tax reform for michigan robert j. kleine state treasurer community college business officials...
TRANSCRIPT

Tax Reform For Michigan
Robert J. Kleine
State Treasurer
Community College Business Officials Association
November 2, 2006

2
Economic and Revenue Forecasting Division, Michigan Department of Treasury
Michigan Still Dependent on Autos
7.88
1.02 0.82 0.55 0.78 0.92 0.96
Autos andParts
Mfg. exc.Autos &
Parts
Finance +Insurance
Nat,resources,
mining
Tourist-oriented
Knowledge-based
All Other
Location Quotient in Michigan(Percentage of Michigan Employment over Percentage U.S.)
Source: George Fulton, University of Michigan, except finance + Insurance calculated by Deptof Treasury.

3
Economic and Revenue Forecasting Division, Michigan Department of Treasury
Michigan Employment by Sector
-289.9
66.3
-77.3
9.1
-8.0-48.3
-217.9
Total Ed &HealthServ.
TradeTrans &
Util.
Fin. Act. Gov. Prof Serv. Mfg.
Tho
usan
ds o
f Jo
bs
Employment Change From 2000 to 2005
Source: Bureau of Labor Statistics.
Note: Detail does not add to total because not all sectors of employment are presented.

4
Economic and Revenue Forecasting Division, Michigan Department of Treasury
Michigan Manufacturing Employment
500
600
700
800
900
1,000
1990 1992 1994 1996 1998 2000 2002 2004 2006
Mon
thly
Em
ploy
men
t (1
000s
)
Source: Bureau of Labor Statistics.
Sep 2006643,600
Jan 1992775,900
Jul 1999908,200

5
Economic and Revenue Forecasting Division, Michigan Department of Treasury
Big 3 Losing Market Share
12.913.9
15.114.8 15.115.215.617.0 17.417.216.8 16.616.916.9
02468
101214161820
1992 1995 1998 2001 2004
Mil
lion
s of
Uni
ts
40%
45%
50%
55%
60%
65%
70%
75%
U.S. Light Vehicle Sales Big 3 Share
Source: Automotive News.

6
Economic and Revenue Forecasting Division, Michigan Department of Treasury
Big Three Still Produce in Michigan
Pct Point1995 2005 Diff
GM 31.0% 28.5% -2.5%
Ford 22.4% 26.7% 4.4%
Chrysler 40.8% 42.8% 2.0%
MI Big 3 % of U.S. 29.7% 30.8% 1.1%
Michigan Big 3 Production as a Percent of Total U.S. Production
7
Economic and Revenue Forecasting Division, Michigan Department of Treasury
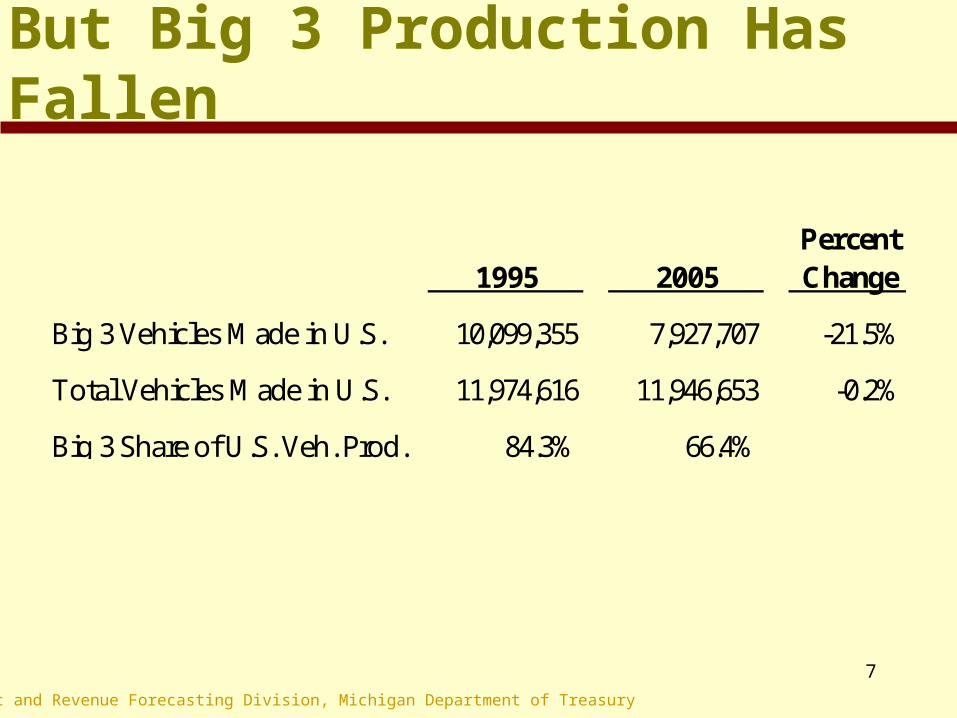
But Big 3 Production Has Fallen
Percent1995 2005 Change
Big 3 Vehicles Made in U.S. 10,099,355 7,927,707 -21.5%
Total Vehicles Made in U.S. 11,974,616 11,946,653 -0.2%
Big 3 Share of U.S. Veh. Prod. 84.3% 66.4%

8
Economic and Revenue Forecasting Division, Michigan Department of Treasury
999
732760
550
650
750
850
950
1,050
1990 1992 1993 1995 1996 1998 1999 2001 2002 2004 2005
12 M
onth
Mov
ing
Ave
rage
Big 3 Light Vehicle Sales
Source: Wards Automotive.
Sales Have Fallen Nearly 24 Percent Since Mid 2000

9
Economic and Revenue Forecasting Division, Michigan Department of Treasury
Slow Michigan Employment Due to Autos
-1.5%-1.0%-0.5%0.0%0.5%1.0%1.5%2.0%2.5%
Michigan annualemploymentgrowth rate,1990-2000
U.S. annualemploymentgrowth rate,1990-2000
Michigan annualemploymentgrowth rate,2000-2005
U.S. annualemploymentgrowth rate,2000-2005
hypotheticalMichigan
growth, 2000-2005, withbetter auto
industryperformance
Source: Michigan Economic Competitiveness and Public Policy, Upjohn Institute 2006.

10
Economic and Revenue Forecasting Division, Michigan Department of Treasury
Michigan Private Sector Employment% of
Michigan Employment
Number of Jobs 8/03 to 8/06
Increasing Sectors
Education & Health 15.3% 30,500
Professional & Business Services 15.9% 20,600
Leisure & Hospitality 10.9% 12,500
Other Private Super Sectors 19.6% 6,500
Total 61.7% 70,100
Decreasing Sectors
Manufacturing 18.3% -70,800
Wholesale/Retail Trade 18.2% -28,400
Other Private Super Sectors 1.8% -2,900
Total 38.3% -102,100Government lost 18,800 jobs from 8/03 to 8/06 and is 15.4% of total wage & salary employment.

11
Economic and Revenue Forecasting Division, Michigan Department of Treasury
-25.0%
-20.0%
-15.0%
-10.0%
-5.0%
0.0%
5.0%
10.0%
15.0%
20.0%
25.0%
Jan-9
9
Apr-9
9
Jul-9
9
Oct-9
9
Jan-0
0
Apr-0
0
Jul-0
0
Oct-0
0
Jan-0
1
Apr-0
1
Jul-0
1
Oct-0
1
Jan-0
2
Apr-0
2
Jul-0
2
Oct-0
2
Jan-0
3
Apr-0
3
Jul-0
3
Oct-0
3
Jan-0
4
Apr-0
4
Jul-0
4
Oct-0
4
Jan-0
5
Apr-0
5
Jul-0
5
Oct-0
5
Jan-0
6
Apr-0
6
Jul-0
6
Veh
icle
Pro
duct
ion
-4.0%
-2.0%
0.0%
2.0%
4.0%
6.0%
8.0%
10.0%
Wit
hhol
ding
Gro
wth
6 Month Vehicle Production 6 Month Withholding
Withholding Still Correlated with Michigan Auto Production
Through September 2006

12
Economic and Revenue Forecasting Division, Michigan Department of Treasury
Michigan Income Growth Trails U.S.
80
100
120
140
160
180
1995 1996 1997 1998 1999 2000 2001 2002 2003 2004 2005
US Michigan
U.S. and Michigan Personal Income Growth1995 = 100
Source: U.S Bureau of Economic Analysis.

13
Economic and Revenue Forecasting Division, Michigan Department of Treasury
Problems with Current System
• High personal property tax burden discourages investment in Michigan
• SBT has been made more complicated through the years
• SBT’s bad reputation may be discouraging investment in Michigan

14
Economic and Revenue Forecasting Division, Michigan Department of Treasury
Advantages of SBT
• Stability• Rate or base has never been increased• Familiarity (30 years of experience)• Low rate lessens interference with economic
decisions and does not penalize efficient companies – the tax is about 0.6 percent of private GSP
• Taxes all economic factors equally

15
Economic and Revenue Forecasting Division, Michigan Department of Treasury
SBT Falling as Share of GSP
0.0%
0.5%
1.0%
1.5%
1976
1978
1980
1982
1984
1986
1988
1990
1992
1994
1996
1998
2000
2002
2004
SBT as Percent of Private Gross State Product

16
Economic and Revenue Forecasting Division, Michigan Department of Treasury
COST Study Puts Michigan BusinessTaxes Below National Average
4.3% 4.8%
Michigan U.S. Average
Source: Council on State Taxation. Bureau of Economic Analysis.
FY 2005 State and Local Business Taxes as a Percent of Gross State Product

17
Economic and Revenue Forecasting Division, Michigan Department of Treasury
Michigan Business Burden Compares Well with Neighbors
StateBusiness Tax as %
of GSP Rank
Wyoming 9.6% 1
Illinois 5.3% 19
Minnesota 4.9% 23
Ohio 4.7% 27
Indiana 4.5% 30
Wisconsin 4.4% 33
MichiganDE, NC, VA
4.3%3.7%
3648
Source: Council on State Taxation.

18
Economic and Revenue Forecasting Division, Michigan Department of Treasury
Upjohn Study Finds Michigan Taxes Below U.S. Average
-5.0%
-12.0%
-19.0%
S & L Taxes Per Dollar PersonalIncome
S & L Business Taxes Per Dollar ofPrivate GSP
S & L Business Taxes onInvestment in New Business Facility
Source: Michigan Economic Competitiveness and Public Policy, Upjohn Institute 2006.
19
Economic and Revenue Forecasting Division, Michigan Department of Treasury
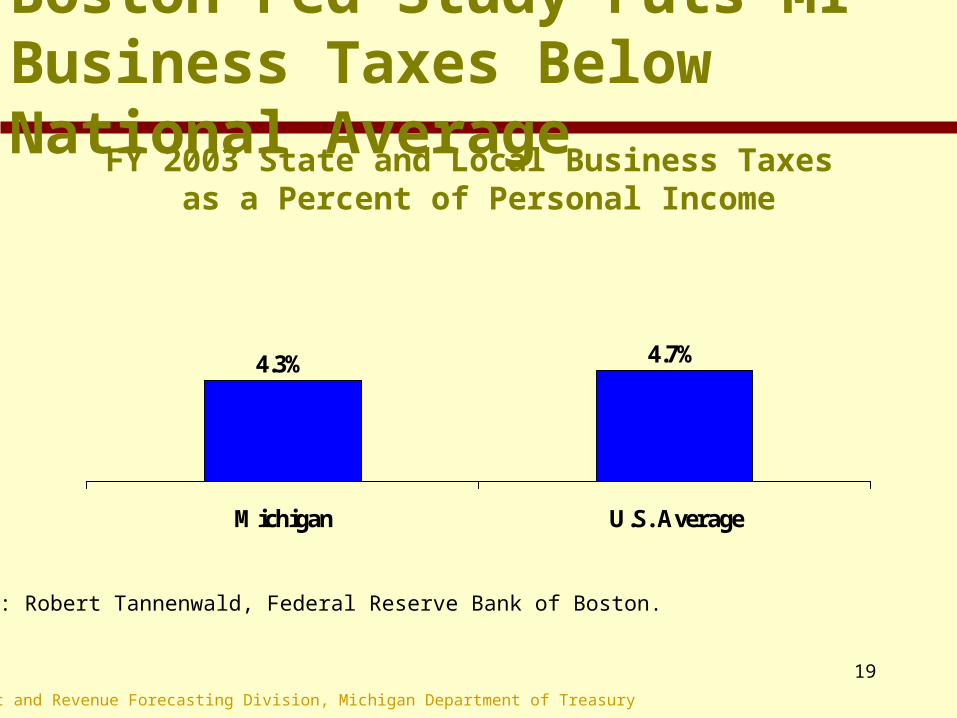
Boston Fed Study Puts MI Business Taxes Below National Average
4.3% 4.7%
Michigan U.S. Average
Source: Robert Tannenwald, Federal Reserve Bank of Boston.
FY 2003 State and Local Business Taxes as a Percent of Personal Income

20
Economic and Revenue Forecasting Division, Michigan Department of Treasury
Governor’s Criteria for Reform
• Broaden tax base and lower tax rate
• Do not raise taxes on individuals
• Fully replace revenues to protect healthcare, education, and public safety
• Simplify business taxes
• Some consideration of ability to pay
21
Economic and Revenue Forecasting Division, Michigan Department of Treasury
Other Criteria for High Quality Business Tax System
• Stable revenue source
• Low compliance costs
• Competitive tax rates with other states

22
Economic and Revenue Forecasting Division, Michigan Department of Treasury
Alternative Business Taxes
• Subtractive VAT
• Gross receipts
• Licensing Fee
• Franchise
• Income
• Business-to-business services
• Other: Texas reforms, factor tax, MJIA

23
Economic and Revenue Forecasting Division, Michigan Department of Treasury
Michigan Jobs and Investment Act
• Broader tax base and lower rate– Eliminate excess compensation reduction– Eliminate gross receipts reduction– Lower rate by more than 1/3 to 1.2%
• 35% refundable manufacturing personal property tax credit• 35% R&D personal property tax credit• Change to 100% sales factor• Increased profits weighting• Raise insurance tax to national median (2% of premiums)• Overall plan revenue neutral
In 2005, the Governor Proposed the Michigan Jobs and Investment Act
24
Economic and Revenue Forecasting Division, Michigan Department of Treasury
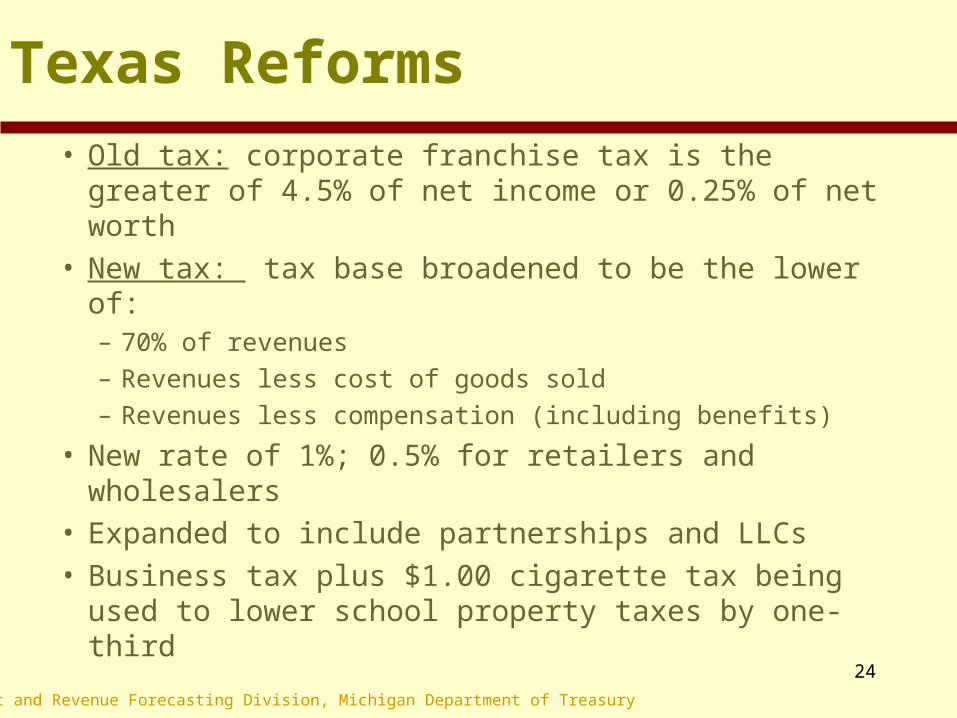
Texas Reforms
• Old tax: corporate franchise tax is the greater of 4.5% of net income or 0.25% of net worth
• New tax: tax base broadened to be the lower of:– 70% of revenues
– Revenues less cost of goods sold
– Revenues less compensation (including benefits)
• New rate of 1%; 0.5% for retailers and wholesalers• Expanded to include partnerships and LLCs• Business tax plus $1.00 cigarette tax being used to
lower school property taxes by one-third

25
Economic and Revenue Forecasting Division, Michigan Department of Treasury
Ohio Reforms
• Old tax: corporate franchise tax is the greater of 4 mills on net worth or 8.5% of income in excess of $50,000
• New tax: Commercial Activities Tax– Tax base is gross receipts of a business or individual
sourced to Ohio
– Tax rate is 0.26 percent (5 year phase-in)
• Tangible personal property tax eliminated• Personal income tax reduced
– Top bracket reduced from 7.5% to 5.95%
– Taxpayers with income under $10,000 exempt

26
Economic and Revenue Forecasting Division, Michigan Department of Treasury
MI Chamber of Commerce Proposal (1)
• Combination income and gross receipts• Business income tax rate 3.05%• “License tax” paid on gross receipts
– 0.48% general rate– 0.24% on wholesale/retail– Paid on excess above $350k in gross receipts– $150 minimum tax on businesses with at least 1
employee– $2 million cap on license tax
• 50% personal property tax credit

27
Economic and Revenue Forecasting Division, Michigan Department of Treasury
MI Chamber of Commerce Proposal (2)
• Combination income and gross receipts• Business income tax rate 1.5%• “License tax” paid on gross receipts
– 0.24% general rate– 0.18% on wholesale/retail– Paid on excess above $350k in gross receipts– $150 minimum tax on businesses with at least 1
employee– $2 million cap on license tax
• No personal property tax credit

28
Economic and Revenue Forecasting Division, Michigan Department of Treasury
GR Chamber of Commerce Proposal
• Tax on MI business activity– MI sales or service revenues, less cost of tangible personal
property purchased for resale, manufacturing, leasing, or cost of funds for financial institutions
• Also replaces personal property tax• Rate not to exceed 0.75%• If tax exceeds estimates, credit in following year (e.g.
Oregon)• Flat fee of $150 for business with at least 1 employee

29
Economic and Revenue Forecasting Division, Michigan Department of Treasury
Detroit Chamber Proposal
• Annual business license “fee” based on sales
• Fee based on sales level.
• Fee ranges from $1,000 to $1,000,000.
• Effective rate varies from about 0.2 percent to 0.5 percent
• Maximum tax set at $1,000,000

30
Economic and Revenue Forecasting Division, Michigan Department of Treasury
Factor Tax Proposal
• Tax Base can include– a measure of gross receipts or sales– compensation – assets or property– Business income times 10
• Low tax rate (below 0.2 percent)
• Broad base provides stability
• Inclusion of business income makes tax more sensitive to profitability

31
Economic and Revenue Forecasting Division, Michigan Department of Treasury
Replacement Tax Issues
• Winners and losers
• How much revenue should be replaced
• Minimum tax?
• Ability to pay
• Personal property tax relief
• Filing threshold
• Capital and human investment incentives

32
Economic and Revenue Forecasting Division, Michigan Department of Treasury
SBT Provides One Quarter of GF-GP Revenue
May 06 Consensus EstimateAdjusted for Proposed Budget
FY 2007 GF-GP Revenues Total $9.2 billion

33
Economic and Revenue Forecasting Division, Michigan Department of Treasury
$8,697 $8,533$8,844
$9,503 $9,788
$8,990$8,427
$7,959 $8,042 $8,309 $8,282 $8,435
1996 1997 1998 1999 2000 2001 2002 2003 2004 2005 2006 2007May 2006 Estimates
Note: Totals exclude transfers and savings from adjusting statutory revenue sharing payments to local governments.
$ in Millions
Nominal General Fund Net Revenue in 2007 Less Than in 1996

34
Economic and Revenue Forecasting Division, Michigan Department of Treasury
Inflation Adjusted GF-GP RevenueDown 28 Percent Since FY 1999
Totals Exclude Transfers and are adjusted to 2007 dollars using U.S. CPI-U.
$6.0
$7.0
$8.0
$9.0
$10.0
$11.0
$12.0
$13.0
1999 2000 2001 2002 2003 2004 2005 2006 2007
Bil
lion
s of
200
7 $
$11.8 billion
$8.4 billion

35
Economic and Revenue Forecasting Division, Michigan Department of Treasury
Replacement Tax Issues
• Winners and losers
• How much revenue should be replaced
• Minimum tax?
• Ability to pay
• Personal property tax relief
• Filing threshold
• Capital and human investment incentives

36
Economic and Revenue Forecasting Division, Michigan Department of Treasury
Comparison: Michigan SBT vs. CIT
$0
$200
$400
$600
$800
$1,000
$1,200
$1,400
$1,600
1977 1979 1981 1983 1985 1987 1989 1991 1993 1995 1997 1999 2001
Mil
lion
s CIT revenues at 7.2% rate
SBT Revenue at 1.9% Rate
Michigan SBT vs. Business Income Tax
SBT Revenues Paid by Corporations

37
Economic and Revenue Forecasting Division, Michigan Department of Treasury
Replacement Tax Issues
• Winners and losers
• How much revenue should be replaced
• Minimum tax?
• Ability to pay
• Personal property tax relief
• Filing threshold
• Capital and human investment incentives

38
Economic and Revenue Forecasting Division, Michigan Department of Treasury
Options for Personal Property Tax Relief
• Tax credits – if too large could result in classification change from real to personal
• Exemption from 24 school mills (6 state and 18 local school) delivers nearly 50 percent relief
• Exempt new property
• Differential credits based on new or existing
• Mandatory PA 198 for new
• Any change to personal property tax must take into account effects on local government