tavr has only a limited role in the treatment of patients with severe aortic...
TRANSCRIPT
TAVR has only a limited role in the treatment of patients with severe
aortic stenosis
D. Craig Miller, M.D.
Stanford University CV Surgery
Stanford CV SurgeryStanford CV SurgeryStanford CV SurgeryStanford CV Surgery
Affiliation/Financial Relationship Company
Grant/ Research Support: NHLBI RO1 HL67025
Consulting Fees/Honoraria:
•Stanford PI – The PARTNER Trial, Edwards Lifesciences •Consultant, Abbott Vascular Structural Heart (MitraClip)
Conflict of Interest Disclosure
•Consultant, Abbott Vascular Structural Heart (MitraClip)•Consultant, Medtronic CardioVascular Division•Consultant, St. Jude Medical •The PARTNER U.S. Pivotal Trial Executive Committee, Edwards Lifesciences (nonremunerative)
Major Stock Shareholder/Equity Interest:Royalty Income:Ownership/Founder:Salary:Intellectual Property Rights:Other Financial Benefit:
Stanford CV SurgeryStanford CV SurgeryStanford CV SurgeryStanford CV Surgery

What’s in a Name?
Placement of AoRTic TraNscathetERValves
Stanford CV SurgeryStanford CV SurgeryStanford CV SurgeryStanford CV Surgery
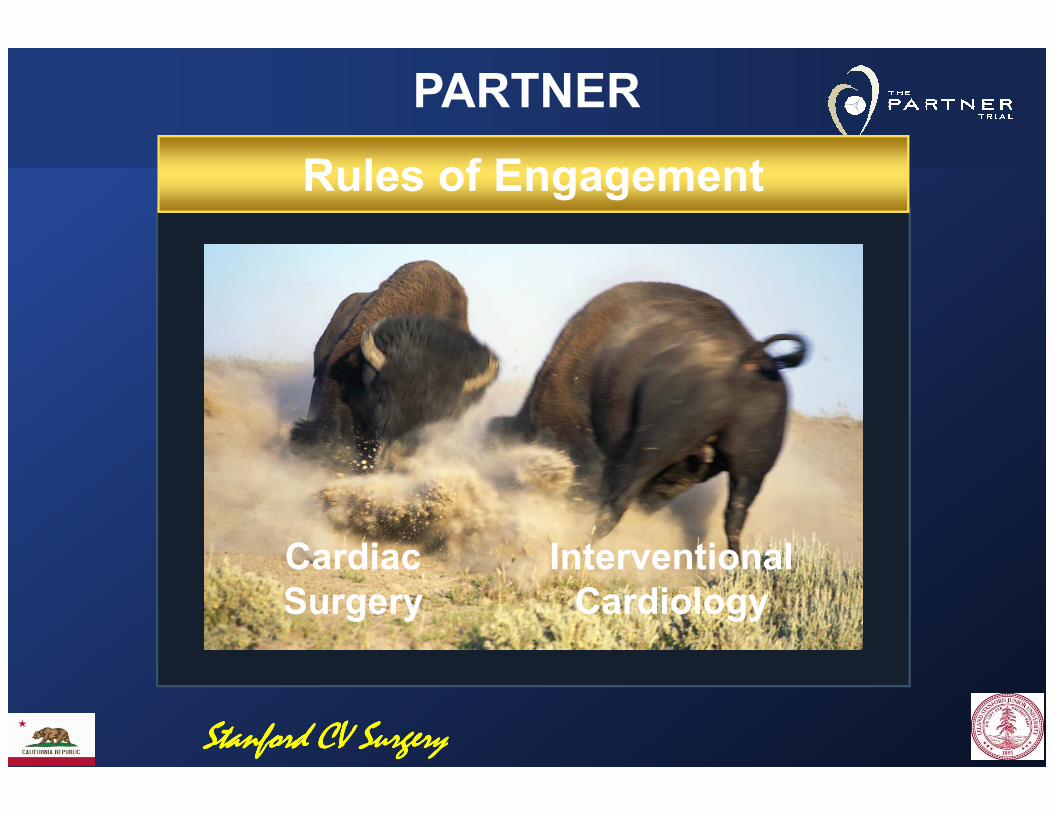
Rules of Engagement
PARTNER
CardiacSurgery
InterventionalCardiology
Stanford CV SurgeryStanford CV SurgeryStanford CV SurgeryStanford CV Surgery
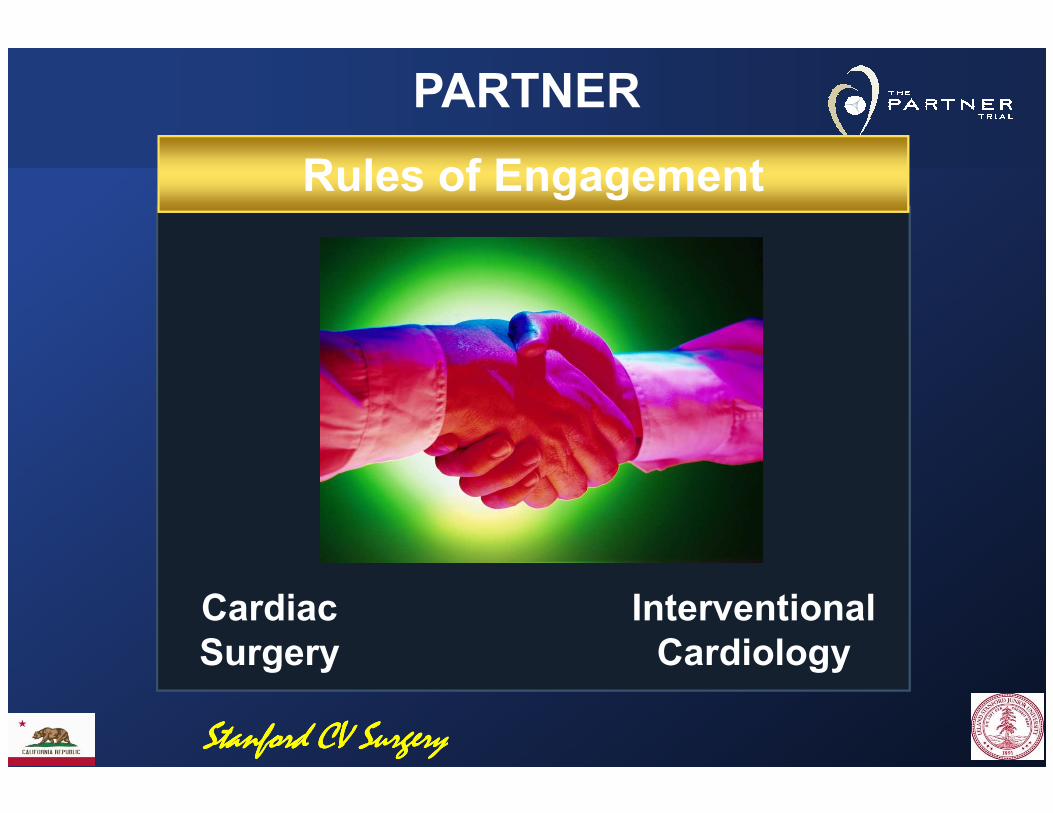
Rules of Engagement
PARTNER
CardiacSurgery
InterventionalCardiology
Stanford CV SurgeryStanford CV SurgeryStanford CV SurgeryStanford CV Surgery

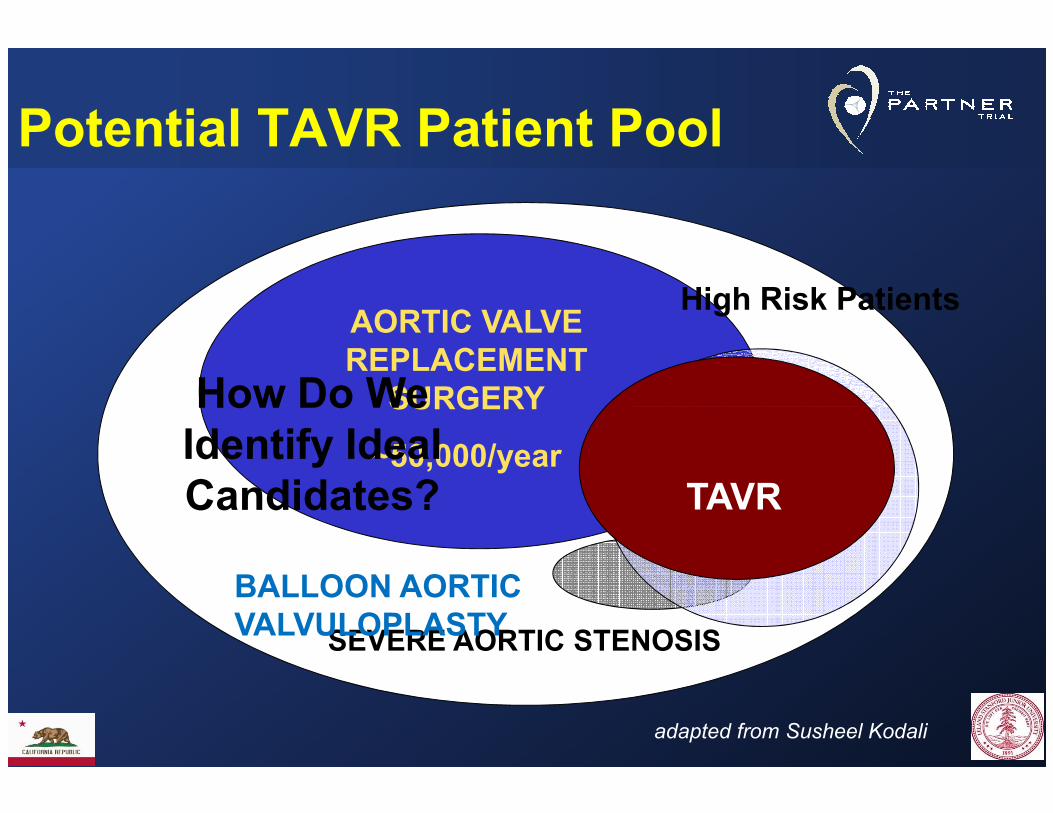
AORTIC VALVE REPLACEMENT SURGERY
Potential TAVR Patient Pool
High Risk Patients
How Do We
SEVERE AORTIC STENOSIS
SURGERY
~50,000/year
BALLOON AORTIC VALVULOPLASTY
TAVR
How Do We Identify Ideal Candidates?
adapted from Susheel Kodali
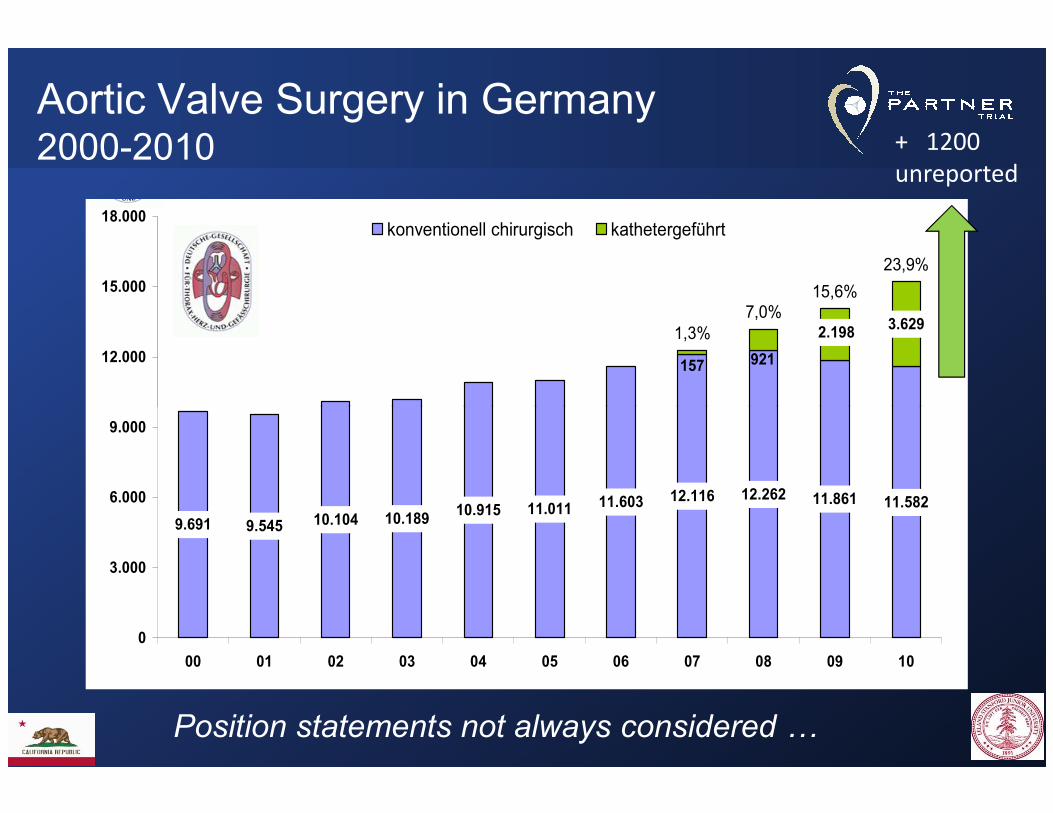
Aortic Valve Surgery in Germany2000-2010
2000 - 2010
2.198
921157
3.6291,3%
7,0%15,6%
23,9%
12.000
15.000
18.000konventionell chirurgisch kathetergeführt
+ 1200
unreported
9.691 9.545 10.104 10.18910.915 11.011 11.603 12.116 12.262 11.861 11.582
0
3.000
6.000
9.000
00 01 02 03 04 05 06 07 08 09 10
Position statements not always considered
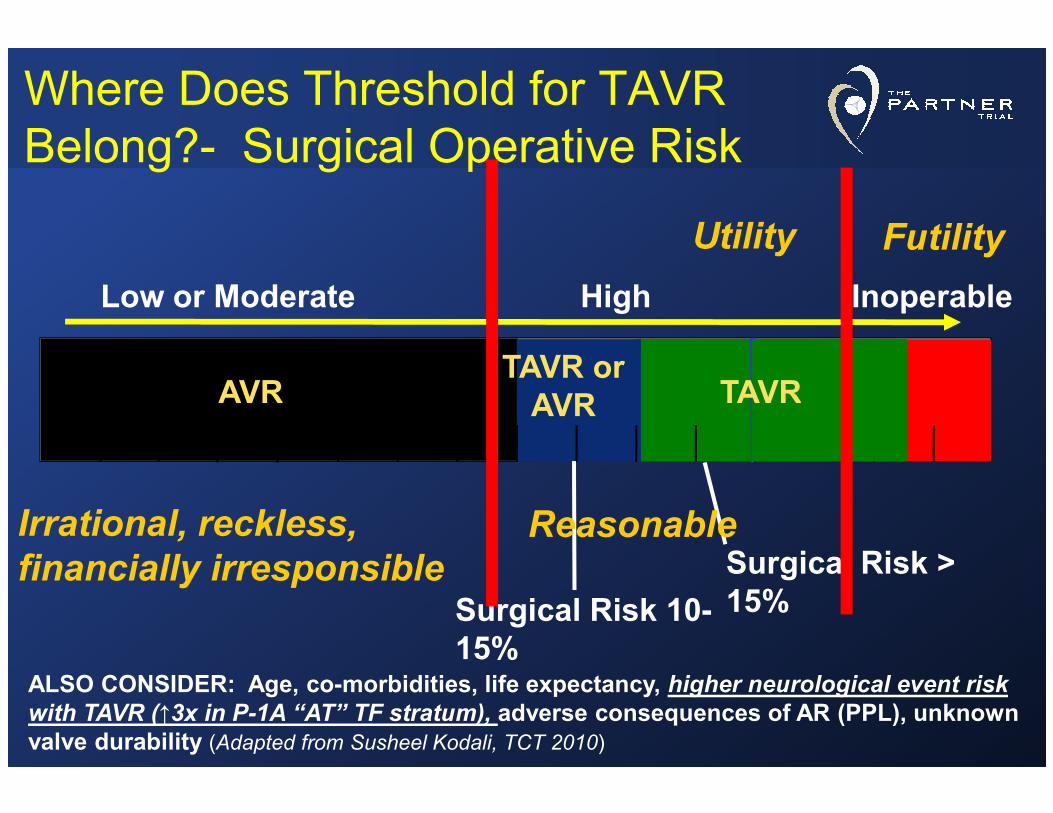
Where Does Threshold for TAVR Belong?- Surgical Operative Risk
Low or Moderate High Inoperable
TAVR orAVRAVR TAVR
FutilityUtility
Surgical Risk > 15%
AVR
Surgical Risk 10-15%
AVR TAVR
ALSO CONSIDER: Age, co-morbidities, life expectancy, higher neurological event risk with TAVR (↑3x in P-1A “AT” TF stratum), adverse consequences of AR (PPL), unknown valve durability (Adapted from Susheel Kodali, TCT 2010)
ReasonableIrrational, reckless,
financially irresponsible
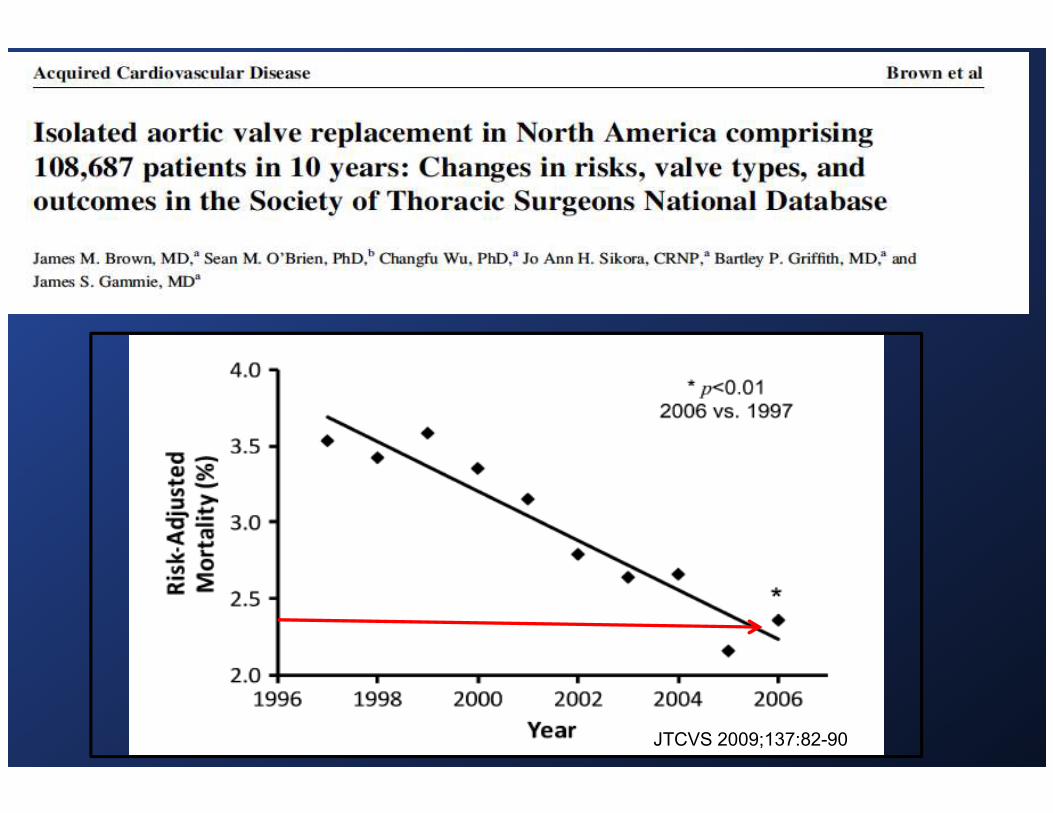
JTCVS 2009;137:82-90

JTCVS 2009;137:82-90
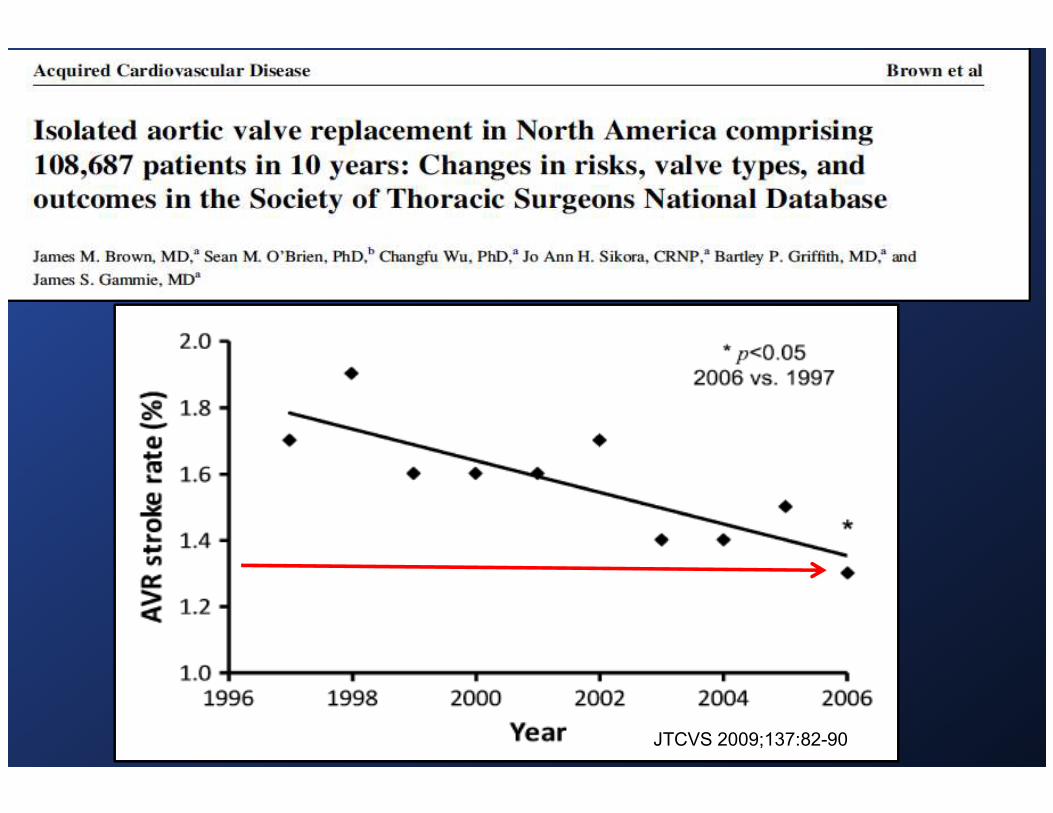
JTCVS 2009;137:82-90

100
80
60
Age >75
% Survival
Long-term survival after AVR by type of prosthesis> 75 years old
60
40
20
00 5 10 15
AllograftMechanicalPorcinePericardial
% Survival
Years After AVR
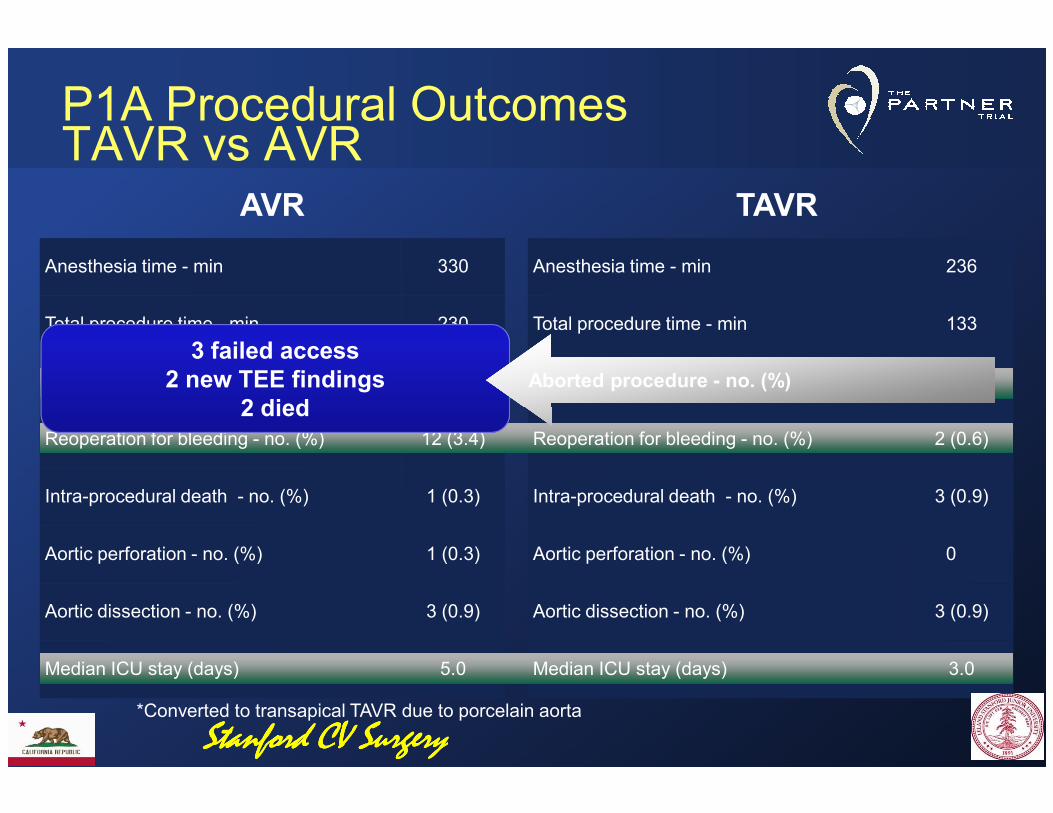
Anesthesia time - min 330
Total procedure time - min 230
Aborted procedure - no. (%) 0
Anesthesia time - min 236
Total procedure time - min 133
Aborted procedure - no. (%) 7 (2.0)
AVR TAVR
3 failed access2 new TEE findings
2 diedAborted procedure - no. (%)Aborted procedure - no. (%)
P1A Procedural OutcomesTAVR vs AVR
Reoperation for bleeding - no. (%) 12 (3.4)
Intra-procedural death - no. (%) 1 (0.3)
Aortic perforation - no. (%) 1 (0.3)
Aortic dissection - no. (%) 3 (0.9)
Median ICU stay (days) 5.0
Reoperation for bleeding - no. (%) 2 (0.6)
Intra-procedural death - no. (%) 3 (0.9)
Aortic perforation - no. (%) 0
Aortic dissection - no. (%) 3 (0.9)
Median ICU stay (days) 3.0
*Converted to transapical TAVR due to porcelain aorta
2 died
Stanford CV SurgeryStanford CV SurgeryStanford CV SurgeryStanford CV Surgery
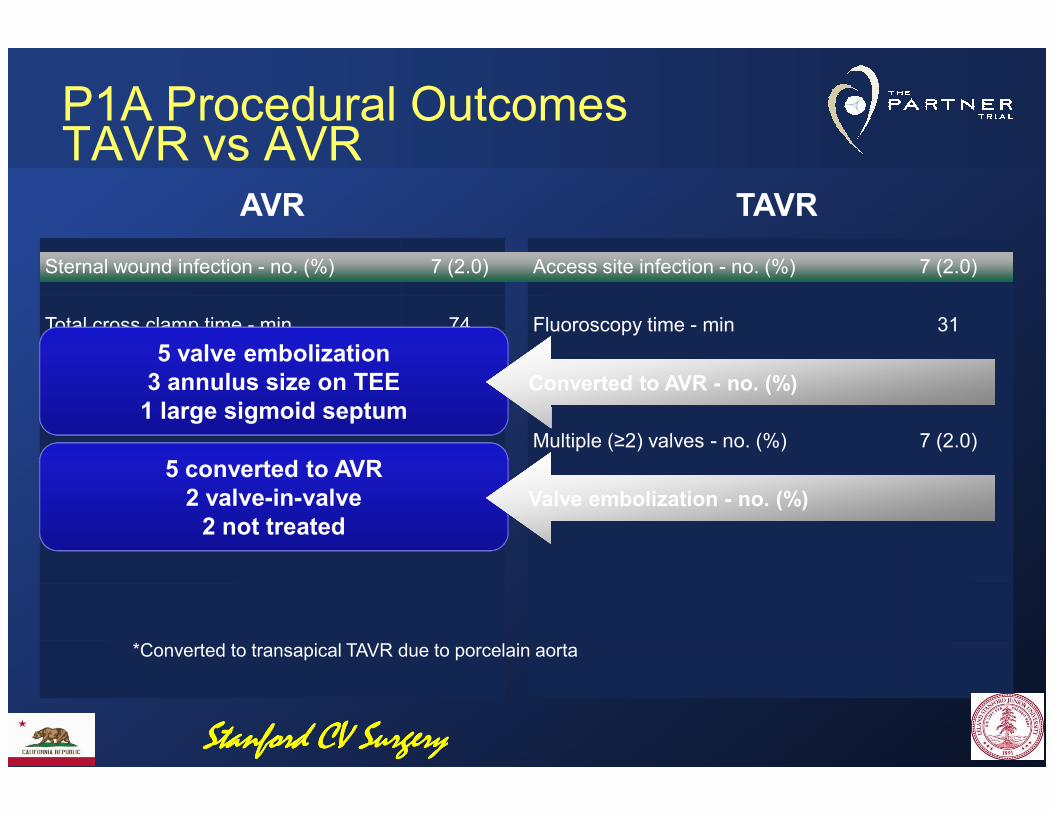
Sternal wound infection - no. (%) 7 (2.0)
Total cross clamp time - min 74
Pump time - min 105
Access site infection - no. (%) 7 (2.0)
Fluoroscopy time - min 31
Converted to AVR - no. (%) 9 (2.6)
P1A Procedural OutcomesTAVR vs AVR
AVR TAVR
5 valve embolization3 annulus size on TEE1 large sigmoid septum
Converted to AVR - no. (%)Converted to AVR - no. (%)
Multiple (≥2) valves - no. (%) 7 (2.0)
Valve embolization - no. (%) 9 (2.6)
*Converted to transapical TAVR due to porcelain aorta
1 large sigmoid septum
5 converted to AVR2 valve-in-valve2 not treated
Valve embolization - no. (%)Valve embolization - no. (%)
Stanford CV SurgeryStanford CV SurgeryStanford CV SurgeryStanford CV Surgery

VARC Device Success – PARTNER 1A(Correct Valve Placement and Function)
Intraop failures = 33 (9.5%)Intraop failures = 33 (9.5%)
6 month Moderate / Severe AR = 10.5%
No AS or SVD
Stanford CV SurgeryStanford CV SurgeryStanford CV SurgeryStanford CV Surgery
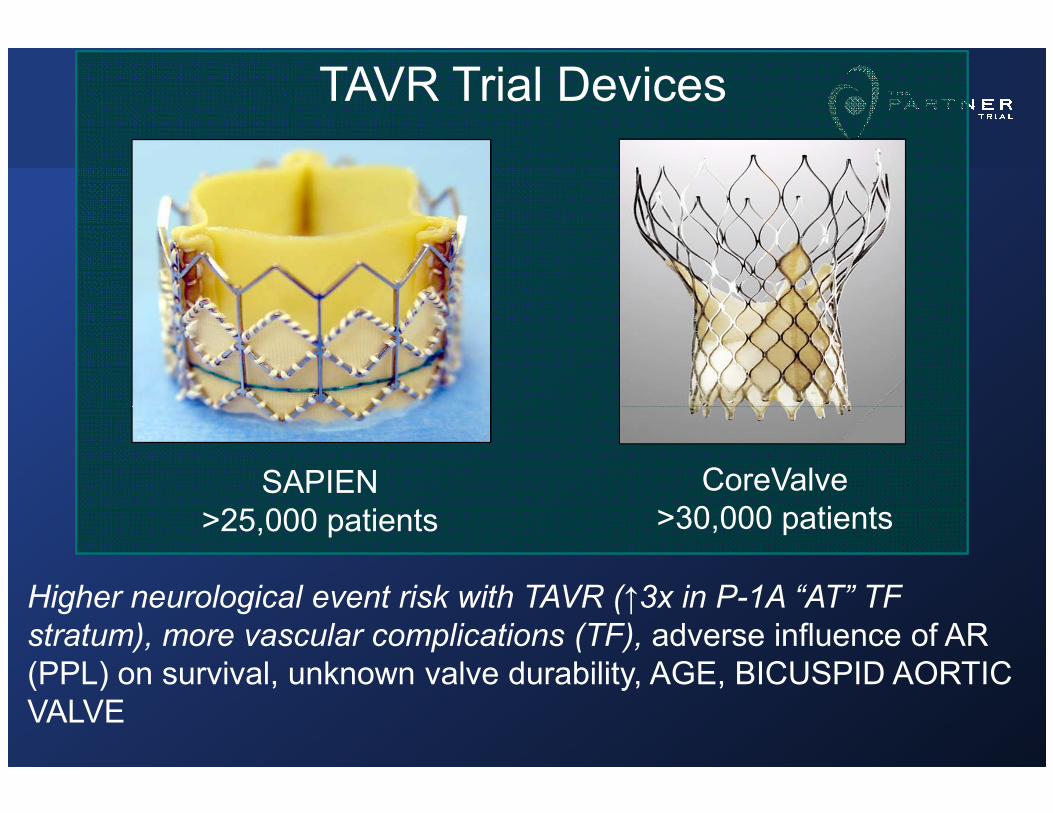
TAVR Trial Devices
SAPIEN>25,000 patients
CoreValve>30,000 patients
Higher neurological event risk with TAVR (↑3x in P-1A “AT” TF
stratum), more vascular complications (TF), adverse influence of AR (PPL) on survival, unknown valve durability, AGE, BICUSPID AORTIC VALVE
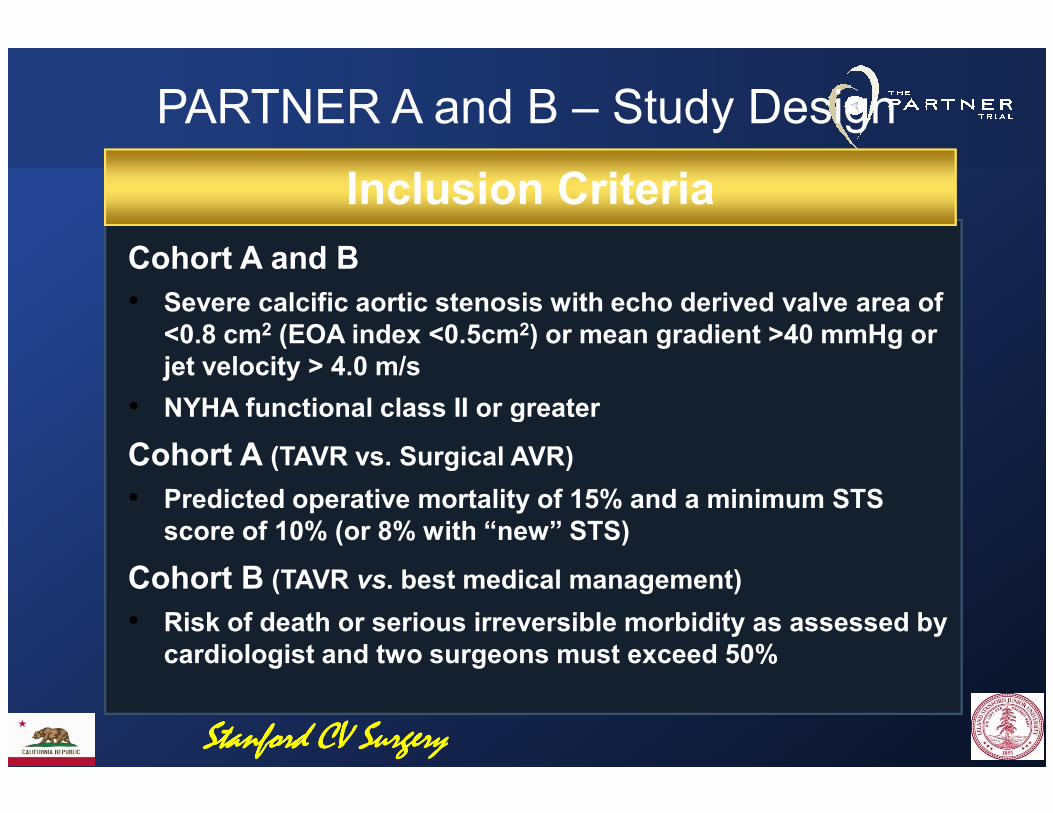
Inclusion Criteria
PARTNER A and B – Study Design
Cohort A and B
• Severe calcific aortic stenosis with echo derived valve area of <0.8 cm2 (EOA index <0.5cm2) or mean gradient >40 mmHg or jet velocity > 4.0 m/s
• NYHA functional class II or greater• NYHA functional class II or greater
Cohort A (TAVR vs. Surgical AVR)
• Predicted operative mortality of 15% and a minimum STS score of 10% (or 8% with “new” STS)
Cohort B (TAVR vs. best medical management)
• Risk of death or serious irreversible morbidity as assessed by cardiologist and two surgeons must exceed 50%
Stanford CV SurgeryStanford CV SurgeryStanford CV SurgeryStanford CV Surgery
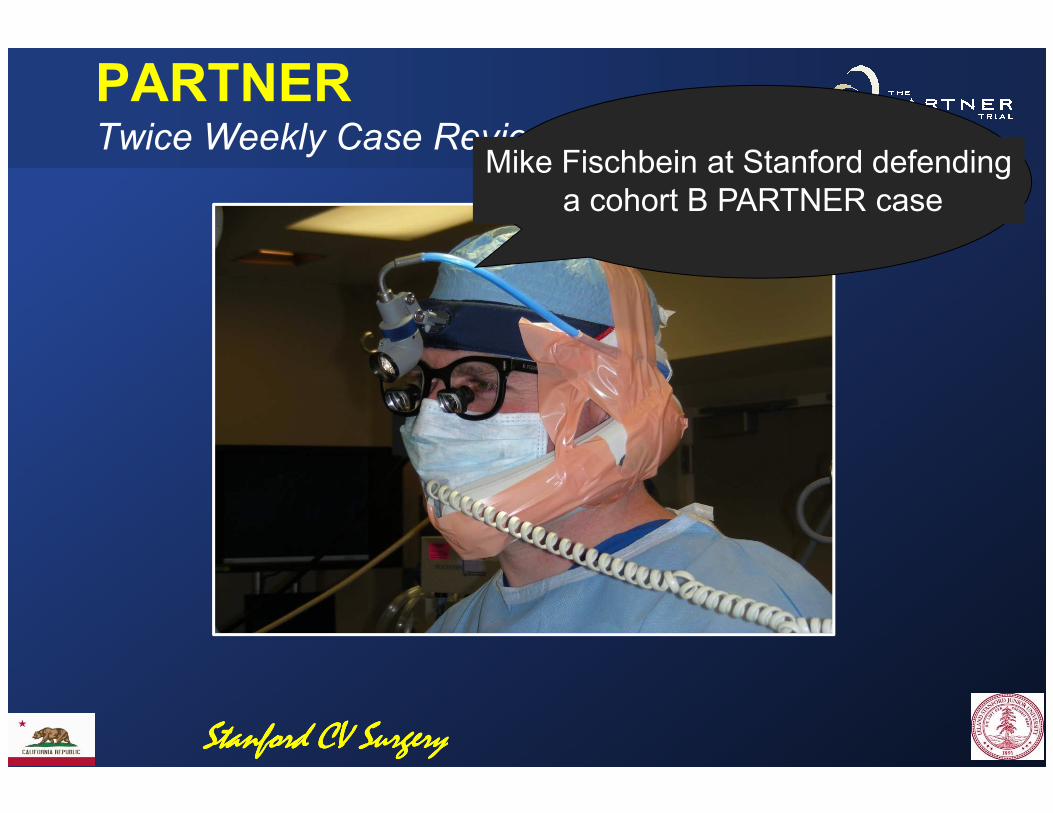
PARTNERTwice Weekly Case Reviews Calls
Mike Fischbein at Stanford defendinga cohort B PARTNER case
Stanford CV SurgeryStanford CV SurgeryStanford CV SurgeryStanford CV Surgery
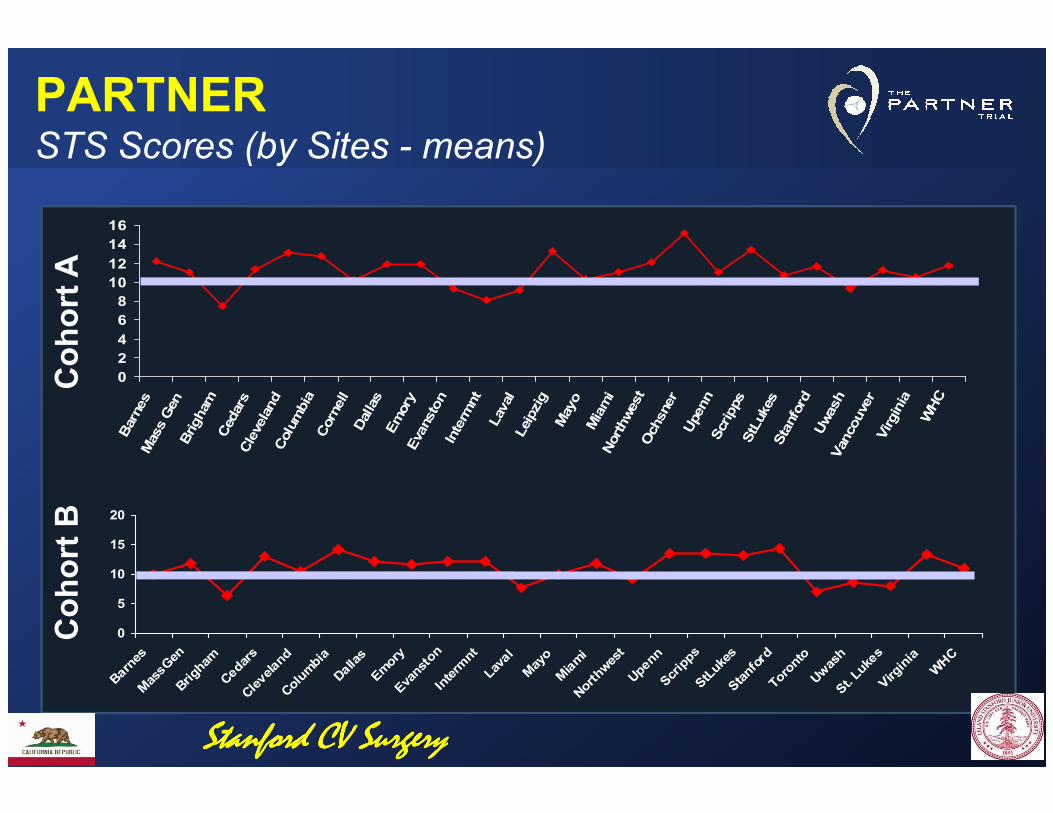
PARTNERSTS Scores (by Sites - means)
0
2
4
6
8
10
12
14
16
Barnes
Mass Gen
Brigham
Cedars
Cleveland
Columbia
Cornell
Dallas
Emory
Evanston
Intermnt
Laval
Leipzig
Mayo
Miami
Northwest
Ochsner
Upenn
Scripps
StLukes
Stanford
Uwash
Vancouver
Virginia
WHC
Cohort A
Barnes
Mass Gen
Brigham
Cedars
Cleveland
Columbia
Cornell
Dallas
Emory
Evanston
Intermnt
Laval
Leipzig
Mayo
Miami
Northwest
Ochsner
Upenn
Scripps
StLukes
Stanford
Uwash
Vancouver
Virginia
WHC
0
5
10
15
20
Barne
sMas
sGen
Brigh
amCed
ars
Cleve
land
Colum
bia
Dallas
Emory
Eva
nston
Interm
ntLa
val
May
oMiami
Northwes
tUpe
nnScripps
StLuk
esStanford
Toronto
Uwas
hSt. Lu
kes
Virg
inia
WHC
Cohort B
Stanford CV SurgeryStanford CV SurgeryStanford CV SurgeryStanford CV Surgery
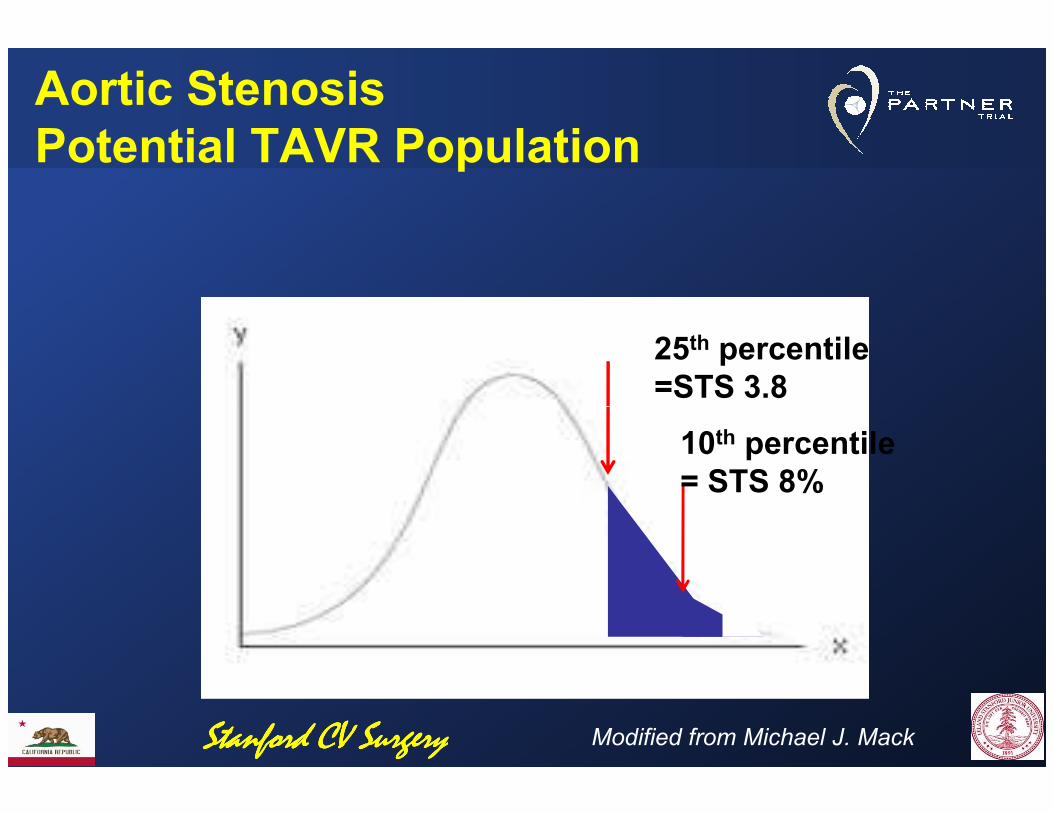
Aortic StenosisPotential TAVR Population
25th percentile =STS 3.8
10th percentile= STS 8%
Modified from Michael J. MackStanford CV SurgeryStanford CV SurgeryStanford CV SurgeryStanford CV Surgery
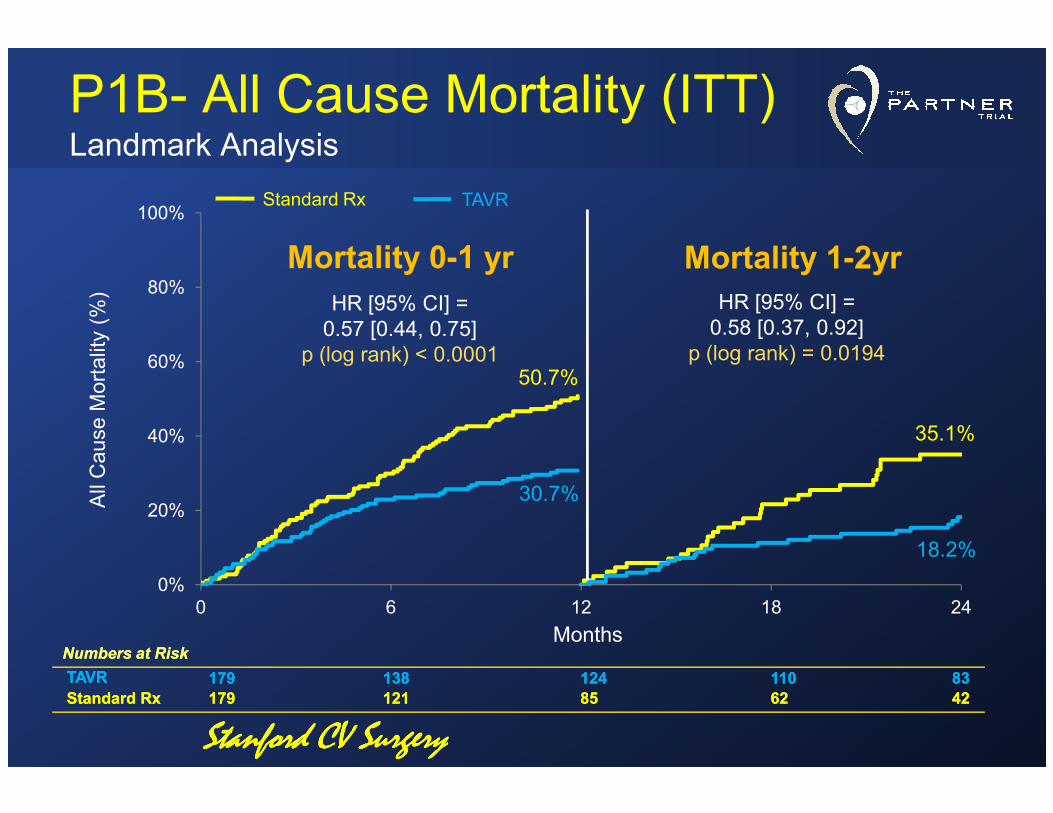
P1B- All Cause Mortality (ITT)Landmark Analysis
All Cause M
ortality (%
)
60%
80%
100%
Mortality 0-1 yr Mortality 1-2yr
Standard Rx TAVR
HR [95% CI] =0.57 [0.44, 0.75]
p (log rank) < 0.0001
HR [95% CI] =0.58 [0.37, 0.92]
p (log rank) = 0.019450.7%
All Cause M
ortality
Months
0%
20%
40%
0 6 12 18 24
30.7%
35.1%
18.2%
Numbers at RiskNumbers at Risk
TAVRTAVR 179179 138138 124124 110110 8383
Standard RxStandard Rx 179179 121121 8585 6262 4242
Stanford CV SurgeryStanford CV SurgeryStanford CV SurgeryStanford CV Surgery
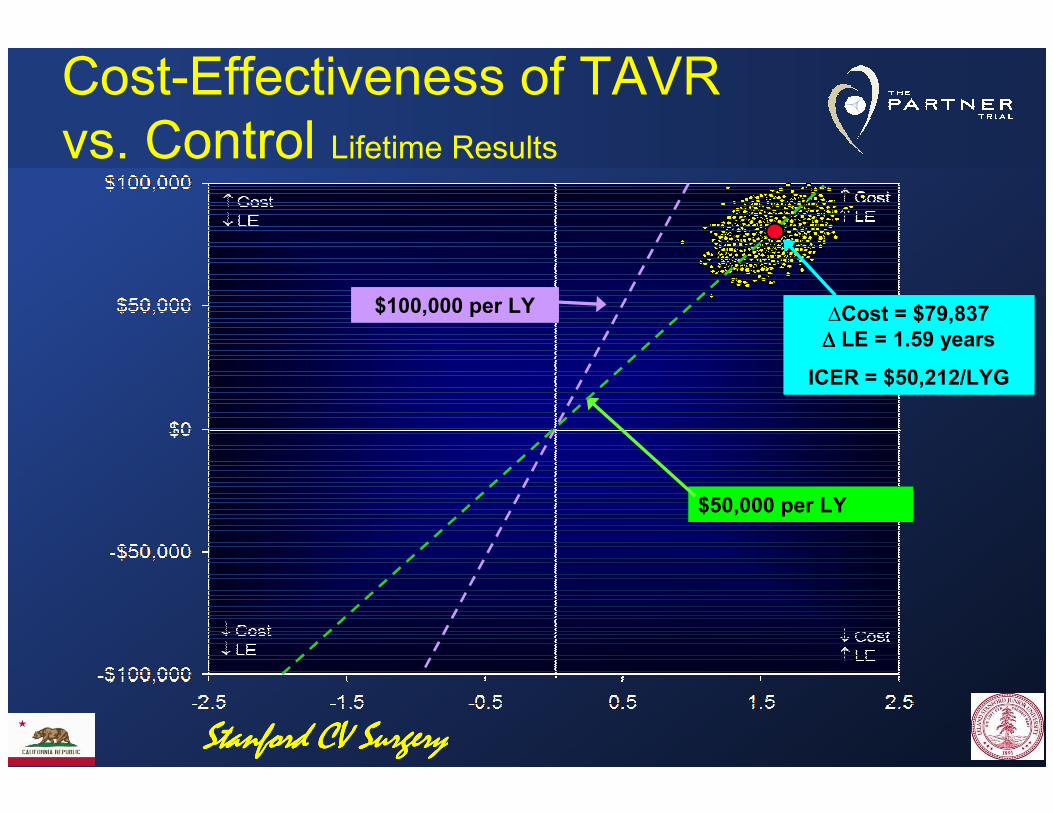
∆Cost = $79,837 ∆∆∆∆ LE = 1.59 years
ICER = $50,212/LYG
∆Cost = $79,837 ∆∆∆∆ LE = 1.59 years
ICER = $50,212/LYG
$100,000 per LY$100,000 per LY
Cost-Effectiveness of TAVR vs. Control Lifetime Results
$50,000 per LY$50,000 per LY
Stanford CV SurgeryStanford CV SurgeryStanford CV SurgeryStanford CV Surgery

Published U.S. Cost Effectiveness Estimates
$200
$250
$300
QA
LY (
$th
ou
san
ds)
$0
$50
$100
$150
aspirin MI
prevention
rosuvastatin
high-CRP
ICD prim prev CRT-D v.
medical Rx
dabigatran AF PARTNER
Cohort B
AF ablation vs.
AAD
dialysis PCI stable CAD LVAD
destination Rx
Do
lla
rs p
er
Life
Ye
ar
or
QA
LY (
$th
ou
san
ds)
Stanford CV SurgeryStanford CV SurgeryStanford CV SurgeryStanford CV Surgery
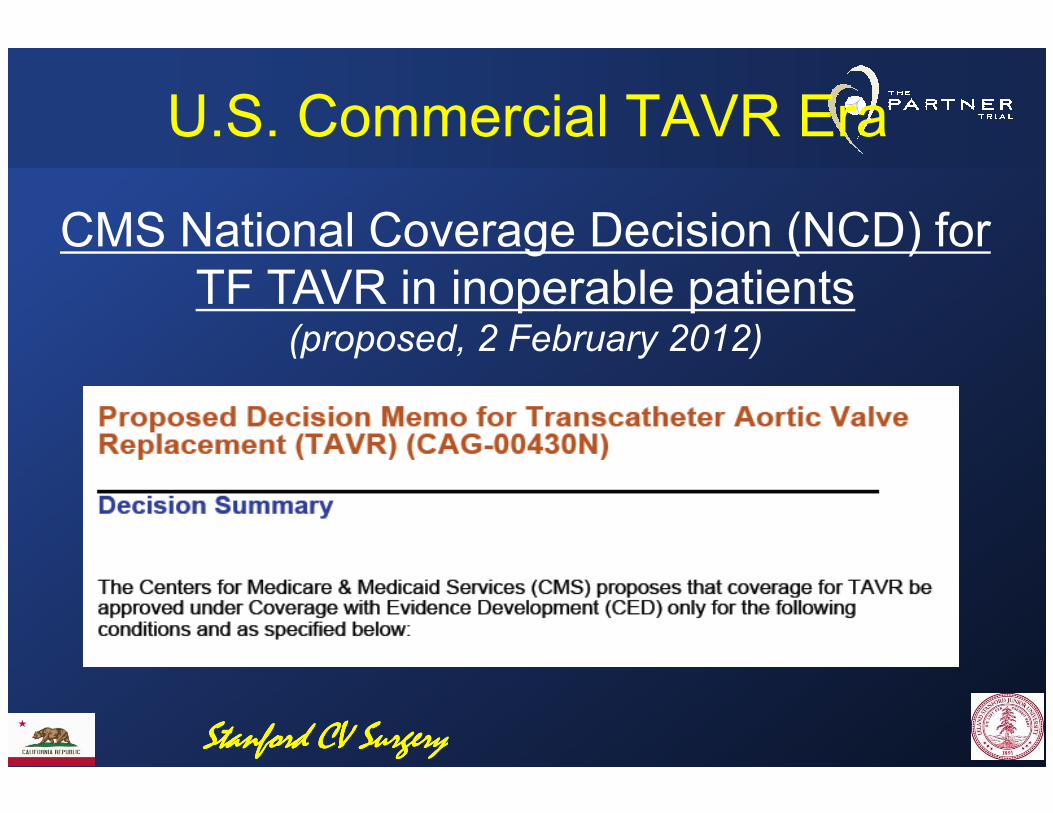
U.S. Commercial TAVR Era
CMS National Coverage Decision (NCD) for TF TAVR in inoperable patients
(proposed, 2 February 2012)
Stanford CV SurgeryStanford CV SurgeryStanford CV SurgeryStanford CV Surgery
U.S. Commercial TAVR Era
Stanford CV SurgeryStanford CV SurgeryStanford CV SurgeryStanford CV Surgery
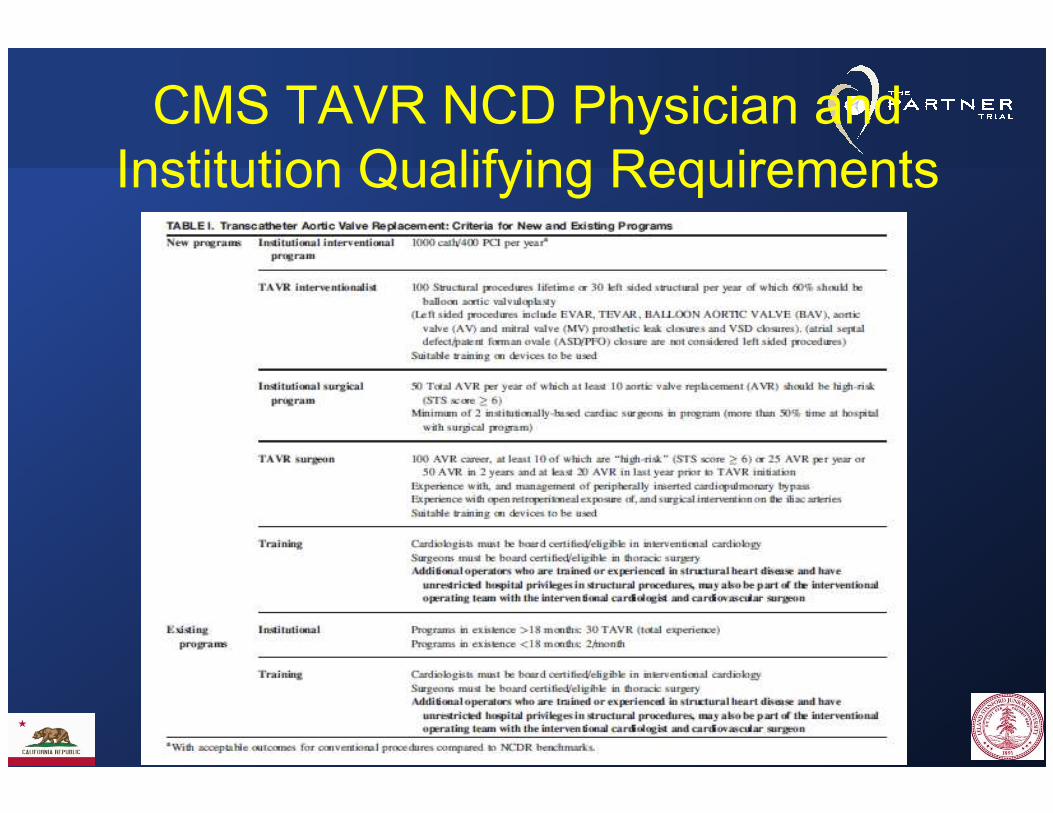
CMS TAVR NCD Physician and Institution Qualifying Requirements
Stanford CV SurgeryStanford CV SurgeryStanford CV SurgeryStanford CV Surgery
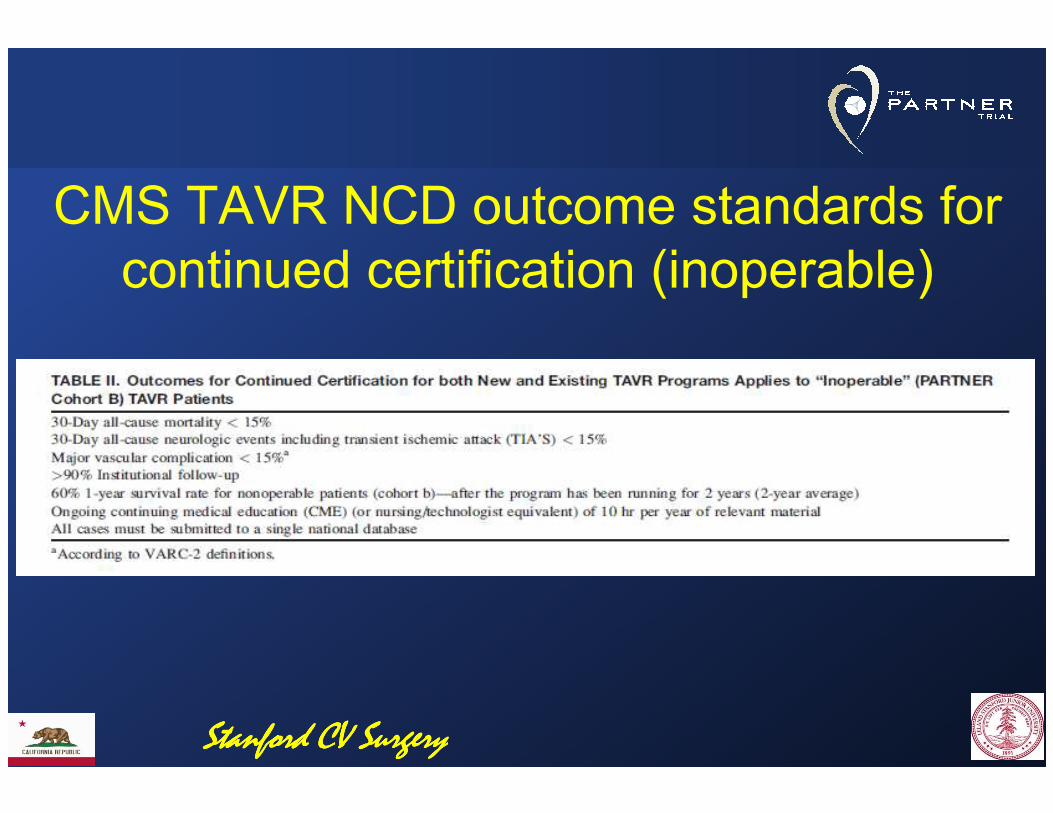
CMS TAVR NCD outcome standards for continued certification (inoperable)
Stanford CV SurgeryStanford CV SurgeryStanford CV SurgeryStanford CV Surgery
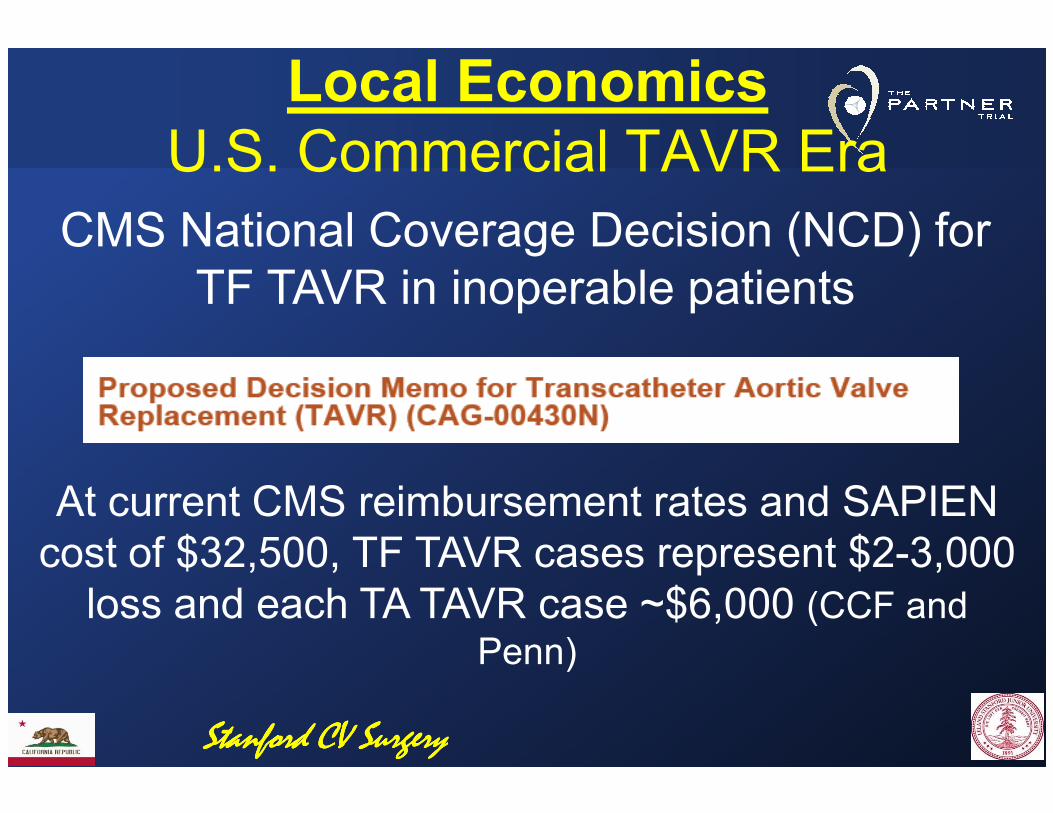
Local EconomicsU.S. Commercial TAVR Era
CMS National Coverage Decision (NCD) for TF TAVR in inoperable patients
Stanford CV SurgeryStanford CV SurgeryStanford CV SurgeryStanford CV Surgery
At current CMS reimbursement rates and SAPIEN cost of $32,500, TF TAVR cases represent $2-3,000
loss and each TA TAVR case ~$6,000 (CCF and Penn)
High risk operable TAVR (P1A)
N Engl J Med 2011;364:2187-98Stanford CV SurgeryStanford CV SurgeryStanford CV SurgeryStanford CV Surgery
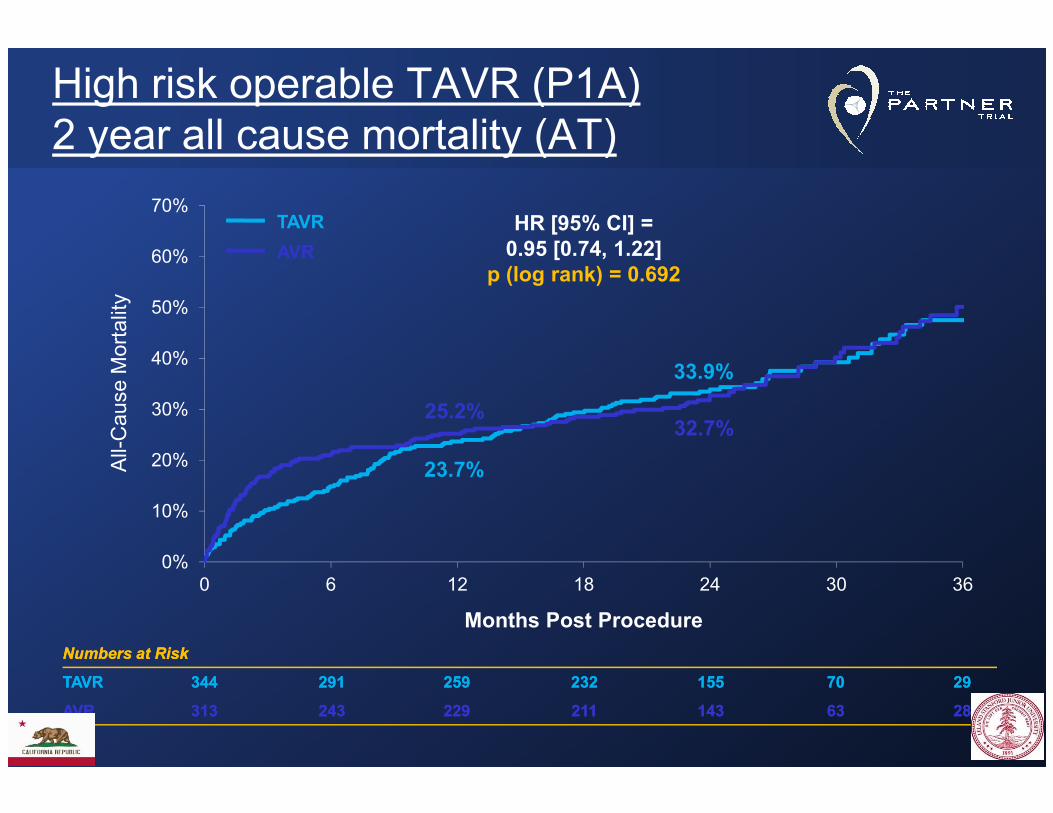
High risk operable TAVR (P1A) 2 year all cause mortality (AT)
30%
40%
50%
60%
70%HR [95% CI] =0.95 [0.74, 1.22]
p (log rank) = 0.692
25.2%
33.9%
Cause Mortality
TAVR
AVR
0%
10%
20%
30%
0 6 12 18 24 30 36
25.2%
23.7%
32.7%
Numbers at RiskNumbers at Risk
TAVRTAVR 344344 291291 259259 232232 155155 7070 2929
AVRAVR 313313 243243 229229 211211 143143 6363 2828
Months Post Procedure
All-Cause Mortality
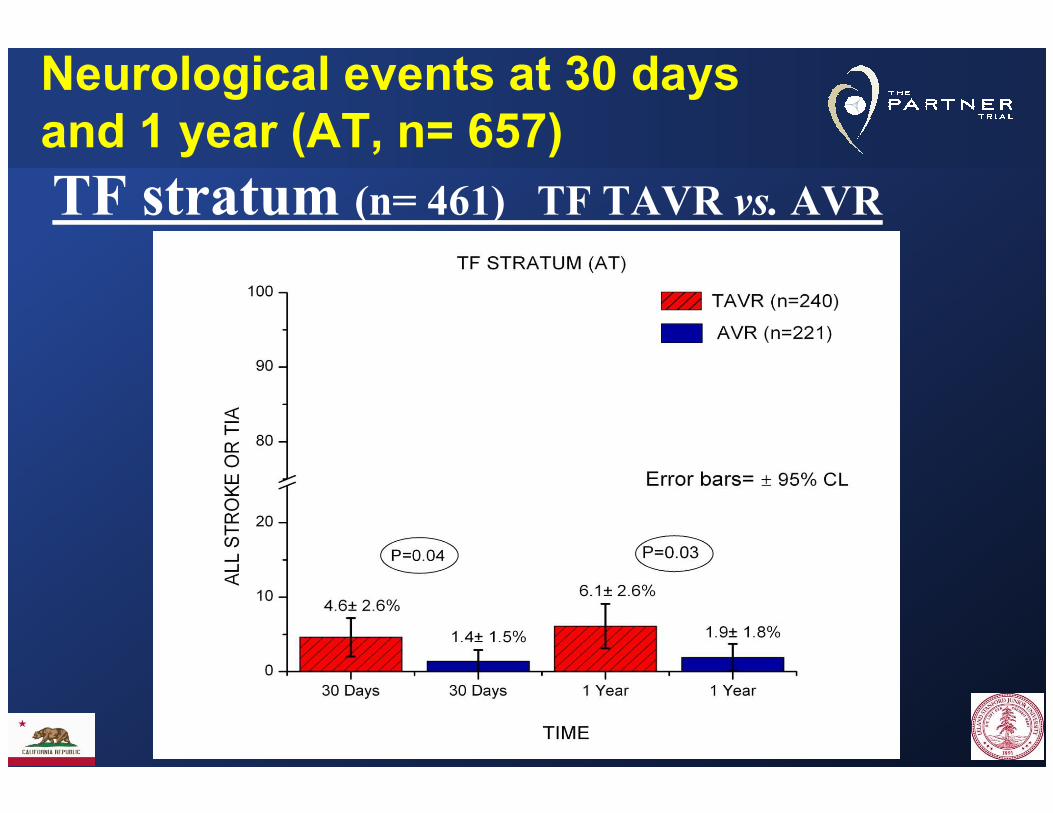
Neurological events at 30 daysand 1 year (AT, n= 657)
TF stratum (n= 461) TF TAVR vs. AVR
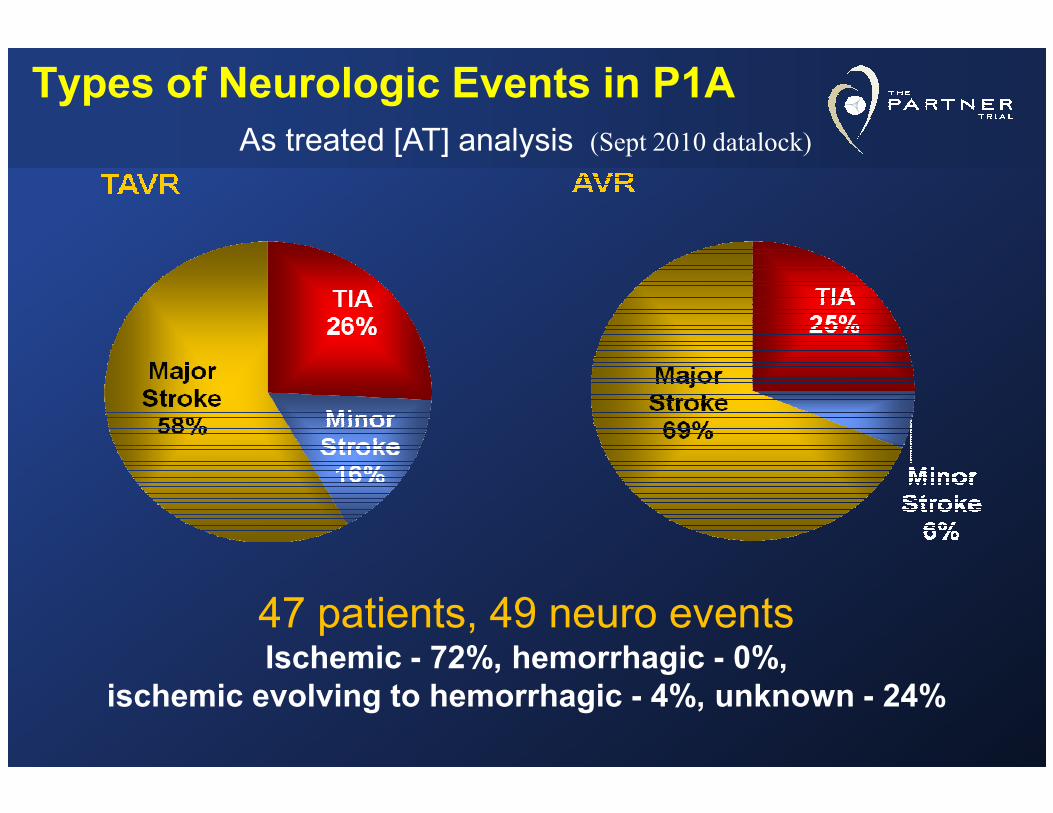
Types of Neurologic Events in P1A
As treated [AT] analysis (Sept 2010 datalock)
47 patients, 49 neuro eventsIschemic - 72%, hemorrhagic - 0%,
ischemic evolving to hemorrhagic - 4%, unknown - 24%

51% Procedural51% Procedural(<10 days)(<10 days)
Timing and Types of Neurologic Events (stroke and TIA)
AVR
AVR
TAVR
TAVR
AVR
AVR
TAVR
TAVR
AVR
AVR
TAVR
TAVR
AVR
AVR
TAVR
TAVR
AVR
AVR
TAVR
TAVR
AVR
AVR
TAVR
TAVR
AVR
AVR
TAVR
TAVR
00--22daysdays
33--55daysdays
3131--364364daysdays
1111--3030daysdays
66--1010daysdays
22--33yearsyears
11--22yearsyears

Risk FactorCoefficient ±
SDP
R (%)
Incremental risk factors for neurologic events (early)
Early high peaking hazard phase
Early hazard phase
TAVR 2.21±0.68 .001 59
Smaller AVA index in TAVR group
-11.8±5.1 .02 57
R(%) = bagging reliability
Atrial fibrillation not significant
in multivariable analysisStanford CV Surgery

90
120
150
TAVR
%/mo%/mo
TF Candidate
Early hazard of neurologic event
0
30
60
.25 .50 .75 1.0
AVR
%/mo%/mo
Months after ProcedureMonths after Procedure

Neurologic event incidence
%% 15
20
25
30TF Candidate
%%
0
5
10
15
6 12 18 24MosMos
TAVRAVR
5451
10699
179159
203170
242221
TAVRAVR
3.4
6.0
2.4
7.4

Neurologic event by 1 monthInfluence of smaller AVA index
%%CandidateCandidate
TAVR
10
15
20
%%
AVAI (cmAVAI (cm22/m/m22))
TF
TA
5
10
0.2 0.3 0.4 0.5 0.6

Neurologic events
15
20
25
%%
Considering
competing risk of death
AVR-TA
TAVR-TA11
0
5
10
6 12 18 24
%% TAVR-TA
AVR-TF
TAVR-TF6.9
2.62.2
5.8
9.1
67
59
1143210618
1796416062
2237617067
24210222192
TAVR-TFTAVR-TAAVR-TFAVR-TA

New Engl J Med (on line, March 26, 2012)
Stanford CV SurgeryStanford CV SurgeryStanford CV SurgeryStanford CV Surgery

P1A 2 year aortic regurgitation (AT)
p < 0.0001 p < 0.0001 p < 0.0001 p < 0.0001
N = 279 N = 228 N = 231 N = 173 N = 217 N = 156 N = 145 N = 113

Total AR and MortalityTAVR Patients (AT)
Mortality
None - Trace
Mild
Moderate - Severe 50.7%
33.4%35.3%
26.2%
p (log rank) < 0.001
Months Post Procedure
Mortality
Numbers at RiskNumbers at Risk
NoneNone--TrTr 135135 125125 115115 101101 6868 3131 1111
MildMild 165165 139139 121121 111111 7171 3333 1616
ModMod--SevSev 3434 2525 2222 1919 1515 66 22
26.3%
12.7%
26.2%

Where Does Threshold for TAVR Belong?- Surgical Operative Risk
Low or Moderate High Inoperable
TAVR orAVRAVR TAVR
FutilityUtility
Surgical Risk > 15%
AVR
Surgical Risk 10-15%
AVR TAVR
ALSO CONSIDER: Age, co-morbidities, life expectancy, higher neurological event risk with TAVR (↑3x in P-1A “AT” TF stratum), adverse consequences of AR (PPL), unknown valve durability (Adapted from Susheel Kodali, TCT 2010)
ReasonableIrrational, reckless,
financially irresponsible

PARTNER P1B inoperable CohortPrimary Endpoint: All-Cause Mortality
Standard Rx
TAVI
cause mortality
(%)
∆ at 1 yr = 20.0%NNT = 5.0 pts
50.7%
HR [95% CI] =0.54 [0.38, 0.78]
P (log rank) < 0.0001
Number at Risk
TAVITAVI 179179 138138 122122 6767 2626
Standard RxStandard Rx 179179 121121 8383 4141 1212
All-cause mortality
(%)
Months
30.7%
Leon et al, NEJM 2010; 363:1597-1607
Cohort “C” ???

P1B 2 year clinical Implications • Two year data continues to support the role of TAVR as the standard-of-care for symptomatic patients with aortic stenosis who are not surgical candidates.
• The ultimate value of TAVR in “inoperable” patients will depend on careful selection of patients who are not surgical candidates, and patients who are not surgical candidates, and yet do not have extreme co-morbidities that overwhelm the benefits of TAVR and render the intervention futile.
Raj R. Makkar, TCT November 2011
Stanford CV SurgeryStanford CV SurgeryStanford CV SurgeryStanford CV Surgery

0.3
0.4
0.5TAVR
AVR
26.8
PARTNER P1A Primary Endpoint:All-Cause Mortality at 1 Year
HR [95% CI] =0.93 [0.71, 1.22]P (log rank) = 0.62
0
0.1
0.2
0 6 12 18 24
Months
348 298 260 147 67
351 252 236 139 65
No. at Risk
TAVR
AVR
24.2
Cohort “C” ???
Stanford CV SurgeryStanford CV SurgeryStanford CV SurgeryStanford CV Surgery

How do you define debility or frailty?
Same age (90) and STS AVR risk (12%)
Frailty Index
7(Severely frail) 1 (Very fit)
Stanford CV SurgeryStanford CV SurgeryStanford CV SurgeryStanford CV Surgery
Courtesy
Todd Dewey

How do you define debility or frailty?Texas “Eyeball Test”
95 years oldTexas tough
Stanford CV SurgeryStanford CV SurgeryStanford CV SurgeryStanford CV Surgery
Courtesy
Todd Dewey

5m walk gait speed & STS risk scoreMortality or Major Morbidity
43.2
30
35
40
45
50
ality or Major
rbidity
rbidity
Normal gait speed (<6s)
Slow gait speed
(≥6s)
Slow gait speed Slow gait speed
((≥≥6s)6s)
5.9
18.921.7
0
5
10
15
20
25
30
Mort
Mortality or Major
Morbidity
rbidity
Low STS risk (<15%)
Low STS risk (<15%)
High STS risk (≥15%)
High STS risk (≥15%)
Afilalo J, J Am Coll Cardiol 56:1668-76, 2010
Normal gait speed (<6s)
(<6s) (≥6s)
Stanford CV SurgeryStanford CV SurgeryStanford CV SurgeryStanford CV Surgery

Who possibly is a Cohort “C”?STS >15- 20
FEV1 < 40%
Long term O2 dependence with history cigarette smoking
Pulmonary hypertension, especially with right heart failure and severe TR, ± severe MR
Chronic kidney disease- Cr >3Chronic kidney disease- Cr >3
Liver disease with MELD > 15
Extreme obesity
Depressed affect, dementia, psychologically has “given up”
Frailty, impairment from previous CVA, neuromuscular disease
Immobile- wheel chair bound
Very slow 5M walk test- > 12 seconds or unable to walk
Stanford CV SurgeryStanford CV SurgeryStanford CV SurgeryStanford CV Surgery

Medical Futility:
Its Meaning and Ethical Implications*
“In judging futility, physicians must distinguish between an effect, which is limited to some part of the patient’s body, and a benefit, which appreciably improves the person as a whole.”
“ futility is a professional judgment that takes
precedence over patient autonomy .”
*Schneiderman et al, Ann Int Med 1990;112:949-54
Stanford CV SurgeryStanford CV SurgeryStanford CV SurgeryStanford CV Surgery Craig R. Smith, AATS 2011
appreciably improves the person as a whole.”

TAVR Cohort C considerations
Wise tips to avoid futile treatment
Michael Mack:“it will be important in these inoperable patients to identify those who are cohort C- dying with aortic stenosis, but not from aortic stenosis”
Stanford CV SurgeryStanford CV SurgeryStanford CV SurgeryStanford CV Surgery
aortic stenosis, but not from aortic stenosis”
John Webb:"It's becoming more and more our job not to do the patients we did earlier.”
PCR London Valve, October 2011

TAVR Cohort C considerations
Can’t anybody in the USA die with dignity today?Just because we can treat with TAVR does not mean we should offer TAVR to all inoperable AS patients
Stanford CV SurgeryStanford CV SurgeryStanford CV SurgeryStanford CV Surgery
“We've added years to life, not life to
years.”
George Carlin (2001)

TAVR Cohort C considerations
Avoiding Futile Therapy
There are other ways to find AS patients with
an STS risk of 11-12%....
PARTNER 1B excluded: Renal failure, end-
Stanford CV SurgeryStanford CV SurgeryStanford CV SurgeryStanford CV Surgery
PARTNER 1B excluded: Renal failure, end-
stage liver disease, endocarditis, severe LV
dysfunction, cardiomyopathy,
urgent/emergent cases, untreated CAD

With limited healthcare dollars in the future, we face difficult choices
concerning unrestricted patient access to
innovative but costly
September 21, 2009
innovative but costly new technologies
Stanford CV SurgeryStanford CV SurgeryStanford CV SurgeryStanford CV Surgery

Economic Constraints
• Cost-effectiveness• Comparative effectivenessresearch (CER)? fewer procedures
Obama Health Economics
? fewer procedures? reduced access? increased regulation? innovation stagnation
Stanford CV SurgeryStanford CV SurgeryStanford CV SurgeryStanford CV Surgery

Stanford CV SurgeryStanford CV SurgeryStanford CV SurgeryStanford CV Surgery

Stanford CV SurgeryStanford CV SurgeryStanford CV SurgeryStanford CV Surgery