tata motors
TRANSCRIPT

LeadingThe
Future
Sep. - Oct., 2003

1
Statements in this presentation describing the Company’s objectives, projections, estimates, expectations may be “forward looking statements” within the meaning of applicable securities laws and regulations. Actual results could differ materially from those expressed or implied. Important factors that could make a difference to the Company’s operations include, among others, economic conditions affecting demand / supply and price conditions in the domestic and overseas markets in which the Company operates, changes in Government regulations, tax laws and other statutes and incidental factors

2
Presentation Outline
x Introduction to Tata Group & Tata Motors
x Growth Strategy
x De-risking The Business
x The Way Forward

3
Tata Group – Leading Business Group in India
x Among the prominent industrial houses of India, with a pioneering track record of more than 125 years
x Over 80 companies with dominant presence in a wide range of businesses such as Materials, Chemicals, Energy, Engineering, Communications & Information Systems, Services and Consumer Goods
x Turnover : Rs 542 bn (US$ 11.2 bn) in FY03 (equivalent to 2.4% of India’s GDP at current prices)
x Net Profit : Rs 39 bn (US$ 805 mn) in FY03
x Strong Brand Equity
x Good Business Ethics

4
Tata Motors – India’s Largest Automotive Companyx India’s first and only fully integrated Automobile manufacturer, with a
significant presence in Commercial and Passenger vehicle markets
x Commenced operations in 1945
x Indigenous technology development for all its products
x FY03 Financial Overview
- Highest ever Net Revenues (unconsolidated) of Rs 91 bn (US$ 1.9 bn)
- PAT (unconsolidated) of Rs 3 bn (US$ 63 mn)
- Operating EVA positive - Operating ROIC of 13.6%
- Dividend of 40%
- Asset base of Rs 41.6 bn (US$ 877 mn)

5
Milestones
1954
19861990
19911994
1945Incorporated as a Public Ltd. Company with a factory at
Jamshedpur for manufacturing locomotives
Daimler-Benz collaboration for CVs
Produced one millionth vehicle
Entered the Car market with Sierra & Estate
Tata Sumo (UV) launched
1997100,000th Sumo rolled out
1998Two millionth vehicle rolled out.
Indica launched
2002100,000th Indica rolled out
Indica V2 launched
1967 Engineering Research Centre set up at Pune
2003
200,000th Indica sold, 500,000th PV rolled outIndica platform achieves break-even
Indigo launchedAgreement with MG Rover for Indica exports
Produced first in-house LCV Tata 407
1969Technical agreement with Benz expired
2001
Three millionth vehicle rolled out

6
Wide Product RangeTrucks (2MT– 40 MT GVW) Buses (12 -60 seater) Passenger Vehicles

7
Maintaining Leadership In Domestic Market
82,564
107,438
88,865104,414
0
20,000
40,000
60,000
80,000
100,000
120,000
CVs PVs
FY02 FY03
+30% +17%Growth
Market share in FY03
x CVs: 56%
x PVs: 15%
April-August, 2003
CVs: Volumes +39% Market share: 58% (+410 bps) PVs: Volumes +45% Market share: 16% (+220 bps)

8
Financial Snapshot
Last 2 yearsRevenue CAGR of 16% & PBT swing of Rs 10 bn
Net Revenue and EBITDA MarginRs bn
6875
91
6.1%
9.9%
12.5%
0
20
40
60
80
100
FY01 FY02 FY030
5
10
15
Net Revenue EBITDA Margin
%PBT and PAT
Rs bn
(5.0)
(1.1)
5.1
(5.0)
(0.5)
3.0
(8)
(4)
0
4
8
FY01 FY02 FY03
PBT PAT

9
Financial Performance – 1Q FY04
x Net Revenues of Rs 25 bn (up 43% YoY)
x EBITDA margin of 13.3% - highest in last 21 quarters
x Pre-tax Cash Profit of Rs 2.9 bn (up 125% YoY)
x PBT of Rs 1.6 bn against Rs 0.4 bn in 1Q FY03
x PAT of Rs 1 bn - highest since April 1998

10
5042
52 50
63
40
88
148
218
120
0
50
100
150
200
250
Apr-02 Jul-02 Oct-02 Jan-03 Apr-03 Jul-030
20
40
60
80
100
Tata Motors Mcap (RHS) Total Auto Index Tata Motors BSE Sensex
Rs bnIndex
Stock Price Performance
+118%8840Tata Motors Market Cap (Rs bn)
+118%275126Tata Motors Stock Price (Rs)
+48%148100Auto Index (April 1, 2002=100)
+20%4,2173,500BSE Sensex
% changeSep 19, 2003Apr 1, 2002
11
Presentation Outline
x Introduction to Tata Group & Tata Motors
x Growth Strategy
x De-risking The Business
x The Way Forward

12
Strategy Ladder - Turnaround
Further BE point reduction
Platform strategy
Customer-centric activities
Positive PBT in Car Project
Aggressive Cost reduction Re-engineered processesMarket share gainsOrganisational
transformation
Turnaround (FY01-03)Improving Internal Efficiencies

13
Strategy Ladder – Growth Phase
Profitable Growth (FY04-06)Leveraging Strengths
Revenue growth through
- Consolidation in domestic market
- Significant presence in international markets
New business activities
ROIC improvement
New Generation Products
Capitalise on prod. dev. skills and costs globally
Turnaround (FY01-03)Improving Internal Efficiencies
Further BE point reduction
Platform strategy
Customer-centric activities
Positive PBT in Car Project
Aggressive Cost reduction Re-engineered processesMarket share gainsOrganisational
transformation

14
Economic Recovery
Auto sector to benefit from increased Industrial and Consumer demand
Indian Economy
Economic Growthx Industrial recovery x Improvements in Capital
Equipment industryxNormal monsoon
InfrastructurexStrong construction activityxRoad Projects
Fiscal InitiativesxBenign interest ratesxRationalisation of Excise duties

15
India Commercial Vehicle Market
FY03 Market size : 192,000 units
Tata Motors’ Market share: 56%
LCV Bus10%
HCV trucks20%
MCV trucks24%
LCV Truck18%
MHCV Bus10%
Pickups12%
ICV trucks6%
(80%)
(65%)
(28%)(63%)
(37%)(17%)
(51%)
Tata Motors – Leading the CV market
No. of foreign players: 2
Market share: 0.3%

16
Source: NHAI
Road Development Programme
Year-wise completion schedule of NHDP
Planned length – 14,000 km
Between 1997 - 2002, Highway length in China increased by around 15,000 km and
CV volumes nearly doubled from 1.2 mn to 2.1mn …
….. Indicative of likely future directions in Indian market
2005-0752%
200312%
200421%
Completed15% 0
100
200
300
400
500
600
700
800
900
1000
0 0.5 1 1.5 2
Tru
ck p
enet
rati
on
MH
CV
/ m
pop
ulat
ion
Germany
FranceUK
Spain
Portugal
Turkey
Australia
IndiaIndonesia
South AfricaChina
BrazilArgentina
Russia
12
3
4
Stage
Road DensityPaved Highway (km) / Area (km2)
Dramatic impact on volumes in initial
stage of road development
0
100
200
300
400
500
600
700
800
900
1000
0 0.5 1 1.5 2
Tru
ck p
enet
rati
on
MH
CV
/ m
pop
ulat
ion
Germany
FranceUK
Spain
Portugal
Turkey
Australia
IndiaIndonesia
South AfricaChina
BrazilArgentina
Russia
12
3
4
Stage
Road DensityPaved Highway (km) / Area (km2)
Dramatic impact on volumes in initial
stage of road development

17
Emerging Trends In CV Demand
MHCVs
LCVs
HCVs gaining strength due to lower cost of operationGrowth in Pickups indicating desegregation of load at the lower end
0
40000
80000
120000
160000
FY97 FY98 FY99 FY00 FY01 FY02 FY03
HCV trucks MCV trucks MHCV Buses
020000400006000080000
100000
FY97 FY98 FY99 FY00 FY01 FY02 FY03
Pickups LCV Trucks Buses

18
Tonnage Addition – More Than A Cyclical Recovery
Factors behind the recoveryEconomic Recovery Lower Interest rates Market Share gains from Railways Replacement & Upgradation of VehiclesInfrastructure Projects
Despite lower GDP growth, the tonnage addition in FY03 nearly equalled
the addition in last peak (FY97)
0.7
0.50.6
0.8
1.4
0.70.8
1.0
1.3
0.7
1.2
1.0
1.3%
5.1%
7.8%
4.8%
6.5%
4.3%5.6%
4.0%
-
0.2
0.4
0.6
0.8
1.0
1.2
1.4
1.6
FY92 FY93 FY94 FY95 FY96 FY97 FY98 FY99 FY00 FY01 FY02 FY030%
3%
6%
9%
Tonnage Addition (mn MT) GDP Growth
Transporters’ ROE continues to be healthy

19
Upside Potential In Bus Demand
China Bus market India Bus market
(‘000)
410 488631
247276
344
71
5844
0
200
400
600
800
1000
1200
2000 2001 2002
Mini Light Medium/Large
701,000Total 822,000 1,046,000(‘000)
12 1418
20
1725
0
10
20
30
40
FY01 FY02 FY03
Light Medium
37,000Total 31,000 38,000
With a geographic & population profile similar to China, India bus market is under-penetrated

20
Tata Motors – Initiatives & Achievements
x MHCV & LCV segment– Superior range of EX series of
M&HCVs and 709LPT launched
x Pick-up Segment – 207DI pickup launched in Aug’02– Gained market share in high
growth segmentx Fully Built Vehicles
– Increased thrust on fully built vehicles & solutions– Wide range of buses, tippers & other applications– FBV volumes doubled

21
Tata Motors – Capturing The Upswing
x Focus on hi-performance Total CV solutions
– Truck of the Future to match global standards
– Higher GVW, power to weight ratio
x Range of Fully Built Buses– Contract manufacturing route
for body building
x Non-vehicular business– Customer Financing– Spares, Recon, AMC
22
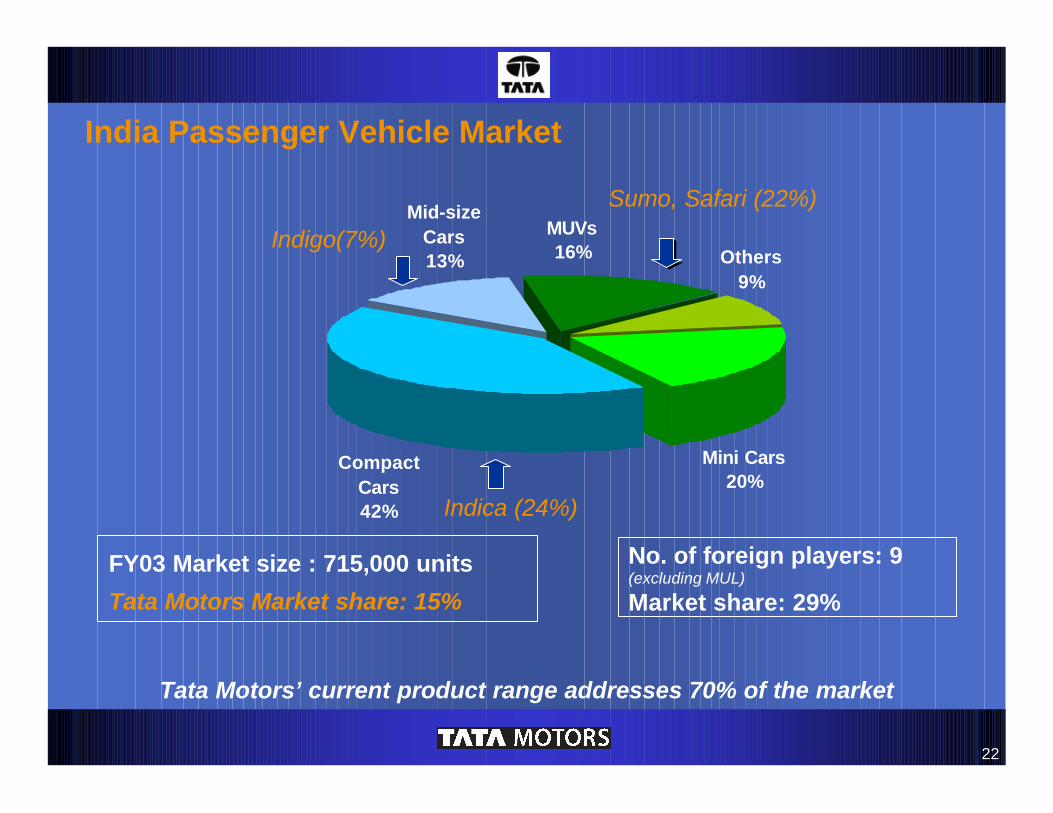
Mini Cars20%
Compact Cars42%
MUVs16% Others
9%
Mid-size Cars13%
Indica (24%)
Indigo(7%)
Sumo, Safari (22%)
Tata Motors’ current product range addresses 70% of the market
India Passenger Vehicle Market
No. of foreign players: 9(excluding MUL)
Market share: 29%
FY03 Market size : 715,000 units
Tata Motors Market share: 15%

23
x Demographics
x Infrastructure
x Economic Factors
x Competitive Intensity
x Technology
x Regulations
Growth Drivers
India Passenger Vehicle Market Potential
PV Market potential
647
1,187
2002 2008E
CAGR 11%
‘000 units

24
Growth Drivers
China PV market
612717
1,121
0
200
400
600
800
1000
1200
1400
2000 2001 2002
‘000 units
x Release of pent-up demand in 2002– Price cuts by OEMs– Easing of Regulations– Low cost finance– Finance availability
+56%
India PV market
?
x Similar conditions in India– Excise duty reduction– Low cost finance– Finance availability– New product launches
‘000 units
624 606647
0
200
400
600
800
1000
2000 2001 2002 2003E
FY04 YTD growth 25%
25
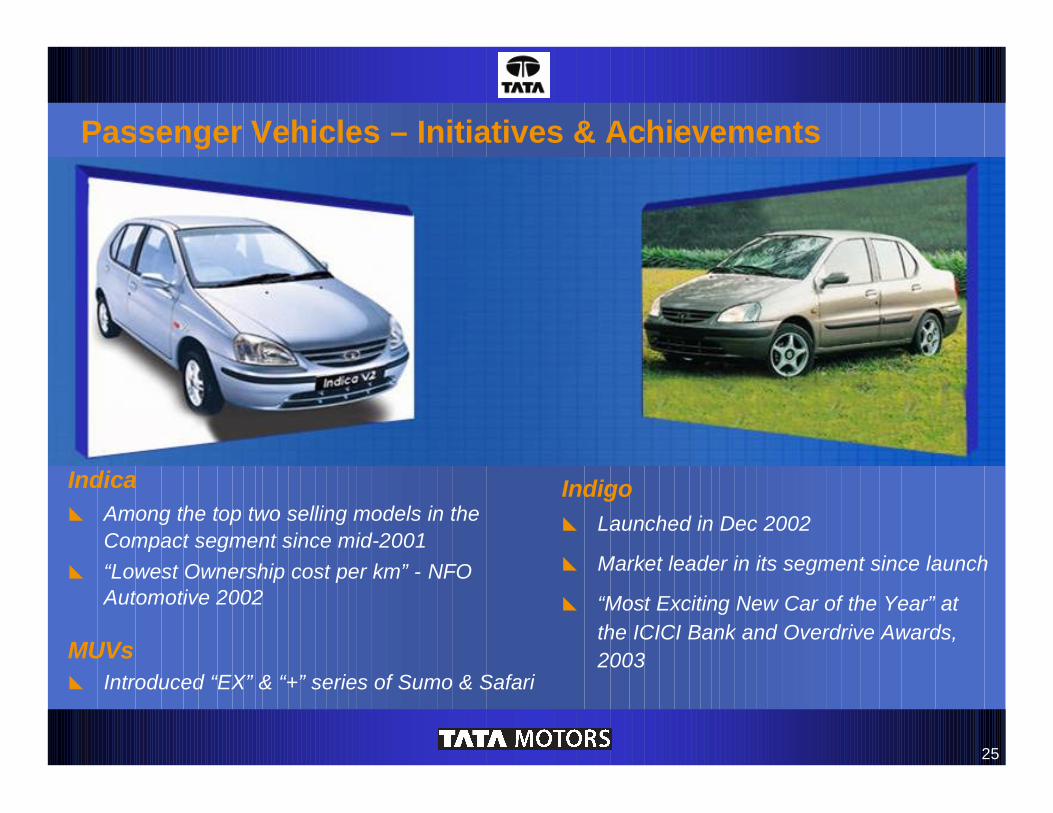
Indicax Among the top two selling models in the
Compact segment since mid-2001x “Lowest Ownership cost per km” - NFO
Automotive 2002
Indigox Launched in Dec 2002
x Market leader in its segment since launch
x “Most Exciting New Car of the Year” at the ICICI Bank and Overdrive Awards, 2003MUVs
x Introduced “EX” & “+” series of Sumo & Safari
Passenger Vehicles – Initiatives & Achievements
26
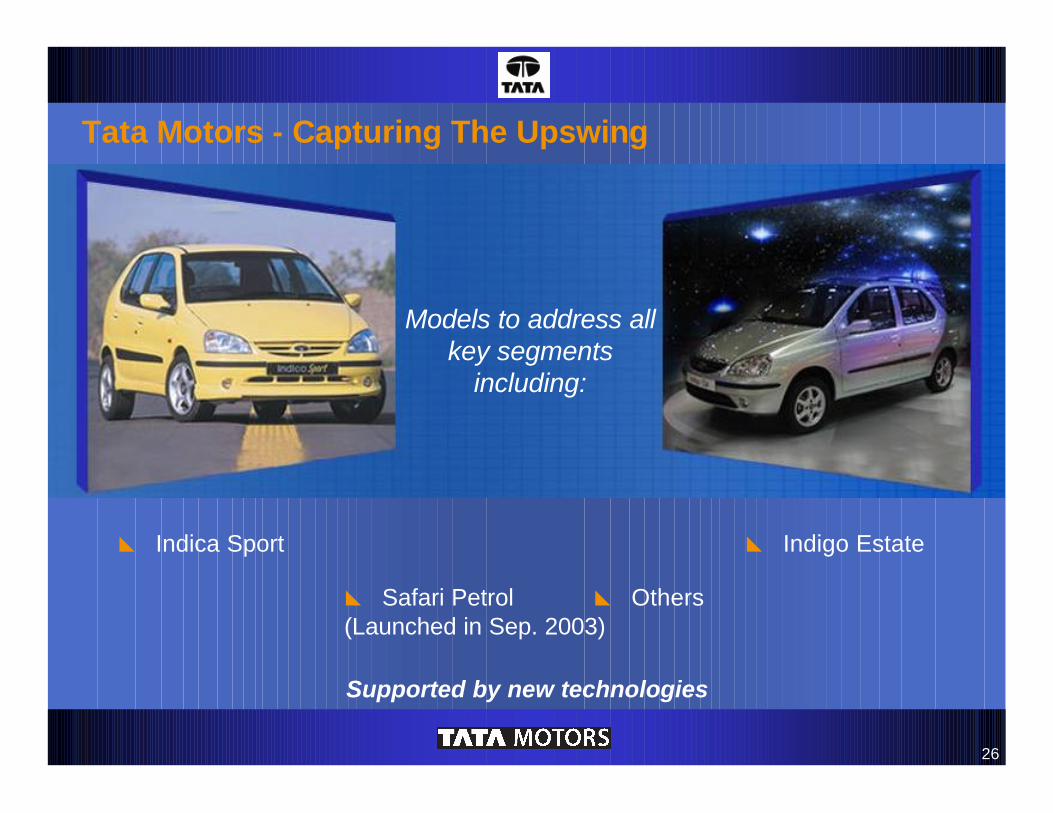
Models to address all key segments
including:
x Indica Sport x Indigo Estate
x Safari Petrol (Launched in Sep. 2003)
x Others
Supported by new technologies
Tata Motors - Capturing The Upswing

27
Presentation Outline
x Introduction To Tata Group & Tata Motors
x Growth Strategy
x De-risking The Business
x The Way Forward

28
Going Globalx Near term strategy
– Strengthen presence in traditional and niche markets• Exports volumes up 71% in first five months of FY04
– Establish regional alliances for marketing
Focussed markets identified for growth
– Re-launched CVs in Colombo and 5 other cities in Sri Lanka
Reflected in the agreement with MG Rover Group – Intend to export 100,000+ Indica to EU over 5 years
• Shipments to begin in 3Q FY04
– Distribution of Safari & Pick-ups in EU
x Long term strategy– Develop ”Truck of the future”– Leverage technical capabilities for product development
Significantly expand presence in the global market

29
Non-Cyclical Revenue Stream
x Exports
x Spares
x Vehicle Financing
x Reconditioned Vehicles / Aggregates
x Marine & Industrial Engines
Plan to increase it to around 20% of Net Revenue in next 2-3 years
13% of Net Revenue
Revenue from Non-cyclical Business in FY03

30
Rs bn
Cost Reduction
Cost Reduction ElementsFY01 – FY03
Total Cost Reduction
Var. Conv. 10%
Raw Mat.65%
Interest25%
Total Cost reduction of Rs 9.5 bn in last three years
3.3
2.8
9.53.3
0
1
2
3
4
5
6
7
8
9
10
FY01 FY02 FY03 Total

31
36%31%
45%
45%43%
54%
0
10
20
30
40
50
60
FY01 FY02 FY03
BEP as % of capacityCapacity utilisation
CVs
62%
48%
95%
29% 44%
54%
0
20
40
60
80
100
FY01 FY02 FY03
BEP as % of capacityCapacity utilisation
Cars% %
Lower Break-even Points

32
Reduction In Balance Sheet Size72 68 63 48
ROCE (pre-tax) 3.7% 2.7% -1.1% 5.4% 17.4%
42Rs bn
40 40 38 35 33
12 12
78
9
141210
14 8 2
0
(4)
11
-10
0
10
20
30
40
50
60
70
FY99 FY00 FY01 FY02 FY03
Net Fixed Assets Investments Net Working Capital
Deferred Revenue Expenses Deferred Tax Assets (Net)
Avg. Asset Turnover 0.8 1.0 1.0 1.4 2.0

33
Tighter Fiscal Discipline
Days of sale
Inventory
Receivables (non-HP)
Days of sale
Net Working Capital
Negative Working Capitalfor the first time in the Company’s history
112
77
33
7
0(15)
-20
0
20
40
60
80
100
120
FY98 FY99 FY00 FY01 FY02 FY03
74
57
29 28 2518
0
20
40
60
80
100
FY98 FY99 FY00 FY01 FY02 FY03
48 4741
5041
39
0
20
40
60
FY98 FY99 FY00 FY01 FY02 FY03

34
Stronger Cash Flows & Debt Reduction
67
11
0
2
4
6
8
10
12
FY01 FY02 FY03
1523
30
0.56
0.94
1.27
0
5
10
15
20
25
30
35
FY01 FY02 FY030
0.2
0.4
0.6
0.8
1
1.2
1.4
Debt D/E (adj.) - RHS
Rs bn
Free Cash Flow Debt & D/E
Rs bn

35
Presentation Outline
x Introduction to Tata Group & Tata Motors
x Growth Strategy
x De-risking the business
x The Way Forward

36
Leveraging Our Strengths
Backed by TATA Brand
Global scales in CVs
Advantage Tata Motors
Distribution network & service reach
Integrated & cost competitive mfg.
facilities
Partnerships for components/ aggregates
Excellent R&D capabilities
Low cost product development
capability

37
The Way Forward
x Domestic demand drivers in place – Capture advantage of CV uptrend and growth in PVs
x Expand presence in global markets
x Reduce interest cost
x Explore further opportunities for cost reduction
x Disciplined capex programme
x Better working capital management

38
Tata MotorsCombining capabilities and cost advantage to emerge as a
world class automotive company
Leading the future ……Leading the future ……

39
Thank YouThank You
Visit us at www.tatamotors.com