tat lan sustainable food security and livelihoods...
TRANSCRIPT
TAT LAN SUSTAINABLE FOOD SECURITY AND LIVELIHOODS
PROGRAMME
2016 OUTCOME MONITORING AND PROGRAM QUALITAY ASSESSMENT
2
Contents INTRODUCTION ......................................................................................................................................... 3 The Tat Lan Program – the Goal and Objectives....................................................................................... 3 METHODHOLOGY ...................................................................................................................................... 4 Quantitative .............................................................................................................................................. 4 Qualitative ................................................................................................................................................. 4 NOTE FOR THE READER ............................................................................................................................. 5 FINDINGS ................................................................................................................................................... 6
Outcome 1: Communities actively participate in decision making related to community development ................................................................................................................................ 6 Discussion and recommendations ......................................................................................... 13
Outcome 2: Enhanced livelihood and nutrition through improved infrastructure and strengthened hygiene and sanitation practices ........................................................................ 15 Discussion and recommendations ......................................................................................... 20
Outcome 3: Strengthened livelihood, food and nutrition security through enhanced livelihood opportunities ............................................................................................................................. 21 Discussion and recommendations ......................................................................................... 29
Outcome 4: Sustainable livelihood opportunities supported through increased access to financial services ........................................................................................................................ 31 Discussion and recommendations ......................................................................................... 36
Outcome 5: Improved nutrition security in the target areas .................................................... 36 Discussion and recommendations ......................................................................................... 39
Outcome 6: Community development and sustainable livelihood opportunities are supported through socially accountable government ................................................................................ 39 Discussion and recommendations ......................................................................................... 44
PROGRESS TOWARDS PROGRAM GOAL AND CONCLUSIONS ................................................................. 45
3
INTRODUCTION The Tat Lan Program – the Goal and Objectives The Tat Lan Program, implemented by the International Rescue Committee (IRC), Save the Children UK (SC), Oxfam, and the local non-governmental organization (NGO) Better Life Organization (BLO) is designed to contribute to equitably and sustainably improving the livelihoods of 259 communities in the townships of Myebon, Pauktaw, Kyaukpyu and Minbya in Rakhine State. The initial design of the program was implemented from 2013 through 2015, and was then revised. With the revision the implementation structure and dynamics were changed, and some key components such as hygiene and financial education were strengthened, while others, such as support to aquaculture farmers and establishment of village information centers were omitted. Overall, the program is focusing to achieve its goal of sustainable increase of food and nutrition security and incomes of participant households. The program is designed based on six main outcomes:
I. Outcome 1: Communities actively participate in decision making related to community development
II. Outcome 2: Enhanced livelihood and nutrition through improved infrastructure and strengthened hygiene and sanitation practices
III. Outcome 3: Strengthened livelihood, food and nutrition security through enhanced livelihood opportunities
IV. Outcome 4: Sustainable livelihood opportunities supported through increased access to financial services
V. Outcome 5: Improved nutrition security in the target areas VI. Outcome 6: Community development and sustainable livelihood opportunities are supported
through socially accountable government The activities implemented in the framework of the program contribute to four sectors that constitute the key elements of livelihoods in Rakhine:
Infrastructure: The program works with communities to restore and manage key embankments and freshwater resources, and also support communities with latrine construction. Infrastructure activities are implemented through the Cash for Work (CFW) component that supports the poorest and most vulnerable.
Fisheries: Tat Lan strengthens village-level fishery groups, builds their technical capacity, and promotes economically and environmentally sustainable fishery practices. The program pilots innovative technologies to connect groups to gender-sensitive value chains and marketing strategies to help secure increased income for men and women fisher-folk.
Agriculture: The program improves rice production and resilience, while stimulating diversified crop production. This will be achieved by delivering key inputs such as seeds and fertilizers, building local capacity, and demonstrating innovative technologies and practices.
Financial Services: Through a phased approach, Tat Lan Program will provide a package of financial services to villages. Through the formation of Village Savings and Loans Associations (VSLAs), the program is providing clients with the opportunity to save and access loans and stimulus grants, complementing the program’s productive activities interventions with the income needed to boost subsistence farmers and fishers to small business owners.
The program was designed to be complemented by a comprehensive information management scheme to ensure that learning is disseminated and shared within, across, and beyond villages. A government engagement strategy should guide the consortium in engaging with and building capacity of local government. Gender equality and social protection is mainstreamed through all program components. Tat Lan offers important opportunities to improve nutrition indicators in program areas and enhance access to small scale village saving and loan associations to further support livelihood, food and nutrition security.

4
METHODHOLOGY
Quantitative To get an indication whether the Tat Lan program is moving towards its intended goals, CARE designed and implemented an outcome monitoring survey in villages where Tat Lan had implemented activities from 2013 through 2016. The survey was a rapid survey focusing only on the key variables, without providing further details on the potential quantitative interpretation of the findings, as the intention was only to receive an indication of the key achievements. To do so, the number of total unique beneficiaries in Tat Lan program was used as sample frame to sample 8% for the survey. Proportionally to the population size, CARE randomly sampled 49 villages across four townships. Overall, 2,874 households were surveyed including 4,692 Tat Lan beneficiaries. In the previous year, when 25 villages were sampled and 2,232 surveys completed, the proportion of beneficiaries covered by the survey was higher with an average number of beneficiaries per household 2.2. In 2016, the average number of beneficiaries per household was only 1.6, meaning that Tat Lan has taken a more scattered approach reaching out to a wider population with lower/shorter contact time per household. Such scattered approach has made it difficult to reach out to a sample of minimum 10% of beneficiary households within the available resources, but has not proven to have any significant negative impact on the analysis and results. Table below summarizes the scope of the household survey in each township.
Township # of villages
sampled Interviewees/HH # of beneficiaries
covered by the survey Average
benef. per HH Pauktaw 11 485 601 1.2
Myebon 17 1,262 2,487 2
Minbya 6 300 458 1.5
Kyaukpyu 15 827 1,146 1.4
Total 49 2,874 4,692 1.6
Table 1: Outcome monitoring survey sample
As in previous years, the sampling approach used for the household sampling was census collecting, meaning that all Tat Lan beneficiary households who were at home at the time of the data collection were interviewed from the 49 randomly selected villages. The means and medians of the outcome monitoring data set are then compared to the means and medians of the baseline values to understand the significance of any differences. For this, the non-parametric Wilcoxon Signed Rank Test was used for comparing medians, and paired sample t-test was used for means. Once differences were identified and proved, the spearman correlation test was applied to explore further associations and binary logistic regression test to assess Tat Lan’s contribution into the outcome variables.
Qualitative In 2016 CARE used a relatively wide range of qualitative data collection approaches that have contributed to this report. The main approach to data collection deployed in the review process is part of a participatory action research method. More particularly, the method used was an adjusted version of a community score card exercise based on guidelines developed by CARE International1. The community score cards were implemented in 5 Tat Lan villages using purposeful intensity sampling. Information-rich villages were selected that manifest the phenomenon intensely, meaning that villages were selected where the biggest variety of Tat Lan activities were being implemented. The sampled communities were divided into interest groups for participatory focus group discussions. The interest
1 The Community Score Card (CSC). A generic guide for implementing CARE’s CSC process to improve quality of
services, May 2013

5
groups were drawn from the list of Tat Lan activities conducted/inputs provided in the particular village. Each group had a local facilitator assigned, who lead the discussions around Tat Lan inputs within their interest group. Except the facilitators, other participants were encouraged to switch the groups if they wanted to contribute to more than one interest group discussion. The results of the interest group discussions were reported back in a plenary session to everybody by the group facilitators, after which CARE M&E staff developed quality indicators based on the discussion results for final scoring exercise by the participants. In total 22 participatory focus groups were implemented through the community score card approach with 142 participants (49m; 93f). Due the rather scattered approach used in Tat Lan implementation in 2016 community score card implementation was replaced with traditional focus group discussions in 4 villages in Kaypkyu, as indicated in the table below. Pauktaw Myabone Minbya Kyaupkyu
# of villages 2 1 2 4
# of CSC/focus groups 9 4 9 4 (FGD)
# of total men in CSC/focus groups 24 10 15 36
# of total women in CSC/focus groups 40 3 50 25
# feedback records from Tat Lan beneficiaries 34 34 11 49 Table 2: scope of qualitative data collected
In addition to the above community score cards and focus group discussions CARE has collected further feedback from Tat Lan participants throughout 2016 using qualitative semi-structured interview approach to assess the participants satisfaction with beneficiary selection, effectiveness/relevance of the activities, coordination between Tat Lan and the communities, timeliness of the activities and potential sustainability of the intervention. Total 128 interviews were recorded with participants from all activities implemented in 2016, which have contributed to this report.
NOTE FOR THE READER 1) As also mentioned in the methodology section, the quantitative survey was a rapid survey
focusing only on the key variables of Tat Lan expected outcomes, which might pose some limitations on the interpretation of some findings or on the understanding of the context in general that might have influential impact on the program achievements.
2) According to the Ministry of Planning and Finance in January 2016 Rakhine state topped the
inflation rate list with 14.04%. However, due several reasons the usual practice is that if the
inflation rate remains below 20% monitoring of inflation is done only at the macro level
(secondary data), and focus is given a the project level to measuring changes in spending
behavior. Hence, in its annual outcome monitoring survey CARE measures the purchasing
power of the target groups disaggregated by the main livelihood strategy since different
livelihood sectors are affected by spiking or decreasing inflation rates differently. For example,
for the purpose of this report CARE measured and analyzed the affordability of various
livelihood assets and services in agriculture and fishery sector separately. Also reported incomes
and indebtedness include inflation. Impact of inflation on food security is mostly measured
through access to different food groups that is then used for the analysis of dietary diversity
among different targets groups. Overall, this report does not include any direct micro level
monitoring of inflation’s impact on target households.

6
3) The narrative of the report provides some statistical elements for a research literate reader which is important to understand the weight of the findings. These elements are not necessarily important for the casual reader to understand as the weight has been emphasized within the narrative to the necessary extent.
4) The qualitative data used in this report serve as guidelines for the program staff to keep in mind
while conducting their field work or monitoring visits. These findings are not representative to the whole program and should be observed in the individual villages by program staff.
5) Due the very limited scope of certain program components (e.g. fishery co-management), due the methodology of qualitative data capture, and due the nature of the assessment, not all program components are reflected in the below analysis and reflection.
FINDINGS Outcome 1: Communities actively participate in decision making related to community development Under outcome one Tat Lan’s expected outputs are to implement village level project activities through a participatory planning process, and to improve access to and management of information in target villages. The program expects that the village-based planning process will highlight the importance of a village planning body for the effective implementation of development work and generate a demand for them, thereby contributing to community ownership. According to the proposed design, the program will build on this momentum by supporting the development of Village Development Committees (VDC) that will be responsible for the management of community program activities and ensuring the broad representation and inclusion of community groups. It is assumed that including women in the VDCs will contribute to addressing gender inequities in the planning and decision-making processes. With input from the problem and response analyses, which will integrate gender equality concerns, IP staff will work with communities to underscore the importance of women’s roles and participation and establish a target for women representatives in VDCs.2 At the end of 2015 a revision was carried in the design of the implementation plan of this outcome whereby development of new Village Information Centers (VIC) was removed. This means that target villages that did not have a VIC by end of 2015 did not receive support for a construction of one VIC. However, the use of already existing VIC has been assessed under this outcome. Overall, outcome 1 has three key indicators have been agreed within Tat Lan consortium to provide insight into the progress of the achievements:
Outcome 1 indicators
Baseline value 2016 value Targe
t
% achievement from target
T M F T M F
% of HHs in targeted area reporting having purposely visited the VIC at least once a quarter (m/f)
N/A 30% -** -**
70% 43%
% increase of target households reporting participation in matters related to community development and planning (m/f)
52% 20% 32% 47% 55%* 45%*
85% 55%
% increase of households who participate in community meetings
3 report women participation in matters related to
community development and planning
41%
15%
26% 61% -** -**
70%
87%
Table 3: Outcome one indicators and progress against targets * p<0.001 ** no differences in sex disaggregation (p>0.05)
2 Tat Lan Sustainable Food Security and Livelihoods Program, Technical Application, Call for Proposals Resubmitted
15 November 2012, by IRC, Save the Children UK, Oxfam Great Britain/Better Life Organization 3 Due the way baseline, 2014 and 2015 values were calculated the indicator is suggested to be redefined to: %
increase of households who report women participation in matters related to community development and planning.

7
Village Information Centres After above mentioned revisions in the program design establishment of new VIC has been removed from the program design with the assumption that the already established VICs will still be updated with program and market information. However, due the lack of priority on VICs in the program updating the VICs has made a relatively significant drop in 2016 whet out of 147 VICs only 13% was updated monthly with project information and 19% with market information as shown in the table below.
End of 2015 2016 Overall average
Monthly update with project information 44% 13% 29%
Monthly update with market information 47% 19% 33%
Table 4: monthly update of VICs
The Program’s decision to omit the VIC component has created some confusion in the target communities. For example community score card participants were still referring to Tat Lan program when requesting help with and update of the VICs not realizing that the communities are free to use the VICs at any time for any purpose. Furthermore, communities where VICs were not established, but are neighbouring communities where VICs are already existent the community score card participants requested Tat Lan’s support to establish and run VICs in their communities too. As the main purpose of the established VICs is to enhance access to market information but also information related to Tat Lan program, the outcome monitoring survey assessed to what extent the VICs are still visited by the target population for those purposes. Overall, 30% of the survey population claimed to visit the VIC at least quarterly for those above purposes as well as for sending feedback letters to Tat Lan program through a suggestion box where the feedback boxes have been set up at VICs. Compared to 2015 survey the interest in or access to VICs has reduced by 7% (p<0.001), acknowledging that in the village list sampled for the 2016 survey were also included villages with no VICs. Further analysis suggests that the program model of delivering food and livelihood support through various activities is not determining whether VICs are visited or not. More simply, it means with 70% certainty we can say that if none of the survey respondents would ever had participated in any of Tat Lan activities still 30% of the respondents would visit VIC at least quarterly for those reasons given above. However, considering the total survey population regardless how frequently they visit the VICs, 40% visit the VIC to check project updates, followed closely by 38% who just have the VIC on the way to their houses. VICs are still relatively popular places for meetings and trainings (not necessarily Tat Lan related meetings or trainings), whereby 17% of the respondents have in the last year used the VIC for it. Interestingly when it comes to visiting the VIC for project or market information then significantly more women visit the VIC purposefully compared to men. Assumedly this might be due men being more involved with the farms or other livelihood activities while women go to the markets and spend more time in the village. Participation in Decision Making As VDCs and its sub-committees are the main entry point for Tat Lan for bottom-up community development, then within 2016 a lot of effort has went to reforming VDCs to enhance their effectiveness, whereby 173 VDCs were reformed and only 10 new VDCs were established. Also 29 technical sub-committees were reformed and six new established. Nevertheless, the qualitative data collected on VDCs doesn’t show any improvement compared to 2015. Majority of VDCs are still struggling and have not reached their full potential in mobilizing communities for community development, particularly for matters that go beyond Tat Lan program scope. Beneficiaries believe that the potential effectiveness of the VDC is mainly hampered by the lack of monetary and/or non-
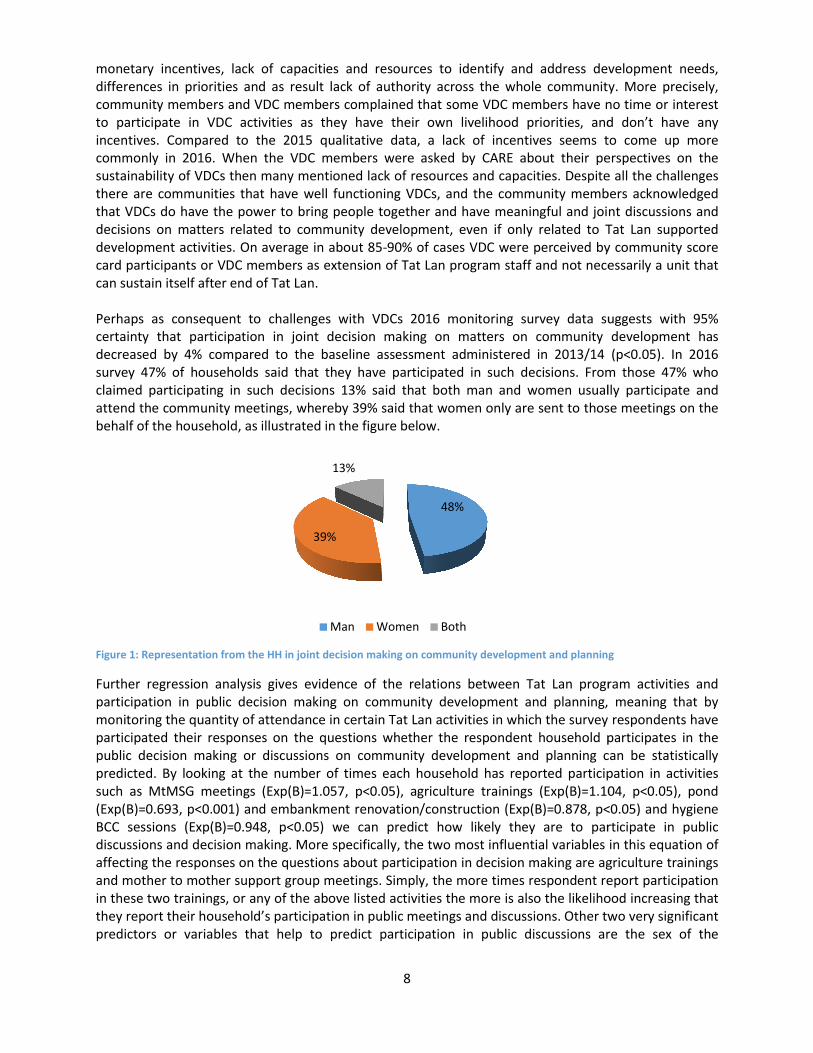
monetary incentives, lack of capacities and differences in priorities and as result lack of authority across the whole community. community members and VDC members complainto participate in VDC activities as they have their own livelihood priorities, and don’t have any incentives. Compared to the 2015 qualitative datacommonly in 2016. When the VDC members were asked by CARE about their persustainability of VDCs then many mentioned lack of resources and capacities. Despite all the challenges there are communities that have well functioning VDCs, and the community members acknowledgethat VDCs do have the power to bring peopdecisions on matters related to community development, even if only related to Tat Lan supported development activities. On average in about 85card participants or VDC members as extension of Tat Lan program staff and not necessarily a unit that can sustain itself after end of Tat Lan. Perhaps as consequent to challenges with VDCs certainty that participation in joidecreased by 4% compared to the baseline assessment administered in 2013/14 (survey 47% of households said that they have participated in such decisions. From those 47% who claimed participating in such decisions 13% said that both man and women usually participate and attend the community meetings, whereby 39% said that women only are sent to those meetingbehalf of the household, as illustrated in the figure below.
Figure 1: Representation from the HH in joint decision making on community development and planning
Further regression analysis gives evidence of the relations between Tat Lan program activities and participation in public decision making on community development and planning, meaning that by monitoring the quantity of attendance in certain Tat Lan activparticipated their responses on the questions whether the respondent household participates in the public decision making or discussions on community development and planning can be statistically predicted. By looking at the number of times each household has reported participation in activities such as MtMSG meetings (Exp(B)=1.057, (Exp(B)=0.693, p<0.001) and embankment renovation/construction (Exp(B)=0.8BCC sessions (Exp(B)=0.948, p<0.05)discussions and decision making. More specifically, the two most influential variables in this equation of affecting the responses on the questions about participation in decision making are agriculture trainings and mother to mother support group meetings. Simply, the more times respondent report participation in these two trainings, or any of the above listed activities the more is also they report their household’s participation in public meetings and discussions. Other two very significant predictors or variables that help to predict participation in public discussions are the sex of the
8
monetary incentives, lack of capacities and resources to identify and address development needsand as result lack of authority across the whole community.
community members and VDC members complained that some VDC members have no time or interest ipate in VDC activities as they have their own livelihood priorities, and don’t have any
2015 qualitative data, a lack of incentives seems to come up more commonly in 2016. When the VDC members were asked by CARE about their persustainability of VDCs then many mentioned lack of resources and capacities. Despite all the challenges there are communities that have well functioning VDCs, and the community members acknowledgethat VDCs do have the power to bring people together and have meaningful and joint discussions and decisions on matters related to community development, even if only related to Tat Lan supported
On average in about 85-90% of cases VDC were perceived by community score d participants or VDC members as extension of Tat Lan program staff and not necessarily a unit that
can sustain itself after end of Tat Lan.
Perhaps as consequent to challenges with VDCs 2016 monitoring survey data suggests with 95% certainty that participation in joint decision making on matters on community development has decreased by 4% compared to the baseline assessment administered in 2013/14 (
aid that they have participated in such decisions. From those 47% who claimed participating in such decisions 13% said that both man and women usually participate and attend the community meetings, whereby 39% said that women only are sent to those meetingbehalf of the household, as illustrated in the figure below.
: Representation from the HH in joint decision making on community development and planning
Further regression analysis gives evidence of the relations between Tat Lan program activities and participation in public decision making on community development and planning, meaning that by monitoring the quantity of attendance in certain Tat Lan activities in which the survey respondents have participated their responses on the questions whether the respondent household participates in the public decision making or discussions on community development and planning can be statistically
king at the number of times each household has reported participation in activities such as MtMSG meetings (Exp(B)=1.057, p<0.05), agriculture trainings (Exp(B)=1.104,
and embankment renovation/construction (Exp(B)=0.878, p<0.05)p<0.05) we can predict how likely they are to participate in public
discussions and decision making. More specifically, the two most influential variables in this equation of e questions about participation in decision making are agriculture trainings
and mother to mother support group meetings. Simply, the more times respondent report participation in these two trainings, or any of the above listed activities the more is also the likelihood increasing that they report their household’s participation in public meetings and discussions. Other two very significant predictors or variables that help to predict participation in public discussions are the sex of the
48%
39%
13%
Man Women Both
development needs, and as result lack of authority across the whole community. More precisely,
that some VDC members have no time or interest ipate in VDC activities as they have their own livelihood priorities, and don’t have any
lack of incentives seems to come up more commonly in 2016. When the VDC members were asked by CARE about their perspectives on the sustainability of VDCs then many mentioned lack of resources and capacities. Despite all the challenges there are communities that have well functioning VDCs, and the community members acknowledged
le together and have meaningful and joint discussions and decisions on matters related to community development, even if only related to Tat Lan supported
90% of cases VDC were perceived by community score d participants or VDC members as extension of Tat Lan program staff and not necessarily a unit that
monitoring survey data suggests with 95% community development has
decreased by 4% compared to the baseline assessment administered in 2013/14 (p<0.05). In 2016 aid that they have participated in such decisions. From those 47% who
claimed participating in such decisions 13% said that both man and women usually participate and attend the community meetings, whereby 39% said that women only are sent to those meetings on the
: Representation from the HH in joint decision making on community development and planning
Further regression analysis gives evidence of the relations between Tat Lan program activities and participation in public decision making on community development and planning, meaning that by
ities in which the survey respondents have participated their responses on the questions whether the respondent household participates in the public decision making or discussions on community development and planning can be statistically
king at the number of times each household has reported participation in activities , agriculture trainings (Exp(B)=1.104, p<0.05), pond
p<0.05) and hygiene we can predict how likely they are to participate in public
discussions and decision making. More specifically, the two most influential variables in this equation of e questions about participation in decision making are agriculture trainings
and mother to mother support group meetings. Simply, the more times respondent report participation the likelihood increasing that
they report their household’s participation in public meetings and discussions. Other two very significant predictors or variables that help to predict participation in public discussions are the sex of the

9
respondent as well as the township. More specifically women are more likely to respond positively to the question whether they or someone from their household participated in public decision making on community development and planning compared to men (Exp(B)=1.103, p<0.05). In terms of townships then if there were no other factors affecting participation then Pauktaw seems to be more active where people are more likely to participate in public decisions versus not participating, and in all other three townships people would not participate rather than to participate (Exp(B)=1.886, p<0.001). In addition to these mostly project related predictors to positively influence participation in communal decision making, there was also moderate correlation found between the mean average monthly income and the participation in public decision making. More specifically, as the figure below illustrates, households with a reported mean monthly income in between 25,001-150,000MMK are less likely to participate in public decision making, but once the income categories increase, the participation in public decision making also becomes more likely, until to income categories starting from 300,001MMK and above (p<0.05, rs = 0.165) when people get busy again and are more likely not to participate.
Figure 2: Correlation between % of HH reporting mean monthly incomes and participation in public decision making on community development and planning
Also moderate correlation suggests that households with main source of income from sale of something (mainly rice, other agriculture products, livestock or livestock products, etc.) are more likely to participate in public decision making compared to different groups of casual labourers (p<0.001, rs = 0.156). One way to interpret that finding is that these are the households need to be or are already well connected in the villages due the nature of their work and hence feel more empowered/confident to show up and participate in decision making. The main reason why households lack some participation in joint community level decision making mentioned by 69% of the respondents is mainly the perception that their views and contributions are already represented by other close friends, neighbours or relatives who do participate in community meetings and decision making. While another 15% said that their village doesn’t have such joint decision making practice, there were 8% (n=101) of households who said that their views vary from the others and hence their opinions are not considered anyways, and another 5% (n=58) of households who said that as members of a minority group they just don’t get included in such meetings and decision making.
0%
10%
20%
30%
40%
50%
60%
70%
Participate Do not participate
10
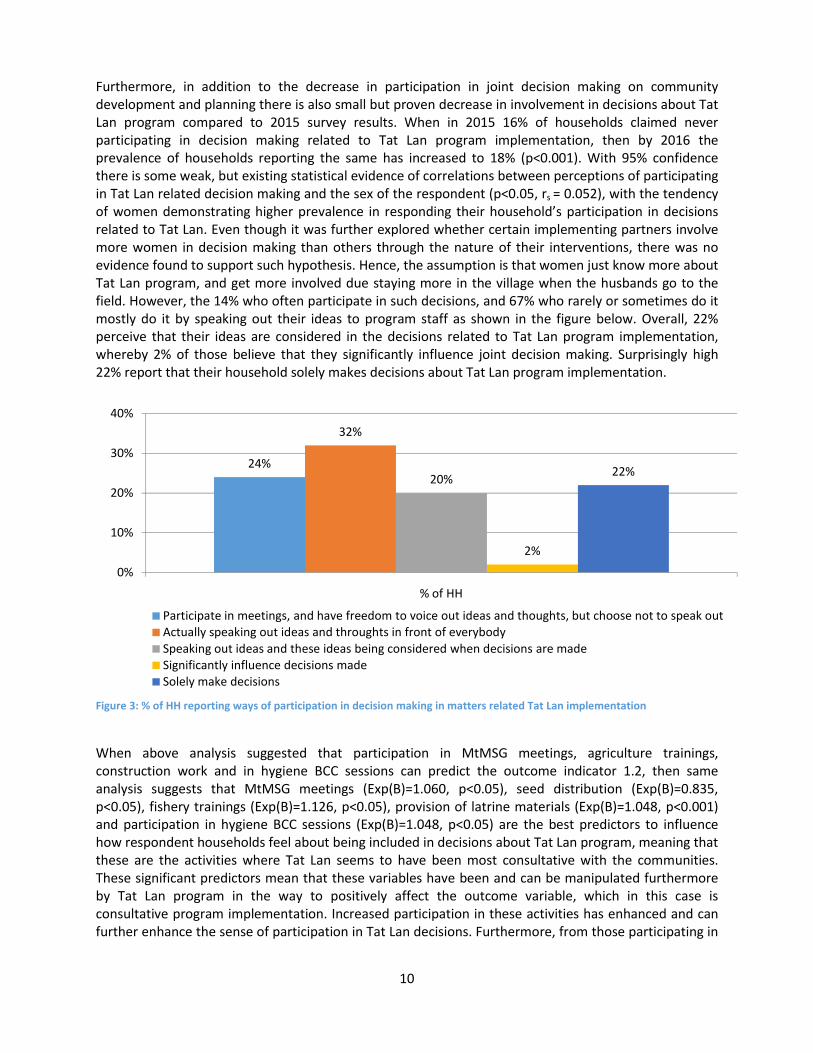
Furthermore, in addition to the decrease in participation in joint decision making on community development and planning there is also small but proven decrease in involvement in decisions about Tat Lan program compared to 2015 survey results. When in 2015 16% of households claimed never participating in decision making related to Tat Lan program implementation, then by 2016 the prevalence of households reporting the same has increased to 18% (p<0.001). With 95% confidence there is some weak, but existing statistical evidence of correlations between perceptions of participating in Tat Lan related decision making and the sex of the respondent (p<0.05, rs = 0.052), with the tendency of women demonstrating higher prevalence in responding their household’s participation in decisions related to Tat Lan. Even though it was further explored whether certain implementing partners involve more women in decision making than others through the nature of their interventions, there was no evidence found to support such hypothesis. Hence, the assumption is that women just know more about Tat Lan program, and get more involved due staying more in the village when the husbands go to the field. However, the 14% who often participate in such decisions, and 67% who rarely or sometimes do it mostly do it by speaking out their ideas to program staff as shown in the figure below. Overall, 22% perceive that their ideas are considered in the decisions related to Tat Lan program implementation, whereby 2% of those believe that they significantly influence joint decision making. Surprisingly high 22% report that their household solely makes decisions about Tat Lan program implementation.
Figure 3: % of HH reporting ways of participation in decision making in matters related Tat Lan implementation
When above analysis suggested that participation in MtMSG meetings, agriculture trainings, construction work and in hygiene BCC sessions can predict the outcome indicator 1.2, then same analysis suggests that MtMSG meetings (Exp(B)=1.060, p<0.05), seed distribution (Exp(B)=0.835, p<0.05), fishery trainings (Exp(B)=1.126, p<0.05), provision of latrine materials (Exp(B)=1.048, p<0.001) and participation in hygiene BCC sessions (Exp(B)=1.048, p<0.05) are the best predictors to influence how respondent households feel about being included in decisions about Tat Lan program, meaning that these are the activities where Tat Lan seems to have been most consultative with the communities. These significant predictors mean that these variables have been and can be manipulated furthermore by Tat Lan program in the way to positively affect the outcome variable, which in this case is consultative program implementation. Increased participation in these activities has enhanced and can further enhance the sense of participation in Tat Lan decisions. Furthermore, from those participating in
24%
32%
20%
2%
22%
0%
10%
20%
30%
40%
% of HH
Participate in meetings, and have freedom to voice out ideas and thoughts, but choose not to speak outActually speaking out ideas and throughts in front of everybody
Speaking out ideas and these ideas being considered when decisions are madeSignificantly influence decisions madeSolely make decisions
11
Tat Lan related decisions 20% perceived that their voices have fully been considered by Tat Lan staff, which is significant 9% increase compared to 2015 (p<0.001). However, the prevalence of households believing that their voices have not been heard and considered at all has also increased by 1% only from 11% in 2015 to 12% in 2016. As a positive note on gender sensitive programming it should be noted that analysis shows no evidence of gender discrimination when it comes to the perceptions of own participation in Tat Lan related decisions (p>0.05). In terms of perceptions on Tat Lan’s contribution on overall community development, survey
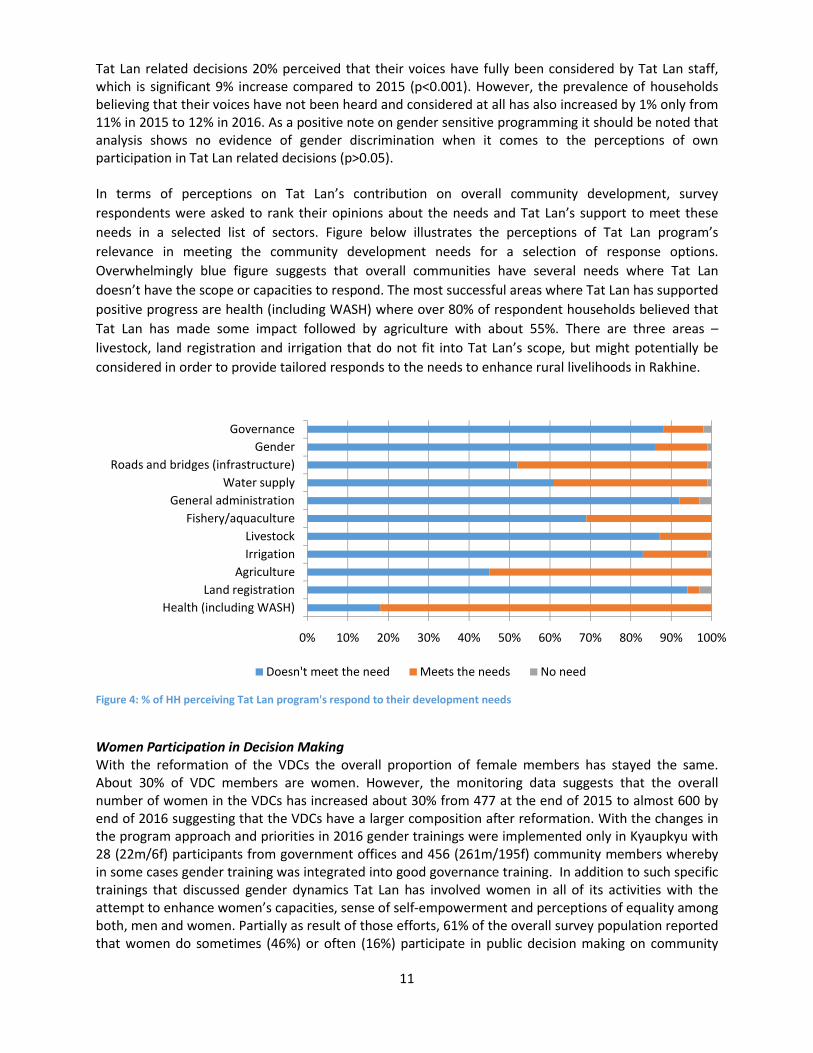
respondents were asked to rank their opinions about the needs and Tat Lan’s support to meet these
needs in a selected list of sectors. Figure below illustrates the perceptions of Tat Lan program’s
relevance in meeting the community development needs for a selection of response options.
Overwhelmingly blue figure suggests that overall communities have several needs where Tat Lan
doesn’t have the scope or capacities to respond. The most successful areas where Tat Lan has supported
positive progress are health (including WASH) where over 80% of respondent households believed that
Tat Lan has made some impact followed by agriculture with about 55%. There are three areas –
livestock, land registration and irrigation that do not fit into Tat Lan’s scope, but might potentially be
considered in order to provide tailored responds to the needs to enhance rural livelihoods in Rakhine.
Figure 4: % of HH perceiving Tat Lan program's respond to their development needs
Women Participation in Decision Making With the reformation of the VDCs the overall proportion of female members has stayed the same. About 30% of VDC members are women. However, the monitoring data suggests that the overall number of women in the VDCs has increased about 30% from 477 at the end of 2015 to almost 600 by end of 2016 suggesting that the VDCs have a larger composition after reformation. With the changes in the program approach and priorities in 2016 gender trainings were implemented only in Kyaupkyu with 28 (22m/6f) participants from government offices and 456 (261m/195f) community members whereby in some cases gender training was integrated into good governance training. In addition to such specific trainings that discussed gender dynamics Tat Lan has involved women in all of its activities with the attempt to enhance women’s capacities, sense of self-empowerment and perceptions of equality among both, men and women. Partially as result of those efforts, 61% of the overall survey population reported that women do sometimes (46%) or often (16%) participate in public decision making on community
0% 10% 20% 30% 40% 50% 60% 70% 80% 90% 100%
Health (including WASH)
Land registration
Agriculture
Irrigation
Livestock
Fishery/aquaculture
General administration
Water supply
Roads and bridges (infrastructure)
Gender
Governance
Doesn't meet the need Meets the needs No need
12
development and planning. More interesting it appears that from all the men who participated in the survey 69% believed in women’s participation, compared to 71% of all the women who responded the same, which to some extent validates the perceptions of men about women participation. This overall 61% achievement is a significant 20% increase from baseline (p<0.001), even if after an expansion to new villages it is a drop from 65% measured in 2015 (p<0.001). Thereby, the main Tat Lan activities that have contributed, and can further contribute in the future to positively influence the perceptions and actual practices of how women participate in public decision making are agriculture sub-committees (Exp(B)=0.925, p<0.05) and trainings (Exp(B)=1.170, p<0.001), VSLAs (Exp(B)=0.970, p<0.001), bond (Exp(B)=0.792, p<0.001) and embankment renovations (Exp(B)=0.761, p<0.001), gender training ((Exp(B)=0.801, p<0.05), provision of latrine materials (Exp(B)=0.812, p<0.05) and provision of water purifiers (Exp(B)=0.903, p<0.05). Thereby VSLAs where over 80% of members are women and agriculture trainings with about 31% of female participation rate have been the most significant contributors to this outcome. There is proof that the more times one participates in above listed activities, but especially in VSLAs and agriculture trainings, the more likely it is to respond positively to the question whether women participate in public decision making on community development and planning. While the above analysis reflects on the perceptions of the total survey population, then it would be meaningful to look at the perceptions and experience of those 48% only who had previously reported that they or their household actually participate in public discussions and decisions made on community development and planning. From those 48% respondents who said that they participate in public decision making 87% believed that women also participate in decision making on matters related to community development and planning4. This is significant 17% higher value compared to the above 70% suggesting that logframe value of 70% reported above might be underreported. Interestingly strong correlation was found between the perception of women participation and those households who reported that their own household participates in public decision making (p<0.001, rs = 0.408). In other words, those who report not participating in public decision making were more likely to underestimate women’s participation too, and those who report their household’s participation in public discussions and decision making are more likely to give a positive response about women’s participation in public discussions and decisions. When looking at the quality of participation then 43% believe that women in the public meetings do speak out their ideas and thoughts, but this does not necessarily mean these are seriously considered in decision making. Only 27% said that their ideas and thoughts are considered in decision making (24%) or that women have even significant influence over the decisions made (3%).
4 Considering that the overall topic of women’s empowerment might be considered by communities socially
undesirable due long lasting traditional gender roles, there is high risk that survey participants were trying to please the surveyors, even if unintentionally, giving answers they think the surveyor expects leading to over-reporting

13
Figure 5: Perceptions of women's participation in public decision making on matters related to community development and planning (% of HH)
Since a correlation analysis suggested evidence of correlations to such perceptions with the sex of respondents (p<0.001, rs = 0.109), it was further explored how the responses between different sex groups differentiate. While overall the trends in how women’s participation in decision making is perceived are similar across the stratification groups, it is interesting to note that more men seem to think that women choose not to speak out their ideas in public meetings, even if they are given the chance. At the same time, more women seem to think that they solely make decision related to community development and planning. In summary, women seem to perceive their own participation in public decision making to be more meaningful than men.
Discussion and recommendations To promote active participation in informed decision making in the target communities it can be
estimated that by end 2016 Tat Lan has achieved on average 62% of its objective. Thereby, lack of access
to information through the purposeful use of VICs, and to some extent also lack of participation in
decisions related to community development and planning drag down the overall average achievement
for this outcome. While participation of people in community development and planning is a human
asset, which is the fundamental axis of change, Tat Lan has managed to contribute to the increase, even
if still significantly below the target, mainly through joint construction of latrines, bringing women
together into mother to mother support groups, and most importantly through agriculture trainings.
Bringing people together through agriculture, through the matters that they relate to the most, has
helped Tat Lan program to find its position among the target communities, and has provided a common
platform for discussions on development. However, the program was designed to rely on VDCs and its
technical sub-committees in order to enhance joint decision making, which up to now has not proven to
be a very effective approach when most of the VDCs prove to be inactive due the lack of interest and
incentives of the VDC members to donate their time. While currently VDCs are mainly perceived only as
extension of Tat Lan program staff, it jeopardizes the potential linkages that Tat Lan attempts to build
17%
22%
15%
43%
38%
44%
24% 24% 24%
3%5%
3%
13%11%
14%
0%
10%
20%
30%
40%
50%
Overall Male respondents Female Respondents
Women participate in meetings, and have freedom to voice out their ideas, but they choose not to
Women speak out their ideas
Women speak out their ideas and these ideas are considered when decisions are made
Women significantly influence the decisions made
Women solely make decisions
14
between communities and the government for sustainable community envelopment. While VICs do not
have any statistically proven influence over the outcome variables, qualitative data above hinted that
VICs are used as libraries and have the potential to bring people together for meetings and trainings.
Hence, to strengthen Tat Lan’s contribution to achieving the targets set for this outcome, the program
could consider some of the following suggestions:
1) Facilitate a clear handover process of VICs to the communities and support communities to
come up with a community driven plan on how best to utilize the existing VIC within their
communities.
2) To void instances where VDCs are not perceived to have any authority or value in the villages
outside Tat Lan program VDCs could be restructures depending on the scope of changes that the
program can afford carrying in to its approaches:
If the program generates any revolving funds where the beneficiaries are expected to
have monetary contribution to the inputs they receive from Tat Lan, build capacities of
VDCs (or other relevant sub-committees) to independently manage those funds on
behalf of the community. This reinforces the community members to be more selective
when choosing VDCs members so that members done become inactive due lack of
incentives or lack of interest, increases the level of authority of the VDC among non-VDC
members, and provides the VDCs the opportunity to gain practical firsthand experience
of planning, implementing and monitoring community development.
Restructure the leadership in the communities around the livelihood priorities of the
villages. For instance, villages where agriculture is predominant livelihoods for most
households dissolve the overarching VDC group and assign agriculture committee to
have the main leadership role in the community, with some added responsibilities to
support other livelihood sectors or other sub-committees. This will help the group to
increase authority and respect within the village and has a more practical outlet
compared to the overarching VDC groups.
3) After reformation of VDCs (regardless whether above suggestions are implemented or not)
conduct a basic organizational capacity assessment as baseline to understand the strengths and
the weaknesses of the new dynamics of the VDC, and develop a capacity building plan according
to the findings.
4) Since building capacities is a gradual process, Tat Lan could allocate resources to ensure that
there is staff available to keep continually (monthly or bi-monthly) working on the VDC
capacities, rather than providing infrequent long information-rich trainings that can easily to be
forgotten. This enables a gradual organizational growth where VDCs have the opportunity to
more frequently reflect back on previous learning and ask follow-up questions that have risen
over time.
5) Develop activities where VDC or sub-committee members and government officials have a joint
role in planning and/or participating in to build stronger and sustainable linkages between the
community leadership and local government departments/offices. Activities could best be
developed around the areas that communities have listed as Tat Lan program not being able to
meet the needs of the communities due its limitations in scope (e.g. land registration, irrigation
and livestock). The activities could be joint meetings/trainings/discussions on how communities
could priority their needs and government to assist the communities to meet their needs (e.g.
enhance access to livestock, build capacities on building irrigation systems, challenges and
processes of land registration).
15
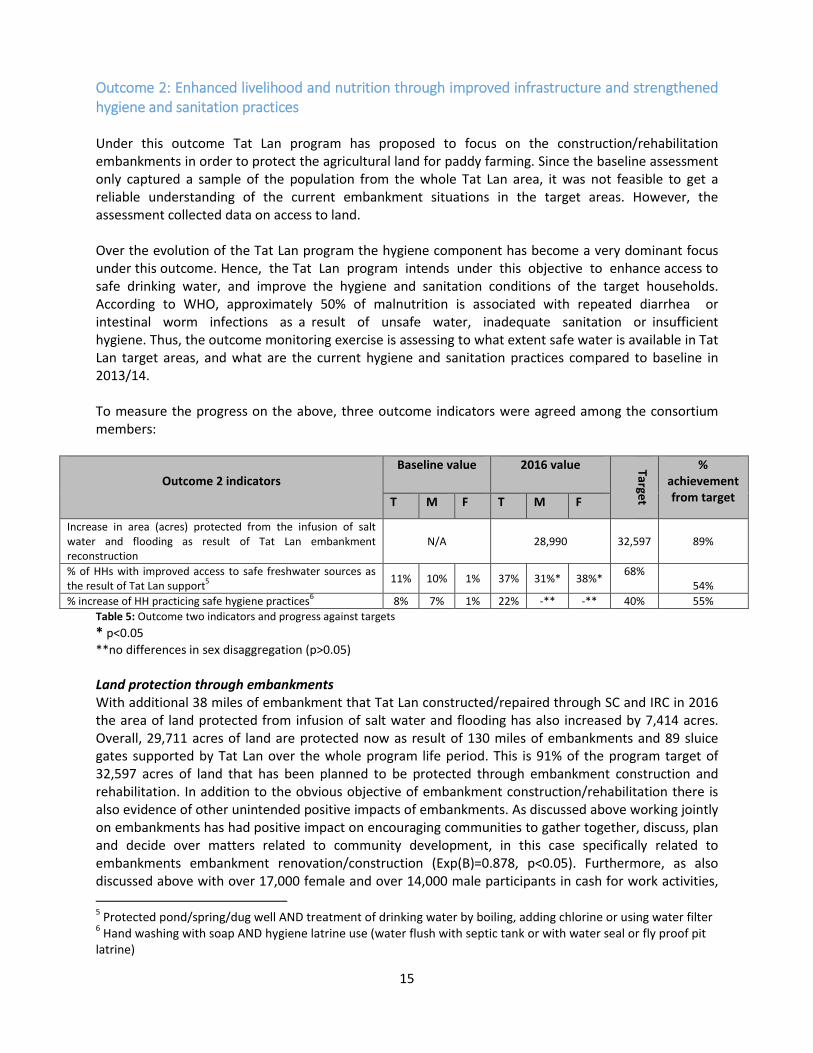
Outcome 2: Enhanced livelihood and nutrition through improved infrastructure and strengthened hygiene and sanitation practices Under this outcome Tat Lan program has proposed to focus on the construction/rehabilitation embankments in order to protect the agricultural land for paddy farming. Since the baseline assessment only captured a sample of the population from the whole Tat Lan area, it was not feasible to get a reliable understanding of the current embankment situations in the target areas. However, the assessment collected data on access to land. Over the evolution of the Tat Lan program the hygiene component has become a very dominant focus under this outcome. Hence, the Tat Lan program intends under this objective to enhance access to safe drinking water, and improve the hygiene and sanitation conditions of the target households. According to WHO, approximately 50% of malnutrition is associated with repeated diarrhea or intestinal worm infections as a result of unsafe water, inadequate sanitation or insufficient hygiene. Thus, the outcome monitoring exercise is assessing to what extent safe water is available in Tat Lan target areas, and what are the current hygiene and sanitation practices compared to baseline in 2013/14. To measure the progress on the above, three outcome indicators were agreed among the consortium members:
Outcome 2 indicators
Baseline value 2016 value Target
% achievement from target T M F T M F
Increase in area (acres) protected from the infusion of salt water and flooding as result of Tat Lan embankment reconstruction
N/A
28,990
32,597
89%
% of HHs with improved access to safe freshwater sources as the result of Tat Lan support
5
11% 10% 1% 37% 31%* 38%* 68%
54%
% increase of HH practicing safe hygiene practices6 8% 7% 1% 22% -** -** 40% 55%
Table 5: Outcome two indicators and progress against targets
* p<0.05
**no differences in sex disaggregation (p>0.05) Land protection through embankments With additional 38 miles of embankment that Tat Lan constructed/repaired through SC and IRC in 2016 the area of land protected from infusion of salt water and flooding has also increased by 7,414 acres. Overall, 29,711 acres of land are protected now as result of 130 miles of embankments and 89 sluice gates supported by Tat Lan over the whole program life period. This is 91% of the program target of 32,597 acres of land that has been planned to be protected through embankment construction and rehabilitation. In addition to the obvious objective of embankment construction/rehabilitation there is also evidence of other unintended positive impacts of embankments. As discussed above working jointly on embankments has had positive impact on encouraging communities to gather together, discuss, plan and decide over matters related to community development, in this case specifically related to embankments embankment renovation/construction (Exp(B)=0.878, p<0.05). Furthermore, as also discussed above with over 17,000 female and over 14,000 male participants in cash for work activities,
5 Protected pond/spring/dug well AND treatment of drinking water by boiling, adding chlorine or using water filter
6 Hand washing with soap AND hygiene latrine use (water flush with septic tank or with water seal or fly proof pit
latrine)
16
including embankment construction, it has encouraged women, and perhaps changed perceptions of men on women’s participation in public discussions and decision making too (Exp(B)=0.761, p<0.001) because as articulated under outcome 1 matters that are highly relevant to most households in the communities will have higher likelihood to promote joint planning and decision making. Jumping few chapters ahead it is also important to note cash for work activities specifically on embankment construction have provided to the most vulnerable casual labour households to earn income, and that planning for embankment construction and mobilizing resources seems to have correlations with financial management enhancing investment into livelihoods. However, as every coin has two sides so do Tat Lan supported embankments. Community score card participants and data from the feedback mechanism suggest that the quality of embankments is still not satisfactory. In two incidents the data from feedback mechanism shows that the freshly constructed embankment started falling apart in the same year already, mainly due delays in the embankment construction so that the timeframe overlapped with rainy season when the soil was not solid anymore. In addition to these two incidents there were reports of previously constructed embankments that by now have started cracking as well, and need maintenance, but communities don’t have the resources. Even though there is only one isolated example in 2016 (but other examples from previous years), it is important that before embankment construction all stakeholder groups are in an agreement and in clear understanding of the working conditions and source of resources. For example, one community reported that farmers, whose paddy fields were used to dig the soil for the embankment, were unhappy and claimed not to have been notified by Tat Lan staff about this. Access to safe water With 99% confidence level (p˂0.001) the percentage of households reporting improved access to safe freshwater sources has also moved closer to the overall target of 68% standing at 37%. To contribute to this within its lifetime Tat Lan has constructed, repaired and/or protected 150 freshwater sources (ponds and wells) and provided water purification inputs to 314 households with some awareness raising on safe water consumption. Like in 2015 the quality of water in Tat Lan supported ponds has reportedly significantly increased. About half of the times when qualitative data was collected on the usefulness of the ponds community members believed that this will enhance access to safe water, meaning that as a result there is more water that will last longer into the dry season, if not even through the whole dry season. However, to support and maintain the safety of the water through pond fencing remains a problem in almost all cases. In some cases communities requested Tat Lan’s support to set up the pond fence to the newly cleaned ponds or there is a misunderstanding about the contribution expected by the communities where there has been an agreement that Tat Lan provides only 50% of the fence and the community has to contribute the rest. In some cases communities were still waiting Tat Lan to complete the pond fence, and in other cases the communities acknowledged the 50% deal, but admitted too late that they do not have resources to complete it. Similarly, Tat Lan’s support to hire casual labor for pond renovation or construction was in all cases reported not sufficient, and in about 80% of the cases the communities demonstrated dissatisfaction with the need to contribute to the cost. Provision of water purification inputs was implemented in very small scale only, and the only feedback received on it was that the quantity of inputs provided was too low and there is little or no chance to generate sustainable impact. Hence there has been found no evidence of correlation between access to safe water and provision of water purification inputs to the communities, but there was some evidence found on weak or moderate correlations with participation in fishery/aquaculture sub-committee meetings (p<0.05, rs = 0.089), pond and embankment renovation/cleaning (p<0.05, rs = 0.091),
17
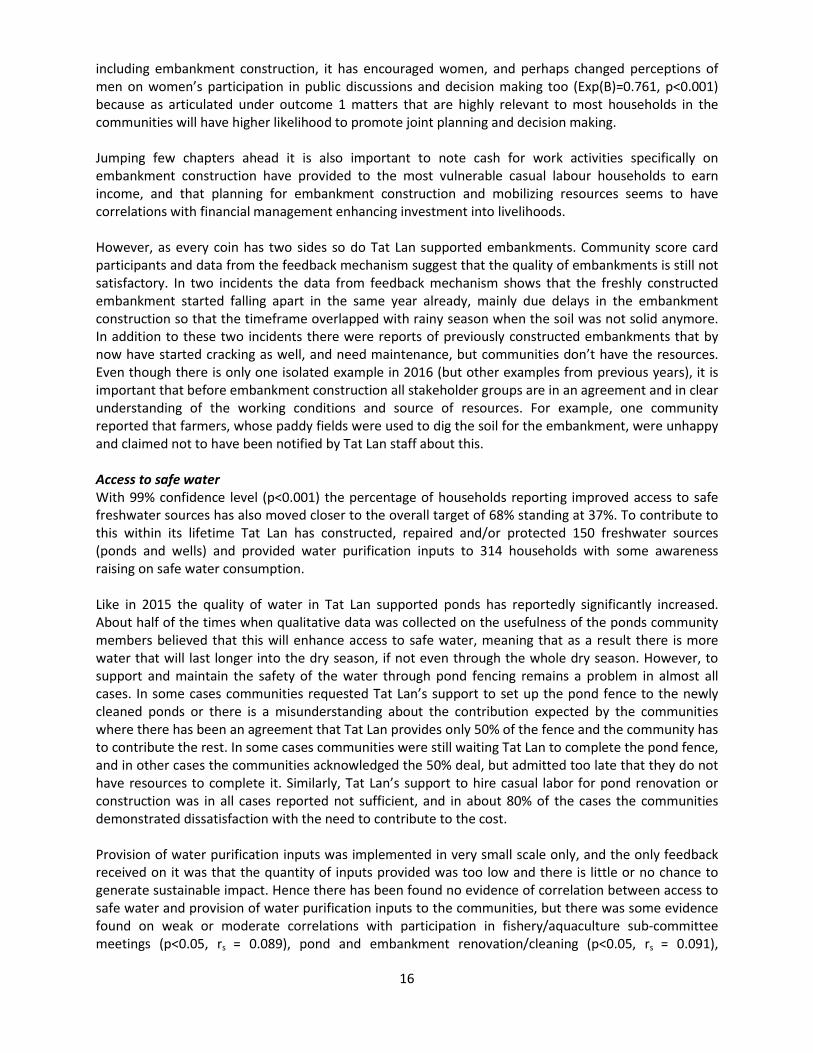
participation in hygiene and sanitation trainings (p<0.001, rs = 0.157), and VDC meetings or trainings (p<0.05, rs = 0.115). Unlike 2015 when embankment and bond construction/rehabilitation had the strongest correlation to the outcome, 2016 survey suggests that hygiene and sanitation training has even stronger correlation to access to safe water. However, interestingly all these variables cannot provide sufficient evidence of regression, meaning that the analysis cannot provide certainty that increased participation in the above activities will necessarily also lead to improved access to safe water and there are other more significant unmeasured variables that have caused improved access to safe water. Table below suggests that there are almost no significant changes in 2016 compared to 2015, except reduction in surface water collection practice and increase in the use of Tat Lan supported ponds. However, unfortunately there are more significant negative trends in 2016 practices compared to 2013/14 baseline. For example, fetching water from protected dug wells has dropped from 25% to 15% and from protected springs from 6% to 2%. Furthermore, use of unprotected dug wells has doubled from baseline value of 6%. A positive trend is that use of surface water collection has become much less popular when now on average only 16% of households reported practicing it compared to 46% during baseline. These 158 freshwater sources that Tat Lan has constructed or repaired are benefiting on average 13% of the target population. More specifically, 8% (n=240) solely depend on Tat Lan supported bonds all year around, meaning that they have no other access to safe water.
2016 OM
Summer
2016 OM
Rainy
2016 OM
Winter
2016 OM
average
2015 OM
average Baseline average
p-value for baseline/
2016
Public tap/pipe 5.7 4.6 4.4 4.9% 3.5% 0.4% p>0.05
tanker/truck 0.5 0 0 0.2% 1.3% 0% p>0.05
tube well/borehole 4 4.1 3.5 3.9% 3.3% 0% p>0.05
protected dug well 18.8 15.1 12.7 15.5% 17.6% 25.1% p<0.001
unprotected dug well 10.7 11.9 10.3 11.0% 9.2% 5.9% p<0.001
protected spring 2.7 1.1 1.3 1.7% 5.6% 6% p<0.001
unprotected spring 8.7 3 2.7 4.8% 7% 6.9% p>0.05
rainwater collection 0.1 8.1 0.5 2.9% 1.3% 0.7% p>0.05
Bottled water 0.1 0 0 0% 0.1% 0% p>0.05
surface water 29.5 10.4 7.9 15.9% 46.5% 54% p<0.05
Tat Lan pond 17.4 11 11.9 13.4% 3.6% N/A p<0.05
Table 6: % of HH reporting accessing drinking water
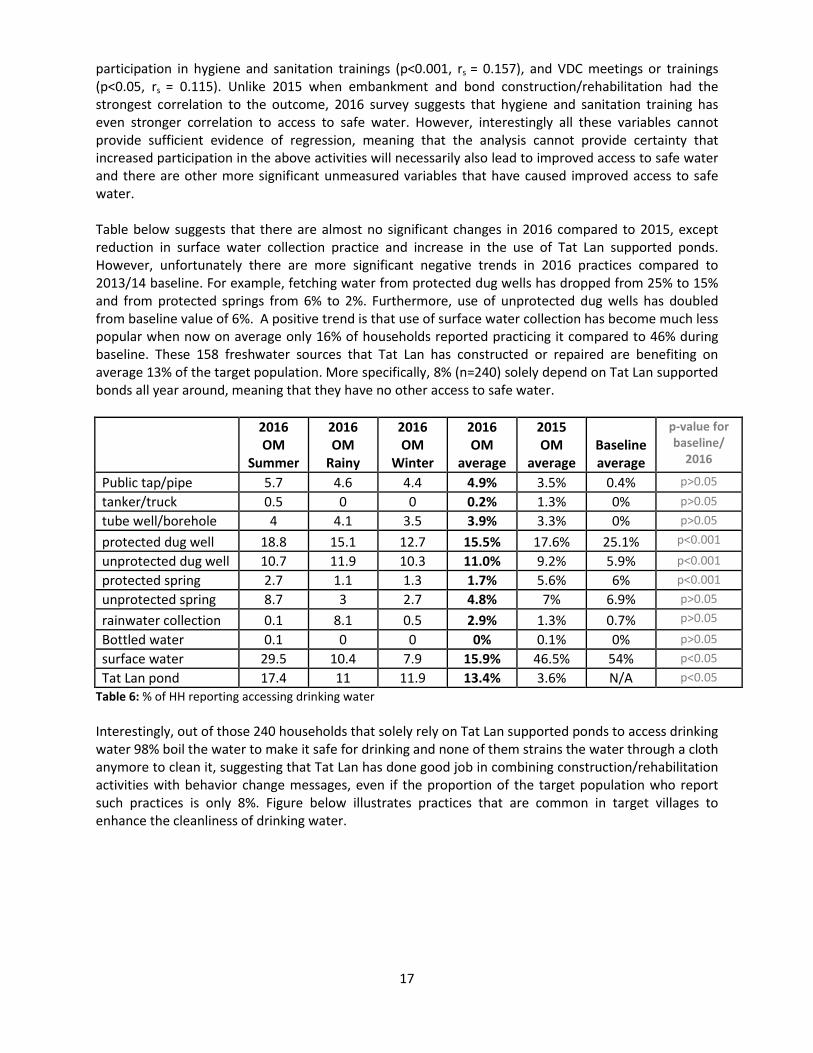
Interestingly, out of those 240 households that solely rely on Tat Lan supported ponds to access drinking water 98% boil the water to make it safe for drinking and none of them strains the water through a cloth anymore to clean it, suggesting that Tat Lan has done good job in combining construction/rehabilitation activities with behavior change messages, even if the proportion of the target population who report such practices is only 8%. Figure below illustrates practices that are common in target villages to enhance the cleanliness of drinking water.
18
Figure 6: % of HH reporting their water treatment practices
In the first glance it is clear that straining water through a cloth to filter out obvious dirt is one of the most popular practices, which during the baseline was practiced among 78% of households, but has now reduced by end of 2016 to 54% only (p<0.001). Secondly, boiling water as a positive practice has increased from 36% in the baseline to 49% in 2016 (p<0.001). Thereby very significant factors that have influenced the practices of boiling water or safety are interestingly VSLA groups (Exp(B)=1.020, p<0.05), that most likely have given the women a platform to share their knowledge and practices, nutrition BCCs (Exp(B)=0.753, p<0.001), nutrition trainings (Exp(B)=1.124, p<0.001) and hygiene BCCs (Exp(B)=1.170, p<0.001) and most importantly and surprisingly provision of water filters (Exp(B)=1.414, p<0.001). Use of water filters (ceramic, sand, etc.) has also been picked up by target population most likely due support from Tat Lan, even though no evidence statistical on it was found. When in 2013 15% of households used water filters, then by end of 2016 its 44% households. Hygiene practices More than 50% of all the 1,951 latrines that have been supported by Tat Lan were constructed in 2016 as well. The qualitative data collected for on Tat Lan supported latrines is very mixed. Those households who have received latrines are very appreciative and see the value of having a safe and nearby place to use. However, the very same beneficiaries reported that many households rejected Tat Lan’s support since they didn’t see the value of it, suggesting that Tat Lan does not always combine hygiene awareness sessions with support to latrine construction. Secondly, in few cases particularly female headed households reported that they received latrine materials and they are storing them until they have the funds to hire a carpenter to set the latrine up, which suggests that there is the problem with self-contribution again and that Tat Lan does not oversee the quality of the actual construction work, and might thereby put the sustainability of the latrines into jeopardy. Also feedback from the communities showed concerns over the sustainability of the latrines due the use of bamboo and wood, and not concrete and iron sheet as suggested by the communities. Except that, all beneficiaries interviewed
36%
0%
0%
78%
15%
1%
0%
0%
55%
1%
1%
62%
26%
2%
1%
14%
49%
0%
0%
54%
44%
1%
1%
14%
0% 10% 20% 30% 40% 50% 60% 70% 80% 90%
Boil
Add bleach/chlorine
Add iodine
Strain through a cloth
Water filter
Composite filter
Solar disinfection
Stand and settle
2016 OM 2015 OM Baseline
19
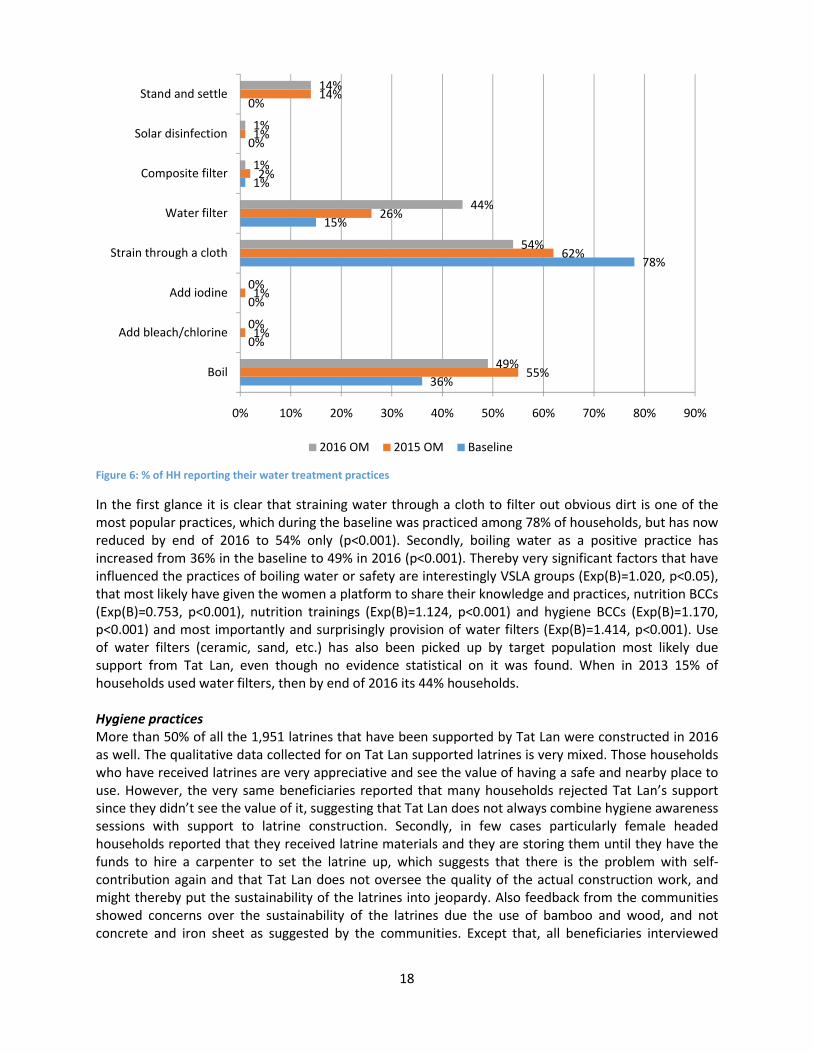
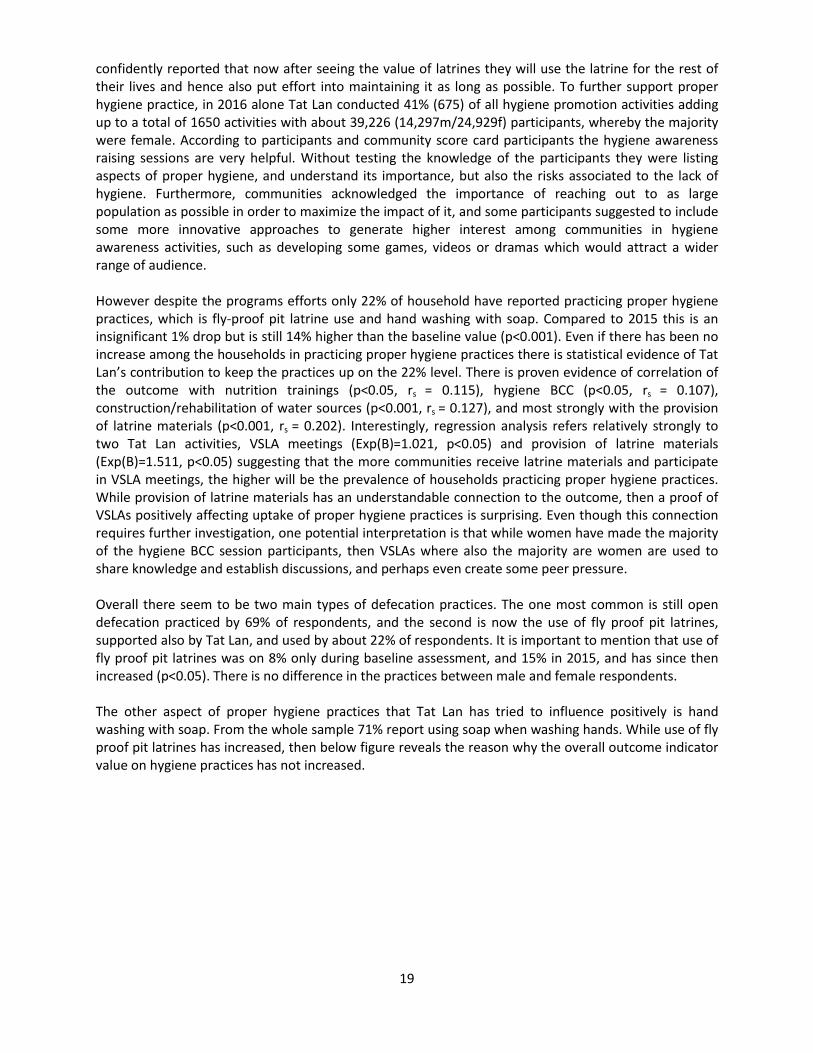
confidently reported that now after seeing the value of latrines they will use the latrine for the rest of their lives and hence also put effort into maintaining it as long as possible. To further support proper hygiene practice, in 2016 alone Tat Lan conducted 41% (675) of all hygiene promotion activities adding up to a total of 1650 activities with about 39,226 (14,297m/24,929f) participants, whereby the majority were female. According to participants and community score card participants the hygiene awareness raising sessions are very helpful. Without testing the knowledge of the participants they were listing aspects of proper hygiene, and understand its importance, but also the risks associated to the lack of hygiene. Furthermore, communities acknowledged the importance of reaching out to as large population as possible in order to maximize the impact of it, and some participants suggested to include some more innovative approaches to generate higher interest among communities in hygiene awareness activities, such as developing some games, videos or dramas which would attract a wider range of audience. However despite the programs efforts only 22% of household have reported practicing proper hygiene practices, which is fly-proof pit latrine use and hand washing with soap. Compared to 2015 this is an insignificant 1% drop but is still 14% higher than the baseline value (p<0.001). Even if there has been no increase among the households in practicing proper hygiene practices there is statistical evidence of Tat Lan’s contribution to keep the practices up on the 22% level. There is proven evidence of correlation of the outcome with nutrition trainings (p<0.05, rs = 0.115), hygiene BCC (p<0.05, rs = 0.107), construction/rehabilitation of water sources (p<0.001, rs = 0.127), and most strongly with the provision of latrine materials (p<0.001, rs = 0.202). Interestingly, regression analysis refers relatively strongly to two Tat Lan activities, VSLA meetings (Exp(B)=1.021, p<0.05) and provision of latrine materials (Exp(B)=1.511, p<0.05) suggesting that the more communities receive latrine materials and participate in VSLA meetings, the higher will be the prevalence of households practicing proper hygiene practices. While provision of latrine materials has an understandable connection to the outcome, then a proof of VSLAs positively affecting uptake of proper hygiene practices is surprising. Even though this connection requires further investigation, one potential interpretation is that while women have made the majority of the hygiene BCC session participants, then VSLAs where also the majority are women are used to share knowledge and establish discussions, and perhaps even create some peer pressure. Overall there seem to be two main types of defecation practices. The one most common is still open defecation practiced by 69% of respondents, and the second is now the use of fly proof pit latrines, supported also by Tat Lan, and used by about 22% of respondents. It is important to mention that use of fly proof pit latrines was on 8% only during baseline assessment, and 15% in 2015, and has since then increased (p<0.05). There is no difference in the practices between male and female respondents. The other aspect of proper hygiene practices that Tat Lan has tried to influence positively is hand washing with soap. From the whole sample 71% report using soap when washing hands. While use of fly proof pit latrines has increased, then below figure reveals the reason why the overall outcome indicator value on hygiene practices has not increased.

20
Figure 7: Hand washing with soap (in %)
In most incidents the above figure indicates decrease in hand washing with soap compared to 2015 outcome monitoring survey findings, but in many cases also compared to baseline assessment. Hand washing with soap after eating has significantly dropped compared to both, baseline assessment (p<0.001) and 2015 outcome monitoring (p<0.05), which might not necessarily reflect on poor hygiene practices, but might indicate that more people use table ware (spoons/forks) rather than eating with hands as traditionally common. This might also have impact on hand washing before eating, which is showing negative trends as well. In addition, the figure above suggests that hand washing with soap after/before handling children, before feeding children, and before cooking has decreased compared to 2015, but is still showing positive trend when compared to baseline. While there is no evidence of any reasons for it, one potential interpretation might be smaller scale of nutrition interventions in Tat Lan program compared to the expanding geographical scope. This assumption becomes little more certain once the hand washing data is disaggregated by sex of the respondent. Naturally, women are more likely to wash hands before (p<0.05, rs = 0.081) and after eating (p<0.05, rs = 0.073), and particularly after using toilet (p<0.001, rs = 0.103), compared to men, but there is no difference in the responses when it comes to handling children or cooking, suggesting that both, male and female respondents are unaware of the need to wash hands with soap at these times.
Discussion and recommendations Outcome 2 has generated some if not most positive impact in the communities, both intended as well as unintended impact through the support to embankment and water source construction and rehabilitation, support to latrine construction and also through activities that have brought women together, such as VSLA, nutrition BCC and hygiene BCCs. While occasionally the positive impact is not as significant as the program would wish to see by the end of forth implementation year, there is solid evidence of effective activities suggesting higher impact to the target communities once well replicated to wider populations. For example VSLA and MtMSG as well as hygiene and nutrition BCC have very strong evidence of positively affecting access to safe water through boiling it, and to proper hygiene practices. However, Tat Lan has also shortcomings that have hampered mainly the sustainability of the positive impacts listed above, such as ensuring community contribution to the infrastructure work and the maintenance of it beyond Tat Lan program. When these shortcomings are addressed, at least partially, Tat Lan has great potential to further maximize the positive impact created by providing access to safe water and promoting safe hygiene practices.
60%66%
95%
12%20% 16%
56%
75%84%
32%37% 39%
58% 61%68%
18%
33%28%
0%10%20%30%40%50%60%70%80%90%
100%
After using the toilet
Before eating After eating Before or after handling children
Before cooking Before feeding children
Baseline 2015 OM 2016 OM
21
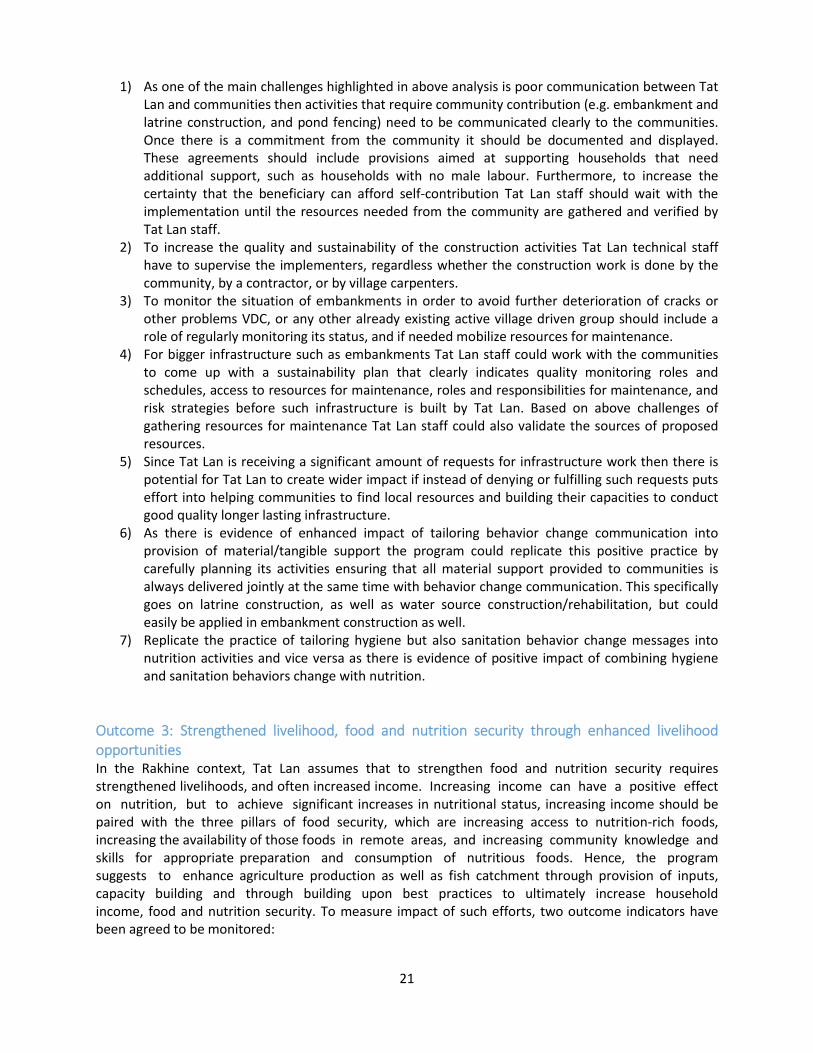
1) As one of the main challenges highlighted in above analysis is poor communication between Tat
Lan and communities then activities that require community contribution (e.g. embankment and latrine construction, and pond fencing) need to be communicated clearly to the communities. Once there is a commitment from the community it should be documented and displayed. These agreements should include provisions aimed at supporting households that need additional support, such as households with no male labour. Furthermore, to increase the certainty that the beneficiary can afford self-contribution Tat Lan staff should wait with the implementation until the resources needed from the community are gathered and verified by Tat Lan staff.
2) To increase the quality and sustainability of the construction activities Tat Lan technical staff have to supervise the implementers, regardless whether the construction work is done by the community, by a contractor, or by village carpenters.
3) To monitor the situation of embankments in order to avoid further deterioration of cracks or other problems VDC, or any other already existing active village driven group should include a role of regularly monitoring its status, and if needed mobilize resources for maintenance.
4) For bigger infrastructure such as embankments Tat Lan staff could work with the communities to come up with a sustainability plan that clearly indicates quality monitoring roles and schedules, access to resources for maintenance, roles and responsibilities for maintenance, and risk strategies before such infrastructure is built by Tat Lan. Based on above challenges of gathering resources for maintenance Tat Lan staff could also validate the sources of proposed resources.
5) Since Tat Lan is receiving a significant amount of requests for infrastructure work then there is potential for Tat Lan to create wider impact if instead of denying or fulfilling such requests puts effort into helping communities to find local resources and building their capacities to conduct good quality longer lasting infrastructure.
6) As there is evidence of enhanced impact of tailoring behavior change communication into provision of material/tangible support the program could replicate this positive practice by carefully planning its activities ensuring that all material support provided to communities is always delivered jointly at the same time with behavior change communication. This specifically goes on latrine construction, as well as water source construction/rehabilitation, but could easily be applied in embankment construction as well.
7) Replicate the practice of tailoring hygiene but also sanitation behavior change messages into nutrition activities and vice versa as there is evidence of positive impact of combining hygiene and sanitation behaviors change with nutrition.
Outcome 3: Strengthened livelihood, food and nutrition security through enhanced livelihood opportunities In the Rakhine context, Tat Lan assumes that to strengthen food and nutrition security requires strengthened livelihoods, and often increased income. Increasing income can have a positive effect on nutrition, but to achieve significant increases in nutritional status, increasing income should be paired with the three pillars of food security, which are increasing access to nutrition-rich foods, increasing the availability of those foods in remote areas, and increasing community knowledge and skills for appropriate preparation and consumption of nutritious foods. Hence, the program suggests to enhance agriculture production as well as fish catchment through provision of inputs, capacity building and through building upon best practices to ultimately increase household income, food and nutrition security. To measure impact of such efforts, two outcome indicators have been agreed to be monitored:
22
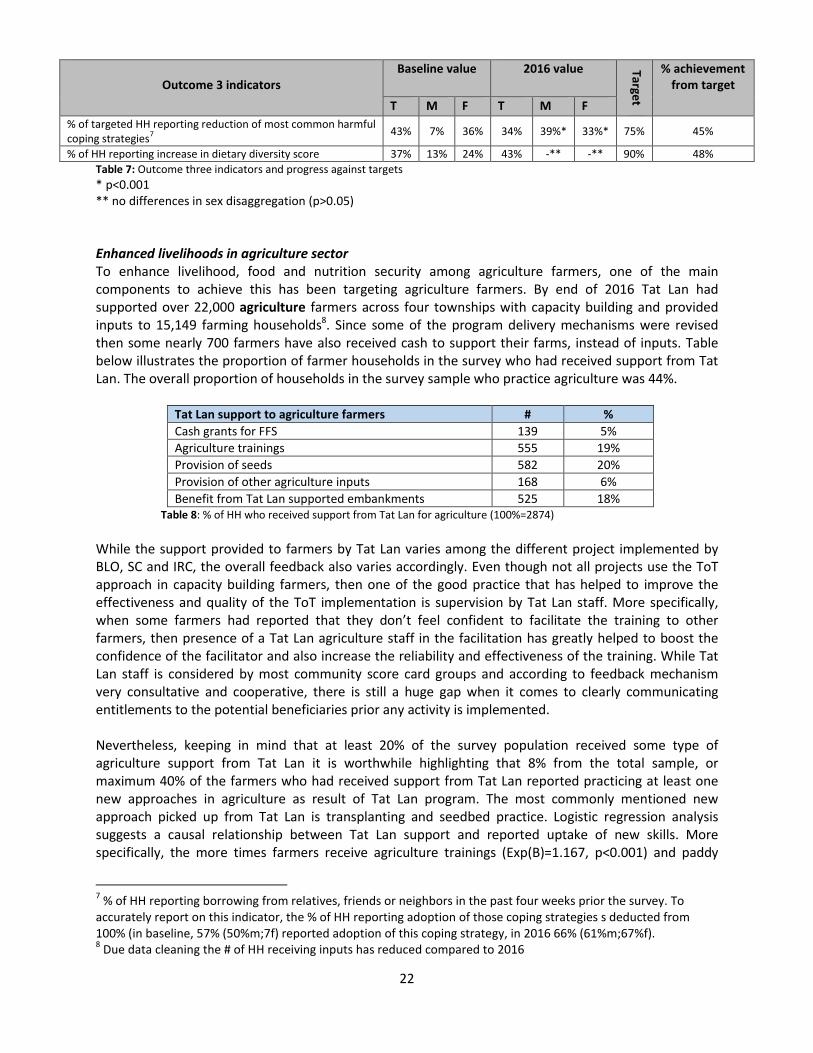
Outcome 3 indicators
Baseline value 2016 value Target
% achievement from target
T M F T M F
% of targeted HH reporting reduction of most common harmful coping strategies
7
43% 7% 36% 34% 39%* 33%* 75% 45%
% of HH reporting increase in dietary diversity score 37% 13% 24% 43% -** -** 90% 48%
Table 7: Outcome three indicators and progress against targets * p<0.001 ** no differences in sex disaggregation (p>0.05)
Enhanced livelihoods in agriculture sector To enhance livelihood, food and nutrition security among agriculture farmers, one of the main components to achieve this has been targeting agriculture farmers. By end of 2016 Tat Lan had supported over 22,000 agriculture farmers across four townships with capacity building and provided inputs to 15,149 farming households8. Since some of the program delivery mechanisms were revised then some nearly 700 farmers have also received cash to support their farms, instead of inputs. Table below illustrates the proportion of farmer households in the survey who had received support from Tat Lan. The overall proportion of households in the survey sample who practice agriculture was 44%.
Tat Lan support to agriculture farmers # %
Cash grants for FFS 139 5%
Agriculture trainings 555 19%
Provision of seeds 582 20%
Provision of other agriculture inputs 168 6%
Benefit from Tat Lan supported embankments 525 18% Table 8: % of HH who received support from Tat Lan for agriculture (100%=2874)
While the support provided to farmers by Tat Lan varies among the different project implemented by BLO, SC and IRC, the overall feedback also varies accordingly. Even though not all projects use the ToT approach in capacity building farmers, then one of the good practice that has helped to improve the effectiveness and quality of the ToT implementation is supervision by Tat Lan staff. More specifically, when some farmers had reported that they don’t feel confident to facilitate the training to other farmers, then presence of a Tat Lan agriculture staff in the facilitation has greatly helped to boost the confidence of the facilitator and also increase the reliability and effectiveness of the training. While Tat Lan staff is considered by most community score card groups and according to feedback mechanism very consultative and cooperative, there is still a huge gap when it comes to clearly communicating entitlements to the potential beneficiaries prior any activity is implemented. Nevertheless, keeping in mind that at least 20% of the survey population received some type of agriculture support from Tat Lan it is worthwhile highlighting that 8% from the total sample, or maximum 40% of the farmers who had received support from Tat Lan reported practicing at least one new approaches in agriculture as result of Tat Lan program. The most commonly mentioned new approach picked up from Tat Lan is transplanting and seedbed practice. Logistic regression analysis suggests a causal relationship between Tat Lan support and reported uptake of new skills. More specifically, the more times farmers receive agriculture trainings (Exp(B)=1.167, p<0.001) and paddy
7 % of HH reporting borrowing from relatives, friends or neighbors in the past four weeks prior the survey. To
accurately report on this indicator, the % of HH reporting adoption of those coping strategies s deducted from 100% (in baseline, 57% (50%m;7f) reported adoption of this coping strategy, in 2016 66% (61%m;67%f). 8 Due data cleaning the # of HH receiving inputs has reduced compared to 2016

23
seeds (Exp(B)= 2.086, p<0.001), the more likely they continue practicing new skills and knowledge from Tat Lan program9. This was also confirmed through qualitative data that suggested that the agriculture trainings yield very high interest among farmers and provide much new knowledge, including but not limited to production of natural fertilizers, correct application of fertilizers, seed bed preparation, weeding, etc. Interestingly, better access to seeds through Tat Lan program is much stronger variable in increasing uptake of skills compared to the agriculture trainings or any other support provided to farmers by Tat Lan. In the attempt to try to interpret this we might assume that cost on seeds is an unavoidable cost that all farmers need to consider with and receiving supplementary seeds helped them to save some the cost they would usually pay for the seeds. With the free funds they could have paid for casual labour to assist with seed beds and transplanting. However, in majority of cases community score card participants and beneficiaries who were interviewed through the feedback mechanism reported that seed provision is commonly delayed, and the seeds provided by Tat Lan are often used in the following season. Also seed quality still remains a problem, whereby some seeds are occasionally mixed, and hence don’t result in good yields. However, despite the positive views on Tat Lan’s support to agriculture the main problem hampering the uptake of skills according to the community members is the affordability of it; whereby some reported that the trainings provided to them are not relevant or practical because these approaches cannot be implemented due lack of fund. As highlighted above, Tat Lan did provide funds to farmers to assist them in covering the production costs, but the reason why there is no proven evidence of cash provision to farmers resulting in higher uptake of skills is due the low proportion of beneficiaries in the sample who actually received cash. From those who claimed practicing a new approach learned from Tat Lan program 74% reported increase in their production and 65% increase in incomes as a result. Furthermore, we can be 96% sure that if the same program would be replicated elsewhere on a population with similar socio-economic background where farmers would get same amount and quality capacity building and seeds, and where 40% of farmers actually put their new skills in practice then 62% of those farmers would report increased incomes. When uptake of skills depends on the quantity (and assumedly also quality) of the agriculture trainings provided to farmers, and also seed provision, then interestingly the most influential variables affecting increased production are uptake of skills (Exp(B)=109.031, p<0.001), but also membership in agriculture sub-committees (Exp(B)=1.171, p<0.001). More specifically, those farmers who take up skills from the agriculture trainings and put them into practice are nearly 109 times more likely to report increased productivity, and 74 times more likely to report increased incomes (Exp(B)=74,323, p<0.001) than those who have not put the skills into practice. Hence, the program would need to find a model that increases uptake of skills beyond those 40% of farmers in order to expand the impact of the agriculture intervention. Research finalized by Tat Lan by April 2017 on the uptake of skills from two different farmer field school modalities implemented by Tat Lan should be able to inform the program further on what the best approaches are to enhance uptake of skills. However, farmers are still facing numerous challenges that have hampered their production as listed in the table below.
9 The max times any survey participant reported participation in agriculture trainings was 4 (mean 1.1), and max
times receiving agriculture inputs was 3 times (mean 1.0)
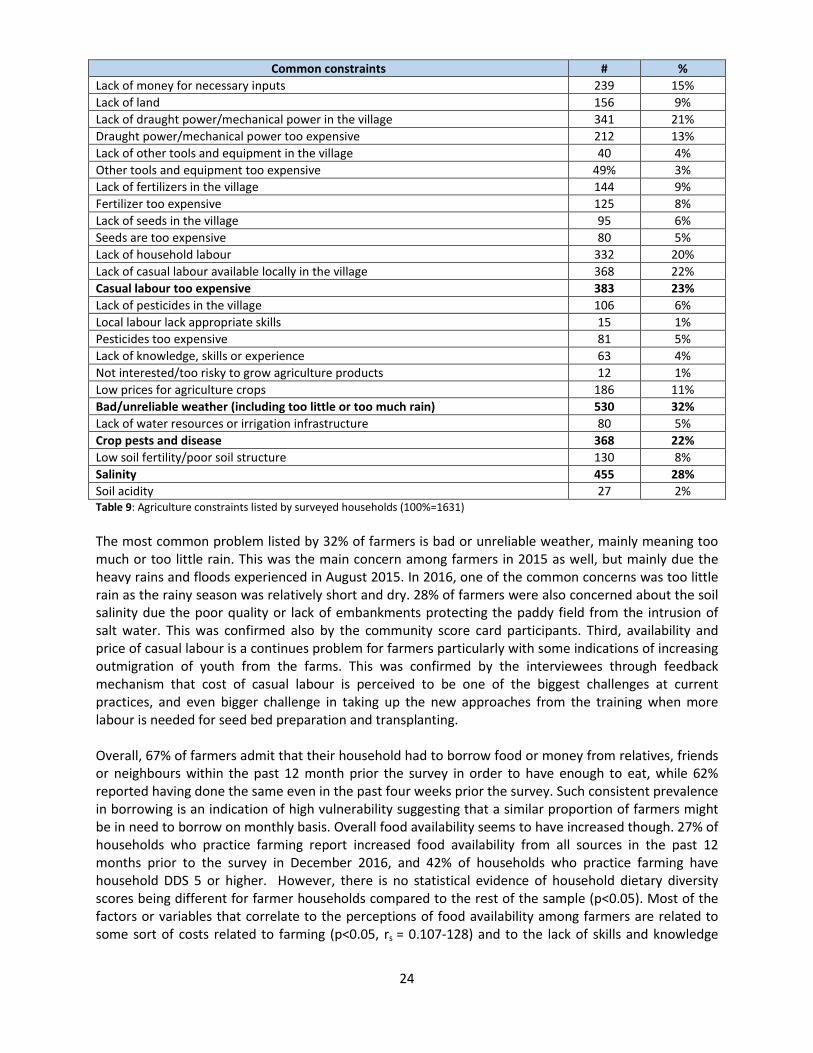
24
Common constraints # %
Lack of money for necessary inputs 239 15%
Lack of land 156 9%
Lack of draught power/mechanical power in the village 341 21%
Draught power/mechanical power too expensive 212 13%
Lack of other tools and equipment in the village 40 4%
Other tools and equipment too expensive 49% 3%
Lack of fertilizers in the village 144 9%
Fertilizer too expensive 125 8%
Lack of seeds in the village 95 6%
Seeds are too expensive 80 5%
Lack of household labour 332 20%
Lack of casual labour available locally in the village 368 22%
Casual labour too expensive 383 23%
Lack of pesticides in the village 106 6%
Local labour lack appropriate skills 15 1%
Pesticides too expensive 81 5%
Lack of knowledge, skills or experience 63 4%
Not interested/too risky to grow agriculture products 12 1%
Low prices for agriculture crops 186 11%
Bad/unreliable weather (including too little or too much rain) 530 32%
Lack of water resources or irrigation infrastructure 80 5%
Crop pests and disease 368 22%
Low soil fertility/poor soil structure 130 8%
Salinity 455 28%
Soil acidity 27 2% Table 9: Agriculture constraints listed by surveyed households (100%=1631)
The most common problem listed by 32% of farmers is bad or unreliable weather, mainly meaning too much or too little rain. This was the main concern among farmers in 2015 as well, but mainly due the heavy rains and floods experienced in August 2015. In 2016, one of the common concerns was too little rain as the rainy season was relatively short and dry. 28% of farmers were also concerned about the soil salinity due the poor quality or lack of embankments protecting the paddy field from the intrusion of salt water. This was confirmed also by the community score card participants. Third, availability and price of casual labour is a continues problem for farmers particularly with some indications of increasing outmigration of youth from the farms. This was confirmed by the interviewees through feedback mechanism that cost of casual labour is perceived to be one of the biggest challenges at current practices, and even bigger challenge in taking up the new approaches from the training when more labour is needed for seed bed preparation and transplanting. Overall, 67% of farmers admit that their household had to borrow food or money from relatives, friends or neighbours within the past 12 month prior the survey in order to have enough to eat, while 62% reported having done the same even in the past four weeks prior the survey. Such consistent prevalence in borrowing is an indication of high vulnerability suggesting that a similar proportion of farmers might be in need to borrow on monthly basis. Overall food availability seems to have increased though. 27% of households who practice farming report increased food availability from all sources in the past 12 months prior to the survey in December 2016, and 42% of households who practice farming have household DDS 5 or higher. However, there is no statistical evidence of household dietary diversity scores being different for farmer households compared to the rest of the sample (p<0.05). Most of the factors or variables that correlate to the perceptions of food availability among farmers are related to some sort of costs related to farming (p<0.05, rs = 0.107-128) and to the lack of skills and knowledge
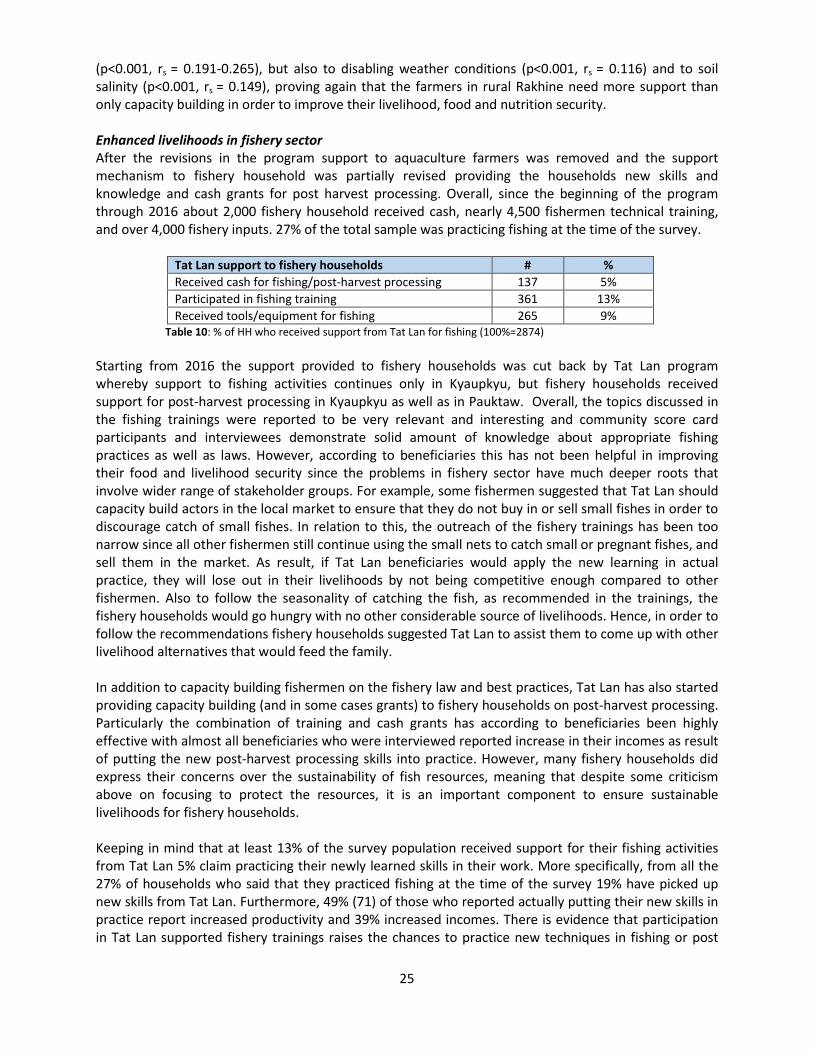
25
(p<0.001, rs = 0.191-0.265), but also to disabling weather conditions (p<0.001, rs = 0.116) and to soil salinity (p<0.001, rs = 0.149), proving again that the farmers in rural Rakhine need more support than only capacity building in order to improve their livelihood, food and nutrition security. Enhanced livelihoods in fishery sector After the revisions in the program support to aquaculture farmers was removed and the support mechanism to fishery household was partially revised providing the households new skills and knowledge and cash grants for post harvest processing. Overall, since the beginning of the program through 2016 about 2,000 fishery household received cash, nearly 4,500 fishermen technical training, and over 4,000 fishery inputs. 27% of the total sample was practicing fishing at the time of the survey.
Tat Lan support to fishery households # %
Received cash for fishing/post-harvest processing 137 5%
Participated in fishing training 361 13%
Received tools/equipment for fishing 265 9% Table 10: % of HH who received support from Tat Lan for fishing (100%=2874)
Starting from 2016 the support provided to fishery households was cut back by Tat Lan program whereby support to fishing activities continues only in Kyaupkyu, but fishery households received support for post-harvest processing in Kyaupkyu as well as in Pauktaw. Overall, the topics discussed in the fishing trainings were reported to be very relevant and interesting and community score card participants and interviewees demonstrate solid amount of knowledge about appropriate fishing practices as well as laws. However, according to beneficiaries this has not been helpful in improving their food and livelihood security since the problems in fishery sector have much deeper roots that involve wider range of stakeholder groups. For example, some fishermen suggested that Tat Lan should capacity build actors in the local market to ensure that they do not buy in or sell small fishes in order to discourage catch of small fishes. In relation to this, the outreach of the fishery trainings has been too narrow since all other fishermen still continue using the small nets to catch small or pregnant fishes, and sell them in the market. As result, if Tat Lan beneficiaries would apply the new learning in actual practice, they will lose out in their livelihoods by not being competitive enough compared to other fishermen. Also to follow the seasonality of catching the fish, as recommended in the trainings, the fishery households would go hungry with no other considerable source of livelihoods. Hence, in order to follow the recommendations fishery households suggested Tat Lan to assist them to come up with other livelihood alternatives that would feed the family. In addition to capacity building fishermen on the fishery law and best practices, Tat Lan has also started providing capacity building (and in some cases grants) to fishery households on post-harvest processing. Particularly the combination of training and cash grants has according to beneficiaries been highly effective with almost all beneficiaries who were interviewed reported increase in their incomes as result of putting the new post-harvest processing skills into practice. However, many fishery households did express their concerns over the sustainability of fish resources, meaning that despite some criticism above on focusing to protect the resources, it is an important component to ensure sustainable livelihoods for fishery households. Keeping in mind that at least 13% of the survey population received support for their fishing activities from Tat Lan 5% claim practicing their newly learned skills in their work. More specifically, from all the 27% of households who said that they practiced fishing at the time of the survey 19% have picked up new skills from Tat Lan. Furthermore, 49% (71) of those who reported actually putting their new skills in practice report increased productivity and 39% increased incomes. There is evidence that participation in Tat Lan supported fishery trainings raises the chances to practice new techniques in fishing or post

26
harvest processing nearly two times compared to those fishery households who have not participate in Tat Lan trainings (Exp(B)=1.883, p<0.05). To go a step further and look at the impact of the trainings on household income it appears that from the tested variables only uptake of skills is directly affecting the chances for better incomes. More specifically, these households who have participated in Tat Lan supported fishery trainings, and have put their new skills into practice are 12 times more likely to increase their incomes compared to households who have participated in trainings, but have not found the opportunities to put the new skills into practice (Exp(B)=12.212, p<0.001). This means that fishermen, but also farmers above do need additional support besides technical capacity building to better enable them the uptake of skills in their livelihoods. To do this, it is essential to identify the constraints that households face in their daily livelihood activities and mitigate their impact. Table below lists the most common constraints listed by households who were practicing fishing at the time of the survey. It appears that the main concern among fishery households continues to be access to a boat mentioned by 36% of fishing households, followed by low prices for fish (32%). This would imply that Tat Lan program would need to work out mechanisms to address those challenges by enhancing access to credit for poor fishery households, but also by assisting the fishermen make their products more marketable for example due some post-harvest processing approaches, as now piloted in Tat Lan for the first time since 201610.
Common constraints # %
Cost of fishing license 134 17%
Limited access to fishing grounds 92 12%
Lack of access to boat 282 36%
Shared fishing grounds between several communities leading to need to share resources 63 8%
Low fish catches 196 25%
Lack of capital for gear replenishment 219 28%
No access to market 78 10%
Low price for fish 250 32%
Lack of cold storage facilities 70 9%
Lack of capital to repair or replace boat 118 15%
Lack of credit 83 11%
Trawler destroyed fishing net/resources 115 15%
Losses of fishing nets because of thieves 179 23%
Migrant fishers from other regions 20 3%
Trawling of large/foreign vessels in the water 6 1%
Use of illegal fishing nets 15 2%
Implementation of illegal fishing practices 15 2%
Quantity and quality of fishing gear 12 2% Table 11: Fishery constraints listed by surveyed households (100%=772)
Compared to agriculture farmers above, there is clear evidence of fishery household being economically more vulnerable. Only 17% of fishery households reported dietary diversity score 5 or higher, compared to 42% of agriculture households (p<0.05, rs = 0.104). Furthermore, 71% of fishery households admitted that they had to borrow food or money from relatives, friends or neighbors in the last four weeks prior the survey in order to have enough to eat and 77% had done the same within the past 12 month prior to the survey. While the proportion of households reporting increased food availability from all sources in the past 12 month is almost the same with the proportion of agriculture households (26% fishery households and 26% farming households), then there is significantly higher proportion of fishery household who report that food availability for their household had decreased instead. Overall, 29%
10
The sample of those beneficiaries within our survey sample is not sufficient to provide evidence of impact yet, and a separate impact assessment on fishery household would be needed
27
perceived access to food to have worsened. Analysis suggests moderate evidence of correlations between perceived access to food with some constraints listed by the fisherman, such as shared fishing grounds between several communities leading to the need to share resources (p<0.05, rs = 0.144), lack of credit (p<0.001, rs = 0.172) and the quantity and quality of fishing gear available (p<0.001, rs = 0.277). However, due the small proportion of fishery households listing those specific concerns the sample size is not sufficient to test causal relations between these constraints and perceptions about access to food. Enhanced livelihoods for cash for work beneficiaries The total survey sample includes 37% of households who have casual labor as their first most importance source of income. Households that have casual work as their most important source of income have had relatively significant role in Tat Lan program. By screening the participation rate at each of the Tat Lan activity it appears that at a minimum 20% and maximum of 46% of all participants in Tat Lan activities who participated in the survey have been casual labor households. Casual labor households have participated the most in hygiene, sanitation and nutrition activities. For instance, 44% of water purification recipients in the survey were casual labor households, likewise, 46% of eco stove training participants and 42% of latrine material recipients. Similar proportion of nutrition and financial education training participants in the survey were casual labor households too. However, the activities that Tat Lan has designed specifically to support casual labor households mainly focus on infrastructure, such as pond and embankment construction and rehabilitation, but also laborers assisting with mangrove plantations at river banks in Kyaupkyu. While is not much data to support statements about the impact of mangrove planting on the casual laborers, there have been some concerns over the relevant of the seeds provided by Tat Lan as they tend not to sprout due the high salinity in the water, and as result the laborers fail to sell the plants to Tat Lan in order to earn income. However, there are numerous reports on the impact of the incomes through construction work. The community score card participants felt disappointed with the differences inequalities in the entitlements between embankment and pond construction casual workers. Reportedly daily earning of about 3,000MMK is the needed amount that covers the daily needs of a household, and this is reportedly also the amount that casual workers working on ponds received. However, the casual workers working on embankment construction received reportedly 4,000MMK per day, which has enabled them to save around 1,000MMK per day. The dissatisfaction is caused by the differences in pays, while the work load and amount is the same. One community score card group even claimed that embankment casual workers work only 3 hours per day, while the workers on ponds had to work 4 hours, but still receive smaller pay. Furthermore, frustrations are even deeper when casual laborers discussed the timeframe. When embankment construction work provides livelihood security to the participants over a time span of about 70-80 days, then pond construction takes only 7-10 days. Considering that casual laborers working on the embankment save on average 1,000MMk per day they are reportedly able to save about 50-70,000MMK by the end of the assignments. Some casual worker households who participated in the community score card activities suggested Tat Lan to support them with access to livestock, even if that meant to cut their daily wages. When they discussed about the impact of the cash that they receive particularly through pond construction they agreed that it is not very sustainable and does not help their livelihoods, but if they would get small livestock such as chickens our goats, whether from Tat Lan directly or could be linked to someone who could deliver the livestock to the remote villages, it would assist them in long run to earn income through the sale of eggs of milk. Interestingly, relatively high 40% of the households who have casual labor as their main source of income have dietary diversity score 5 or higher. However, when we look at the negative coping strategies comparing the prevalence of adopting the most common coping strategy in a 12 month period (77%) and the prevalence in a four week period (72%), then the margins are relatively narrow suggesting that there is very high likelihood that this most common coping strategy is adopted regularly
28
on monthly basis. Fishery and casual labor households have similar prevalence of adoption of such harmful coping strategy indicating that they have similar level of economic vulnerability, compared to farming households where prevalence was lower at about 65%. Increased dietary diversity In 2013/14 baseline assessment the overall mean for the dietary diversity score was measured to be 5.2
and at the time 37% of the households had dietary diversity score 5 or higher. In 2016 the mean for the
overall score has dropped to 4.5 while the proportion of households with the score 5 or higher has
increased to 43%. This suggests that most vulnerable households with limited access struggle even more
to keep the score up, and their mean drags down the overall mean to 4.5. None of the Tat Lan activities
have evidence of causal relationships to the reported dietary diversity score, meaning that reasons why
the score has dropped, or even the fact that 43% have a dietary diversity score 5 or higher is affected by
factors outside Tat Lan’s scope. However, there was evidence found of multiple correlations with the
dietary diversity score. Thereby some of the significant correlations were for example related to the
infra/CfW sub-committee membership (p<0.001, rs = 0.118) that revealed that committee members are
more likely to have HDDS below 5 compared to non-members, which also applied to fishery training
(p<0.05, rs = 0.088) and CfW participants (p<0.001, rs = 0.124) which implies that these in fact are groups
with lowest food security compared to, for instance, agriculture training participants. Agriculture
training participants are less likely to have a HDDS less than 5 compared to non-participants (p<0.05, rs =
0.099) as also VSLA members (p<0.05, rs = 0.096) compared to non-members and nutrition training
participants (p<0.05, rs = 0.088) compared to non-participants. Interestingly, there is no evidence of
correlation between the dietary diversity score with the average income of the household as well as
with the main livelihood strategy, while there is evidence of moderate correlation to the township of the
participants (p<0.001, rs = 0.250) suggesting that there are factors outside Tat Lan’s control that have
stronger impact over the access to food than any of the Tat Lan activities.
Most common harmful coping strategies Overall 28% of households believed that food availability has increased within the past 12 month prior the survey, with another 23% who perceived it decreasing for them. Furthermore, there is solid evidence of correlation between perceptions of food availability and township of the respondent (p<0.001, rs = 0.200) meaning that there are differences between township in terms of access to food which confirms the above assumption that access to food seems to be determined by external factors outside Tat Lan’s scope. Figure below illustrates the households’ perceptions of access to food in 2016. Myabone has the highest 35% proportion of households who reported increased food availability, with Pauktaw being the lowest with 16% of households only reporting the same. At the same time, Myabone had also the lowest proportion of households reporting decreased food availability, and Pauktaw the highest. When Myabone and Minbya have more households reporting increase in food availability than the households reporting decrease, then in Pauktaw and Kyaupkyu it is the other way around. More people there reported decease than increase, meaning that overall access to food in Pauktaw and Kyaupkyu had worsened in 2016.

29
Figure 8: % of HH reporting access to food within the last 12 month prior the survey
To cope with food insecurity most community members have had to adopt different coping strategies, among which are also some harmful coping strategies. In 2013 Tat Lan baseline identified borrowing food or money from relatives, friends or neighbors in the past 4 weeks prior the survey as most common harmful strategy that helps to cope with food insecurity. At the time of the baseline assessment 57% of households admitted borrowing from relatives, friends or neighbors in that four week period and now in 2016 66% report doing the same. However, there is no statistical evidence between these two figures, meaning that in reality, it might or it might not be that 66% borrowed within the past four weeks, it might as well be that the figure stands still at about 57%. Nevertheless there is no evidence or even indications of improvement compared to 2013. Adoption of this most common negative coping strategy has several correlations to Tat Lan activities. For instance, infra/CfW sub-committee members are less likely to apply that coping strategy compared to non-members (p<0.05, rs = 0.042), as also farmers who received cash grants (p<0.05, rs = 0.039) and agriculture inputs (p<0.05, rs = 0.040) or mothers who received maternity cash grants (p<0.05, rs = 0.051). While correlation does not imply on a causal relationship, it could be assumed that cash grants provided to the communities might have assisted the household to reduce the need to apply that specific negative coping strategy. Expectedly there is also moderate evidence of correlation between the adoption of this coping strategy and the size of household income (p<0.001, rs = 0.137) and the most importance source of income (p<0.001, rs = 0.211) confirming the obvious that households with less lucrative livelihoods are economically more vulnerable and more prone to adopt negative coping strategies.
Discussion and recommendations As the outcome indicators suggest the overall food security has decreased compared to baseline assessment in 2013/14. More households have been in a situation where they had to adopt the most common harmful coping strategy of borrowing from family or friends in order to cover the food needs of the household, and even though higher percentage of households demonstrate dietary diversity score higher than 5, which was the average during baseline, the overall dietary diversity score has dropped. While there was no significant natural disaster, or any other significant event in 2016 that would have negatively affected the food security situation of target households, it can be speculated, based on findings from above analysis that unsupportive weather conditions were still one of the main factors. This might mean that households, mainly farmers, were still dealing with the aftermath of 2015 flooding, while others were having difficulties due rainfall in 2016 which was lower than usual. In any case, rural households in Tat Lan areas are still very vulnerable to external factors despite having evidence of positive impact of Tat Lan activities on the food and livelihood security of the target households. Thereby the most influential activities were provision of paddy seeds and capacity building
16%
35%
33%
22%
57%
45%
41%
53%
27%
20%
26%
25%
0% 10% 20% 30% 40% 50% 60% 70% 80% 90% 100%
Pauktaw
Myabone
Minbya
Kyaupkyu
Increased Same Decreased
30
provided to farmers and fishery households, which showed evidence of enhancing the uptake of new agriculture and fishery practices, and consequently leading to increased production rates and incomes. To further enhance the food and livelihood security of the target households, and eventually reduce the vulnerability to natural disasters Tat Lan program could potentially build upon following best practices and try to reduce some of the shortcomings:
1) To enhance the retention of information from Tat Lan supported trainings each capacity building activity should include provision of simple and straightforward pamphlets that ideally are as visual as possible so that training participants can refer back to the materials at any time.
2) As there is strong evidence suggesting that capacity building alone will not promote uptake of skills as much as it would when provided with relevant inputs (in this case seeds, but potentially also cash or other good quality inputs) Tat Lan should maximize such approach as much as resources allow, but thereby always ensuring that capacity building about the proper use of those inputs accompanies the provision of inputs in good time.
3) Tat Lan should ensure that the recommended agricultural techniques can be afforded by farmers. Alternative approaches could be discussed with farmers if they are not able to afford the full package. Similarly, the FFS can be a forum to discuss impediments to adoption and possible community-driven solutions to reduce dependency on Tat Lan inputs.
4) Projects that still work through ToT approaches could potentially consider a good practice of having a Tat Lan staff supervising the implementation of the trainings by communities, if resources allow to support the quality of the teaching but also confidence of the facilitators.
5) With significant gaps in communicating the program entitlements to the beneficiaries, but also requirements from the participants Tat Lan could prepare information sheets with clear information that are posted in the VICs or hand them to VDCs at least a week prior beneficiary selection process.
6) As there is some qualitative evidence of positive impact of post-harvest processing trainings and grants on fishery households Tat Lan could explore the positive impact further and once verified replicate the support to post-harvest processing among wider range of fishery households.
7) While there is obvious need to ensure that fish resources are sustainable, the project approach should be well tailored to address the different value chain aspects in fishery sector in order to include all necessary stakeholder groups in the theory of change. Even if such complex approach is not feasible within Tat Lan scope and timeframe, separate funding sources could be explored to address the lack of sustainability of fish resources.
8) While a mangrove planting idea in Kaypkyu is appreciated by the casual laborers as well as fishermen, Tat Lan should ensure that the seeds provided are relevant for the soil structure and content in Rakhine to reduce the loss in seeds that don’t sprout.
9) To avoid frustrations between casual labor beneficiaries who support pond construction and casual laborers on embankment Tat Lan could consider using the same casual labor group for both activities, which would slightly decrease the time required for the completion of the activities, but would make up for this due the time required to complete both embankment as well as pond construction/rehabilitation. Payment should also be in line with the minimum wage and be consistently applied across all activities and all partners.
10) To support livelihoods of the casual labor households Tat Lan could assist to facilitate linkages to markets for livestock in the most rural communities where households struggle to access the livestock markets.

31
Outcome 4: Sustainable livelihood opportunities supported through increased access to financial services Another main area of focus complementing Tat Lan’s efforts to increase household food and nutrition security and enhance livelihood, is development and capacity building of Village Saving and Loan Associations (VSLA) and since 2016 also a solid financial literacy component. Through a phased approach, the Tat Lan Program has proposed to provide a package of financial services to all target villages. Through the formation of VSLAs, the program will provide clients with the opportunity to save and access loans, complementing the program’s productive activities interventions. The relatively new financial literacy component is providing capacity building to VSLA members, as well as non-VSLA adults, youth and even children to positively influence their financial behaviours.
Outcome 4 indicators
Baseline value 2016 value Target
% achievement from target T M F T M F
% of HH reporting increase in investment into livelihoods/productive assets as most important use of loans
11
33% 30% 3% 42% -* -* 48%
87%
% of HH reporting consumption borrowing 59% 51% 8% 40% -* -* 35% 87%
% increase among women in target population reporting inclusion in financial decision making processes on community level
28%
N/A
28% 76% N/A 76%
80%
95%
Table 12: Outcome four indicators and progress against targets
* p<0.05
To support increased access to financial services and strengthen financial management capacities Tat Lan program has supported 168 villages by enabling the community members to establish VSLA groups that provide low interest loans and an opportunity to regularly save even small amounts of money. Furthermore, to support positive changes in financial behaviors Tat Lan has given financial literacy training to 7,285 beneficiaries of different age groups (including 5,082 female). While financial literacy trainings have really scaled up just in 2016 there has been a separate study conducted by Tat Lan that measures the impact of the financial literacy programs. But qualitative data collected for this assessment suggests that these trainings are in high demand and highly relevant and beneficial to the communities. Almost all participants in community score card groups and beneficiaries interviewed through the feedback mechanism reported satisfaction with the training, and/or asked for further scale up of it. Financial literacy and VSLA establishment supplement each other whereby one provides the theoretical understanding of the importance of savings and the potential negative impacts of borrowing, then VSLA gives a practical outlet to it. It appears that the most useful aspects of VSLAs are the reinforcement of saving practice. Many CRM interviewees and community score card participants agreed that if they weren’t able to save at VSLA, they would have most likely used their savings for something unnecessary. VSLAs seem to enable strong positive peer support to save. For example, one VSLA group reported that they have a habit to positively cheer and clap every time a member puts money in the saving box. Also the opportunity to take low interest loans particularly in cases of emergency was highly valued by the VSLA members. Qualitative data suggests that big proportion of loans goes on health emergencies and school fees, but also on livelihoods such as purchase of fishing nets and small livestock. While the capacities are not very strong yet to build sufficient confidence among VSLA members to independently manage the groups, the regular feedback from VSLAs to CARE and also from community score card participants was often about requesting more contact time with
11
Business investment, land purchase/rent, purchase of working tools or equipment, purchase of agriculture inputs and/or purchase of animals/medicine for animals
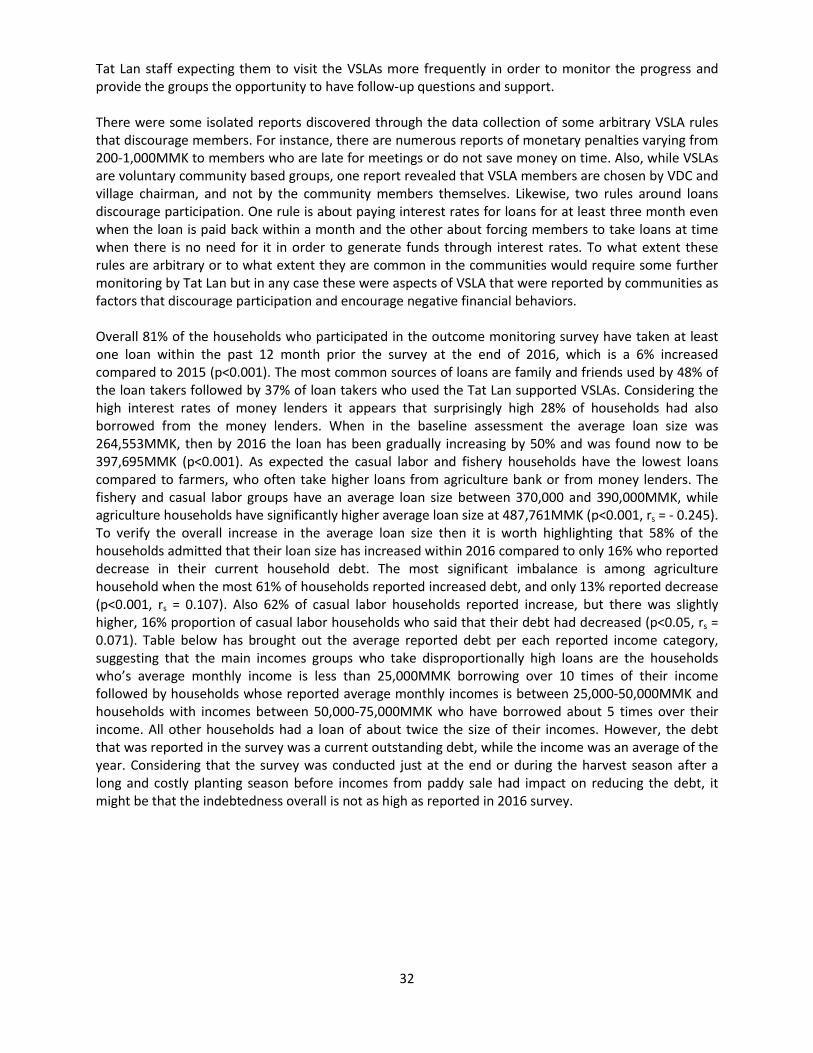
32
Tat Lan staff expecting them to visit the VSLAs more frequently in order to monitor the progress and provide the groups the opportunity to have follow-up questions and support. There were some isolated reports discovered through the data collection of some arbitrary VSLA rules that discourage members. For instance, there are numerous reports of monetary penalties varying from 200-1,000MMK to members who are late for meetings or do not save money on time. Also, while VSLAs are voluntary community based groups, one report revealed that VSLA members are chosen by VDC and village chairman, and not by the community members themselves. Likewise, two rules around loans discourage participation. One rule is about paying interest rates for loans for at least three month even when the loan is paid back within a month and the other about forcing members to take loans at time when there is no need for it in order to generate funds through interest rates. To what extent these rules are arbitrary or to what extent they are common in the communities would require some further monitoring by Tat Lan but in any case these were aspects of VSLA that were reported by communities as factors that discourage participation and encourage negative financial behaviors. Overall 81% of the households who participated in the outcome monitoring survey have taken at least one loan within the past 12 month prior the survey at the end of 2016, which is a 6% increased compared to 2015 (p˂0.001). The most common sources of loans are family and friends used by 48% of the loan takers followed by 37% of loan takers who used the Tat Lan supported VSLAs. Considering the high interest rates of money lenders it appears that surprisingly high 28% of households had also borrowed from the money lenders. When in the baseline assessment the average loan size was 264,553MMK, then by 2016 the loan has been gradually increasing by 50% and was found now to be 397,695MMK (p<0.001). As expected the casual labor and fishery households have the lowest loans compared to farmers, who often take higher loans from agriculture bank or from money lenders. The fishery and casual labor groups have an average loan size between 370,000 and 390,000MMK, while agriculture households have significantly higher average loan size at 487,761MMK (p˂0.001, rs = - 0.245). To verify the overall increase in the average loan size then it is worth highlighting that 58% of the households admitted that their loan size has increased within 2016 compared to only 16% who reported decrease in their current household debt. The most significant imbalance is among agriculture household when the most 61% of households reported increased debt, and only 13% reported decrease (p˂0.001, rs = 0.107). Also 62% of casual labor households reported increase, but there was slightly higher, 16% proportion of casual labor households who said that their debt had decreased (p˂0.05, rs = 0.071). Table below has brought out the average reported debt per each reported income category, suggesting that the main incomes groups who take disproportionally high loans are the households who’s average monthly income is less than 25,000MMK borrowing over 10 times of their income followed by households whose reported average monthly incomes is between 25,000-50,000MMK and households with incomes between 50,000-75,000MMK who have borrowed about 5 times over their income. All other households had a loan of about twice the size of their incomes. However, the debt that was reported in the survey was a current outstanding debt, while the income was an average of the year. Considering that the survey was conducted just at the end or during the harvest season after a long and costly planting season before incomes from paddy sale had impact on reducing the debt, it might be that the indebtedness overall is not as high as reported in 2016 survey.
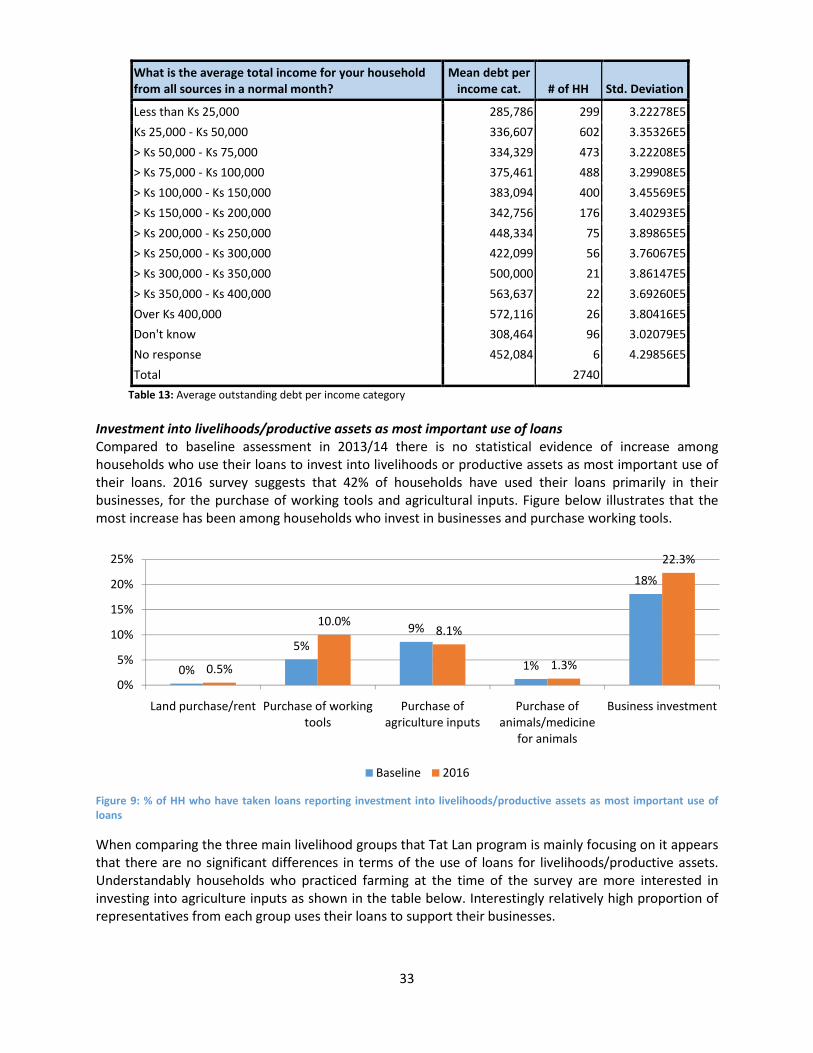
33
What is the average total income for your household from all sources in a normal month?
Mean debt per income cat. # of HH Std. Deviation
Less than Ks 25,000 285,786 299 3.22278E5
Ks 25,000 - Ks 50,000 336,607 602 3.35326E5
> Ks 50,000 - Ks 75,000 334,329 473 3.22208E5
> Ks 75,000 - Ks 100,000 375,461 488 3.29908E5
> Ks 100,000 - Ks 150,000 383,094 400 3.45569E5
> Ks 150,000 - Ks 200,000 342,756 176 3.40293E5
> Ks 200,000 - Ks 250,000 448,334 75 3.89865E5
> Ks 250,000 - Ks 300,000 422,099 56 3.76067E5
> Ks 300,000 - Ks 350,000 500,000 21 3.86147E5
> Ks 350,000 - Ks 400,000 563,637 22 3.69260E5
Over Ks 400,000 572,116 26 3.80416E5
Don't know 308,464 96 3.02079E5
No response 452,084 6 4.29856E5
Total 2740
Table 13: Average outstanding debt per income category
Investment into livelihoods/productive assets as most important use of loans Compared to baseline assessment in 2013/14 there is no statistical evidence of increase among households who use their loans to invest into livelihoods or productive assets as most important use of their loans. 2016 survey suggests that 42% of households have used their loans primarily in their businesses, for the purchase of working tools and agricultural inputs. Figure below illustrates that the most increase has been among households who invest in businesses and purchase working tools.
Figure 9: % of HH who have taken loans reporting investment into livelihoods/productive assets as most important use of loans
When comparing the three main livelihood groups that Tat Lan program is mainly focusing on it appears that there are no significant differences in terms of the use of loans for livelihoods/productive assets. Understandably households who practiced farming at the time of the survey are more interested in investing into agriculture inputs as shown in the table below. Interestingly relatively high proportion of representatives from each group uses their loans to support their businesses.
0%
5%
9%
1%
18%
0.5%
10.0%8.1%
1.3%
22.3%
0%
5%
10%
15%
20%
25%
Land purchase/rent Purchase of working tools
Purchase of agriculture inputs
Purchase of animals/medicine
for animals
Business investment
Baseline 2016
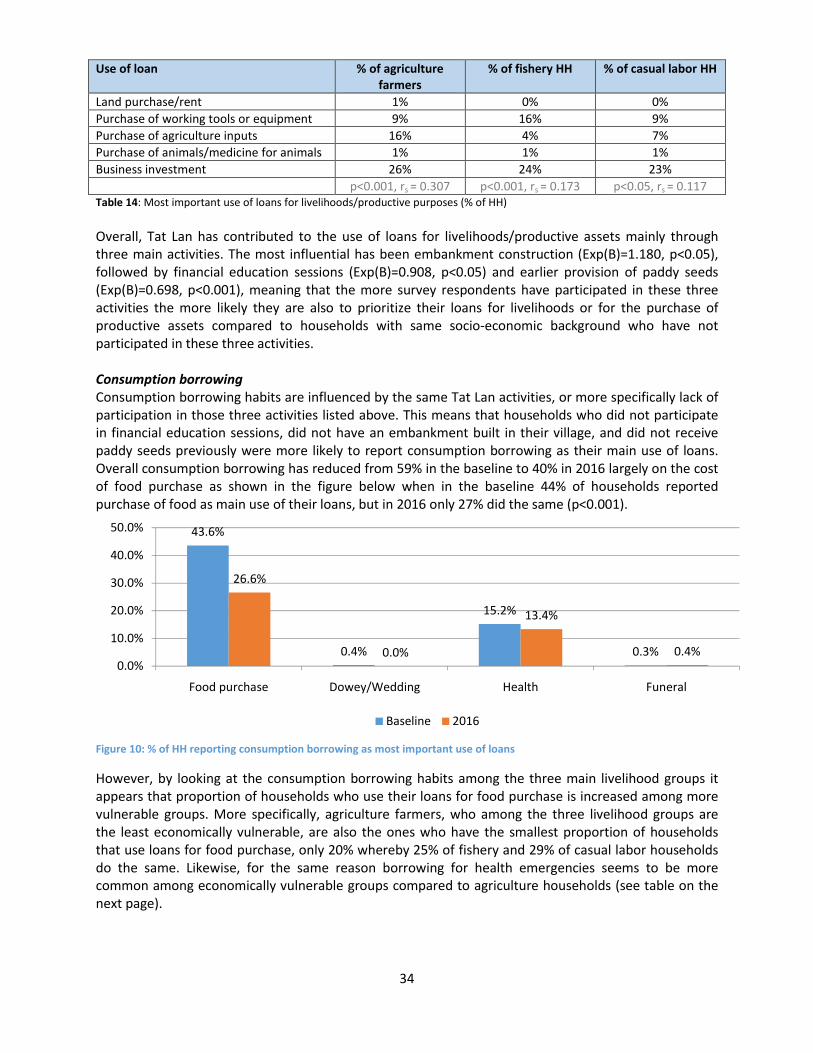
34
Use of loan % of agriculture farmers
% of fishery HH % of casual labor HH
Land purchase/rent 1% 0% 0%
Purchase of working tools or equipment 9% 16% 9%
Purchase of agriculture inputs 16% 4% 7%
Purchase of animals/medicine for animals 1% 1% 1%
Business investment 26% 24% 23%
p<0.001, rs = 0.307 p<0.001, rs = 0.173 p<0.05, rs = 0.117 Table 14: Most important use of loans for livelihoods/productive purposes (% of HH)
Overall, Tat Lan has contributed to the use of loans for livelihoods/productive assets mainly through three main activities. The most influential has been embankment construction (Exp(B)=1.180, p<0.05), followed by financial education sessions (Exp(B)=0.908, p<0.05) and earlier provision of paddy seeds (Exp(B)=0.698, p<0.001), meaning that the more survey respondents have participated in these three activities the more likely they are also to prioritize their loans for livelihoods or for the purchase of productive assets compared to households with same socio-economic background who have not participated in these three activities. Consumption borrowing Consumption borrowing habits are influenced by the same Tat Lan activities, or more specifically lack of participation in those three activities listed above. This means that households who did not participate in financial education sessions, did not have an embankment built in their village, and did not receive paddy seeds previously were more likely to report consumption borrowing as their main use of loans. Overall consumption borrowing has reduced from 59% in the baseline to 40% in 2016 largely on the cost of food purchase as shown in the figure below when in the baseline 44% of households reported purchase of food as main use of their loans, but in 2016 only 27% did the same (p<0.001).
Figure 10: % of HH reporting consumption borrowing as most important use of loans
However, by looking at the consumption borrowing habits among the three main livelihood groups it appears that proportion of households who use their loans for food purchase is increased among more vulnerable groups. More specifically, agriculture farmers, who among the three livelihood groups are the least economically vulnerable, are also the ones who have the smallest proportion of households that use loans for food purchase, only 20% whereby 25% of fishery and 29% of casual labor households do the same. Likewise, for the same reason borrowing for health emergencies seems to be more common among economically vulnerable groups compared to agriculture households (see table on the next page).
43.6%
0.4%
15.2%
0.3%
26.6%
0.0%
13.4%
0.4%0.0%
10.0%
20.0%
30.0%
40.0%
50.0%
Food purchase Dowey/Wedding Health Funeral
Baseline 2016

35
Use of loan % of agriculture
farmers % of fishery HH % of casual labor HH
Food purchase 20% 25% 29%
Dowry/wedding 0% 0% 0%
Health 9% 11% 15%
Funeral 0% 1% 1%
Repayment of loans 2% 1% 1%
School/education fees/cost 12% 9% 10%
p<0.001, rs = 0.307 p<0.001, rs = 0.173 p<0.05, rs = 0.117 Table 15: % of HH reporting consumption borrowing
Borrowing habits, negative and positive, seem to be in correlation with a number of Tat Lan activities and with some independent variables or factors. Main livelihood strategy of the household (p˂0.001, rs = 0.164) and township of the survey participants (p˂0.001, rs = 0.124) have the strongest correlation to the borrowing habits suggesting that availability and access to markets, as well as affordability of products remain two main factors determining financial behaviors. Women in community level financial decision making In addition, as in previous year, community score card participants perceive VSLA groups as a great opportunity for enhancing collaboration and cohesion. It has united the community members, particularly women, and provided a platform for discussions beyond topics relevant to VSLAs. With 99% confidence level, women perceiving their participation in financial decision making processes on community level has also increased to 76% compared to the initial baseline value of 28%. The Tat Lan variables that have been significant in increasing women’s inclusion in village level financial decisions are interestingly mostly related to hygiene, sanitation and nutrition suggesting that these are the spheres where women feel most confident to be included in and make decisions about. More specifically, provision of latrine materials (Exp(B)=0.822, p<0.05), hygiene BCC sessions (Exp(B)=0.950, p<0.05), financial education sessions (Exp(B)=0.879, p<0.05), but most importantly nutrition trainings (Exp(B)=1.057, p<0.05) and provision of fishing gear/equipment (Exp(B)=1.244, p<0.05) have positively influenced women’s perceptions of their participation in community level financial decisions. Thereby, connection to the provision of fishing gear would need to be explored further in order to throw conclusions that Tat Lan could build upon. Pond construction/renovation seems to be an influential factor too assuming that women were to some extent involved in decisions about construction materials for pond fencing or ladder building as they are the main group utilizing the ponds directly (Exp(B)=0.677, p<0.001). Correlation was also found with participation in VDCs (p˂0.05, rs = 0.056), in fishery sub-committees (p˂0.05, rs = 0.057), MtMSGs (p˂0.05, rs = 0.038), VSLAs (p˂0.05, rs = 0.047), maternity cash transfers p˂0.001, rs = 0.066) and gender trainings (p˂0.05, rs = 0.050). However, as these variables did not show up in previous regression analysis when we looked for variables that have actually influenced the outcome, then it means there is reverse relationship between women’s inclusion in community level decision making and the above variables. In other worse, the data suggests that because women are involved in financial decisions, they are more likely to participate in the above activities. Interestingly, while 76% of women believe that women do participate in community level financial decision making, then 72% of men believe the same (p˂0.05, rs = 0.060), which to some extent verifies women’s perceptions of own participation.
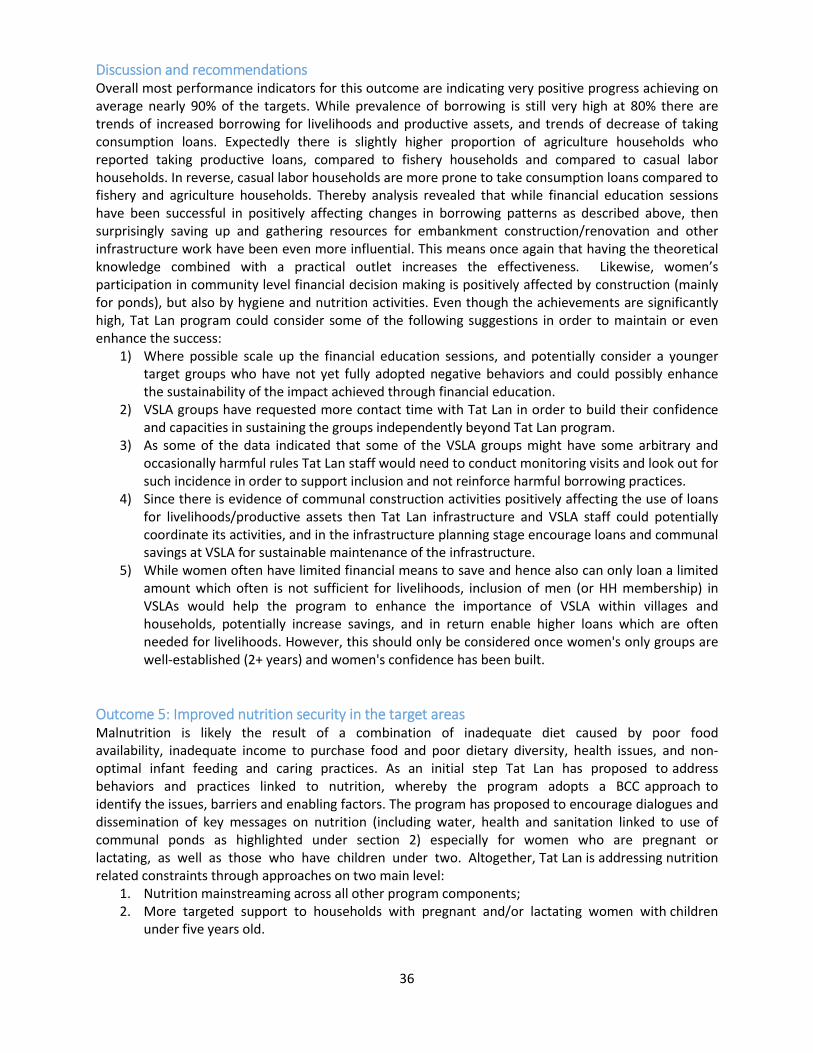
36
Discussion and recommendations Overall most performance indicators for this outcome are indicating very positive progress achieving on average nearly 90% of the targets. While prevalence of borrowing is still very high at 80% there are trends of increased borrowing for livelihoods and productive assets, and trends of decrease of taking consumption loans. Expectedly there is slightly higher proportion of agriculture households who reported taking productive loans, compared to fishery households and compared to casual labor households. In reverse, casual labor households are more prone to take consumption loans compared to fishery and agriculture households. Thereby analysis revealed that while financial education sessions have been successful in positively affecting changes in borrowing patterns as described above, then surprisingly saving up and gathering resources for embankment construction/renovation and other infrastructure work have been even more influential. This means once again that having the theoretical knowledge combined with a practical outlet increases the effectiveness. Likewise, women’s participation in community level financial decision making is positively affected by construction (mainly for ponds), but also by hygiene and nutrition activities. Even though the achievements are significantly high, Tat Lan program could consider some of the following suggestions in order to maintain or even enhance the success:
1) Where possible scale up the financial education sessions, and potentially consider a younger target groups who have not yet fully adopted negative behaviors and could possibly enhance the sustainability of the impact achieved through financial education.
2) VSLA groups have requested more contact time with Tat Lan in order to build their confidence and capacities in sustaining the groups independently beyond Tat Lan program.
3) As some of the data indicated that some of the VSLA groups might have some arbitrary and occasionally harmful rules Tat Lan staff would need to conduct monitoring visits and look out for such incidence in order to support inclusion and not reinforce harmful borrowing practices.
4) Since there is evidence of communal construction activities positively affecting the use of loans for livelihoods/productive assets then Tat Lan infrastructure and VSLA staff could potentially coordinate its activities, and in the infrastructure planning stage encourage loans and communal savings at VSLA for sustainable maintenance of the infrastructure.
5) While women often have limited financial means to save and hence also can only loan a limited amount which often is not sufficient for livelihoods, inclusion of men (or HH membership) in VSLAs would help the program to enhance the importance of VSLA within villages and households, potentially increase savings, and in return enable higher loans which are often needed for livelihoods. However, this should only be considered once women's only groups are well-established (2+ years) and women's confidence has been built.
Outcome 5: Improved nutrition security in the target areas Malnutrition is likely the result of a combination of inadequate diet caused by poor food availability, inadequate income to purchase food and poor dietary diversity, health issues, and non-optimal infant feeding and caring practices. As an initial step Tat Lan has proposed to address behaviors and practices linked to nutrition, whereby the program adopts a BCC approach to identify the issues, barriers and enabling factors. The program has proposed to encourage dialogues and dissemination of key messages on nutrition (including water, health and sanitation linked to use of communal ponds as highlighted under section 2) especially for women who are pregnant or lactating, as well as those who have children under two. Altogether, Tat Lan is addressing nutrition related constraints through approaches on two main level:
1. Nutrition mainstreaming across all other program components; 2. More targeted support to households with pregnant and/or lactating women with children
under five years old.
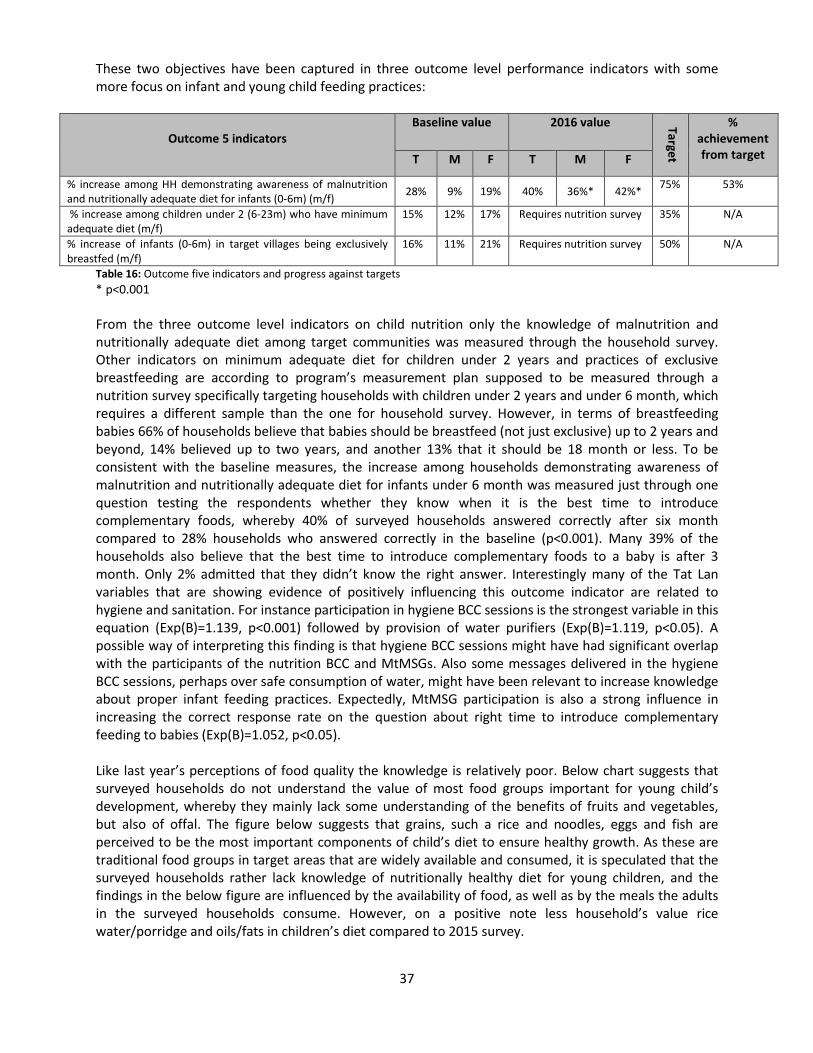
37
These two objectives have been captured in three outcome level performance indicators with some more focus on infant and young child feeding practices:
Outcome 5 indicators
Baseline value 2016 value Target
% achievement from target T M F T M F
% increase among HH demonstrating awareness of malnutrition and nutritionally adequate diet for infants (0-6m) (m/f)
28% 9% 19% 40% 36%* 42%* 75% 53%
% increase among children under 2 (6-23m) who have minimum adequate diet (m/f)
15% 12% 17% Requires nutrition survey 35% N/A
% increase of infants (0-6m) in target villages being exclusively breastfed (m/f)
16% 11% 21% Requires nutrition survey 50% N/A
Table 16: Outcome five indicators and progress against targets * p<0.001
From the three outcome level indicators on child nutrition only the knowledge of malnutrition and nutritionally adequate diet among target communities was measured through the household survey. Other indicators on minimum adequate diet for children under 2 years and practices of exclusive breastfeeding are according to program’s measurement plan supposed to be measured through a nutrition survey specifically targeting households with children under 2 years and under 6 month, which requires a different sample than the one for household survey. However, in terms of breastfeeding babies 66% of households believe that babies should be breastfeed (not just exclusive) up to 2 years and beyond, 14% believed up to two years, and another 13% that it should be 18 month or less. To be consistent with the baseline measures, the increase among households demonstrating awareness of malnutrition and nutritionally adequate diet for infants under 6 month was measured just through one question testing the respondents whether they know when it is the best time to introduce complementary foods, whereby 40% of surveyed households answered correctly after six month compared to 28% households who answered correctly in the baseline (p˂0.001). Many 39% of the households also believe that the best time to introduce complementary foods to a baby is after 3 month. Only 2% admitted that they didn’t know the right answer. Interestingly many of the Tat Lan variables that are showing evidence of positively influencing this outcome indicator are related to hygiene and sanitation. For instance participation in hygiene BCC sessions is the strongest variable in this equation (Exp(B)=1.139, p<0.001) followed by provision of water purifiers (Exp(B)=1.119, p<0.05). A possible way of interpreting this finding is that hygiene BCC sessions might have had significant overlap with the participants of the nutrition BCC and MtMSGs. Also some messages delivered in the hygiene BCC sessions, perhaps over safe consumption of water, might have been relevant to increase knowledge about proper infant feeding practices. Expectedly, MtMSG participation is also a strong influence in increasing the correct response rate on the question about right time to introduce complementary feeding to babies (Exp(B)=1.052, p<0.05). Like last year’s perceptions of food quality the knowledge is relatively poor. Below chart suggests that surveyed households do not understand the value of most food groups important for young child’s development, whereby they mainly lack some understanding of the benefits of fruits and vegetables, but also of offal. The figure below suggests that grains, such a rice and noodles, eggs and fish are perceived to be the most important components of child’s diet to ensure healthy growth. As these are traditional food groups in target areas that are widely available and consumed, it is speculated that the surveyed households rather lack knowledge of nutritionally healthy diet for young children, and the findings in the below figure are influenced by the availability of food, as well as by the meals the adults in the surveyed households consume. However, on a positive note less household’s value rice water/porridge and oils/fats in children’s diet compared to 2015 survey.

38
Figure 11: Perception of food types important for the growth and development of young children
Overall, while 91% of households believed that quantity of food is important in complementary feeding for children once the child needs more than breast milk, then only 78% valued the diversity of the food, which confirms the above where households demonstrated some lack of understanding the importance of certain food groups in child’s diet. Almost the same 77% of households believed that frequency of child feeding throughout the day is important in order to ensure healthy growth. To support child nutrition, Tat Lan has facilitated awareness raising to over 15,000 mothers of children under 2 across Tat Lan areas on child nutrition, and supported the establishment of Mother to Mother Support Groups (MtMSGs) and provided grants to 4,926 pregnant and lactating women in limited number of target villages. Mothers, but also few fathers who were interviewed through the feedback mechanism were very eager to share their new knowledge with the interviewee even without asking about it. They reported having learned enormously and believed to continue infant and young child feeding practices even beyond Tat Lan program and knowledge sharing with other women who have not participated in Tat Lan nutrition BCCs or MtMSG meetings is reportedly also very common, meaning that there is expected to be some positive spill-over effect of the program. Nutrition volunteers, who have been selected by the program to support nutrition activities, seem to be acting as knowledge agents who advise and capacity build women at any time when they have questions and/or have missed out any of the nutrition sessions. Much of the new knowledge was built around local resources, just learning how to ensure higher nutrition security. However, some community score card participants did express concerns about access to certain food items that were suggested by Tat Lan but are not accessible to the communities. As some villages are located close to the townships and bigger markets it might mean that relevance of the nutrition trainings sometimes depends on the local context. While there were some opposing opinions about the relevance of the nutrition messages, there were also some opposing opinions about the sufficiency of the maternity cash provided to them. Some women reported that they use on average 8,000MMK out of the 13,000MMK for nutritious food and save the rest for health care and other emergencies, while mostly community score card participants, the same who believed the nutrition messages not to be always relevant were concerned that the grants are not sufficient for health care since the transportation cost itself eats a significant proportion of the cash, which confirms that some villages more report would need some additional attention from Tat Lan in order to equitably benefit from the support. The same community score card groups were generally concerned with the lack of availability of health care opportunities for babies and pregnant women, and requested support from Tat Lan.
87%
39%
8%
32%38%
6%
40%
22%
44%
62%55%
41% 42%
67%
92%
29%
11%
32%25%
13%
43%
15%
34%
55%
40%
17% 15%
35%
0%
20%
40%
60%
80%
100%
2015 2016
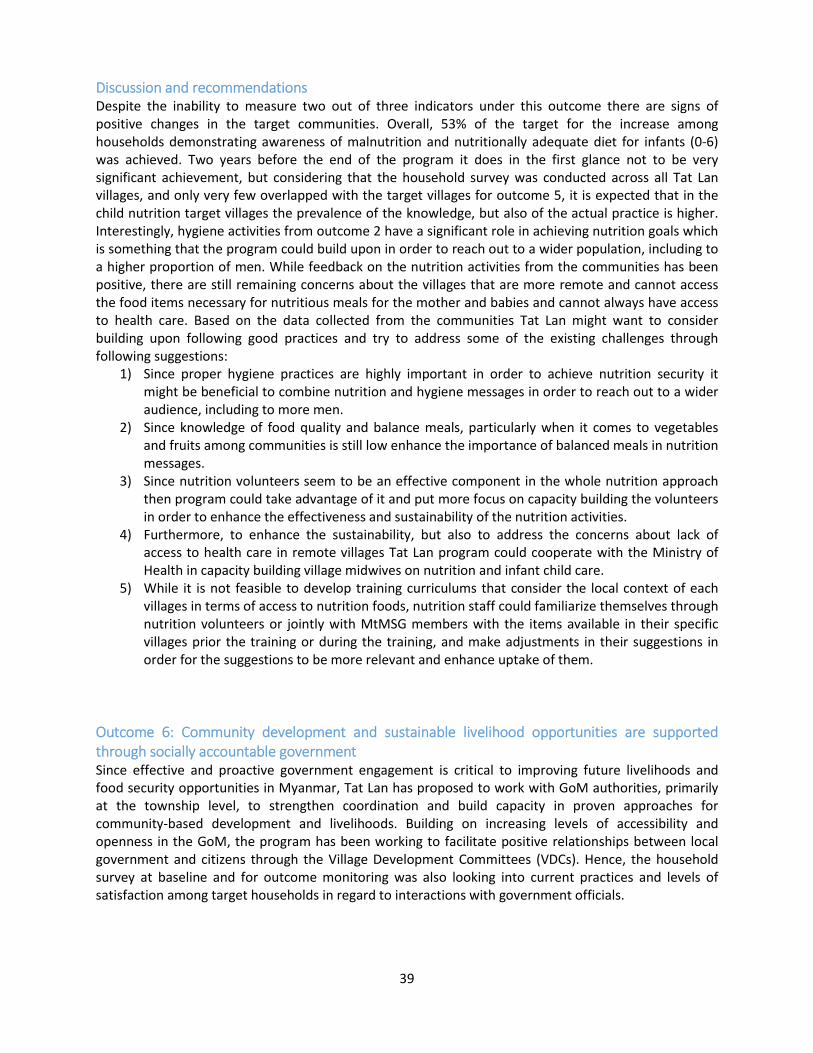
39
Discussion and recommendations Despite the inability to measure two out of three indicators under this outcome there are signs of positive changes in the target communities. Overall, 53% of the target for the increase among households demonstrating awareness of malnutrition and nutritionally adequate diet for infants (0-6) was achieved. Two years before the end of the program it does in the first glance not to be very significant achievement, but considering that the household survey was conducted across all Tat Lan villages, and only very few overlapped with the target villages for outcome 5, it is expected that in the child nutrition target villages the prevalence of the knowledge, but also of the actual practice is higher. Interestingly, hygiene activities from outcome 2 have a significant role in achieving nutrition goals which is something that the program could build upon in order to reach out to a wider population, including to a higher proportion of men. While feedback on the nutrition activities from the communities has been positive, there are still remaining concerns about the villages that are more remote and cannot access the food items necessary for nutritious meals for the mother and babies and cannot always have access to health care. Based on the data collected from the communities Tat Lan might want to consider building upon following good practices and try to address some of the existing challenges through following suggestions:
1) Since proper hygiene practices are highly important in order to achieve nutrition security it might be beneficial to combine nutrition and hygiene messages in order to reach out to a wider audience, including to more men.
2) Since knowledge of food quality and balance meals, particularly when it comes to vegetables and fruits among communities is still low enhance the importance of balanced meals in nutrition messages.
3) Since nutrition volunteers seem to be an effective component in the whole nutrition approach then program could take advantage of it and put more focus on capacity building the volunteers in order to enhance the effectiveness and sustainability of the nutrition activities.
4) Furthermore, to enhance the sustainability, but also to address the concerns about lack of access to health care in remote villages Tat Lan program could cooperate with the Ministry of Health in capacity building village midwives on nutrition and infant child care.
5) While it is not feasible to develop training curriculums that consider the local context of each villages in terms of access to nutrition foods, nutrition staff could familiarize themselves through nutrition volunteers or jointly with MtMSG members with the items available in their specific villages prior the training or during the training, and make adjustments in their suggestions in order for the suggestions to be more relevant and enhance uptake of them.
Outcome 6: Community development and sustainable livelihood opportunities are supported through socially accountable government Since effective and proactive government engagement is critical to improving future livelihoods and food security opportunities in Myanmar, Tat Lan has proposed to work with GoM authorities, primarily at the township level, to strengthen coordination and build capacity in proven approaches for community-based development and livelihoods. Building on increasing levels of accessibility and openness in the GoM, the program has been working to facilitate positive relationships between local government and citizens through the Village Development Committees (VDCs). Hence, the household survey at baseline and for outcome monitoring was also looking into current practices and levels of satisfaction among target households in regard to interactions with government officials.
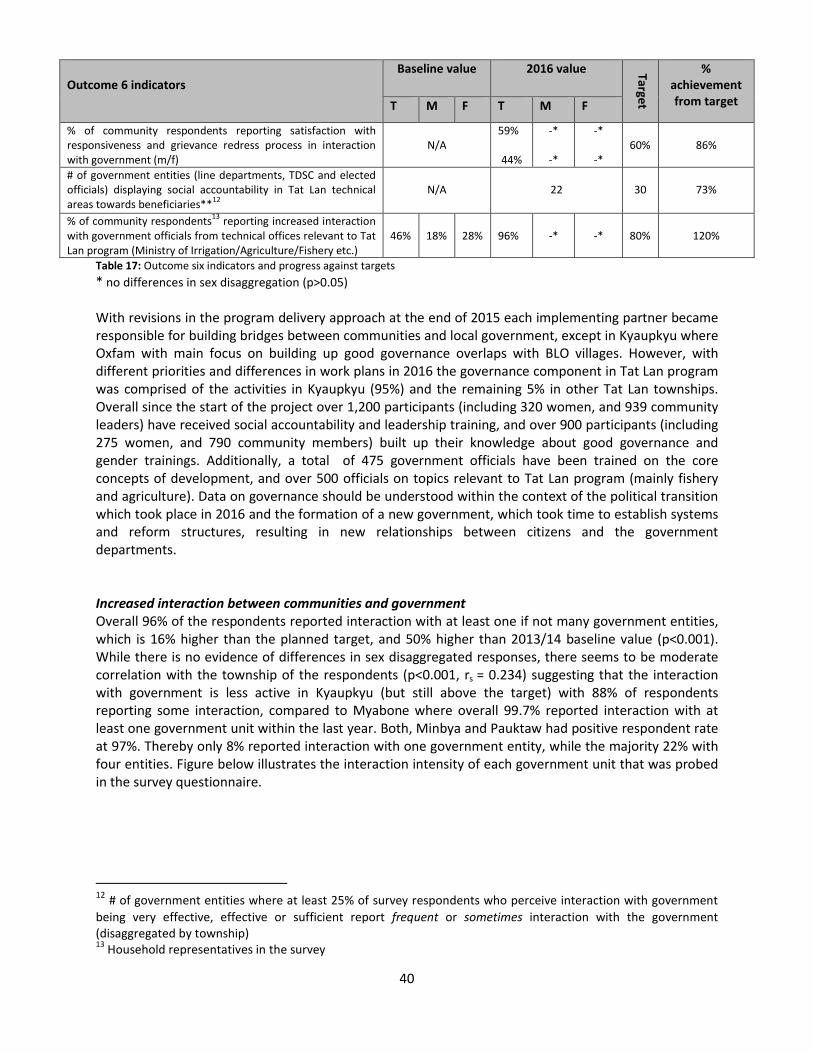
40
Outcome 6 indicators
Baseline value 2016 value Target
% achievement from target T M F T M F
% of community respondents reporting satisfaction with responsiveness and grievance redress process in interaction with government (m/f)
N/A
59% 44%
-*
-*
-*
-*
60%
86%
# of government entities (line departments, TDSC and elected officials) displaying social accountability in Tat Lan technical areas towards beneficiaries**
12
N/A
22
30
73%
% of community respondents13
reporting increased interaction with government officials from technical offices relevant to Tat Lan program (Ministry of Irrigation/Agriculture/Fishery etc.)
46%
18%
28%
96%
-*
-*
80%
120%
Table 17: Outcome six indicators and progress against targets
* no differences in sex disaggregation (p>0.05) With revisions in the program delivery approach at the end of 2015 each implementing partner became responsible for building bridges between communities and local government, except in Kyaupkyu where Oxfam with main focus on building up good governance overlaps with BLO villages. However, with different priorities and differences in work plans in 2016 the governance component in Tat Lan program was comprised of the activities in Kyaupkyu (95%) and the remaining 5% in other Tat Lan townships. Overall since the start of the project over 1,200 participants (including 320 women, and 939 community leaders) have received social accountability and leadership training, and over 900 participants (including 275 women, and 790 community members) built up their knowledge about good governance and gender trainings. Additionally, a total of 475 government officials have been trained on the core concepts of development, and over 500 officials on topics relevant to Tat Lan program (mainly fishery and agriculture). Data on governance should be understood within the context of the political transition which took place in 2016 and the formation of a new government, which took time to establish systems and reform structures, resulting in new relationships between citizens and the government departments. Increased interaction between communities and government Overall 96% of the respondents reported interaction with at least one if not many government entities, which is 16% higher than the planned target, and 50% higher than 2013/14 baseline value (p<0.001). While there is no evidence of differences in sex disaggregated responses, there seems to be moderate correlation with the township of the respondents (p<0.001, rs = 0.234) suggesting that the interaction with government is less active in Kyaupkyu (but still above the target) with 88% of respondents reporting some interaction, compared to Myabone where overall 99.7% reported interaction with at least one government unit within the last year. Both, Minbya and Pauktaw had positive respondent rate at 97%. Thereby only 8% reported interaction with one government entity, while the majority 22% with four entities. Figure below illustrates the interaction intensity of each government unit that was probed in the survey questionnaire.
12 # of government entities where at least 25% of survey respondents who perceive interaction with government
being very effective, effective or sufficient report frequent or sometimes interaction with the government (disaggregated by township) 13
Household representatives in the survey

41
Figure 12: % of respondents’ perceptions of interaction with government departments
The above figure suggests that overall interaction with government departments in Tat Lan areas continues to be rare, or sometimes non-existent. Like in 2015, the top departments that have had some interaction with the communities are the departments of education, health, land registration, agriculture, infrastructure and general administration office. By searching for statistical evidence of Tat Lan’s contribution to this indicator it appears that participation in VSLAs (Exp(B)=1.163, p<0.05) and in hygiene BCCs (Exp(B)=1.438, p<0.001), as well as in cash for work infrastructure activities (Exp(B)=0.975, p<0.05) are the strongest variables in increasing perceptions of interactions with government offices, which might mean that the communities might associate Tat Lan’s objectives with the public health objectives from Ministry of Health, with the objectives of roads and bridges (infrastructure) and department of rural development. Satisfaction with responsiveness and grievance redress process To measure the quality of the interaction between the government offices and Tat Lan communities, the program measured the percentage of community respondents reporting satisfaction with responsiveness and grievance redress process in integration with government. The survey participants were asked to rate the effectiveness of integration with government based on their experience with and perceptions of the frequency and quality of interaction with government departments. The perceptions of government’s effectiveness are showing some changes. Like in 2015 the majority perceive that the government’s effectiveness to respond to their needs and concerns is sufficient. However, in 2015 when this performance indicator was measured for the first time in Tat Lan target areas only 36% perceived government to be just sufficient but 18% perceived it to be effective, then in 2016 the prevalence of who believe that government is effective has decreased from 18% to 8% only (p<0.05), and the prevalence who believed that government’s effectiveness is just sufficient has increased to 50% (p<0.05). Furthermore, when in 2015 5% of the respondents perceived government offices to be very effective, and then in 2016 this has reduced to almost nothing (p<0.001). Overall, 59% of respondents believe in government effectiveness, which is an insignificant decrease from 60% measured in 2016. It should also be noted that 2015 was the year before the general election and it is likely that government
11.00%
29%
63%
68%
96%
97%
93%
58%
89%
62%
81%
94%
27%
34%
19%
21%
3%
2%
6%
16%
9%
27%
10%
3%
62%
37%
18%
11%
1%
1%
1%
26%
2%
11%
9%
3%
0% 10% 20% 30% 40% 50% 60% 70% 80% 90% 100%
Education
Health
Land registration
Agriculture
Irrigation
Livestock
Fishery/aquaculture
General admin.
Water supply
Roads and bridges (infra.)
Dep. of Rural Development
Tsp. Development Supporting Committee
Never Rarely or sometimes Often

departments had been more active than usual in their responsiveness to communities as part of aelection campaign.
Figure 13: % of respondents' perceptions of the effectiveness of government entities
The Tat Lan activities that have evidence of contributing to positive perceptions of government’s effectiveness in responding to community needs are hygiene BCC activities (MtMSGs (Exp(B)=1.051, p<0.05), which might be due the assumption among communities that Tat Lan is supporting the Ministry of Health to achieve its public health goals throughcommunication as assumed also above. Assumedly for the same reason regression analysis suggests that latrine construction (Exp(B)=0.816, also Tat Lan activities that increase the chances of respondents perceiving government to be responsive and effective. Interestingly VSLA membership seems to be one of the strongest predictors helping to increase the positive response rate on the questions about government’s effectiveness.correlation analysis suggests that survey respondents who have not been participating in the rest of Tat Lan activities are more likely to perceive government offices effective, compared to the survey respondents who have participated in Tat In addition to the effectiveness of the interaction with government departments, the survey also explored the practice of submitting complaints to the government departments. of the survey participants had submitted later 10% of households had done it (responses and the township of the respondents suggesting that communities in Kyaupkyu tend to be less active or having less of a need to submit complaints to the government compared to other townships as indicated in the table below submitted complaints a significant 44% perceived the grievance re
0%
5%
10%
15%
20%
25%
30%
35%
40%
45%
50%
Very effective
Effective
0.50%
8%5%
18%
42
departments had been more active than usual in their responsiveness to communities as part of a
: % of respondents' perceptions of the effectiveness of government entities
The Tat Lan activities that have evidence of contributing to positive perceptions of government’s onding to community needs are hygiene BCC activities (Exp(B)=1.044,
p<0.05), which might be due the assumption among communities that Tat Lan is ealth to achieve its public health goals through
communication as assumed also above. Assumedly for the same reason regression analysis suggests that Exp(B)=0.816, p<0.05) and provision of water purifiers (Exp(B)=0.862,
ase the chances of respondents perceiving government to be responsive and effective. Interestingly VSLA membership seems to be one of the strongest predictors helping to increase the positive response rate on the questions about government’s effectiveness.correlation analysis suggests that survey respondents who have not been participating in the rest of Tat Lan activities are more likely to perceive government offices effective, compared to the survey respondents who have participated in Tat Lan activities.
In addition to the effectiveness of the interaction with government departments, the survey also explored the practice of submitting complaints to the government departments. When in 2015 only 3% of the survey participants had submitted any complaints to any government department, then a year later 10% of households had done it (p<0.05). There is also some moderate correlation between the responses and the township of the respondents suggesting that communities in Kyaupkyu tend to be
active or having less of a need to submit complaints to the government compared to other townships as indicated in the table below (p<0.001, rs = 0.234). Furthermore, from those 10% who had submitted complaints a significant 44% perceived the grievance redress process being fair.
Sufficient Rarely effective
Not effective
Some effective
50%
25%
6%8%
36%
20%
4%
10%
2016 OM 2015 OM
departments had been more active than usual in their responsiveness to communities as part of a pre-
The Tat Lan activities that have evidence of contributing to positive perceptions of government’s Exp(B)=1.044, p<0.05) and
p<0.05), which might be due the assumption among communities that Tat Lan is behavior change
communication as assumed also above. Assumedly for the same reason regression analysis suggests that Exp(B)=0.862, p<0.05) are
ase the chances of respondents perceiving government to be responsive and effective. Interestingly VSLA membership seems to be one of the strongest predictors helping to increase the positive response rate on the questions about government’s effectiveness. Interestingly correlation analysis suggests that survey respondents who have not been participating in the rest of Tat Lan activities are more likely to perceive government offices effective, compared to the survey
In addition to the effectiveness of the interaction with government departments, the survey also When in 2015 only 3%
any complaints to any government department, then a year ). There is also some moderate correlation between the
responses and the township of the respondents suggesting that communities in Kyaupkyu tend to be active or having less of a need to submit complaints to the government compared to other
= 0.234). Furthermore, from those 10% who had dress process being fair.
DK
1%4%
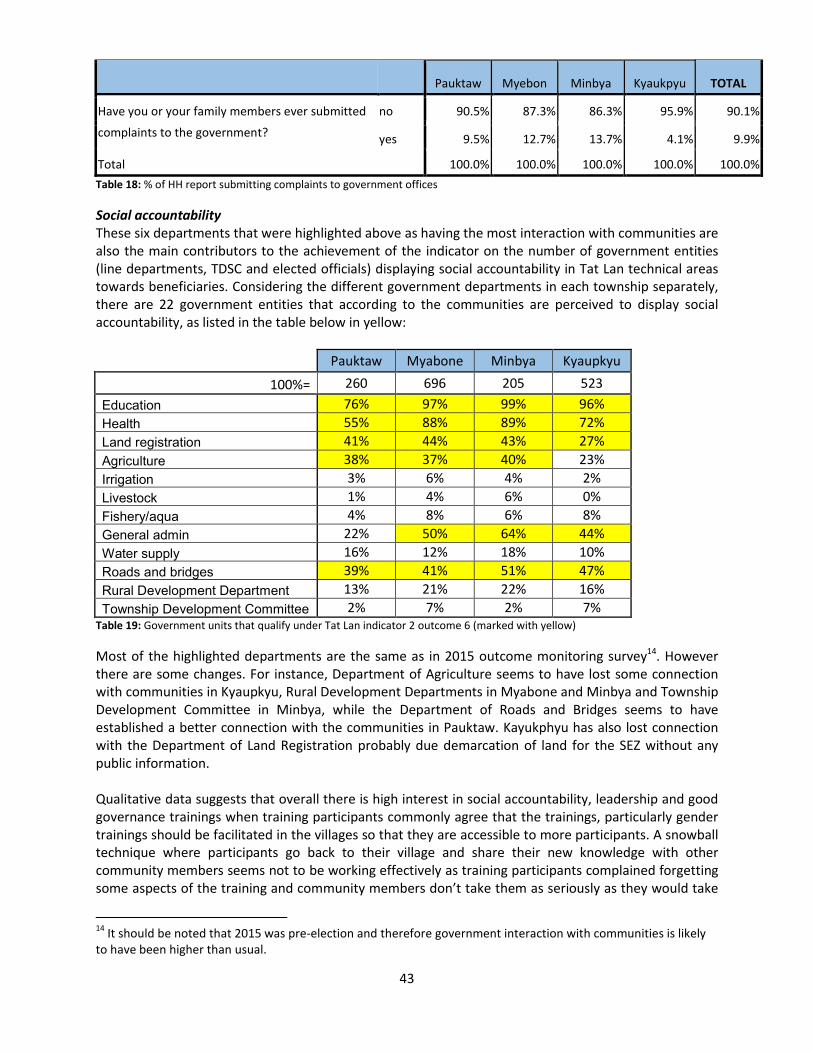
43
Pauktaw Myebon Minbya Kyaukpyu TOTAL
Have you or your family members ever submitted
complaints to the government?
no 90.5% 87.3% 86.3% 95.9% 90.1%
yes 9.5% 12.7% 13.7% 4.1% 9.9%
Total 100.0% 100.0% 100.0% 100.0% 100.0%
Table 18: % of HH report submitting complaints to government offices
Social accountability These six departments that were highlighted above as having the most interaction with communities are also the main contributors to the achievement of the indicator on the number of government entities (line departments, TDSC and elected officials) displaying social accountability in Tat Lan technical areas towards beneficiaries. Considering the different government departments in each township separately, there are 22 government entities that according to the communities are perceived to display social accountability, as listed in the table below in yellow:
Pauktaw Myabone Minbya Kyaupkyu
100%= 260 696 205 523
Education 76% 97% 99% 96%
Health 55% 88% 89% 72%
Land registration 41% 44% 43% 27%
Agriculture 38% 37% 40% 23%
Irrigation 3% 6% 4% 2%
Livestock 1% 4% 6% 0%
Fishery/aqua 4% 8% 6% 8%
General admin 22% 50% 64% 44%
Water supply 16% 12% 18% 10%
Roads and bridges 39% 41% 51% 47%
Rural Development Department 13% 21% 22% 16%
Township Development Committee 2% 7% 2% 7% Table 19: Government units that qualify under Tat Lan indicator 2 outcome 6 (marked with yellow)
Most of the highlighted departments are the same as in 2015 outcome monitoring survey14. However there are some changes. For instance, Department of Agriculture seems to have lost some connection with communities in Kyaupkyu, Rural Development Departments in Myabone and Minbya and Township Development Committee in Minbya, while the Department of Roads and Bridges seems to have established a better connection with the communities in Pauktaw. Kayukphyu has also lost connection with the Department of Land Registration probably due demarcation of land for the SEZ without any public information. Qualitative data suggests that overall there is high interest in social accountability, leadership and good governance trainings when training participants commonly agree that the trainings, particularly gender trainings should be facilitated in the villages so that they are accessible to more participants. A snowball technique where participants go back to their village and share their new knowledge with other community members seems not to be working effectively as training participants complained forgetting some aspects of the training and community members don’t take them as seriously as they would take
14
It should be noted that 2015 was pre-election and therefore government interaction with communities is likely to have been higher than usual.

44
training facilitators from Tat Lan program. To enhance effectiveness and sustainability of the trainings communities suggested sharing training materials such a pamphlets and books, and provide refresher trainings. Overall the trainings are considered by the communities very relevant empowering the participants to understand their rights and stand up for them. Particularly appreciated are trainings on agriculture law and land registration as well as on gender. On land registration several participants said that they would welcome further help with the land registration process and occasionally with the fees. In one occasion one of the training participants suggested including more youth in order to build their capacities, enhance the potential impact as well as sustainability of the trainings. Tat Lan also encouraged certain villages to establish women’s groups. Some communities where the community score card exercise was facilitated saw those groups ineffective with no clear role or mandate in the village. In other communities where women leaders have emerged and where there has been support from men, and community members have been more supportive to gender equality, the women groups continue working well independently mobilizing women to participate in public discussions and decision making. However, even in those villages most participants agreed that in rural areas it is very difficult for women to feel a sense of accomplishment and feel under-valued as there are only very limited livelihood opportunities. While there are elements of sustainability of the trainings brought out by the participants from the communities, there is also clear acknowledgment that SCOs would need continues support to build up their capacities to effectively support the communities, particularly in Kyaupkyu to help the citizens to stand for their rights and entitlements once the Special Economic Zone is established. So far some feedback received from CSO members who participated in Tat Lan trainings was about appreciation for the imitative to include CSOs in Tat Lan, but there was also some concern over the relevance of those trainings to CSOs.
Discussion and recommendations In the first glance it seems that Tat Lan is well on track with achieving its targets set for each for at least two of its performance indicators. The target for the prevalence of community respondents reporting interaction with government officials from technical offices relevant to Tat Lan program has been achieved by 120%. However, the quality but most importantly the frequency of this interaction would require some additional exploration through qualitative data collection and analysis. References to the quality of interaction were made under the first performance indicator that measured the satisfaction with the interaction, when only 59% reported that they are satisfied with the government work. Thereby government’s grievance redress process is barely existent and still needs time to be built up. With this in mind the analysis above under outcome 6 but mainly under outcome 1 leaves an understanding that there is still significant gap between the communities and government offices, and that Tat Lan program is perceived as an extension of government offices, and not necessarily linking government to the communities across the four townships. While Tat Lan projects in Kyaupkyu, including a project that channeled its focus on building up good governance, will end at the beginning of 2017 and governance work will be taken forward in 2017 by the other townships, some of the recommendations that the remaining projects could consider are following:
1) Develop activities where VDC or sub-committee members and government officials have a joint
role in planning and/or participating in to build stronger and sustainable linkages between the
community leadership and local government departments/offices. Activities could best be
developed around the areas that communities have listed as Tat Lan program not being able to
meet the needs of the communities due its limitations in scope (e.g. land registration, irrigation
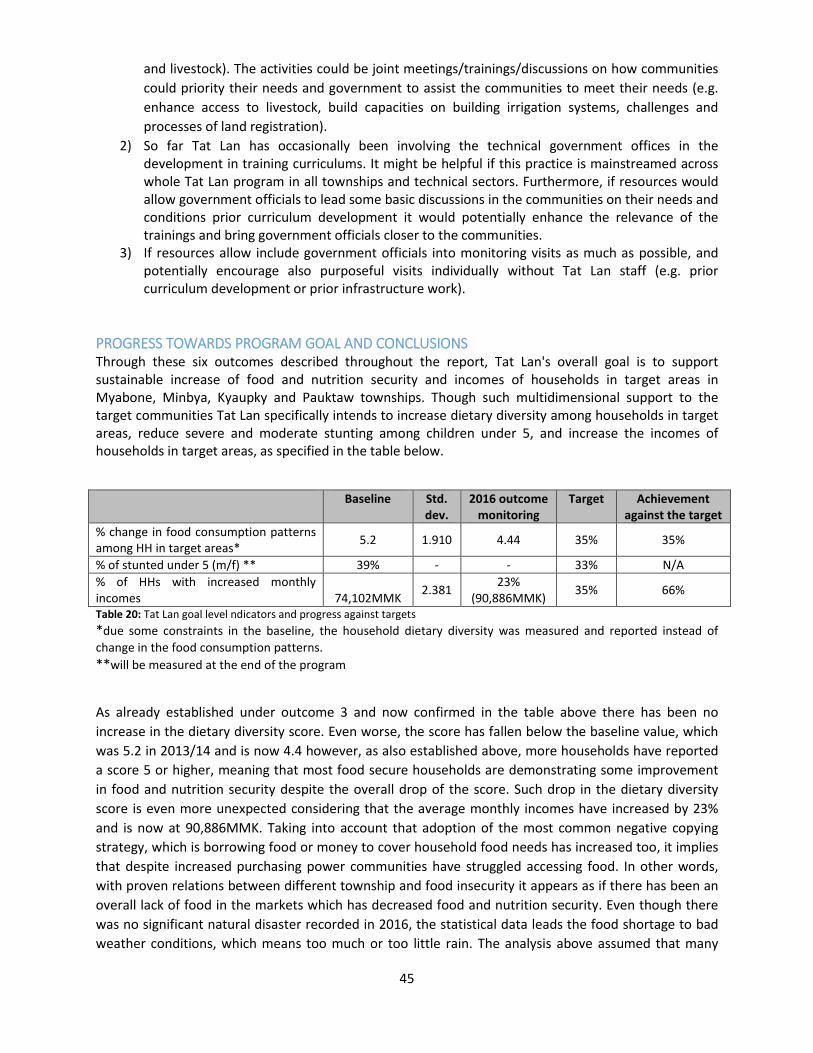
45
and livestock). The activities could be joint meetings/trainings/discussions on how communities
could priority their needs and government to assist the communities to meet their needs (e.g.
enhance access to livestock, build capacities on building irrigation systems, challenges and
processes of land registration).
2) So far Tat Lan has occasionally been involving the technical government offices in the development in training curriculums. It might be helpful if this practice is mainstreamed across whole Tat Lan program in all townships and technical sectors. Furthermore, if resources would allow government officials to lead some basic discussions in the communities on their needs and conditions prior curriculum development it would potentially enhance the relevance of the trainings and bring government officials closer to the communities.
3) If resources allow include government officials into monitoring visits as much as possible, and potentially encourage also purposeful visits individually without Tat Lan staff (e.g. prior curriculum development or prior infrastructure work).
PROGRESS TOWARDS PROGRAM GOAL AND CONCLUSIONS Through these six outcomes described throughout the report, Tat Lan's overall goal is to support sustainable increase of food and nutrition security and incomes of households in target areas in Myabone, Minbya, Kyaupky and Pauktaw townships. Though such multidimensional support to the target communities Tat Lan specifically intends to increase dietary diversity among households in target areas, reduce severe and moderate stunting among children under 5, and increase the incomes of households in target areas, as specified in the table below.
Baseline Std. dev.
2016 outcome monitoring
Target Achievement against the target
% change in food consumption patterns among HH in target areas*
5.2 1.910 4.44 35% 35%
% of stunted under 5 (m/f) ** 39% - - 33% N/A
% of HHs with increased monthly incomes
74,102MMK
2.381 23%
(90,886MMK) 35% 66%
Table 20: Tat Lan goal level ndicators and progress against targets
*due some constraints in the baseline, the household dietary diversity was measured and reported instead of
change in the food consumption patterns. **will be measured at the end of the program
As already established under outcome 3 and now confirmed in the table above there has been no
increase in the dietary diversity score. Even worse, the score has fallen below the baseline value, which
was 5.2 in 2013/14 and is now 4.4 however, as also established above, more households have reported
a score 5 or higher, meaning that most food secure households are demonstrating some improvement
in food and nutrition security despite the overall drop of the score. Such drop in the dietary diversity
score is even more unexpected considering that the average monthly incomes have increased by 23%
and is now at 90,886MMK. Taking into account that adoption of the most common negative copying
strategy, which is borrowing food or money to cover household food needs has increased too, it implies
that despite increased purchasing power communities have struggled accessing food. In other words,
with proven relations between different township and food insecurity it appears as if there has been an
overall lack of food in the markets which has decreased food and nutrition security. Even though there
was no significant natural disaster recorded in 2016, the statistical data leads the food shortage to bad
weather conditions, which means too much or too little rain. The analysis above assumed that many
46
households are still struggling to cope with the aftermath of the 2015 floods, meaning that the crop
yield got damaged and was low, and hence did not generate sufficient seeds for the 2016 planting
season. Usually lack of seeds reflects in significantly higher prices too, which was the case when rice and
paddy prices skyrocketed in 215 across Myanmar. This might to some extent also explain the increased
incomes, which were gained after the sale of paddy with high prices. Alternatively too small rainfall in
2016 might have also had a role in increased food and nutrition insecurity. This proves that rural
households in Rakhine are still too vulnerable to natural disasters and Tat Lan would need to focus more
on resilience building and disaster risk reduction management in order to sustainably minimize the
negative impact of potential natural disasters. This would include reviewing available infrastructure and
strategies of safely store paddy seeds, review and where needed support establishment of information
flows to warn the communities about upcoming risks, include DRR messaging into financial education
components in order to set up individual but perhaps also some communal savings for such situations,
etc.
However, such vulnerability to natural disasters does not mean that Tat Lan has not created any impact.
Analysis across all the sectors above gives sufficient evidence of positive impact. There is strong
evidence that increased contact time with Tat Lan activities significantly increases the positive
outcomes. Overall the most influential activities have been embankment construction and support to
the construction of household latrines, hygiene and nutrition BCCs, agriculture trainings and paddy seed
provision, and groups that have brought women together, such as VSLAs and MtMSG. All these activities
have resulted in one or another way in improved practices or even in social changes where women have
a more integral role. Nevertheless, acknowledging the complexity of the livelihoods in rural Rakhine
there are still gaps. For instance, fishery sector would need a very complex tailored approach in order to
support the sustainability of this sector. Also there seems to be increasing need for support with access
to livestock and establishment of irrigation systems which would hugely support improvement of food,
nutrition and livelihood security.