task force meeting 2 june 12, 2012 - yellowknife file• rfp / cannor proposal (city to lead) 3. eco...
TRANSCRIPT

Task Force Meeting 2 June 12, 2012

AGENDA 1. APPROVAL OF MINUTES
2. REVIEW OF PROJECT OBJECTIVES (10min) • RFP / CanNor Proposal (City to Lead)
3. ECO HOUSING SUSTAINABILITY FRAMEWORK (40min) • Review Matrix / Confirm Criteria (Task Force Discussion)
4. OPEN HOUSE 1 & 2 (20min)
5. SKILLS & CAPACITY BUILDING OBJECTIVES (20min)
6. PREVIOUS BUSINESS (15min) • Other Opportunities and Partnerships
7. OTHER BUSINESS (15min)
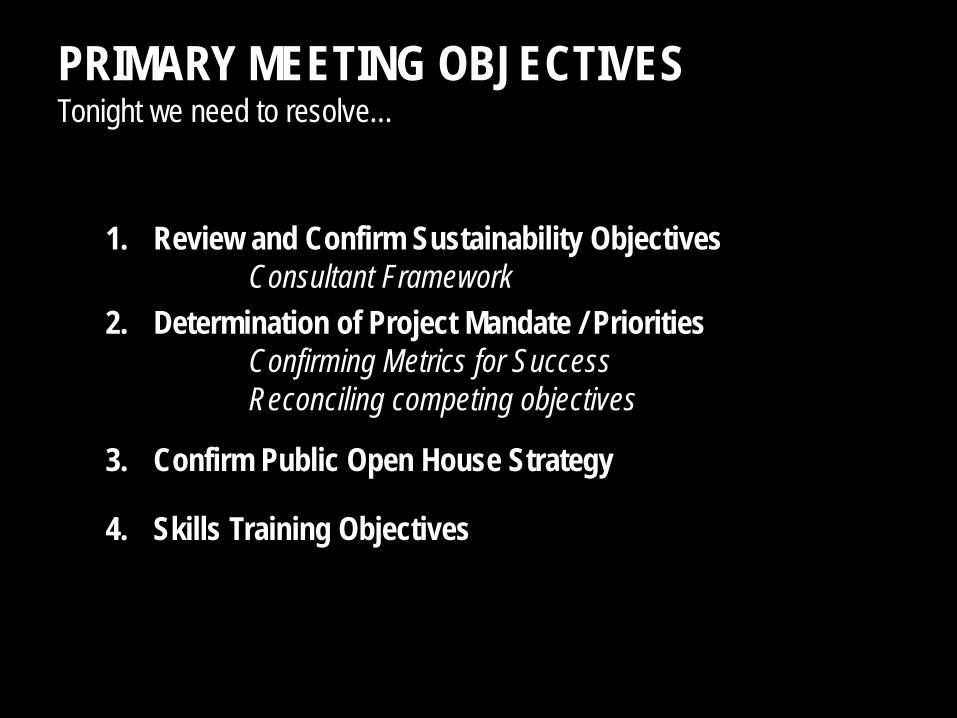
PRIMARY MEETING OBJECTIVES Tonight we need to resolve…
1. Review and Confirm Sustainability Objectives Consultant Framework
2. Determination of Project Mandate / Priorities Confirming Metrics for Success Reconciling competing objectives
3. Confirm Public Open House Strategy
4. Skills Training Objectives

2. REVIEW OF PROJECT OBJECTIVES
Eco Housing Vision “The Yellowknife Eco-house will make downtown living attractive and affordable by providing an opportunity to live, work and play that enhances the well-being of residents, the community and our environment.” - Eco Housing Workshop Report
RECAP: ECO HOUSING
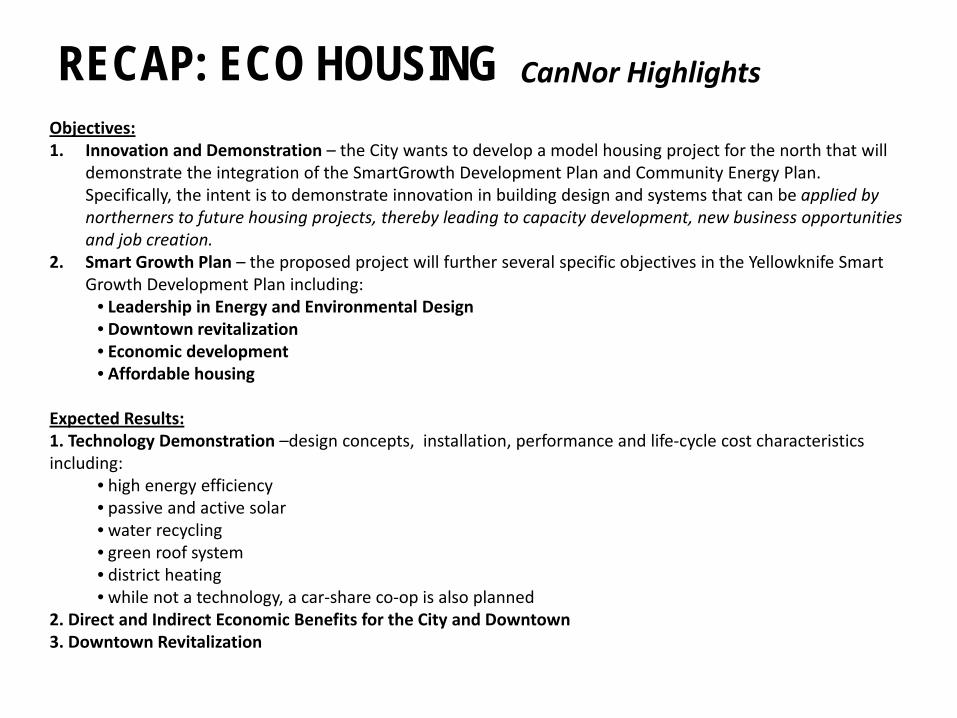
Objectives: 1. Innovation and Demonstration – the City wants to develop a model housing project for the north that will
demonstrate the integration of the SmartGrowth Development Plan and Community Energy Plan. Specifically, the intent is to demonstrate innovation in building design and systems that can be applied by northerners to future housing projects, thereby leading to capacity development, new business opportunities and job creation.
2. Smart Growth Plan – the proposed project will further several specific objectives in the Yellowknife Smart Growth Development Plan including:
• Leadership in Energy and Environmental Design • Downtown revitalization • Economic development • Affordable housing
Expected Results: 1. Technology Demonstration –design concepts, installation, performance and life-cycle cost characteristics including:
• high energy efficiency • passive and active solar • water recycling • green roof system • district heating • while not a technology, a car-share co-op is also planned
2. Direct and Indirect Economic Benefits for the City and Downtown 3. Downtown Revitalization
RECAP: ECO HOUSING CanNor Highlights

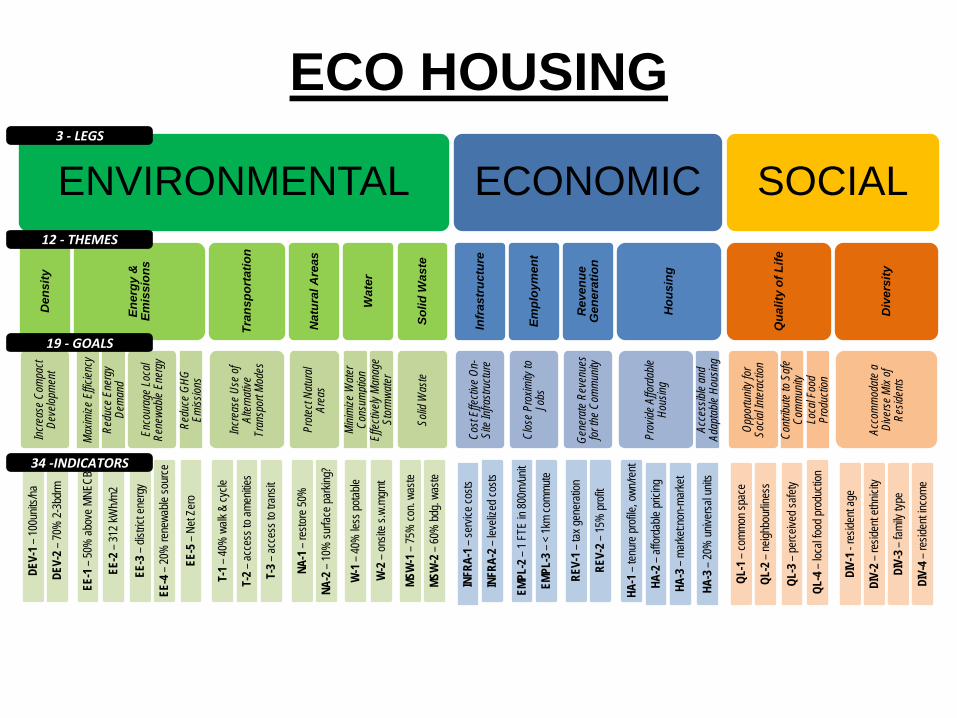
3. ECO HOUSING FRAMEWORK Summary of RFP / Eco Housing Workshop Report / Eco Housing Sustainability Framework
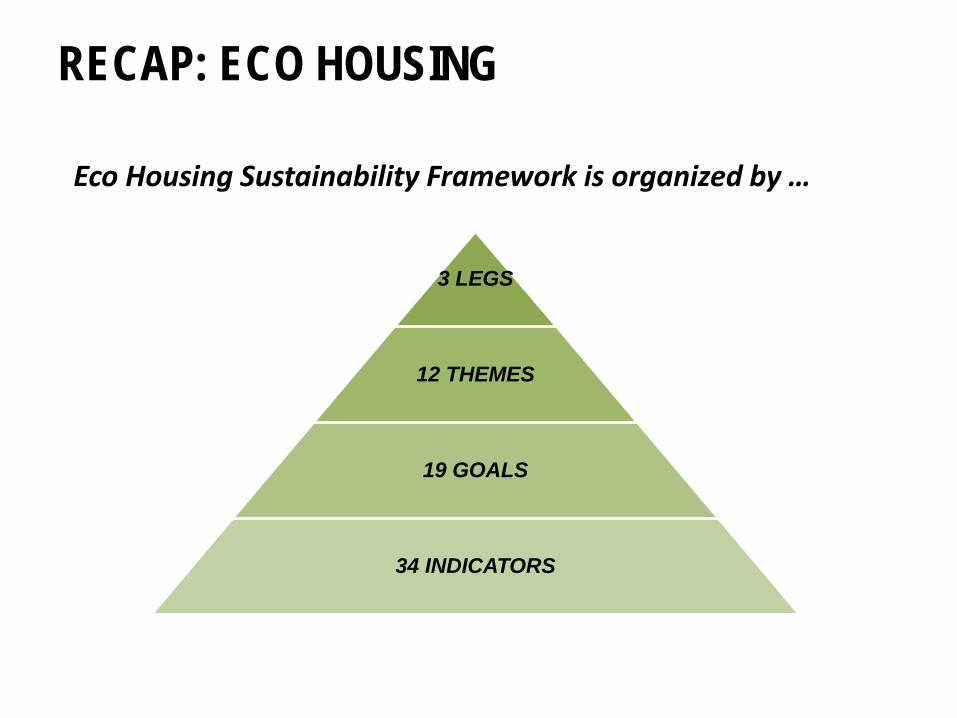
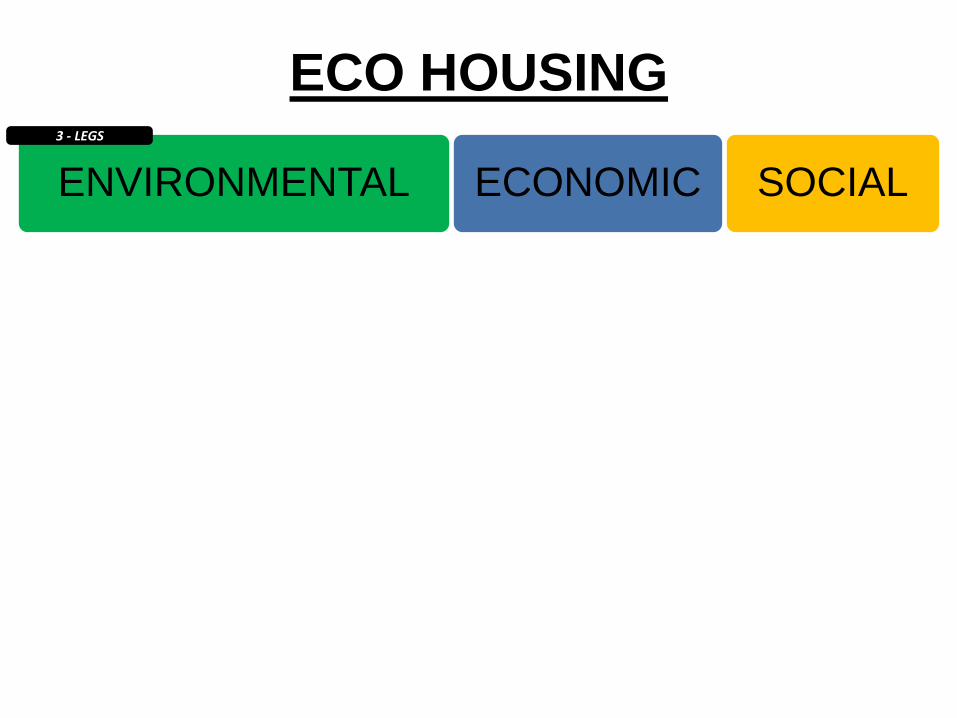
3 LEGS
12 THEMES
19 GOALS
34 INDICATORS
Eco Housing Sustainability Framework is organized by …
RECAP: ECO HOUSING
ECO HOUSING
ENVIRONMENTAL
Den
sity
In
crea
se C
ompa
ct De
velop
men
t DE
V-1 –
100u
nits/h
a
DEV-
2 – 70
% 2
-3bd
rm
Ener
gy &
Em
issi
ons
Max
imize
Effic
iency
EE
-1 –
50%
abo
ve M
NECB
Re
duce
Ene
rgy
Dem
and
EE-2
– 31
2 kW
h/m2
Enco
urag
e Lo
cal
Rene
wable
Ene
rgy
EE-3
– dis
trict e
nerg
y
EE-4
– 20
% re
newa
ble so
urce
Re
duce
GHG
Em
ission
s EE
-5 –
Net Z
ero
Tran
spor
tatio
n In
crea
se U
se o
f Al
tern
ative
Tr
ansp
ort M
odes
T-1 –
40%
walk
& cy
cle
T-2 –
acce
ss to
amen
ities
T-3 –
acce
ss to
tran
sit
Nat
ural
Are
as
Prot
ect N
atur
al Ar
eas
NA-1
– re
store
50%
NA-2
– 10
% su
rface
parki
ng?
Wat
er
Mini
mize
Wat
er
Cons
umpt
ion
W-1
– 40
% le
ss po
table
Effe
ctive
ly M
anag
e St
orm
wate
r W
-2 –
onsit
e s.w
.mgm
t
Solid
Was
te
Solid
Was
te
MSW
-1 –
75%
con.
waste
MSW
-2 –
60%
bdg
. was
te
ECONOMIC
Infr
astr
uctu
re
Cost
Effe
ctive
On-
Site
Infra
struc
ture
IN
FRA-
1 – se
rvice
costs
INFR
A-2 –
leve
lized
costs
Empl
oym
ent
Clos
e Pr
oxim
ity to
Jo
bs
EMPL
-2 –
1 FTE
in 80
0m/un
it
EMPL
-3 –
< 1k
m co
mmute
Rev
enue
G
ener
atio
n Ge
nera
te R
even
ues
for t
he C
omm
unity
RE
V-1 –
tax g
ener
ation
REV-
2 – 15
% p
rofit
Hou
sing
Pr
ovide
Affo
rdab
le Ho
using
HA-1
– ten
ure p
rofile
, own
/rent
HA-2
– aff
orda
ble p
ricing
HA-3
– ma
rket:n
on-m
arke
t
Acce
ssibl
e and
Ad
apta
ble H
ousin
g HA
-3 –
20%
univ
ersa
l unit
s
SOCIAL
Qua
lity
of L
ife
Oppo
rtunit
y for
So
cial In
tera
ction
QL
-1 –
comm
on sp
ace
QL-2
- ne
ighbo
urlin
ess
Cont
ribut
e to
Saf
e Co
mm
unity
QL
-3 –
perce
ived s
afety
QL-4
– foo
d pro
ducti
on
Div
ersi
ty
Acco
mm
odat
e a
Dive
rse M
ix of
Re
siden
ts
DIV-
1 - re
siden
t age
DIV-
2 – re
siden
t ethn
icity
DIV-
3 – fa
mily
type
DIV-
4 – re
siden
t inco
me
3 - LEGS
19 - GOALS
34 -INDICATORS

ECO HOUSING
ENVIRONMENTAL
Den
sity
In
crea
se C
ompa
ct De
velop
men
t DE
V-1 –
100u
nits/h
a
DEV-
2 – 70
% 2
-3bd
rm
Ener
gy &
Em
issi
ons
Max
imize
Effic
iency
EE
-1 –
50%
abo
ve M
NECB
Re
duce
Ene
rgy
Dem
and
EE-2
– 31
2 kW
h/m2
Enco
urag
e Lo
cal
Rene
wable
Ene
rgy
EE-3
– dis
trict e
nerg
y
EE-4
– 20
% re
newa
ble so
urce
Re
duce
GHG
Em
ission
s EE
-5 –
Net Z
ero
Tran
spor
tatio
n In
crea
se U
se o
f Al
tern
ative
Tr
ansp
ort M
odes
T-1 –
40%
walk
& cy
cle
T-2 –
acce
ss to
amen
ities
T-3 –
acce
ss to
tran
sit
Nat
ural
Are
as
Prot
ect N
atur
al Ar
eas
NA-1
– re
store
50%
NA-2
– 10
% su
rface
parki
ng?
Wat
er
Mini
mize
Wat
er
Cons
umpt
ion
W-1
– 40
% le
ss po
table
Effe
ctive
ly M
anag
e St
orm
wate
r W
-2 –
onsit
e s.w
.mgm
t
Solid
Was
te
Solid
Was
te
MSW
-1 –
75%
con.
waste
MSW
-2 –
60%
bdg
. was
te
ECONOMIC
Infr
astr
uctu
re
Cost
Effe
ctive
On-
Site
Infra
struc
ture
IN
FRA-
1 – se
rvice
costs
INFR
A-2 –
leve
lized
costs
Empl
oym
ent
Clos
e Pr
oxim
ity to
Jo
bs
EMPL
-2 –
1 FTE
in 80
0m/un
it
EMPL
-3 –
< 1k
m co
mmute
Rev
enue
G
ener
atio
n Ge
nera
te R
even
ues
for t
he C
omm
unity
RE
V-1 –
tax g
ener
ation
REV-
2 – 15
% p
rofit
Hou
sing
Pr
ovide
Affo
rdab
le Ho
using
HA-1
– ten
ure p
rofile
, own
/rent
HA-2
– aff
orda
ble p
ricing
HA-3
– ma
rket:n
on-m
arke
t
Acce
ssibl
e and
Ad
apta
ble H
ousin
g HA
-3 –
20%
univ
ersa
l unit
s
SOCIAL
Qua
lity
of L
ife
Oppo
rtunit
y for
So
cial In
tera
ction
QL
-1 –
comm
on sp
ace
QL-2
- ne
ighbo
urlin
ess
Cont
ribut
e to
Saf
e Co
mm
unity
QL
-3 –
perce
ived s
afety
QL-4
– foo
d pro
ducti
on
Div
ersi
ty
Acco
mm
odat
e a
Dive
rse M
ix of
Re
siden
ts
DIV-
1 - re
siden
t age
DIV-
2 – re
siden
t ethn
icity
DIV-
3 – fa
mily
type
DIV-
4 – re
siden
t inco
me
3 - LEGS
12 - THEMES
34 -INDICATORS

ECO HOUSING
ENVIRONMENTAL
Den
sity
In
crea
se C
ompa
ct De
velop
men
t DE
V-1 –
100u
nits/h
a
DEV-
2 – 70
% 2
-3bd
rm
Ener
gy &
Em
issi
ons
Max
imize
Effic
iency
EE
-1 –
50%
abo
ve M
NECB
Re
duce
Ene
rgy
Dem
and
EE-2
– 31
2 kW
h/m2
Enco
urag
e Lo
cal
Rene
wable
Ene
rgy
EE-3
– dis
trict e
nerg
y
EE-4
– 20
% re
newa
ble so
urce
Re
duce
GHG
Em
ission
s EE
-5 –
Net Z
ero
Tran
spor
tatio
n In
crea
se U
se o
f Al
tern
ative
Tr
ansp
ort M
odes
T-1 –
40%
walk
& cy
cle
T-2 –
acce
ss to
amen
ities
T-3 –
acce
ss to
tran
sit
Nat
ural
Are
as
Prot
ect N
atur
al Ar
eas
NA-1
– re
store
50%
NA-2
– 10
% su
rface
parki
ng?
Wat
er
Mini
mize
Wat
er
Cons
umpt
ion
W-1
– 40
% le
ss po
table
Effe
ctive
ly M
anag
e St
orm
wate
r W
-2 –
onsit
e s.w
.mgm
t
Solid
Was
te
Solid
Was
te
MSW
-1 –
75%
con.
waste
MSW
-2 –
60%
bdg
. was
te
ECONOMIC
Infr
astr
uctu
re
Cost
Effe
ctive
On-
Site
Infra
struc
ture
IN
FRA-
1 – se
rvice
costs
INFR
A-2 –
leve
lized
costs
Empl
oym
ent
Clos
e Pr
oxim
ity to
Jo
bs
EMPL
-2 –
1 FTE
in 80
0m/un
it
EMPL
-3 –
< 1k
m co
mmute
Rev
enue
G
ener
atio
n Ge
nera
te R
even
ues
for t
he C
omm
unity
RE
V-1 –
tax g
ener
ation
REV-
2 – 15
% p
rofit
Hou
sing
Pr
ovide
Affo
rdab
le Ho
using
HA-1
– ten
ure p
rofile
, own
/rent
HA-2
– aff
orda
ble p
ricing
HA-3
– ma
rket:n
on-m
arke
t
Acce
ssibl
e and
Ad
apta
ble H
ousin
g HA
-3 –
20%
univ
ersa
l unit
s
SOCIAL
Qua
lity
of L
ife
Oppo
rtunit
y for
So
cial In
tera
ction
QL
-1 –
comm
on sp
ace
QL-2
– ne
ighbo
urlin
ess
Cont
ribut
e to
Saf
e Co
mm
unity
QL
-3 –
perce
ived s
afety
Loca
l Foo
d Pr
oduc
tion
QL-4
– loc
al foo
d pro
ducti
on
Div
ersi
ty
Acco
mm
odat
e a
Dive
rse M
ix of
Re
siden
ts
DIV-
1 - re
siden
t age
DIV-
2 – re
siden
t ethn
icity
DIV-
3 – fa
mily
type
DIV-
4 – re
siden
t inco
me
3 - LEGS
12 - THEMES
19 - GOALS
34 -INDICATORS
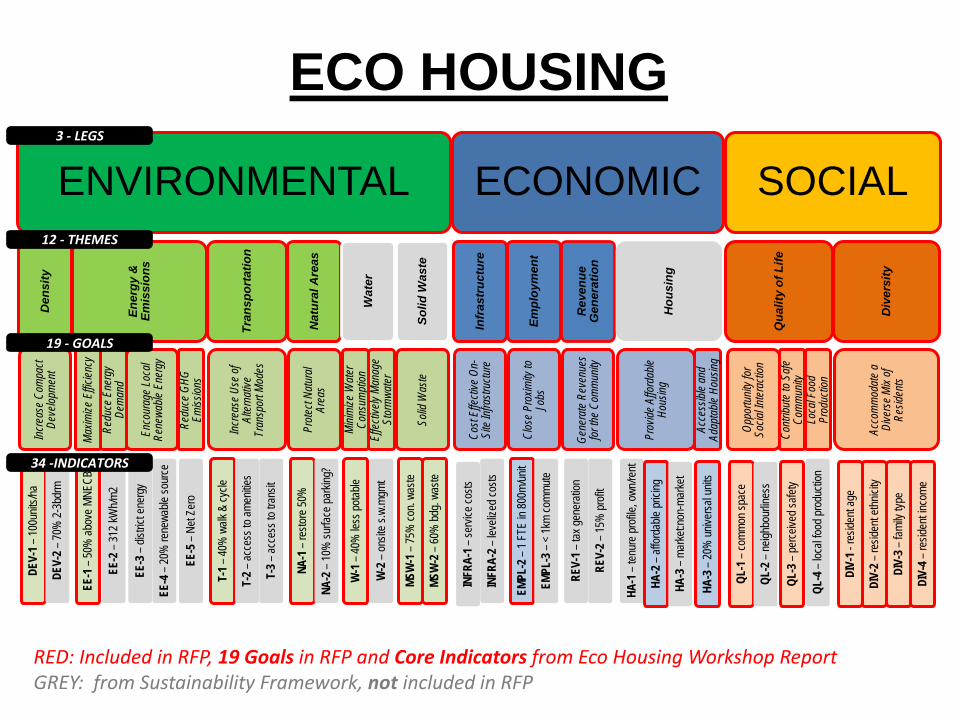
RED: Included in RFP, 19 Goals in RFP and Core Indicators from Eco Housing Workshop Report GREY: from Sustainability Framework, not included in RFP
SUMMARY
ENVIRONMENTAL
Den
sity
In
crea
se C
ompa
ct De
velop
men
t DE
V-1 –
100u
nits/h
a
DEV-
2 – 70
% 2
-3bd
rm
Ener
gy &
Em
issi
ons
Max
imize
Effic
iency
EE
-1 –
50%
abo
ve M
NECB
Re
duce
Ene
rgy
Dem
and
EE-2
– 31
2 kW
h/m2
Enco
urag
e Lo
cal
Rene
wable
Ene
rgy
EE-3
– dis
trict e
nerg
y
EE-4
– 20
% re
newa
ble so
urce
Re
duce
GHG
Em
ission
s EE
-5 –
Net Z
ero
Tran
spor
tatio
n In
crea
se U
se o
f Al
tern
ative
Tr
ansp
ort M
odes
T-1 –
40%
walk
& cy
cle
T-2 –
acce
ss to
amen
ities
T-3 –
acce
ss to
tran
sit
Nat
ural
Are
as
Prot
ect N
atur
al Ar
eas
NA-1
– re
store
50%
NA-2
– 10
% su
rface
parki
ng?
Wat
er
Mini
mize
Wat
er
Cons
umpt
ion
W-1
– 40
% le
ss po
table
Effe
ctive
ly M
anag
e St
orm
wate
r W
-2 –
onsit
e s.w
.mgm
t
Solid
Was
te
Solid
Was
te
MSW
-1 –
75%
con.
waste
MSW
-2 –
60%
bdg
. was
te
ECONOMIC
Infr
astr
uctu
re
Cost
Effe
ctive
On-
Site
Infra
struc
ture
IN
FRA-
1 – se
rvice
costs
INFR
A-2 –
leve
lized
costs
Empl
oym
ent
Clos
e Pr
oxim
ity to
Jo
bs
EMPL
-2 –
1 FTE
in 80
0m/un
it
EMPL
-3 –
< 1k
m co
mmute
Rev
enue
G
ener
atio
n Ge
nera
te R
even
ues
for t
he C
omm
unity
RE
V-1 –
tax g
ener
ation
REV-
2 – 15
% p
rofit
Hou
sing
Pr
ovide
Affo
rdab
le Ho
using
HA-1
– ten
ure p
rofile
, own
/rent
HA-2
– aff
orda
ble p
ricing
HA-3
– ma
rket:n
on-m
arke
t
Acce
ssibl
e and
Ad
apta
ble H
ousin
g HA
-3 –
20%
univ
ersa
l unit
s
SOCIAL
Qua
lity
of L
ife
Oppo
rtunit
y for
So
cial In
tera
ction
QL
-1 –
comm
on sp
ace
QL-2
– ne
ighbo
urlin
ess
Cont
ribut
e to
Saf
e Co
mm
unity
QL
-3 –
perce
ived s
afety
Loca
l Foo
d Pr
oduc
tion
QL-4
– loc
al foo
d pro
ducti
on
Div
ersi
ty
Acco
mm
odat
e a
Dive
rse M
ix of
Re
siden
ts
DIV-
1 - re
siden
t age
DIV-
2 – re
siden
t ethn
icity
DIV-
3 – fa
mily
type
DIV-
4 – re
siden
t inco
me
3 - LEGS
12 - THEMES
19 - GOALS
34 -INDICATORS

SUMMARY
ENVIRONMENTAL
Den
sity
In
crea
se C
ompa
ct De
velop
men
t DE
V-1 –
100u
nits/h
a
DEV-
2 – 70
% 2
-3bd
rm
Ener
gy &
Em
issi
ons
Max
imize
Effic
iency
EE
-1 –
50%
abo
ve M
NECB
Re
duce
Ene
rgy
Dem
and
EE-2
– 31
2 kW
h/m2
Enco
urag
e Lo
cal
Rene
wable
Ene
rgy
EE-3
– dis
trict e
nerg
y
EE-4
– 20
% re
newa
ble so
urce
Re
duce
GHG
Em
ission
s EE
-5 –
Net Z
ero
Tran
spor
tatio
n In
crea
se U
se o
f Al
tern
ative
Tr
ansp
ort M
odes
T-1 –
40%
walk
& cy
cle
T-2 –
acce
ss to
amen
ities
T-3 –
acce
ss to
tran
sit
Nat
ural
Are
as
Prot
ect N
atur
al Ar
eas
NA-1
– re
store
50%
site
NA-2
– 10
% su
rface
parki
ng?
Wat
er
Mini
mize
Wat
er
Cons
umpt
ion
W-1
– 40
% le
ss po
table
Effe
ctive
ly M
anag
e St
orm
wate
r W
-2 –
onsit
e s.w
.mgm
t
Solid
Was
te
Solid
Was
te
MSW
-1 –
75%
con.
waste
MSW
-2 –
60%
bdg
. was
te
ECONOMIC
Infr
astr
uctu
re
Cost
Effe
ctive
On-
Site
Infra
struc
ture
IN
FRA-
1 – se
rvice
costs
INFR
A-2 –
leve
lized
costs
Empl
oym
ent
Clos
e Pr
oxim
ity to
Jo
bs
EMPL
-2 –
1 FTE
in 80
0m/un
it
EMPL
-3 –
< 1k
m co
mmute
Rev
enue
G
ener
atio
n Ge
nera
te R
even
ues
for t
he C
omm
unity
RE
V-1 –
tax g
ener
ation
REV-
2 – 15
% p
rofit
Hou
sing
Pr
ovide
Affo
rdab
le Ho
using
HA-1
– ten
ure p
rofile
, own
/rent
HA-2
– aff
orda
ble p
ricing
HA-3
– ma
rket:n
on-m
arke
t
Acce
ssibl
e and
Ad
apta
ble H
ousin
g HA
-3 –
20%
univ
ersa
l unit
s
SOCIAL
Qua
lity
of L
ife
Oppo
rtunit
y for
So
cial In
tera
ction
QL
-1 –
comm
on sp
ace
QL-2
– ne
ighbo
urlin
ess
Cont
ribut
e to
Saf
e Co
mm
unity
QL
-3 –
perce
ived s
afety
Loca
l Foo
d Pr
oduc
tion
QL-4
– loc
al foo
d pro
ducti
on
Div
ersi
ty
Acco
mm
odat
e a
Dive
rse M
ix of
Re
siden
ts
DIV-
1 - re
siden
t age
DIV-
2 – re
siden
t ethn
icity
DIV-
3 – fa
mily
type
DIV-
4 – re
siden
t inco
me
3 - LEGS
12 - THEMES
19 - GOALS
34 -INDICATORS
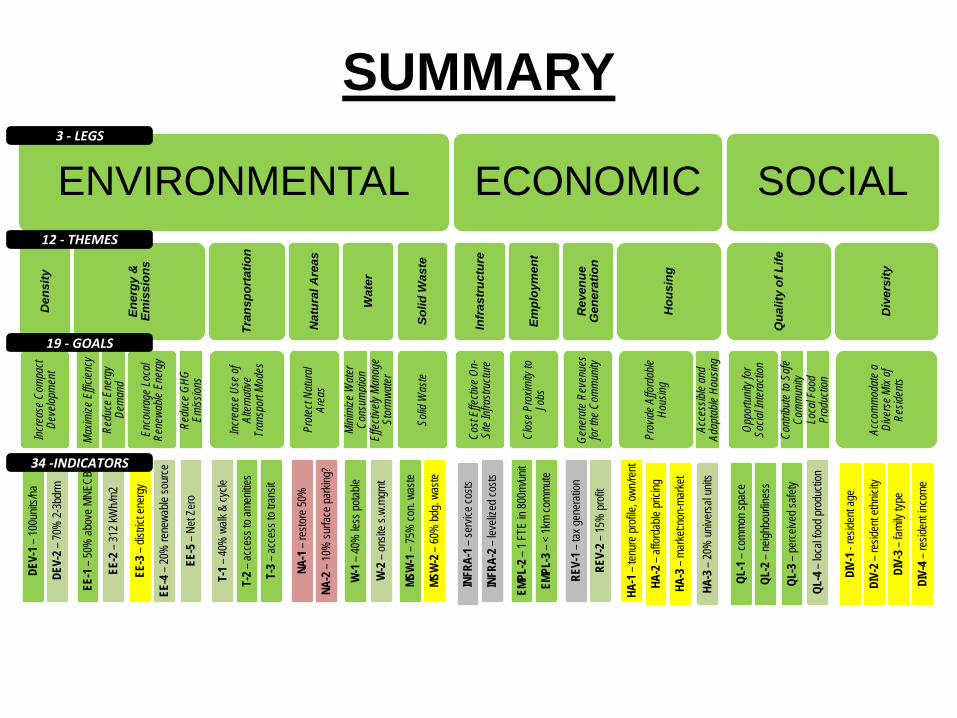
Achievable
To Strive For/Aim to Exceed
Beyond Control
Presents Challenge
Not Applicable
Included in RFP’s Core Indicator

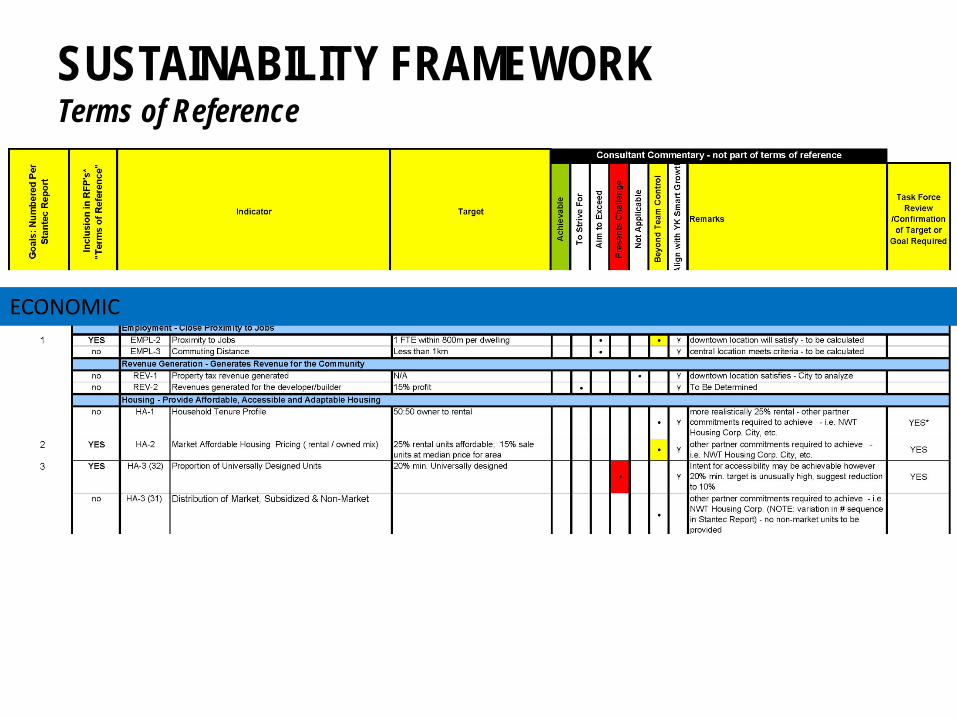
SUSTAINABILITY FRAMEWORK Terms of Reference
ENVIRONMENTAL

SUSTAINABILITY FRAMEWORK Terms of Reference
ENVIRONMENTAL
SUSTAINABILITY FRAMEWORK Terms of Reference
ECONOMIC

SUSTAINABILITY FRAMEWORK Terms of Reference
SOCIAL

Sustainability and Innovation
Skills and Capacity Building
Affordability
RECONCILING COMPETING OBJECTIVES
For example: •Enhanced Technology Demonstration versus Affordable High Performance ‘low tech’ •Flagship Precedent versus Marketable Revitalization Precedent •Intensive on-site Skills Development versus Affordable Prefabrication/select Skills Development
4. OPEN HOUSE 1 & 2
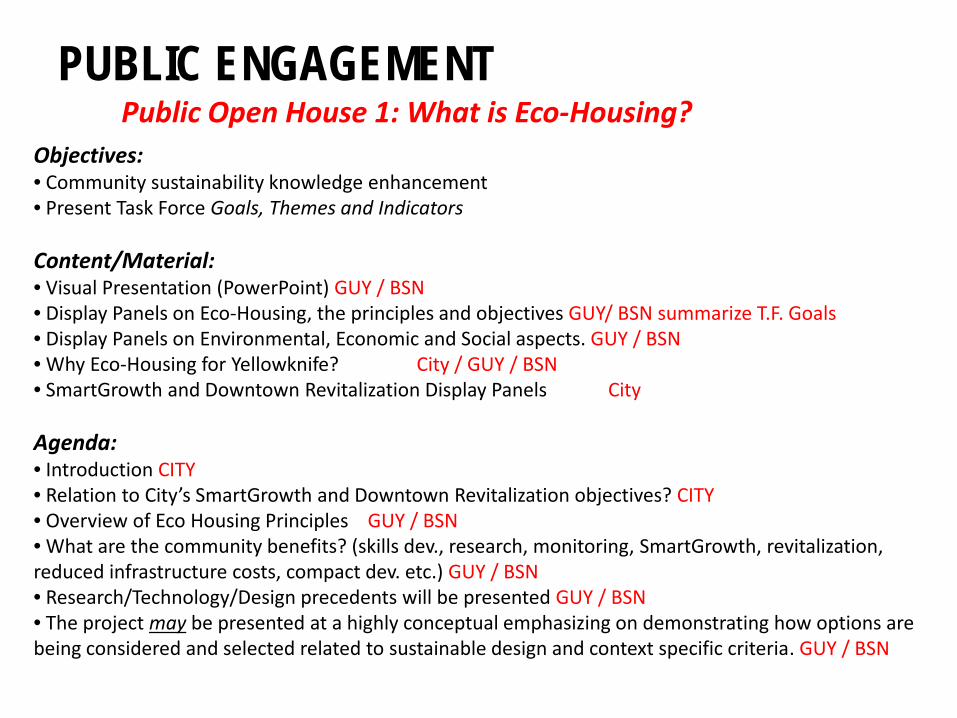
PUBLIC ENGAGEMENT Public Open House 1: What is Eco-Housing?
Objectives: • Community sustainability knowledge enhancement • Present Task Force Goals, Themes and Indicators Content/Material: • Visual Presentation (PowerPoint) GUY / BSN • Display Panels on Eco-Housing, the principles and objectives GUY/ BSN summarize T.F. Goals • Display Panels on Environmental, Economic and Social aspects. GUY / BSN • Why Eco-Housing for Yellowknife? City / GUY / BSN • SmartGrowth and Downtown Revitalization Display Panels City Agenda: • Introduction CITY • Relation to City’s SmartGrowth and Downtown Revitalization objectives? CITY • Overview of Eco Housing Principles GUY / BSN • What are the community benefits? (skills dev., research, monitoring, SmartGrowth, revitalization, reduced infrastructure costs, compact dev. etc.) GUY / BSN • Research/Technology/Design precedents will be presented GUY / BSN • The project may be presented at a highly conceptual emphasizing on demonstrating how options are being considered and selected related to sustainable design and context specific criteria. GUY / BSN

*
*
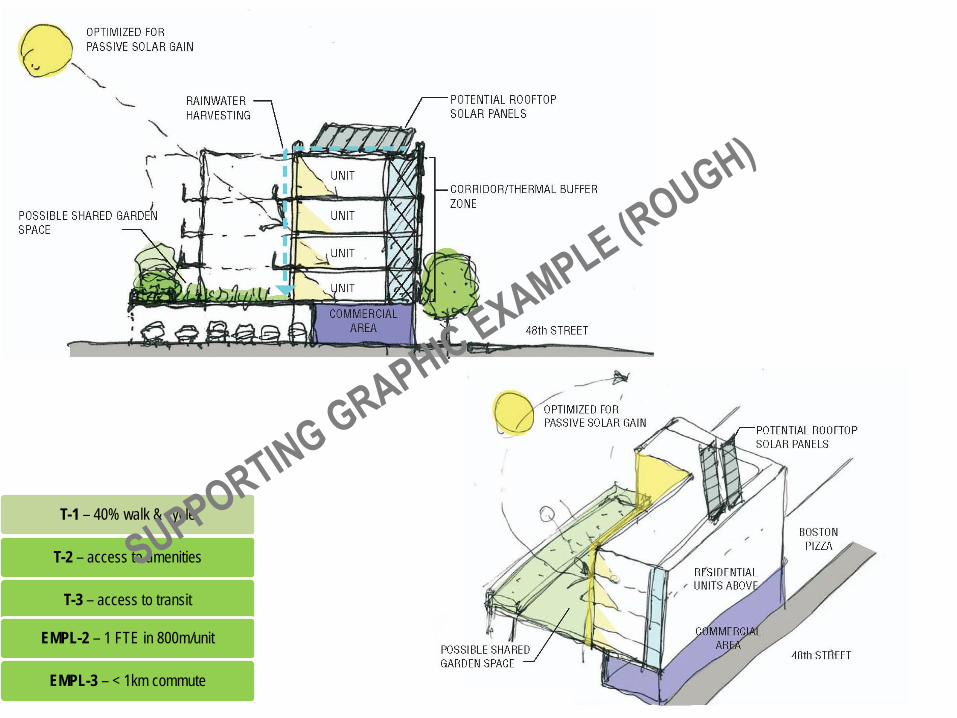
T-1 – 40% walk & cycle
T-2 – access to amenities
T-3 – access to transit
EMPL-2 – 1 FTE in 800m/unit
EMPL-3 – < 1km commute
T-1 – 40% walk & cycle
T-2 – access to amenities
T-3 – access to transit
EMPL-2 – 1 FTE in 800m/unit
EMPL-3 – < 1km commute

PUBLIC ENGAGEMENT Public Open House 2: Realizing Eco-Housing Principles
Objectives: • Knowledge and capacity building • Understanding of Process and decision making
Content/Material (To Be Determined) Proposed Focus (Agenda To Be Determined) • Focus on reviewing the project progress to date. • Project presented with emphasis on demonstrating how options were considered and selected related to sustainable design criteria and benchmarks established by the Task Force • Sharing project lessons, information, data, modeling and life-cycle assessment results • Enabling the public to understand more clearly why certain features are selected in the project, as well as understand community benefits and economic spin-offs.
Preliminary
5. SKILLS & CAPACITY BUILDING

SKILLS & CAPACITY BUILDING SUMMARY
1. Public Open House: raise knowledge and understanding of sustainable housing, SmartGrowth practices in Yellowknife and Eco Housing Goals 2. Baseline Surveys: survey of local contractor and development community 3. Design Skills: 1 or 2 invited for internship with local design firm 4. Municipal Skills: a) possible internship, b) how can this project prepare City officials for future high performance multi-unit buildings and meeting efficiency bylaws 5. Development Skills: assist with sales and marketing training 6. Construction Skills & Training: a) utilization of local labour requirements, b) apprenticing and skills development as part of tender process 7. Inspection Skills & Quality Control: a) Holmes Inspection Training, b) Quality Control/Construction Documentation training
… applied by northerners to future housing projects, thereby leading to capacity development, new business opportunities and job creation. (CanNor Objective)

8. Construction and Development Industry Public Meeting/Open House a) presentation of lessons learned, life-cycle cost analysis overview, performance modeling, present Eco Housing Goals and SmartGrowth principles, b) possible expansion into conference format if support exists 9. Facility Tour: Education Public Tour Day – 3 Tours 10. Eco-Housing Report: Publicly available report at conclusion focused on lessons learned and how to implement future projects 11. Project Monitoring: a) 2 year period for monitoring: using recorded and available energy use data, compiled and compared to understand actual performance, payback and fine tune building systems, b) looking for partner for 3rd party involvement & verification 12. Post Occupancy Survey: conducted amongst residents to understand what it is like living there, what worked and didn’t, what has been most beneficial, etc
SKILLS & CAPACITY BUILDING SUMMARY
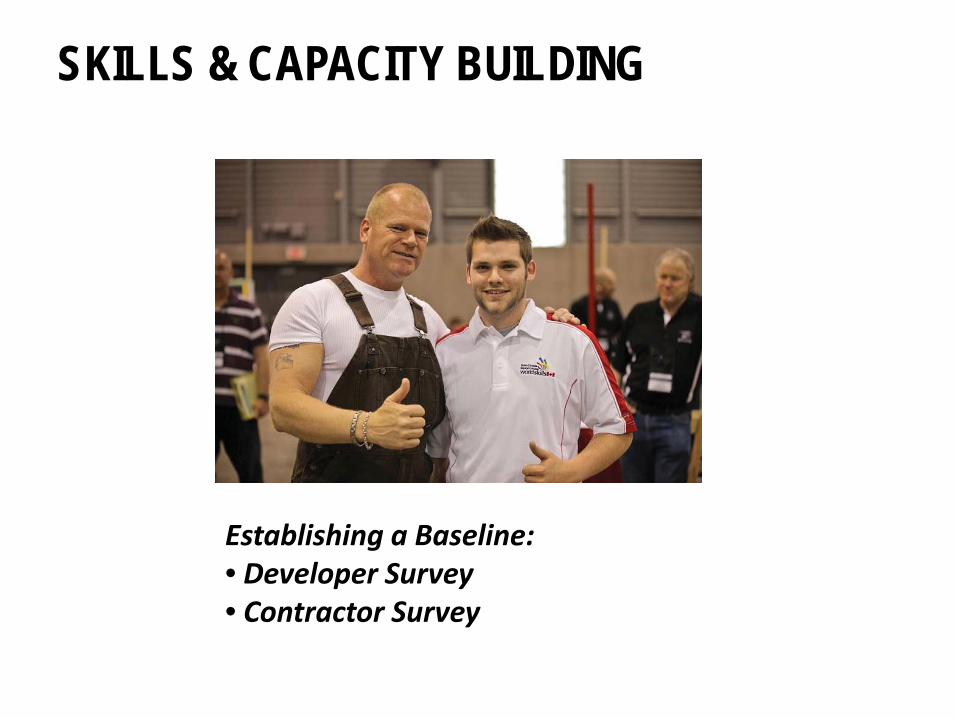
SKILLS & CAPACITY BUILDING
Establishing a Baseline: • Developer Survey • Contractor Survey

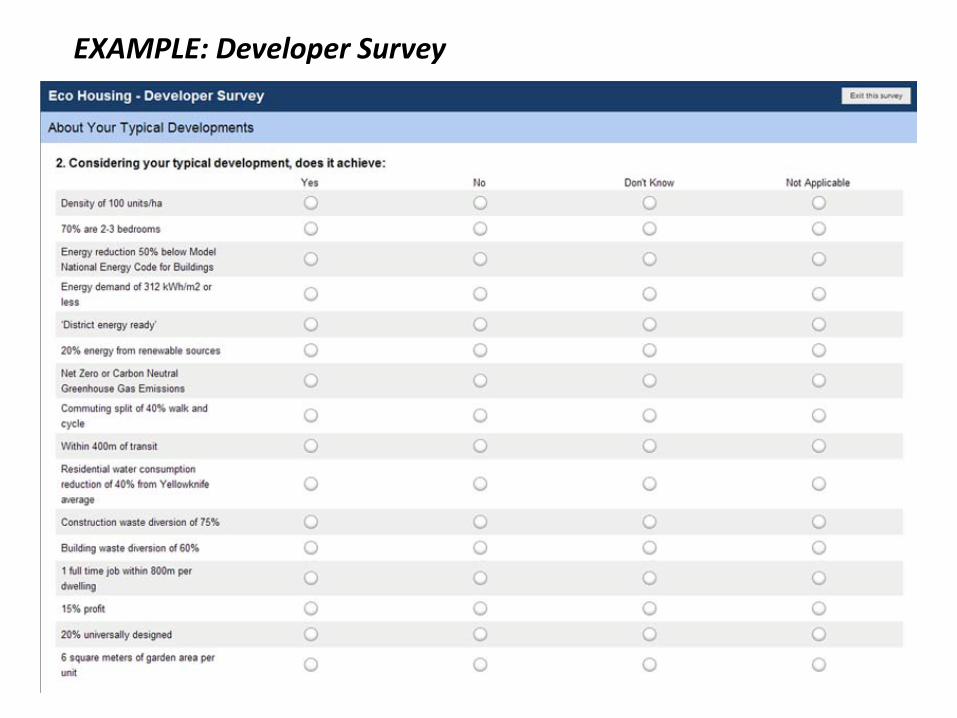
EXAMPLE: Developer Survey
This is to ensure 1 response per company.
please
EXAMPLE: Developer Survey
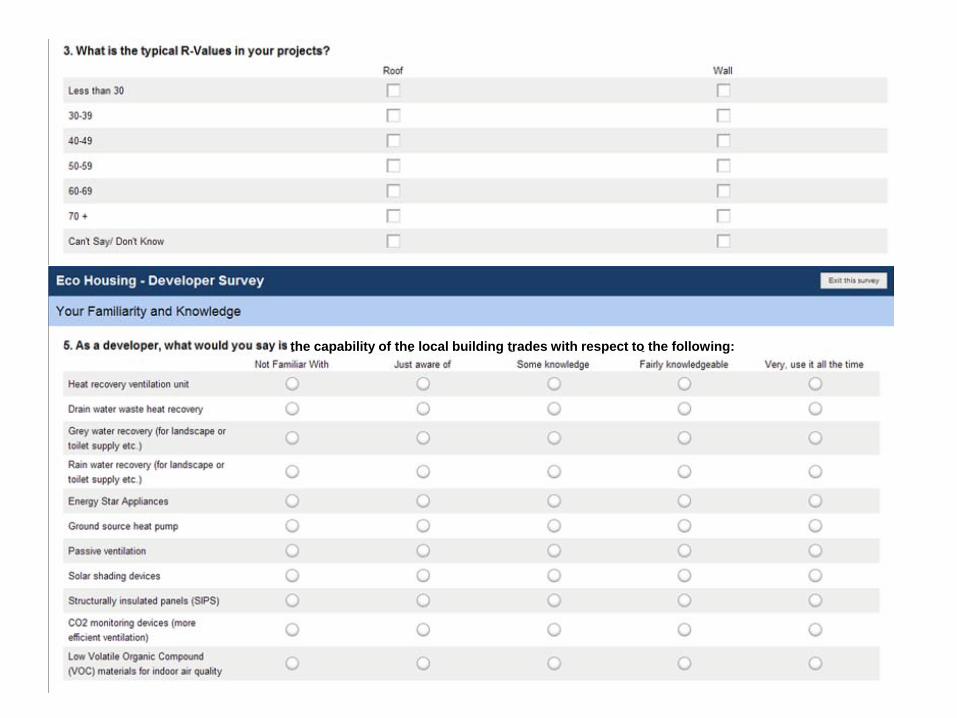
the capability of the local building trades with respect to the following:

EXAMPLE: Developer Survey

EXAMPLE: Developer Survey
What are the top ways to deliver more sustainable housing in Yellowknife?
6. PREVIOUS BUSINESS

HOW ELSE CAN WE MAXIMIZE PROJECT VALUE WHILE MULTIPLYING PROJECT BENEFITS?
WHAT OTHER OPPORTUNITIES EXIST?
a. Skills Canada, CMHC, Arctic Energy Alliance, NWT Housing Corp. etc. (what agencies could be involved and in what capacities?) b. Private sector suppliers/partnerships

Sustainability and Innovation
Skills and Capacity Building
Affordability
CONFIRMING METRICS FOR SUCCESS
TBD

7. OTHER BUSINESS
