task 5 networks and assignment public and private
TRANSCRIPT
Task 5 Networks and Assignment – Public and Private
Scope
This section covers the specification of the ART3 road and PT networks and assignments and their
implementation. While the implementation of the model as a whole is Task 15, the networks and
assignments are required prior to the implementation of other components in order to provide
generalised costs for estimating the distribution/mode split models.
A new roading network for ART3 has always been intended, whereas our original proposal for PT
was to make use of the APT network in conjunction with ART3 or APT zones. Following discussions
with the ARC it has been agreed that new PT networks will be developed for use with both ART3 and
APT, using the ART3 roading network plus some additional PT-only network where necessary. It is
intended that the new PT network would draw on the APT model for various PT attributes as far as
possible.
Hence it is necessary that the specification and then the development of these networks are carried out
jointly where necessary.
Additionally, with the approval of the ARC, the road network is to be largely developed as part of
Transit New Zealand’s evaluation of the Western Ring Route (WRR) as a toll project. This will occur
during the latter part of 2006 and involve Tasks 5.1 to 5.8, with the testing and calibration focussed on
the WRR corridor. The ATM2 project will then complete the network development for ART3, that is,
for the whole of the network.
The overall approach for the assignments will be to use the roading and PT assignment procedures
within EMME/2.
For roading generalised cost equilibrium assignments will be used. These will allow for both all-
vehicle assignment (single class) and multi-class assignments; the latter enabling separate assignment
of vehicle-type and/or purposes which can reflect differences in time and operating cost values. It is
expected that the single class assignment will be used in most applications.
The PT assignment will be of all modes and separation into PT sub-modes will occur as part of this.
The specific tasks described in the following sections are:
Task 5.1 Network Inventory Data
Task 5.2 Develop Road Networks (Links)
Task 5.3 Develop Road Network Delay Modelling
Task 5.4 Develop Peaking Factors
Task 5.5 Develop Motorway Delay Procedures
Task 5.6 Auto Access Functions
Task 5.7 Design of Private Vehicle Assignment
Task 5.8 Implementation and Testing of Private Vehicle Assignment
Task 5.9 PT Travel Time Functions

Task 5.10 Park-and-Ride
Task 5.11 Design of PT Attributes and Assignment
Task 5.12 Develop PT Networks (Links)
Task 5.13 Coding of PT Services
Task 5.14 Implementation and Testing of PT Network and Assignment
Task 5.15 Networks and Assignment Report
The development of the networks and assignments has, necessarily, a close interaction with other
tasks such as:
Definition of time periods
Zone system and model extent
Implementation

Task 5.1 Network Inventory Data
Purpose
This task involves collation/collection of the network inventory data required to develop the base year
roading and PT networks.
Inputs
GIS database – census road centrelines, TLA boundaries, traffic zone boundaries
District Plan hierarchy maps
Transit NZ route data sheets (State Highway only)
Aerial photos
Street maps
Sample free-speed surveys (with sample from each link-type classification)
Inventory surveys at key junctions
TLA data on clearways, bus lanes, HOV lanes
Processing
Assemble and collate all data sources/bases and store in a convenient form. Specifically:
network data that varies by time period will be collated (clearways, bus lanes, tidal-flow
facilities), and identified by link i-j reference (this data is held by TAs/RCAs);
a library of the layout details for all key junctions will be developed. This should include a sketch
of the layout, including lanes, lane markings, basic lane dimensions (widths, short lanes etc),
phase diagrams etc. These will be sketched on template forms (then scanned into electronic
format). An electronic storage system will be developed for the junction library.
Develop a robust link-type classification, identifying:
TLA
RCA
Road environment (service road, local road, arterial, rural, expressway etc)
Posted speed-limit
Using this classification allocate link-free-speeds, capacities and volume delay functions, and the
generic relationship between link type/speed limit and the free-speed. Free-speeds by link-type should
be based on a sample of free-speed surveys.
Outputs
Link-type classification of all links
RCA/TLA/DP Hierarchy classification of all links
Generic allocations of free-speeds and capacities by link type
Junction layout library

Task 5.2 Develop Road Networks (Links)
Scope
The network will generally include all roads down to major collector road, but with minor collector
roads added where required to support the zone system. Networks will be developed to avoid multiple
centroid connectors, but only to a level of refinement supported by the zone system.
New networks will be developed from the GIS centreline data rather than from any existing networks.
Additional nodes will be included on longer links at significant landmarks (such as local road
intersections). This would assist in avoiding later refinement of the networks that might be required
for the PT network and any associated more refined zone system implemented with APT.
Node numbering would be based on geographical clusters, broadly in line with current practice.
Inputs
GIS inventory data
Additional inventory data
Revised zone system
Current networks for ART2 and project models
Road network already developed for ART3 (in ARC GIS)
Link-type classification
Processing
Identify node locations and links from GIS centrelines and export co-ordinates and link numbers
Import skeleton networks into EMME/2
Load centrelines as background and identify visual anomalies in network shape
Define modes
Allocate lanes, modes and link types
Develop zone connectors
Identify and code period-specific coding (clearways, tidal lanes etc)
Run EMME/2 link validation macro to identify errors (including review of link lengths against
calculated distance)
Assign a unit matrix and identify empty links and un-attached zones
Notes:
NZTM grid reference used for co-ordinates
Include walk-links on 1-way streets and in Auckland CBD
The AM peak networks to be the reference networks, with period-specific amendments added for
other periods
Reference network master copies to be stored in a spreadsheet, and imported to EMME/2
Outputs
Base road networks stored in both spreadsheet and EMME/2 format
Node numbering protocols
Task 5.3 Develop Road Network Delay Modelling
Scope
The modelling of road speeds and delays will be similar to WTSM, with link speed-flow relationships
and approach-based intersection delays. Intersection delays will be calculated as a function of
opposing flow (where the zone system is refined enough). Where the zone/network detail is not
refined enough to support interactive calculations of capacities based on opposing flows (such as
inner CBD areas), fixed capacities will be used.
Key components will be as follows:
Akcelik volume-delay functions on all links
Link parameters (capacity, free speed etc) allocated globally based on defined link type
Akcelik volume-delay functions for turn delays
Turn capacities based on simplified ASRaTM1-type procedures
Special procedures for modelling over-capacity conditions on the motorway (see Task 5.5 below)
Of these 5 components, the first 4 are essentially updates to or developments of the procedures
presently used in either or both of the Auckland and Wellington city models. The fifth is a new
development.
Issues considered during development of these functions will include:
Consistency with requirements of equilibrium assignment
Minimisation of assignment run-times
Avoidance of ‘hard’ delay functions, which could increase model sensitivity and instability
Development of delay functions which reasonably reflect the key locations and extent of delays,
but also reflect the strategic-demand nature of the models (i.e. models that reflect the hierarchical
structure of models in Auckland)
Development of simplified coding systems which reflect the strategic nature of the model
The procedures intended for junction modelling have been implemented elsewhere along with
procedures for achieving satisfactory convergence. Convergence and stability will be achieved in
assignment through damping procedures.
Inputs
WTSM delay functions
ASRaTM delay macros17
HCM and AUSTROADS capacity guides
aaSIDRA software manual
Akcelik volume-delay papers
Processing
Code Akcelik volume-delay functions for links
1 These are the EMME/2 macros developed for modelling turn capacities and delays for the Auckland sub-
regional models. They compute capacities based on opposing flows, as simplification of which was adopted at
major intersections in WTSM.

Allocate generic link parameters based on link type (with parameters based on reference
guidelines and other calibrated models using these functions)
Develop simplified junction coding procedures (similar to WTSM)
Code junctions
Develop assignment procedures, including warm-start and feed-back loops for intersection
capacities
Test delay functions using sub-area demands in isolated areas and ‘validate’ capacity and delay
predictions with other models (e.g. aaSIDRA or local project models)
Test procedures to optimise convergence and run-time
Document road network coding procedures
Outputs
Coded road networks
Road network coding procedures
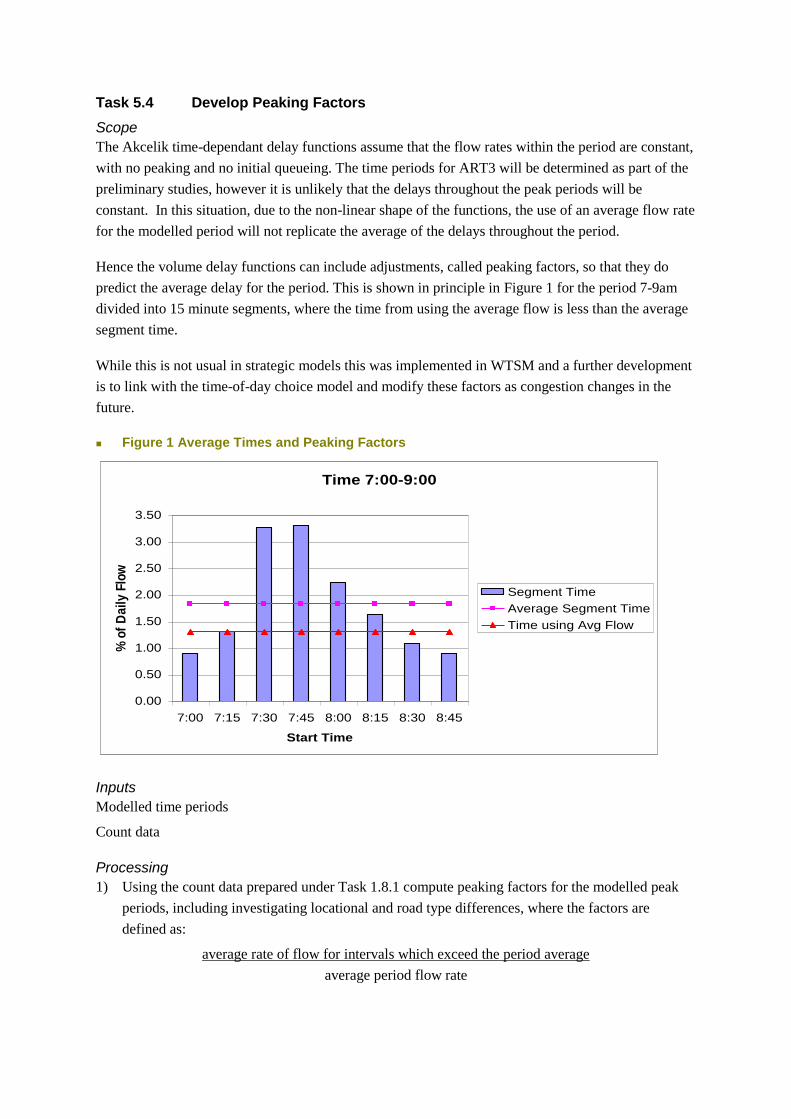
Task 5.4 Develop Peaking Factors
Scope
The Akcelik time-dependant delay functions assume that the flow rates within the period are constant,
with no peaking and no initial queueing. The time periods for ART3 will be determined as part of the
preliminary studies, however it is unlikely that the delays throughout the peak periods will be
constant. In this situation, due to the non-linear shape of the functions, the use of an average flow rate
for the modelled period will not replicate the average of the delays throughout the period.
Hence the volume delay functions can include adjustments, called peaking factors, so that they do
predict the average delay for the period. This is shown in principle in Figure 1 for the period 7-9am
divided into 15 minute segments, where the time from using the average flow is less than the average
segment time.
While this is not usual in strategic models this was implemented in WTSM and a further development
is to link with the time-of-day choice model and modify these factors as congestion changes in the
future.
Figure 1 Average Times and Peaking Factors
Inputs
Modelled time periods
Count data
Processing
1) Using the count data prepared under Task 1.8.1 compute peaking factors for the modelled peak
periods, including investigating locational and road type differences, where the factors are
defined as:
average rate of flow for intervals which exceed the period average
average period flow rate
Time 7:00-9:00
0.00
0.50
1.00
1.50
2.00
2.50
3.00
3.50
7:00 7:15 7:30 7:45 8:00 8:15 8:30 8:45
Start Time
% o
f D
ail
y F
low
Segment Time
Average Segment Time
Time using Avg Flow

2) Develop the methodology for implementing the factors in the delay functions, such as their
inclusion in link or intersection delay, and whether the factors are applied to volumes or
capacities.
3) Implement peaking factors
4) Consider methods of modifying these profiles in future years to reflect changes in time of travel
(refer to Task 12, particularly 12.1 and 12.2 on time period factors and macro time period
choice)2
Outputs
Peaking factors by location, time of day etc implemented in delay functions
Note
2 This would be an innovatory approach in NZ city models, and will rely on cross-sectional and historic data
providing evidence of the relationship between the profiles and the general level of congestion.

Task 5.5 Develop Motorway Delay Procedures
Scope
Motorway delay functions will be modelled using the same general Akcelik curves used on the local
network. However, experience on other models shows that the standard speed-flow methods do not
adequately reflect the significant congestion and blocking-back queuing experienced on the
motorways in Auckland. Motorway-specific procedures will be developed to address the following
key limitations of the standard volume-delay functions:
Reduced capacity due to flow-breakdown and blocking-back
Unequal Lane Utilisation
Ramp Signalling
We recognise that with the introduction of new procedures there is always associated risk; mitigating
this will be a key criterion in the design of the procedures. The intention is to use simple procedures
with progressive impact (rather than sudden on/off queue procedures). The convergence and stability
will be achieved through damping procedures applied both with each assignment process (refer to
Tasks 5.7 and 5.8) and between iterations of the demand model.
Flow-Breakdown and Queue Capacity:
The standard functions, which reflect over-capacity delays when volume-capacity ratios exceed
100%, have been found to under-estimate the observed delays (for example, a number of locations on
the motorway which have significant delays and queues due to flow-breakdown and blocking-back
queues, actually have volume-capacity ratios well below 100%). This is fundamentally because the
theoretical link capacities do not reflect flow break-down conditions or blocking back queues.
It is recognised that there is little scope for significant change to the modelling of motorway delays
and bottlenecks within the EMME/2 software and within the strategic context of the models.
However, it is considered that some attempt to better reflect flow-breakdown capacities is required in
the ART3 model. The actual details of the method will be developed as part of the study; however the
guiding principles for their development will be as follows:
The procedures must be automated and predictive (i.e. they must be able to reasonably identify
where similar conditions could apply on future networks)
Convergence and stability must be retained within reasonable run times
The procedures should be simple to code and their impact easy to identify
The procedures should be able to broadly reflect changes in capacity allocation by ramp
signalling
The basic approach proposed is as follows:
Undertake a preliminary or ‘warm-start’ assignment (broadly representing pre-peak shoulder
period)
Identify motorway links at or over the theoretical capacity
Identify unsatisfied demand on each link (i.e. the excess demand over capacity)
Propagate back upstream the un-satisfied demand, being representative of queuing
Reduce capacities on links with this identified ‘queuing’
Continue assignment using the reduced capacities

These procedures would be run within the EMME/2 assignment process, with capacities updated
during interruptions to the assignment (as will be done for intersection capacities).
The procedures would be developed within a ‘test-bed’ corridor model to avoid the complications of
re-routing, before being implemented across all motorway links. Bounds would be placed on the
procedures to avoid extreme capacity reductions.
Lane Utilisation:
Simple procedures will be developed where non-equal lane utilisation reduces the theoretical link
capacity. This is especially apparent on sections of motorway with auxiliary lanes present, where the
low utilisation of the auxiliary lanes is not reflected in the EMME/2 models (which assume equal
utilisation across all lanes). Simple procedures will be applied where the number of mainline lanes
reduces to reflect this unequal utilisation. In essence, a proportion of the auxiliary lane capacity will
be added to the downstream (through) capacity. The proportion will be based on the volume of off-
ramp traffic. Implementation of such procedures is feasible using the EMME/2 network calculation
module.
For example, in the Figure shown below, the capacity of the section with the auxiliary lane would be
calculated as the downstream capacity, plus the volume of off ramp traffic.
Ramp Signalling:
Detailed representation of ramp signalling is not feasible using this type of software or within this
type of strategic demand model. However, two broad effects of ramp signalling will be considered
during network development, namely the re-allocation/re-prioritisation of capacity between ramps and
mainlines and additional delays on the ramps.
Within the capacity reduction procedures outlined above are assumptions on the allocation of capacity
between ramps and mainline at bottleneck locations. The current (forced-flow) allocations can be
determined from observations at existing bottlenecks. The potential effect of ramp signals can then be
considered by coding revised allocations. The broad approach could be as follows:
Identify current allocations of ramp and mainline capacity at existing bottlenecks
Develop simple relationship between the capacity and site conditions (for example it is known
that short, narrow merges such as at Symonds Street have lower ramp allocations than ramps
Downstream capacity =
3 lanes @ 2,000 vphpl =
6,000 vph
Auxiliary Lane
Off ramp flow
(500 vph)
Un-adjusted capacity = 4x2,000 = 8,000 vph
Adjusted Link capacity = 6,500 vph

with longer, less acute merges). This would be developed into a simple coding system (e.g.
‘good’, standard’ or ‘poor’ on-ramp merges);
In future networks, the potential effects of ramp signalling could be reflected by altering the
merge coding (e.g. reducing the ramp allocation to a fixed, lower proportion);
Additional delay functions could then be used on ramps where ramp signals are activated (these
would be treated similar to normal intersection delays)
Inputs
Standard delay functions
Observed ramp and mainline count and speed data
Processing
Develop procedures within test-bed corridor model (spreadsheet)
Once confirmed, implement within corridor EMME/2 model of the same area as the spreadsheet
model
Once confirmed, roll-out across all motorway links
Outputs
EMME/2 calculation macros and associated assignment procedures for automatically reducing
motorway capacities where flow-breakdown
Documented coding procedures.

Task 5.6 Auto Access Functions
Auto access functions will be coded with representative link lengths to the zone centroid. Fixed
speeds will generally be used on auto access functions with no capacity constraints (e.g. fixed speeds
of 40 km/hr).
On zones with multiple auto connectors, functions will be considered which attempt to spread trips
between the connectors, rather than reducing to shortest-path access.

Task 5.7 Design of Private Vehicle Assignment
Inputs
Outputs from preceding network tasks and others, such as related to model segments.
Overall ART3 implementation design
Processing
The basic assignment methodology is fixed within EMME/2, but the design will include and consider:
Assignment segmentation into user classes for multi-user assignment, including possible
future segmentations, and coding
Representation of fixed costs, that is distance-based costs, in generalised cost assignment
Global and user-class specific routeing parameters
Link-specific routeing parameters to account for environmental factors not included in basic
generalised cost function (such as strategic signage, comfort, road hierarchy etc)
Representation of road-pricing or tolls (most probably through additional fixed-costs on
specific links, which also allows differential tolling by market segment when using mode-
specific links)
Network ‘priming’ (‘warm starting’) (refer Task 5.3)
Peaking factors (refer Task 5.4)
Feed-back and update loops, especially in respect of intersection modelling (refer Task 5.3)
Ease of extraction of data required in other modules (e.g. skimmed matrices of generalised
cost components for use in distribution/mode split)
Convergence
Running times
Interface between roading and PT (especially ability to extract link speed data for assessing
bus speeds)
Ease of secondary analysis (select-link, sub-area traversals, emission-analysis (cold-start
assessments)
Outputs
Note on design of private vehicle assignment
Task 5.8 Implementation and Testing of Private Vehicle Assignment
Purpose
This task implements the design and individual components developed previously. Additionally, as
noted in the overall scope for this section, the road network and assignment are to be developed
initially as part of Transit’s WRR tolling project, and then completed as part of the ATM2 project.
Inputs
Road networks including coding for link types, lanes, and link and junction delay parameters and
functions
Procedures etc developed in previous tasks
Matrices from HTS (plus 2006 ART2 matrices for the Transit WRR component)
Note on design of assignment.
Processing
Generally this task implements the design from Task 5.7 and the individual procedures developed in
previous tasks. Matrices from the HTS are to be used along with a unitary matrix as required.
This includes:
Development of EMME/2 macros
Setting up of input files and parameters
Testing and checking of the assignments and networks will include:
Checks on convergence, with varying assignment iterations and EMME/2 convergence criteria,
and different junction feedback procedures;
Checks on maximum delays across the network;
Comparison of modelled and observed journey times (see Model Validation task);
Checks on routing patterns via select-link analysis;
Tuning of routeing parameters;
Checks on sensitivity to minor changes in delay parameters; and
Test of response to increased traffic demands.
From these tests any identified errors will be corrected along with tuning and adjustment to both the
networks and the assignment procedures as required. Note that final testing in conjunction with the
other sub-models is carried out as part of the full model testing and validation.
Outputs
Note on tests
Implemented and tested networks and assignment procedures.
Ideally these will be used to provide costs for the distribution/mode choice estimations, but the timing
may be such that interim versions of these are used.

Task 5.9 PT Travel Time Functions
Purpose
The purpose of this task is to develop travel time functions for bus, rail and ferry.
Inputs
Bus and private vehicle travel time databases
Existing travel time functions: ART2, APT, WTSM
Ferry and rail timetables
Processing
Set up database for analysis of bus and private vehicle times by:
extracting times from private vehicle travel time database on bus route sections and
processing the bus and private vehicle data into suitable compatible formats
Calibrate relationships between car and bus times time for different contexts (urban, rural, arterial,
motorway, mixed with traffic, bus lanes) and time periods. This should be, in the first instance, based
on relating bus running times with car times with bus stopped times a separate component, that is
functions of the form:
Bus time/km= x* car time/km + y
Where:
x is likely to only vary by road type, and
y, which reflects the frequency of stops and the number of boardings and alightings, can vary
by context and period.
Check the compatibility and consistency of these results with timetabled times to generally confirm
their applicability, and compare with functions from ART2, APT and WTSM.
For rail and ferry:
in the base year develop functions based on timetable travel times between stations and terminals;
for changes to the networks, external information on changed travel times would be required for
implementation in the model
Outputs
Travel time functions for bus, rail and ferry
Note

Task 5.10 Park-and-Ride
Scope
Park-and-ride in Auckland affects rail and ferry services currently and, in future, the North Shore
Busway. Car access to public transport also includes kiss-and-ride. There are a number of different
aspects to be considered:
car access by park-and-ride or kiss-and-ride are equally important in demand modelling;
informal park-and-ride may occur at all stations; the provision of a car park at a station may have
little effect on usage unless informal parking was previously constrained or distant from the
station or there were previously car security considerations;
generally, major park-and-ride sites are created in situations where the station achieves a
relatively high level of service (the busway park-and-ride stations are the main example in
Auckland, rather than the railway);
we expect generally rail/busway park-and-ride to occur for the outer stations/stops where
potential car users can access the journey time benefits of a high quality longer distance
rail/coach service;
for ferries the position is quite different, with for example the Devonport ferry enabling car users
to avoid the harbour bridge congestion and make the last short leg of their journey by ferry, the
larger part of the journey being by car.
For a strategic model, the key issue is to establish how the provision of park-and-ride options
influences mode shares. In Auckland the potential mode share of the North Shore Busway is an
example. Forecasts are sensitive to (i) the catchment area of a park-and-ride station, which is in
principle larger than other stations and (ii) how the choice between the park-and-ride station and the
local station is represented.
The output from the preliminary analysis on park-and-ride will enable us to confirm many of these
preconceptions and to explore some of the modelling issues.
At this time the intention is for a similar level of representation as in ART2 and WTSM:
park-and-ride stations would be identified and linked to a wider station catchment by connectors
which represent multi-modal access, including park-and-ride and kiss-and-ride; hence the use of
park-and-ride will be determined as part of the PT assignment;
these connectors would have journey times allocated to them based on the access distance and
the mix of access modes likely to be used (for a given distance band); thus short distance access
would be by active modes and longer distance access would increasingly use the mechanised
modes, predominantly car (as park-and-ride or kiss-and-ride); it should be possible to infer from
this process the implied parking demand (but this is not something we have attempted before and
will need to be investigated during the model development); it should also be possible to allow
for parking charges, but again this will need to be investigated;
catchment areas for current stations would be determined from the survey (and this should also
include the busway ‘stations’)and rules would be developed for defining the catchments of new
sites;
for ferry, we need to consider including ferry services in both the public transport and road
networks, the latter to provide a more sensible way of representing park-and-ride.
While there are more complex options than this, including hierarchical logit choice methods and
EMME/2 matrix convolution techniques as used in the APT, the information available within a
strategic model is not seen to merit this level of detail. The method proposed can be readily validated
and tuned on the survey data (the PTIS) and is transparent in application.
Inputs
Note on park-and-ride analysis of HTS and PTIS data
Information on park-and-ride sites showing layouts etc
Processing
Using the preliminary studies analysis, the steps include:
Confirmation that the above approach is appropriate
Identification of existing park-and-ride sites and their catchments, and comparison with those
presently in APT
Assessment of car access distances and journey distances to determine any constraints to be
applied, and comparison with APT procedures
Assessment of relevancy of parking costs
Using information on the layout of park-and-ride sites, make an assessment of average transfer times
for each.
Outputs
Note setting out:
the final approach to park-and-ride in ART3;
the sites to be included in the 2006 network and definition of catchments in terms of ART3
zones;
other parameters such as minimum car access and journey distances, transfer time, parking
costs, and any others arising from the analysis.
Task 5.11 Design of PT Attributes and Assignment
Inputs
Information from other tasks, such as related to model segments, network development, etc
Current attributes and procedures in ART, APT, and WTSM
Processing
1) Modes and vehicle types:
Define mode and vehicle type codes and descriptions and default speeds.
Design how vehicle capacities (seated and standing) and operating costs (per km and per
hour) will be implemented; that is as part of the service coding or as external inputs as
required.
For on-street modes define the auto equivalent of each vehicle type.
2) Buslanes:
In the current ART model the travel times on buslanes are reduced from the standard by a
specified percentage on links identified as having buslanes, whereas in APT the travel times
on buslanes are based on specified speeds.
The tasks are to:
– Define travel time functions (see Task 5.9).
– Define how buslanes will be identified in the network.
3) Bus priority:
This will consider how the reduced delay due to bus priority measures such as signal pre-
emption and queue-jumping lanes at signals will be incorporated into ART3, including
directly in the travel time functions.
In ART this is presently represented globally as a percentage reduction travel time on all
arterial roads. APT currently does not include the effect of these measures.
4) PT access and egress:
This is concerned with the basis for PT access times from and to zones, their representation
and then implementation in the network and will incorporate the outcomes from Task 5.10
on park-and-ride access.
PT access (i.e. walk) along roads will be considered, particularly in light of decisions on how
intrazonal and short trips are treated in the model. Currently in ART walking is allowed
within the CBD to enable connectivity between services and zones without the need to
provide specific walk links. In APT, on the other hand, all road links have walk mode
available; this avoids the need to create specific connectivity, but also can enable PT trips to
walk between zones without boarding PT.
Our approach will be to allow walking on all roads and supplement this by centroid
connectors for zones with longer access distances, where public transport or car would be
used (for very long access distances, refer to park-and-ride discussion). For the latter,
centroid connector times would be based on distance assuming speeds relating to the
expected distribution of access modes.
The design tasks will include definition of the access mode and associated coding (mode
code, link type) and the implementation of the time function.
5) Boarding, waiting and transfers:
This is concerned with the design of boarding, waiting and transfer times and any associated
penalties and factors.
APT and WTSM both have a time of 3 minutes for boarding itself, which we would expect to use
for ART3.
For wait times we would review the functions in APT and WTSM, which are 0.22 and 0.25 of the
headway respectively. (as noted in Task 2.11 the weight of wait times will be 2.0)
All models have a boarding penalty which is included in the generalised costs for second and
subsequent boardings to represent the undesirability of transferring between PT services and
modes. In APT and WTSM this penalty varies with the quality of transfer facility and level of
service integration as follows:
– 10 minutes for standard interchanges,
– 8 minutes for purpose-built interchanges, and
– 5 minutes for high quality and/or planned interchanges.
We would expect to continue with these for ART3.
It is standard in the EMME/2 assignment for the transfer penalty to be included in the initial
boarding as well as subsequent transfer boardings and then the initial penalty removed prior to
the generalised costs.
The way in which these are implemented in ART3 will be designed.
6) Fares and integrated fares and ticketing
The bus and rail fare structures in Auckland are, in general terms, made up of a series of fare
stage boundaries, with the minimum fare paid for a trip which does not cross a boundary.
While fares will part of the ART3 PT generalised costs, it is less clear to what extent fares
affect routeing and hence how they might be represented in the PT assignment. This will
need to be considered in light of the current fare structures.
The result of this will, in turn, affect the way in which fares would be implemented, whether
in matrix form or in the network or both. If it were deemed that fares did not affect routeing
greatly, then they do not need to be represented in assignment. If it were necessary to
implement fares in the network, the fare stage boundaries would need to be set up. This is
possible with radial services, but becomes very problematic with other routeings such as
cross-town and circular routes, and more so when adding different types of routes in the
future.
The fares in generalised costs can be in matrix form to reflect the fare structure and there is
the possibility of these varying by both trip purpose and time period. This can account for the
prevalence of each purpose paying different ticket types (full, weekly and monthly passes,
discounted fares, etc), such as student discounts for HBE trips. Within a purpose the average
fare from the survey data will be implemented.
In the current ART model fare boundaries are implemented in the network as well as a
minimum boarding fare applied to the boarding penalty. This was originally developed at a
time when the vast majority of services were radial to/from the Auckland CBD. In APT both
bus and rail have an initial boarding fare, following which bus fares are based on distance
and rail has fare stage boundaries. Both are both implemented as part of the travel time
functions, that is, via the network.
Integrated fares are modelled in APT with a different fare structure; all modes have an initial
boarding fare and then a distance-based fare. This is calculated as a matrix and hence
integrated fares are modelled at a matrix level rather than on the network. In ART integrated
fares are represented by removing the second and any subsequent boarding fare.
Integrated ticketing is represented in APT by a specified reduction in boarding time.
The design for ART3 will consider the above.
7) In-vehicle-time mode specific factors:
As part of tuning the base year network to achieve better routeing factors may be applied to
the in-vehicle time of a mode or sub-mode ASCs used. When a new mode is introduced or an
existing mode improved an adjustment to these factors may be required to reflect the mode-
specific qualities (such as comfort or convenience, or improvements in supporting
infrastructure).
The design will consider how these factors are incorporated.
8) Assignment procedures, using the above and parameters for generalised cost, and including park-
and-ride, the separation into PT sub-modes and the saving of result matrices.
Outputs
Note on PT attributes and assignment
Task 5.12 Develop PT Networks (Links)
Scope
The PT networks will build on the roading networks developed under Task 5.2. Bus mode will be
added to the roading networks and additional PT-only links added – both more minor roads required
for PT modelling (particularly for APT) plus any busway links. The ferry and rail networks can be
imported from APT reviewed and updated, and then combined with the completed roading and bus
network.
Inputs
Roading networks (Task 5.2)
Network already developed for ART3 by ARC (in ARC GIS)
Latest APT rail and ferry network (link) coding
Rail and ferry timetables showing routes
Park-and-ride sites, catchments, etc (Task 5.10)
Mode codes, walk access (Task 5.11)
Processing
1) Review roading network: centroid connectors for PT, additional nodes, and links, and modify
accordingly
2) Develop and insert network for bus-only links (e.g. Northern busway)
3) Adapt APT rail and ferry network to fit with ART3, including:
Modify node numbering to fit with ART3 system,
Check that all existing ferry routes are included, add as required,
Check rail stations, modify as required,
Check the alignment against GIS layers.
4) Develop and insert network required for park-and-ride (refer Task 5.10)
5) Review and modify as required connectivity, particularly walk linkages, between zones and PT
services and between PT modes
6) Add mode codes to links
Outputs
Base networks for ART3 for roading and PT stored in both spreadsheet and EMME/2 format.

Task 5.13 Coding of PT Services
Purpose
In this task the 2006 PT services for the AM, IP and PM periods will be coded onto the base year
networks consistent with the travel time functions and the design of other attributes.
Inputs
ART3 networks from Task 5.10
Latest APT coded services (understood to be 2005 for AM peak)
ARTA PT databases
ARC PT services in GIS
Ferry and rail timetables
PT attributes from Task 5.11 (e.g. travel time functions, vehicle types)
Processing
1) Accumulate, as necessary, individual services into routes for each time period and their
headways.
2) Design conventions for naming and descriptions of routes
3) Code services onto the ART3 time period networks in EMME/2, including:
for each route: route name, route description, headway, default vehicle speed, and if
required, seated and standing capacity, and operating costs;
the timetable travel time may also be coded into a user data item;
for rail and ferry, code the speed on each segment (this will be pre-determined so that the
total time on the line is consistent with the timetabled time, refer Task 5.9)
for each node, where applicable: type of activity, dwell (stop) time, layover time, transit time
function on link following the node; rail and ferry should have zero dwell times.
4) Check and verify each route:
View plots of each, checking routeing.
View transit line summary reports.
Outputs
Base PT services coded onto base networks in EMME/2 and as text files
Note

Task 5.14 Implementation and Testing of PT Network and Assignment
Purpose
This task implements the design and individual components developed previously. Note that there is
significant overlap between this task and Task 8.2, in which costs are obtained for calibration.
Inputs
PT networks with coded services (Task 5.11)
Travel time functions
Park-and-ride design
Matrices from HTS
Note on PT attributes and assignment.
Processing
Generally this task implements the previous design decisions and incorporates the functions and
coded services. The park-and-ride component will be coded here as will any additional network
connectivity identified as part of the network and assignment testing.
The implementation will include:
Coding of park-and-ride
Coding for network attributes defined in Task 5.10 (e.g. transfers, fares, boarding)
Development of EMME/2 macros
Setting up of input files and parameters
The testing of the PT networks and assignments is aimed at identifying deficiencies in the network
(such as missing connectivity) and to test and adjust the routeing. The testing will include:
Assignment of unit matrices and checking of zonal connectivity;
Assignment of observed matrices and checking of routeing patterns, transfers and trip length,
tuning of the networks, routeing parameters and assignment procedures;
Visual comparison of generalised costs against PT accessibility to check their reasonableness;
Checking of generalised cost components for selected zone pairs: access and egress times, walk
times, wait, and in-vehicle time, boarding, transfer penalties;
From these tests any identified errors will be corrected along with tuning and adjustments to both the
networks and the assignment procedures as required. Note that final testing in conjunction with the
other sub-models is carried out as part of the full model testing and validation (Task 16).
Outputs
Note on tests
Implemented and tested networks, which will be used to provide costs for the distribution/mode
choice estimations.

Task 5.15 Networks and Assignment Report
Write the Networks and Assignment report