tashkent uzbkeistan - international cotton … uzbkeistan oct. 22-27, 2017 country statement the...
TRANSCRIPT
76TH PLENARY MEETING OF THE
INTERNATIONAL COTTON ADVISORY COMMITTEE
TASHKENT
UZBKEISTAN OCT. 22-27, 2017
COUNTRY STATEMENT
THE UNITED STATES OF AMERICA
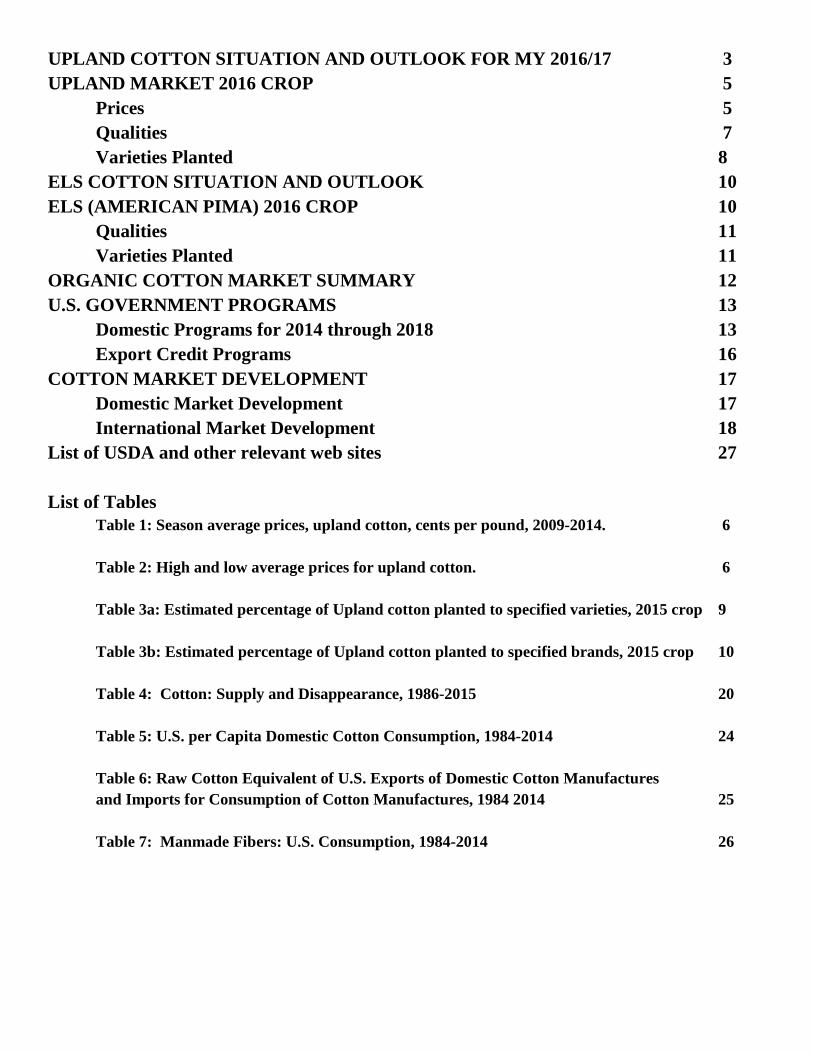
UPLAND COTTON SITUATION AND OUTLOOK FOR MY 2016/17 3 UPLAND MARKET 2016 CROP 5 Prices 5 Qualities 7 Varieties Planted 8 ELS COTTON SITUATION AND OUTLOOK 10 ELS (AMERICAN PIMA) 2016 CROP 10 Qualities 11 Varieties Planted 11 ORGANIC COTTON MARKET SUMMARY 12 U.S. GOVERNMENT PROGRAMS 13 Domestic Programs for 2014 through 2018 13 Export Credit Programs 16 COTTON MARKET DEVELOPMENT 17 Domestic Market Development 17 International Market Development 18 List of USDA and other relevant web sites 27 List of Tables
Table 1: Season average prices, upland cotton, cents per pound, 2009-2014. 6 Table 2: High and low average prices for upland cotton. 6 Table 3a: Estimated percentage of Upland cotton planted to specified varieties, 2015 crop 9 Table 3b: Estimated percentage of Upland cotton planted to specified brands, 2015 crop 10 Table 4: Cotton: Supply and Disappearance, 1986-2015 20 Table 5: U.S. per Capita Domestic Cotton Consumption, 1984-2014 24 Table 6: Raw Cotton Equivalent of U.S. Exports of Domestic Cotton Manufactures and Imports for Consumption of Cotton Manufactures, 1984 2014 25 Table 7: Manmade Fibers: U.S. Consumption, 1984-2014 26

UPLAND COTTON SITUATION AND OUTLOOK FOR MY 2017/18 (Based on the August 2017 WASDE-USDA Estimate) Area and Production
U.S. upland cotton production for the 2017 crop (2017/18 August/July marketing year) is forecast at 19.78 million 480 pound bales (4.3 MMT), 19 percent more than in 2016/17, and above the 5-year average of 14.7 million bales (3.21 MMT). Planted area in 2017/18 totaled 4.78 million hectares, 19 percent above the previous year. Harvested area is forecast at 4.37 million hectares, which suggests an abandonment rate of 8.4 percent. Yield per harvested hectare is forecast at 984 kilograms, above the 5-year average of 921 kilograms. Favorable prices relative to competing crops pushed planted acreage well above the previous year. Very good weather conditions, especially in Texas, will maintain low abandonment, and average yield is projected to be above last year’s crop.
Domestic Mill Use
In 2017/18, mill use of upland cotton is projected at 3.32 million bales (723,000 MT) slightly higher than mill use in 2016/17. This would be near the five year average, but well below the record high of 11.2 million bales in 1997/98.
Foreign Trade
Exports for 2016/17 were 14.3 million bales (3.11 MMT), the highest level since 2005/06. For a second consecutive year, the top export destination was Vietnam. China, which had dropped to fifth place in 2015/16, recovered to second. The top ten upland markets, were Vietnam, China, Turkey, Indonesia, Mexico, Pakistan, India, South Korea, Bangladesh, and Thailand. The top ten destinations represented 88 percent of U.S. upland cotton exports. U.S. upland cotton imports in 2016/17 were 7,000 bales (1,500 MT). In 2017/18, upland cotton exports are projected at 13.55 million bales (2.95 MMT), a 5.2 percent decrease from the previous year. The U.S. share of world exports of all cotton is expected to decrease to 38.6 percent. In 2017/18, upland cotton imports are forecast at 10,000 bales (2,000 MT).
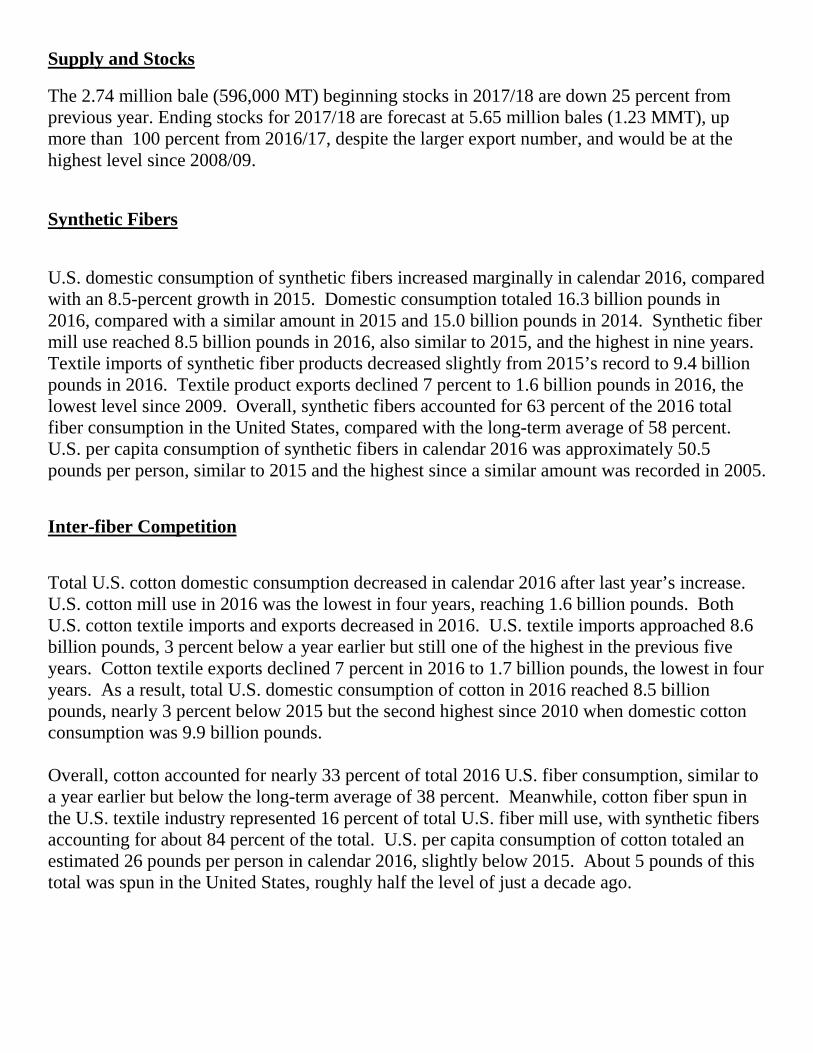
Supply and Stocks
The 2.74 million bale (596,000 MT) beginning stocks in 2017/18 are down 25 percent from previous year. Ending stocks for 2017/18 are forecast at 5.65 million bales (1.23 MMT), up more than 100 percent from 2016/17, despite the larger export number, and would be at the highest level since 2008/09.
Synthetic Fibers
U.S. domestic consumption of synthetic fibers increased marginally in calendar 2016, compared with an 8.5-percent growth in 2015. Domestic consumption totaled 16.3 billion pounds in 2016, compared with a similar amount in 2015 and 15.0 billion pounds in 2014. Synthetic fiber mill use reached 8.5 billion pounds in 2016, also similar to 2015, and the highest in nine years. Textile imports of synthetic fiber products decreased slightly from 2015’s record to 9.4 billion pounds in 2016. Textile product exports declined 7 percent to 1.6 billion pounds in 2016, the lowest level since 2009. Overall, synthetic fibers accounted for 63 percent of the 2016 total fiber consumption in the United States, compared with the long-term average of 58 percent. U.S. per capita consumption of synthetic fibers in calendar 2016 was approximately 50.5 pounds per person, similar to 2015 and the highest since a similar amount was recorded in 2005. Inter-fiber Competition Total U.S. cotton domestic consumption decreased in calendar 2016 after last year’s increase. U.S. cotton mill use in 2016 was the lowest in four years, reaching 1.6 billion pounds. Both U.S. cotton textile imports and exports decreased in 2016. U.S. textile imports approached 8.6 billion pounds, 3 percent below a year earlier but still one of the highest in the previous five years. Cotton textile exports declined 7 percent in 2016 to 1.7 billion pounds, the lowest in four years. As a result, total U.S. domestic consumption of cotton in 2016 reached 8.5 billion pounds, nearly 3 percent below 2015 but the second highest since 2010 when domestic cotton consumption was 9.9 billion pounds. Overall, cotton accounted for nearly 33 percent of total 2016 U.S. fiber consumption, similar to a year earlier but below the long-term average of 38 percent. Meanwhile, cotton fiber spun in the U.S. textile industry represented 16 percent of total U.S. fiber mill use, with synthetic fibers accounting for about 84 percent of the total. U.S. per capita consumption of cotton totaled an estimated 26 pounds per person in calendar 2016, slightly below 2015. About 5 pounds of this total was spun in the United States, roughly half the level of just a decade ago.

UPLAND MARKET CROP ANNUAL COTTON STATISTICS
Prices 2016 Crop:
Spot cotton quotations for color 41, leaf 4, staple 34, mike 35-36 and 43-49, strength readings of 26.5-28.4 grams per tex, uniformity of 81 units in the designated spot markets averaged 70.71 cents per pound for the 2016-2017 season, up from 61.03 cents for the 2015-2016 season. The season’s lowest daily quotation for the base quality occurred on August 31, 2016 at 63.91 cents per pound and the season’s highest quotation was 81.76 cents on May 15, 2017. The highest monthly average for the marketing year was 75.75 cents per pound in May 2017 and the lowest was 66.24 cents per pound in July 2017.
Aug Sep Oct Nov Dec Jan Feb Mar Apr May Jun Jul 41‐4‐34 68.57 67.65 68.04 69.42 69.69 71.81 73.02 74.33 74.13 75.75 69.85 66.24 31‐4‐34 69.77 68.85 69.24 70.68 70.86 72.06 73.98 75.17 74.99 76.63 70.73 67.12
Quotations for color 31, leaf 3, staple 34, mike 35-36 and 43-49, strength readings of 26.5-28.4 grams per tex, uniformity of 81 units in the designated spot markets averaged 71.74 cents per pound for the 2016-2017 season, up sharply from 62.34 cents for the 2015-2016 season. The average price received by farmers for Upland cotton in June was 69.70 cents per pound in the 2016-2017 marketing year. The 2015-2016 marketing year average price was 61.20 cents, compared to the 2014-2015 marketing year of 61.30 cents, according to the National Agricultural Statistics Service, USDA. The marketing year average price is monthly prices weighted by monthly marketings during the period August through the following July, with no allowances for unredeemed loans.
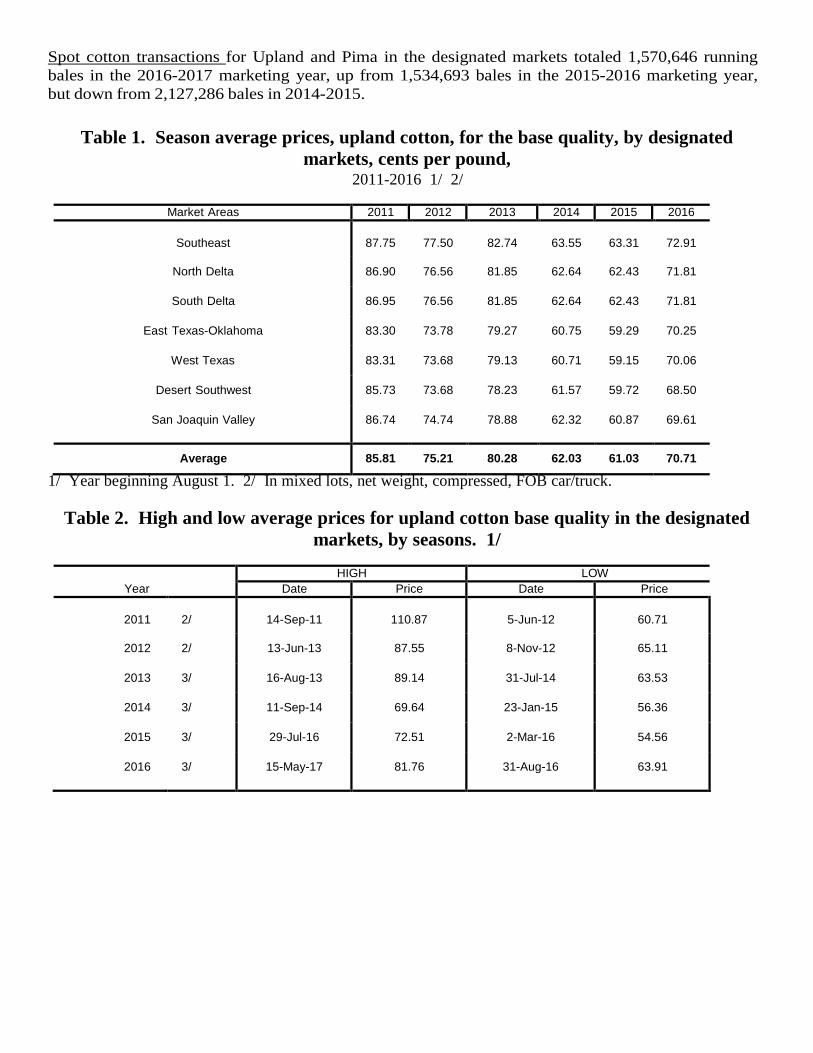
Spot cotton transactions for Upland and Pima in the designated markets totaled 1,570,646 running bales in the 2016-2017 marketing year, up from 1,534,693 bales in the 2015-2016 marketing year, but down from 2,127,286 bales in 2014-2015.
Table 1. Season average prices, upland cotton, for the base quality, by designated markets, cents per pound,
2011-2016 1/ 2/
Market Areas 2011 2012 2013 2014 2015 2016
Southeast
87.75
77.50
82.74
63.55
63.31
72.91
North Delta 86.90 76.56 81.85 62.64 62.43 71.81
South Delta 86.95 76.56 81.85 62.64 62.43 71.81
East Texas-Oklahoma 83.30 73.78 79.27 60.75 59.29 70.25
West Texas 83.31 73.68 79.13 60.71 59.15 70.06
Desert Southwest 85.73 73.68 78.23 61.57 59.72 68.50
San Joaquin Valley 86.74 74.74 78.88 62.32 60.87 69.61
Average 85.81 75.21 80.28 62.03 61.03 70.71 1/ Year beginning August 1. 2/ In mixed lots, net weight, compressed, FOB car/truck.
Table 2. High and low average prices for upland cotton base quality in the designated markets, by seasons. 1/
Year HIGH LOW
Date Price Date Price
2011
2/
14-Sep-11
110.87
5-Jun-12
60.71
2012 2/ 13-Jun-13 87.55 8-Nov-12 65.11
2013 3/ 16-Aug-13 89.14 31-Jul-14 63.53
2014 3/ 11-Sep-14 69.64 23-Jan-15 56.36
2015 3/ 29-Jul-16 72.51 2-Mar-16 54.56
2016 3/ 15-May-17 81.76 31-Aug-16 63.91
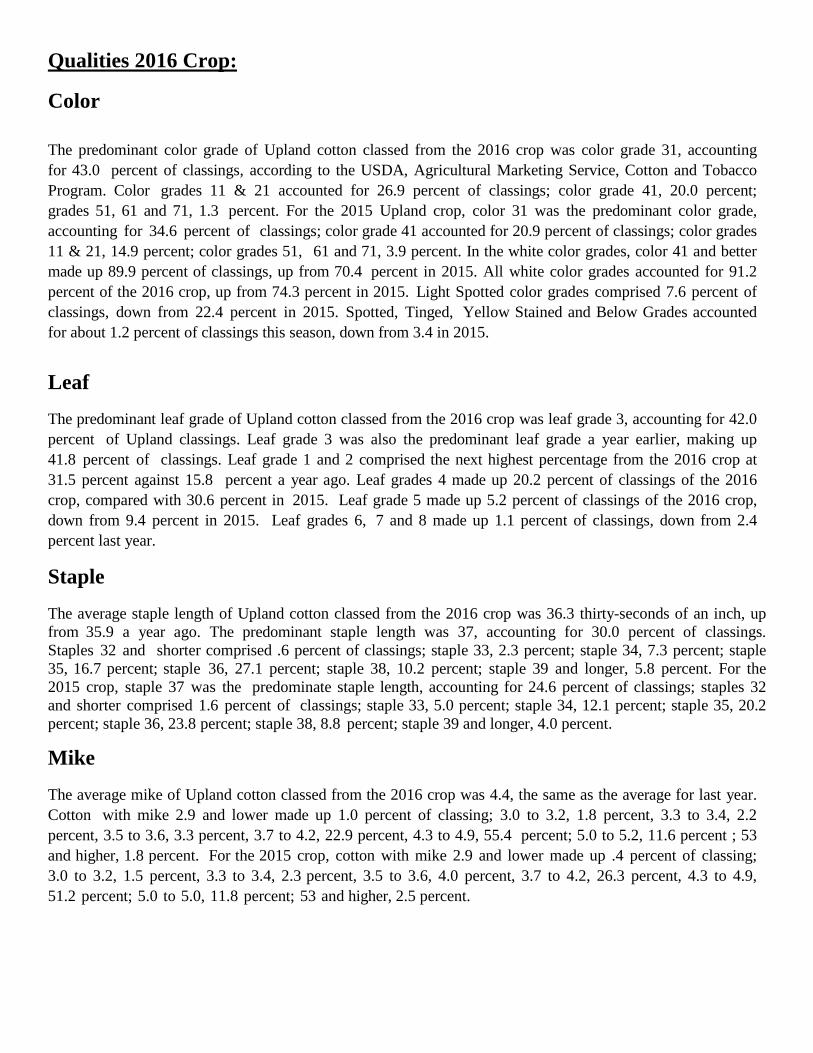
Qualities 2016 Crop:
Color The predominant color grade of Upland cotton classed from the 2016 crop was color grade 31, accounting for 43.0 percent of classings, according to the USDA, Agricultural Marketing Service, Cotton and Tobacco Program. Color grades 11 & 21 accounted for 26.9 percent of classings; color grade 41, 20.0 percent; grades 51, 61 and 71, 1.3 percent. For the 2015 Upland crop, color 31 was the predominant color grade, accounting for 34.6 percent of classings; color grade 41 accounted for 20.9 percent of classings; color grades 11 & 21, 14.9 percent; color grades 51, 61 and 71, 3.9 percent. In the white color grades, color 41 and better made up 89.9 percent of classings, up from 70.4 percent in 2015. All white color grades accounted for 91.2 percent of the 2016 crop, up from 74.3 percent in 2015. Light Spotted color grades comprised 7.6 percent of classings, down from 22.4 percent in 2015. Spotted, Tinged, Yellow Stained and Below Grades accounted for about 1.2 percent of classings this season, down from 3.4 in 2015.
Leaf The predominant leaf grade of Upland cotton classed from the 2016 crop was leaf grade 3, accounting for 42.0 percent of Upland classings. Leaf grade 3 was also the predominant leaf grade a year earlier, making up 41.8 percent of classings. Leaf grade 1 and 2 comprised the next highest percentage from the 2016 crop at 31.5 percent against 15.8 percent a year ago. Leaf grades 4 made up 20.2 percent of classings of the 2016 crop, compared with 30.6 percent in 2015. Leaf grade 5 made up 5.2 percent of classings of the 2016 crop, down from 9.4 percent in 2015. Leaf grades 6, 7 and 8 made up 1.1 percent of classings, down from 2.4 percent last year.
Staple The average staple length of Upland cotton classed from the 2016 crop was 36.3 thirty-seconds of an inch, up from 35.9 a year ago. The predominant staple length was 37, accounting for 30.0 percent of classings. Staples 32 and shorter comprised .6 percent of classings; staple 33, 2.3 percent; staple 34, 7.3 percent; staple 35, 16.7 percent; staple 36, 27.1 percent; staple 38, 10.2 percent; staple 39 and longer, 5.8 percent. For the 2015 crop, staple 37 was the predominate staple length, accounting for 24.6 percent of classings; staples 32 and shorter comprised 1.6 percent of classings; staple 33, 5.0 percent; staple 34, 12.1 percent; staple 35, 20.2 percent; staple 36, 23.8 percent; staple 38, 8.8 percent; staple 39 and longer, 4.0 percent.
Mike The average mike of Upland cotton classed from the 2016 crop was 4.4, the same as the average for last year. Cotton with mike 2.9 and lower made up 1.0 percent of classing; 3.0 to 3.2, 1.8 percent, 3.3 to 3.4, 2.2 percent, 3.5 to 3.6, 3.3 percent, 3.7 to 4.2, 22.9 percent, 4.3 to 4.9, 55.4 percent; 5.0 to 5.2, 11.6 percent ; 53 and higher, 1.8 percent. For the 2015 crop, cotton with mike 2.9 and lower made up .4 percent of classing; 3.0 to 3.2, 1.5 percent, 3.3 to 3.4, 2.3 percent, 3.5 to 3.6, 4.0 percent, 3.7 to 4.2, 26.3 percent, 4.3 to 4.9, 51.2 percent; 5.0 to 5.0, 11.8 percent; 53 and higher, 2.5 percent.
Strength The average fiber strength of Upland cotton classed from the 2016 crop was 30.3 grams per tex (gpt), the same as a year ago. Strengths in the 25 gpt and lower range accounted for 1.0 percent of classings; strengths in the 26 to 27 gpt, 9.8 percent; strengths of 28 to 29 gpt, 31.8 percent; strengths of 30 to 31 gpt, 37.8 percent; strengths in the 32 to 33 gpt, 15.8 percent; strengths in the 34 and higher range comprised 3.7 percent of classings. For the 2015 crop, strengths in the 25 gpt and lower range accounted for 2.6 percent of classings; strengths in the 26 to 27 gpt, 12.4 percent; strengths of 28 to 29 gpt, 28.7 percent; strengths of 30 to 31 gpt, 31.8 percent; strengths in the 32 to 33 gpt, 18.6 percent; strengths in the 34 and higher range comprised 5.9 percent of classings.
Cotton Ginnings Ginnings of 2016-crop cotton in the United States totaled 16,710,000 running bales, according to the Cotton Ginnings 2016 Summary report released on May 10, 2017 by the Agricultural Statistics Board, National Agricultural Statistics Service, USDA. This total includes 16,160,450 bales of Upland and 549,550 bales of American Pima cotton. The number of active cotton gins for crop year 2016 was 556, down from 560 in 2015. Classings at AMS, Cotton and Tobacco Program, Classing Offices totaled 16,157,380 Upland samples and 542,614 American Pima samples through May 18, 2017.
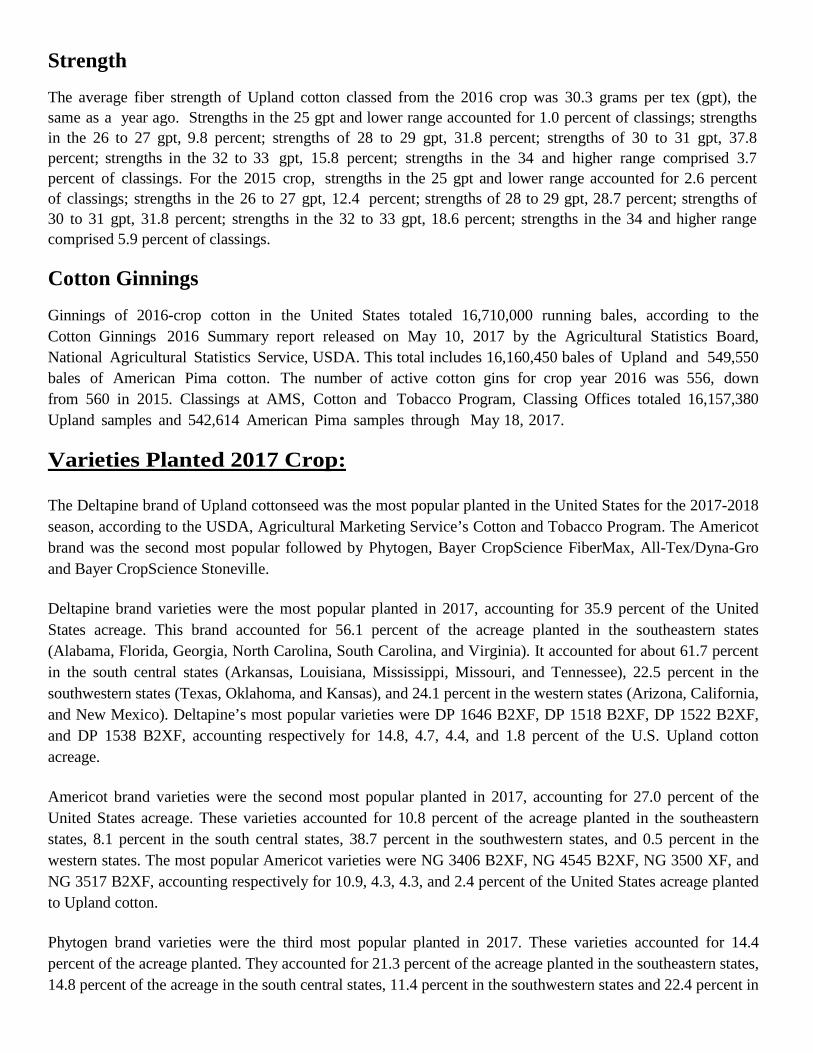
Varieties Planted 2017 Crop: The Deltapine brand of Upland cottonseed was the most popular planted in the United States for the 2017-2018 season, according to the USDA, Agricultural Marketing Service’s Cotton and Tobacco Program. The Americot brand was the second most popular followed by Phytogen, Bayer CropScience FiberMax, All-Tex/Dyna-Gro and Bayer CropScience Stoneville. Deltapine brand varieties were the most popular planted in 2017, accounting for 35.9 percent of the United States acreage. This brand accounted for 56.1 percent of the acreage planted in the southeastern states (Alabama, Florida, Georgia, North Carolina, South Carolina, and Virginia). It accounted for about 61.7 percent in the south central states (Arkansas, Louisiana, Mississippi, Missouri, and Tennessee), 22.5 percent in the southwestern states (Texas, Oklahoma, and Kansas), and 24.1 percent in the western states (Arizona, California, and New Mexico). Deltapine’s most popular varieties were DP 1646 B2XF, DP 1518 B2XF, DP 1522 B2XF, and DP 1538 B2XF, accounting respectively for 14.8, 4.7, 4.4, and 1.8 percent of the U.S. Upland cotton acreage. Americot brand varieties were the second most popular planted in 2017, accounting for 27.0 percent of the United States acreage. These varieties accounted for 10.8 percent of the acreage planted in the southeastern states, 8.1 percent in the south central states, 38.7 percent in the southwestern states, and 0.5 percent in the western states. The most popular Americot varieties were NG 3406 B2XF, NG 4545 B2XF, NG 3500 XF, and NG 3517 B2XF, accounting respectively for 10.9, 4.3, 4.3, and 2.4 percent of the United States acreage planted to Upland cotton. Phytogen brand varieties were the third most popular planted in 2017. These varieties accounted for 14.4 percent of the acreage planted. They accounted for 21.3 percent of the acreage planted in the southeastern states, 14.8 percent of the acreage in the south central states, 11.4 percent in the southwestern states and 22.4 percent in
the western states. The most popular Phytogen varieties were PHY 444 WRF, PHY 333 WRF, and PHY 490 W3FE accounting respectively for 3.9, 3.4, and 2.1 percent of the United States acreage planted to Upland cotton. Bayer CropScience FiberMax brand varieties were the fourth most popular planted in 2017, accounting for 9.6 percent of the United States acreage. They accounted for 0.4 percent of the acreage planted in the southeastern states, 0.1 percent of the acreage in the south central states, 13.9 percent in the southwestern states and 43.6 percent in the western states. The most popular Bayer CropScience FiberMax brand varieties were FM 1830GLT, FM 2011GT, and FM 2334GLT, accounting respectively for 2.8, 1.2, and 1.2 percent of the United States acreage planted to Upland cotton. All-Tex/Dyna-Gro brand varieties were the fifth most popular and accounted for about 7.0 percent of the U.S. acreage planted in 2017. Bayer CropScience Stoneville varieties were the sixth most popular and accounted for about 4.6 percent of the 2017 cotton acreage. Estimates of the percentage of the various varieties of cotton planted in the United States for 2017 were based on informal surveys made by the Cotton and Tobacco Program Classing Offices. Those surveyed included ginners, seed dealers, extension agents, and other knowledgeable sources.
Table 3a.

Table 3b.
ELS COTTON SITUATION AND OUTLOOK
(Based on the August 2017 WASDE-USDA Estimate)
Acreage and Production
The U.S. ELS cotton production in 2017/18 is forecast at 770,000 bales (168,400 MT), up 35 percent from the 2016/17 crop, and above the five year averge of 130,000 MT. U.S. plantings of ELS cotton are estimated at 102,000 hectares in 2017/18, up 30 percent from last year. The national ELS cotton yield is forecast at 1,676 kilograms per harvested hectare, up 3 percent from the previous crop. Harvested area in 2017/18 is forecast at 100,000 hectares, indicating an abandonment rate of 2 percent. California remains the dominant ELS producing state.
Domestic Mill Use
Mill use of ELS cotton in 2016/17 is estimated at 30,000 bales (7,000 MT), unchanged from the previous year. Foreign Trade
U.S. Pima exports for 2016/17 reached 614,000 bales (134,000 MT), up 15 percent from the previous season. China remained the largest U.S. Pima market. The other top ten export destinations include India, Pakistan, Turkey, Peru, Indonesia, Thailand, Egypt, Vietnam and Japan. The top 10 markets accounted for 95 percent of total ELS exports. Projected ELS exports for 2017/18 are 650,000 bales (142,000 MT). Projected ELS imports for 2017/18 are less than 1,000 bales. 2,000 bales of ELS were recorded in 2016/17.

Supply and Stocks
The ELS cotton supply for 2017/18 is forecast at 833,000 bales (181,000 MT), 18 percent above the previous year as lower carry-in stocks are more than offset by high projected production. Ending stocks for 2017/18 are expected to increase to 153,000 bales (33,000 MT) from 63,000 bales (14,000 MT) in 2016/17.
ELS (AMERICAN PIMA) Quality 2016 Crop Color grades 1 and 2 made up 87.5 percent of classings from the 2016 crop, up slightly from 87.3 percent last year. Color grade 2 was the predominant color grade in 2016, accounting for 49.1 percent of the classings. Color grade 1 accounted for 38.4 percent; color grade 3, 9.2 percent; color grade 4, 2.2 percent; color grades 5 and lower, 1.1 percent of the 2016 classings. Leaf grade 2 was the predominant leaf grade in 2016, accounting for 52.2 percent of classings. Leaf grade 1 accounted for 33.5 percent, leaf grade 3, 11.9 percent; leaf grade 4, 2.0 percent; leaf grades 5 and lower, .4 percent. The average staple length was 48.9 thirty-seconds of an inch, up from 47.9 last year. Staple 50 was the predominate staple length, accounting for 45.4 percent of classings. Average mike was 3.9, down slightly from 4.0 last year. Average fiber strength was 43.6 grams per tex, up from 42.7 last year. Varieties Planted 2017 Crop Phytogen was the most popular brand of American Pima varieties planted in 2017. Phytogen variety PHY 881 RF accounted for 42.6 percent of the United States Pima acreage. Phytogen’s PHY 841 RF was the second most planted American Pima variety and accounted for 17.4 percent of the U.S. crop. Phytogen’s PHY 888 RF was the next most popular variety and accounted for 10.2 percent of the U.S. Pima acreage.
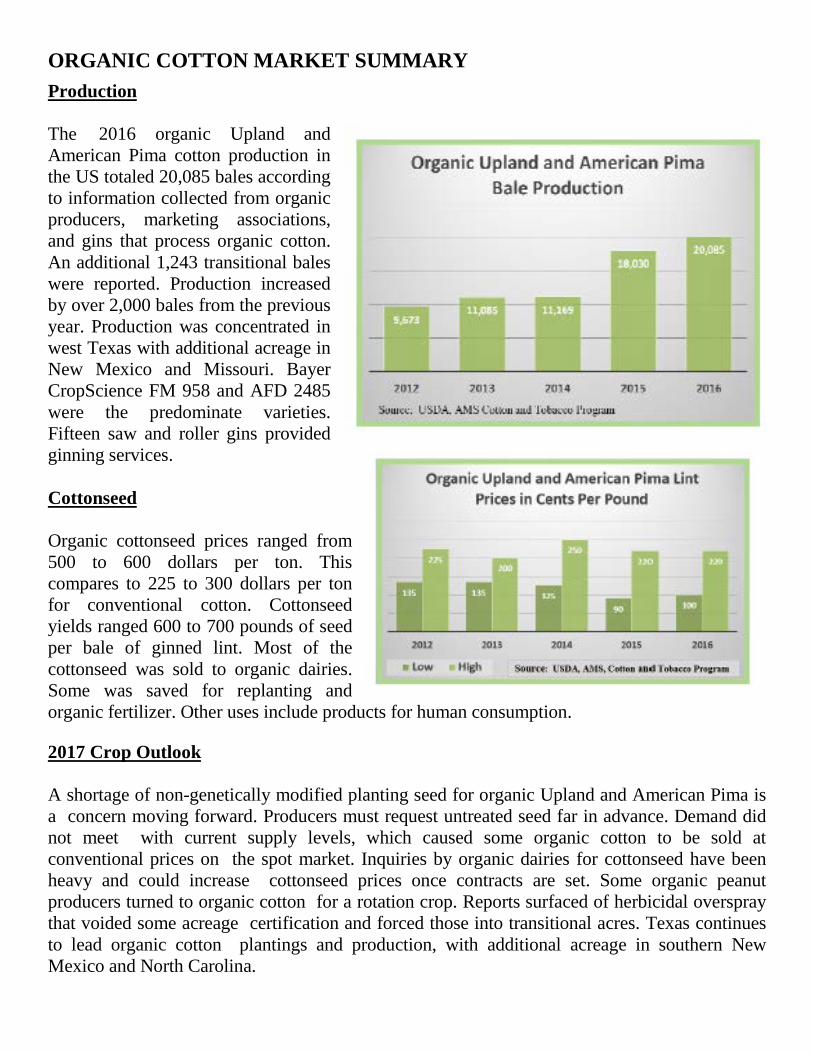
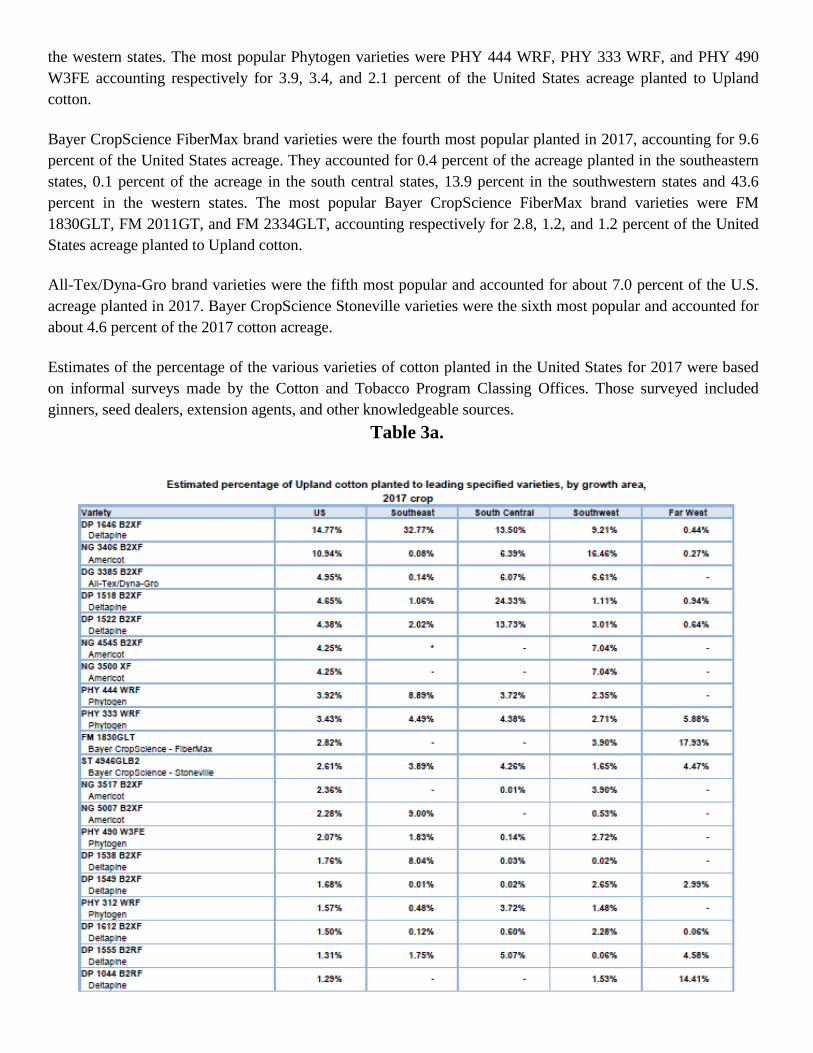
ORGANIC COTTON MARKET SUMMARY Production The 2016 organic Upland and American Pima cotton production in the US totaled 20,085 bales according to information collected from organic producers, marketing associations, and gins that process organic cotton. An additional 1,243 transitional bales were reported. Production increased by over 2,000 bales from the previous year. Production was concentrated in west Texas with additional acreage in New Mexico and Missouri. Bayer CropScience FM 958 and AFD 2485 were the predominate varieties. Fifteen saw and roller gins provided ginning services. Cottonseed Organic cottonseed prices ranged from 500 to 600 dollars per ton. This compares to 225 to 300 dollars per ton for conventional cotton. Cottonseed yields ranged 600 to 700 pounds of seed per bale of ginned lint. Most of the cottonseed was sold to organic dairies. Some was saved for replanting and organic fertilizer. Other uses include products for human consumption. 2017 Crop Outlook A shortage of non-genetically modified planting seed for organic Upland and American Pima is a concern moving forward. Producers must request untreated seed far in advance. Demand did not meet with current supply levels, which caused some organic cotton to be sold at conventional prices on the spot market. Inquiries by organic dairies for cottonseed have been heavy and could increase cottonseed prices once contracts are set. Some organic peanut producers turned to organic cotton for a rotation crop. Reports surfaced of herbicidal overspray that voided some acreage certification and forced those into transitional acres. Texas continues to lead organic cotton plantings and production, with additional acreage in southern New Mexico and North Carolina.

U.S. GOVERNMENT PROGRAMS
Domestic Programs for 2014 though 2018
Upland Cotton
The current upland cotton program is authorized by the Agricultural Act of 2014 (2014 Act), a new five-year farm bill signed into law on February 7, 2014. This Act updates farm and crop insurance programs, nutrition programs, trade, credit, energy and forestry programs for the years 2014-2018. The new law eliminated the Direct and Counter-Cyclical payment programs and the Average Crop Revenue Election program for all of the major commodities, while two new Title I safety net programs were introduced—Agricultural Risk Coverage (ARC) and Price Loss Coverage (PLC). Cotton is not a covered commodity under the 2014 Act, and is not eligible for ARC or PLC, which are administered by the Department of Agriculture’s (USDA’s) Farm Service Agency. Instead, cotton support has shifted to a shallow loss revenue insurance program called the Stacked Income Protection Plan (STAX), which is administered by USDA’s Risk Management Agency. STAX is specific to upland cotton and is designed to address U.S. obligations under the WTO cotton case. It is a revenue insurance program that pairs with (stacks on top of) the traditional crop insurance program. STAX covers 20 percent of potential revenue losses; the remainder may be covered by traditional crop insurance. STAX does not have a fixed target price; rather, STAX is based on a commodity exchange market futures price (generally the December contract) for a given cotton crop. Thus, STAX provides intra-seasonal risk coverage to upland cotton producers, but does not protect against declines in cotton prices from one season to the next. STAX was made available to cotton producers in most counties beginning with the 2015 crop. Growers were provided with Cotton Transition Assistance Program (CTAP) during 2014 and in some cases in 2015. The 2014 Act provided for CTAP payments to upland cotton base holders on 60 percent of base acreage in 2014. In counties where STAX is not available in 2015, growers can receive payments on up to 36.5 percent of base acreage. The transition payment rate was 9 cents per pound, compared to the maximum combined Direct and Counter-Cyclical payment rate under the previous farm bill of 19.25 cents per pound (which was paid on 85 percent of base acres). The upland cotton marketing assistance loan program continues under the 2014 Act. The base loan rate is no longer fixed at 52 cents per pound, but can range from 45 cents per pound to 52 cents per pound. The announced base loan rates for 2014-,2015-, and 2016-crop upland cotton are 52 cents. The announced base loan rate for 2017-crop upland cotton is 49.49 cents.

Economic Adjustment Assistance Payments (EAAP) to spinners are continued under the 2014 farm bill and remain fixed at a 3 cent per pound rate (as opposed to 4 cents per pound for 2008-2011 cotton crops under the 2008 farm bill) on all cotton spun in the United States. Special Competitiveness Provisions for extra long staple (ELS) Cotton are continued (the most recent payment was made in March 2010), as well as the Special Import Quota for Upland Cotton (which has never been used). The Cotton Ginning Cost-Share (CGCS) program provides cost-share assistance payments to cotton producers with a share in the 2015 cotton crop. Eligible producers can receive a one-time cost share payment, which is based on a producer’s share (plantings) of 2015 cotton acres reported to FSA multiplied by a payment rate equal to 40 percent of the average ginning cost for their production region. Cost share payments are capped at $40,000 per individual or entity and do not count against payment limitations. General Provisions Applicable to Cotton and Other Crops Upland cotton producers are entitled to receive marketing assistance loans as in previous legislation. For most crops, national average loan rates are fixed for the life of the 2014 farm bill. However, for upland cotton, the base quality loan rate for the 2014-2018 crops is no longer fixed at 52.0 cents per pound, but can range from 45.0 cents per pound to 52.0 cents per pound. The upland cotton loan rate is determined by a simple average of world market prices of the two immediately preceding marketing years prior to the planting of the crop to which the new loan rate will apply, adjusted to U.S. quality and location (the adjusted world price or AWP). Based on AWPs well above 52.0 cents in recent years, 2014-, 2015-, and 2016-crop loan rates are 52.0 cents per pound. However, because the average AWP during 2014 and 2015 was below 52.00 cents per pound, the 2017 loan rate will be 49.49 cents per pound. Producers are eligible for marketing assistance loans on their entire production. Loans are available for a period of 9 months beginning with the first full month after the loan is made. Loans are nonrecourse, so that forfeiture of the cotton pledged as collateral to the Commodity Credit Corporation (CCC) constitutes payment of the loan in full, regardless of the current market value of the cotton. If CCC determines that the AWP for upland cotton is below the loan rate, then producers may repay marketing loans at the AWP, receiving a marketing loan gain equal to the difference between the loan rate and the AWP. In addition, CCC credits warehouse storage charges to the producer and waives interest payments on the loan when the AWP is below the loan rate. Eligible producers who agree to forgo CCC loans may receive loan deficiency payments on their total production otherwise eligible for loan. The loan deficiency payment rate is equal to the difference, if any, between the loan rate and the loan repayment rate (AWP) in effect during the week in which the application for payment is filed.
A $125,000 per person payment limit applies to combined program benefits, such as marketing loan gains and loan deficiency payments and benefits received by farmers under ARC/PLC. Beginning with the 2015 crop year, the CCC can issue commodity certificates to agricultural producers that can be exchanged for marketing assistance loan (MAL) collateral. This allows producers with outstanding MALs to purchase certificates and then exchange the certificate for their outstanding loan collateral rather than forfeit that loan collateral to CCC at loan maturity. Provisions Specific to Upland Cotton The 3-step competitiveness program that had been retained in the 2002 Act to help keep U.S. cotton prices competitive has undergone considerable change. Step 1, which had last been used in April 1992, was changed from mandatory AWP adjustment criteria to the more discretionary criteria common to all marketing loans. The criteria now applicable to Step 1 adjustments include minimizing forfeitures, minimizing the accumulation of Government stocks, ensuring that U.S. cotton can be marketed domestically and internationally, and ensuring that the transition from old-crop to new-crop price quotations does not disrupt the market. Step 2, which required issuance of marketing certificates to U.S. domestic users and exporters when U.S. prices were above international prices, was eliminated, effective August 1, 2006, in the Deficit Reduction Act of 2005 (Section 1103 of PL 109-171). The WTO ruled that Step 2 was a prohibited export subsidy when paid to exporters and a prohibited domestic use subsidy when paid to U.S. mills. Step 3, formally known as the Special Import Quota, provides additional import access if the U.S. Far East price exceeds the prevailing world market price in each week of a consecutive 4-week period. The quota equals 1 week's domestic mill consumption based on the seasonally adjusted average rate for the most recent 3 months for which data are available. This is approximately 12.8million kilograms or 60,000 480-pound bales. Importers have 90 days to purchase and an additional 90 days to import the cotton. Quotas established under this provision can overlap. In a separate provision, a limited global import quota must be established whenever the average spot market price for SLM 1-1/16 inch cotton during the preceding month exceeds 130 percent of such average price during the preceding 36 months. The amount of the limited global import quota is equal to 21 days of domestic consumption except when a special quota has been established during the previous 12 months, in which case the quota would be the smaller of 21 days of domestic consumption or an amount needed to increase the supply of cotton to 130 percent of the demand. A 90-day period will be allowed for entering cotton under this quota. This quota cannot be in effect while a Special Import Quota is in effect. Even if neither of the quotas is in effect, cotton still may be imported under the tariff rate quotas (TRQ) established pursuant to the General Agreement on Tariffs and Trade (GATT). Over the next twelve months, approximately 165,000 bales of raw upland cotton (staple 35 or less) may
be imported at the "in-quota" tariff level under the TRQs and about 184,000 bales of extra-long staple. ELS Cotton: The 2014 Act provides for a nonrecourse loan program for extra long staple (ELS) cotton with no changes from the 2008 Act provisions. The national average loan rate established for the 2014 through 2018 crops is 79.77 cents per pound (80.85 cents per pound when adjusted to grade 2 staple 46.) Producers participating in the program are eligible for loans on their entire production. Loans are available for a term of 9 months beginning with the first entire month after the loan is made. Loans are nonrecourse, i.e., forfeiture of the pledged cotton to the Commodity Credit Corporation (CCC) constitutes payment of the loan in full, regardless of the current market value of the cotton. ELS cotton is not eligible for marketing loan benefits. The 2014 Act provided no authority for ARC/PLC or for the acreage reduction programs for ELS cotton. ELS cotton may be grown on any farm without restriction, and producers are eligible for marketing assistance loans on all ELS cotton produced on participating farms.
Export Credit Programs
The Commodity Credit Corporation (CCC) began using a risk-based fee structure for the GSM-102 program in 2005. Fee rates are based on the country risk that CCC is undertaking, as well as the repayment term (tenor) and repayment frequency (annual or semi-annual). For the GSM-102 program, country risk is based on the country of the foreign obligor (opening bank), as determined by the CCC. CCC Export Credit Guarantee Program GSM-102 Initiated in 1981, the GSM-102 program attempts to develop, maintain or increase markets for U.S. agricultural commodities. The program assists U.S. exporters in obtaining short-term (up to 24 months, and will go to 18 months in 2018 result of the Nairobi Ministerial) commercial financing by providing loan guarantee protection against the risk of non-payment for both commercial and non-commercial reasons. The program requires that export sales be secured by a dollar denominated, irrevocable letter of credit (L/C) issued by a CCC-approved foreign bank. If the foreign bank defaults on payments for any reason, the CCC will pay the exporter or the exporter’s assignee the guaranteed amounts specified in the guarantee and in accordance with the GSM-102 regulations.
From time to time CCC will issue Program Announcements to announce a GSM-102 program allocation for a CCC-approved country or region. The Program Announcement for a country/region allocation may designate specific allocations for U.S. agricultural commodities. Any qualified U.S. exporter with a firm sale of a covered commodity to the specified country or region may submit an application for a guarantee under the GSM-102 program but the application must be submitted prior to shipment. A guarantee fee must also be received by CCC before the guarantee will be issued. The exporter should first determine whether foreign bank financing is available. The export sale must be secured by an irrevocable letter of credit payable in U.S. dollars from a CCC-approved foreign bank.
The repayment period or tenor is specified in the announcement. The maximum tenor under GSM-102 is currently 24 months. Approvals of acceptable applications are made up to the dollar limit stated in the announcement. The exporter is provided with a payment guarantee, which specifies the maximum value to be guaranteed by CCC. Presently, CCC generally covers 98 or 97 percent of the exported value. The per annum rate to be used to calculate covered interest shall be the lesser of the interest rate specified in the L/C or 55 percent of the average investment rate of the most recent 52-week Treasury Bill, whichever is less. Coverage is effective from the date of export and continues in force for the period covered. The exporter may assign to a CCC-approved U.S. bank or other financial institution the proceeds payable by CCC under the payment guarantee. Notice of the assignment is submitted to the CCC. Within 30 days (60 days for rail) of export the U.S. exporter must furnish the export information required under 7 CFR, § 1493.80.
If the foreign bank fails to make the scheduled payments required under the L/C, the exporter or assignee must notify CCC of the default within 10 days of the payment's due date (or any extension thereof). The exporter or assignee is permitted up to 6 months from due date to file a claim.
Registrations are made on a first-come, first-served basis COTTON MARKET DEVELOPMENT: Domestic Market Development Under provisions of the Cotton Research and Promotion Act of 1966, a Cotton Research and Promotion Program was started in the United States in 1967. The primary objective is to carry out an effective and continuous program of research and promotion in order to strengthen the competitive position of cotton by expanding domestic and foreign markets for cotton, improving fiber quality, and lowering costs of production. From 1967 to 1990, the program was financed through refundable assessments paid by producers. Amendments to the Act, contained in the 1990 Farm Bill, expanded the funding base for the program by authorizing assessments on imported cotton and cotton-containing products while eliminating refunds of producer paid assessments. These changes became effective in 1992. Assessments are levied on each bale or bale equivalent of cotton at a rate of

$1 per bale with a supplemental assessment not to exceed one percent of the value of lint of each bale. The Act provides for the establishment of a Cotton Board to assist the Secretary of Agriculture by administering the Cotton Research and Promotion Program. The Board collects funds from cotton producers and importers to promote and research the use of cotton and its products. The Board reviews all proposed projects and budgets and recommends programs for approval by the Secretary of Agriculture. The Cotton Board consists of 38 cotton producer and importer representatives appointed by the Secretary of Agriculture from nominations submitted by certified cotton producer and importer organizations. Cotton Board members represent each major cotton-producing state in the United States and cotton importers. Research, promotion and technical assistance activities are carried out by a contracting organization, Cotton Incorporated. Research activities funded under the Cotton Research and Promotion Program effectively develop innovative processes and treatments for cotton to provide consumers with the latest in fiber technology. International Market Development Cotton Incorporated: Cotton Incorporated's overseas operations began in 1973, with the purpose of expanding markets for cotton by providing technical and marketing assistance abroad. Cotton Incorporated maintains headquarters in United States with offices in China, Japan, Hong Kong, and Mexico. Experts from Cotton Incorporated work closely with mills and their customers to develop and deliver the best cotton products possible. They also help importers establish productive supply chains and sourcing relationships worldwide. Overseas activities include technical servicing to mills to enhance cotton processing technologies, introduction of new fabric and technological advances, and the presentation of color and fabric trend forecasting. Cotton Council International: Cotton Council International (CCI) is the export promotion arm of the National Cotton Council of America. CCI's mission is to increase exports of U.S. cotton, cottonseed and U.S. manufactured cotton products through activities that affect every phase of the marketing chain -- from the initial mill buyer of cotton fiber or purchaser of U.S. cotton-rich yarns and fabrics on through to the final consumer. These activities are partly funded by the Foreign Agricultural Service of the U.S. Department of Agriculture.
From its offices in the United States, the United Kingdom, Korea, China and Hong Kong, along with in-country representatives throughout Asia, Latin America and Europe, CCI executes a strategic mix of programs designed to stimulate trade and consumer demand for U.S. cotton. CCI promotes quality containing 51 percent or more U.S. cotton under the COTTON USA program, reaching about 3 billion current and potential customers of U.S. cotton in more than 50 countries worldwide. Examples of CCI activities include: orientation tours to the United States for foreign cotton spinners and manufacturers’ representatives; trade missions to cotton-consuming countries for producers, exporters and government representatives; marketing support via advertising campaigns and retail sales promotions; and buying delegations for COTTON USA partners to targeted sourcing countries.
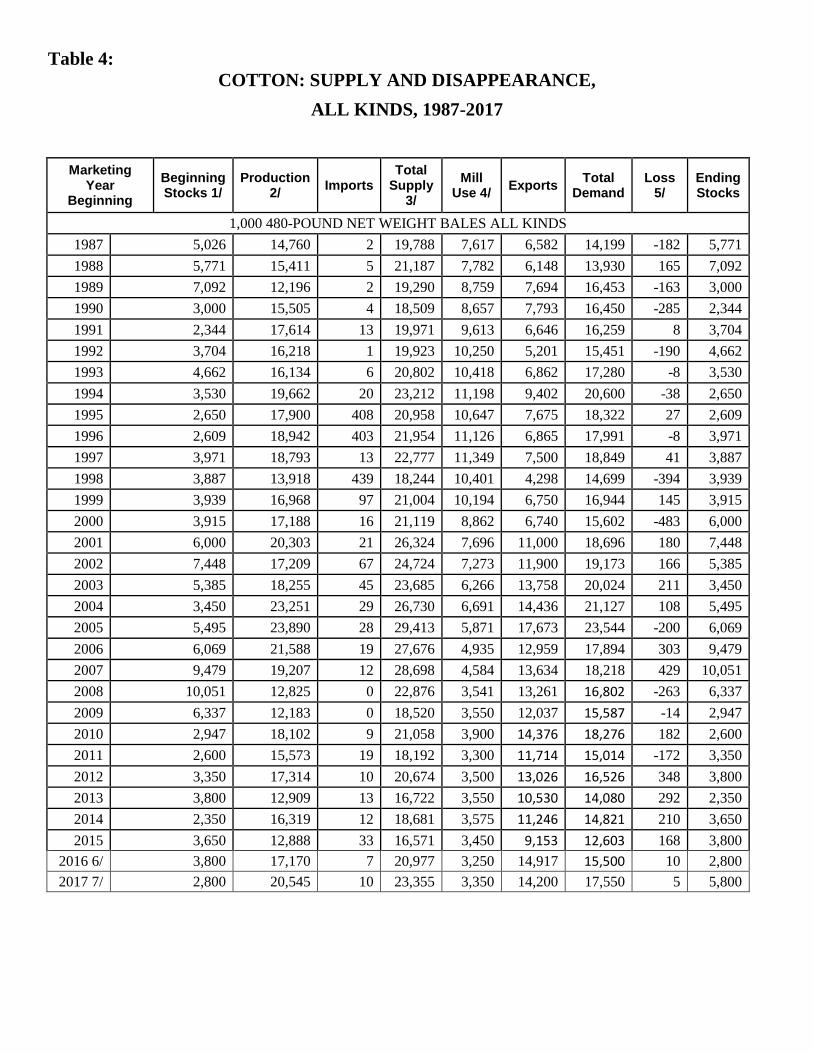
Table 4: COTTON: SUPPLY AND DISAPPEARANCE,
ALL KINDS, 1987-2017
Marketing Year
Beginning Beginning Stocks 1/
Production 2/ Imports
Total Supply
3/ Mill
Use 4/ Exports Total Demand
Loss 5/
Ending Stocks
1,000 480-POUND NET WEIGHT BALES ALL KINDS 1987 5,026 14,760 2 19,788 7,617 6,582 14,199 -182 5,771 1988 5,771 15,411 5 21,187 7,782 6,148 13,930 165 7,092 1989 7,092 12,196 2 19,290 8,759 7,694 16,453 -163 3,000 1990 3,000 15,505 4 18,509 8,657 7,793 16,450 -285 2,344 1991 2,344 17,614 13 19,971 9,613 6,646 16,259 8 3,704 1992 3,704 16,218 1 19,923 10,250 5,201 15,451 -190 4,662 1993 4,662 16,134 6 20,802 10,418 6,862 17,280 -8 3,530 1994 3,530 19,662 20 23,212 11,198 9,402 20,600 -38 2,650 1995 2,650 17,900 408 20,958 10,647 7,675 18,322 27 2,609 1996 2,609 18,942 403 21,954 11,126 6,865 17,991 -8 3,971 1997 3,971 18,793 13 22,777 11,349 7,500 18,849 41 3,887 1998 3,887 13,918 439 18,244 10,401 4,298 14,699 -394 3,939 1999 3,939 16,968 97 21,004 10,194 6,750 16,944 145 3,915 2000 3,915 17,188 16 21,119 8,862 6,740 15,602 -483 6,000 2001 6,000 20,303 21 26,324 7,696 11,000 18,696 180 7,448 2002 7,448 17,209 67 24,724 7,273 11,900 19,173 166 5,385 2003 5,385 18,255 45 23,685 6,266 13,758 20,024 211 3,450 2004 3,450 23,251 29 26,730 6,691 14,436 21,127 108 5,495 2005 5,495 23,890 28 29,413 5,871 17,673 23,544 -200 6,069 2006 6,069 21,588 19 27,676 4,935 12,959 17,894 303 9,479 2007 9,479 19,207 12 28,698 4,584 13,634 18,218 429 10,051 2008 10,051 12,825 0 22,876 3,541 13,261 16,802 -263 6,337 2009 6,337 12,183 0 18,520 3,550 12,037 15,587 -14 2,947 2010 2,947 18,102 9 21,058 3,900 14,376 18,276 182 2,600 2011 2,600 15,573 19 18,192 3,300 11,714 15,014 -172 3,350 2012 3,350 17,314 10 20,674 3,500 13,026 16,526 348 3,800 2013 3,800 12,909 13 16,722 3,550 10,530 14,080 292 2,350 2014 2,350 16,319 12 18,681 3,575 11,246 14,821 210 3,650 2015 3,650 12,888 33 16,571 3,450 9,153 12,603 168 3,800
2016 6/ 3,800 17,170 7 20,977 3,250 14,917 15,500 10 2,800 2017 7/ 2,800 20,545 10 23,355 3,350 14,200 17,550 5 5,800

Table 4 continued: COTTON: SUPPLY AND DISAPPEARANCE,
UPLAND, 1987-2017
Marketing Year
Beginning Beginning Stocks 1/
Production 2/ Imports
Total Supply
3/ Mill
Use 4/ Exports Total Demand
Loss 5/
Ending Stocks
1,000 480-POUND NET WEIGHT BALES UPLAND 1987 4,942 14,475 2 19,419 7,565 6,345 13,910 -209 5,718 1988 5,718 15,077 5 20,800 7,711 5,883 13,594 180 7,026 1989 7,026 11,504 2 18,532 8,686 7,242 15,928 -194 2,793 1990 2,798 15,147 4 17,949 8,592 7,378 15,970 -283 2,262 1991 2,262 17,216 13 19,491 9,548 6,348 15,896 12 3,583 1992 3,583 15,710 1 19,294 10,190 4,869 15,059 -221 4,456 1993 4,456 15,764 6 20,226 10,346 6,555 16,901 22 3,303 1994 3,303 19,324 18 22,645 11,109 8,978 20,087 -30 2,588 1995 2,588 17,532 400 20,520 10,538 7,375 17,913 64 2,543 1996 2,543 18,413 403 21,359 11,020 6,399 17,419 20 3,920 1997 3,920 18,245 13 22,178 11,234 7,060 18,294 62 3,822 1998 3,822 13,476 427 17,725 10,254 4,010 14,264 -375 3,836 1999 3,836 16,294 53 20,183 10,055 6,303 16,358 160 3,665 2000 3,665 16,799 8 20,472 8,738 6,303 15,041 -448 5,879 2001 5,879 19,603 6 25,488 7,592 10,603 18,195 173 7,120 2002 7,120 16,531 10 23,660 7,170 11,266 18,436 85 5,140 2003 5,140 17,823 4 22,967 6,204 13,239 19,443 140 3,384 2004 3,384 22,505 8 25,897 6,629 13,683 20,312 103 5,482 2005 5,482 23,260 9 28,751 5,820 17,115 22,935 -175 5,991 2006 5,991 20,823 10 26,824 4,896 12,324 17,220 313 9,291 2007 9,291 18,355 6 27,652 4,548 12,801 17,349 408 9,895 2008 9,895 12,395 0 22,289 3,512 13,029 16,541 -284 6,032 2009 6,032 11,783 0 17,815 3,529 11,343 14,872 14 2,929 2010 2,929 17,598 2 20,529 3,874 13,881 17,755 202 2,572 2011 2,572 14,722 13 17,307 3,278 11,120 14,398 -172 3,081 2012 3,081 16,534 6 19,621 3,478 12,182 15,660 348 3,613 2013 3,613 12,275 6 15,894 3,527 9,850 13,377 292 2,225 2014 2,225 15,753 9 17,987 3,550 10,836 14,386 210 3,391 2015 3,391 12,455 30 15,876 3,425 8,619 12,044 168 3,664 2016 3,664 16,601 5 20,270 3,220 14,303 17,523 10 2,737
2017 6/ 2,737 19,775 10 22,522 3,320 13,550 16,870 5 5,647

Table 4 continued: COTTON: SUPPLY AND DISAPPEARANCE,
ELS, 1987-2017
Marketing Year
Beginning Beginning Stocks 1/
Production 2/ Imports
Total Supply
3/
Mill Use 4/
Exports Total Demand
Loss 5/
Ending Stocks
1,000 480-POUND NET WEIGHT BALES EXTRA-LONG STAPLE 1987 84 285 0 369 52 237 289 27 53 1988 53 334 0 387 71 265 336 -15 66 1989 66 692 0 758 73 452 525 31 202 1990 202 358 0 560 65 415 480 -2 82 1991 82 398 0 480 65 298 363 -4 121 1992 121 508 0 629 60 332 392 31 206 1993 206 370 0 576 72 307 379 -30 227 1994 227 338 2 567 89 424 513 -8 62 1995 62 368 8 438 109 300 409 -37 66 1996 66 529 0 595 106 466 572 -28 51 1997 51 548 0 599 115 440 555 -21 65 1998 65 442 12 519 147 288 435 -19 103 1999 103 674 44 821 139 447 586 -15 250 2000 250 389 8 647 124 437 561 -35 121 2001 121 700 15 836 104 397 501 7 328 2002 328 678 57 1,063 103 634 737 81 245 2003 245 432 41 718 62 519 581 71 66 2004 66 746 21 833 62 753 815 5 13 2005 13 630 19 662 51 558 609 -25 78 2006 78 765 9 852 39 635 674 -10 188 2007 188 852 6 1,046 36 833 869 21 156 2008 156 431 0 587 29 232 261 21 305 2009 305 400 0 705 21 694 715 -28 18 2010 18 504 7 529 26 495 521 -20 28 2011 28 851 6 885 22 594 616 0 269 2012 269 780 4 1,053 22 844 866 0 187 2013 187 634 7 828 23 680 703 0 125 2014 125 566 3 694 25 410 435 0 259 2015 259 433 3 695 25 534 559 0 136
2016 6/ 136 569 2 707 30 614 644 0 63 2017 7/ 63 770 0 833 30 650 680 0 153

1/ Compiled from Bureau of the Census data and adjusted to an August 1 480-pound net weight basis. Excludes preseason ginnings. Beginning in 2012, stocks are estimated by USDA.
2/ Includes preseason ginnings. 3/ Totals made from unrounded data. 4/ Adjusted to August 1-July 31 marketing year. 5/ Difference between ending stocks based on Census data and preceding season's supply less disappearance. For
upland cotton, this difference primarily reflects an increase of an estimated one percent in average bale weights due to moisture absorption once cotton is ginned and begins to flow through marketing channels.
6/ Estimate. 7/ Forecast.
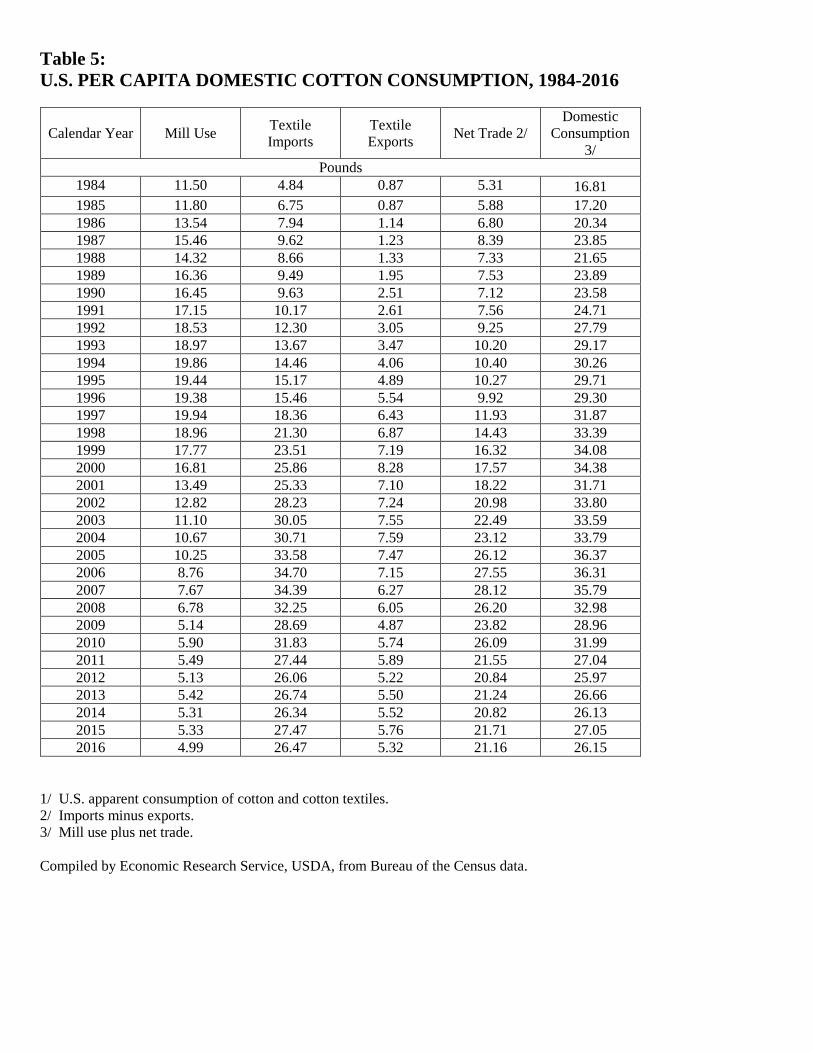
Table 5: U.S. PER CAPITA DOMESTIC COTTON CONSUMPTION, 1984-2016
Calendar Year Mill Use Textile Imports
Textile Exports Net Trade 2/
Domestic Consumption
3/ Pounds
1984 11.50 4.84 0.87 5.31 16.81 1985 11.80 6.75 0.87 5.88 17.20 1986 13.54 7.94 1.14 6.80 20.34 1987 15.46 9.62 1.23 8.39 23.85 1988 14.32 8.66 1.33 7.33 21.65 1989 16.36 9.49 1.95 7.53 23.89 1990 16.45 9.63 2.51 7.12 23.58 1991 17.15 10.17 2.61 7.56 24.71 1992 18.53 12.30 3.05 9.25 27.79 1993 18.97 13.67 3.47 10.20 29.17 1994 19.86 14.46 4.06 10.40 30.26 1995 19.44 15.17 4.89 10.27 29.71 1996 19.38 15.46 5.54 9.92 29.30 1997 19.94 18.36 6.43 11.93 31.87 1998 18.96 21.30 6.87 14.43 33.39 1999 17.77 23.51 7.19 16.32 34.08 2000 16.81 25.86 8.28 17.57 34.38 2001 13.49 25.33 7.10 18.22 31.71 2002 12.82 28.23 7.24 20.98 33.80 2003 11.10 30.05 7.55 22.49 33.59 2004 10.67 30.71 7.59 23.12 33.79 2005 10.25 33.58 7.47 26.12 36.37 2006 8.76 34.70 7.15 27.55 36.31 2007 7.67 34.39 6.27 28.12 35.79 2008 6.78 32.25 6.05 26.20 32.98 2009 5.14 28.69 4.87 23.82 28.96 2010 5.90 31.83 5.74 26.09 31.99 2011 5.49 27.44 5.89 21.55 27.04 2012 5.13 26.06 5.22 20.84 25.97 2013 5.42 26.74 5.50 21.24 26.66 2014 5.31 26.34 5.52 20.82 26.13 2015 5.33 27.47 5.76 21.71 27.05 2016 4.99 26.47 5.32 21.16 26.15
1/ U.S. apparent consumption of cotton and cotton textiles. 2/ Imports minus exports. 3/ Mill use plus net trade.
Compiled by Economic Research Service, USDA, from Bureau of the Census data.
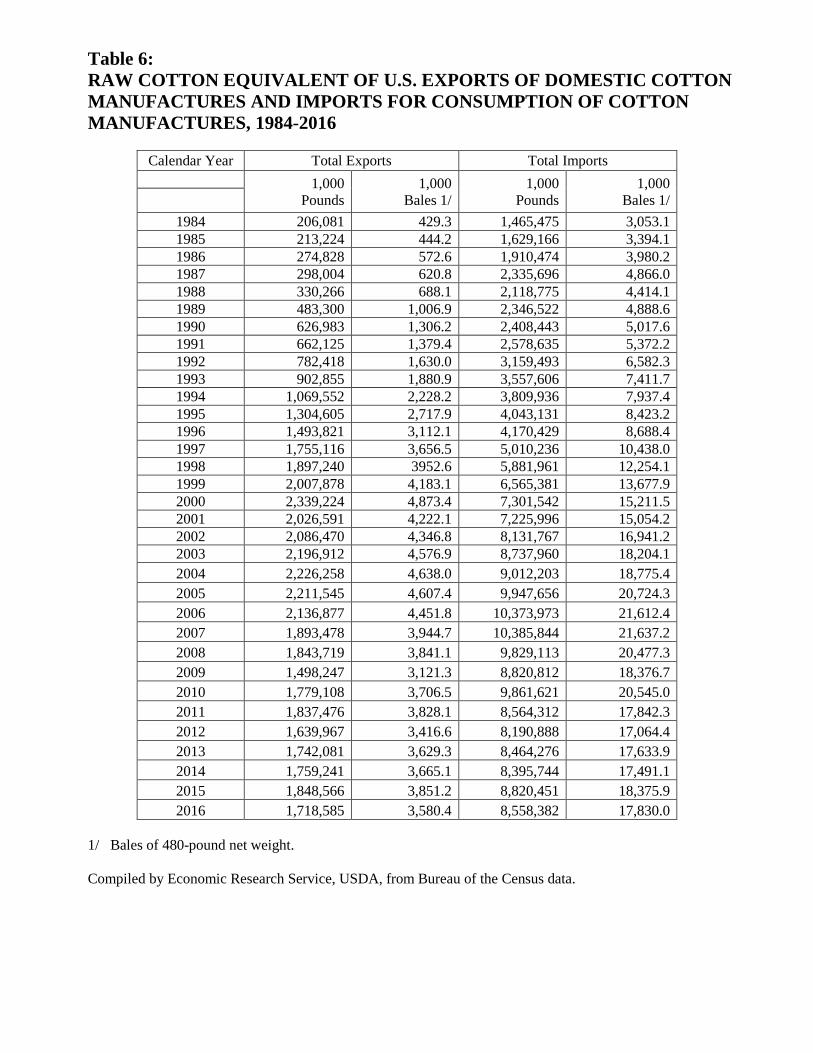
Table 6: RAW COTTON EQUIVALENT OF U.S. EXPORTS OF DOMESTIC COTTON MANUFACTURES AND IMPORTS FOR CONSUMPTION OF COTTON MANUFACTURES, 1984-2016
Calendar Year Total Exports Total Imports
1,000 Pounds
1,000 Bales 1/
1,000 Pounds
1,000 Bales 1/
1984 206,081 429.3 1,465,475 3,053.1 1985 213,224 444.2 1,629,166 3,394.1 1986 274,828 572.6 1,910,474 3,980.2 1987 298,004 620.8 2,335,696 4,866.0 1988 330,266 688.1 2,118,775 4,414.1 1989 483,300 1,006.9 2,346,522 4,888.6 1990 626,983 1,306.2 2,408,443 5,017.6 1991 662,125 1,379.4 2,578,635 5,372.2 1992 782,418 1,630.0 3,159,493 6,582.3 1993 902,855 1,880.9 3,557,606 7,411.7 1994 1,069,552 2,228.2 3,809,936 7,937.4 1995 1,304,605 2,717.9 4,043,131 8,423.2 1996 1,493,821 3,112.1 4,170,429 8,688.4 1997 1,755,116 3,656.5 5,010,236 10,438.0 1998 1,897,240 3952.6 5,881,961 12,254.1 1999 2,007,878 4,183.1 6,565,381 13,677.9 2000 2,339,224 4,873.4 7,301,542 15,211.5 2001 2,026,591 4,222.1 7,225,996 15,054.2 2002 2,086,470 4,346.8 8,131,767 16,941.2 2003 2,196,912 4,576.9 8,737,960 18,204.1 2004 2,226,258 4,638.0 9,012,203 18,775.4 2005 2,211,545 4,607.4 9,947,656 20,724.3 2006 2,136,877 4,451.8 10,373,973 21,612.4 2007 1,893,478 3,944.7 10,385,844 21,637.2 2008 1,843,719 3,841.1 9,829,113 20,477.3 2009 1,498,247 3,121.3 8,820,812 18,376.7 2010 1,779,108 3,706.5 9,861,621 20,545.0 2011 1,837,476 3,828.1 8,564,312 17,842.3 2012 1,639,967 3,416.6 8,190,888 17,064.4 2013 1,742,081 3,629.3 8,464,276 17,633.9 2014 1,759,241 3,665.1 8,395,744 17,491.1 2015 1,848,566 3,851.2 8,820,451 18,375.9 2016 1,718,585 3,580.4 8,558,382 17,830.0
1/ Bales of 480-pound net weight.
Compiled by Economic Research Service, USDA, from Bureau of the Census data.
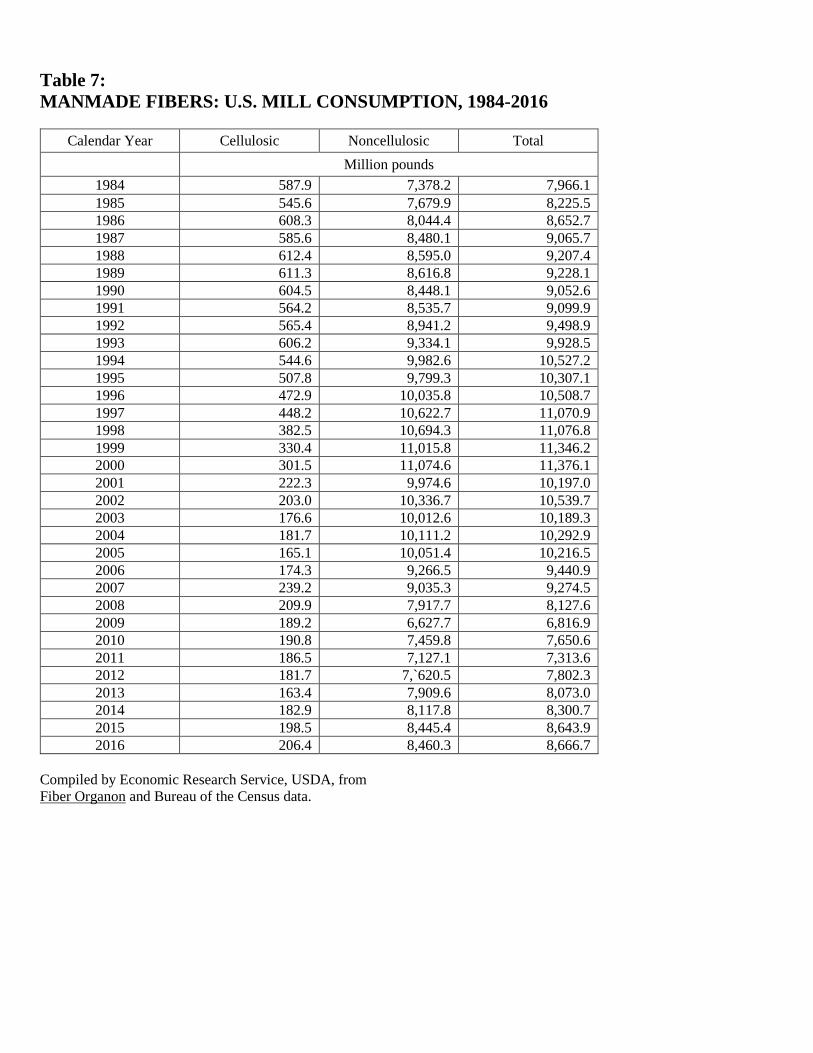
Table 7: MANMADE FIBERS: U.S. MILL CONSUMPTION, 1984-2016
Calendar Year Cellulosic Noncellulosic Total
Million pounds 1984 587.9 7,378.2 7,966.1 1985 545.6 7,679.9 8,225.5 1986 608.3 8,044.4 8,652.7 1987 585.6 8,480.1 9,065.7 1988 612.4 8,595.0 9,207.4 1989 611.3 8,616.8 9,228.1 1990 604.5 8,448.1 9,052.6 1991 564.2 8,535.7 9,099.9 1992 565.4 8,941.2 9,498.9 1993 606.2 9,334.1 9,928.5 1994 544.6 9,982.6 10,527.2 1995 507.8 9,799.3 10,307.1 1996 472.9 10,035.8 10,508.7 1997 448.2 10,622.7 11,070.9 1998 382.5 10,694.3 11,076.8 1999 330.4 11,015.8 11,346.2 2000 301.5 11,074.6 11,376.1 2001 222.3 9,974.6 10,197.0 2002 203.0 10,336.7 10,539.7 2003 176.6 10,012.6 10,189.3 2004 181.7 10,111.2 10,292.9 2005 165.1 10,051.4 10,216.5 2006 174.3 9,266.5 9,440.9 2007 239.2 9,035.3 9,274.5 2008 209.9 7,917.7 8,127.6 2009 189.2 6,627.7 6,816.9 2010 190.8 7,459.8 7,650.6 2011 186.5 7,127.1 7,313.6 2012 181.7 7,`620.5 7,802.3 2013 163.4 7,909.6 8,073.0 2014 182.9 8,117.8 8,300.7 2015 198.5 8,445.4 8,643.9 2016 206.4 8,460.3 8,666.7
Compiled by Economic Research Service, USDA, from Fiber Organon and Bureau of the Census data.
List of USDA and other relevant web sites:
USDA Production, Supply, and Demand Estimates: On line access to USDA’s historical and forecast data for cotton production, consumption, and trade for 120 countries. http://www.fas.usda.gov/psdonline/psdHome.aspx
Cotton and Wool Outlook (CWS): Economic Research Service, U.S. Department of Agriculture. Description: Monthly. Provides information and statistics on domestic and world cotton and wool production, consumption, export sales, use, and prices, including data on raw fibers and textiles. http://usda.mannlib.cornell.edu/MannUsda/viewDocumentInfo.do?documentID=1281
The USDA Economics, Statistics & Market Information System: Contains nearly 300 reports and datasets from the economics agencies of the U.S. Department of Agriculture. These materials cover U.S. and international agriculture and related topics. Most reports are text files that contain time-sensitive information. Most data sets are in spreadsheet format and include time-series data that are updated yearly. http://usda.mannlib.cornell.edu/
The USDA Baseline provides: Long run projections for the U.S. agricultural sector through 2023. Projections cover selected agricultural commodities and agricultural trade, and aggregate indicators such as farm income and food prices. As "baseline" projections, they represent one plausible scenario for the next ten years, and reflect both model results and judgment http://www.ers.usda.gov/topics/farm-economy/agricultural-baseline-projections.aspx#.VBc2a_ldV8E
AMS The Cotton Program: The program promotes the orderly and efficient marketing of cotton by preparing, distributing, and encouraging the use of universal cotton classification standards, and by providing cotton classification and market news that meet the needs and expectations of the cotton and textile industries. http://www.ams.usda.gov/cotton/index.htm
USDA AMS Market News Reports - Cotton Reports: AMS provides current, unbiased price and sales information to assist in the orderly marketing and distribution of farm commodities. http://www.ams.usda.gov/market-news/cotton
USDA - National Agricultural Statistics Service Reports by Commodity: https://www.nass.usda.gov/Publications/index.php
World Agricultural Outlook Board WASDE REPORT: The World Agricultural Supply and Demand Estimates (WASDE) report is available electronically within one hour of release. http://www.usda.gov/oce/commodity/wasde/index.htm
Farm Service Agency (FSA): The Farm Service Agency provides "Program Fact Sheets" in Portable Document Format (PDF) on all commodity programs including cotton. https://www.fsa.usda.gov/news-room/fact-sheets/index
Export Credit Guarantee Programs: The Commodity Credit Corporation (CCC), U.S. Department of Agriculture, administers export credit guarantee programs for commercial financing of U.S. agricultural exports. http://www.fas.usda.gov/excredits/ecgp.asp
United States Farm Bill: Information on the U.S. Farm Bill. https://www.fsa.usda.gov/programs-and-services/farm-bill/index