tariff order fy201011
TRANSCRIPT

8/6/2019 Tariff Order FY201011
http://slidepdf.com/reader/full/tariff-order-fy201011 1/121
CENTRAL ELECTRICITY REGULATORY COMMISSIONNEW DELHI
Coram1. Dr. Pramod Deo, Chairperson2. Shri S.Jayaraman, Member3. Shri V.S.Verma, Member
Petition No.53/2010 (Suo Motu)
IN THE MATTER OF
Determination of generic levellised generation tariff under Regulation 8 of the
Central Electricity Regulatory Commission (Terms and Conditions for Tariff determinationfrom Renewable Energy Sources) Regulations, 2009 and Central Electricity Regulatory
Commission (Terms and Conditions for Tariff determination from Renewable Energy
Sources) (First Amendment) Regulations, 2010.
ORDER
1. In exercise of the powers vested under Section 61 read with Section 178 of the Act
and after previous publication, the Commission has notified the Central Electricity
Regulatory Commission (Terms and Conditions for Tariff determination from
Renewable Energy Sources) Regulations, 2009, (hereinafter referred to as “the
RE Regulations”). The RE Regulations provide for terms and conditions and the
procedure for determination of tariff of the following categories of renewable

8/6/2019 Tariff Order FY201011
http://slidepdf.com/reader/full/tariff-order-fy201011 2/121
(c) Biomass Power Projects;
(d) Non-fossil fuel-based co-generation Plants;
(e) Solar Photo voltaic (PV) and Solar Thermal Power Projects.
2. The Renewable Energy (RE) Regulations require the Commission to determine
the generic tariff on the basis of the suo motu petition, for the RE technologies for
which norms have been provided in the regulations. Generic Tariff is different from
the project specific tariff for which a project developer has to file petition before
the commission as per the format provided in the RE regulations. Pertinently,
project specific tariff has been envisaged for the new RE technologies and the
technologies which are still at the nascent stage of development, and the
Commission shall determine the project specific tariff for such technologies on a
case to case basis.
3. Clause (1) of Regulation 8 of the RE Regulations provides that “the Commission
shall determine the generic tariff on the basis of suo motu petition at least six
months in advance at the beginning of each year of the Control period for
renewable energy technologies for which norms have been specified under the
Regulations.” The Commission has notified the RE Tariff Regulations on
16.9.2009 and subsequently issued generic suo-motu tariff order, which was
applicable for the renewable energy projects to be commissioned during first year

8/6/2019 Tariff Order FY201011
http://slidepdf.com/reader/full/tariff-order-fy201011 3/121
generic tariff of the RE projects for the second year of control period (i.e. FY 2010-
11).
4. The Commission has made the following provision in regulation 8 through the
CERC (Terms and Conditions for Tariff determination from Renewable Energy
Sources) (First Amendment) Regulations, 2010, as under:
“(2) Notwithstanding anything contained in these regulations,
a) the generic tariff determined for Solar PV projects based on the capital cost
and other norms applicable for the year 2010-11 shall also apply for such
projects during the year 2011-12; and
b) the generic tariff determined for Solar thermal projects based on the capital
cost and other norms for the year 2010-11 shall also apply for such projects
during the years 2011-12 and 2012-13,
provided that (i) the Power Purchase Agreements in respect of the Solar PV
projects and Solar thermal projects as mentioned in this clause are signed on or
before 31st March, 2011; and (ii) the entire capacity covered by the Power
Purchase Agreements is commissioned on or before 31st March, 2012 in respect
of Solar PV projects and on or before 31st March, 2013 in respect of Solar thermal
projects.”
5. In pursuance of First Amendment to the RE Tariff Regulations, the Commission,
through this order based on the financial principles and technology specific
8/6/2019 Tariff Order FY201011
http://slidepdf.com/reader/full/tariff-order-fy201011 4/121
shall be signed before March 31, 2011 and entire capacity shall be commissioned
on or before March 31, 2012 in case of solar PV projects and on or before March
31, 2013 in case of thermal projects.
6. The proposed generic levellised generation tariff for various renewable energy
technologies other than solar, for 2010-11 and for solar PV projects for 2010-11
and 2011 – 12 and for solar thermal projects for 2010-11, 2011-12 and 2012-13
(subject to the conditions stipulated in the first amendment to RE Regulations as
highlighted in the preceding para) are discussed below:
USEFUL LIFE
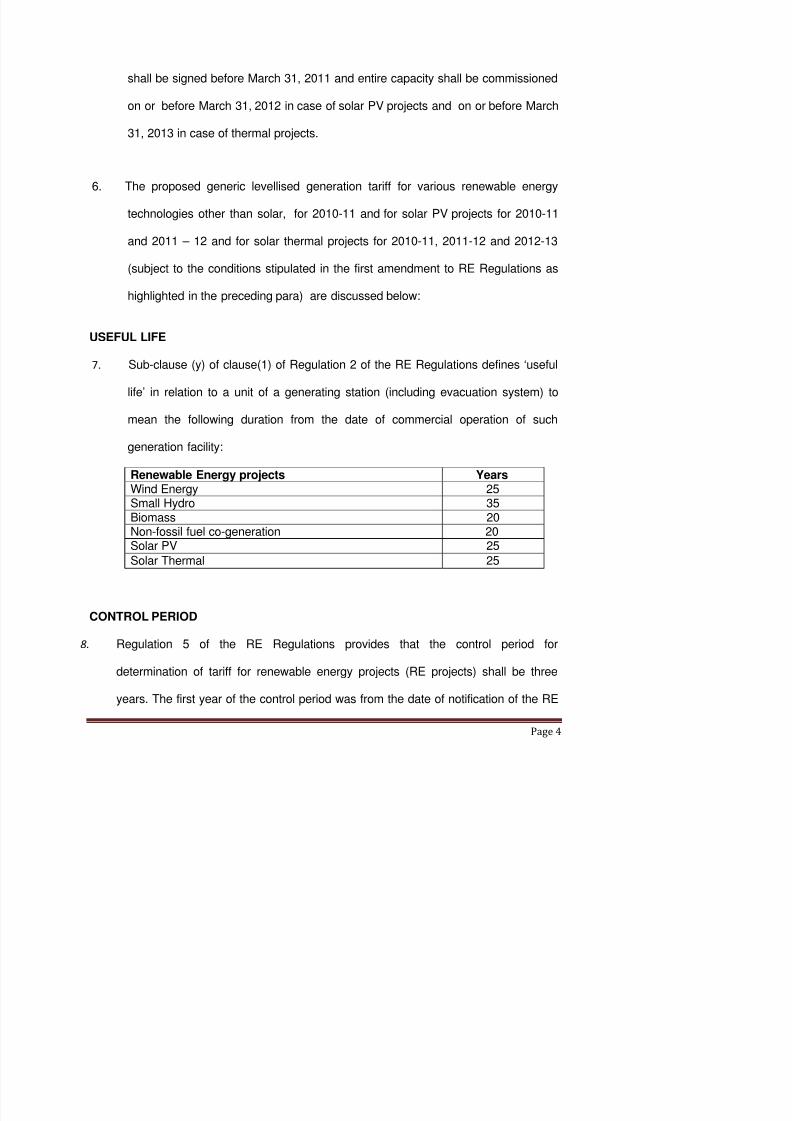
7. Sub-clause (y) of clause(1) of Regulation 2 of the RE Regulations defines ‘useful
life’ in relation to a unit of a generating station (including evacuation system) to
mean the following duration from the date of commercial operation of such
generation facility: Renewable Energy projects Years Wind Energy 25Small Hydro 35Biomass 20
Non-fossil fuel co-generation 20Solar PV 25
Solar Thermal 25

8/6/2019 Tariff Order FY201011
http://slidepdf.com/reader/full/tariff-order-fy201011 5/121
Regulations till 31.3.2010 and the second year of the control period shall by FY
2010-11.The Proviso to the said regulation stipulates that the tariff determined for
the RE projects commissioned during the control period shall continue to be
applicable for the entire duration of the tariff period as specified in Regulation 6 of
the RE Regulations. However, the benchmark cost for Solar PV and Solar thermal
may be reviewed by the Commission annually. Further, as per First Amendment to
RE Regulations, generic tariff determined for solar photovoltaic power projects for
year 2010-11 shall also apply for projects commissioned during 2011-12 also the
generic tariff determined for solar thermal power projects for year 2010-11 shall also
apply for projects commissioned during 2011-12 and 2012-13, subject to the
conditions stipulated in the amendment.
TARIFF PERIOD
9. In terms of Regulation 6 of the RE Regulations, the tariff period in respect of the
RE projects is as under:
Renewable Energy Projects Years
Wind Energy 13
Small Hydro (less than 5MW) 35
Small Hydro (between 5MW to 25 MW) 13
Biomass 13Non-fossil fuel co-generation 13
Solar PV and Solar Thermal 25

8/6/2019 Tariff Order FY201011
http://slidepdf.com/reader/full/tariff-order-fy201011 6/121
In terms of clauses (4) and (5) of the said regulation, the tariff period specified
above shall be reckoned from the date of commercial operation of the RE projects
and the tariff determined under the regulations shall be applicable for the duration
of the tariff period.
TARIFF STRUCTURE
10. Clause (1) of Regulation 9 of the RE Regulations stipulates that the tariff for RE
projects shall be single part tariff consisting of the following fixed cost
components:
(a) Return on equity;
(b) Interest on loan capital;
(c) Depreciation;
(d) Interest on working capital;
(e) Operation and maintenance expenses;
For renewable energy technologies having fuel cost component, like biomass
power projects and non-fossil fuel based cogeneration, single part tariff with two
components, fixed cost component and fuel cost component, is to be determined.
TARIFF DESIGN
11. In terms of Regulation 10 of the RE Regulations, the tariff design for renewable

8/6/2019 Tariff Order FY201011
http://slidepdf.com/reader/full/tariff-order-fy201011 7/121
commissioning of the project for fixed cost component while the fuel cost component shall be specified on year of operation basis.
(2) For the purpose of levellised tariff computation, the discount factor equivalent to weighted average cost of capital shall be considered.
(3) Levellisation shall be carried out for the ‘useful life’ of the Renewable Energy while tariff shall be specified for the period equivalent to ‘Tariff Period.”
LEVELLISED TARIFF
12. Levellised Tariff is calculated by carrying out levellisation for ‘useful life’ of each
technology considering the discount factor for time value of money.
Discount Factor
The discount factor considered for this purpose is equal to the weighted average
cost of the capital on the basis of normative debt: equity ratio (70:30) specified in
the Regulations. Considering the normative debt equity ratio and weighted
average of the rates for interest and equity component, the discount factor is
calculated.
Interest Rate considered for the loan component (i.e. 70%) of Capital Cost is
13.39% (as explained later). For equity component (i.e. 30%) rate of Return on
Equity (ROE) for the first ten (10) years is 19% and for 11th year onward till useful
life of the RE project the rate is 24%. Based on these rates, the weighted average
of rate of ROE has been calculated which is around 22% (ranging from 21.5% to
22.5% depending on useful life of RE technologies).

8/6/2019 Tariff Order FY201011
http://slidepdf.com/reader/full/tariff-order-fy201011 8/121
DetailsWind
EnergySmall Hydro Biomass
Non-fossilfuel co-generati
on
SolarPV
SolarThermal
Less than5 MW(HimachalPradesh,Uttarakhand andNorthEasternStates)
Between 5MW to 25MW(HimachalPradesh,Uttarakhand andNorthEasternStates
OtherStates(below5 MW
Otherstates(5 MWto 25MW)
DiscountRate(%)
15.97 16.14 16.14 16.14 16.14 15.82 15.82 15.97 15.97
CAPITAL COST
13. Regulation 12 of the RE Regulations stipulates that the norms for the capital cost
as specified in the technology specific chapter shall be inclusive of all capital
works like plant and machinery, civil works, erection and commissioning, financing
and interest during construction, and evacuation infrastructure up to inter-
connection point. The Commission has specified the normative capital cost,
applicable for the first year of control period i.e. FY 2009-10, for various RE
technologies viz Wind Energy, Small Hydro Power, Biomass Power, Non-Fossil
Fuel based Cogeneration Solar PV and Solar Thermal Projects.
In order to determine the normative capital cost for the remaining years of the

8/6/2019 Tariff Order FY201011
http://slidepdf.com/reader/full/tariff-order-fy201011 9/121
shall take into account adjustments in capital cost with the changes in Wholesale
Price Index of Steel and Wholesale Price Index of Electrical Machinery as per
formulation stipulated under the RE Tariff Regulations, which is reproduced below.
CC(n) = P&M(n)* (1+F1+F2+F3)
P&M(n) = P&M(0) * (1+d(n))
d(n) = [a*{(SI(n-1) /SI(0))– 1} + b*{(EI(n-1) /EI(0)) – 1}]/(a+b)
Where,
CC (n) = Capital Cost for nth year
P&M (n) = Plant and Machinery Cost for nth year
P&M (0) = Plant and Machinery Cost for the base year
Note: P&M (0) is to be computed by dividing the base capital cost (for the first
year of the control period) by (1+F1+F2+F3). Factors F1, F2, F3 for each RE
technology has been specified separately, as summarized in following table.
d (n) = Capital Cost escalation factor for year (n) of Control Period
SI (n-1) = Average WPI Steel Index prevalent for calendar year (n-1) of the Control
Period
SI (0) = Average WPI Steel Index prevalent for calendar year (0) at the beginning
of the Control Period i.e. January 2008 to December 2008
EI (n-1) = Average WPI Electrical Machinery Index prevalent for calendar year (n-1)

8/6/2019 Tariff Order FY201011
http://slidepdf.com/reader/full/tariff-order-fy201011 10/121
a = Constant to be determined by Commission from time to time,
(for weightage to Steel Index)
b = Constant to be determined by Commission from time to time,
(for weightage to Electrical Machinery Index)
F1 = Factor for Land and Civil Works
F2 = Factor for Erection and Commissioning
F3 = Factor for IDC and Financing Cost
The default values of the factors for various RE technologies as stipulated under the said
RE Regulations, is summarized in the table below,
Parameters Wind EnergySmall Hydro
ProjectsBiomass
Power
Non-FossilFuel Based
Cogenerationa 0.6 0.6 0.7 0.7b 0.4 0.4 0.3 0.3
F1 0.08 0.16 0.10 0.10F2 0.07 0.10 0.09 0.09
F3 0.10 0.14 0.14 0.14
The Commission has relied on the following sources for relevant information on various
indices:
• Source for WPI (electrical & machinery and iron and steel), WPI ( all commodities),
WPI (Price of HSD): Office of Economic Advisor, Ministry of Commerce & Industry
(www.eaindustry.nic.in)
• Source for IRC (Average Annual Inflation rate for indexed energy charge

8/6/2019 Tariff Order FY201011
http://slidepdf.com/reader/full/tariff-order-fy201011 11/121
Technology specific capital cost of RE projects is discussed hereinunder:
(A) Capital Cost of Wind Energy for FY 2010-11 14. Wind Power projects located at the wind sites having minimum annual Wind
Power Density(WPD) of 200 Watt/m2 measured at hub height of 50 meters and
using new wind turbine generators are eligible for tariff determination under the
RE Regulations. Regulation 24 provides that the capital cost for wind energy
project shall include wind turbine generator including its auxiliaries, land cost, site
development charges and other civil works, transportation charges, evacuation
cost up to inter-connection point, financing charges and IDC.
The Commission under Regulation 24 (2) has specified the normative capital cost
for wind energy projects as Rs. 515Lakh/MW for FY 2009-10 which shall be linked
to the indexation mechanism specified under Regulation 25 of the RE Tariff
Regulations. In line with the indexation mechanism specified in Regulation 25 of
the RE Regulations, the normative capital cost of the Wind Energy Projects shall
be Rs.467Lakh/MW for FY 2010-11. The detailed computations of the indexation
mechanism and determination of the capital cost for FY 2010-11 thereof, has been
enclosed as Appendix-1 of this Order.
(B) Capital cost of Small Hydro Projects for FY 2010-11
15. Small Hydro Projects for the purpose of the RE Regulations cover those projects

8/6/2019 Tariff Order FY201011
http://slidepdf.com/reader/full/tariff-order-fy201011 12/121
16. The Commission under Regulation 28 (1) has specified the normative capital cost
for small hydro projects for FY 2009-10 which shall be linked to the indexation
mechanism specified under Regulation 29 of the RE Regulations.
17. In line with the indexation mechanism, specified in Regulation 29 of the RE Tariff
Regulations, the normative capital cost for FY 2010-11 for Small Hydro Projects
shall be as under,
The detailed computations of the indexation mechanism and the determination of the
capital cost for FY 2010-11 thereof, has been enclosed as Appendix-2 of this Order.
(C) Capital Cost of Biomass based Power Projects for FY 2010-11
Region Project SizeCapital Cost(FY 2009-10)(RsLakh/ MW)
Himachal Pradesh, Uttarakhandand North Eastern States Below 5 MW5 MW to 25 MW 700630
Other States Below 5 MW5 MW to 25 MW
550500
Region Project SizeCapital Cost(FY 2010-11)(RsLakh/ MW)
Himachal Pradesh, Uttarakhandand North Eastern States
Below 5 MW5 MW to 25 MW
635571
Other States Below 5 MW5 MW to 25 MW
499454

8/6/2019 Tariff Order FY201011
http://slidepdf.com/reader/full/tariff-order-fy201011 13/121
19. The Commission under Regulation 34 has specified the normative capital cost for
the biomass power projects based on Rankine cycle technology application using
water cooled condenser as Rs.450 Lakh/MW for FY 2009-10 which shall be linked
to the indexation mechanism specified under Regulation 35 of the RE Tariff
Regulations. In line with the indexation mechanism specified in Regulation 35 of
the RE Regulations, the normative capital cost of the biomass power projects
based on Rankine cycle technology application using water cooled condenser
shall be Rs.403Lakh/MW for FY 2010-11. The detailed calculations of the
indexation mechanism and determination of the capital cost for FY 2010-11
thereof, has been enclosed as Appendix -3 of this Order.
(D) Capital Cost of Non-fossil fuel based Cogeneration Projects for FY 2010-11
20. Non-fossil based cogeneration has been defined as the process in which more
than one form of energy is produced in a sequential manner by using biomass. As
per Regulation 4(4) of the RE Regulations, a project to qualify as the non-fossil
based co-generation project must be using new plant and machinery with topping
cycle mode of operation which uses the non-fossil fuel input for power generation
and utilizes the thermal energy generated for useful heat applications in other
industrial activities simultaneously, and where the sum of useful power output and

8/6/2019 Tariff Order FY201011
http://slidepdf.com/reader/full/tariff-order-fy201011 14/121
2009-10 which shall be linked to the indexation mechanism specified under
Regulation 48 of the RE Tariff Regulations. In line with the indexation mechanism
specified in Regulation 48 of the RE Regulations, the normative capital cost of the
Non-Fossil Fuel based Cogeneration power projects shall be Rs.398Lakh/MW for
FY 2010-11. The detailed computations of the indexation mechanism and
determination of the capital cost for FY 2010-11 thereof, has been enclosed as
Appendix-4 of this Order.
(E) Capital Cost of Solar PV Projects for FY 2010-11
22. Solar Photo Voltaic (PV) power projects which directly convert solar energy into
electricity using the crystalline silicon or thin film technology or any other
technology as approved by the Ministry of New and Renewable Energy and are
connected to the grid qualify for the purpose of tariff determination under the RE
Regulations.
23. As per Regulation 5, the Commission has reviewed vide the Order dated
25.02.2010 in Petition no. 13/2010 benchmark capital cost for Solar PV power
projects and it shall be Rs.1690 Lakh/MW for the FY 2010-11. Further as per the
first amendment to RE Regulations, the generic tariff determined for solar PV
projects based on the benchmark capital cost and other norms applicable for
2010-11 shall also be applicable for such projects commissioned during 2011-12

8/6/2019 Tariff Order FY201011
http://slidepdf.com/reader/full/tariff-order-fy201011 15/121
(F) Solar Thermal Power Project for FY 2010-11
24. In order to qualify for tariff determination under the RE Regulations, Solar Thermal
Power Project shall be based on concentrated solar power technologies with line
focusing or point focusing as may be approved by the Ministry of New and
Renewable Energy and which uses direct sunlight to generate sufficient heat to
operate a conventional power cycle to generate electricity.
25. As per Regulation 5, the Commission has reviewed by the Order dated 25.02.2010
in Petition no. 13/2010 benchmark capital cost for Solar Thermal Power projects
and it shall be Rs.1530 Lakh/MW for the FY 2010-11. Further as per the first
amendment to RE Regulations, the generic tariff determined for solar thermal
projects based on the benchmark capital cost and other norms applicable for
2010-11 shall also be applicable for such projects commissioned during 2011-12
2012-13 subject to the condition that the power purchase agreement (PPA) is
signed on or before 31.03.2011 and entire capacity covered under the PPA is
signed on or before 31.03.2013.
26. The capital cost for the second year (FY 2010-11) of the control period in respect
of the renewable energy power generating stations is summarized as under:
Renewable Energy ProjectsCapital Cost Norm
for FY 2010-11

8/6/2019 Tariff Order FY201011
http://slidepdf.com/reader/full/tariff-order-fy201011 16/121
(d) Other States ( 5MW to 25 MW) 454
(3) Biomass power projects 403
(4) Non-fossil fuel based co-generation projects 398
(5) Solar Photovoltaic power projects(6) Solar Thermal power projects
16901530
DEBT-EQUITY RATIO
27. Clause (1) of Regulation 13 of the RE Regulations provides that the debt-equity
ratio of 70:30 is to be considered for determination of generic tariff based on suo
motu petition.
28. Based on the debt equity ratio of 70:30, the debt and equity components of the
normative capital cost for determination of tariff for the RE projects have been
worked out as under:
Renewable Energy Projects Debt(Rs Lakh) Equity(Rs Lakh)
(1) Wind Energy (for all zones) 326.99 140.14
(2) Small Hydro
Himachal Pradesh, Uttarakhand and NorthEastern States (below 5 MW)
444.46 190.48
Himachal Pradesh, Uttarakhand and NorthEastern States (5 MW to 25 MW)
400.01 171.43
Other States (below 5 MW) 349.21 149.66
Other States ( 5MW to 25 MW) 317.47 136.06
(3) Biomass 281.78 120.76
(4) N f il f l i 278 65 119 42

8/6/2019 Tariff Order FY201011
http://slidepdf.com/reader/full/tariff-order-fy201011 17/121
RETURN ON EQUITY
29. Clause (1) of Regulation 16 of the RE Regulations provides that the value base for
the equity shall be 30% of the capital cost for generic tariff determination. Clause
(2) of the said regulation stipulates the normative return on equity as under:
(a) Pre-tax 19% per annum for the first 10 years, and
(b) Pre-tax 24% per annum from the 11th year onwards.
30. In accordance with the above regulations, return on equity has been worked out in
respect of the RE generating technologies taking the value base of equity as 30%
of the capital cost as under:
DetailsWind
Energy
Small Hydro
Biomass
Non-fossil
fuel co-generati
on
Solar
PV
SolarTherm
al
Less than5 MW(HimachalPradesh,Uttarakhand andNorthEasternStates)
Between5 MW to25 MW(HimachalPradesh,Uttarakhand andNorthEasternStates
OtherStates(below 5MW
Otherstates (5MW to 25MW)
Equityopening (Rsin lakh)
140.14 190.48 171.43 149.66 136.06 120.76 119.42 507 459
Return onEquity forthe first 10years (%)
19 19 19 19 19 19 19 19 19
Return onEquity afterfirst 10 24 24 24 24 24 24 24 24 24

8/6/2019 Tariff Order FY201011
http://slidepdf.com/reader/full/tariff-order-fy201011 18/121
INTEREST ON LOAN
31. Clause (1) of Regulation 14 of the RE Regulations provides that the loan tenure of
10 years is to be considered for the purpose of determination of tariff for RE
projects. Clause (2) of the said regulation provides for computation of the rate of
interest on loan as under:
“(a) The loans arrived at in the manner indicated above shall be considered as gross normative loan for calculation for interest on loan. The normative loan outstanding as on April 1st of every year shall be worked out by deducting the cumulative repayment up to March 31st of previous year from the gross normative loan.
(b) For the purpose of computation of tariff, the normative interest rate shall be considered as average long term prime lending rate (LTPLR) of State Bank of India (SBI) prevalent during the previous year plus 150 basis points.
(c) Notwithstanding any moratorium period availed by the generating company, the repayment of loan shall be considered from the first year of commercial operation of the project and shall be equal to the annual depreciation allowed.”
32. In terms of the above, the computations of interest on loan for determination of
tariff in respect of the RE projects treating the value base of loan as 70% of the
capital cost and the weighted average of SBI prime lending rate for the financial
year 2009-10 (i.e. 11.89%) plus 150 basis points (equivalent to interest rate of
13.39%), are as under:
Period SBI PLR1-Apr- 2009 to 28-June 2009 12.25%29-Jun-2009 to 15-Feb-2010 11.75%Avg. SBI PLR 11.89%Source: State Bank of India (www.statebankofindia.com)

8/6/2019 Tariff Order FY201011
http://slidepdf.com/reader/full/tariff-order-fy201011 19/121
DetailsWind
Energy
Small Hydro
Biomass
Non-fossil fuel
co-generatio
n
SolarPV
SolarThermal
Less than5 MW (HP
,Uttarakha
nd &North
EasternStates)
Between 5MW to
25MW (HP,Uttarakhand
& NorthEasternStates
OtherStates
(below 5MW
Otherstates (5MW to 25
MW)
Gross loanopening
(Rs in lakh)
326.99 444.46 400.01 349.21 317.47 281.78 278.65 1183 1071
Period ofrepayment 10 10 10 10 10 10 10 10 10
Rate ofinterest(%)
13.39 13.39 13.39 13.39 13.39 13.39 13.39 13.39 13.39
DEPRECIATION
33. Regulation 15 of the RE Regulations provides for computation of depreciation in
the following manner:
“(1) The value base for the purpose of depreciation shall be the Capital Cost of the asset admitted by the Commission. The Salvage value of the asset shall be considered as 10% and depreciation shall be allowed up to maximum of 90% of the Capital Cost of the asset.
(2) Depreciation per annum shall be based on ‘Differential Depreciation Approach’ over loan tenure and period beyond loan tenure over useful life computed on ‘Straight Line Method’. The depreciation rate for the first 10 years of the Tariff Period shall be 7% per annum and the remaining depreciation shall be spread over the remaining useful life of the project from 11th year onwards.
(3) Depreciation shall be chargeable from the first year of commercial operation.
Provided that in case of commercial operation of the asset for part of the year,depreciation shall be charged on pro rata basis.”

8/6/2019 Tariff Order FY201011
http://slidepdf.com/reader/full/tariff-order-fy201011 20/121
Details WindEnergy
SmallHydro
Biomass Non-fossilfuel co-
generation
SolarPV
SolarThermal
Useful Life (in years)25 35 20 20 25 25
Rate of depreciation for10 years (%) 7.00 7.00 7.00 7.00 7.00 7.00
Rate of depreciationafter first 10 years (%) 1.33 0.80 2.00 2.00 1.33 1.33
INTEREST ON WORKING CAPITAL
35. Regulation 17 of the RE Regulations provides for the working capital requirements
of the RE projects as under:
“(1) The Working Capital requirement in respect of wind energy projects, small hydro power, solar PV and Solar thermal power projects shall be computed in accordance with the following :
Wind Energy / Small Hydro Power /Solar PV / Solar thermal
(a) Operation & Maintenance expenses for one month;
(b) Receivables equivalent to 2 (Two) months of energy charges for sale of electricity calculated on the normative CUF; (c) Maintenance @ 15% of operation and maintenance expenses
(2) The Working Capital requirement in respect of biomass power projects and non-fossil fuel based co-generation projects shall be computed in accordance with the following clause: Biomass Power and Non-fossil fuel Co-generation
(a) Fuel costs for four months equivalent to normative PLF; (b) Operation & Maintenance expense for one month; (c) Receivables equivalent to 2 (Two) months of fixed and variable charges for sale of electricity calculated on the target PLF; (d) Maintenance spare @ 15% of operation and maintenance expenses
8/6/2019 Tariff Order FY201011
http://slidepdf.com/reader/full/tariff-order-fy201011 21/121
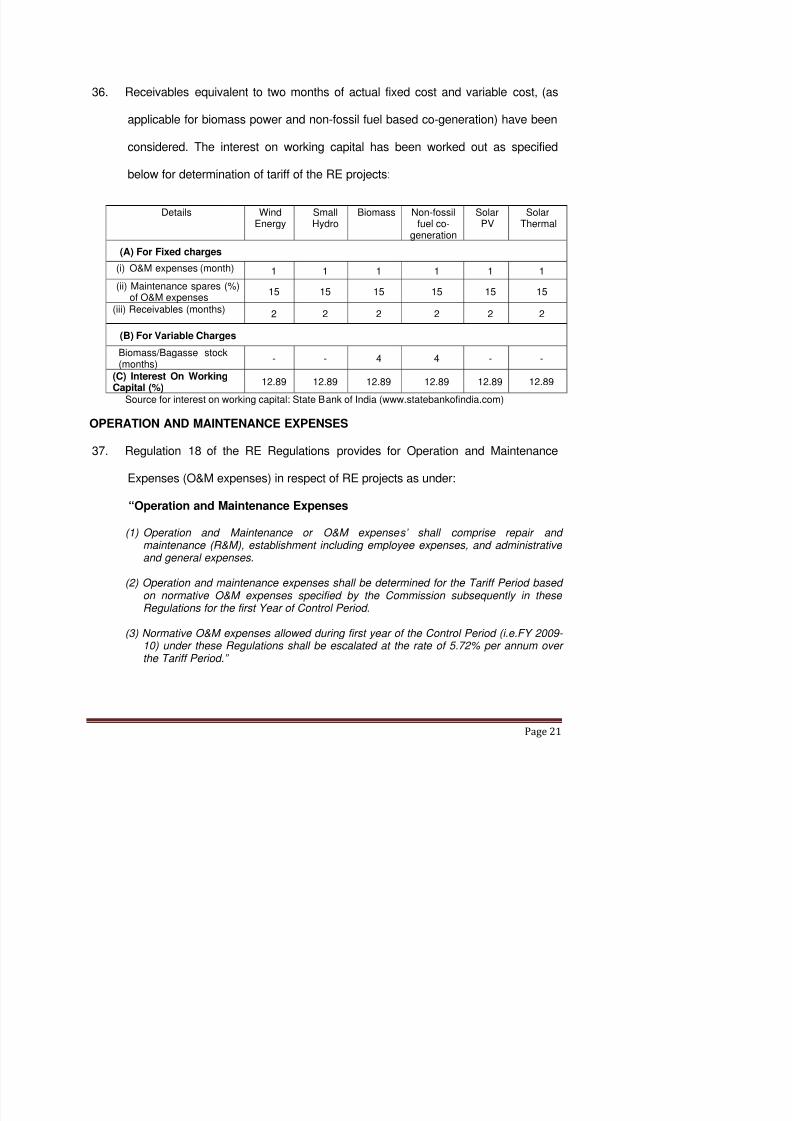
36. Receivables equivalent to two months of actual fixed cost and variable cost, (as
applicable for biomass power and non-fossil fuel based co-generation) have been
considered. The interest on working capital has been worked out as specified
below for determination of tariff of the RE projects:
Details WindEnergy
SmallHydro
Biomass Non-fossilfuel co-
generation
SolarPV
SolarThermal
(A) For Fixed charges
(i) O&M expenses (month) 1 1 1 1 1 1
(ii) Maintenance spares (%)of O&M expenses
15 15 15 15 15 15
(iii) Receivables (months) 2 2 2 2 2 2
(B) For Variable Charges
Biomass/Bagasse stock(months)
- - 4 4 - -
(C) Interest On WorkingCapital (%)
12.89 12.89 12.89 12.89 12.89 12.89
Source for interest on working capital: State Bank of India (www.statebankofindia.com)
OPERATION AND MAINTENANCE EXPENSES
37. Regulation 18 of the RE Regulations provides for Operation and Maintenance
Expenses (O&M expenses) in respect of RE projects as under:
“Operation and Maintenance Expenses
(1) Operation and Maintenance or O&M expenses’ shall comprise repair and maintenance (R&M), establishment including employee expenses, and administrative and general expenses.
(2) Operation and maintenance expenses shall be determined for the Tariff Period based on normative O&M expenses specified by the Commission subsequently in these Regulations for the first Year of Control Period
8/6/2019 Tariff Order FY201011
http://slidepdf.com/reader/full/tariff-order-fy201011 22/121
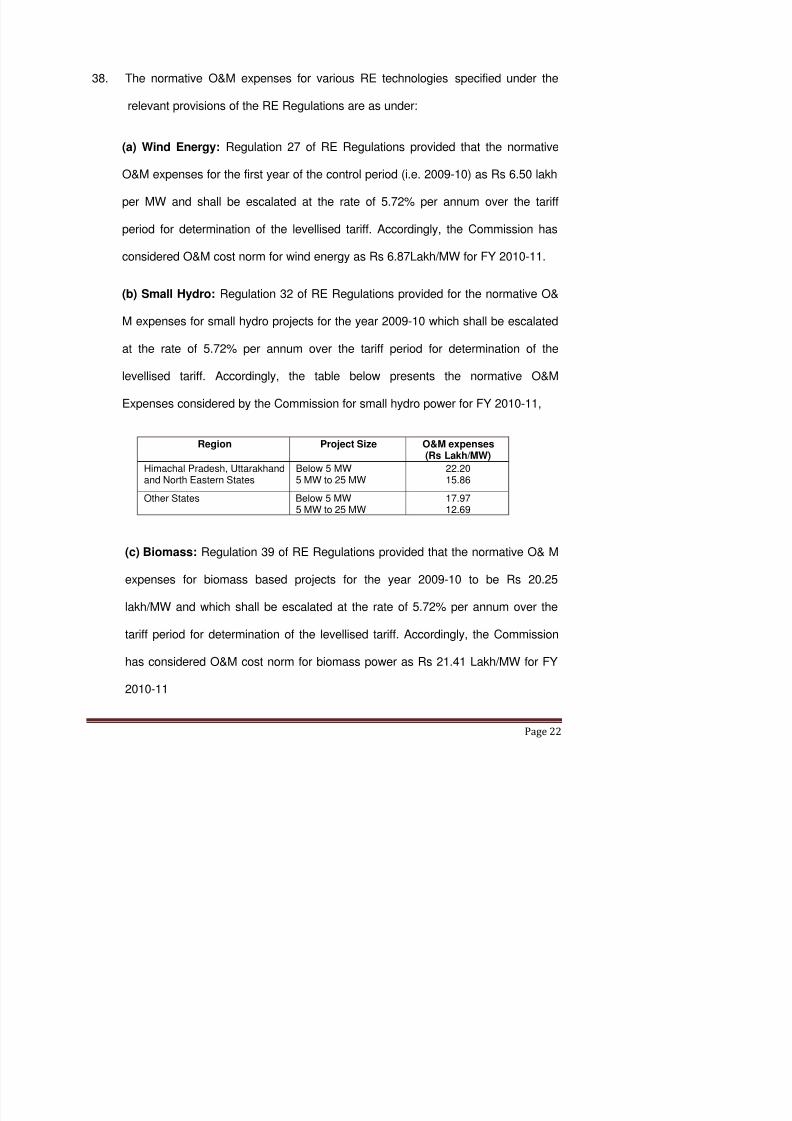
38. The normative O&M expenses for various RE technologies specified under the
relevant provisions of the RE Regulations are as under:
(a) Wind Energy: Regulation 27 of RE Regulations provided that the normative
O&M expenses for the first year of the control period (i.e. 2009-10) as Rs 6.50 lakh
per MW and shall be escalated at the rate of 5.72% per annum over the tariff
period for determination of the levellised tariff. Accordingly, the Commission has
considered O&M cost norm for wind energy as Rs 6.87Lakh/MW for FY 2010-11.
(b) Small Hydro: Regulation 32 of RE Regulations provided for the normative O&
M expenses for small hydro projects for the year 2009-10 which shall be escalated
at the rate of 5.72% per annum over the tariff period for determination of the
levellised tariff. Accordingly, the table below presents the normative O&M
Expenses considered by the Commission for small hydro power for FY 2010-11,
(c) Biomass: Regulation 39 of RE Regulations provided that the normative O& M
expenses for biomass based projects for the year 2009-10 to be Rs 20.25
lakh/MW and which shall be escalated at the rate of 5 72% per annum over the
Region Project Size O&M expenses(Rs Lakh/MW)
Himachal Pradesh, Uttarakhandand North Eastern States
Below 5 MW5 MW to 25 MW
22.2015.86
Other States Below 5 MW5 MW to 25 MW
17.9712.69

8/6/2019 Tariff Order FY201011
http://slidepdf.com/reader/full/tariff-order-fy201011 23/121

8/6/2019 Tariff Order FY201011
http://slidepdf.com/reader/full/tariff-order-fy201011 24/121
CAPACITY UTILISATION FACTOR
40. Regulations 26, 30, 58 and 62 of the RE Regulations specify the norms for
Capacity Utilization Factor (CUF) in respect of the renewable energy generating
stations except biomass and non- fossil fuel based cogeneration as per the details
given in the table below which has been considered for determination of tariff.
Renewable Energy Projects CUF
(A) Wind EnergyAnnual Mean Wind Power Density (W/m2)
Wind zone-1 (200-250)Wind zone-2 (250-300)Wind zone-3 (300-400)Wind zone-4 (above 400)
20%23%27%30%
(B) Small Hydro(i) Himachal Pradesh, Uttarakhand and North Eastern
States(ii) Other States
45%
30%
(C) Solar PV
(D) Solar Thermal
19%
23%
41. In terms of clause (2) of Regulation 26 of the RE Regulations, the annual mean
wind power density specified above is to be measured at 50 meter hub-height and
as per clause (3), for the purpose of classification of wind energy project into
particular wind zone class, the State-wise wind power density map prepared by
Centre for Wind Energy Technology (C-WET) annexed as schedule to the said
regulations, is to be considered.

8/6/2019 Tariff Order FY201011
http://slidepdf.com/reader/full/tariff-order-fy201011 25/121
43. Regulation 49 of the RE Regulations stipulates the plant load factor for non-fossil
fuel based co-generation projects as under, computed on the basis of plant
availability for number of operating days considering the operations during
crushing season and off-season and load factor of 92%. The number of operating
days for different States as specified in the regulations is as under:
States Operating days PLF (%)
Uttar Pradeshand Andhra Pradesh
120 days (crushing)+ 60 days (off-season) = 180 days 45%
Tamil Nadu andMaharashtra
180 days (crushing)+ 60 days (off-season) = 240 days 60%
Other States 150 days (crushing) + 60 days (off-season) = 210 days 53%
AUXILIARY POWER CONSUMPTION44. Regulations 31, 37, 50 and 64 of the RE Regulations stipulate the auxiliary power
consumption factor as under which has been considered for determination of tariff
of the RE projects :
Renewable Energy Projects PLF (%)
Biomass(a) During stabilization (6 months)(b) During first year after stabilization(c) Second year onwards
60%70%80%
Renewable Energy Projects Auxiliary Consumption factor
Small Hydro 1 0%

8/6/2019 Tariff Order FY201011
http://slidepdf.com/reader/full/tariff-order-fy201011 26/121
STATION HEAT RATE
45. The Station Heat Rates (SHR) specified under Regulations 38 and 51 of the RE
Regulations for biomass and non-fossil fuel based co-generation projects are as
under:
Renewable Energy ProjectsSHR
(kCal / kWh)
Biomass 3800
Non-fossil fuel co-generation (for power component) 3600
FUEL
(a) Fuel Mix
46. Clause (1) of Regulation 40 of the RE Regulations stipulates that the biomass
based power generating stations are to be designed in a way that it uses different
types of non-fossil fuels available within the vicinity of biomass power project such
as crop residues, agro-industrial residues, forest residues etc. and other biomass
fuels as may be approved by the Ministry of Non-Renewable Energy (MNRE).
Clause (2) of the said regulations stipulates that the biomass power generating
companies are to ensure fuel management plan to ensure adequate availability of
fuel to meet the respective project requirements.
(b) U f f il f l

8/6/2019 Tariff Order FY201011
http://slidepdf.com/reader/full/tariff-order-fy201011 27/121
of Regulation 42 of the said regulations the mechanism for monitoring the use of
fossil fuel is as under:
“(1) The Project developer shall furnish a monthly fuel usage statement and monthly fuel procurement statement duly certified by Chartered Accountant to the beneficiary (with a copy to appropriate agency appointed by the Commission for the purpose of monitoring the fossil and non-fossil fuel consumption) for each month, along with the monthly energy bill. The statement shall cover details such as;
(a) Quantity of fuel (in tonnes) for each fuel type (biomass fuels and fossil fuels)consumed and procured during the month for power generation purposes;
(b) Cumulative quantity (in tonnes) of each fuel type consumed and procured till the end of that month during the year;
(c) Actual (gross and net) energy generation (denominated in units) during the
month;
(d) Cumulative actual (gross and net) energy generation (denominated in units)until the end of that month during the year;
(e) Opening fuel stock quantity (in tonnes);
(f) Receipt of fuel quantity (in tonnes) at the power plant site; and
(g) Closing fuel stock quantity (in tonnes) for each fuel type (biomass fuels and fossil fuels) available at the power plant site.
(2) Non-compliance with the condition of fossil fuel usage by the project developer,during any financial year, shall result in withdrawal of applicability of tariff as per these Regulations for such biomass based power project.”
(c) Calorific value
48. In terms of Regulation 43 of the RE Regulations the calorific value of biomass
fuel(s) for determination of tariff is as under:

8/6/2019 Tariff Order FY201011
http://slidepdf.com/reader/full/tariff-order-fy201011 28/121
State Calorific Value(kCal/kg)
Rajasthan 3689
Tamilnadu 3300
Uttar Pradesh 3371
Other States 3467
49. In terms of Regulation 52 of the said regulations, the gross calorific value for
bagasse to be considered in case of non-fossil fuel co-generation projects is 2250
kCal/kg and for the use of biomass fuels other than bagasse, the calorific value as
specified above shall be applicable.
(d) Fuel cost
50. The Commission, in terms of Regulation 44 of the RE Regulations, has specified
the biomass fuel price applicable during the period 2009-10 and has specified fuel
price indexation mechanism, in case developer wishes to opt, for the remaining
years of the control period. The detailed computations of the fuel price indexation
mechanism and the determination of the biomass fuel prices for FY 2010-11
thereof, has been enclosed as Appendix-5 of this Order. Accordingly, the
biomass fuel price applicable for FY 2010-11 shall be as indicated in the table
below,
State Biomass price(Rs/MT)
Andhra Pradesh 1343
Haryana 2238
Maharashtra 1859

8/6/2019 Tariff Order FY201011
http://slidepdf.com/reader/full/tariff-order-fy201011 29/121
51. The Commission, in terms of Regulation 53 of the RE Regulations, has specified
the price of bagasse applicable during the period 2009-10 and has specified fuel
price indexation mechanism, in case developer wishes to opt, for the remaining
years of the control period. The detailed computations of the fuel price indexation
mechanism and the determination of the bagasse fuel prices for FY 2010-11
thereof, has been enclosed as Appendix-6 of this Order. Accordingly, the price of
bagasse (for non-fossil fuel based co-generation projects) applicable for FY 2010-
11 shall be as in the table below,
State Bagasse Price(Rs/MT)
Andhra Pradesh 928
Haryana 1456
Maharashtra 1159
Madhya Pradesh 835
Punjab 1443
Tamilnadu 1283
Uttar Pradesh 1046
Other States 1200
Subsidy or incentive by the Central / State Government
52. Regulation 22 of the RE Regulations provides as under:
“The Commission shall take into consideration any incentive or subsidy offered by

8/6/2019 Tariff Order FY201011
http://slidepdf.com/reader/full/tariff-order-fy201011 30/121
i. Assessment of benefit shall be based on normative capital cost,accelerated depreciation rate as per relevant provisions under Income Tax Act and corporate income tax rate.
ii. Capitalisation of RE projects during second half of the fiscal year. Per unit benefit shall be derived on levellised basis at discount factor equivalent to weighted average cost of capital.”
53. In terms of the above regulation, for the projects availing the benefit of Section 80
IA of the Income Tax Act, 1961, the Minimum Alternate Tax (MAT) @ 16.995%
(15% MAT+10% surcharge+3% education cess) for the first ten years and
thereafter the normal tax rate @ 33.99% (30% IT rate+ 10% surcharge +3%
Education cess) has been considered. For the purpose of determining net
depreciation benefits, depreciation @ 5.28% as per straight line method (Book
depreciation as per Companies Act, 1956) has been compared with depreciation
as per Income Tax rate i.e. 80% of the written down value method and
depreciation for the first year has been calculated at the rate of 50% of 80% i.e
40%, as project is capitalized during the second half of the financial year as per
proviso (ii) to Regulation 22. Tax benefit has been worked out as per normal tax
rate on the net depreciation benefit. Per unit levellised accelerated depreciation
benefit has been computed considering the weighted average cost of capital as
discount factor.
54. In the light of the discussion made in the preceding paragraphs, the generic tariffs

8/6/2019 Tariff Order FY201011
http://slidepdf.com/reader/full/tariff-order-fy201011 31/121
RE Technologies as per CERC RE Tariff Regulations Norms for FY 2010-11
Particular
LevellisedTotal Tariff(FY2010-11)
Benefit ofAcceleratedDepreciation(if availed)
Net Levellised Tariff
(upon adjusting forAccelerated
Depreciation benefit) (ifavailed)
(Rs / kWh) (Rs/kWh) (Rs/kWh)
Wind Energy
Wind Zone -1 (CUF20%)
5.07 0.78 4.29
Wind Zone -2 (CUF23%)
4.41 0.68 3.73
Wind Zone -3 (CUF27%)
3.75 0.58 3.18
Wind Zone -4 (CUF30%)
3.38 0.52 2.86
Small Hydro Power Project
HP, Uttarakhand and NE
States (Below 5MW)
3.59 0.48 3.11
HP, Uttarakhand and NEStates (5MW to 25 MW)
3.06 0.43 2.63
Other States (Below 5MW)
4.26 0.57 3.70
Other States (5 MW to25 MW)
3.65 0.51 3.14
Solar Power Projects
Solar PV 17.91 2.96 14.95
Solar Thermal 15.31 2.46 12.85
State
Levellised
FixedCost
Variable
Cost (FY2010-11)
Applicable
Tariff Rate(FY 2010-11)
Benefit ofAcceleratedDepreciation(if availed)
Net LevellisedTariff
(upon adjustingfor Accelerated
Depreciationbenefit) (if availed)
(Rs/kWh) (Rs/kWh) (Rs/kWh) (Rs/kWh) (Rs/kWh)
Biomass Power ProjectAndhra

8/6/2019 Tariff Order FY201011
http://slidepdf.com/reader/full/tariff-order-fy201011 32/121
State
LevellisedFixed
Cost
VariableCost (FY
2010-11)
ApplicableTariff Rate
(FY 2010-11)
Benefit ofAccelerated
Depreciation(if availed)
Net LevellisedTariff
(upon adjusting
for AcceleratedDepreciationbenefit) (if availed)
(Rs/kWh) (Rs/kWh) (Rs/kWh) (Rs/kWh) (Rs/kWh)
Rajasthan 1.83 2.15 3.99 0.19 3.80
Tamil Nadu 1.86 2.41 4.26 0.19 4.07
Uttar Pradesh 1.82 1.96 3.78 0.19 3.59
Others 1.84 2.26 4.10 0.19 3.91
Non-Fossil Fuel based CogenerationAndhraPradesh 2.61 1.62 4.23 0.32 3.91
Haryana 2.32 2.55 4.86 0.27 4.59
Maharashtra 2.03 2.03 4.05 0.24 3.81
MadhyaPradesh 2.22 1.46 3.68 0.27 3.41
Punjab 2.31 2.52 4.84 0.27 4.57
Tamil Nadu 2.05 2.24 4.29 0.24 4.05
Uttar Pradesh 2.62 1.83 4.45 0.32 4.13
Others 2.28 2.10 4.38 0.27 4.11
55. The detailed computations of the normative Capital Cost in respect of various RE
technologies for FY 2010-11, in line with the indexation mechanism stipulated
under RE Tariff Regulations, have been enclosed to this Order as per the details
given hereunder:
S No Renewable Energy Projects Appendix
A Wind Power Projects Appendix 1

8/6/2019 Tariff Order FY201011
http://slidepdf.com/reader/full/tariff-order-fy201011 33/121

8/6/2019 Tariff Order FY201011
http://slidepdf.com/reader/full/tariff-order-fy201011 34/121
S No Renewable Energy Projects Annexure
Maharashtra Annexure 4C
Madhya Pradesh Annexure 4D
Punjab Annexure 4E
Uttar Pradesh Annexure 4F
Tamil Nadu Annexure 4G
Other Annexure 4H
E Solar Projects
Solar PV Projects Annexure 5A
Solar Thermal Projects Annexure 5B
57. Above generic tariff is proposed for the RE power projects (other than solar
projects) commissioned during the FY 2010-11 and for solar PV projects for the
FY 2010-11 and FY 2011- 12 and for solar thermal power projects for the FY
2010-11, FY 2011- 12 and FY 2012- 13 (subject to the conditions for solar
projects as stipulated in the first amendment to the RE Regulations) fulfilling the
conditions of the RE regulations.
58. Comments/suggestions of the stakeholders on the above proposals are invited by
08.03.201. We direct that the matter be notified for hearing on 09.03.2010.
Sd/- Sd/- Sd/-[V.S.VERMA] [S. JAYARAMAN] [Dr. PRAMOD DEO]
MEMBER MEMBER CHAIRPERSON

8/6/2019 Tariff Order FY201011
http://slidepdf.com/reader/full/tariff-order-fy201011 35/121
Appendix – 1
Capital Cost Indexation for Wind Power Projects (FY2010-11)
Indexation FormulationCC(n)=P&M(n)*[1+F1+F2+F3]
dn = (a*(SIn-1/SI0)-1)+b*(EIn-1/EI0)-1))/(a+b)
P&M(n)=P&M(0)*(1+dn)
Variable Value
a 0.6
b 0.4
F1 0.08
F2 0.07
F3 0.10
2009 2008 2009 2008
January 146.70 145.20 303.10 279.90
Febuary 146.70 145.20 286.60 281.70
March 147.30 145.70 288.40 337.70
April 146.40 147.30 285.80 359.00
May 146.70 149.50 286.30 353.30
June 146.20 152.80 286.40 357.60
July 146.10 153.20 286.50 362.60
August 147.00 153.20 293.90 362.80
September 149.00 152.90 290.00 360.40
October 148.40 152.90 291.40 355.10
November 149.20 153.40 290.80 329.20
December 148.20 149.10 290.80 321.30
Average 147.33 150.00 290.00 338.40
Parameter Value
CC(0)(RsL/MW) 515.00
P&M(0) (RsL/MW) 412.00dn -9.29%
P&M(n) (RsL/MW) 373.71
CC(n) (RsL/MW) 467.13
Plant & Machinery Cost for the nth Year (FY 2010-11)
Capital Cost for the nth Year (FY2010-11)
Description
Capital Cost for the Base Year
Plant & Machinery Cost for the Base YearCapital Cost Escalation Factor
Factor for Erection and Commissioning
Factor for IDC and Financing
Month/YearElectrical & Machinery Iron & Steel
Description
Weightage for Steel Index
Weightage for Electrical Machinery Index
Factor for Land and Civil Work
Source of WPI (Iron &Steel and Electrical and Machinery) : Office of Economic Advisor Ministry of

8/6/2019 Tariff Order FY201011
http://slidepdf.com/reader/full/tariff-order-fy201011 36/121
Appendix-2
Capital Cost Indexation for Small Hydro Power Projects (FY2010-11)
Indexation FormulationCC(n)=P&M(n)*[1+F1+F2+F3]
dn = (a*(SIn-1/SI0)-1)+b*(EIn-1/EI0)-1))/(a+b)
P&M(n)=P&M(0)*(1+dn)
Variable Description Value
a 0.6
b 0.4
F1 0.16
F2 0.10
F3 0.14
Month/Year
2009 2008 2009 2008
January 146.70 145.20 303.10 279.90
Febuary 146.70 145.20 286.60 281.70
March 147.30 145.70 288.40 337.70
April 146.40 147.30 285.80 359.00
May 146.70 149.50 286.30 353.30
June 146.20 152.80 286.40 357.60July 146.10 153.20 286.50 362.60
August 147.00 153.20 293.90 362.80
September 149.00 152.90 290.00 360.40
October 148.40 152.90 291.40 355.10
November 149.20 153.40 290.80 329.20
December 148.20 149.10 290.80 321.30
Average 147.33 150.00 290.00 338.40
< 5MW 5MW - 25MW < 5MW 5MW - 25MWCC(0)(RsL/MW) 700.00 630.00 550.00 500.00
P&M(0) (RsL/MW) 500.00 450.00 392.86 357.14
dn -9.29% -9.29% -9.29% -9.29%
P&M(n) (RsL/MW) 453.53 408.17 356.34 323.95
CC(n) (RsL/MW) 634.94 571.44 498.88 453.53Capital Cost for the nth Year (FY2010-11)
DescriptionParameter
Weightage for Steel Index
Weightage for Electrical Machinery Index
Factor for Land and Civil Work
Factor for Erection and Commissioning
Factor for IDC and Financing
E&M Iron & Steel
Plant & Machinery Cost for the nth Year (FY 2010-11)
HP/Uttrakhand/NE Other States
Plant & Machinery Cost for the Base Year
Capital Cost Escalation Factor
Capital Cost for the Base Year
Source of WPI (Iron &Steel and Electrical and Machinery) : Office of Economic Advisor, Ministry of
Commerce and Industry (www.eaindustry.nic.in)Appendix– 3

8/6/2019 Tariff Order FY201011
http://slidepdf.com/reader/full/tariff-order-fy201011 37/121
Capital Cost Indexation for Biomass Power Projects (FY2010-11)
Indexation Formulation
CC(n)=P&M(n)*[1+F1+F2+F3]
dn = (a*(SIn-1/SI0)-1)+b*(EIn-1/EI0)-1))/(a+b)P&M(n)=P&M(0)*(1+dn)
Variable Value
a 0.7
b 0.3
F1 0.10
F2 0.09
F3 0.14
2009 2008 2009 2008
January 146.70 145.20 303.10 279.90
Febuary 146.70 145.20 286.60 281.70
March 147.30 145.70 288.40 337.70April 146.40 147.30 285.80 359.00
May 146.70 149.50 286.30 353.30
June 146.20 152.80 286.40 357.60
July 146.10 153.20 286.50 362.60
August 147.00 153.20 293.90 362.80
September 149.00 152.90 290.00 360.40
October 148.40 152.90 291.40 355.10
November 149.20 153.40 290.80 329.20
December 148.20 149.10 290.80 321.30
Average 147.33 150.00 290.00 338.40
Parameter Value
CC(0)(RsL/MW) 450.00
P&M(0) (RsL/MW) 338.35
dn -10.55%
P&M(n) (RsL/MW) 302.66CC(n) (RsL/MW) 402.54
Plant & Machinery Cost for the nth Year (FY 2010-11)Capital Cost for the nth Year (FY2010-11)
Iron & SteelElectrical & Machinery
Factor for Erection and Commissioning
Factor for IDC and Financing
Description
Description
Weightage for Steel Index
Weightage for Electrical Machinery Index
Factor for Land and Civil Work
Capital Cost for the Base Year
Plant & Machinery Cost for the Base Year
Month/Year
Capital Cost Escalation Factor
Source of WPI (Iron &Steel and Electrical and Machinery) : Office of Economic Advisor, Ministry of
Commerce and Industry (www.eaindustry.nic.in)

8/6/2019 Tariff Order FY201011
http://slidepdf.com/reader/full/tariff-order-fy201011 38/121
Appendix – 4
Capital Cost Indexation for Non-Fossil Fuel Based Cogeneration Power Projects (FY2010-11)
Indexation FormulationCC(n)=P&M(n)*[1+F1+F2+F3]
dn = (a*(SIn-1/SI0)-1)+b*(EIn-1/EI0)-1))/(a+b)
P&M(n)=P&M(0)*(1+dn)
Variable Value
a 0.7
b 0.3
F1 0.10F2 0.09
F3 0.14
2009 2008 2009 2008
January 146.70 145.20 303.10 279.90
Febuary 146.70 145.20 286.60 281.70
March 147.30 145.70 288.40 337.70April 146.40 147.30 285.80 359.00
May 146.70 149.50 286.30 353.30
June 146.20 152.80 286.40 357.60
July 146.10 153.20 286.50 362.60
August 147.00 153.20 293.90 362.80
September 149.00 152.90 290.00 360.40
October 148.40 152.90 291.40 355.10
November 149.20 153.40 290.80 329.20December 148.20 149.10 290.80 321.30
Average 147.33 150.00 290.00 338.40
Parameter Value
CC(0)(RsL/MW) 445.00
P&M(0) (RsL/MW) 334.59
dn -10.55%P&M(n) (RsL/MW) 299.30
CC(n) (RsL/MW) 398.07
Plant & Machinery Cost for the nth Year (FY 2010-11)
Capital Cost for the nth Year (FY2010-11)
Description
Capital Cost for the Base Year
Plant & Machinery Cost for the Base Year
Capital Cost Escalation Factor
Factor for IDC and Financing
Month/YearElectrical & Machinery Iron & Steel
Description
Weightage for Steel Index
Weightage for Electeical Machinery Index
Factor for Land and Civil WorkFactor for Erection and Commissioning
Source of WPI (Iron &Steel and Electrical and Machinery) : Office of Economic Advisor, Ministry of
d d ( d )

8/6/2019 Tariff Order FY201011
http://slidepdf.com/reader/full/tariff-order-fy201011 39/121

8/6/2019 Tariff Order FY201011
http://slidepdf.com/reader/full/tariff-order-fy201011 40/121

8/6/2019 Tariff Order FY201011
http://slidepdf.com/reader/full/tariff-order-fy201011 41/121
Annexure – 1A
(Wind Zone-1)
Form 1.1 Assumptions Parameters
S. No.Assumption
HeadSub-Head Sub-Head (2) Unit
Base Case Wind
Zone 1
1 Power Generation
Capacity
Installed Power Generation Capacity MW 1
Capacity Utilization Factor % 20%
Deration Factor % 0.00%
Useful Life Years 25
2 Project CostCapital Cost/MW Power Plant Cost Rs Lacs/MW 467
3 Sources of Fund
Tariff Period Years 13
Debt: Equity
Debt % 70%
Equity % 30%
Total Debt Amount Rs Lacs 327
Total Equity Amout Rs Lacs 140
Debt ComponentLoan Amount Rs Lacs 327
Moratorium Period years 0
Repayment Period(incld Moratorium) years 10
Interest Rate % 13.39%
Equity Component
Equity amount Rs Lacs 140
Return on Equity for first 10 years % p.a 19.00%
RoE Period Year 10
Return on Equity 11th year onwards % p.a 24.00%
Weighted average of ROE 22.00%Discount Rate 15.97%
4 Financial Assumptions
Fiscal Assumptions
Income Tax % 33.99%
MAT Rate (for f irst 10 years) % 16.995%
80 IA benefits Yes/No Yes
Depreciation 0.0%
Depreciation Rate for first 10 years % 7.00%
Depreciation Rate 11th year onwards % 1.33%
Years for 7% rate 10
5 Working Capital
For Fixed Charges
O&M Charges Months 1
Maintenance Spare (% of O&M exepenses) 15%

8/6/2019 Tariff Order FY201011
http://slidepdf.com/reader/full/tariff-order-fy201011 42/121
Page 42
Form 1.2 Form Template for (Wind Power Projects) : Determination of Tariff Component1 0.862 0.744 0.641 0.553 0.477 0.411 0.354 0.306 0.264 0.227 0.196 0.169 0.146 0.126 0.108 0.093 0.081 0.069 0.060 0.052 0.045 0.038 0.033 0.029
Units Generation Unit Year---> 1 2 3 4 5 6 7 8 9 10 11 12 13 14 15 16 17 18 19 20 21 22 23 24 25
Installed Capacity MW 1 1 1 1 1 1 1 1 1 1 1 1 1 1 1 1 1 1 1 1 1 1 1 1 1
Gross/Net Generation MU 1.75 1.75 1.75 1.75 1.75 1.75 1.75 1.75 1.75 1.75 1.75 1.75 1.75 1.75 1.75 1.75 1.75 1.75 1.75 1.75 1.75 1.75 1.75 1.75 1.75
Fixed Cost Unit Year---> 1 2 3 4 5 6 7 8 9 10 11 12 13 14 15 16 17 18 19 20 21 22 23 24 25
O&M Expenses Rs Lakh 6.87 7.26 7.68 8.12 8.58 9.08 9.59 10.14 10.72 11.34 11.99 12.67 13.40 14.16 14.97 15.83 16.73 17.69 18.70 19.77 20.90 22.10 23.36 24.70 26.11
Depreciation Rs Lakh 32.70 32.70 32.70 32.70 32.70 32.70 32.70 32.70 32.70 32.70 6.23 6.23 6.23 6.23 6.23 6.23 6.23 6.23 6.23 6.23 6.23 6.23 6.23 6.23 6.23
Interest on term loan Rs Lakh 41.59 37.21 32.84 28.46 24.08 19.70 15.32 10.95 6.57 2.19 0.00 0.00 0.00 0.00 0.00 0.00 0.00 0.00 0.00 0.00 0.00 0.00 0.00 0.00 0.00
Interest on working Capital Rs Lakh 2.58 2.50 2.43 2.35 2.28 2.21 2.14 2.08 2.01 1.95 1.51 1.54 1.58 1.62 1.66 1.71 1.76 1.81 1.86 1.92 1.98 2.04 2.11 2.18 2.25
Return on Equity Rs Lakh 26.63 26.63 26.63 26.63 26.63 26.63 26.63 26.63 26.63 26.63 33.63 33.63 33.63 33.63 33.63 33.63 33.63 33.63 33.63 33.63 33.63 33.63 33.63 33.63 33.63Total Fixed Cost Rs Lakh 110.37 106.31 102.27 98.26 94.27 90.32 86.39 82.49 78.63 74.80 53.35 54.08 54.84 55.64 56.50 57.40 58.35 59.36 60.42 61.55 62.74 64.00 65.33 66.74 68.22
Levallised tariff corresponding to Useful life
Per Unit Cost of Generation Unit Levellise 1 2 3 4 5 6 7 8 9 10 11 12 13 14 15 16 17 18 19 20 21 22 23 24 25
O&M expn Rs/kWh 0.56 0.39 0.41 0.44 0.46 0.49 0.52 0.55 0.58 0.61 0.65 0.68 0.72 0.76 0.81 0.85 0.90 0.96 1.01 1.07 1.13 1.19 1.26 1.33 1.41 1.49
Depreciation Rs/kWh 1.55 1.87 1.87 1.87 1.87 1.87 1.87 1.87 1.87 1.87 1.87 0.36 0.36 0.36 0.36 0.36 0.36 0.36 0.36 0.36 0.36 0.36 0.36 0.36 0.36 0.36
Int. on term loan Rs/kW h 1.22 2.37 2.12 1.87 1.62 1.37 1.12 0.87 0.62 0.37 0.12 0.00 0.00 0.00 0.00 0.00 0.00 0.00 0.00 0.00 0.00 0.00 0.00 0.00 0.00 0.00
Int . on working capital Rs/kWh 0.13 0.15 0.14 0.14 0.13 0.13 0.13 0.12 0.12 0.11 0.11 0.09 0.09 0.09 0.09 0.09 0.10 0.10 0.10 0.11 0.11 0.11 0.12 0.12 0.12 0.13
RoE Rs/kWh 1.60 1.52 1.52 1.52 1.52 1.52 1.52 1.52 1.52 1.52 1.52 1.92 1.92 1.92 1.92 1.92 1.92 1.92 1.92 1.92 1.92 1.92 1.92 1.92 1.92 1.92Total COG Rs/kWh 5.07 6.30 6.07 5.84 5.61 5.38 5.15 4.93 4.71 4.49 4.27 3.05 3.09 3.13 3.18 3.22 3.28 3.33 3.39 3.45 3.51 3.58 3.65 3.73 3.81 3.89
Levellised
D is cou nt F ac to r 1 0 .8 62 0.7 44 0. 64 1 0. 55 3 0 .4 77 0. 41 1 0 .3 54 0.3 06 0 .26 4 0.2 27 0. 19 6 0 .1 69 0.1 46 0.1 26 0 .1 08 0 .0 93 0. 08 1 0. 06 9 0 .0 60 0.0 52 0. 045 0 .0 38 0. 03 3 0.0 29
Levellised Tariff 5.07 Rs/Unit

8/6/2019 Tariff Order FY201011
http://slidepdf.com/reader/full/tariff-order-fy201011 43/121
Page 43
Determination of Accelerated Depreciation for Wind Power Projects
Depreciation amount 90%
Book Depreciation rate 5.28%
Tax Depreciation rate 80%
Income Tax (MAT) 16.995%
Income Tax (Norma l Ra tes ) 33 .99%
Capital Cost 467.1
Years --- -- --- -- --- --- -> Unit 1 2 3 4 5 6 7 8 9 10 11 12 13 14 15
Book Depreciation % 2.64% 5.28% 5.28% 5.28% 5.28% 5.28% 5.28% 5.28% 5.28% 5.28% 5.28% 5.28% 5.28% 5.28% 5.28%
Book Depreciation Rs Lakh 12.33 24.66 24.66 24.66 24.66 24.66 24.66 24.66 24.66 24.66 24.66 24.66 24.66 24.66 24.66
Accelerated Depreciation
Opening % 100% 60% 12% 2% 0% 0% 0% 0% 0% 0% 0% 0% 0% 0% 0%
Allowed during the year % 40% 48.00% 9.60% 1.92% 0.38% 0.08% 0.02% 0.00% 0.00% 0.00% 0.00% 0.00% 0.00% 0.00% 0.00%Closing % 60% 12% 2.40% 0.48% 0.10% 0.02% 0.00% 0.00% 0.00% 0.00% 0.00% 0.00% 0.00% 0.00% 0.00%
Accelrated Deprn. Rs Lakh 186.85 224.22 44.84 8.97 1.79 0.36 0.07 0.01 0.00 0.00 0.00 0.00 0.00 0.00 0.00
Net Depreciation Benefit Rs Lakh 174.52 199.56 20.18 -15.70 -22.87 -24.31 -24.59 -24.65 -24.66 -24.66 -24.66 -24.66 -24.66 -24.66 -24.66
Tax Benefit Rs Lakh 59.32 67.83 6.86 -5.33 -7.77 -8.26 -8.36 -8.38 -8.38 -8.38 -8.38 -8.38 -8.38 -8.38 -8.38
Energy generation MU 0.88 1.75 1.75 1.75 1.75 1.75 1.75 1.75 1.75 1.75 1.75 1.75 1.75 1.75 1.75
Discounting Factor 1.00 0.93 0.80 0.69 0.60 0.51 0.44 0.38 0.33 0.28 0.24 0.21 0.18 0.16 0.14
0.93 0.80 0.69 0.60 0.51 0.44 0.38 0.33 0.28 0.24 0.21 0.18 0.16 0.14
Levellised benefit 0.78 Rs/Unit

8/6/2019 Tariff Order FY201011
http://slidepdf.com/reader/full/tariff-order-fy201011 44/121

8/6/2019 Tariff Order FY201011
http://slidepdf.com/reader/full/tariff-order-fy201011 45/121
Page 45
Form 1.2 Form Template for (Wind Power Projects) : Determination of Tariff Component1 0.862 0.744 0.641 0.553 0.477 0.411 0.354 0.306 0.264 0.227 0.196 0.169 0.146 0.126 0.108 0.093 0.081 0.069 0.060 0.052 0.045 0.038 0.033 0.029
Units Generation Unit Year---> 1 2 3 4 5 6 7 8 9 10 11 12 13 14 15 16 17 18 19 20 21 22 23 24 25
Installed Capacity MW 1 1 1 1 1 1 1 1 1 1 1 1 1 1 1 1 1 1 1 1 1 1 1 1 1
Gross/Net Generation MU 2.01 2.01 2.01 2.01 2.01 2.01 2.01 2.01 2.01 2.01 2.01 2.01 2.01 2.01 2.01 2.01 2.01 2.01 2.01 2.01 2.01 2.01 2.01 2.01 2.01
Fixed Cost Unit Year---> 1 2 3 4 5 6 7 8 9 10 11 12 13 14 15 16 17 18 19 20 21 22 23 24 25
O&M Expenses Rs Lakh 6.87 7.26 7.68 8.12 8.58 9.08 9.59 10.14 10.72 11.34 11.99 12.67 13.40 14.16 14.97 15.83 16.73 17.69 18.70 19.77 20.90 22.10 23.36 24.70 26.11
Depreciation Rs Lakh 32.70 32.70 32.70 32.70 32.70 32.70 32.70 32.70 32.70 32.70 6.23 6.23 6.23 6.23 6.23 6.23 6.23 6.23 6.23 6.23 6.23 6.23 6.23 6.23 6.23
Interest on term loan Rs Lakh 41.59 37.21 32.84 28.46 24.08 19.70 15.32 10.95 6.57 2.19 0.00 0.00 0.00 0.00 0.00 0.00 0.00 0.00 0.00 0.00 0.00 0.00 0.00 0.00 0.00
Interest on working Capital Rs Lakh 2.58 2.50 2.43 2.35 2.28 2.21 2.14 2.08 2.01 1.95 1.51 1.54 1.58 1.62 1.66 1.71 1.76 1.81 1.86 1.92 1.98 2.04 2.11 2.18 2.25
Return on Equity Rs Lakh 26.63 26.63 26.63 26.63 26.63 26.63 26.63 26.63 26.63 26.63 33.63 33.63 33.63 33.63 33.63 33.63 33.63 33.63 33.63 33.63 33.63 33.63 33.63 33.63 33.63
Total Fixed Cost Rs Lakh 110.37 106.31 102.27 98.26 94.27 90.32 86.39 82.49 78.63 74.80 53.35 54.08 54.84 55.64 56.50 57.40 58.35 59.36 60.42 61.55 62.74 64.00 65.33 66.74 68.22
Levallised tariff corresponding to Useful life
Per Unit Cost of Generation Unit Levellise 1 2 3 4 5 6 7 8 9 10 11 12 13 14 15 16 17 18 19 20 21 22 23 24 25
O&M expn Rs/kWh 0.49 0.34 0.36 0.38 0.40 0.43 0.45 0.48 0.50 0.53 0.56 0.59 0.63 0.66 0.70 0.74 0.79 0.83 0.88 0.93 0.98 1.04 1.10 1.16 1.23 1.30
Depreciation Rs/kWh 1.35 1.62 1.62 1.62 1.62 1.62 1.62 1.62 1.62 1.62 1.62 0.31 0.31 0.31 0.31 0.31 0.31 0.31 0.31 0.31 0.31 0.31 0.31 0.31 0.31 0.31
Int. on term loan Rs/kW h 1.06 2.06 1.85 1.63 1.41 1.20 0.98 0.76 0.54 0.33 0.11 0.00 0.00 0.00 0.00 0.00 0.00 0.00 0.00 0.00 0.00 0.00 0.00 0.00 0.00 0.00
Int . on working capital Rs/kWh 0.11 0.13 0.12 0.12 0.12 0.11 0.11 0.11 0.10 0.10 0.10 0.07 0.08 0.08 0.08 0.08 0.08 0.09 0.09 0.09 0.10 0.10 0.10 0.10 0.11 0.11
RoE Rs/kWh 1.39 1.32 1.32 1.32 1.32 1.32 1.32 1.32 1.32 1.32 1.32 1.67 1.67 1.67 1.67 1.67 1.67 1.67 1.67 1.67 1.67 1.67 1.67 1.67 1.67 1.67
Total COG Rs/kWh 4.41 5.48 5.28 5.08 4.88 4.68 4.48 4.29 4.09 3.90 3.71 2.65 2.68 2.72 2.76 2.80 2.85 2.90 2.95 3.00 3.05 3.11 3.18 3.24 3.31 3.39
Levellised
D is cou nt F ac to r 1 0 .8 62 0.7 44 0. 64 1 0. 55 3 0 .4 77 0. 41 1 0 .3 54 0.3 06 0 .26 4 0.2 27 0. 19 6 0 .1 69 0.1 46 0.1 26 0 .1 08 0 .0 93 0. 08 1 0. 06 9 0 .0 60 0.0 52 0. 045 0 .0 38 0. 03 3 0.0 29
Levellised Tariff 4.41 Rs/Unit

8/6/2019 Tariff Order FY201011
http://slidepdf.com/reader/full/tariff-order-fy201011 46/121

8/6/2019 Tariff Order FY201011
http://slidepdf.com/reader/full/tariff-order-fy201011 47/121
Annexure – 3A
(Wind Zone-3)
Form 1.1 Assumptions Parameters
S. No.Assumption
HeadSub-Head Sub-Head (2) Unit
Base Case Wind
Zone 3
1 Power Generation
Capacity
Installed Power Generation Capacity MW 1
Capacity Utilization Factor % 27%
Deration Factor % 0.00%
Useful Life Years 25
2 Project Cost
Capital Cost/MW Power Plant Cost Rs Lacs/MW 467
3 Sources of Fund
Tariff Period Years 13
Debt: Equity
Debt % 70%
Equity % 30%
Total Debt Amount Rs Lacs 327
Total Equity Amout Rs Lacs 140
Debt Component
Loan Amount Rs Lacs 327
Moratorium Period years 0
Repayment Period(incld Moratorium) years 10
Interest Rate % 13.39%
Equity Component
Equity amount Rs Lacs 140
Return on Equity for first 10 years % p.a 19.00%
RoE Period Year 10
Return on Equity 11th year onwards % p.a 24.00%
Weighted average of ROE 22.00%
Discount Rate 15.97%
4 Financial Assumptions
Fiscal Assumptions
Income Tax % 33.99%
MAT Rate (for f irst 10 years) % 16.995%
80 IA benefits Yes/No Yes
Depreciation 0.0%
Depreciation Rate for first 10 years % 7.00%
Depreciation Rate 11th year onwards % 1.33%
Years for 7% rate 10
5 Working Capital
For Fixed Charges
O&M Charges Months 1
Maintenance Spare (% of O&M exepenses) 15%
Receivables for Debtors Months 2

8/6/2019 Tariff Order FY201011
http://slidepdf.com/reader/full/tariff-order-fy201011 48/121

8/6/2019 Tariff Order FY201011
http://slidepdf.com/reader/full/tariff-order-fy201011 49/121
Page 49
Determination of Accelerated Depreciation for Wind Power Projects
Depreciation amount 90%
Book Deprec iat ion rate 5.28%
Tax Depreciation rate 80%
Income Tax (MAT) 16.995%Income Tax (Normal Rates) 33.99%
Capital Cost 467.1
Years -- -- -- -- -- -- -- -- -> Unit 1 2 3 4 5 6 7 8 9 10 11 12 13 14 15 16 17 18 19 20
Book Depreciation % 2.64% 5.28% 5.28% 5.28% 5.28% 5.28% 5.28% 5.28% 5.28% 5.28% 5.28% 5.28% 5.28% 5.28% 5.28% 5.28% 5.28% 2.88% 0.00% 0.00%
Book Depreciation Rs Lakh 12.33 24.66 24.66 24.66 24.66 24.66 24.66 24.66 24.66 24.66 24.66 24.66 24.66 24.66 24.66 24.66 24.66 13.45 0.00 0.00
Accelerated Depreciation
Opening % 100% 60% 12% 2% 0% 0% 0% 0% 0% 0% 0% 0% 0% 0% 0% 0% 0% 0% 0% 0%
Allowed during the year % 40% 48.00% 9.60% 1.92% 0.38% 0.08% 0.02% 0.00% 0.00% 0.00% 0.00% 0.00% 0.00% 0.00% 0.00% 0.00% 0.00% 0.00% 0.00% 0.00%
Closing % 60% 12% 2 .40% 0.48% 0 .10% 0 .02% 0.00% 0 .00% 0 .00% 0.00% 0.00% 0.00% 0 .00% 0.00% 0 .00% 0 .00% 0.00% 0 .00% 0 .00% 0.00%
Accelrated Deprn. Rs Lakh 186.85 224.22 44.84 8.97 1.79 0.36 0.07 0.01 0.00 0.00 0.00 0.00 0.00 0.00 0.00 0.00 0.00 0.00 0.00 0.00
Net Deprec iat ion Benef it Rs Lakh 174.52 199 .56 20.18 -15.70 -22.87 -24.31 -24.59 -24.65 -24.66 -24.66 -24 .66 -24 .66 -24.66 -24.66 -24 .66 -24 .66 -24 .66 -13.45 0 .00 0.00Tax Benefit Rs Lakh 59.32 67.83 6.86 -5.33 -7.77 -8.26 -8.36 -8.38 -8.38 -8.38 -8.38 -8.38 -8.38 -8.38 -8.38 -8.38 -8.38 -4.57 0.00 0.00
Energy generation MU 1.18 2.37 2.37 2.37 2.37 2.37 2.37 2.37 2.37 2.37 2.37 2.37 2.37 2.37 2.37 2.37 2.37 2.37 2.37 2.37
Discounting Factor 1.00 0.93 0.80 0.69 0.60 0.51 0.44 0.38 0.33 0.28 0.24 0.21 0.18 0.16 0.14 0.12 0.10 0.09 0.07 0.06
0.93 0.80 0.69 0.60 0.51 0.44 0.38 0.33 0.28 0.24 0.21 0.18 0.16 0.14 0.12 0.10 0.09 0.07 0.06
Levellised benefit 0.58 Rs/Unit
A A

8/6/2019 Tariff Order FY201011
http://slidepdf.com/reader/full/tariff-order-fy201011 50/121
Annexure – 4A
(Wind Zone-4)
Form 1.1 Assumptions Parameters
S. No.Assumption
HeadSub-Head Sub-Head (2) Unit
Base Case Wind
Zone 4
1 Power Generation
Capacity
Installed Power Generation Capacity MW 1
Capacity Utilization Factor % 30%
Deration Factor % 0.00%
Useful Life Years 25
2 Project Cost
Capital Cost/MW Power Plant Cost Rs Lacs/MW 467
3 Sources of Fund
Tariff Period Years 13
Debt: Equity
Debt % 70%
Equity % 30%
Total Debt Amount Rs Lacs 327
Total Equity Amout Rs Lacs 140
Debt Component
Loan Amount Rs Lacs 327
Moratorium Period years 0
Repayment Period(incld Moratorium) years 10
Interest Rate % 13.39%
Equity Component
Equity amount Rs Lacs 140
Return on Equity for first 10 years % p.a 19.00%
RoE Period Year 10
Return on Equity 11th year onwards % p.a 24.00%
Weighted average of ROE 22.00%Discount Rate 15.97%
4 Financial Assumptions
Fiscal Assumptions
Income Tax % 33.99%
MAT Rate (for f irst 10 years) % 16.995%
80 IA benefits Yes/No Yes
Depreciation 0.0%
Depreciation Rate for first 10 years % 7.00%
Depreciation Rate 11th year onwards % 1.33%
Years for 7% rate 10
5 Working Capital
For Fixed Charges
O&M Charges Months 1
Maintenance Spare (% of O&M exepenses) 15%

8/6/2019 Tariff Order FY201011
http://slidepdf.com/reader/full/tariff-order-fy201011 51/121
Page 51
Form 1.2 Form Template for (Wind Power Projects) : Determination of Tariff Component1 0.862 0.744 0.641 0.553 0.477 0.411 0.354 0.306 0.264 0.227 0.196 0.169 0.146 0.126 0.108 0.093 0.081 0.069 0.060 0.052 0.045 0.038 0.033 0.029
Units Generation Unit Year---> 1 2 3 4 5 6 7 8 9 10 11 12 13 14 15 16 17 18 19 20 21 22 23 24 25
Installed Capacity MW 1 1 1 1 1 1 1 1 1 1 1 1 1 1 1 1 1 1 1 1 1 1 1 1 1
Gross/Net Generation MU 2.63 2.63 2.63 2.63 2.63 2.63 2.63 2.63 2.63 2.63 2.63 2.63 2.63 2.63 2.63 2.63 2.63 2.63 2.63 2.63 2.63 2.63 2.63 2.63 2.63
Fixed Cost Unit Year---> 1 2 3 4 5 6 7 8 9 10 11 12 13 14 15 16 17 18 19 20 21 22 23 24 25
O&M Expenses Rs Lakh 6.87 7.26 7.68 8.12 8.58 9.08 9.59 10.14 10.72 11.34 11.99 12.67 13.40 14.16 14.97 15.83 16.73 17.69 18.70 19.77 20.90 22.10 23.36 24.70 26.11
Depreciation Rs Lakh 32.70 32.70 32.70 32.70 32.70 32.70 32.70 32.70 32.70 32.70 6.23 6.23 6.23 6.23 6.23 6.23 6.23 6.23 6.23 6.23 6.23 6.23 6.23 6.23 6.23
Interest on term loan Rs Lakh 41.59 37.21 32.84 28.46 24.08 19.70 15.32 10.95 6.57 2.19 0.00 0.00 0.00 0.00 0.00 0.00 0.00 0.00 0.00 0.00 0.00 0.00 0.00 0.00 0.00
Interest on working Capital Rs Lakh 2.58 2.50 2.43 2.35 2.28 2.21 2.14 2.08 2.01 1.95 1.51 1.54 1.58 1.62 1.66 1.71 1.76 1.81 1.86 1.92 1.98 2.04 2.11 2.18 2.25
Return on Equity Rs Lakh 26.63 26.63 26.63 26.63 26.63 26.63 26.63 26.63 26.63 26.63 33.63 33.63 33.63 33.63 33.63 33.63 33.63 33.63 33.63 33.63 33.63 33.63 33.63 33.63 33.63
Total Fixed Cost Rs Lakh 110.37 106.31 102.27 98.26 94.27 90.32 86.39 82.49 78.63 74.80 53.35 54.08 54.84 55.64 56.50 57.40 58.35 59.36 60.42 61.55 62.74 64.00 65.33 66.74 68.22
Levallised tariff corresponding to Useful life
Per Unit Cost of Generation Unit Levellise 1 2 3 4 5 6 7 8 9 10 11 12 13 14 15 16 17 18 19 20 21 22 23 24 25
O&M expn Rs/kWh 0.38 0.26 0.28 0.29 0.31 0.33 0.35 0.37 0.39 0.41 0.43 0.46 0.48 0.51 0.54 0.57 0.60 0.64 0.67 0.71 0.75 0.80 0.84 0.89 0.94 0.99
Depreciation Rs/kWh 1.04 1.24 1.24 1.24 1.24 1.24 1.24 1.24 1.24 1.24 1.24 0.24 0.24 0.24 0.24 0.24 0.24 0.24 0.24 0.24 0.24 0.24 0.24 0.24 0.24 0.24
Int. on term loan Rs/kW h 0.82 1.58 1.42 1.25 1.08 0.92 0.75 0.58 0.42 0.25 0.08 0.00 0.00 0.00 0.00 0.00 0.00 0.00 0.00 0.00 0.00 0.00 0.00 0.00 0.00 0.00
Int . on working capital Rs/kWh 0.08 0.10 0.10 0.09 0.09 0.09 0.08 0.08 0.08 0.08 0.07 0.06 0.06 0.06 0.06 0.06 0.07 0.07 0.07 0.07 0.07 0.08 0.08 0.08 0.08 0.09
RoE Rs/kWh 1.07 1.01 1.01 1.01 1.01 1.01 1.01 1.01 1.01 1.01 1.01 1.28 1.28 1.28 1.28 1.28 1.28 1.28 1.28 1.28 1.28 1.28 1.28 1.28 1.28 1.28
Total COG Rs/kWh 3.38 4.20 4.05 3.89 3.74 3.59 3.44 3.29 3.14 2.99 2.85 2.03 2.06 2.09 2.12 2.15 2.18 2.22 2.26 2.30 2.34 2.39 2.44 2.49 2.54 2.60Levellised
Dis cou nt F ac to r 1 0 .8 62 0 .7 44 0 .64 1 0.5 53 0 .4 77 0 .4 11 0 .3 54 0 .3 06 0 .2 64 0 .2 27 0 .19 6 0. 16 9 0.1 46 0 .1 26 0 .1 08 0 .0 93 0 .08 1 0. 06 9 0.0 60 0 .0 52 0 .0 45 0 .0 38 0 .0 33 0 .0 29
Levellised Tariff 3.38 Rs/Unit

8/6/2019 Tariff Order FY201011
http://slidepdf.com/reader/full/tariff-order-fy201011 52/121
Page 52
Determination of Accelerated Depreciation for Wind Power Projects
Depreciation amount 90%
Book Deprec iat ion rate 5.28%
Tax Depreciation rate 80%
Income Tax (MAT) 16.995%Income Tax (Normal Rates) 33.99%
Capital Cost 467.1
Years -- -- -- -- -- -- -- -- -> Unit 1 2 3 4 5 6 7 8 9 10 11 12 13 14 15 16 17 18 19 20
Book Depreciation % 2.64% 5.28% 5.28% 5.28% 5.28% 5.28% 5.28% 5.28% 5.28% 5.28% 5.28% 5.28% 5.28% 5.28% 5.28% 5.28% 5.28% 2.88% 0.00% 0.00%
Book Depreciation Rs Lakh 12.33 24.66 24.66 24.66 24.66 24.66 24.66 24.66 24.66 24.66 24.66 24.66 24.66 24.66 24.66 24.66 24.66 13.45 0.00 0.00
Accelerated Depreciation
Opening % 100% 60% 12% 2% 0% 0% 0% 0% 0% 0% 0% 0% 0% 0% 0% 0% 0% 0% 0% 0%
Allowed during the year % 40% 48.00% 9.60% 1.92% 0.38% 0.08% 0.02% 0.00% 0.00% 0.00% 0.00% 0.00% 0.00% 0.00% 0.00% 0.00% 0.00% 0.00% 0.00% 0.00%
Closing % 60% 12% 2 .40% 0.48% 0 .10% 0 .02% 0.00% 0 .00% 0 .00% 0.00% 0.00% 0.00% 0 .00% 0.00% 0 .00% 0 .00% 0.00% 0 .00% 0 .00% 0.00%
Accelrated Deprn. Rs Lakh 186.85 224.22 44.84 8.97 1.79 0.36 0.07 0.01 0.00 0.00 0.00 0.00 0.00 0.00 0.00 0.00 0.00 0.00 0.00 0.00
Net Deprec iat ion Benef it Rs Lakh 174.52 199 .56 20.18 -15.70 -22.87 -24.31 -24.59 -24.65 -24.66 -24.66 -24 .66 -24 .66 -24.66 -24.66 -24 .66 -24 .66 -24 .66 -13.45 0 .00 0.00Tax Benefit Rs Lakh 59.32 67.83 6.86 -5.33 -7.77 -8.26 -8.36 -8.38 -8.38 -8.38 -8.38 -8.38 -8.38 -8.38 -8.38 -8.38 -8.38 -4.57 0.00 0.00
Energy generation MU 1.31 2.63 2.63 2.63 2.63 2.63 2.63 2.63 2.63 2.63 2.63 2.63 2.63 2.63 2.63 2.63 2.63 2.63 2.63 2.63
Discounting Factor 1.00 0.93 0.80 0.69 0.60 0.51 0.44 0.38 0.33 0.28 0.24 0.21 0.18 0.16 0.14 0.12 0.10 0.09 0.07 0.06
0.93 0.80 0.69 0.60 0.51 0.44 0.38 0.33 0.28 0.24 0.21 0.18 0.16 0.14 0.12 0.10 0.09 0.07 0.06
Levellised benefit 0.52 Rs/Unit

8/6/2019 Tariff Order FY201011
http://slidepdf.com/reader/full/tariff-order-fy201011 53/121

8/6/2019 Tariff Order FY201011
http://slidepdf.com/reader/full/tariff-order-fy201011 54/121

8/6/2019 Tariff Order FY201011
http://slidepdf.com/reader/full/tariff-order-fy201011 55/121
Page 55
Determination of Accelerated DepreciationDe pr ec ia ti on a mou nt 9 0%
Boo k Depreciat io n r ate 5.28%
T ax D ep re ci at io n r at e 8 0%
Income Tax (MAT) 17%
Income Tax (Normal Rates) 33.99%
Capital Cost 634.9
Years -- -- -- -- -- -- -- -- -> U nit 1 2 3 4 5 6 7 8 9 10 11 12 13 14 15 16 17 18 19 20 21 22 23 24 25 26 27 28 29 30 31 32 33 34 35
B oo k De pr ec ia ti on % 2. 64 % 5 .2 8% 5 .2 8% 5 .2 8% 5 .2 8% 5 .2 8% 5 .2 8% 5 .2 8% 5 .2 8% 5 .2 8% 5 .2 8% 5 .2 8% 5. 28 % 5 .2 8% 5 .2 8% 5 .2 8% 5 .2 8% 2 .8 8% 0 .0 0% 0 .0 0% 0 .0 0% 0 .0 0% 0 .0 0% 0 .0 0% 0 .0 0% 0 .0 0% 0 .0 0% 0 .0 0% 0 .0 0% 0 .0 0% 0 .0 0% 0 .0 0% 0 .0 0% 0 .0 0% 0 .0 0%
Book Deprecia tion Rs Lakh 16.76 33.5 2 33.52 33 .5 2 33.52 33 .52 33.52 33.52 3 3.52 3 3.52 33.52 3 3.52 33.52 33.5 2 33.52 33.52 33.5 2 18.29 0 .0 0 0.00 0.00 0.00 0 .00 0.00 0.00 0.00 0.00 0.00 0.00 0.00 0.00 0.00 0.0 0 0.00 0 .0 0
Accelerated Depreciation
Opening % 100% 60% 12% 2% 0% 0% 0% 0% 0% 0% 0% 0% 0% 0% 0% 0% 0% 0% 0% 0% 0% 0% 0% 0% 0% 0% 0% 0% 0% 0% 0% 0% 0% 0% 0%
A ll owe d d uri ng t he ye ar % 4 0% 4 8. 00 % 9 .6 0% 1 .9 2% 0 .3 8% 0 .0 8% 0 .0 2% 0 .0 0% 0 .0 0% 0 .0 0% 0 .0 0% 0 .0 0% 0 .0 0% 0 .0 0% 0 .0 0% 0 .0 0% 0 .0 0% 0 .0 0% 0 .0 0% 0 .0 0% 0 .0 0% 0 .0 0% 0 .0 0% 0 .0 0% 0 .0 0% 0 .0 0% 0 .0 0% 0 .0 0% 0 .0 0% 0 .0 0% 0 .0 0% 0 .0 0% 0 .0 0% 0 .0 0% 0 .0 0%
Closing % 60% 12 % 2.40 % 0.48 % 0.10% 0 .0 2% 0.00% 0 .0 0% 0.00% 0.00% 0 .00% 0.00% 0.00% 0.00% 0.00% 0.00 % 0.00% 0.00% 0.00% 0.00% 0.0 0% 0.00% 0 .0 0% 0.00% 0 .00% 0.0 0% 0 .00% 0 .0 0% 0.00% 0.00 % 0.00% 0.00% 0.00% 0.00 % 0.0 0%
Accelrated Deprn. Rs Lakh 253.97 304.77 60.95 12.19 2.44 0.49 0.10 0.02 0.00 0.00 0.00 0.00 0.00 0.00 0.00 0.00 0.00 0.00 0.00 0.00 0.00 0.00 0.00 0.00 0.00 0.00 0.00 0.00 0.00 0.00 0.00 0.00 0.00 0.00 0.00
Ne t De pre ci ati on Be ne fit Rs L ak h 2 37 .2 1 2 71 .2 4 2 7. 43 -2 1.3 3 - 31 .0 9 - 33 .0 4 - 33 .4 3 - 33 .5 1 -3 3. 52 -3 3. 52 - 33 .5 2 -3 3. 52 - 33 .5 2 -3 3.5 2 - 33 .5 2 -3 3. 52 - 33 .5 2 - 18 .2 9 0 .0 0 0 .0 0 0 .0 0 0 .0 0 0 .0 0 0 .0 0 0 .0 0 0 .0 0 0 .0 0 0 .0 0 0 .0 0 0 .0 0 0 .0 0 0 .0 0 0 .0 0 0 .0 0 0 .0 0
Tax Benefit Rs Lakh 80.63 92.2 0 9.32 -7 .2 5 - 10.57 -11 .23 -11.36 -1 1.39 -11.39 -1 1.39 -11.39 -1 1.40 -11.40 -1 1.40 -11.40 -11 .40 -11.4 0 -6.22 0.00 0 .00 0 .0 0 0.00 0 .00 0.00 0.00 0.00 0.00 0.00 0.00 0.00 0.00 0.00 0.0 0 0.00 0 .0 0
Energy generation MU 1.95 3.90 3.90 3.90 3.90 3.90 3.90 3.90 3.90 3.90 3.90 3.90 3.90 3.90 3.90 3.90 3.90 3.90 3.90 3.90 3.90 3.90 3.90 3.90 3.90 3.90 3.90 3.90 3.90 3.90 3.90 3.90 3.90 3.90 3.90
Discounting Factor 1.00 0.93 0.80 0.69 0.59 0.51 0.44 0.38 0.33 0.28 0.24 0.21 0.18 0.15 0.13 0.11 0.10 0.08 0.07 0.06 0.05 0.05 0.04 0.03 0.03 0.03 0.02 0.02 0.02 0.01 0.01 0.01 0.01 0.01 0.01
Levellised benefit 0.48 Rs/Unit
Annexure – 2B

8/6/2019 Tariff Order FY201011
http://slidepdf.com/reader/full/tariff-order-fy201011 56/121
(5 MW to 25 MWHP/Uttarakhand/NE)
1.1 Form Template for (HP, Uttarakhand, NE States 5MW to 25MW) Assumptions Parameters
S. No. Assumption Head Sub-Head Sub-Head (2) UnitHP, Uttarakhand, NE
States
5 MW to 25 MW
1 Power Generation
Capacity
Installed Power Generation Capacity MW 1
Capacity Utilization Factor % 45%
Auxiliary Consumption 1%
Deration Factor % 0.00%Useful Life Years 35
2 Project Cost
Capital Cost/MW Power Plant Cost Rs Lacs/MW 571
3 Financial Assumption
Tariff Period Years 13
Debt: Equity
Debt % 70%
Equity % 30%
Total Debt Amount Rs Lacs 400
Total Equity Amout Rs Lacs 171
Debt ComponentLoan Amount Rs Lacs 400
Moratorium Period years 0
Repayment Period(incld Moratorium) years 10
Intrest Rate % 13.39%
Equity Component
Equity amount Rs Lacs 171
Normative ROE (Post-tax) 16%
Return on Equity for first 10 years % p.a 19%
RoE Period Year 10
Return on Equity 11th year onwards % p.a 24.00%
Weighted average of ROE 22.57%
Discount Rate (equiv. to WACC) 11th year onwards 16.14%
4 Financial Assumptions
Economic Assumptions 0
Coal Price Escalation % p.a 0%
HSD Price Escalation % p.a 0%
Discount Rate % p.a 16%
0%
Fiscal Assumptions
Income Tax % 33.99%
MAT Rate ( for f irst 10 years) % 16.995%
80 IA benefits Yes/No Yes
Depreciation 0.0%
Depreciation Rate for first 10 years % 7.00%Depreciation Rate 11th year onwards % 0.80%
Years for 7% rate 10
5 Working Capital
For Fixed Charges
O&M Charges Months 1

8/6/2019 Tariff Order FY201011
http://slidepdf.com/reader/full/tariff-order-fy201011 57/121

8/6/2019 Tariff Order FY201011
http://slidepdf.com/reader/full/tariff-order-fy201011 58/121
Page 58
Determination of Accelerated DepreciationDep reci ation a mou nt 90 %
Book Depreciat ion rate 5.28%
T ax De pr ec ia ti on r at e 8 0%
Income Tax (MAT) 17%
Income Tax (Normal Rates) 33.99%
Capital Cost 571.4
Years - - -- -- -- -- -- -- -- -> Unit 1 2 3 4 5 6 7 8 9 10 11 12 13 14 15 16 17 18 19 20 21 22 23 24 25 26 27 28 29 30 31 32 33 34 35
B oo k D ep re ci at io n % 2 .6 4% 5 .2 8% 5 .2 8% 5 .2 8% 5 .2 8% 5 .2 8% 5 .2 8% 5 .2 8% 5 .2 8% 5 .2 8% 5 .2 8% 5 .2 8% 5 .2 8% 5 .2 8% 5 .2 8% 5 .2 8% 5 .2 8% 2 .8 8% 0 .0 0% 0 .0 0% 0 .0 0% 0 .0 0% 0 .0 0% 0 .0 0% 0 .0 0% 0 .0 0% 0 .0 0% 0 .0 0% 0 .0 0% 0 .0 0% 0 .0 0% 0 .0 0% 0 .0 0% 0 .0 0% 0 .0 0%
B ook Dep reci ati on Rs La kh 1 5.0 9 3 0.17 30 .17 3 0. 17 30 .17 30 .1 7 30. 17 30 .1 7 3 0.1 7 30. 17 30 .1 7 3 0.1 7 30. 17 3 0.1 7 30.1 7 3 0.17 30.1 7 16 .46 0.0 0 0 .00 0.0 0 0 .00 0.0 0 0. 00 0 .0 0 0.0 0 0 .00 0.0 0 0 .00 0.00 0. 00 0.00 0. 00 0 .00 0.0 0
Accelerated Depreciation
Opening % 100% 60% 12% 2% 0% 0% 0% 0% 0% 0% 0% 0% 0% 0% 0% 0% 0% 0% 0% 0% 0% 0% 0% 0% 0% 0% 0% 0% 0% 0% 0% 0% 0% 0% 0%
A ll ow ed d ur in g t he y ea r % 4 0% 4 8. 00 % 9 .6 0% 1 .9 2% 0 .3 8% 0 .0 8% 0 .0 2% 0 .0 0% 0 .0 0% 0 .0 0% 0 .0 0% 0 .0 0% 0 .0 0% 0 .0 0% 0 .0 0% 0 .0 0% 0 .0 0% 0 .0 0% 0 .0 0% 0 .0 0% 0 .0 0% 0 .0 0% 0 .0 0% 0 .0 0% 0 .0 0% 0 .0 0% 0 .0 0% 0 .0 0% 0 .0 0% 0 .0 0% 0 .0 0% 0 .0 0% 0 .0 0% 0 .0 0% 0 .0 0%
Cl osi ng % 6 0% 1 2% 2. 40 % 0 .4 8% 0.1 0% 0 .02 % 0.0 0% 0 .00 % 0.0 0% 0.0 0% 0 .00 % 0.00 % 0. 00% 0.00 % 0. 00% 0 .00 % 0.0 0% 0 .00% 0 .0 0% 0. 00% 0 .0 0% 0.0 0% 0. 00 % 0 .0 0% 0.0 0% 0.0 0% 0 .00% 0.0 0% 0 .00% 0 .00 % 0. 00% 0 .00 % 0 .0 0% 0. 00 % 0 .0 0%
Accelrated Deprn. Rs Lakh 228.58 274.29 54.86 10.97 2.19 0.44 0.09 0.02 0.00 0.00 0.00 0.00 0.00 0.00 0.00 0.00 0.00 0.00 0.00 0.00 0.00 0.00 0.00 0.00 0.00 0.00 0.00 0.00 0.00 0.00 0.00 0.00 0.00 0.00 0.00
N et D ep re ci at io n B en ef it R s L ak h 2 13 .4 9 24 4. 12 2 4. 69 - 19 .2 0 - 2 7. 98 - 29 .7 3 - 3 0. 08 - 30 .1 5 - 3 0. 17 - 30 .1 7 - 3 0. 17 - 30 .1 7 - 3 0. 17 - 30 .1 7 - 3 0. 17 - 30 .1 7 - 3 0. 17 - 16 .4 6 0 .0 0 0 .0 0 0 .0 0 0 .0 0 0 .0 0 0 .0 0 0 .0 0 0 .0 0 0 .0 0 0 .0 0 0 .0 0 0 .0 0 0 .0 0 0 .0 0 0 .0 0 0 .0 0 0 .0 0
T ax Ben ef it Rs L akh 7 2.5 7 8 2.98 8 .3 9 - 6. 53 - 9.5 1 -10 .1 1 -10. 23 - 10 .2 5 -10.2 5 - 10. 26 - 10 .2 6 -10.2 6 -10 .26 - 10.2 6 -10 .26 - 10.26 - 10. 26 - 5.59 0.0 0 0 .00 0. 00 0 .00 0 .0 0 0. 00 0 .0 0 0.0 0 0 .00 0.0 0 0 .00 0.00 0. 00 0.00 0. 00 0 .00 0.0 0
Energy generation MU 1.95 3.90 3.90 3.90 3.90 3.90 3.90 3.90 3.90 3.90 3.90 3.90 3.90 3.90 3.90 3.90 3.90 3.90 3.90 3.90 3.90 3.90 3.90 3.90 3.90 3.90 3.90 3.90 3.90 3.90 3.90 3.90 3.90 3.90 3.90
Discounting Factor 1.00 0.93 0.80 0.69 0.59 0.51 0.44 0.38 0.33 0.28 0.24 0.21 0.18 0.15 0.13 0.11 0.10 0.08 0.07 0.06 0.05 0.05 0.04 0.03 0.03 0.03 0.02 0.02 0.02 0.01 0.01 0.01 0.01 0.01 0.01
Levellised benefit 0.43 Rs/Unit
Annexure – 2C

8/6/2019 Tariff Order FY201011
http://slidepdf.com/reader/full/tariff-order-fy201011 59/121
(Less Than 5 MW Other States)
1.1 Form Template for (Other States <5MW) Assumptions Parameters
S. No. Assumption Head Sub-Head Sub-Head (2) Unit Other States
Less than 5 MW
1 Power Generation
Capacity
Installed Power Generation Capacity MW 1
Capacity Utilization Factor % 30%
Auxiliary Consumption 1%
Deration Factor % 0.00%Useful Life Years 35
2 Project Cost
Capital Cost/MW Power Plant Cost Rs Lacs/MW 499
3 Financial Assumption
Tariff Period Years 35
Debt: Equity
Debt % 70%
Equity % 30%
Total Debt Amount Rs Lacs 349
Total Equity Amout Rs Lacs 150
Debt ComponentLoan Amount Rs Lacs 349
Moratorium Period years 0
Repayment Period(incld Moratorium) years 10
Intrest Rate % 13.39%
Equity Component
Equity amount Rs Lacs 150
Normative ROE (Post-tax) 16%
Return on Equity for first 10 years % p.a 19%
RoE Period Year 10
Return on Equity 11th year onwards % p.a 24.00%
Weighted average of ROE 22.57%
Discount Rate (equiv. to WACC) 11th year onwards 16.14%
4 Financial Assumptions
Economic Assumptions 0
Coal Price Escalation % p.a 0%
HSD Price Escalation % p.a 0%
Discount Rate % p.a 16%
0%
Fiscal Assumptions
Income Tax % 33.99%
MAT Rate (for f irst 10 years) % 16.995%
80 IA benefits Yes/No Yes
Depreciation 0.0%
Depreciation Rate for first 10 years % 7.00%
Depreciation Rate 11th year onwards % 0.80%
Years for 7% rate 10
5 Working Capital
For Fixed Charges
O&M Charges Months 1

8/6/2019 Tariff Order FY201011
http://slidepdf.com/reader/full/tariff-order-fy201011 60/121
Determination of Accelerated Depreciation

8/6/2019 Tariff Order FY201011
http://slidepdf.com/reader/full/tariff-order-fy201011 61/121
Page 61
Dep reci ation a mou nt 90 %
Book Depreciat ion rate 5.28%
T ax De pr ec ia ti on r at e 8 0%
Income Tax (MAT) 17%
Income Tax (Normal Rates) 33.99%
Capital Cost 498.9
Years - - -- -- -- -- -- -- -- -> Unit 1 2 3 4 5 6 7 8 9 10 11 12 13 14 15 16 17 18 19 20 21 22 23 24 25 26 27 28 29 30 31 32 33 34 35
B oo k D ep re ci at io n % 2 .6 4% 5 .2 8% 5 .2 8% 5 .2 8% 5 .2 8% 5 .2 8% 5 .2 8% 5 .2 8% 5 .2 8% 5 .2 8% 5 .2 8% 5 .2 8% 5 .2 8% 5 .2 8% 5 .2 8% 5 .2 8% 5 .2 8% 2 .8 8% 0 .0 0% 0 .0 0% 0 .0 0% 0 .0 0% 0 .0 0% 0 .0 0% 0 .0 0% 0 .0 0% 0 .0 0% 0 .0 0% 0 .0 0% 0 .0 0% 0 .0 0% 0 .0 0% 0 .0 0% 0 .0 0% 0 .0 0%
B ook Dep reci ati on Rs La kh 1 3.1 7 2 6.34 26 .34 2 6. 34 26 .34 26 .3 4 26. 34 26 .3 4 2 6.3 4 26. 34 26 .3 4 2 6.3 4 26. 34 2 6.3 4 26.3 4 2 6.34 26.3 4 14 .37 0.0 0 0 .00 0.0 0 0 .00 0.0 0 0. 00 0 .0 0 0.0 0 0 .00 0.0 0 0 .00 0.00 0. 00 0.00 0. 00 0 .00 0.0 0
Accelerated Depreciation
Opening % 100% 60% 12% 2% 0% 0% 0% 0% 0% 0% 0% 0% 0% 0% 0% 0% 0% 0% 0% 0% 0% 0% 0% 0% 0% 0% 0% 0% 0% 0% 0% 0% 0% 0% 0%
A ll ow ed d ur in g t he y ea r % 4 0% 4 8. 00 % 9 .6 0% 1 .9 2% 0 .3 8% 0 .0 8% 0 .0 2% 0 .0 0% 0 .0 0% 0 .0 0% 0 .0 0% 0 .0 0% 0 .0 0% 0 .0 0% 0 .0 0% 0 .0 0% 0 .0 0% 0 .0 0% 0 .0 0% 0 .0 0% 0 .0 0% 0 .0 0% 0 .0 0% 0 .0 0% 0 .0 0% 0 .0 0% 0 .0 0% 0 .0 0% 0 .0 0% 0 .0 0% 0 .0 0% 0 .0 0% 0 .0 0% 0 .0 0% 0 .0 0%
Cl osi ng % 6 0% 1 2% 2. 40 % 0 .4 8% 0.1 0% 0 .02 % 0.0 0% 0 .00 % 0.0 0% 0.0 0% 0 .00 % 0.00 % 0. 00% 0.00 % 0. 00% 0 .00 % 0.0 0% 0 .00% 0 .0 0% 0. 00% 0 .0 0% 0.0 0% 0. 00 % 0 .0 0% 0.0 0% 0.0 0% 0 .00% 0.0 0% 0 .00% 0 .00 % 0. 00% 0 .00 % 0 .0 0% 0. 00 % 0 .0 0%
Accelrated Deprn. Rs Lakh 199.55 239.46 47.89 9.58 1.92 0.38 0.08 0.02 0.00 0.00 0.00 0.00 0.00 0.00 0.00 0.00 0.00 0.00 0.00 0.00 0.00 0.00 0.00 0.00 0.00 0.00 0.00 0.00 0.00 0.00 0.00 0.00 0.00 0.00 0.00
N et D ep re ci at io n B en ef it R s L ak h 1 86 .3 8 21 3. 12 2 1. 55 - 16 .7 6 - 2 4. 43 - 25 .9 6 - 2 6. 26 - 26 .3 3 - 2 6. 34 - 26 .3 4 - 2 6. 34 - 26 .3 4 - 2 6. 34 - 26 .3 4 - 2 6. 34 - 26 .3 4 - 2 6. 34 - 14 .3 7 0 .0 0 0 .0 0 0 .0 0 0 .0 0 0 .0 0 0 .0 0 0 .0 0 0 .0 0 0 .0 0 0 .0 0 0 .0 0 0 .0 0 0 .0 0 0 .0 0 0 .0 0 0 .0 0 0 .0 0
Tax Benefit Rs Lakh 63.35 72.44 7.33 -5.70 -8.30 -8.82 -8.93 -8.95 -8.95 -8.95 -8.95 -8.95 -8.95 -8.95 -8.95 -8.95 -8.95 -4.88 0.00 0.00 0.00 0.00 0.00 0.00 0.00 0.00 0.00 0.00 0.00 0.00 0.00 0.00 0.00 0.00 0.00
Energy generation MU 1.30 2.60 2.60 2.60 2.60 2.60 2.60 2.60 2.60 2.60 2.60 2.60 2.60 2.60 2.60 2.60 2.60 2.60 2.60 2.60 2.60 2.60 2.60 2.60 2.60 2.60 2.60 2.60 2.60 2.60 2.60 2.60 2.60 2.60 2.60
Discounting Factor 1.00 0.93 0.80 0.69 0.59 0.51 0.44 0.38 0.33 0.28 0.24 0.21 0.18 0.15 0.13 0.11 0.10 0.08 0.07 0.06 0.05 0.05 0.04 0.03 0.03 0.03 0.02 0.02 0.02 0.01 0.01 0.01 0.01 0.01 0.01
Levellised benefit 0.57 Rs/Unit
Annexure – 2D
(5 MW to 25 MW Other States)

8/6/2019 Tariff Order FY201011
http://slidepdf.com/reader/full/tariff-order-fy201011 62/121
(5 MW to 25 MW Other States)
1.1 Form Template for (Other States 5MW to 25MW) Assumptions Parameters
S. No. Assumption Head Sub-Head Sub-Head (2) Unit Other States
5 MW to 25 MW
1 Power Generation
Capacity
Installed Power Generation Capacity MW 1
Capacity Utilization Factor % 30%
Auxiliary Consumption 1%
Deration Factor % 0.00%Useful Life Years 35
2 Project Cost
Capital Cost/MW Power Plant Cost Rs Lacs/MW 454
3 Financial Assumption
Tariff Period Years 13
Debt: Equity
Debt % 70%
Equity % 30%
Total Debt Amount Rs Lacs 317
Total Equity Amout Rs Lacs 136
Debt ComponentLoan Amount Rs Lacs 317
Moratorium Period years 0
Repayment Period(incld Moratorium) years 10
Intrest Rate % 13.39%
Equity Component
Equity amount Rs Lacs 136
Normative ROE (Post-tax) 16%
Return on Equity for first 10 years % p.a 19%
RoE Period Year 10
Return on Equity 11th year onwards % p.a 24.00%
Weighted average of ROE 22.57%
Discount Rate (equiv. to WACC) 11th year onwards 16.14%
4 Financial Assumptions
Economic Assumptions 0
Coal Price Escalation % p.a 0%
HSD Price Escalation % p.a 0%
Discount Rate % p.a 16%
0%
Fiscal Assumptions
Income Tax % 33.99%
MAT Rate (for f irst 10 years) % 16.995%
80 IA benefits Yes/No Yes
Depreciation 0.0%
Depreciation Rate for first 10 years % 7.00%
Depreciation Rate 11th year onwards % 0.80%
Years for 7% rate 10
5 Working Capital
For Fixed Charges

8/6/2019 Tariff Order FY201011
http://slidepdf.com/reader/full/tariff-order-fy201011 63/121

8/6/2019 Tariff Order FY201011
http://slidepdf.com/reader/full/tariff-order-fy201011 64/121
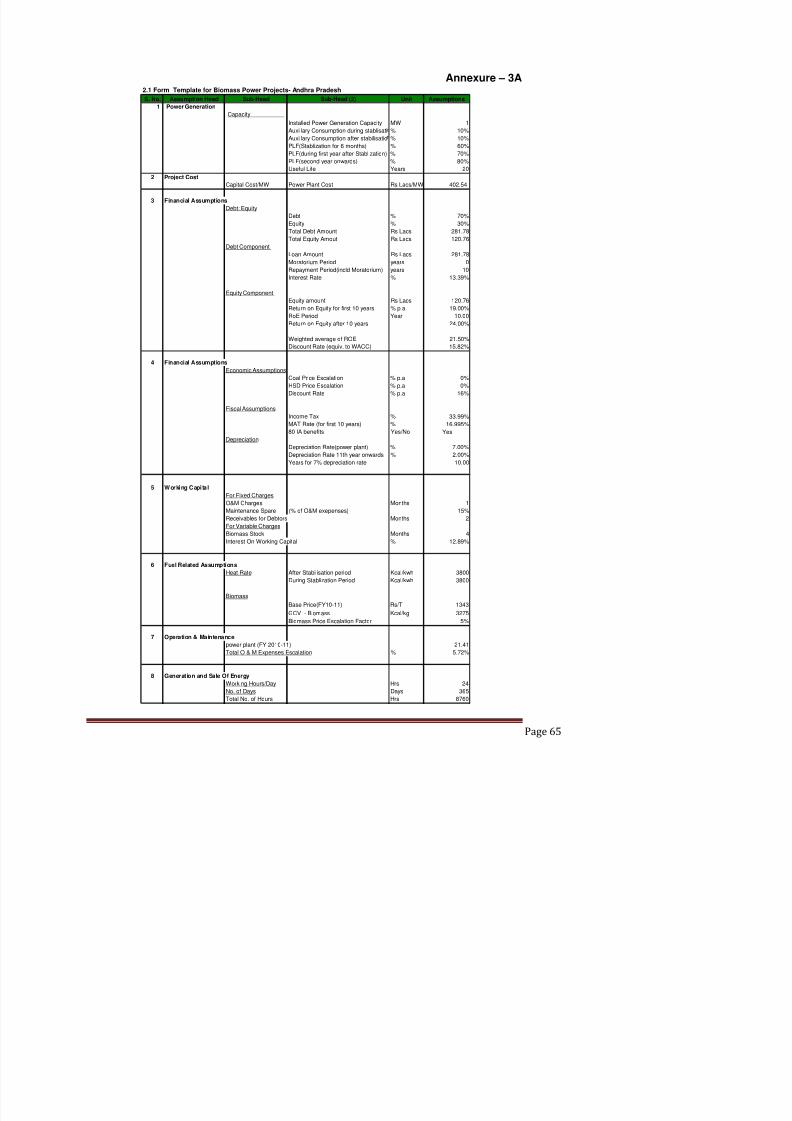
8/6/2019 Tariff Order FY201011
http://slidepdf.com/reader/full/tariff-order-fy201011 65/121

8/6/2019 Tariff Order FY201011
http://slidepdf.com/reader/full/tariff-order-fy201011 66/121

8/6/2019 Tariff Order FY201011
http://slidepdf.com/reader/full/tariff-order-fy201011 67/121
Annexure – 3B
2.1 Form Template for Biomass Power Projects- Haryana

8/6/2019 Tariff Order FY201011
http://slidepdf.com/reader/full/tariff-order-fy201011 68/121
2.1 Form Template for Biomass Power Projects Haryana
S. No. Assumption Head Sub-Head Sub-Head (2) Unit Assumptions
1 Power Generation
CapacityInstalled Power Generation Capacity MW 1
Auxillary Consumption during stablisatio% 10%
Auxillary Consumption after stabilisation% 10%
PLF(Stablization for 6 months) % 60%
PLF(during first year after Stablization) % 70%
PLF(second year onwards) % 80%
Useful Life Years 20
2 Project Cost
Capital Cost/MW Power Plant Cost Rs Lacs/MW 402.54
3 Financial Assumptions
Debt: Equity
Debt % 70%
Equity % 30%Total Debt Amount Rs Lacs 281.78
Total Equity Amout Rs Lacs 120.76
Debt Component
Loan Amount Rs Lacs 281.78
Moratorium Period years 0
Repayment Period(incld Moratorium) years 10
Interest Rate % 13.39%
Equity Component
Equity amount Rs Lacs 120.76
Return on Equity for first 10 years % p.a 19.00%
RoE Period Year 10.00
Return on Equity after 10 years 24.00%
Weighted average of ROE 21.50%
Discount Rate (equiv. to WACC) 15.82%
4 Financial Assumptions
Economic Assumptions
Coal Price Escalation % p.a 0%
HSD Price Escalation % p.a 0%
Discount Rate % p.a 16%
Fiscal Assumptions
Income Tax % 33.99%
MAT Rate (for first 10 years) % 16.995%
80 IA benefits Yes/No Yes
Depreciation
Depreciation Rate(power plant) % 7.00%Depreciation Rate 11th year onwards % 2.00%
Years for 7% depreciation rate 10.00
5 Working Capital
For Fixed Charges
O&M Charges Months 1
Maintenance Spare (% of O&M exepenses) 15%
Receivables for Debtors Months 2
For Variable Charges
Biomass Stock Months 4
Interest On Working Capital % 12.89%
6 Fuel Related Assumptions
Heat Rate After Stabilisation period Kcal/kwh 3800
During Stablization Period Kcal/kwh 3800
Biomass
Base Price(FY10-11) Rs/T 2238
GCV - Biomass Kcal/kg 3458

8/6/2019 Tariff Order FY201011
http://slidepdf.com/reader/full/tariff-order-fy201011 69/121
Determination of Accelerated Depreciation for Biomass Power ProjectDepreciation amount 90%
Book Depreciation rate 5 28%

8/6/2019 Tariff Order FY201011
http://slidepdf.com/reader/full/tariff-order-fy201011 70/121
Page 70
Book Depreciation rate 5.28%
Tax Depreciation rate 80%
Income Tax (MAT) 16.995%
Income Tax (Normal Ra tes) 33 .99%
Capital Cost 402.5
Years - -- -- -- -- -- -- -- --> Uni t 1 2 3 4 5 6 7 8 9 10 11 12 13 14 15 16 17 18 19 20
Book Depreciation % 2.64% 5.28% 5.28% 5.28% 5.28% 5.28% 5.28% 5.28% 5.28% 5.28% 5.28% 5.28% 5.28% 5.28% 5.28% 5.28% 5.28% 2.88% 0.00% 0.00%
Book Depreciation Rs Lakh 10.63 21.25 21.25 21.25 21.25 21.25 21.25 21.25 21.25 21.25 21.25 21.25 21.25 21.25 21.25 21.25 21.25 11.59 0.00 0.00
Accelerated Depreciation
Opening % 100% 60% 12% 2% 0% 0% 0% 0% 0% 0% 0% 0% 0% 0% 0% 0% 0% 0% 0% 0%
Allowed during the year % 40% 48.00% 9.60% 1.92% 0.38% 0.08% 0.02% 0.00% 0.00% 0.00% 0.00% 0.00% 0.00% 0.00% 0.00% 0.00% 0.00% 0.00% 0.00% 0.00%
Closing % 60% 12% 2.40% 0.48% 0.10% 0.02% 0.00% 0.00% 0.00% 0.00% 0.00% 0.00% 0.00% 0.00% 0.00% 0.00% 0.00% 0.00% 0.00% 0.00%
Accelrated Deprn. Rs Lakh 161.02 193.22 38.64 7.73 1.55 0.31 0.06 0.01 0.00 0.00 0.00 0.00 0.00 0.00 0.00 0.00 0.00 0.00 0.00 0.00
Net Depreciation Benefit Rs Lakh 150.39 171.96 17.39 -13.53 -19.71 -20.94 -21.19 -21.24 -21.25 -21.25 -21.25 -21.25 -21.25 -21.25 -21.25 -21.25 -21.25 -11.59 0.00 0.00
Tax Benefit Rs Lakh 51.12 58.45 5.91 -4.60 -6.70 -7.12 -7.20 -7.22 -7.22 -7.22 -7.22 -7.22 -7.22 -7.22 -7.22 -7.22 -7.22 -3.94 0.00 0.00
Net Energy generation MU 2.56 6.31 6.31 6.31 6.31 6.31 6.31 6.31 6.31 6.31 6.31 6.31 6.31 6.31 6.31 6.31 6.31 6.31 6.31 6.31
Discounting Factor 1.00 0.93 0.80 0.69 0.60 0.52 0.45 0.38 0.33 0.29 0.25 0.21 0.18 0.16 0.14 0.12 0.10 0.09 0.08 0.07
Levellised benefit 0.19 (Rs/kWh)

8/6/2019 Tariff Order FY201011
http://slidepdf.com/reader/full/tariff-order-fy201011 71/121

8/6/2019 Tariff Order FY201011
http://slidepdf.com/reader/full/tariff-order-fy201011 72/121
Determination of Accelerated Depreciation for Biomass Power ProjectDepreciation amount 90%
Book Depreciation rate 5.28%

8/6/2019 Tariff Order FY201011
http://slidepdf.com/reader/full/tariff-order-fy201011 73/121
Page 73
Tax Depreciation rate 80%
Income Tax (MAT) 16.995%
Income Tax (Normal Ra tes) 33 .99%
Capital Cost 402.5
Years - -- -- -- -- -- -- -- --> Uni t 1 2 3 4 5 6 7 8 9 10 11 12 13 14 15 16 17 18 19 20
Book Depreciation % 2.64% 5.28% 5.28% 5.28% 5.28% 5.28% 5.28% 5.28% 5.28% 5.28% 5.28% 5.28% 5.28% 5.28% 5.28% 5.28% 5.28% 2.88% 0.00% 0.00%
Book Depreciation Rs Lakh 10.63 21.25 21.25 21.25 21.25 21.25 21.25 21.25 21.25 21.25 21.25 21.25 21.25 21.25 21.25 21.25 21.25 11.59 0.00 0.00
Accelerated Depreciation
Opening % 100% 60% 12% 2% 0% 0% 0% 0% 0% 0% 0% 0% 0% 0% 0% 0% 0% 0% 0% 0%
Allowed during the year % 40% 48.00% 9.60% 1.92% 0.38% 0.08% 0.02% 0.00% 0.00% 0.00% 0.00% 0.00% 0.00% 0.00% 0.00% 0.00% 0.00% 0.00% 0.00% 0.00%
Closing % 60% 12% 2.40% 0.48% 0.10% 0.02% 0.00% 0.00% 0.00% 0.00% 0.00% 0.00% 0.00% 0.00% 0.00% 0.00% 0.00% 0.00% 0.00% 0.00%
Accelrated Deprn. Rs Lakh 161.02 193.22 38.64 7.73 1.55 0.31 0.06 0.01 0.00 0.00 0.00 0.00 0.00 0.00 0.00 0.00 0.00 0.00 0.00 0.00
Net Depreciation Benefit Rs Lakh 150.39 171.96 17.39 -13.53 -19.71 -20.94 -21.19 -21.24 -21.25 -21.25 -21.25 -21.25 -21.25 -21.25 -21.25 -21.25 -21.25 -11.59 0.00 0.00
Tax Benefit Rs Lakh 51.12 58.45 5.91 -4.60 -6.70 -7.12 -7.20 -7.22 -7.22 -7.22 -7.22 -7.22 -7.22 -7.22 -7.22 -7.22 -7.22 -3.94 0.00 0.00Net Energy generation MU 2.56 6.31 6.31 6.31 6.31 6.31 6.31 6.31 6.31 6.31 6.31 6.31 6.31 6.31 6.31 6.31 6.31 6.31 6.31 6.31
Discounting Factor 1.00 0.93 0.80 0.69 0.60 0.52 0.45 0.38 0.33 0.29 0.25 0.21 0.18 0.16 0.14 0.12 0.10 0.09 0.08 0.07
Levellised benefit 0.19 (Rs/kWh)

8/6/2019 Tariff Order FY201011
http://slidepdf.com/reader/full/tariff-order-fy201011 74/121

8/6/2019 Tariff Order FY201011
http://slidepdf.com/reader/full/tariff-order-fy201011 75/121
Determination of Accelerated Depreciation for Biomass Power ProjectDepreciation amount 90%
Book Depreciation rate 5.28%
Tax Depreciation rate 80%

8/6/2019 Tariff Order FY201011
http://slidepdf.com/reader/full/tariff-order-fy201011 76/121
Page 76
Tax Depreciation rate 80%
Income Tax (MAT) 16.995%
Income Tax (Normal Ra tes) 33 .99%Capital Cost 402.5
Years - -- -- -- -- -- -- -- --> Uni t 1 2 3 4 5 6 7 8 9 10 11 12 13 14 15 16 17 18 19 20
Book Depreciation % 2.64% 5.28% 5.28% 5.28% 5.28% 5.28% 5.28% 5.28% 5.28% 5.28% 5.28% 5.28% 5.28% 5.28% 5.28% 5.28% 5.28% 2.88% 0.00% 0.00%
Book Depreciation Rs Lakh 10.63 21.25 21.25 21.25 21.25 21.25 21.25 21.25 21.25 21.25 21.25 21.25 21.25 21.25 21.25 21.25 21.25 11.59 0.00 0.00
Accelerated Depreciation
Opening % 100% 60% 12% 2% 0% 0% 0% 0% 0% 0% 0% 0% 0% 0% 0% 0% 0% 0% 0% 0%
Allowed during the year % 40% 48.00% 9.60% 1.92% 0.38% 0.08% 0.02% 0.00% 0.00% 0.00% 0.00% 0.00% 0.00% 0.00% 0.00% 0.00% 0.00% 0.00% 0.00% 0.00%
Closing % 60% 12% 2.40% 0.48% 0.10% 0.02% 0.00% 0.00% 0.00% 0.00% 0.00% 0.00% 0.00% 0.00% 0.00% 0.00% 0.00% 0.00% 0.00% 0.00%
Accelrated Deprn. Rs Lakh 161.02 193.22 38.64 7.73 1.55 0.31 0.06 0.01 0.00 0.00 0.00 0.00 0.00 0.00 0.00 0.00 0.00 0.00 0.00 0.00
Net Depreciation Benefit Rs Lakh 150.39 171.96 17.39 -13.53 -19.71 -20.94 -21.19 -21.24 -21.25 -21.25 -21.25 -21.25 -21.25 -21.25 -21.25 -21.25 -21.25 -11.59 0.00 0.00
Tax Benefit Rs Lakh 51.12 58.45 5.91 -4.60 -6.70 -7.12 -7.20 -7.22 -7.22 -7.22 -7.22 -7.22 -7.22 -7.22 -7.22 -7.22 -7.22 -3.94 0.00 0.00Net Energy generation MU 2.56 6.31 6.31 6.31 6.31 6.31 6.31 6.31 6.31 6.31 6.31 6.31 6.31 6.31 6.31 6.31 6.31 6.31 6.31 6.31
Discounting Factor 1.00 0.93 0.80 0.69 0.60 0.52 0.45 0.38 0.33 0.29 0.25 0.21 0.18 0.16 0.14 0.12 0.10 0.09 0.08 0.07
Levellised benefit 0.19 (Rs/kWh)
Annexure – 3E
2.1 Form Template for Biomass Power Projects- Madhya Pradesh
S. No. Assumption Head Sub-Head Sub-Head (2) Unit Assumptions
1 Power Generation

8/6/2019 Tariff Order FY201011
http://slidepdf.com/reader/full/tariff-order-fy201011 77/121
1 Power Generation
Capacity
Installed Power Generation Capacity MW 1
Auxillary Consumption during stablisati % 10%
Auxillary Consumption after stabilisatio % 10%
PLF(Stablization for 6 months) % 60%
PLF(during first year after Stablization) % 70%
PLF(second year onwards) % 80%
Useful Life Years 20
2 Project Cost
Capital Cost/MW Power Plant Cost Rs Lacs/MW 402.54
3 Financial Assumptions
Debt: Equity
Debt % 70%
Equity % 30%
Total Debt Amount Rs Lacs 281.78
Total Equity Amout Rs Lacs 120.76
Debt Component
Loan Amount Rs Lacs 281.78
Moratorium Period years 0
Repayment Period(incld Moratorium) years 10
Interest Rate % 13.39%
Equity Component
Equity amount Rs Lacs 120.76
Return on Equity for first 10 years % p.a 19.00%
RoE Period Year 10.00
Return on Equity after 10 years 24.00%
Weighted average of ROE 21.50%Discount Rate (equiv. to WACC) 15.82%
4 Financia l Assumptions
Economic Assumptions
Coal Price Escalation % p.a 0%
HSD Price Escalation % p.a 0%
Discount Rate % p.a 16%
Fiscal Assumptions
Income Tax % 33.99%
MAT Rate (for first 10 years) % 16.995%
80 IA benefits Yes/No Yes
Depreciation
Depreciation Rate(power plant) % 7.00%
Depreciation Rate 11th year onwards % 2.00%
Years for 7% depreciation rate 10.00
5 Working Capital
For Fixed Charges
O&M Charges Months 1
Maintenance Spare (% of O&M exepenses) 15%
Receivables for Debtors Months 2
For Variable Charges
Biomass Stock Months 4
Interest On Working Capital % 12.89%
6 Fuel Related Assumptions
Heat Rate After Stabilisation period Kcal/kwh 3800
During Stablization Period Kcal/kwh 3800
Biomass
Base Price(FY10-11) Rs/T 1341
GCV - Biomass Kcal/kg 3612

8/6/2019 Tariff Order FY201011
http://slidepdf.com/reader/full/tariff-order-fy201011 78/121
Determination of Accelerated Depreciation for Biomass Power ProjectDepreciation amount 90%
Book Depreciation rate 5.28%
Tax Depreciation rate 80%
I T (MAT) 16 995%

8/6/2019 Tariff Order FY201011
http://slidepdf.com/reader/full/tariff-order-fy201011 79/121
Page 79
Income Tax (MAT) 16.995%
Income Tax (Normal Ra tes) 33 .99%Capital Cost 402.5
Years - -- -- -- -- -- -- -- --> Uni t 1 2 3 4 5 6 7 8 9 10 11 12 13 14 15 16 17 18 19 20
Book Depreciation % 2.64% 5.28% 5.28% 5.28% 5.28% 5.28% 5.28% 5.28% 5.28% 5.28% 5.28% 5.28% 5.28% 5.28% 5.28% 5.28% 5.28% 2.88% 0.00% 0.00%
Book Depreciation Rs Lakh 10.63 21.25 21.25 21.25 21.25 21.25 21.25 21.25 21.25 21.25 21.25 21.25 21.25 21.25 21.25 21.25 21.25 11.59 0.00 0.00
Accelerated Depreciation
Opening % 100% 60% 12% 2% 0% 0% 0% 0% 0% 0% 0% 0% 0% 0% 0% 0% 0% 0% 0% 0%
Allowed during the year % 40% 48.00% 9.60% 1.92% 0.38% 0.08% 0.02% 0.00% 0.00% 0.00% 0.00% 0.00% 0.00% 0.00% 0.00% 0.00% 0.00% 0.00% 0.00% 0.00%
Closing % 60% 12% 2.40% 0.48% 0.10% 0.02% 0.00% 0.00% 0.00% 0.00% 0.00% 0.00% 0.00% 0.00% 0.00% 0.00% 0.00% 0.00% 0.00% 0.00%
Accelrated Deprn. Rs Lakh 161.02 193.22 38.64 7.73 1.55 0.31 0.06 0.01 0.00 0.00 0.00 0.00 0.00 0.00 0.00 0.00 0.00 0.00 0.00 0.00
Net Depreciation Benefit Rs Lakh 150.39 171.96 17.39 -13.53 -19.71 -20.94 -21.19 -21.24 -21.25 -21.25 -21.25 -21.25 -21.25 -21.25 -21.25 -21.25 -21.25 -11.59 0.00 0.00
Tax Benefit Rs Lakh 51.12 58.45 5.91 -4.60 -6.70 -7.12 -7.20 -7.22 -7.22 -7.22 -7.22 -7.22 -7.22 -7.22 -7.22 -7.22 -7.22 -3.94 0.00 0.00Net Energy generation MU 2.56 6.31 6.31 6.31 6.31 6.31 6.31 6.31 6.31 6.31 6.31 6.31 6.31 6.31 6.31 6.31 6.31 6.31 6.31 6.31
Discounting Factor 1.00 0.93 0.80 0.69 0.60 0.52 0.45 0.38 0.33 0.29 0.25 0.21 0.18 0.16 0.14 0.12 0.10 0.09 0.08 0.07
Levellised benefit 0.19 (Rs/kWh)

8/6/2019 Tariff Order FY201011
http://slidepdf.com/reader/full/tariff-order-fy201011 80/121

8/6/2019 Tariff Order FY201011
http://slidepdf.com/reader/full/tariff-order-fy201011 81/121

8/6/2019 Tariff Order FY201011
http://slidepdf.com/reader/full/tariff-order-fy201011 82/121

8/6/2019 Tariff Order FY201011
http://slidepdf.com/reader/full/tariff-order-fy201011 83/121

8/6/2019 Tariff Order FY201011
http://slidepdf.com/reader/full/tariff-order-fy201011 84/121

8/6/2019 Tariff Order FY201011
http://slidepdf.com/reader/full/tariff-order-fy201011 85/121
Annexure – 3H
2.1 Form Template for Biomass Power Projects- Tamil Nadu
S. No. Assumption Head Sub-Head Sub-Head (2) Unit Assumptions
1 Power Generation
Capacity

8/6/2019 Tariff Order FY201011
http://slidepdf.com/reader/full/tariff-order-fy201011 86/121
Installed Power Generation Capacity MW 1
Auxillary Consumption during stablisatio% 10%
Auxillary Consumption after stabilisation% 10%
PLF(Stablization for 6 months) % 60%
PLF(during first year after Stablization) % 70%
PLF(second year onwards) % 80%
Useful Life Years 20
2 Project Cost
Capital Cost/MW Power Plant Cost Rs Lacs/MW 402.54
3 Financial Assumptions
Debt: Equity
Debt % 70%
Equity % 30%Total Debt Amount Rs Lacs 281.78
Total Equity Amout Rs Lacs 120.76
Debt Component
Loan Amount Rs Lacs 281.78
Moratorium Period years 0
Repayment Period(incld Moratorium) years 10
Interest Rate % 13.39%
Equity Component
Equity amount Rs Lacs 120.76
Return on Equity for first 10 years % p.a 19.00%
RoE Period Year 10.00
Return on Equity after 10 years 24.00%
Weighted average of ROE 21.50%
Discount Rate (equiv. to WACC) 15.82%
4 Financial Assumptions
Economic Assumptions
Coal Price Escalation % p.a 0%
HSD Price Escalation % p.a 0%
Discount Rate % p.a 16%
Fiscal Assumptions
Income Tax % 33.99%
MAT Rate (for first 10 years) % 16.995%
80 IA benefits Yes/No Yes
Depreciation Depreciation Rate(power plant) % 7.00%
Depreciation Rate 11th year onwards % 2.00%
Years for 7% depreciation rate 10.00
5 Working Capital
For Fixed Charges
O&M Charges Months 1
Maintenance Spare (% of O&M exepenses) 15%
Receivables for Debtors Months 2
For Variable Charges
Biomass Stock Months 4
Interest On Working Capital % 12.89%
6 Fuel Related Assumptions
Heat Rate After Stabilisation period Kcal/kwh 3800
During Stablization Period Kcal/kwh 3800
Biomass

8/6/2019 Tariff Order FY201011
http://slidepdf.com/reader/full/tariff-order-fy201011 87/121
Determination of Accelerated Depreciation for Biomass Power ProjectDepreciation amount 90%
Book Depreciation rate 5.28%
Tax Depreciation rate 80%
Income Tax (MAT) 16.995%
Income Tax (Normal Rates) 33 99%

8/6/2019 Tariff Order FY201011
http://slidepdf.com/reader/full/tariff-order-fy201011 88/121
Page 88
Income Tax (Normal Ra tes) 33 .99%Capital Cost 402.5
Years - -- -- -- -- -- -- -- --> Uni t 1 2 3 4 5 6 7 8 9 10 11 12 13 14 15 16 17 18 19 20
Book Depreciation % 2.64% 5.28% 5.28% 5.28% 5.28% 5.28% 5.28% 5.28% 5.28% 5.28% 5.28% 5.28% 5.28% 5.28% 5.28% 5.28% 5.28% 2.88% 0.00% 0.00%
Book Depreciation Rs Lakh 10.63 21.25 21.25 21.25 21.25 21.25 21.25 21.25 21.25 21.25 21.25 21.25 21.25 21.25 21.25 21.25 21.25 11.59 0.00 0.00
Accelerated Depreciation
Opening % 100% 60% 12% 2% 0% 0% 0% 0% 0% 0% 0% 0% 0% 0% 0% 0% 0% 0% 0% 0%
Allowed during the year % 40% 48.00% 9.60% 1.92% 0.38% 0.08% 0.02% 0.00% 0.00% 0.00% 0.00% 0.00% 0.00% 0.00% 0.00% 0.00% 0.00% 0.00% 0.00% 0.00%
Closing % 60% 12% 2.40% 0.48% 0.10% 0.02% 0.00% 0.00% 0.00% 0.00% 0.00% 0.00% 0.00% 0.00% 0.00% 0.00% 0.00% 0.00% 0.00% 0.00%
Accelrated Deprn. Rs Lakh 161.02 193.22 38.64 7.73 1.55 0.31 0.06 0.01 0.00 0.00 0.00 0.00 0.00 0.00 0.00 0.00 0.00 0.00 0.00 0.00
Net Depreciation Benefit Rs Lakh 150.39 171.96 17.39 -13.53 -19.71 -20.94 -21.19 -21.24 -21.25 -21.25 -21.25 -21.25 -21.25 -21.25 -21.25 -21.25 -21.25 -11.59 0.00 0.00
Tax Benefit Rs Lakh 51.12 58.45 5.91 -4.60 -6.70 -7.12 -7.20 -7.22 -7.22 -7.22 -7.22 -7.22 -7.22 -7.22 -7.22 -7.22 -7.22 -3.94 0.00 0.00Net Energy generation MU 2.56 6.31 6.31 6.31 6.31 6.31 6.31 6.31 6.31 6.31 6.31 6.31 6.31 6.31 6.31 6.31 6.31 6.31 6.31 6.31
Discounting Factor 1.00 0.93 0.80 0.69 0.60 0.52 0.45 0.38 0.33 0.29 0.25 0.21 0.18 0.16 0.14 0.12 0.10 0.09 0.08 0.07
Levellised benefit 0.19 (Rs/kWh)

8/6/2019 Tariff Order FY201011
http://slidepdf.com/reader/full/tariff-order-fy201011 89/121

8/6/2019 Tariff Order FY201011
http://slidepdf.com/reader/full/tariff-order-fy201011 90/121
Determination of Accelerated Depreciation for Biomass Power ProjectDepreciation amount 90%
Book Depreciation rate 5.28%
Tax Depreciation rate 80%
Income Tax (MAT) 16.995%
Income Tax (Normal Ra tes) 33 .99%Capital Cost 402.5

8/6/2019 Tariff Order FY201011
http://slidepdf.com/reader/full/tariff-order-fy201011 91/121
Page 91
Capital Cost 402.5
Years - -- -- -- -- -- -- -- --> Uni t 1 2 3 4 5 6 7 8 9 10 11 12 13 14 15 16 17 18 19 20
Book Depreciation % 2.64% 5.28% 5.28% 5.28% 5.28% 5.28% 5.28% 5.28% 5.28% 5.28% 5.28% 5.28% 5.28% 5.28% 5.28% 5.28% 5.28% 2.88% 0.00% 0.00%
Book Depreciation Rs Lakh 10.63 21.25 21.25 21.25 21.25 21.25 21.25 21.25 21.25 21.25 21.25 21.25 21.25 21.25 21.25 21.25 21.25 11.59 0.00 0.00
Accelerated Depreciation
Opening % 100% 60% 12% 2% 0% 0% 0% 0% 0% 0% 0% 0% 0% 0% 0% 0% 0% 0% 0% 0%
Allowed during the year % 40% 48.00% 9.60% 1.92% 0.38% 0.08% 0.02% 0.00% 0.00% 0.00% 0.00% 0.00% 0.00% 0.00% 0.00% 0.00% 0.00% 0.00% 0.00% 0.00%
Closing % 60% 12% 2.40% 0.48% 0.10% 0.02% 0.00% 0.00% 0.00% 0.00% 0.00% 0.00% 0.00% 0.00% 0.00% 0.00% 0.00% 0.00% 0.00% 0.00%
Accelrated Deprn. Rs Lakh 161.02 193.22 38.64 7.73 1.55 0.31 0.06 0.01 0.00 0.00 0.00 0.00 0.00 0.00 0.00 0.00 0.00 0.00 0.00 0.00
Net Depreciation Benefit Rs Lakh 150.39 171.96 17.39 -13.53 -19.71 -20.94 -21.19 -21.24 -21.25 -21.25 -21.25 -21.25 -21.25 -21.25 -21.25 -21.25 -21.25 -11.59 0.00 0.00
Tax Benefit Rs Lakh 51.12 58.45 5.91 -4.60 -6.70 -7.12 -7.20 -7.22 -7.22 -7.22 -7.22 -7.22 -7.22 -7.22 -7.22 -7.22 -7.22 -3.94 0.00 0.00
Net Energy generation MU 2.56 6.31 6.31 6.31 6.31 6.31 6.31 6.31 6.31 6.31 6.31 6.31 6.31 6.31 6.31 6.31 6.31 6.31 6.31 6.31
Discounting Factor 1.00 0.93 0.80 0.69 0.60 0.52 0.45 0.38 0.33 0.29 0.25 0.21 0.18 0.16 0.14 0.12 0.10 0.09 0.08 0.07
Levellised benefit 0.19 (Rs/kWh)
Annexure – 4A
2.1 Form Template for Non-Fossil Fueled Based Cogeneration Power Projects- Andhra Pradesh
S. No. Assumption Head Sub-Head Sub-Head (2) Unit Assumptions
1 Power Generation
Capacity
Installed Power Generation Capacity MW 1

8/6/2019 Tariff Order FY201011
http://slidepdf.com/reader/full/tariff-order-fy201011 92/121
p y
Auxillary Consumption % 8.5%
Plant Load Factor % 45%
Life of Power Plant Years 20
2 Project Cost
Capital Cost/MW Power Plant Cost Rs Lacs/MW 398.07
3 Financial Assumptions
Debt: Equity
Debt % 70%
Equity % 30%
Total Debt Amount Rs Lacs 278.65
Total Equity Amout Rs Lacs 119.42
Debt ComponentLoan Amount Rs Lacs 278.65
Moratorium Period years 0
Repayment Period(incld Moratorium) years 10
Interest Rate % 13.39%
Equity Component
Equity amount Rs Lacs 119.42
Return on Equity for first 10 years % p.a 19.00%
RoE Period Year 10.00
Return on Equity after 10 years 24.00%
Weighted average of ROE 21.50%
Discount Rate (equiv. to WACC) 15.82%
4 Financial Assumptions
Economic Assumptions
Coal Price Escalation % p.a 0%
HSD Price Escalation % p.a 0%
Discount Rate % p.a 16%
Depreciation
Depreciation Rate(power plant) % 7.00%
Depreciation Rate 11th year onwards % 2.00%
Years for 7% depreciation rate 10.00
MAT Rate % 16.995%
Corporate Tax Rate % 33.99%
5 Working Capital
For Fixed Charges
O&M Charges Months 1
Maintenance Spare (% of O&M exepenses) 15%
Receivables for Debtors Months 2
For Variable Charges
Bagasse Stock Months 4
Interest On Working Capital % 12.89%
6 Fuel Related Assumptions
Heat Rate After Stabilisation period Kcal/kwh 3600
During Stablization Period Kcal/kwh 3600
Bagasse
Base Price(FY10-11) Rs/T 928
GCV - Bagasse Kcal/kg 2250
Bagasse Price Escalation Factor 5%
7 Allocation of Bagasse to Power and Steam

8/6/2019 Tariff Order FY201011
http://slidepdf.com/reader/full/tariff-order-fy201011 93/121
Determination of Accelerated Depreciation for Non fossil Fueled Based Cogeneration Power Projects
Depreciation amount 90%
Book Deprec ia tion rate 5 .28%
Tax Depreciation rate 80%
Income Tax (MAT) 16.995%
Income Tax (Normal Rates) 33.99%
Capital Cost 398.1

8/6/2019 Tariff Order FY201011
http://slidepdf.com/reader/full/tariff-order-fy201011 94/121
Page 94
Years - -- -- -- -- -- -- -- --> Uni t 1 2 3 4 5 6 7 8 9 10 11 12 13 14 15 16 17 18 19 20
Book Depreciation % 2.64% 5.28% 5.28% 5.28% 5.28% 5.28% 5.28% 5.28% 5.28% 5.28% 5.28% 5.28% 5.28% 5.28% 5.28% 5.28% 5.28% 2.88% 0.00% 0.00%
Book Depreciation Rs Lakh 10.51 21.02 21.02 21.02 21.02 21.02 21.02 21.02 21.02 21.02 21.02 21.02 21.02 21.02 21.02 21.02 21.02 11.46 0.00 0.00
Accelerated Depreciation
Opening % 100% 60% 12% 2% 0% 0% 0% 0% 0% 0% 0% 0% 0% 0% 0% 0% 0% 0% 0% 0%
Allowed during the year % 40% 48.00% 9.60% 1.92% 0.38% 0.08% 0.02% 0.00% 0.00% 0.00% 0.00% 0.00% 0.00% 0.00% 0.00% 0.00% 0.00% 0.00% 0.00% 0.00%
Closing % 60% 12% 2 .40% 0 .48% 0.10% 0.02% 0 .00% 0.00% 0 .00% 0.00% 0 .00% 0.00% 0 .00% 0 .00% 0.00% 0.00% 0.00% 0 .00% 0.00% 0 .00%
Accelrated Deprn. Rs Lakh 159.23 191.07 38.21 7.64 1.53 0.31 0.06 0.01 0.00 0.00 0.00 0.00 0.00 0.00 0.00 0.00 0.00 0.00 0.00 0.00
Net Deprec iation Benef it Rs Lakh 148.72 170.05 17.20 -13.38 -19.49 -20.71 -20 .96 -21.01 -21 .02 -21.02 -21.02 -21.02 -21.02 -21.02 -21 .02 -21.02 -21.02 -11.46 0 .00 0.00
Tax Benefit Rs Lakh 50.55 57.80 5.85 -4.55 -6.62 -7.04 -7.12 -7.14 -7.14 -7.14 -7.14 -7.14 -7.14 -7.14 -7.14 -7.14 -7.14 -3.90 0.00 0.00
Energy generation MU 1.80 3.61 3.61 3.61 3.61 3.61 3.61 3.61 3.61 3.61 3.61 3.61 3.61 3.61 3.61 3.61 3.61 3.61 3.61 3.61
Discounting Factor 1.00 0.93 0.80 0.69 0.60 0.52 0.45 0.38 0.33 0.29 0.25 0.21 0.18 0.16 0.14 0.12 0.10 0.09 0.08 0.07
Levellised benefit 0.32 Rs/Unit

8/6/2019 Tariff Order FY201011
http://slidepdf.com/reader/full/tariff-order-fy201011 95/121

8/6/2019 Tariff Order FY201011
http://slidepdf.com/reader/full/tariff-order-fy201011 96/121

8/6/2019 Tariff Order FY201011
http://slidepdf.com/reader/full/tariff-order-fy201011 97/121
Annexure – 4C
2.1 Form Template for Non-Fossil Fueled Based Cogeneration Power Projects- Maharashtra
S. No. Assumption Head Sub-Head Sub-Head (2) Unit Assumptions
1 Power Generation
Capacity
Installed Power Generation Capacity MW 1Auxillary Consumption % 8.5%
Pl L d F % 60%

8/6/2019 Tariff Order FY201011
http://slidepdf.com/reader/full/tariff-order-fy201011 98/121
Plant Load Factor % 60%
Life of Power Plant Years 20
2 Project Cost
Capital Cost/MW Power Plant Cost Rs Lacs/MW 398.07
3 Financial Assumptions
Debt: Equity
Debt % 70%
Equity % 30%
Total Debt Amount Rs Lacs 278.65
Total Equity Amout Rs Lacs 119.42
Debt Component Loan Amount Rs Lacs 278.65
Moratorium Period years 0
Repayment Period(incld Moratorium) years 10
Interest Rate % 13.39%
Equity Component
Equity amount Rs Lacs 119.42
Return on Equity for first 10 years % p.a 19.00%
RoE Period Year 10.00
Return on Equity after 10 years 24.00%
Weighted average of ROE 21.50%
Discount Rate (equiv. to WACC) 15.82%
4 Financial Assumptions
Economic Assumptions
Coal Price Escalation % p.a 0%
HSD Price Escalation % p.a 0%
Discount Rate % p.a 16%
Depreciation
Depreciation Rate(power plant) % 7.00%
Depreciation Rate 11th year onwards % 2.00%
Years for 7% depreciation rate 10.00
MAT Rate % 16.995%
Corporate Tax Rate % 33.99%
5 Working Capital
For Fixed Charges
O&M Charges Months 1
Maintenance Spare (% of O&M exepenses) 15%
Receivables for Debtors Months 2
For Variable Charges
Bagasse Stock Months 4
Interest On Working Capital % 12.89%
6 Fuel Related Assumptions
Heat Rate After Stabilisation period Kcal/kwh 3600
During Stablization Period Kcal/kwh 3600
Bagasse
Base Price(FY10-11) Rs/T 1159
GCV - Bagasse Kcal/kg 2250
Bagasse Price Escalation Factor 5%
7 Allocation of Bagasse to Power and Steam

8/6/2019 Tariff Order FY201011
http://slidepdf.com/reader/full/tariff-order-fy201011 99/121

8/6/2019 Tariff Order FY201011
http://slidepdf.com/reader/full/tariff-order-fy201011 100/121

8/6/2019 Tariff Order FY201011
http://slidepdf.com/reader/full/tariff-order-fy201011 101/121
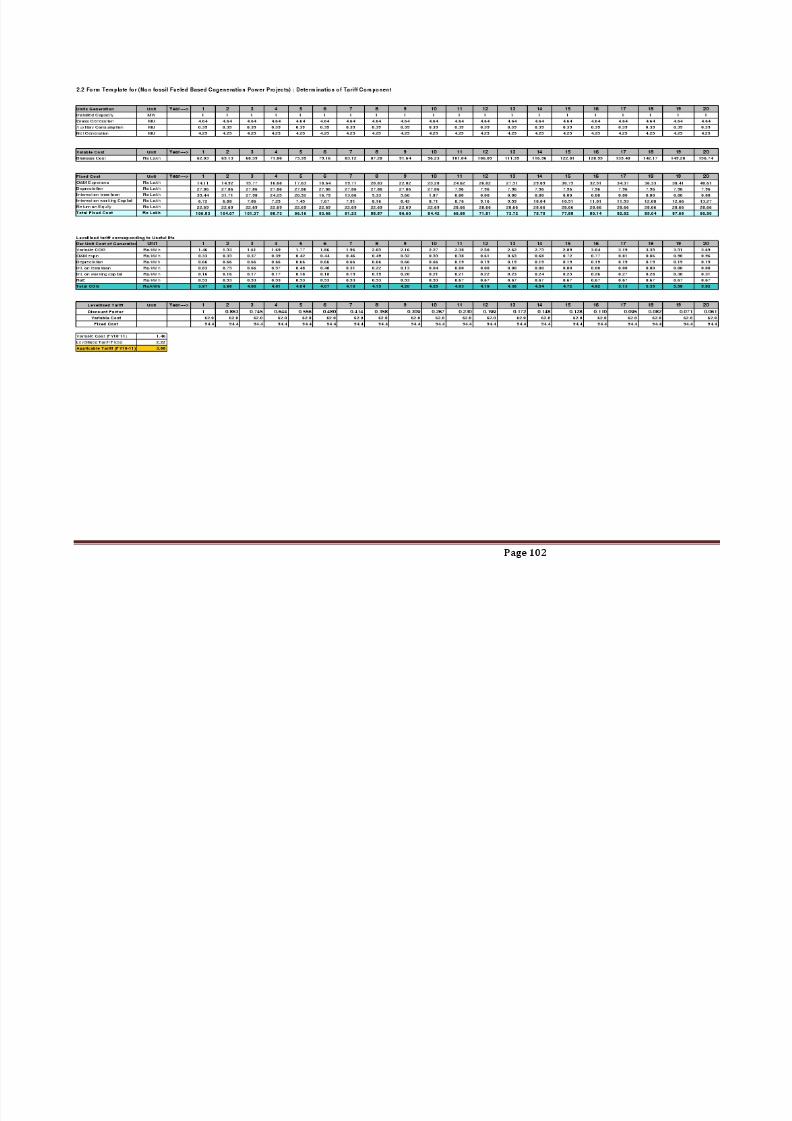
8/6/2019 Tariff Order FY201011
http://slidepdf.com/reader/full/tariff-order-fy201011 102/121
Determination of Accelerated Depreciation for Non fossil Fueled Based Cogeneration Power Projects
Depreciation amount 90%
Book Deprec ia tion rate 5 .28%
Tax Depreciation rate 80%
Income Tax (MAT) 16.995%
Income Tax (Normal Rates) 33.99%
Capital Cost 398.1
Years - -- -- -- -- -- -- -- --> Uni t 1 2 3 4 5 6 7 8 9 10 11 12 13 14 15 16 17 18 19 20

8/6/2019 Tariff Order FY201011
http://slidepdf.com/reader/full/tariff-order-fy201011 103/121
Page 103
Book Depreciation % 2.64% 5.28% 5.28% 5.28% 5.28% 5.28% 5.28% 5.28% 5.28% 5.28% 5.28% 5.28% 5.28% 5.28% 5.28% 5.28% 5.28% 2.88% 0.00% 0.00%
Book Depreciation Rs Lakh 10.51 21.02 21.02 21.02 21.02 21.02 21.02 21.02 21.02 21.02 21.02 21.02 21.02 21.02 21.02 21.02 21.02 11.46 0.00 0.00
Accelerated Depreciation
Opening % 100% 60% 12% 2% 0% 0% 0% 0% 0% 0% 0% 0% 0% 0% 0% 0% 0% 0% 0% 0%
Allowed during the year % 40% 48.00% 9.60% 1.92% 0.38% 0.08% 0.02% 0.00% 0.00% 0.00% 0.00% 0.00% 0.00% 0.00% 0.00% 0.00% 0.00% 0.00% 0.00% 0.00%
Closing % 60% 12% 2 .40% 0 .48% 0.10% 0.02% 0 .00% 0.00% 0 .00% 0.00% 0 .00% 0.00% 0 .00% 0 .00% 0.00% 0.00% 0.00% 0 .00% 0.00% 0 .00%
Accelrated Deprn. Rs Lakh 159.23 191.07 38.21 7.64 1.53 0.31 0.06 0.01 0.00 0.00 0.00 0.00 0.00 0.00 0.00 0.00 0.00 0.00 0.00 0.00
Net Deprec iation Benef it Rs Lakh 148.72 170.05 17.20 -13.38 -19.49 -20.71 -20 .96 -21.01 -21 .02 -21.02 -21.02 -21.02 -21.02 -21.02 -21 .02 -21.02 -21.02 -11.46 0 .00 0.00
Tax Benefit Rs Lakh 50.55 57.80 5.85 -4.55 -6.62 -7.04 -7.12 -7.14 -7.14 -7.14 -7.14 -7.14 -7.14 -7.14 -7.14 -7.14 -7.14 -3.90 0.00 0.00
Energy generation MU 2.12 4.25 4.25 4.25 4.25 4.25 4.25 4.25 4.25 4.25 4.25 4.25 4.25 4.25 4.25 4.25 4.25 4.25 4.25 4.25Discounting Factor 1.00 0.93 0.80 0.69 0.60 0.52 0.45 0.38 0.33 0.29 0.25 0.21 0.18 0.16 0.14 0.12 0.10 0.09 0.08 0.07
Levellised benefit 0.27 Rs/Unit
Annexure – 4E
2.1 Form Template for Non-Fossil Fueled Based Cogeneration Power Projects- Punjab
S. No. Assumption Head Sub-Head Sub-Head (2) Unit Assumptions
1 Power Generation
Capacity
Installed Power Generation Capacity MW 1Auxillary Consumption % 8.5%
Plant Load Factor % 53%
Life of Power Plant Years 20

8/6/2019 Tariff Order FY201011
http://slidepdf.com/reader/full/tariff-order-fy201011 104/121
Life of Power Plant Years 20
2 Project Cost
Capital Cost/MW Power Plant Cost Rs Lacs/MW 398.07
3 Financial Assumptions
Debt: Equity
Debt % 70%
Equity % 30%
Total Debt Amount Rs Lacs 278.65
Total Equity Amout Rs Lacs 119.42
Debt Component
Loan Amount Rs Lacs 278.65
Moratorium Period years 0
Repayment Period(incld Moratorium) years 10
Interest Rate % 13.39%
Equity Component
Equity amount Rs Lacs 119.42
Return on Equity for first 10 years % p.a 19.00%
RoE Period Year 10.00
Return on Equity after 10 years 24.00%
Weighted average of ROE 21.50%
Discount Rate (equiv. to WACC) 15.82%
4 Financial Assumptions
Economic Assumptions
Coal Price Escalation % p.a 0%
HSD Price Escalation % p.a 0%
Discount Rate % p.a 16%
Depreciation
Depreciation Rate(power plant) % 7.00%
Depreciation Rate 11th year onwards % 2.00%
Years for 7% depreciation rate 10.00
MAT Rate % 16.995%
Corporate Tax Rate % 33.99%
5 Working Capital
For Fixed Charges
O&M Charges Months 1
Maintenance Spare (% of O&M exepenses) 15%
Receivables for Debtors Months 2
For Variable Charges
Bagasse Stock Months 4
Interest On Working Capital % 12.89%
6 Fuel Related Assumptions
Heat Rate After Stabilisation period Kcal/kwh 3600
During Stablization Period Kcal/kwh 3600
Bagasse
Base Price(FY10-11) Rs/T 1443
GCV - Bagasse Kcal/kg 2250
Bagasse Price Escalation Factor 5%
7 Allocation of Bagasse to Power and Steam

8/6/2019 Tariff Order FY201011
http://slidepdf.com/reader/full/tariff-order-fy201011 105/121

8/6/2019 Tariff Order FY201011
http://slidepdf.com/reader/full/tariff-order-fy201011 106/121
Annexure – 4F
2.1 Form Template for Non-Fossil Fueled Based Cogeneration Power Projects- Uttar Pradesh
S. No. Assumption Head Sub-Head Sub-Head (2) Unit Assumptions
1 Power Generation
Capacity
Installed Power Generation Capacity MW 1Auxillary Consumption % 8.5%
Plant Load Factor % 45%
Life of Power Plant Years 20

8/6/2019 Tariff Order FY201011
http://slidepdf.com/reader/full/tariff-order-fy201011 107/121
2 Project Cost
Capital Cost/MW Power Plant Cost Rs Lacs/MW 398.07
3 Financial Assumptions
Debt: Equity
Debt % 70%
Equity % 30%
Total Debt Amount Rs Lacs 278.65
Total Equity Amout Rs Lacs 119.42
Debt Component
Loan Amount Rs Lacs 278.65
Moratorium Period years 0
Repayment Period(incld Moratorium) years 10
Interest Rate % 13.39%
Equity Component
Equity amount Rs Lacs 119.42
Return on Equity for first 10 years % p.a 19.00%
RoE Period Year 10.00
Return on Equity after 10 years 24.00%
Weighted average of ROE 21.50%
Discount Rate (equiv. to WACC) 15.82%
4 Financial Assumptions
Economic Assumptions
Coal Price Escalation % p.a 0%
HSD Price Escalation % p.a 0%
Discount Rate % p.a 16%
Depreciation
Depreciation Rate(power plant) % 7.00%
Depreciation Rate 11th year onwards % 2.00%
Years for 7% depreciation rate 10.00
MAT Rate % 16.995%
Corporate Tax Rate % 33.99%
5 Working Capital
For Fixed Charges
O&M Charges Months 1
Maintenance Spare (% of O&M exepenses) 15%
Receivables for Debtors Months 2
For Variable Charges
Bagasse Stock Months 4
Interest On Working Capital % 12.89%
6 Fuel Related Assumptions
Heat Rate After Stabilisation period Kcal/kwh 3600
During Stablization Period Kcal/kwh 3600
Bagasse
Base Price(FY10-11) Rs/T 1046
GCV - Bagasse Kcal/kg 2250
Bagasse Price Escalation Factor 5%
7 Allocation of Bagasse to Power and Steam

8/6/2019 Tariff Order FY201011
http://slidepdf.com/reader/full/tariff-order-fy201011 108/121
Determination of Accelerated Depreciation for Non fossil Fueled Based Cogeneration Power Projects
Depreciation amount 90%
Book Deprec ia tion rate 5 .28%
Tax Depreciation rate 80%
Income Tax (MAT) 16.995%
Income Tax (Normal Rates) 33.99%
Capital Cost 398.1
Years - -- -- -- -- -- -- -- --> Uni t 1 2 3 4 5 6 7 8 9 10 11 12 13 14 15 16 17 18 19 20
Book Depreciation % 2.64% 5.28% 5.28% 5.28% 5.28% 5.28% 5.28% 5.28% 5.28% 5.28% 5.28% 5.28% 5.28% 5.28% 5.28% 5.28% 5.28% 2.88% 0.00% 0.00%
Book Depreciation Rs Lakh 10 51 21 02 21 02 21 02 21 02 21 02 21 02 21 02 21 02 21 02 21 02 21 02 21 02 21 02 21 02 21 02 21 02 11 46 0 00 0 00

8/6/2019 Tariff Order FY201011
http://slidepdf.com/reader/full/tariff-order-fy201011 109/121
Page 109
Book Depreciation Rs Lakh 10.51 21.02 21.02 21.02 21.02 21.02 21.02 21.02 21.02 21.02 21.02 21.02 21.02 21.02 21.02 21.02 21.02 11.46 0.00 0.00
Accelerated Depreciation
Opening % 100% 60% 12% 2% 0% 0% 0% 0% 0% 0% 0% 0% 0% 0% 0% 0% 0% 0% 0% 0%
Allowed during the year % 40% 48.00% 9.60% 1.92% 0.38% 0.08% 0.02% 0.00% 0.00% 0.00% 0.00% 0.00% 0.00% 0.00% 0.00% 0.00% 0.00% 0.00% 0.00% 0.00%
Closing % 60% 12% 2 .40% 0 .48% 0.10% 0.02% 0 .00% 0.00% 0 .00% 0.00% 0 .00% 0.00% 0 .00% 0 .00% 0.00% 0.00% 0.00% 0 .00% 0.00% 0 .00%
Accelrated Deprn. Rs Lakh 159.23 191.07 38.21 7.64 1.53 0.31 0.06 0.01 0.00 0.00 0.00 0.00 0.00 0.00 0.00 0.00 0.00 0.00 0.00 0.00
Net Deprec iation Benef it Rs Lakh 148.72 170.05 17.20 -13.38 -19.49 -20.71 -20 .96 -21.01 -21 .02 -21.02 -21.02 -21.02 -21.02 -21.02 -21 .02 -21.02 -21.02 -11.46 0 .00 0.00
Tax Benefit Rs Lakh 50.55 57.80 5.85 -4.55 -6.62 -7.04 -7.12 -7.14 -7.14 -7.14 -7.14 -7.14 -7.14 -7.14 -7.14 -7.14 -7.14 -3.90 0.00 0.00
Energy generation MU 1.80 3.61 3.61 3.61 3.61 3.61 3.61 3.61 3.61 3.61 3.61 3.61 3.61 3.61 3.61 3.61 3.61 3.61 3.61 3.61Discounting Factor 1.00 0.93 0.80 0.69 0.60 0.52 0.45 0.38 0.33 0.29 0.25 0.21 0.18 0.16 0.14 0.12 0.10 0.09 0.08 0.07
Levellised benefit 0.32 Rs/Unit
Annexure – 4G
2.1 Form Template for Non-Fossil Fueled Based Cogeneration Power Projects- Tamil Nadu
S. No. Assumption Head Sub-Head Sub-Head (2) Unit Assumptions
1 Power Generation
Capacity
Installed Power Generation Capacity MW 1Auxillary Consumption % 8.5%
Plant Load Factor % 60%
Life of Power Plant Years 20
2 Project Cost

8/6/2019 Tariff Order FY201011
http://slidepdf.com/reader/full/tariff-order-fy201011 110/121
j
Capital Cost/MW Power Plant Cost Rs Lacs/MW 398.07
3 Financial Assumptions
Debt: Equity
Debt % 70%
Equity % 30%
Total Debt Amount Rs Lacs 278.65
Total Equity Amout Rs Lacs 119.42
Debt Component
Loan Amount Rs Lacs 278.65Moratorium Period years 0
Repayment Period(incld Moratorium) years 10
Interest Rate % 13.39%
Equity Component
Equity amount Rs Lacs 119.42
Return on Equity for first 10 years % p.a 19.00%
RoE Period Year 10.00
Return on Equity after 10 years 24.00%
Weighted average of ROE 21.50%
Discount Rate (equiv. to WACC) 15.82%
4 Financial AssumptionsEconomic Assumptions
Coal Price Escalation % p.a 0%
HSD Price Escalation % p.a 0%
Discount Rate % p.a 16%
Depreciation
Depreciation Rate(power plant) % 7.00%
Depreciation Rate 11th year onwards % 2.00%
Years for 7% depreciation rate 10.00
MAT Rate % 16.995%
Corporate Tax Rate % 33.99%
5 Working Capital
For Fixed ChargesO&M Charges Months 1
Maintenance Spare (% of O&M exepenses) 15%
Receivables for Debtors Months 2
For Variable Charges
Bagasse Stock Months 4
Interest On Working Capital % 12.89%
6 Fuel Related Assump tions
Heat Rate After Stabilisation period Kcal/kwh 3600
During Stablization Period Kcal/kwh 3600
Bagasse
Base Price(FY10-11) Rs/T 1283GCV - Bagasse Kcal/kg 2250
Bagasse Price Escalation Factor 5%
7 Allocation of Bagasse to Power and Steam
Power As a % of fuel cost 100%
Steam As a % of fuel cost 0%

8/6/2019 Tariff Order FY201011
http://slidepdf.com/reader/full/tariff-order-fy201011 111/121

8/6/2019 Tariff Order FY201011
http://slidepdf.com/reader/full/tariff-order-fy201011 112/121
Annexure – 4H
2.1 Form Template for Non-Fossil Fueled Based Cogeneration Power Projects- Other States
S. No. Assumption Head Sub-Head Sub-Head (2) Unit Assumptions
1 Power Generation
Capacity
Installed Power Generation Capacity MW 1Auxillary Consumption % 8.5%
Plant Load Factor % 53%
Life of Power Plant Years 20
2 Project Cost
C it l C t/MW P Pl t C t R L /MW 398 07

8/6/2019 Tariff Order FY201011
http://slidepdf.com/reader/full/tariff-order-fy201011 113/121
Capital Cost/MW Power Plant Cost Rs Lacs/MW 398.07
3 Financial Assumptions
Debt: Equity
Debt % 70%
Equity % 30%
Total Debt Amount Rs Lacs 278.65
Total Equity Amout Rs Lacs 119.42
Debt Component
Loan Amount Rs Lacs 278.65Moratorium Period years 0
Repayment Period(incld Moratorium) years 10
Interest Rate % 13.39%
Equity Component
Equity amount Rs Lacs 119.42
Return on Equity for first 10 years % p.a 19.00%
RoE Period Year 10.00
Return on Equity after 10 years 24.00%
Weighted average of ROE 21.50%
Discount Rate (equiv. to WACC) 15.82%
4 Financial AssumptionsEconomic Assumptions
Coal Price Escalation % p.a 0%
HSD Price Escalation % p.a 0%
Discount Rate % p.a 16%
Depreciation
Depreciation Rate(power plant) % 7.00%
Depreciation Rate 11th year onwards % 2.00%
Years for 7% depreciation rate 10.00
MAT Rate % 16.995%
Corporate Tax Rate % 33.99%
5 Working Capital
For Fixed Charges
O&M Charges Months 1
Maintenance Spare (% of O&M exepenses) 15%
Receivables for Debtors Months 2
For Variable Charges
Bagasse Stock Months 4
Interest On Working Capital % 12.89%
6 Fuel Related Assumptions
Heat Rate After Stabilisation period Kcal/kwh 3600
During Stablization Period Kcal/kwh 3600
BagasseBase Price(FY10-11) Rs/T 1200
GCV - Bagasse Kcal/kg 2250
Bagasse Price Escalation Factor 5%
7 Allocation of Bagasse to Power and Steam
Power As a % of fuel cost 100%

8/6/2019 Tariff Order FY201011
http://slidepdf.com/reader/full/tariff-order-fy201011 114/121
Determination of Accelerated Depreciation for Non fossil Fueled Based Cogeneration Power Projects
Depreciation amount 90%
Book Deprec ia tion rate 5 .28%
Tax Depreciation rate 80%
Income Tax (MAT) 16.995%
Income Tax (Normal Rates) 33.99%
Capital Cost 398.1
Years - -- -- -- -- -- -- -- --> Uni t 1 2 3 4 5 6 7 8 9 10 11 12 13 14 15 16 17 18 19 20
Book Depreciation % 2.64% 5.28% 5.28% 5.28% 5.28% 5.28% 5.28% 5.28% 5.28% 5.28% 5.28% 5.28% 5.28% 5.28% 5.28% 5.28% 5.28% 2.88% 0.00% 0.00%
Book Depreciation Rs Lakh 10.51 21.02 21.02 21.02 21.02 21.02 21.02 21.02 21.02 21.02 21.02 21.02 21.02 21.02 21.02 21.02 21.02 11.46 0.00 0.00

8/6/2019 Tariff Order FY201011
http://slidepdf.com/reader/full/tariff-order-fy201011 115/121
Page 115
Accelerated Depreciation
Opening % 100% 60% 12% 2% 0% 0% 0% 0% 0% 0% 0% 0% 0% 0% 0% 0% 0% 0% 0% 0%
Allowed during the year % 40% 48.00% 9.60% 1.92% 0.38% 0.08% 0.02% 0.00% 0.00% 0.00% 0.00% 0.00% 0.00% 0.00% 0.00% 0.00% 0.00% 0.00% 0.00% 0.00%
Closing % 60% 12% 2 .40% 0 .48% 0.10% 0.02% 0 .00% 0.00% 0 .00% 0.00% 0 .00% 0.00% 0 .00% 0 .00% 0.00% 0.00% 0.00% 0 .00% 0.00% 0 .00%
Accelrated Deprn. Rs Lakh 159.23 191.07 38.21 7.64 1.53 0.31 0.06 0.01 0.00 0.00 0.00 0.00 0.00 0.00 0.00 0.00 0.00 0.00 0.00 0.00
Net Deprec iation Benef it Rs Lakh 148.72 170.05 17.20 -13.38 -19.49 -20.71 -20 .96 -21.01 -21 .02 -21.02 -21.02 -21.02 -21.02 -21.02 -21 .02 -21.02 -21.02 -11.46 0 .00 0.00
Tax Benefit Rs Lakh 50.55 57.80 5.85 -4.55 -6.62 -7.04 -7.12 -7.14 -7.14 -7.14 -7.14 -7.14 -7.14 -7.14 -7.14 -7.14 -7.14 -3.90 0.00 0.00
Energy generation MU 2.12 4.25 4.25 4.25 4.25 4.25 4.25 4.25 4.25 4.25 4.25 4.25 4.25 4.25 4.25 4.25 4.25 4.25 4.25 4.25Discounting Factor 1.00 0.93 0.80 0.69 0.60 0.52 0.45 0.38 0.33 0.29 0.25 0.21 0.18 0.16 0.14 0.12 0.10 0.09 0.08 0.07
Levellised benefit 0.27 Rs/Unit

8/6/2019 Tariff Order FY201011
http://slidepdf.com/reader/full/tariff-order-fy201011 116/121

8/6/2019 Tariff Order FY201011
http://slidepdf.com/reader/full/tariff-order-fy201011 117/121
Determination of Accelerated Depreciation Benefit for Solar PV Power ProjectsDepreciation amount 90%
Book Deprec ia tion rate 5 .28%
Tax Depreciation rate 80%
Income Tax (MAT) 16.995%
Income Tax (Normal Rates) 33.99%
Capital Cost 1690.0
Years - -- -- -- -- -- -- -- --> Uni t 1 2 3 4 5 6 7 8 9 10 11 12 13 14 15 16 17 18 19 20
Book Depreciation 2.64% 5.28% 5.28% 5.28% 5.28% 5.28% 5.28% 5.28% 5.28% 5.28% 5.28% 5.28% 5.28% 5.28% 5.28% 5.28% 5.28% 2.88% 0.00% 0.00%
Book Depreciation Rs Lakh 44.62 89.23 89.23 89.23 89.23 89.23 89.23 89.23 89.23 89.23 89.23 89.23 89.23 89.23 89.23 89.23 89.23 48.67 0.00 0.00

8/6/2019 Tariff Order FY201011
http://slidepdf.com/reader/full/tariff-order-fy201011 118/121
Page 118
Accelerated Depreciation
Opening % 100% 60% 12% 2% 0% 0% 0% 0% 0% 0% 0% 0% 0% 0% 0% 0% 0% 0% 0% 0%
Allowed during the year % 40% 48.00% 9.60% 1.92% 0.38% 0.08% 0.02% 0.00% 0.00% 0.00% 0.00% 0.00% 0.00% 0.00% 0.00% 0.00% 0.00% 0.00% 0.00% 0.00%
Closing % 60% 12% 2 .40% 0 .48% 0.10% 0.02% 0 .00% 0.00% 0 .00% 0.00% 0 .00% 0.00% 0 .00% 0 .00% 0.00% 0.00% 0.00% 0 .00% 0.00% 0 .00%
Accelrated Deprn. Rs Lakh 676.00 811.20 162.24 32.45 6.49 1.30 0.26 0.05 0.01 0.00 0.00 0.00 0.00 0.00 0.00 0.00 0.00 0.00 0.00 0.00
Net Deprec iation Benef it Rs Lakh 631.38 721.97 73.01 -56.78 -82.74 -87.93 -88 .97 -89.18 -89 .22 -89.23 -89.23 -89.23 -89.23 -89.23 -89 .23 -89.23 -89.23 -48.67 0 .00 0.00
Tax Benefit Rs Lakh 214.61 245.40 24.82 -19.30 -28.12 -29.89 -30.24 -30.31 -30.33 -30.33 -30.33 -30.33 -30.33 -30.33 -30.33 -30.33 -30.33 -16.54 0.00 0.00
Energy generation MU 0.83 1.66 1.66 1.66 1.66 1.66 1.66 1.66 1.66 1.66 1.66 1.66 1.66 1.66 1.66 1.66 1.66 1.66 1.66 1.66Discounting Factor 1.00 0.93 0.80 0.69 0.60 0.51 0.44 0.38 0.33 0.28 0.24 0.21 0.18 0.16 0.14 0.12 0.10 0.09 0.07 0.06
0.93 0.80 0.69 0.60 0.51 0.44 0.38 0.33 0.28 0.24 0.21 0.18 0.16 0.14 0.12 0.10 0.09 0.07 0.06
Levellised benefit 2.96 Rs/Unit
Annexure – 6A
Form 1.1 Form Template for (Solar Thermal Power Projects) Parameters Assumptions
S. No. Assumption Head Sub-Head Sub-Head (2) Unit Assumptions
1 Power Generation
Capacity
Installed Power Generation Capacity MW 1
Capacity Utilization Factor % 23.0%
Auxiliary Consumption Factor % 10.0%
Useful Life Years 25
2 Project Cost

8/6/2019 Tariff Order FY201011
http://slidepdf.com/reader/full/tariff-order-fy201011 119/121
2 Project Cost
Capital Cost/MW Power Plant Cost Rs Lacs/MW 1530
3 Sources of Fund
Tariff Period Years 25
Debt: Equity
Debt % 70%Equity % 30%
Total Debt Amount Rs Lacs 1071
Total Equity Amout Rs Lacs 459
Debt Component
Loan Amount Rs Lacs 1071
Moratorium Period years 0
Repayment Period(incld Moratorium) years 10
Interest Rate % 13.39%
Equity Component
Equity amount Rs Lacs 459.00Return on Equity for firs t 10 years % p.a 19.00%
RoE Period Year 10
Return on Equity 11th year onwards % p.a 24.00%
Weighted average of ROE 22.00%
Discount Rate 15.97%
4 Financial Assumptions
Economic Assumptions
Coal Price Escalation % p.a 0%
HSD Price Escalation % p.a 0%
Discount Rate % p.a 16%
Fiscal Assumptions
Income Tax % 33.99%
MAT Rate ( for f irs t 10 years) % 16.995%
80 IA benefits Yes/No Yes
Depreciation
Depreciation Rate for first 10 years % 7.00%
Depreciation Rate 11th year onwards % 1.33%
Years for 7% rate 10
5 Working CapitalFor Fixed Charges
O&M Charges Months 1
Maintenance Spare (% of O&M exepenses) 15%
Receivables for Debtors Months 2
Form 1.2 Form Template for (Solar Thermal) - Determination of Tariff ComponentDiscount Factor 1 0.862 0.744 0.641 0.553 0.477 0.411 0.354 0.306 0.264 0.227 0.196 0.169 0.146 0.126 0.108 0.093 0.081 0.069 0.060 0.052 0.045 0.038 0.033 0.029
Units Generation Unit Year---> 1 2 3 4 5 6 7 8 9 10 11 12 13 14 15 16 17 18 19 20 21 22 23 24 25Installed Capacity MW 1 1 1 1 1 1 1 1 1 1 1 1 1 1 1 1 1 1 1 1 1 1 1 1 1
Net Generation MU 1.81 1.81 1.81 1.81 1.81 1.81 1.81 1.81 1.81 1.81 1.81 1.81 1.81 1.81 1.81 1.81 1.81 1.81 1.81 1.81 1.81 1.81 1.81 1.81 1.81
Fixed Cost Unit Year---> 1 2 3 4 5 6 7 8 9 10 11 12 13 14 15 16 17 18 19 20 21 22 23 24 25O&M Expenses Rs Lakh 13.74 14.53 15.36 16.24 17.17 18.15 19.19 20.29 21.45 22.67 23.97 25.34 26.79 28.32 29.94 31.66 33.47 35.38 37.40 39.54 41.81 44.20 46.73 49.40 52.22
Depreciation Rs Lakh 1 07 .10 107 .1 0 10 7. 10 10 7. 10 10 7. 10 1 07 .1 0 10 7.1 0 1 07 .10 1 07 .10 1 07 .10 2 0. 40 2 0. 40 2 0. 40 20. 40 20 .4 0 20 .4 0 20 .40 20 .40 20 .40 2 0. 40 2 0. 40 2 0. 40 2 0. 40 20 .40 20 .40
Interest on term loan Rs Lakh 136.22 121.88 107.55 93.21 78.87 64.53 50.19 35.85 21.51 7.17 0.00 0.00 0.00 0.00 0.00 0.00 0.00 0.00 0.00 0.00 0.00 0.00 0.00 0.00 0.00
Interest on working Capital Rs Lakh 7.98 7.71 7.44 7.17 6.90 6.64 6.38 6.12 5.87 5.62 4.13 4.20 4.28 4.36 4.44 4.53 4.63 4.73 4.84 4.95 5.07 5.19 5.33 5.47 5.62
R et urn o n E qui ty Rs La kh 8 7. 21 8 7. 21 8 7. 21 87. 21 87 .2 1 87 .2 1 87 .21 87 .21 87 .21 8 7. 21 110 .16 11 0. 16 11 0. 16 11 0. 16 1 10. 16 1 10 .1 6 1 10 .1 6 1 10 .16 1 10 .16 110 .16 110 .16 11 0. 16 11 0. 16 11 0. 16 1 10. 16
Total Fixed Cost Rs Lakh 352.26 338.43 324.65 310.92 297.25 283.63 270.06 256.57 243.13 229.77 158.66 160.10 161.63 163.24 164.95 166.75 168.66 170.67 172.80 175.05 177.44 179.95 182.61 185.43 188.40

8/6/2019 Tariff Order FY201011
http://slidepdf.com/reader/full/tariff-order-fy201011 120/121
Page 120
Levellised COG
Per Unit Cost of Generatio Unit evellised 1 2 3 4 5 6 7 8 9 10 11 12 13 14 15 16 17 18 19 20 21 22 23 24 25O&M expn Rs/kWh 1.09 0.76 0.80 0.85 0.90 0.95 1.00 1.06 1.12 1.18 1.25 1.32 1.40 1.48 1.56 1.65 1.75 1.85 1.95 2.06 2.18 2.31 2.44 2.58 2.72 2.88
Depreciation Rs/kWh 4.91 5.91 5.91 5.91 5.91 5.91 5.91 5.91 5.91 5.91 5.91 1.13 1.13 1.13 1.13 1.13 1.13 1.13 1.13 1.13 1.13 1.13 1.13 1.13 1.13 1.13
I nt. on t er m l oa n R s/ kW h 3.87 7.51 6.72 5.93 5.14 4.35 3.56 2.77 1.98 1.19 0.40 0.00 0.00 0.00 0.00 0.00 0.00 0.00 0.00 0.00 0.00 0.00 0.00 0.00 0.00 0.00
Int. on working capital Rs/kWh 0.36 0.44 0.43 0.41 0.40 0.38 0.37 0.35 0.34 0.32 0.31 0.23 0.23 0.24 0.24 0.25 0.25 0.26 0.26 0.27 0.27 0.28 0.29 0.29 0.30 0.31
RoE Rs/kWh 5.07 4.81 4.81 4.81 4.81 4.81 4.81 4.81 4.81 4.81 4.81 6.08 6.08 6.08 6.08 6.08 6.08 6.08 6.08 6.08 6.08 6.08 6.08 6.08 6.08 6.08
Total COG Rs/kWh 15.31 19.43 18.66 17.90 17.15 16.39 15.64 14.89 14.15 13.41 12.67 8.75 8.83 8.91 9.00 9.10 9.20 9.30 9.41 9.53 9.65 9.79 9.92 10.07 10.23 10.39
Levellised
Levellised Tariff 15.31 Rs/Unit

8/6/2019 Tariff Order FY201011
http://slidepdf.com/reader/full/tariff-order-fy201011 121/121