targets earnings quality and bidders takeover
DESCRIPTION
Review of Accounting StudiesTRANSCRIPT

1 23
Review of Accounting Studies ISSN 1380-6653Volume 18Number 4 Rev Account Stud (2013) 18:1050-1087DOI 10.1007/s11142-013-9224-0
Target’s earnings quality and bidders’takeover decisions
Kartik Raman, Lakshmanan Shivakumar& Ane Tamayo

1 23
Your article is protected by copyright and all
rights are held exclusively by Springer Science
+Business Media New York. This e-offprint is
for personal use only and shall not be self-
archived in electronic repositories. If you wish
to self-archive your article, please use the
accepted manuscript version for posting on
your own website. You may further deposit
the accepted manuscript version in any
repository, provided it is only made publicly
available 12 months after official publication
or later and provided acknowledgement is
given to the original source of publication
and a link is inserted to the published article
on Springer's website. The link must be
accompanied by the following text: "The final
publication is available at link.springer.com”.

Target’s earnings quality and bidders’ takeoverdecisions
Kartik Raman • Lakshmanan Shivakumar •
Ane Tamayo
Published online: 22 May 2013
� Springer Science+Business Media New York 2013
Abstract This study examines how takeover decisions are influenced by the
quality of information in target firms’ earnings. We show that bidders prefer
negotiated takeovers in deals involving targets with poor earnings quality. More-
over, earnings quality and takeover premiums are negatively related in negotiated
takeovers, suggesting that bidders obtain valuable private information through
negotiations. We also find that bidders share information risk with target share-
holders by paying with more equity for targets with poor earnings quality. These
findings are driven primarily by the asymmetric information component of earnings
quality (as opposed to the symmetric component) and are observed mainly in inter-
industry takeovers, where asymmetric information concerns are greater, rather than
in intra-industry takeovers. We conclude that targets’ earnings quality affects bid-
ders’ takeover decisions, particularly in cases of large asymmetric information
between targets and bidders.
Keywords Takeovers � Earnings quality � Asymmetric uncertainty � Negotiation �Bid premium � Stock payment
JEL Classification G34 � M41
K. Raman
Bentley University, 175 Forest Street, Waltham, MA 02452, USA
e-mail: [email protected]
L. Shivakumar
London Business School, Regent’s Park, London NW1 4SA, UK
e-mail: [email protected]
A. Tamayo (&)
London School of Economics, Houghton Street, London WC2A 2AE, UK
e-mail: [email protected]
123
Rev Account Stud (2013) 18:1050–1087
DOI 10.1007/s11142-013-9224-0
Author's personal copy

1 Introduction
Acquisition decisions rank among the most critical investment decisions made by
firms. Before acquiring a company, bidders face important choices relating to the
type of bid, the offer premium, and the method of payment. Such choices are likely
to depend upon the quality of information available to bidders, as illustrated by the
prevalence of anecdotal evidence where takeover bids are conditioned upon
additional disclosures by the target.1 In contrast to the copious anecdotal evidence,
there is relatively little academic evidence on the role of targets’ information quality
in takeover decisions.2 In this study, we address this issue by examining how the
quality of targets’ earnings, an important source of information in takeovers, affects
bidders’ takeover decisions.
Although information quality is likely to impact corporate decisions in general,
takeovers provide an interesting context in which to study its effects on managerial
decision-making, since a subset of the conditioning information, namely financial
statements, is observable. Financial reports are by no means the only source of
information used in takeover decisions, but they are likely to be an important
source.3 The estimation of synergies and other benefits, for example, is often based
on the financial information available about the target (see, e.g., Koller et al. 2005,
pp. 436–443). The role of financial statements is likely to be even more important in
deals where the target is either unwilling or unable to provide reliable inside
information. Thus we focus on the quality of targets’ financial reporting to capture
the quality of information available in takeovers. More specifically, we examine
how targets’ earnings quality, as measured by the Dechow and Dichev (2002) and
McNichols (2002) methods,4 affects acquirers’ decisions along three key dimen-
sions: (i) takeover method, (ii) offer premium, and (iii) payment method.
To develop our hypotheses, we follow Rogo (2009) and decompose a bidder’s
uncertainty arising from a target’s earnings quality into two components:
(i) asymmetric uncertainty, which reflects the informational advantage of target
managers relative to other parties, including bidders, and (ii) symmetric uncertainty,
which reflects the uncertainty faced equally by target managers and other parties.
Asymmetric uncertainty, but not symmetric uncertainty, can be partly resolved
1 For example, on January 4, 2006, BASF, one of the largest chemicals groups in the world, launched a
hostile takeover bid for Engelhard Corp., a US specialty chemicals producer. Although the bid by BASF
represented a 23 % premium over Engelhard’s closing stock price, the CEO of BASF wrote in a letter to
the CEO of Engelhard that BASF would be prepared to raise its bid ‘‘by as much as $1 per share’’ if
Engelhard was ready to open its books (Jenkins et al. 2006). For other examples, see also the bid by
Murchison Metals Limited for Midwest Corporation Limited in 2007 and the bid by Electronic Arts Inc.
for Take-Two Interactive Software Inc. in 2008.2 Contemporaneous papers examine the role of targets’ earnings quality on bidders’ announcement
returns (McNichols and Stubben 2012) and on acquisition outcomes (Marquardt and Zur 2010).3 Bushman and Smith (2001, p. 309) suggest that ‘‘a potentially important channel through which
financial accounting information can enhance economic performance is by providing input to a variety of
corporate control mechanisms.’’4 Accrual-based metrics are widely used to measure financial reporting quality. See, for example,
Aboody et al. (2005), Bharath et al. (2008), Cornett et al. (2008), Doyle et al. (2007), Francis et al. (2004,
2005), Hutton et al. (2009), and Lee and Masulis (2009).
Target’s earnings quality and bidders’ takeover decisions 1051
123
Author's personal copy

through negotiations between the target and the bidder and is more likely to affect
the takeover decisions that we study.
We hypothesize that, all else being equal, bidders prefer negotiated acquisitions
when they face greater asymmetric uncertainty arising from a target’s poor-quality
reporting, as private negotiations reduce the information asymmetry between the
bidder and the target and lower the bidder’s information risks.5 Further, for such
targets, we predict that the additional information obtained through negotiations is
likely to lead to higher bid premiums, as negotiations unravel more private
information in targets with poor reporting quality and takeover bids are more likely
to occur when such information is positive. Lastly, we argue that bidders are more
likely to offer shares (as opposed to cash) when asymmetric uncertainty is high, as
the use of equity allows the acquirer to share the risk of overpayment with the
target’s shareholders or, in the case of underpayment, make the deal more
acceptable for the target shareholders.6 In contrast to the above predictions, we
predict either a weaker or a more ambiguous relation between bidders’ takeover
decisions and the symmetric uncertainty component of a target’s earnings quality.
We test our predictions using a large sample of US takeovers of publicly listed
firms over the 1977–2005 period. To isolate the roles of asymmetric and symmetric
uncertainty components of earnings quality, we follow two alternative approaches.
Under the first approach, we note that asymmetric uncertainty is more likely to be
prevalent in inter-industry takeovers than in intra-industry takeovers and, therefore,
assess the relative importance of asymmetric and symmetric components of
uncertainty for bidders’ decisions by comparing the empirical results across these
takeovers. Under the second approach, we regress target earnings quality on either
bid-ask spread (a proxy for asymmetric uncertainty) or analyst forecast dispersion (a
proxy for symmetric uncertainty) and rely on the fitted values from the regressions
to capture the components of earnings quality that give rise to asymmetric and
symmetric uncertainty respectively.
Our empirical analyses reveal results consistent with the hypothesis that target
firms’ earnings quality affects bidders’ takeover decisions. First, the likelihood of a
non-negotiated bid is increasing in the quality of the target’s earnings. Second, in
negotiated transactions, we find a significant negative relation between targets’
earnings quality and takeover premium, which is consistent with the notion that
negotiations provide bidders with value-enhancing information. Finally, among
public bidders, we find that the percentage of proceeds paid with equity is
negatively related to the quality of the target’s earnings. This effect is primarily
observed in negotiated takeovers of relatively large targets (defined as targets whose
market value is at least 15 % of that of the bidder), where the use of stock as
payment method is a more meaningful tool to reduce over- or underpayment risks.
5 We denominate as non-negotiated takeovers those takeovers in which the bidder is unlikely to have
access to the target’s books of accounts and other inside information (e.g., bids rejected by target
management and unsolicited bids). All other takeovers are classified as negotiated takeovers.6 Moeller et al. (2007), and Officer et al. (2009) examine the effect of uncertainty on acquirers’ stock
returns. The stock price reactions to acquisition announcements capture investors’ perceived valuation
impacts of the totality of bidders’ actions, while our study focuses on one of the determinants of those
actions, namely financial reporting quality.
1052 K. Raman et al.
123
Author's personal copy

Our results occur in a subsample of inter-industry acquisitions, where both
asymmetric uncertainty and symmetric uncertainty are likely to be present, but not
in a subsample of intra-industry acquisitions, where symmetric uncertainty is the
prime source of uncertainty. Further, when we parse our earnings-quality measure
into symmetric and asymmetric components, we find that the results hold mainly for
the asymmetric component. These findings are consistent with our prediction that
asymmetric uncertainty arising from poor financial reporting quality is a main factor
influencing bidders’ decisions.
Our study makes several contributions to the literature. First, it adds to our
understanding of how bidding firms adapt their takeover strategies to take into
account asymmetric uncertainty and symmetric uncertainty arising from targets’
financial reports. Second, although practitioners point to due-diligence activities as
being one of the most important aspects of private takeover negotiations and spend
significant amount of resources examining targets’ books of accounts, scant
academic evidence exists on how bidders’ takeover strategies are influenced by such
activities. Our results indicate that more information is garnered from private
negotiations with poor earnings quality targets, pointing to a greater importance of
due-diligence in such firms. Lastly, by examining how target firms’ earnings quality
influences investment decisions by bidders, our study adds to recent research that
examines how financial reporting quality affects the cost and terms of corporate
financing (e.g., Francis et al. 2005; Aboody et al. 2005; Bharath et al. 2008; Lee and
Masulis 2009).
The rest of the paper is organized as follows. In the following section, we
develop our hypotheses. Section 3 describes the research methods, including the
measures of financial reporting quality and bid premiums used in the analyses.
Section 4 describes the sample and presents descriptive statistics. The empirical
results and robustness tests are presented in Sects. 5 and 6 respectively, and Sect. 7
concludes the paper.
2 Hypotheses development
2.1 Asymmetric uncertainty, symmetric uncertainty, and financial reporting
quality
Following Rogo (2009), we decompose the uncertainty faced by a bidder on account
of a target’s poor financial reporting quality into two components: asymmetric
uncertainty and symmetric uncertainty. Asymmetric uncertainty arises from the
informational advantage that the target’s management has relative to the bidder’s,
which can be (partly) resolved through private negotiations with the target.7 This
type of uncertainty results from (i) limitations of the financial reporting system in
capturing the underlying business fundamentals, (ii) managers’ financial reporting
7 Prior studies evaluating the effect of financial reporting quality on information asymmetry between
insiders and outsiders include Diamond (1985), Brown and Hillegeist (2007), and Bhattacharya et al.
(2007).
Target’s earnings quality and bidders’ takeover decisions 1053
123
Author's personal copy
choices, and/or (iii) the opacity caused by off-balance sheet transactions and real
earnings management (e.g., R&D manipulation or selecting a specific transaction
structure to achieve a reporting objective).8 While some elements of asymmetric
uncertainty are within target managers’ control, other aspects, such as the
asymmetry caused by limitations in accounting standards, are clearly beyond their
control.
In contrast, symmetric uncertainty is intrinsic to the business and is unlikely to be
resolved through negotiations with the target. This component includes, for
instance, uncertainty surrounding the macroeconomy, government regulation, and
the success of research and development. Generally speaking, this component of
uncertainty is not within the choice-set of the target manager.
Given these differences, we expect bidders’ takeover decisions to be affected
differently by the asymmetric and symmetric components of uncertainty resulting
from a target’s financial reporting quality. Next, we discuss how each of these
components affects three major takeover decisions: (i) takeover method, (ii) bid
premium, and (iii) method of payment.
2.2 Asymmetric uncertainty and takeover decisions
2.2.1 Takeover method: negotiated versus non-negotiated takeovers
The decision to make a hostile or friendly takeover is a strategic decision on the part
of the companies involved (Schwert 2000). A bidder can take control of a target firm
either by initially negotiating with the target’s board and management or by making
a hostile tender offer directly to shareholders. We define the former strategy as a
negotiated takeover and the latter as a non-negotiated takeover.9
As part of the negotiations, the target’s management is likely to allow bidders
access to its underlying books of accounts (including management accounts) and
other inside information, thereby revealing its private information and reducing
asymmetric uncertainty. We propose that bidders are likely to prefer negotiated
takeovers over non-negotiated ones when the asymmetric component of financial
reporting quality is high, as in these cases the benefits from negotiating with the
target’s management are likely to outweigh the potential costs of negotiation.10
Previous studies have shown that poor financial reporting quality increases the
likelihood of misvaluation (e.g., Aboody et al. 2005). In our setting, this implies a
higher risk of overpayment, given that target managers are more likely to reject
offers that undervalue their firms. The difficulty in valuing targets with poor
financial reporting quality also increases the range of bids made by competing
8 Managers could obscure their financial reporting to veil their perk consumption and mislead investors,
or to avoid disclosing proprietary information. Thus, the decision to issue opaque financial statements is
not necessarily inconsistent with shareholders’ value maximization.9 We do not require negotiated takeovers to involve only one bidder. In this sense, our definition of
negotiated takeovers is different from that employed by Boone and Mulherin (2007), who classify firms
based on whether they were auctioned among multiple bidders or negotiated with a single bidder.10 A potential cost of a negotiated takeover is the lower expected offer price compared with a public
auction (see Rogo 2009).
1054 K. Raman et al.
123
Author's personal copy

bidders, leading to larger losses for the winning bidder (see Roll 1986; Varaiya
1988; Bazerman and Samuelson 1983).11 To mitigate losses from overpayment and
increase their chances of success, bidders are more likely to negotiate takeovers
involving targets with poor financial reporting quality, with the view of garnering
information that decreases asymmetric uncertainty.12
Another reason for preferring negotiated takeovers relates to the potential release
of private information to unwanted bidders, competitors and capital market
participants that may occur in public tender offers (Berkovitch and Khanna 1991).
This risk is more pronounced when the target has poorer financial reporting quality
(given the greater information asymmetry in the capital market), making a
negotiated takeover more attractive in such cases. Since this information spillover
risk exists irrespective of whether the bid is initiated by the target or by the bidder,
both parties would prefer a negotiated takeover when opaque financial reports cause
greater asymmetric uncertainty (see also Rogo 2009). Conversely, when the target’s
financial reporting quality is good, there are fewer benefits from negotiating,
increasing the likelihood of a direct tender offer to shareholders.
All these arguments lead to our first hypothesis:
H1 The likelihood of a non-negotiated takeover decreases with the asymmetric
uncertainty component of a target’s financial reporting quality.
2.2.2 Takeover premium
As discussed above, bidders can mitigate the asymmetric uncertainty component of
poor financial reporting quality through negotiations. In the case of announced
takeovers (i.e., takeover bids that become known to the public), the information
revealed to the bidder in such negotiations is likely to be value-enhancing. This is
because negotiated bids are less likely to occur when the target management’s
private information is negative; in such cases, either the target management would
be less willing to negotiate and share information, or bidders would walk away from
the negotiations without making a formal bid.13 The information gleaned from
private negotiations is likely to be even more value-enhancing when asymmetric
information is high, given the greater potential for release of private information in
such cases. Thus we propose that this ‘‘favorable selection’’ argument, combined
11 Surveys by Thaler (1988), Barberis and Thaler (2006), and Baker et al. (2006) conclude that the
winner’s curse holds in corporate takeover auctions. Boone and Mulherin (2008) fail to find evidence for
the winner’s curse in the private auction process that precedes the announcement of some takeover deals
that are initiated by the target.12 Milgrom and Weber (1982) and Eso and Szentes (2007), among others, discuss targets’ incentives to
disclose information in order to refine bidders’ valuations.13 Holmes and Schmitz (1995) make a similar point in the context of small businesses and note that
businesses that are sold are likely to be of a higher quality than those that are not sold.
Target’s earnings quality and bidders’ takeover decisions 1055
123
Author's personal copy

with competition in the market for corporate control, results in higher premiums
being offered in negotiated takeovers of targets with greater asymmetric uncertainty
in their financial reports.14
This prediction raises a particularly poignant possibility: ceteris paribus,
takeovers of targets with more asymmetric uncertainty in their financial reports
obtain larger premiums due to greater value creation, which raises the point: ‘‘What
is the source of value creation?’’
One source of value creation is the better use of information-based assets (e.g.,
R&D, brands), which tend to make a target’s financial reports less transparent and
more prone to asymmetric uncertainty. A merger could allow the bidder and target
to extract full synergistic value from such assets, which may not be possible under
arms’ length deals, owing to difficulties in transmitting tacit information (see also
Conn et al. 2005).
Another source of value creation is through the elimination of valuation discounts
suffered by targets with poor financial reporting quality. Prior studies suggest that
these valuation discounts are a compensation to investors for the greater
information-related risks and agency problems borne by such firms (e.g., Easley
et al. 2002; Easley and O’Hara 2004; Lambert et al. 2007; Francis et al. 2004, 2005;
Damodaran 2006; Urcan et al. 2008). By reducing the reliance on financial
statements, a bidder, particularly one facing relatively low agency problems, could
mitigate the causes underlying the valuation discounts of targets with higher
asymmetric uncertainty in their financial reports.15
In contrast to the above discussion on negotiated takeovers, we expect
asymmetric uncertainty arising from a target’s financial reports to be unrelated to
the bid premium in non-negotiated takeovers, as the uncertainty and information
risk remain unresolved. The bidder continues to face the same risks as other capital
market participants, warranting neither an additional valuation discount nor a
premium (since the target’s stock price already reflects the potential risks associated
with the target’s reporting quality).
Thus our second hypothesis is:
H2 The bid premium in negotiated (non-negotiated) takeovers is positively related
(unrelated) to the asymmetric uncertainty component of a target’s financial
reporting quality.
14 It is worth noting that, in line with the corporate finance literature, both our hypotheses and empirical
tests are conditional on an event (namely, an acquisition announcement) occurring. Prabhala (1997)
shows that controlling for potential selection bias in conditional event studies offers little value relative to
traditional event study methodologies, particularly when firms choosing not to participate in the event are
unobservable.15 Even though, after an acquisition, a bidder could take actions that have a negative impact on the
target’s value, competition in the market for corporate control would force the bid premium to be based
on the gains achievable from eliminating a target’s valuation discount.
1056 K. Raman et al.
123
Author's personal copy

2.2.3 Method of payment
Since misvaluation risk is larger in takeovers involving greater asymmetric
uncertainty in financial reports, we would expect both bidders and targets to take
actions that minimize losses from misvaluations.
One way to mitigate losses from misvaluation is to use stock as a method of
payment, as a stock offer is essentially a contingent pricing contract that allows
targets’ shareholders to share in both gains and losses of the combined entity.
Hansen (1987), for example, argues that acquirers could protect themselves from
overpaying for a target by using stock as method of payment, as any ex post losses
occurring from overpayment cause the combined entity’s stock price to go down,
resulting in the losses being shared between the target and bidder shareholders.16 A
stock offer could also entice a target’s manager to accept a takeover offer even if the
bid price undervalued the target on the acquisition date, since the stock offer partly
compensates target shareholders for any initial underpayment by allowing them to
share in the stock-price gains of the combined entity (Fishman 1989).
The use of stock as a method of payment will be particularly attractive when a
bidder makes a non-negotiated takeover attempt for a target with poor financial
reporting quality, as asymmetric uncertainty concerns are greatest in this case.
However, it may also be attractive in negotiated takeovers of targets with poor
financial reporting quality, as negotiations may not fully resolve the information
asymmetry between target and bidder, owing to difficulties in credibly communi-
cating soft information and hold-up problems in negotiations.
These arguments lead to our third hypothesis:
H3 The use of stock as a method of payment is positively associated with the
asymmetric uncertainty component of a target’s financial reporting quality. This
relation is expected to be stronger for non-negotiated takeovers than for negotiated
takeovers.
2.3 Symmetric uncertainty and takeover decisions
In contrast to the effect of asymmetric uncertainty on bidders’ decisions, the
influence of symmetric uncertainty is either unclear or, at best, weaker.
Since symmetric uncertainty cannot be resolved through negotiations with a
target’s management, bidders would have little preference for negotiated takeovers
when faced with high symmetric uncertainty. However, bidders may still engage
into negotiations in such cases, in order to avoid information spillovers. Hence, we
expect the relation between takeover method and symmetric uncertainty arising
from a target’s financial reports to be negative but weaker than in the case of
asymmetric uncertainty.
16 The ability to share losses from overpayment with target shareholders implicitly assumes that target
shareholders, especially those with private information about potential overpayment, do not sell their
share-holdings in the merged firm soon after the merger. This assumption is consistent with SEC Rule
145, which lays restrictions on certain key target shareholders from reselling their shares immediately
after a merger. In practice, additional restrictions are often placed through contractual arrangements
between the merger parties.
Target’s earnings quality and bidders’ takeover decisions 1057
123
Author's personal copy

With regard to bid premium, prior studies provide mixed predictions for the
effect of symmetric uncertainty. On the one hand, bidders are likely to offer lower
premiums for targets with larger symmetric uncertainty, in order to lower potential
losses from the winner’s curse (Milgrom and Weber 1982). Moreover, Epstein and
Schneider (2008) note that ambiguity-averse investors will discount the price of
low-information-quality stocks when the fundamentals of their assets are volatile,
which also predicts a negative relation between symmetric uncertainty and bid
premium. On the other hand, Pastor and Veronesi (2003, 2006) analytically show
that, in a world with low risk-aversion, firm value increases with uncertainty about a
firm’s future profitability.17 In our context, this model implies higher bid premiums
for targets with larger symmetric uncertainty, particularly with regard to uncertainty
about future synergies. In sum, theory predicts both a positive and a negative
relation between symmetric uncertainty and bid premium, depending on the risk-
aversion profile of bidders.
Finally, with regard to the method of payment, Berkovitch and Narayanan
(1990), Fishman (1989), and Eckbo et al. (1990) note that, in markets with
symmetrically informed agents, the medium of exchange in a takeover is
economically irrelevant, because the level of the merger-induced gains, as well as
the division of these gains across bidder and target, does not depend on the method
of payment.18 Thus, when financial reporting quality reflects symmetric uncertainty,
we do not expect any relation between this component of reporting quality and the
method of payment.
Finally, the effect of symmetric uncertainty on bid premium and method of
payment is unlikely to vary across negotiated and non-negotiated takeovers, given
that negotiations do not mitigate this type of uncertainty.
Based on these arguments, we formally state the effect of symmetric uncertainty
on bidders’ takeover decisions as follows:
H1A The likelihood of a non-negotiated takeover decreases with/is independent
of the symmetric uncertainty component of a target’s financial reporting quality.
H2A The bid premiums in both negotiated and non-negotiated takeovers are
ambiguously related to the symmetric uncertainty component of a target’s financial
reporting quality.
H3A The use of stock as a method of payment in both negotiated and non-
negotiated takeovers is unrelated to the symmetric uncertainty component of a
target’s financial reporting quality.
17 The intuition in the models of Pastor and Veronesi (2003, 2006) is that greater uncertainty about
average profitability increases the likelihood that the future growth rate of book equity will be persistently
high or low. Because of the convex relation between future firm value and compounded growth rates, the
positive effect of a high growth rate on the expected future firm value will be disproportionately larger
than the corresponding effect of a low growth rate. As a consequence, firm value is higher as the
uncertainty about average profitability increases.18 Under symmetric information, the target will accept any offer that equals or exceeds its expected
payoff from rejection. Therefore the equilibrium offer in this scenario is simply equal to the present value
of the target’s expected payoff from rejection.
1058 K. Raman et al.
123
Author's personal copy
3 Research method
3.1 Earnings quality measure
In line with recent studies (e.g., Aboody et al. 2005; Francis et al. 2004, 2005; Lee
and Masulis 2009), we measure earnings quality as the mapping of accruals into
cash flows: the weaker the mapping, the poorer the quality of information in
earnings. Francis et al. (2008) show this measure to be a good proxy for overall
reporting quality. In particular, for each year t and each of Fama and French’s
(1997) 48 industry groups, we estimate the following equation:19
ACCi;t ¼ a0 þ a1CFOi;t þ a2CFOi;t�1 þ a3CFOi;tþ1 þ a4DREVi;t
þ a5GPPEi;t þ ei;t;ð1Þ
where ACCi,t is firm i’s accruals (net income - cash flow from operations) in year t,
and CFOi,t is firm i’s cash from operations in year t.20 Following McNichols (2002),
we include DREVi,t the change in total revenue (Compustat #12), and GPPEi,t, the
gross property, plant, and equipment (Compustat #7), as control variables. All the
variables are standardized by average total assets (Compustat #6), and winsorized,
at the 1st and 99th percentiles each year.
The annual cross-sectional estimations of Eq. (1) yield firm- and year-specific
residuals. Earnings quality (EQ) for firm i in year t is then computed as the standard
deviation of firm i’s residuals over years t - 5 through t - 1, where a higher value
indicates lower earnings quality. In our empirical tests, year t corresponds to the
fiscal year ending at least 3 months prior to the acquisition announcement. We lag
the period over which the standard deviation of residuals is computed by 1 year,
relative to year t, to account for the fact that Eq. (1) includes the year-ahead cash
flows.21
This approach to measuring earnings quality is likely to bias our sample towards
larger and more successful targets. To minimize this bias, we require firms to have a
minimum of only three observations to compute the standard deviation of the
residuals, although our results are not sensitive to this requirement.
Finally, to ease the interpretation of our results, we take the negative value of the
standard deviation of the residuals as our estimate of earnings quality, so that a
higher value for this estimate corresponds to higher earnings quality.
19 We require at least 20 firms in year t to estimate the industry-level regressions.20 CFO is taken directly from the cash flow statement (Compustat #308) when available. Otherwise it is
computed from balance-sheet changes as: Net income (Compustat #18) - {Change in current assets
(Compustat #4) - Change in cash and short-term investment (Compustat #1) - [Change in current
liabilities (Compustat #5) - Change in debt in current liabilities (Compustat #34) - Change in income
taxes payable (Compustat #71)] - Depreciation and amortization (Compustat #14)}. To be consistent
with the definition of cash flows, accruals are based on net income from cash flow statements (Compustat
#123) when cash flows are obtained from the cash flow statement. Otherwise, net income is obtained from
the income statement (Compustat #18).21 Lagging the earnings quality proxy by a year relative to the acquisition announcement also allays
concerns that our measures of reporting quality may be influenced by the target’s management
manipulating earnings in the year prior to a takeover.
Target’s earnings quality and bidders’ takeover decisions 1059
123
Author's personal copy
3.2 Measuring the symmetric and asymmetric uncertainty components
of financial reporting quality
Conceptually, the key difference between the asymmetric and symmetric uncer-
tainty components of financial reporting is whether a target manager has private
information about the underlying drivers of financial reporting quality. Capturing
this difference is, of course, challenging. In the next two subsections, we describe
the two approaches followed in this paper.
3.2.1 Inter-industry versus intra-industry takeovers
In our first approach, we split our sample of takeovers into two groups, based on
whether the acquirer and target are in the same industry (intra-industry takeover) or
in different industries (inter-industry takeover).
Firms in the same industry frequently share information through industry-
association conferences, senior-management forums and networking events, CEO-
level meetings, etc., and hence are likely to be well informed of the happenings in
each other’s firms. Moreover, through their own economic activities, confidential
industry reports, and close tracking of competition, firms often have a clearer idea of
the economic performance, key risks, and economic drivers of their industry peers.
In contrast, firms tend to have less access to detailed information about industries
other than their own.
Based on these observations, we propose that bidders engaged in intra-industry
takeovers have a better understanding of the sources of uncertainty underlying a
target’s financial reporting quality and, hence, are likely to face less asymmetric
uncertainty than bidders engaged in inter-industry takeovers. Symmetric uncer-
tainty, however, is likely to be present in both intra- and inter-industry takeovers,
since, by definition, symmetric uncertainty is largely unaffected through sharing of
information across firms.
In sum, whereas inter-industry takeovers are characterized by both asymmetric
and symmetric uncertainties, intra-industry takeovers are characterized primarily by
symmetric uncertainty. Thus, if the bidders’ takeover decisions that we consider are
driven primarily by the asymmetric uncertainty component of financial reporting
quality, we should observe supporting results mainly in the inter-industry
subsample. On the other hand, if the two components of financial reporting quality
are equally important, then we should observe similar results across the inter-
industry and intra-industry sub-samples.
3.2.2 Predicted components of earnings quality
The use of inter-industry and intra-industry analyses to capture asymmetric and
symmetric uncertainties admittedly has limitations. Hence we alternatively use a
regression-based approach to identify the asymmetric and symmetric components.
In particular, we regress our earnings quality proxy (EQ) on proxies for either
(i) information asymmetry or (ii) symmetric uncertainty. Then we use the predicted
1060 K. Raman et al.
123
Author's personal copy

values from each of these regressions to evaluate the effect of each EQ component
on bidders’ takeover decisions.
In our first regression model, our proxy for information asymmetry is the bid–ask
spread, which has been shown to capture information asymmetry between informed
and uninformed traders in capital markets (Glosten and Milgrom 1985; Venkatesh
and Chiang 1986). Although our study focuses on information asymmetry between
bidder and target management, the bid-ask spread is likely to be related to the
informational advantages of the target management, insofar as these informational
advantages lead capital market participants to view target management as potential
informed traders. Thus the fitted value of this regression is our proxy for the
asymmetric uncertainty component of EQ.
In our second regression model, we use analysts’ forecast dispersion to capture
symmetric uncertainty, as prior studies have shown that analysts’ forecast dispersion
is positively correlated with general measures of uncertainty (e.g., Lang and
Lundholm 1996). In this model, the fitted value is our proxy for the symmetric
uncertainty component of EQ.22
3.3 Bid premium measure
Previous studies have measured the takeover premium using either the bid values
provided by the Securities Data Corporation database (SDC) or the targets’ stock
returns. We employ both of these measures in our analyses, after adjusting them for
market returns, given that a target’s earnings quality has no influence on the
premium attributable to market-wide shocks.
Our first measure of bid premium, SDC premium, is the cumulative abnormal
return over event day -63 to event day 0, where event day 0 is the announcement
date.23 This measure captures both the premium offered at the takeover announce-
ment and the additional cost faced by the bidder on account of a pre-bid run-up that
occurs because of either insider trading or leakage of the bid news (see Meulbroek
1992).
Officer (2003) notes that the data on bid values provided in SDC critically
depend on the method and assumptions used to estimate bid values in takeovers
involving non-cash offers. Hence, following Schwert (1996), we use a second
measure of premium, Schwert premium, which is based on the target’s cumulative
abnormal return around the acquisition announcement (-63 to ?126 days event
window). The inclusion of returns in the post-announcement period allows for
changes in the price offered to the target shareholders.
22 Since bid-ask spreads and analyst forecast dispersion are noisy proxies, they will be insufficient to
comprehensively capture aspects of information asymmetry between bidders and targets or of symmetric
uncertainty. This makes it difficult to interpret residual components cleanly from regressions of EQ on
these proxies as reflecting either asymmetric or symmetric uncertainty. Hence we do not consider the
residual components in our subsequent analyses.23 The returns for event day 0 are computed using the SDC reported offer price and the closing stock
price on day -1, while the abnormal returns are computed from a market model whose parameters are
estimated over event days -316 to -64 (See the appendix for further details).
Target’s earnings quality and bidders’ takeover decisions 1061
123
Author's personal copy
Some firms in our sample have large, negative premium measures. As Officer
(2003) describes, the interpretation of negative premiums is problematic. Hence we
follow his approach and delete observations with premiums in excess of 200 % or less
than 0 %. In untabulated analyses, we find that our results are robust to allowing for
negative premiums as well as to including all observations with positive premiums.
4 Sample and descriptive statistics
We obtain our sample of takeover bids from the SDC database. We restrict our sample
to US publicly listed target companies and transactions where the bidder seeks to own
more than 50 % of the target after the transaction is completed (as in, for example,
Moeller et al. 2007; Officer et al. 2009). Our final sample consists of 4,716 takeover
bids, of which about 84 % involve inter-industry takeovers (see Panel A of Table 1).
The takeovers in our sample are spread across a variety of industries, with the
business equipment industry accounting for the highest frequency of takeovers
(17.6 % of the sample) (Panel B of Table 1). Consistent with the overall pattern of
takeover activity reported in the literature (see, e.g., Holmstrom and Kaplan 2001),
many takeover events occurred in the mid-1980s and the mid-1990s, although none of
the years by itself accounts for more than 7 % of the full sample (Panel C of Table 1).
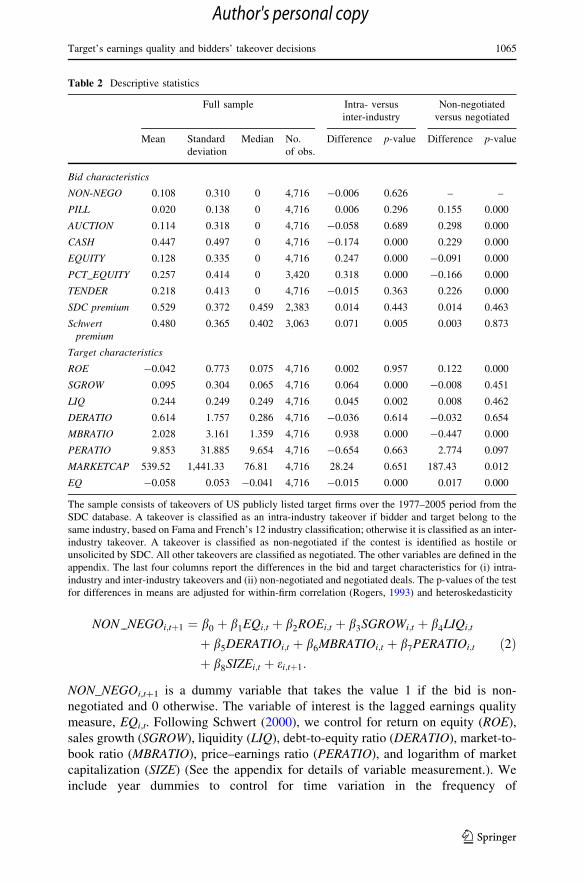
Table 2 presents descriptive statistics on the variables used in the study, together
with differences in the means across two groups obtained by sorting the sample
either by industry similarity (inter-industry versus intra-industry) or by takeover
method (negotiated versus non-negotiated). A takeover is classified as an intra-
industry takeover if bidder and target belong to the same industry, based on Fama–
French 12 industry classification;24 otherwise it is classified as inter-industry
takeover. We refer to takeover bids as non-negotiated if SDC classifies the bid as
either hostile or unsolicited.25 Accordingly, negotiated takeovers are those where
the target is likely to allow access to its underlying books of accounts, irrespective
of whether the takeover is target-initiated or involves multiple bidders.
The deal characteristics of our sample firms are generally consistent with those
reported in prior studies (e.g., Officer 2003; Schwert 2000). Takeover bids are
predominantly negotiated, with only 10.8 % of the offers being classified as non-
negotiated. Cash is used as the mode of payment in 44.7 % of the takeover bids, and
12.8 % of the sample involves equity as the sole method of payment. Multiple
bidders (‘‘auctions’’) are involved in 11.4 % of the takeovers. Finally, the average
SDC premium for our sample is 52.9 %, and the average Schwert premium is
48.0 %. The average bid premiums are significantly greater for intra-industry
takeovers than for inter-industry takeovers; however, the differences across
negotiated and non-negotiated bids are not significant.
24 Fama–French 12-industry classification is derived from reclassifying four-digit SIC codes and is
available at Kenneth French’s website: http://mba.tuck.dartmouth.edu/pages/faculty/ken.french/Data_Lib
rary/det_12_ind_port.html.25 According to SDC, a transaction is defined as hostile if the target board officially rejects the offer but
the acquirer persists with the takeover. Similarly, a transaction is defined as unsolicited if the offer is a
surprise to the target’s board, and it has not yet given a recommendation.
1062 K. Raman et al.
123
Author's personal copy

Focusing on the characteristics of the target firm, the average (median) market
capitalization is $540 ($77) million. The average target firm has a negative return on
equity, sales growth of 9.5 % per year, and a leverage ratio of 61.4 %. The average
value of EQ for the sample firms is -0.058, which is similar to the average for
Compustat firms as a whole. We observe significant differences across subsamples.
For instance, targets involved in inter-industry takeovers have, on average, lower
sales growth and lower market-to-book ratios but higher EQ than those involved in
intra-industry takeovers. Targets involved in non-negotiated bids also have higher
Table 1 Sample compositionNumber of
observations
Panel A: Sample construction
Total number of firm-years from SDC 21,453
Less: firm-years with missing
target earnings-quality data
13,798
Less: firm-years with (other) missing
target Compustat data
600
Total number of firm-years 7,055
Less: bidders seeking to achieve
less than 50 % stake
2,339
Total number of firm-years for
common sample
4,716
Of which
Nature of acquisition
Intra-industry 769
Inter-industry 3,947
Number of
observations
% of
sample
Panel B: Takeover bids by industry
Consumer nondurables 284 6.0
Consumer durables 135 2.9
Manufacturing 526 11.2
Oil, gas, and coal 238 5.0
Chemicals and allied products 102 2.2
Business equipment 828 17.6
Telephone and television
transmission
119 2.5
Utilities 113 2.4
Wholesale, retail, and some services 635 13.5
Healthcare, medical equipment, and
drugs
405 8.6
Finance 77 1.6
Others 1,254 26.5
Total 4,716 100.0
Target’s earnings quality and bidders’ takeover decisions 1063
123
Author's personal copy

EQ than those involved in negotiated bids, which is consistent with our prediction
that bidders are more likely to seek information through negotiations with the target
management when the quality of target firm earnings is worse. We explore this
prediction in detail next.
5 Empirical results
5.1 Impact of targets’ earnings quality on the likelihood of a non-negotiated deal
We examine the relation between earnings quality and the likelihood of non-
negotiated bids by estimating the following Probit regression:
Table 1 continued
The data consist of takeover bids
involving US publicly listed
targets from the SDC database.
This is combined with
Compustat and CRSP data to
obtain the final sample. The
initial takeover sample consists
of 21,453 firm-year observations
over the 1977–2005 period.
After deleting target
observations without Compustat
or earnings-quality data, the
sample consists of 4,716
observations. Panel A of this
table reconciles the initial and
final samples. In Panel B the
observations are grouped into
industries based on Fama–
French 12-industry classification
Number of
observations
% of sample
Panel C: Takeover bids by year
1977–1980 26 0.5
1981 92 2.0
1982 92 2.0
1983 125 2.6
1984 216 4.6
1985 163 3.5
1986 229 4.9
1987 212 4.5
1988 283 6.0
1989 290 6.1
1990 159 3.4
1991 146 3.1
1992 90 1.9
1993 127 2.7
1994 181 3.8
1995 206 4.4
1996 202 4.3
1997 249 5.3
1998 286 6.1
1999 299 6.3
2000 257 5.4
2001 204 4.3
2002 121 2.6
2003 158 3.3
2004 134 2.8
2005 169 3.6
Total 4,716 100.0
1064 K. Raman et al.
123
Author's personal copy
NON NEGOi;tþ1 ¼ b0 þ b1EQi;t þ b2ROEi;t þ b3SGROWi;t þ b4LIQi;t
þ b5DERATIOi;t þ b6MBRATIOi;t þ b7PERATIOi;t
þ b8SIZEi;t þ ei;tþ1:
ð2Þ
NON_NEGOi,t?1 is a dummy variable that takes the value 1 if the bid is non-
negotiated and 0 otherwise. The variable of interest is the lagged earnings quality
measure, EQi,t. Following Schwert (2000), we control for return on equity (ROE),
sales growth (SGROW), liquidity (LIQ), debt-to-equity ratio (DERATIO), market-to-
book ratio (MBRATIO), price–earnings ratio (PERATIO), and logarithm of market
capitalization (SIZE) (See the appendix for details of variable measurement.). We
include year dummies to control for time variation in the frequency of
Table 2 Descriptive statistics
Full sample Intra- versus
inter-industry
Non-negotiated
versus negotiated
Mean Standard
deviation
Median No.
of obs.
Difference p-value Difference p-value
Bid characteristics
NON-NEGO 0.108 0.310 0 4,716 -0.006 0.626 – –
PILL 0.020 0.138 0 4,716 0.006 0.296 0.155 0.000
AUCTION 0.114 0.318 0 4,716 -0.058 0.689 0.298 0.000
CASH 0.447 0.497 0 4,716 -0.174 0.000 0.229 0.000
EQUITY 0.128 0.335 0 4,716 0.247 0.000 -0.091 0.000
PCT_EQUITY 0.257 0.414 0 3,420 0.318 0.000 -0.166 0.000
TENDER 0.218 0.413 0 4,716 -0.015 0.363 0.226 0.000
SDC premium 0.529 0.372 0.459 2,383 0.014 0.443 0.014 0.463
Schwert
premium
0.480 0.365 0.402 3,063 0.071 0.005 0.003 0.873
Target characteristics
ROE -0.042 0.773 0.075 4,716 0.002 0.957 0.122 0.000
SGROW 0.095 0.304 0.065 4,716 0.064 0.000 -0.008 0.451
LIQ 0.244 0.249 0.249 4,716 0.045 0.002 0.008 0.462
DERATIO 0.614 1.757 0.286 4,716 -0.036 0.614 -0.032 0.654
MBRATIO 2.028 3.161 1.359 4,716 0.938 0.000 -0.447 0.000
PERATIO 9.853 31.885 9.654 4,716 -0.654 0.663 2.774 0.097
MARKETCAP 539.52 1,441.33 76.81 4,716 28.24 0.651 187.43 0.012
EQ -0.058 0.053 -0.041 4,716 -0.015 0.000 0.017 0.000
The sample consists of takeovers of US publicly listed target firms over the 1977–2005 period from the
SDC database. A takeover is classified as an intra-industry takeover if bidder and target belong to the
same industry, based on Fama and French’s 12 industry classification; otherwise it is classified as an inter-
industry takeover. A takeover is classified as non-negotiated if the contest is identified as hostile or
unsolicited by SDC. All other takeovers are classified as negotiated. The other variables are defined in the
appendix. The last four columns report the differences in the bid and target characteristics for (i) intra-
industry and inter-industry takeovers and (ii) non-negotiated and negotiated deals. The p-values of the test
for differences in means are adjusted for within-firm correlation (Rogers, 1993) and heteroskedasticity
Target’s earnings quality and bidders’ takeover decisions 1065
123
Author's personal copy

Table 3 Earnings quality and probability of a non-negotiated takeover
Coeff.
(stand.
error)
Marginal effect
[change in prob (%)
10th–90th percentile]
Coeff.
(stand.
error)
Marginal effect
[change in prob (%)
10th–90th percentile]
Panel A: All targets
Constant -0.665*** -1.145***
(0.245) (0.257)
EQ 3.820*** 0.655 2.536*** 0.420
(0.798) [6.81] (0.783) [4.43]
ROE 0.080*** 0.013
(0.031) [0.96]
SGROW -0.074 -0.012
(0.078) [-0.70]
LIQ 0.246** 0.041
(0.107) [2.52]
DERATIO 0.031* 0.005
(0.017) [0.83]
MBRATIO -0.047*** -0.008
(0.013) [-2.83]
PERATIO 0.001 0.000
(0.001) [0.44]
SIZE 0.092*** 0.015
(0.014) [7.89]
Pseudo R squared 0.0471 0.0630
No. of observations 4,716 4,716
Inter-industry Intra-industry
Coeff.
(stand.
error)
Marginal effect
[change in prob (%)
10th–90th percentile]
Coeff.
(stand.
error)
Marginal effect
[change in prob (%)
10th–90th percentile]
Panel B: Inter-industry versus intra-industry takeovers
Constant -1.030*** -7.266***
(0.262) (0.573)
EQ 3.389*** 0.556 0.337 0.029
(0.871) [5.50] (1.570) [0.39]
ROE 0.069** 0.011 0.193** 0.017
(0.034) [0.81] (0.082) [1.35]
SGROW -0.061 -0.001 -0.128 -0.011
(0.094) [-0.55] (0.149) [-0.79]
LIQ 0.210* 0.035 0.487* 0.042
(0.117) [2.10] (0.259) [2.85]
1066 K. Raman et al.
123
Author's personal copy
non-negotiated bids (Holmstrom and Kaplan 2001) and correct the standard errors
for within-firm correlation (Rogers 1993) and for heteroscedasticity.
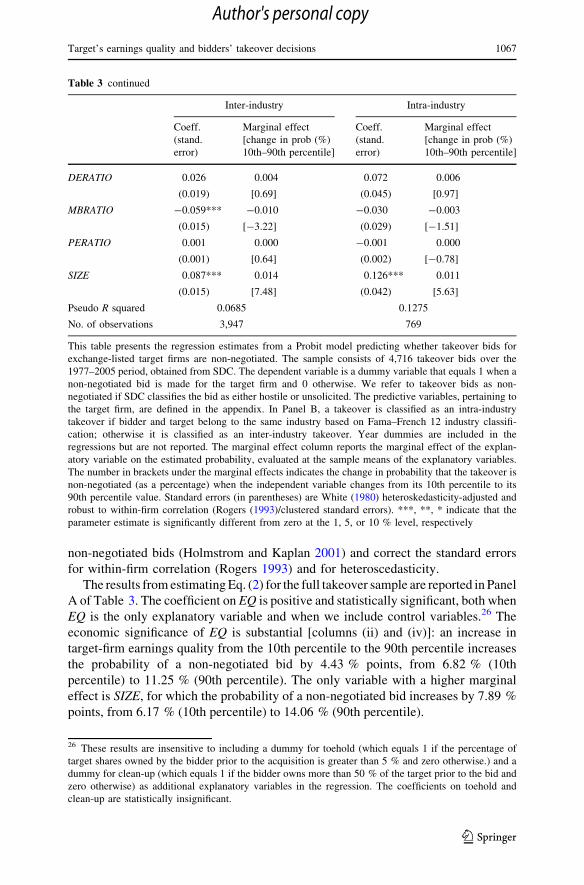
The results from estimating Eq. (2) for the full takeover sample are reported in Panel
A of Table 3. The coefficient on EQ is positive and statistically significant, both when
EQ is the only explanatory variable and when we include control variables.26 The
economic significance of EQ is substantial [columns (ii) and (iv)]: an increase in
target-firm earnings quality from the 10th percentile to the 90th percentile increases
the probability of a non-negotiated bid by 4.43 % points, from 6.82 % (10th
percentile) to 11.25 % (90th percentile). The only variable with a higher marginal
effect is SIZE, for which the probability of a non-negotiated bid increases by 7.89 %
points, from 6.17 % (10th percentile) to 14.06 % (90th percentile).
Table 3 continued
Inter-industry Intra-industry
Coeff.
(stand.
error)
Marginal effect
[change in prob (%)
10th–90th percentile]
Coeff.
(stand.
error)
Marginal effect
[change in prob (%)
10th–90th percentile]
DERATIO 0.026 0.004 0.072 0.006
(0.019) [0.69] (0.045) [0.97]
MBRATIO -0.059*** -0.010 -0.030 -0.003
(0.015) [-3.22] (0.029) [-1.51]
PERATIO 0.001 0.000 -0.001 0.000
(0.001) [0.64] (0.002) [-0.78]
SIZE 0.087*** 0.014 0.126*** 0.011
(0.015) [7.48] (0.042) [5.63]
Pseudo R squared 0.0685 0.1275
No. of observations 3,947 769
This table presents the regression estimates from a Probit model predicting whether takeover bids for
exchange-listed target firms are non-negotiated. The sample consists of 4,716 takeover bids over the
1977–2005 period, obtained from SDC. The dependent variable is a dummy variable that equals 1 when a
non-negotiated bid is made for the target firm and 0 otherwise. We refer to takeover bids as non-
negotiated if SDC classifies the bid as either hostile or unsolicited. The predictive variables, pertaining to
the target firm, are defined in the appendix. In Panel B, a takeover is classified as an intra-industry
takeover if bidder and target belong to the same industry based on Fama–French 12 industry classifi-
cation; otherwise it is classified as an inter-industry takeover. Year dummies are included in the
regressions but are not reported. The marginal effect column reports the marginal effect of the explan-
atory variable on the estimated probability, evaluated at the sample means of the explanatory variables.
The number in brackets under the marginal effects indicates the change in probability that the takeover is
non-negotiated (as a percentage) when the independent variable changes from its 10th percentile to its
90th percentile value. Standard errors (in parentheses) are White (1980) heteroskedasticity-adjusted and
robust to within-firm correlation (Rogers (1993)/clustered standard errors). ***, **, * indicate that the
parameter estimate is significantly different from zero at the 1, 5, or 10 % level, respectively
26 These results are insensitive to including a dummy for toehold (which equals 1 if the percentage of
target shares owned by the bidder prior to the acquisition is greater than 5 % and zero otherwise.) and a
dummy for clean-up (which equals 1 if the bidder owns more than 50 % of the target prior to the bid and
zero otherwise) as additional explanatory variables in the regression. The coefficients on toehold and
clean-up are statistically insignificant.
Target’s earnings quality and bidders’ takeover decisions 1067
123
Author's personal copy
In general, the coefficients on the control variables are in line with the findings in
prior research and suggest that negotiated bids are more likely for target firms that are
more difficult to value (e.g., Schwert 2000; Dong et al. 2006). For example, negotiated
bids are more likely for targets with a lower fraction of liquid assets, higher market-
to-book ratios, lower profitability (ROE), and smaller market capitalization.
In Panel B of Table 3, we estimate Eq. (2) separately for inter- and intra-industry
takeovers, in order to gauge the relative importance of the asymmetric uncertainty
vis-a-vis symmetric uncertainty components of earnings quality. The coefficient on
EQ is substantially larger for inter-industry takeovers than for intra-industry
takeovers, which translates into large differences in economic significance: an
increase in target firm earnings quality from the 10th percentile to the 90th percentile
increases the probability of a non-negotiated bid by 5.50 % for inter-industry
takeovers but by only 0.39 % for intra-industry takeovers. This is consistent with
asymmetric uncertainty playing a more important role than symmetric uncertainty in
the decision of whether or not to make a non-negotiated bid.
Overall, the results show that negotiated takeovers are more likely when the
target’s earnings quality leads to greater asymmetric uncertainty.
5.2 Impact of targets’ earnings quality on bid premium
Next, we examine the relation between earnings quality and bid premium by
regressing the bid premium on earnings quality and other control variables (Schwert
2000; Bargeron et al. 2008; see the Appendix):
PREMi;tþ1 ¼ d0 þ dneg1 ð1� NON NEGOi;tþ1Þ � EQi;t
þ dnon neg1 ðNON NEGOi;tþ1Þ � EQi;t
þ d2ROEi;t þ d3SGROWi;t þ d4LIQi;t þ d5DERATIOi;t
þ d6MBRATIOi;t þ d7PERATIOi;t þ d8SIZEi;t þ d9NON NEGOi;tþ1
þ d10PILLi;tþ1 þ d11AUCTIONi;tþ1 þ d12CASHi;tþ1
þ d13TENDERi;tþ1 þ d14PUBLICi;tþ1 þ ti;tþ1;
ð3Þ
where PREMi,t?1 refers to either SDC premium or Schwert premium, as described in
Sect. 3. To test for differences across negotiated and non-negotiated takeovers, we
allow the coefficient on earnings quality to differ for negotiated bids and non-
negotiated bids. We expect the coefficient on EQi,t to be negative for negotiated
takeovers only. As before, the regressions include year dummies to control for any
time variation in bid premiums, and the standard errors are corrected for within-firm
dependence and for heteroscedasticity.27
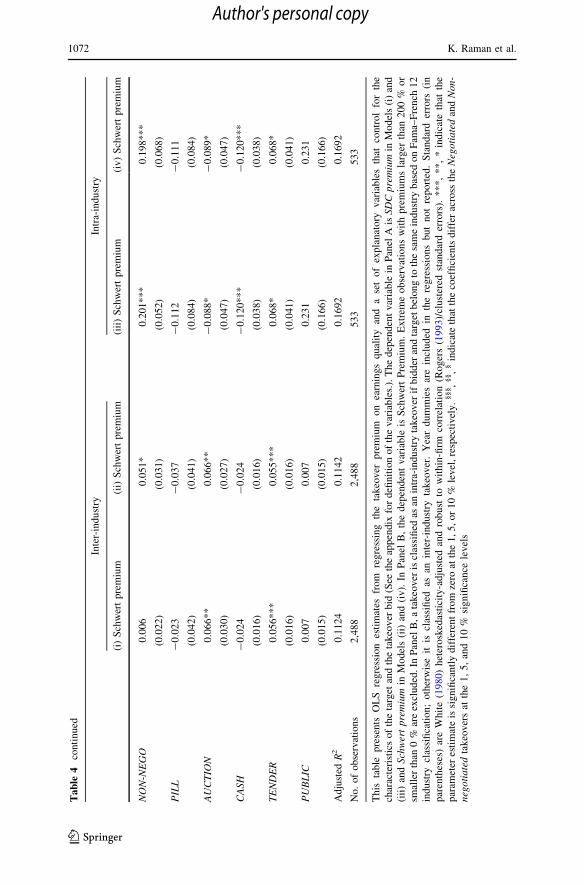
Our results for the full takeover sample are presented in Panel A of Table 4.
Overall, we find a negative relation between earnings quality and premium,
irrespective of the premium definition (Panel A, columns (i) and (ii)). The economic
27 Since the premium is required to be between 0 and 200 %, we tested the sensitivity of our results to the
use of Tobit. The use of Tobit instead of OLS does not qualitatively affect the results.
1068 K. Raman et al.
123
Author's personal copy

Tab
le4
Ear
nin
gs
qu
alit
yan
dta
keo
ver
pre
miu
m
(i)
SD
Cp
rem
ium
(ii)
Sch
wer
tp
rem
ium
(iii
)S
DC
pre
miu
m(i
v)
Sch
wer
tp
rem
ium
Pa
nel
A:
All
targ
ets
Const
ant
0.4
11***
0.5
31***
0.4
11***
0.5
29***
(0.1
11)
(0.0
31)
(0.1
11
)(0
.03
1)
EQ
-0
.431
**
*-
0.6
88
**
*
(0.1
69)
(0.1
66)
(1-
NO
N-N
EG
O)
9E
Q-
0.4
14
**
-0
.741
**
*,§
(0.1
75
)(0
.17
4)
(NO
N-N
EG
O)
9E
Q-
0.5
81
-0
.071
(0.4
59
)(0
.38
9)
RO
E-
0.0
24
-0
.054
**
*-
0.0
24
-0
.054
**
*
(0.0
18)
(0.0
16)
(0.0
18
)(0
.01
6)
SG
RO
W-
0.0
77
**
*-
0.0
22
-0
.077
**
*-
0.0
22
(0.0
29)
(0.0
28)
(0.0
29
)(0
.02
8)
LIQ
-0
.022
-0
.043
-0
.022
-0
.043
(0.0
38)
(0.0
35)
(0.0
38
)(0
.03
5)
DE
RA
TIO
-0
.002
-0
.006
-0
.002
-0
.006
(0.0
07)
(0.0
06)
(0.0
07
)(0
.00
6)
MB
RA
TIO
-0
.002
-0
.003
-0
.002
-0
.003
(0.0
04)
(0.0
03)
(0.0
04
)(0
.00
3)
PE
RA
TIO
0.0
00
0.0
00
*0
.000
0.0
00
*
(0.0
00)
(0.0
00)
(0.0
00
)(0
.00
0)
SIZ
E-
0.0
32
**
*-
0.0
33
**
*-
0.0
32
**
*-
0.0
33
**
*
(0.0
06)
(0.0
04)
(0.0
06
)(0
.00
4)
Target’s earnings quality and bidders’ takeover decisions 1069
123
Author's personal copy

Tab
le4
con
tin
ued
(i)
SD
Cp
rem
ium
(ii)
Sch
wer
tp
rem
ium
(iii
)S
DC
pre
miu
m(i
v)
Sch
wer
tp
rem
ium
NO
N-N
EG
O0
.003
0.0
23
-0
.005
0.0
53
**
(0.0
22)
(0.0
21)
(0.0
32
)(0
.02
7)
PIL
L0
.002
-0
.024
0.0
04
-0
.031
(0.0
40)
(0.0
38)
(0.0
40
)(0
.03
8)
AU
CT
ION
0.0
99
**
*0
.045
*0
.099
**
*0
.047
**
(0.0
25)
(0.0
24)
(0.0
25
)(0
.02
4)
CA
SH
-0
.038
**
-0
.041
**
*-
0.0
37
**
-0
.041
**
*
(0.0
19)
(0.0
15)
(0.0
19
)(0
.01
5)
TE
ND
ER
0.0
77
**
*0
.054
**
*0
.077
**
*0
.053
**
*
(0.0
18)
(0.0
15)
(0.0
18
)(0
.01
5)
PU
BL
IC0
.050
**
*0
.013
0.0
50
**
*0
.013
(0.0
18)
(0.0
14)
(0.0
18
)(0
.01
4)
Ad
just
edR
20
.095
50
.108
50
.095
50
.109
1
No
.o
fo
bse
rvat
ion
s2
,346
3,0
21
2,3
46
3,0
21
1070 K. Raman et al.
123
Author's personal copy
Tab
le4
con
tin
ued
Inte
r-in
du
stry
Intr
a-in
du
stry
(i)
Sch
wer
tp
rem
ium
(ii)
Sch
wer
tp
rem
ium
(iii
)S
chw
ert
pre
miu
m(i
v)
Sch
wer
tp
rem
ium
Pa
nel
B:
Inte
r-in
du
stry
vs.
intr
a-i
nd
ust
ryta
keove
rs
Const
ant
0.5
10***
0.4
86***
0.4
63***
0.4
64***
(0.0
34)
(0.0
46)
(0.1
84)
(0.1
85)
EQ
-0
.857
**
*-
0.0
76
(0.1
92)
(0.3
10)
(1-
NO
N-N
EG
O)
9E
Q-
0.9
40
**
*,§
§-
0.0
70
(0.1
97)
(0.3
42)
(NO
N-N
EG
O)
9E
Q0
.434
-0
.114
(0.5
58)
(0.4
82)
RO
E-
0.0
53
**
*-
0.0
53
**
*-
0.0
59
*-
0.0
59
*
(0.0
18)
(0.0
18)
(0.0
33)
(0.0
33)
SG
RO
W0
.003
0.0
03
-0
.124
**
-0
.124
**
(0.0
34)
(0.0
34)
(0.0
50)
(0.0
50)
LIQ
-0
.059
-0
.058
0.0
05
0.0
05
(0.0
39)
(0.0
39)
(0.0
78)
(0.0
78)
DE
RA
TIO
-0
.001
-0
.001
-0
.032
*-
0.0
32
*
(0.0
06)
(0.0
06)
(0.0
18)
(0.0
19)
MB
RA
TIO
-0
.007
*-
0.0
07
*0
.009
0.0
09
(0.0
04)
(0.0
04)
(0.0
07)
(0.0
07)
PE
RA
TIO
0.0
00
0.0
00
-0
.001
*-
0.0
01
*
(0.0
00)
(0.0
00)
(0.0
00)
(0.0
00)
SIZ
E-
0.0
30
**
*-
0.0
31
**
*-
0.0
45
**
*-
0.0
45
**
*
(0.0
05)
(0.0
05)
(0.0
11)
(0.0
11)
Target’s earnings quality and bidders’ takeover decisions 1071
123
Author's personal copy
Tab
le4
con
tin
ued
Inte
r-in
du
stry
Intr
a-in
du
stry
(i)
Sch
wer
tp
rem
ium
(ii)
Sch
wer
tp
rem
ium
(iii
)S
chw
ert
pre
miu
m(i
v)
Sch
wer
tp
rem
ium
NO
N-N
EG
O0
.00
60
.05
1*
0.2
01
**
*0
.198
**
*
(0.0
22
)(0
.03
1)
(0.0
52)
(0.0
68)
PIL
L-
0.0
23
-0
.03
7-
0.1
12
-0
.111
(0.0
42
)(0
.04
1)
(0.0
84)
(0.0
84)
AU
CT
ION
0.0
66
**
0.0
66
**
-0
.088
*-
0.0
89
*
(0.0
30
)(0
.02
7)
(0.0
47)
(0.0
47)
CA
SH
-0
.02
4-
0.0
24
-0
.120
**
*-
0.1
20
**
*
(0.0
16
)(0
.01
6)
(0.0
38)
(0.0
38)
TE
ND
ER
0.0
56
**
*0
.05
5*
**
0.0
68
*0
.068
*
(0.0
16
)(0
.01
6)
(0.0
41)
(0.0
41)
PU
BL
IC0
.00
70
.00
70
.231
0.2
31
(0.0
15
)(0
.01
5)
(0.1
66)
(0.1
66)
Ad
just
edR
20
.11
24
0.1
14
20
.169
20
.169
2
No
.o
fo
bse
rvat
ion
s2
,48
82
,48
85
33
53
3
Th
ista
ble
pre
sen
tsO
LS
reg
ress
ion
esti
mat
esfr
om
reg
ress
ing
the
tak
eov
erp
rem
ium
on
earn
ing
sq
ual
ity
and
ase
to
fex
pla
nat
ory
var
iab
les
that
con
trol
for
the
char
acte
rist
ics
of
the
targ
etan
dth
eta
keo
ver
bid
(See
the
app
endix
for
defi
nit
ion
of
the
var
iab
les.
).T
he
dep
enden
tv
aria
ble
inP
anel
Ais
SD
Cp
rem
ium
inM
od
els
(i)
and
(iii
)an
dSch
wer
tpre
miu
min
Mo
del
s(i
i)an
d(i
v).
InP
anel
B,
the
dep
enden
tv
aria
ble
isS
chw
ert
Pre
miu
m.
Ex
trem
eo
bse
rvat
ion
sw
ith
pre
miu
ms
larg
erth
an2
00
%o
r
smal
ler
than
0%
are
excl
ud
ed.
InP
anel
B,
ata
keo
ver
iscl
assi
fied
asan
intr
a-in
du
stry
tak
eov
erif
bid
der
and
targ
etb
elon
gto
the
sam
ein
du
stry
bas
edo
nF
ama–
Fre
nch
12
indust
rycl
assi
fica
tion;
oth
erw
ise
itis
clas
sifi
edas
anin
ter-
indust
ryta
keo
ver
.Y
ear
dum
mie
sar
ein
cluded
inth
ere
gre
ssio
ns
but
not
report
ed.
Sta
nd
ard
erro
rs(i
n
par
enth
eses
)ar
eW
hit
e(1
98
0)
het
erosk
edas
tici
ty-a
dju
sted
and
robust
tow
ithin
-firm
corr
elat
ion
(Roger
s(1
99
3)/
clust
ered
stan
dar
der
rors
).***,
**,
*in
dic
ate
that
the
par
amet
eres
tim
ate
issi
gn
ifica
ntl
yd
iffe
ren
tfr
om
zero
atth
e1
,5
,o
r1
0%
lev
el,
resp
ecti
vel
y.
§§§,
§§,
§in
dic
ate
that
the
coef
fici
ents
dif
fer
acro
ssth
eN
egoti
ate
dan
dN
on
-
neg
oti
ate
dta
keo
ver
sat
the
1,
5,
and
10
%si
gn
ifica
nce
lev
els
1072 K. Raman et al.
123
Author's personal copy

significance of this relation is considerable. For example, the coefficient of -0.69 in
column (ii) indicates that when a target’s earnings quality is one standard deviation
below the mean EQ, the premium offered increases by 3.65 % (i.e., 7.6 %
[= 0.0365/0.48] relative to the average Schwert premium reported in Table 2). This
negative relation between premium and earnings quality is driven by the negotiated
takeovers; the coefficient on earnings quality is insignificant for non-negotiated
bids. Thus it seems that bidders are willing to offer higher premiums when
uncertainty arising from the target’s informational advantage is mitigated through
negotiations. The difference across negotiated and non-negotiated bids is consistent
with the asymmetric uncertainty component of earnings quality being a driver of bid
premium.
The coefficients on the control variables are generally consistent with prior work.
For example, smaller targets, deals involving multiple bidders, tender offers, and
bids by public bidders involve higher bid premiums (e.g., Schwert 2000; Bargeron
et al. 2008).
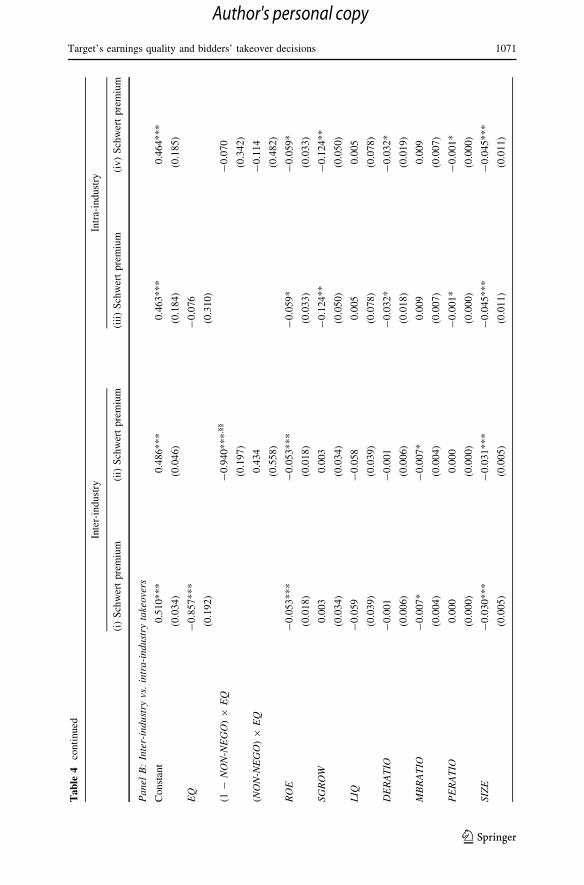
We explore the source of uncertainty driving the results more directly by
estimating Eq. (3) separately for the intra-industry and inter-industry takeover
samples.28 The results in Panel B of Table 4 indicate that the coefficient on EQ for
inter-industry takeovers (-0.857) is more than ten times larger than that for intra-
industry takeovers (-0.076), a statistically and economically significant difference.
Economically, a one standard deviation decrease in EQ over its mean implies a
3.98 % increase in the premium offered for inter-industry takeovers vis-a-vis an
increase of 0.43 % for intra-industry takeovers. The negative relation between bid
premium and earnings quality in inter-industry takeovers is driven by the negotiated
takeovers; for non-negotiated takeovers, the coefficient is positive (albeit insignif-
icant) and statistically different from the coefficient of -0.940 in negotiated
takeovers. Thus, whereas the resolution of asymmetric uncertainty leads to higher
premiums in negotiated deals, targets in non-negotiated deals do not reap this
benefit, since asymmetric uncertainty remains largely unresolved. Finally, for intra-
industry takeovers, the coefficients of earnings quality are statistically insignificant
across both negotiated and non-negotiated bids, suggesting that symmetric
uncertainty in financial reports is unrelated to bid premiums.
Overall, both the comparison of results across negotiated and non-negotiated bids
and the comparison across inter-industry and intra-industry takeovers yield
consistent conclusions: the asymmetric uncertainty component of earnings quality
is a prime determinant of bid premium.
5.3 Impact of targets’ earnings quality on method of payment
To test the relation between earnings quality and method of payment, we estimate
the following Tobit regression:29
28 The dependent variable in these regressions is the Schwert premium. We obtain qualitatively similar
results using the SDC premium.29 We use Tobit because the dependent variable is censored to be between 0 and 100 %. However, our
conclusions are unaffected if we use ordinary least squares regressions instead.
Target’s earnings quality and bidders’ takeover decisions 1073
123
Author's personal copy
PCT EQUITYi;tþ1 ¼ d0þ dneg1 ð1�NON NEGOi;tþ1Þ �EQi;t
þ dnon neg1 ðNON NEGOi;tþ1Þ �EQi;t
þ d2MBRATIOi;tþ d3SIZEi;tþ d4NON NEGOi;tþ1þ d5PILLi;tþ1
þ d6AUCTIONi;tþ1þ d7TENDERi;tþ1þ d8PREMi;tþ1
þ d9ACQ MBRATIOi;tþ d10ACQ SIZEi;tþ d11ACQ LEVi;t
þ d12ACQ FCFi;tþ d13REL SIZEi;tþ ti;tþ1;
ð4Þ
where PCT_EQUITYi,t?1 represents the percentage of the bid price offered in stock.
Following prior research (e.g., Martin 1996; Dong et al. 2006), we include several
control variables (defined in Table 5) and year dummies. As before, we allow the
coefficient on earnings quality to differ across negotiated and non-negotiated
takeovers. We estimate the regression in Eq. (4) for the full sample and for a
subsample of firms where the target’s market capitalization is at least 15 % of that
of the bidder, since the effects of over- or underpayment are likely to be econom-
ically more important in acquisitions of larger targets.
Panel A of Table 5 presents the results for the full sample.30 We find a negative
relation between the percentage of stock and earnings quality for negotiated
takeovers, indicating that negotiations do not completely resolve uncertainty, and
consequently stock tends to be used as a method of payment in takeovers involving
greater asymmetric uncertainty. But, surprisingly, earnings quality and method of
payment are unrelated in non-negotiated bids, where asymmetric uncertainty
remains unresolved. We explore this result in greater detail in our subsample
analysis below.
Panel B of Table 5 reports the regression estimates separately for the inter-
industry subsample. The coefficient of EQ for inter-industry, non-negotiated
takeovers is significantly larger in magnitude than for the combined sample. Within
inter-industry takeovers, the effect of EQ is larger for non-negotiated takeovers; in
regression (iv), for example, the coefficient of EQ for non-negotiated takeovers is
-11.048, in magnitude almost twice the corresponding coefficient for negotiated
takeovers (-5.276). However, the difference is not significant at conventional
levels, which we speculate is due to power issues and due to the appeal of cash
payment as a signaling mechanism in the more competitive non-negotiated
takeovers, as suggested by Berkovitch and Narayanan (1990).
We conduct the same analysis for the sample of intra-industry takeovers.
Consistent with our Hypothesis 3A, we find insignificant EQ coefficients for both
negotiated and non-negotiated takeovers in this subsample (The results are
untabulated to save space).
30 The number of observations in the regression is lower than the number of observations for which we
have PCT_EQUITY data (as reported in Table 2) owing to the elimination of takeovers by private bidders
and of takeovers for which acquirer characteristics (size, leverage, book-to-market, or free cash flow) or
Schwert premium are missing.
1074 K. Raman et al.
123
Author's personal copy

Table 5 Earnings quality and method of payment
(i) All
bidders
(ii) If relative market
size [15 %
(iii) All
bidders
(iv) If relative market
size [15 %
Panel A: All targets
Constant -2.244*** -2.048*** -1.188*** -1.218***
(0.281) (0.290) (0.314) (0.300)
(1 - NON-NEGO) 9 EQ -1.875** -2.504** -1.464 -3.638***,§§
(0.943) (1.048) (1.147) (1.437)
(NON-NEGO) 9 EQ -1.942 -1.719 1.299 1.460
(3.095) (2.779) (3.067) (2.305)
MBRATIO 0.051*** 0.046*** 0.023 0.024
(0.014) (0.014) (0.018) (0.017)
SIZE 0.075*** 0.065** 0.214*** 0.105
(0.027) (0.028) (0.044) (0.093)
NON-NEGO -0.519** -0.420** -0.305 -0.084
(0.231) (0.213) (0.254) (0.203)
PILL -0.027 0.077 -0.292 -0.174
(0.395) (0.355) (0.418) (0.309)
AUCTION -0.109 -0.131 0.011 0.033
(0.150) (0.145) (0.173) (0.146)
TENDER -2.332*** -1.978*** -1.884*** -1.226***
(0.148) (0.147) (0.161) (0.146)
Schwert premium -0.150** -0.168*** -0.160* -0.269***
(0.068) (0.066) (0.097) (0.103)
ACQ_MBRATIO 0.120*** 0.057***
(0.020) (0.022)
ACQ_SIZE -0.217*** -0.068
(0.040) (0.089)
ACQ_DERATIO -0.216*** -0.165***
(0.048) (0.042)
ACQ_FCF -1.447*** -1.216***
(0.521) (0.459)
REL_SIZE -0.085 -0.054
(0.054) (0.049)
Pseudo R squared 0.2106 0.2379 0.2157 0.2612
No. of observations 2,030 1,390 1,169 578
(i) All
bidders
(ii) If relative market
size [15 %
(iii) All
bidders
(iv) If relative market
size [15 %
Panel B: Inter-industry takeovers
Constant -2.328*** -2.279*** -1.364*** -1.447***
(0.333) (0.354) (0.413) (0.400)
(1 - NON-NEGO) 9 EQ -1.647 -2.152* -2.086 -5.276**
(1.271) (1.323) (1.945) (2.509)
(NON-NEGO) 9 EQ -10.173* -10.407* -8.476 -11.048*
(5.928) (5.522) (8.481) (6.582)
MBRATIO 0.043** 0.031* 0.032 -0.001
(0.019) (0.019) (0.030) (0.030)
Target’s earnings quality and bidders’ takeover decisions 1075
123
Author's personal copy

Overall, we conclude that asymmetric uncertainty in financial reports plays an
important role in influencing the method of payment in both negotiated and non-
negotiated bids of inter-industry takeovers.
Table 5 continued
(i) All
bidders
(ii) If relative market
size [15 %
(iii) All
bidders
(iv) If relative market
size [15 %
SIZE 0.089*** 0.092*** 0.186*** 0.101
(0.033) (0.034) (0.062) (0.132)
NON-NEGO -0.739** -0.713** -0.527 -0.405
(0.327) (0.312) (0.430) (0.339)
PILL -0.235 0.216 0.053 -0.017
(0.496) (0.460) (0.598) (0.431)
AUCTION -0.287 0.252 -0.061 0.021
(0.189) (0.185) (0.250) (0.209)
TENDER -2.160*** -2.021*** -1.574*** -1.014***
(0.177) (0.182) (0.211) (0.194)
Schwert premium -0.181** -0.173** -0.202 -0.363**
(0.082) (0.079) (0.163) (0.179)
ACQ_MBRATIO 0.081*** 0.038
(0.029) (0.040)
ACQ_SIZE -0.163*** -0.025
(0.056) (0.124)
ACQ_DERATIO -0.145* -0.130*
(0.076) (0.073)
ACQ_FCF -1.320 -1.714*
(0.917) (1.022)
REL_SIZE -0.062 -0.036
(0.062) (0.058)
Pseudo R squared 0.2065 0.2269 0.1823 0.2379
No. of observations 1,372 1,060 581 286
This table presents Tobit estimates from regressing the percentage of the proceeds paid using equity on earnings quality
and a set of explanatory variables. The dependent variable is PCT_EQUITY, the percentage of proceeds paid with the
bidder’s equity. The variables MBRATIO and SIZE refer to the characteristics of the target firm. ACQ_MBRATIO is
defined as the acquirer’s ratio of market value of equity to book value of equity (data 24 (price) 9 data 25 (common
shares outstanding)/data 60 (book value of equity)). ACQ_SIZE is the acquirer’s log of market capitalization from CRSP
on day -60 relative to the announcement date (day 0). ACQ_DERATIO is defined as the ratio of long-term debt to
equity, data9 (long-term debt)/data60 (book value of equity). ACQ_FCF is defined as [data13 (operating income before
depreciation) - data15 (interest expense) - data16 (income taxes) - data128 (capital expenditures)]/data6 (total
assets). REL_SIZE is the ratio of the market capitalization for the target to that of the bidder, both measured on day -60
relative to the announcement date (day 0). All accounting variables are taken as of the latest fiscal year ending at least
90 days before the acquisition announcement date. All other variables are defined in the appendix. In Models (ii) and
(iv), observations for which REL_SIZE \ 15 % are dropped from the regression. In Panel B a takeover is classified as an
intra-industry takeover if bidder and target belong to the same industry, based on Fama–French 12 industry classifi-
cation; otherwise it is classified as an inter-industry takeover. Year dummies are included in the regressions but are not
reported. Standard errors are reported within parentheses. ***, **, * indicate that the parameter estimate is significantly
different from zero at the 1, 5, or 10 % level, respectively. §§ indicates that the coefficients differ across the Negotiated
and Non-negotiated takeovers at the 5 % significance level
1076 K. Raman et al.
123
Author's personal copy

6 Further tests and alternative explanations
6.1 Additional evidence on the role of asymmetric and symmetric uncertainties
In order to test the robustness of the inferences derived from inter- and intra-
industry analyses, we use a two-stage research design to capture the influence of the
asymmetric and symmetric uncertainty components of financial reporting quality. In
the first stage, we regress earnings quality either on bid-ask spread (a proxy for
asymmetric uncertainty) or on analyst dispersion (a proxy for symmetric
uncertainty). In the second-stage regression, we replace the EQ variable in Eqs.
(2)–(4) with the fitted values of EQ from the first-stage regression. Relative to the
inter- and intra-industry analyses, this approach provides a more direct link between
the components of EQ and bidder decisions. However, the downside of this
approach is the reliance on relatively noisy proxies for asymmetric and symmetric
components of uncertainty. This approach also imposes greater data requirements—
data on bid-ask spreads and on analyst coverage—which limits the sample size.
The results using this two-stage approach are reported in Table 6. The
explanatory variables in columns (i), (iii), and (v) are the fitted values from
regressing EQ on bid-ask spreads, which we interpret as the asymmetric uncertainty
component of earnings quality, and those in columns (ii), (iv), and (vi) are the fitted
values from regressing EQ on analyst-forecast dispersion, which captures the
symmetric uncertainty component of earnings quality. This table does not tabulate
the coefficient estimates of control variables, as they are not much different from
those reported in earlier tables.
Consistent with the conclusions drawn in the earlier section, we find that the
asymmetric component of earnings quality is the main driver of bidders’ decisions.
From columns (i) and (ii), we note that the probability of a non-negotiated deal is
positively correlated with the asymmetric component of earnings quality but is at
best weakly correlated with the symmetric component. In regressions of the bid
premium, the coefficient on the asymmetric component is -6.55 and that on the
symmetric component is -22.98 (reported in columns (iii) and (iv) respectively) for
negotiated takeovers, suggesting that the premium increases with both asymmetric
and symmetric components of uncertainty. In contrast, the coefficient on the
asymmetric component is insignificant in non-negotiated takeovers, consistent with
non-resolution of asymmetric uncertainty in these takeovers. The symmetric
component of earnings quality has a positive coefficient for non-negotiated
takeovers. Since prior theoretical studies provide mixed predictions for the relation
between symmetric uncertainty and bid premium, we cannot resolve the puzzling
finding of opposite signs for the coefficients on symmetric uncertainty among non-
negotiated takeovers. Lastly, we find little relation between either asymmetric
uncertainty or symmetric uncertainty components of earnings quality and the
method of payment. However, given the small sample sizes employed in the method
of payment regressions, we are wary of drawing strong conclusions from these
regressions.
Target’s earnings quality and bidders’ takeover decisions 1077
123
Author's personal copy
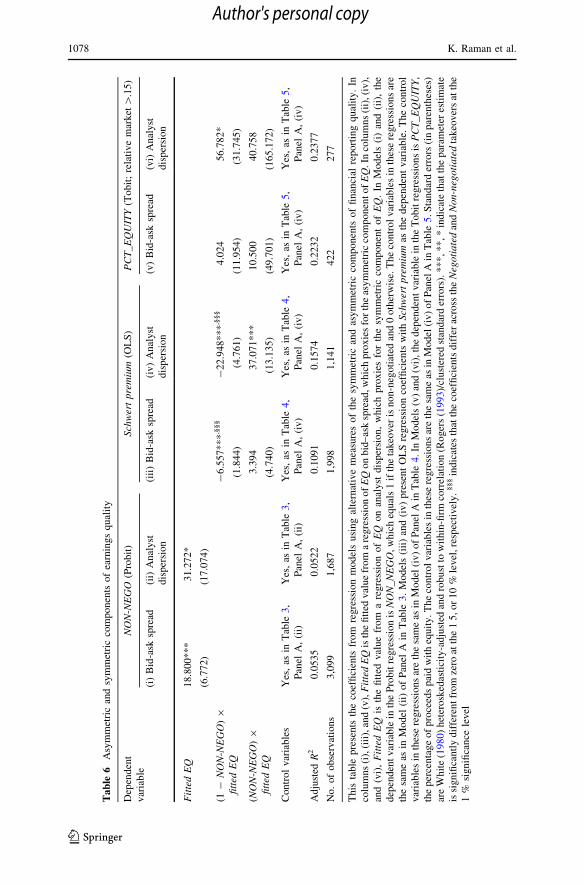
Ta
ble
6A
sym
met
ric
and
sym
met
ric
com
po
nen
tso
fea
rnin
gs
qu
alit
y
Dep
end
ent
var
iab
le
NO
N-N
EG
O(P
rob
it)
Sch
wer
tpre
miu
m(O
LS
)P
CT
_E
QU
ITY
(To
bit
;re
lati
ve
mar
ket
[.1
5)
(i)
Bid
-ask
spre
ad(i
i)A
nal
yst
dis
per
sion
(iii
)B
id-a
sksp
read
(iv
)A
nal
yst
dis
per
sio
n
(v)
Bid
-ask
spre
ad(v
i)A
nal
yst
dis
per
sio
n
Fit
ted
EQ
18
.80
0*
**
31
.27
2*
(6.7
72)
(17
.07
4)
(1-
NO
N-N
EG
O)
9
fitt
edE
Q
-6
.557
**
*,§
§§
-2
2.9
48
***
,§§§
4.0
24
56
.78
2*
(1.8
44)
(4.7
61)
(11
.95
4)
(31
.745
)
(NO
N-N
EG
O)
9
fitt
edE
Q
3.3
94
37
.07
1*
**
10
.50
04
0.7
58
(4.7
40)
(13
.13
5)
(49
.70
1)
(16
5.1
72
)
Con
tro
lv
aria
ble
sY
es,
asin
Tab
le3,
Pan
elA
,(i
i)
Yes
,as
inT
able
3,
Pan
elA
,(i
i)
Yes
,as
inT
able
4,
Pan
elA
,(i
v)
Yes
,as
inT
able
4,
Pan
elA
,(i
v)
Yes
,as
inT
able
5,
Pan
elA
,(i
v)
Yes
,as
inT
able
5,
Pan
elA
,(i
v)
Ad
just
edR
20
.05
35
0.0
52
20
.109
10
.15
74
0.2
23
20
.237
7
No
.o
fo
bse
rvat
ion
s3
,09
91
,687
1,9
98
1,1
41
42
22
77
This
table
pre
sents
the
coef
fici
ents
from
regre
ssio
nm
odel
susi
ng
alte
rnat
ive
mea
sure
sof
the
sym
met
ric
and
asym
met
ric
com
ponen
tsof
finan
cial
report
ing
qu
alit
y.
In
colu
mn
s(i
),(i
ii),
and
(v),
Fit
ted
EQ
isth
efi
tted
val
ue
from
are
gre
ssio
no
fE
Qo
nb
id–
ask
spre
ad,w
hic
hp
rox
ies
for
the
asy
mm
etri
cco
mp
on
ent
of
EQ
.In
colu
mn
s(i
i),(i
v),
and
(vi)
,F
itte
dE
Qis
the
fitt
edv
alue
fro
ma
reg
ress
ion
of
EQ
on
anal
yst
dis
per
sion
,w
hic
hp
rox
ies
for
the
sym
met
ric
com
po
nen
to
fE
Q.
InM
od
els
(i)
and
(ii)
,th
e
dep
enden
tv
aria
ble
inth
eP
robit
reg
ress
ion
isN
ON
_N
EG
O,
whic
heq
ual
s1
ifth
eta
keo
ver
isnon-n
egoti
ated
and
0oth
erw
ise.
The
contr
ol
var
iable
sin
thes
ere
gre
ssio
ns
are
the
sam
eas
inM
odel
(ii)
of
Pan
elA
inT
able
3.
Model
s(i
ii)
and
(iv)
pre
sent
OL
Sre
gre
ssio
nco
effi
cien
tsw
ith
Sch
wer
tpre
miu
mas
the
dep
enden
tv
aria
ble
.T
he
con
tro
l
var
iab
les
inth
ese
reg
ress
ion
sar
eth
esa
me
asin
Mo
del
(iv
)o
fP
anel
Ain
Tab
le4.
InM
odel
s(v
)an
d(v
i),
the
dep
enden
tvar
iable
inth
eT
obit
regre
ssio
ns
isP
CT
_E
QU
ITY
,
the
per
centa
ge
of
pro
ceed
spai
dw
ith
equit
y.T
he
contr
ol
var
iable
sin
thes
ere
gre
ssio
ns
are
the
sam
eas
inM
odel
(iv)
of
Pan
elA
inT
able
5.S
tan
dar
der
rors
(in
par
enth
eses
)
are
Wh
ite
(19
80)
het
erosk
edas
tici
ty-a
dju
sted
and
robust
tow
ithin
-firm
corr
elat
ion
(Roger
s(1
99
3)/
clust
ered
stan
dar
der
rors
).***,**,*
indic
ate
that
the
par
amet
eres
tim
ate
issi
gn
ifica
ntl
yd
iffe
ren
tfr
om
zero
atth
e1
5,o
r1
0%
lev
el,re
spec
tiv
ely.
§§§
ind
icat
esth
atth
eco
effi
cien
tsd
iffe
rac
ross
the
Neg
oti
ate
dan
dN
on
-neg
oti
ate
dta
keo
ver
sat
the
1%
sig
nifi
can
cele
vel
1078 K. Raman et al.
123
Author's personal copy

Overall, the results for the probability of non-negotiated takeovers and for bid
premium are largely consistent with those derived in Sect. 5. We continue to find
that the asymmetric component of earnings quality is the main driver of the takeover
decisions that we study.
6.2 Innate versus discretionary components of financial reporting quality
Based on Rogo (2009), we have decomposed earnings quality into symmetric and
asymmetric uncertainty components. We have relied on this decomposition as
negotiations can resolve one of these components (asymmetric component) but not
the other. However, prior studies have primarily decomposed earnings quality into
innate and discretionary components, based on whether the quality is determined by
business fundamentals or by managerial reporting strategy (e.g., Francis et al. 2005).
We note that this decomposition is not equivalent to splitting earnings quality into
symmetric and asymmetric components, especially given that the asymmetric
uncertainty component includes aspects of both discretionary and innate compo-
nents. In fact, there are cases where business fundamentals cause poor financial
reporting quality, leading to increased uncertainty in firm value, but where the
uncertainty can be (partly) resolved by accessing private information. For instance,
a firm with lumpiness in its selling activities, or with long operating cycles, might be
seen by outsiders as having volatile cash flows and poor reporting quality. However,
the cash flows could be predictable by that firm’s managers based on their
knowledge of sales order book and internal production schedules, which are
reflected in financial reports only with a delay. Lastly, the inability of accounting
standards to reflect underlying business transactions might lead to poor financial
reporting quality. But this limitation can be potentially overcome if one has access
to the firm’s underlying books of accounts.
Thus, while our primary hypotheses do not apply directly to innate or
discretionary components of earnings quality, for completeness this subsection
evaluates whether bidders’ decisions are driven by innate or by discretionary
components of accruals.
We conjecture that the effect of the innate component is likely to be stronger.
Prior work has shown that managers use the reporting discretion accorded by
accounting standards to better signal their private information about the firm’s
future prospects (e.g., Subramanyam 1996; Chaney et al. 1998), as well as to reduce
the transparency of the firm’s financial reports. Even in cases where managers use
their reporting discretion opportunistically, market participants seem to anticipate
the reversal of accruals in some settings (Defond and Park 2001; Shivakumar 2000).
Since bidders, either by themselves or through their takeover advisors, are likely to
be better at evaluating financial reports and at separating discretionary and innate
components than the average market participant, we expect that bidders’ decisions
will be more (less) influenced by the innate (discretionary) component of earnings
quality.
To test this prediction, we first decompose earnings quality into discretionary and
innate components, following the approach in Francis et al. (2005), and then
Target’s earnings quality and bidders’ takeover decisions 1079
123
Author's personal copy

re-estimate Eqs. (2)–(4) after replacing EQ with its two components.31 The results
are reported in Table 7. We find that the decision to engage in negotiations is driven
mostly by the innate component of earnings quality (column (i)). Likewise, the
innate component is the main driver of the higher premium (column (ii)) and the
greater use of stock as a method of payment (column (iii)) in negotiated takeovers of
targets with poorer earnings quality.
In sum, the takeover decisions that we examine are influenced more by the innate
component of earnings quality than by the discretionary component, especially
when information asymmetry is high.
Table 7 Innate and discretionary components of earnings quality
Dependent variable (i) NON-NEGO
(Probit)
(ii) Schwert
premium (OLS)
(iii) PCT_EQUITY
(Tobit; relative
market [.15)
Innate EQ 7.699***
(1.543)
Discretionary EQ 1.628**
(0.834)
(1 - NON-NEGO) 9
Innate
-1.860*** -9.557***
(0.387) (3.160)
(NON-NEGO) 9 Innate -1.083 -2.895
(1.093) (7.818)
(1 - NON-NEGO) 9
Discretionary
-0.513*** -2.819*
(0.195) (1.543)
(NON-NEGO) 9
Discretionary
0.097 2.158
(0.503) (2.905)
Control variables Yes, as in Table 3,
Panel A, (ii)
Yes, as in Table 4,
Panel A, (iv)
Yes, as in Table 5,
Panel A, (iv)
Adjusted R2 0.0681 0.1135 0.2651
No. of observations 4,705 3,014 578
This table presents the coefficients from regression models using the innate and discretionary components
of EQ as explanatory variables. Innate EQ and Discretionary EQ are estimated as in Francis et al. (2005).
In Model (i) the dependent variable in the Probit regression is NON_NEGO, which equals 1 if the
takeover is non-negotiated and 0 otherwise. The control variables in this regression are the same as in
Model (ii) of Panel A in Table 3. Model (ii) presents OLS regression coefficients with Schwert premium
as the dependent variable. The control variables in this regression are the same as in Model (iv) of Panel
A in Table 4. In Model (iii), the dependent variable in the Tobit regressions is PCT_EQUITY, the
percentage of proceeds paid with equity. The control variables in this regression are the same as in Model
(iv) of Panel A in Table 5. Standard errors (in parentheses) are White (1980) heteroskedasticity-adjusted
and robust to within-firm correlation (Rogers (1993)/clustered standard errors). ***, **, * indicate that the
parameter estimate is significantly different from zero at the 1, 5, or 10 % level, respectively
31 We do not report the subsample analyses of inter-industry and intra-industry takeovers, to conserve
space. The subsample results indicate that most of the results are driven by inter-industry takeovers.
1080 K. Raman et al.
123
Author's personal copy

6.3 Robustness tests
In untabulated analyses, we have verified that our results are robust to (1) excluding
financials and utilities, (2) including only targets with a share price greater than
$2.00, (3) including only targets with market capitalization greater than $10 million,
(4) including only successful bids, and (5) deleting multiple bids. We have also
tested the sensitivity of our conclusions to a variety of alternative measures of
earnings quality: (1) EQ measured using Dechow and Dichev’s (2002) model, (2)
EQ defined as the predictive ability of earnings for future cash flows, and (3) EQ
defined as the predictive ability of accruals and cash flows for future cash flows.
Regardless of the specific model employed to measure earnings quality, we find that
earnings quality affects takeover decisions and that the effect is strongest for the
asymmetric component of earnings quality.
A potential concern, however, may be our single focus on earnings as opposed to
overall reporting quality, even though Francis et al. (2008) show that earnings quality
is indeed a good proxy for overall reporting quality. To verify the robustness of our
conclusions to a broader definition of reporting quality, we construct an index that
aggregates a variety of financial reporting quality attributes: (i) accruals quality based
on Francis et al. (2005), (ii) Watts and Khan’s (2009) timely gain recognition measure,
and (iii) timely loss recognition, (iv) an indicator for Big 5 auditor, (v) number of
business segments, (vi) number of geographical segments, (vii) proportion of years
with losses in the prior 5-year period, (viii) volatility of cash flows, (ix) volatility of
stock returns, (x) volatility of net income, and (xi) volatility of sales. Our earlier results
continue to hold for this broader measure of financial reporting quality (Table 8),
which assuages concerns about the paper’s focus on earnings quality.
A final concern is whether our results simply reflect the target’s corporate
governance or managerial ownership structure. Prior studies have pointed to a link
between financial reporting quality and various governance characteristics, as well
as between takeover premiums and managerial ownership structure. For example,
Bushman et al. (2004) show that corporate governance and reporting quality act as
substitutes for a firm, with demands on governance systems increasing as financial
reporting quality decreases. In contrast, Klein (2002) shows that corporate
governance places limits on the ability of managers to manipulate reported
numbers, implying a positive correlation between reporting quality and corporate
governance. Also, Cotter and Zenner (1994) document a negative relation between
managerial ownership and takeover premium, while Warfield et al. (1995) find
managerial ownership to be positively correlated with earnings quality.
To examine the robustness of our results to these concerns, we include in our
regressions variables that proxy for governance and managerial ownership in the target
firms. We use two measures of corporate governance: (i) the Gompers et al. (2003)
corporate governance index, and (ii) board characteristics employed by Bange and
Mazzeo (2004). We define managerial ownership as the sum of common and restricted
shares for all executives in a firm, divided by shares outstanding for the firm.32
32 We thank Andrew Metrick for providing the data on the corporate governance index. The board
characteristics we include are (i) board size, (ii) whether the majority of the board consists of independent
Target’s earnings quality and bidders’ takeover decisions 1081
123
Author's personal copy

Untabulated results from this analysis reveal that our earlier conclusions on the relation
between earnings quality and bidders’ decisions are robust to controlling for corporate
governance and managerial ownership. Thus our earlier results are not driven by earnings
quality proxying for either corporate governance or managerial ownership structure.
7 Conclusion
Financial information is central to corporate decision-making. Given the promi-
nence of acquisitions as investment decisions, we investigate how the quality of
Table 8 Alternative measure of financial reporting quality
Dependent variable (i) NON-
NEGO
(Probit)
(ii) SDC
premium
(OLS)
(iii) Schwert
premium
(OLS)
(iv)
PCT_EQUITY
(Tobit; all
bidders)
(v) PCT_EQUITY
(Tobit; if relative
market
size [15 %)
I_INDEX 0.113***
(0.028)
(1 - NON-
NEGO) 9 I_INDEX
-0.042*** -0.061*** -0.113** -0.231***,§§
(0.009) (0.007) (0.055) (0.061)
(NON-
NEGO) 9 I_INDEX
-0.024 -0.032 0.034 0.058
(0.018) (0.021) (0.147) (0.115)
Control variables Yes, as in
Table 3,
Panel A,
(ii)
Yes, as in
Table 4,
Panel A,
(iv)
Yes, as in
Table 4,
Panel A,
(iv)
Yes, as in
Table 5,
Panel A,
(iv)
Yes, as in
Table 5,
Panel A,
(iv)
Adjusted R2 0.0626 0.1021 0.1241 0.2212 0.2695
No. of observations 4,700 2,342 3,009 1,166 578
This table presents the coefficients from regression models using I_INDEX as an alternative measure of
financial reporting quality. I_INDEX is the average of the decile ranks of several variables that proxy for the
target firm’s financial reporting quality. A higher value indicates higher financial reporting quality. In Model
(i), the dependent variable in the Probit regression is NON_NEGO, which equals 1 if the takeover is non-
negotiated and 0 otherwise. The control variables in this regression are the same as in Model (ii) of Panel A in
Table 3. Models (ii) and (iii) present OLS regression coefficients with SDC or Schwert premium as the
dependent variable. The control variables in these regressions are the same as in Model (iv) of Panel B in
Table 4. In Models (iv) and (v), the dependent variable in the Tobit regressions is PCT_EQUITY, the
percentage of proceeds paid with equity. Model (iv) includes all public bidders, whereas Model (v) includes
only observations in which the target’s market capitalization is at least 15 % of the bidder’s market capi-
talization. Standard errors (in parentheses) are White (1980) heteroskedasticity-adjusted and robust to
within-firm correlation (Rogers (1993)/clustered standard errors). ***, **, * indicate that the parameter
estimate is significantly different from zero at the 1 %, 5 %, or 15 % level, respectively. §§ indicates that the
coefficients differ across the Negotiated and Non-negotiated takeovers at the 5 % significance level
Footnote 32 continued
directors, and (iii) whether the positions of CEO and board chairman are held by separate individuals. The
data on board characteristics are obtained from the IRRC database, which covers firms belonging to the
S&P 500, S&P 400 mid-cap, and S&P 600 small-cap indices, beginning in 1997. The data on managerial
ownership are obtained from S&P Execucomp, which covers firms in the S&P 500, S&P 400 mid-cap,
and S&P 600 small-cap from 1992 onwards. The data availability on S&P Execucomp limits the sample
size for this analysis.
1082 K. Raman et al.
123
Author's personal copy

information in target firms’ earnings affects acquisition decisions by bidding firms.
We differentiate between the symmetric and asymmetric components of financial
reporting quality and hypothesize that bidders are more likely to choose negotiated
takeovers, offer larger bid premiums in negotiated transactions, and use shares as
method of payment when the asymmetric component is large. Conversely, we
predict no clear relation between these takeover decisions and the symmetric
uncertainty component.
Using a large sample of US takeovers between 1977 and 2005, we find evidence
consistent with our predictions: bidders are more likely to undertake negotiated
takeovers when asymmetric uncertainty is potentially an important concern; in
negotiated deals, the asymmetric components of earnings quality and takeover
premiums are negatively related, suggesting that bidders obtain valuable private
information through negotiations. Finally, the propensity to use equity as a method
of payment is higher if the target firm’s earnings quality is poor, which is consistent
with bidders attempting to share the information risks associated with such targets.
Overall, our findings suggest that acquiring firms take into consideration the
quality of target firms’ earnings in making strategic investment decisions. In a
broader context, while earnings quality has been shown to affect the pricing of
financial securities in general, the evidence in this study suggests that earnings
quality also affects critical corporate decisions. Our study also shows that
decomposition of earnings quality into asymmetric uncertainty and symmetric
uncertainty components, as suggested by Rogo (2009), could be a fruitful approach
to obtain a deeper understanding of the effect of earnings quality on managerial
decisions.
Acknowledgments We thank Ray Ball, Russell Lundholm (editor), Per Olsson, Sugata Roychowdhury,
Henri Servaes, Husayn Shahrur, an anonymous reviewer, and seminar participants at the 2008 London
Business School Accounting Symposium, the 2009 Financial Management Association Conference,
Erasmus University of Rotterdam, Indian School of Business, Massachusetts Institute of Technology,
National University of Singapore, Singapore Management University, Southern Methodist University,
University of Auckland, University of Chicago, University of Texas at Dallas, Vanderbilt University, and
Washington University for helpful discussions. Shivakumar gratefully acknowledges financial support
from the Private Equity Institute, London Business School.
Appendix
See Table 9.
Table 9 Variable definitions
EQ Negative of the standard deviation of accrual residuals in years t - 5 to t - 1, where year
t is the fiscal year ending at least 30 days prior to the acquisition announcement. The
accrual residuals for a sample firm in a given year are obtained from industry-level
regressions of the accrual model given in McNichols (2002)
NON-
NEGO
Equals 1 if takeover contest is classified as hostile or unsolicited by SDC and 0 otherwise
PILL Equals 1 if the target firm is reported by SDC to have a poison pill in place during the
contest and 0 otherwise
Target’s earnings quality and bidders’ takeover decisions 1083
123
Author's personal copy

References
Aboody, D., Hughes, J., & Liu, J. (2005). Earnings quality, insider trading and cost of capital. Journal of
Accounting Research, 43(5), 651–673.
Baker, M., Ruback, R., & Wurgler, J. (2006). Behavioral corporate finance: A survey. In E. Eckbo (Ed.),
The handbook of corporate finance: Empirical corporate finance. North Holland: Elsevier.
Bange, M. M., & Mazzeo, M. A. (2004). Board composition, board effectiveness, and the observed form
of takeover bids. Review of Financial Studies, 17(4), 1185–1215.
Barberis, N., & Thaler, R. (2006). A survey of behavioral finance. In G. M. Constantinides, M. Harris, &
R. Stulz (Eds.), Handbook of the economics of finance. New York: Elsevier.
Bargeron, L., Schlingemann, F. P., Stulz, R. M., & Zutter, C. J. (2008). Why do private acquirers pay so
little compared to public acquirers? Journal of Financial Economics, 89(3), 375–390.
Table 9 continued
AUCTION Equals 1 if the number of bidders reported by SDC is more than one and 0 otherwise
TENDER Equals 1 if the deal is classified as a tender offer by SDC and 0 otherwise
CASH Equals 1 if the deal is paid for using cash only and 0 otherwise
EQUITY Equals 1 if the deal is paid for using stock only and 0 otherwise
PCT_EQUITY Percentage of the takeover proceeds paid using equity
ROE Ratio of earnings to average equity: data item 20(t)/{[data60(t) ? data60(t - 1)]/2}
SGROW Percentage change in sales: Ln(data item 12(t)/data12(t - 1))
LIQ Ratio of net liquid assets to total assets: (data4 - data5)/data6
DERATIO Ratio of debt to equity: data9/data60
MBRATIO Ratio of market value of equity to book value of equity: data24 9 data25/data60
PERATIO Data24/data58
SIZE Log of MARKETCAP, the market capitalization from CRSP on day -60 relative to
announcement date
PUBLIC A bidder is classified as public if it is identified as a public company by SDC; otherwise
it is classified as private
SDC premium Market model cumulative abnormal return over event day -63 to event day 0, where
event day 0 is the acquisition announcement date. The stock return on event day 0 is
computed from the SDC reported offer price and the closing stock price on day -1.
The abnormal returns are obtained from a market model with the CRSP value-
weighted index return as the market return. The parameters of the model are estimated
over the period day -316 to day -64
Schwert
premium
Market model cumulative abnormal return for the [-63, 126] window relative to the
acquisition announcement date (day 0), with [-316, -64] as the estimation window,
and the CRSP value-weighted index return as the market return
I_INDEX The average of the decile ranks of variables that proxy for the target firm’s operating
volatility and financial reporting quality. A higher decile rank indicates higher
information quality. The operating volatility variables are (i) volatility of cash flows,
(ii) volatility of stock returns, (iii) volatility of net income, and (iv) volatility of sales.
These volatility variables are measured as the standard deviation of the underlying
annual variable over a 5-year period prior to the acquisition announcement date. The
financial reporting quality variables are (i) accruals quality, (ii) timely gain
recognition measure, (iii) timely loss recognition measure, (iv) an indicator for Big 5
auditor, (v) number of business segments, (vi) number of geographical segments, and
(vii) proportion of years with losses in the prior 5-year period
All accounting variables are as of the latest fiscal year ending at least 90 days before the acquisition
announcement date
1084 K. Raman et al.
123
Author's personal copy
Bazerman, M. H., & Samuelson, W. (1983). I won the auction but don’t want the prize. Journal of
Conflict Resolution, 27(4), 618–634.
Berkovitch, E., & Khanna, N. (1991). A theory of acquisition markets: Mergers versus tender offers and
golden parachutes. Review of Financial Studies, 4(1), 149–174.
Berkovitch, E., & Narayanan, M. P. (1990). Competition and the medium of exchange in takeovers.
Review of Financial Studies, 3(2), 153–174.
Bharath, S., Sunder, J., & Sunder, S. V. (2008). Accounting quality and debt contracting. The Accounting
Review, 83(1), 1–28.
Bhattacharya, N., Desai, H., & Venkataraman, K. (2007). Earnings quality and information asymmetry:
Evidence from trading costs. Working paper, Southern Methodist University.
Boone, A., & Mulherin, J. H. (2007). How are firms sold? Journal of Finance, 62(2), 847–875.
Boone, A., & Mulherin, J. H. (2008). Do auctions induce a winner’s curse? Evidence from the corporate
takeover market. Journal of Financial Economics, 89(1), 1–19.
Brown, S., & Hillegeist, S. (2007). How disclosure quality affects the level of information asymmetry.
Review of Accounting Studies, 12(2/3), 443–477.
Bushman, R. M., Chen, Q., Engle, E., & Smith, A. (2004). Financial accounting information,
organizational complexity and corporate governance systems. Journal of Accounting and
Economics, 37(2), 167–201.
Bushman, R. M., & Smith, A. (2001). Financial accounting information and corporate governance.
Journal of Accounting and Economics, 32(1–3), 237–333.
Chaney, P., Jeter, D., & Lewis, C. (1998). The use of accruals in income smoothing: A permanent
earnings hypothesis. In C. F. Lee (Ed.), Advances in quantitative analysis of finance and accounting
(Vol. 6, pp. 103–135). Singapore: World Scientific.
Conn, R. L., Cosh, A., Guest, P. M., & Hughes, A. (2005). The impact on UK acquirers of domestic,
cross-border, public and private acquisitions. Journal of Business Finance and Accounting, 32(5–6),
815–870.
Cornett, M. M., Marcus, A., & Tehranian, H. (2008). Earnings management, corporate governance, and
financial performance. Journal of Financial Economics, 87(2), 357–373.
Cotter, J. F., & Zenner, M. (1994). How managerial wealth affects the tender offer process. Journal of
Financial Economics, 35(1), 63–97.
Damodaran, A. (2006). The value of transparency and cost of complexity. Working paper, New York
University.
Dechow, P., & Dichev, I. (2002). The quality of accruals and earnings: The role of accrual estimation
errors. The Accounting Review, 77(Supplement), 35–59.
Defond, M. L., & Park, C. W. (2001). The reversal of abnormal accruals and the market valuation of
earnings surprises. The Accounting Review, 76(3), 375–404.
Diamond, D. (1985). Optimal releases of information by firms. Journal of Finance, 40(4), 1071–1094.
Dong, M., Hirshleifer, D., Richardson, S., & Teoh, S. (2006). Does investor misvaluation drive the
takeover market? Journal of Finance, 61(2), 725–762.
Doyle, J., Ge, W., & Mcvay, S. (2007). Accruals quality and internal control over financial reporting. The
Accounting Review, 82(5), 1141–1170.
Easley, D. S., Hvidkjaer, S., & O’Hara, M. (2002). Is information risk a determinant of asset returns?
Journal of Finance, 57(5), 2185–2221.
Easley, D. S., & O’Hara, M. (2004). Information and the cost of capital. Journal of Finance, 59(4),
1553–1583.
Eckbo, B. E., Giammarino, R. M., & Heinkel, R. L. (1990). Asymmetric information and the medium of
exchange in takeovers: Theory and tests. Review of Financial Studies, 3(4), 651–675.
Epstein, L., & Schneider, M. (2008). Ambiguity, information quality and asset prices. Journal of Finance,
63(1), 197–228.
Eso, P., & Szentes, B. (2007). Optimal information disclosure in auctions and the handicap auction.
Review of Economic Studies, 74(3), 705–731.
Fama, E., & French, K. (1997). Industry costs of equity. Journal of Financial Economics, 43(2), 153–193.
Fishman, M. J. (1989). Preemptive bidding and the role of medium of exchange in acquisitions. The
Journal of Finance, 44(1), 41–57.
Francis, J. R., LaFond, R., Olsson, P., & Schipper, K. (2004). Costs of equity and earnings attributes. The
Accounting Review, 79(4), 967–1010.
Francis, J. R., LaFond, R., Olsson, P., & Schipper, K. (2005). The market pricing of earnings quality.
Journal of Accounting and Economics, 39(2), 295–327.
Target’s earnings quality and bidders’ takeover decisions 1085
123
Author's personal copy

Francis, J. R., Nanda, D. J., & Olsson, P. (2008). Voluntary disclosure, earnings quality and cost of
capital. Journal of Accounting Research, 46(1), 53–99.
Glosten, L. R., & Milgrom, P. (1985). Bid, ask and transaction prices in a specialist market with
heterogeneously informed traders. Journal of Financial Economics, 14(1), 71–100.
Gompers, P., Ishii, J. L., & Metrick, A. (2003). Corporate governance and equity prices. Quarterly
Journal of Economics, 118(1), 107–155.
Hansen, R. G. (1987). A theory of the choice of exchange medium in the market for corporate control.
Journal of Business, 60, 75–95.
Holmes, T. J., & Schmitz, J. A., Jr. (1995). On the turnover of business firms and business managers.
Journal of Political Economy, 103(5), 1005–1038.
Holmstrom, B., & Kaplan, S. N. (2001). Corporate governance and merger activity in the United States:
Making sense of the 1980s and 1990s. Journal of Economic Perspectives, 15(2), 121–144.
Hutton, A. P., Marcus, A. J., & Tehranian, H. (2009). Opaque financial reports, R2, and crash risk.
Journal of Financial Economics, 94(1), 67–86.
Jenkins, P., Politi, J., & Wiesmann, G. (2006). BASF launches hostile bid for Engelhard. Financial Times
Intelligence, January 4, 1.
Klein, A. (2002). Audit committee, board of director characteristics, and earnings management. Journal
of Accounting and Economics, 33(3), 375–400.
Koller, T., Goedhart, M., & Wessels, D. (2005). Valuation: Measuring and managing the value of
companies (4th ed.). Hoboken, NJ: Wiley.
Lambert, R., Leuz, C., & Verrechia, R. (2007). Information asymmetry, information precision and the
cost of capital. Working paper, University of Pennsylvania and University of Chicago.
Lang, M. H., & Lundholm, R. J. (1996). Corporate disclosure policy and analyst behavior. The
Accounting Review, 71(4), 467–492.
Lee, G., & Masulis, R. W. (2009). Seasoned equity offerings: Quality of accounting information and
expected flotation costs. Journal of Financial Economics, 92(3), 443–469.
Marquardt, C. A., & Zur, E. (2010). The role of accounting quality in the M&A market. Working paper,
Baruch College.
Martin, K. (1996). The method of payment in corporate acquisitions, investment opportunities, and
management ownership. Journal of Finance, 51(4), 1227–1246.
McNichols, M. (2002). Discussion of ‘‘The quality of accruals and earnings: The role of accrual
estimation errors’’. The Accounting Review, 77, 61–69.
McNichols, M., & Stubben, S. (2012). The effect of target-firm accounting quality on valuation in
acquisitions. Working paper, Stanford University.
Meulbroek, L. (1992). An empirical analysis of illegal insider trading. Journal of Finance, 47(5),
1661–1699.
Milgrom, P., & Weber, R. J. (1982). The value of information in a sealed-bid auction. Journal of
Mathematical Economics, 10(1), 105–114.
Moeller, S. B., Schlingemann, F., & Stulz, R. M. (2007). How do diversity of opinion and information
asymmetry affect acquirer returns? Review of Financial Studies, 20(6), 2047–2078.
Officer, M. S. (2003). Termination fees in mergers and acquisitions. Journal of Financial Economics,
69(3), 431–467.
Officer, M. S., Poulsen, A. B., & Stegemoller, M. (2009). Target-firm information asymmetry and
acquirer returns. Review of Finance, 13(3), 467–493.
Pastor, L., & Veronesi, P. (2003). Stock valuation and learning about profitability. Journal of Finance,
58(5), 1749–1789.
Pastor, L., & Veronesi, P. (2006). Was there a Nasdaq bubble in the late 1990s? Journal of Financial
Economics, 81(1), 61–100.
Prabhala, N. R. (1997). Conditional methods in event studies and an equilibrium justification for using
standard event-study proceduresd. Review of Financial Studies, 10(1), 1–38.
Rogers, W. (1993). Regression standard errors in clustered samples. Stata Technical Bulletin, 13, 19–23.
Rogo, R. (2009). The effect of valuation uncertainty in the choice of selling mechanism. Working paper,
University of British Columbia.
Roll, R. (1986). The hubris hypothesis of corporate takeovers. Journal of Business, 59(2), 197–216.
Schwert, G. W. (1996). Markup pricing in mergers and acquisitions. Journal of Financial Economics,
41(2), 153–192.
Schwert, G. W. (2000). Hostility in takeovers: In the eyes of the beholder? Journal of Finance, 55(6),
2599–2640.
1086 K. Raman et al.
123
Author's personal copy

Shivakumar, L. (2000). Do firms mislead investors by overstating earnings around seasoned equity
offerings? Journal of Accounting and Economics, 29(3), 339–371.
Subramanyam, K. R. (1996). The pricing of discretionary accruals. Journal of Accounting and
Economics, 22(1–3), 249–281.
Thaler, R. (1988). Anomalies: The winner’s curse. Journal of Economics Perspectives, 2(1), 191–202.
Urcan, O., Radhakrishnan, S., & Demirkan, S. (2008). Earnings quality and excess value of
diversification. Working paper, London Business School.
Varaiya, N. (1988). The winner’s curse hypothesis and corporate takeovers. Managerial and Decision
Economics, 9(3), 209–219.
Venkatesh, P. C., & Chiang, R. (1986). Asymmetry and the dealer’s bid-ask spread: A case study of
earnings and dividend announcements. Journal of Finance, 41(5), 1089–1102.
Warfield, T. D., Wild, J. J., & Wild, K. L. (1995). Managerial ownership, accounting choices, and
informativeness of earnings. Journal of Accounting and Economics, 20(1), 61–91.
Watts, R. L., & Khan, M. (2009). Estimation and empirical properties of a firm-year measure of
conservatism. Journal of Accounting and Economics, 48(2–3), 132–150.
White, H. (1980). A heteroscedasticity-consistent covariance matrix estimator and a direct test for
heteroscedasticity. Econometrica, 48, 817–838.
Target’s earnings quality and bidders’ takeover decisions 1087
123
Author's personal copy