targeting tumour microenvironment: development of …
TRANSCRIPT
TARGETING TUMOUR MICROENVIRONMENT: DEVELOPMENT OF CARBONIC
ANHYDRASE IX NUCLEAR IMAGING AGENTS
by
Joseph Cheong Chun Lau
B.Sc., The University of British Columbia, 2011
A THESIS SUBMITTED IN PARTIAL FULFILLMENT OF
THE REQUIREMENTS FOR THE DEGREE OF
DOCTOR OF PHILOSOPHY
in
THE FACULTY OF GRADUATE AND POSTDOCTORAL STUDIES
(Interdisciplinary Oncology)
THE UNIVERSITY OF BRITISH COLUMBIA
(Vancouver)
August 2016
© Joseph Cheong Chun Lau, 2016
ii
Abstract
Tumour hypoxia has long been recognized as an impediment to radiotherapy and
chemotherapy. Cancers that are hypoxic tend to be aggressive, with high propensity for distant
metastasis. As hypoxia is a salient feature of most solid cancers, targeting components of the
hypoxia-induced signaling cascade has been proposed as a means for oncologic treatment. The
key enzyme mediating hypoxia-induced stress response in cancers is carbonic anhydrase IX
(CA-IX). Regulated by hypoxia-inducible factor 1α (HIF-1α), CA-IX catalyzes the reversible
hydration of carbon dioxide to bicarbonate ion. CA-IX promotes cancer cell survival by
transporting bicarbonate ions into the cell to maintain pH homeostasis during glycolysis. CA-IX
is well-established as a surrogate marker for cellular hypoxia. Overexpression of CA-IX has been
observed in a broad spectrum of cancers including: breast, cervix, ovarian, bladder, brain, colon,
lung, kidney, head and neck cancers. In healthy individuals, CA-IX is expressed at low levels
except in the gastrointestinal tract where it is involved in the process of cell differentiation. As
CA-IX is pathologically expressed by cancer cells and located at the cell surface, it has emerged
as a promising imaging/therapeutic target.
In this thesis, we communicate the development of molecular antigen recognition
molecules as potential radiotracers for CA-IX targeted nuclear imaging. We identified two
classes of sulfonamide derivatives that successfully delineated CA-IX expression in tumour-
bearing mice. Isoform selectivity, the major challenge for small molecule inhibitor-based
imaging, was achieved via a multivalent approach or by conjugating pharmacophores to
polyaminocarboxylate chelators. With good tumour-to-nontarget ratios and fast
pharmacokinetics, some of these agents warrant further investigation as surrogate hypoxia
imaging agents. Additionally we radiolabeled three novel monoclonal antibodies (mAbs) and one
affibody for CA-IX imaging, with one mAb in particular showing significant accumulation in
tumours. Collectively, this research provides a non-invasive platform to characterize and
quantify expression of CA-IX in primary lesions and across metastatic sites. The diagnostic
information can be readily integrated with emergent pharmaceuticals to increase effectiveness
and safety of CA-IX or hypoxia-directed treatments for cancer patients.
iii
Preface
A version of Chapter 2 has been published [Pan J, Lau J, Mesak F, Hundal N,
Pourghiasian M, Liu Z, Bénard F, Dedhar S, Supuran CT, Lin KS. Synthesis and evaluation of 18F-labeled carbonic anhydrase IX inhibitors for imaging with positron emission tomography. J
Enzyme Inhib Med Chem, 2014; 29(2):249-255]. Pan J and I were the lead investigators,
responsible for all major areas of concept formation, data collection and analysis, as well as the
majority of manuscript composition. Mesak F, Hundal N, Pourghiasian M, and Liu Z were
involved in radiochemistry and imaging experiments. Supuran CT provided the binding affinity
measurements. Bénard F, Dedhar S, Supuran CT, and Lin KS were the supervisory authors on
this project and were involved throughout the project in concept formation and manuscript
composition.
A version of Chapter 3 has been published [Lau J, Pan J, Zhang Z, Hundal N, Liu Z,
Bénard F, Lin KS. Synthesis and Evaluation of 18F-Labeled Tertiary Sulfonamides for Imaging
Carbonic Anhydrase IX expression in Tumours with Positron Emission Tomography. Bioorg
Med Chem Lett, 2014; 24(14):3064-3068]. I was the lead investigator, responsible for all major
areas of concept formation, data collection and analysis, as well as the majority of manuscript
composition. Pan J, Zhang Z, Hundal N, and Liu Z were involved in radiochemistry and imaging
experiments. Bénard F and Lin KS were the supervisory authors on this project and were
involved throughout the project in concept formation and manuscript composition.
A version of Chapter 4 has been published [Lau J, Liu Z, Lin KS, Pan J, Zhang Z, Vullo
D, Supuran CT, Perrin DM, Bénard F. Trimeric Radiofluorinated Sulfonamide Derivatives to
Achieve In Vivo Selectivity for Carbonic Anhydrase IX-Targeted Cancer Imaging. J Nuc Med,
2015;56(9): 1434-1440]. Liu Z and I were the lead investigators, responsible for all major areas
of concept formation, data collection and analysis, as well as the majority of manuscript
composition. Pan J, Zhang Z, and Vullo D were involved in binding affinity and radiochemistry
experiments. Lin KS, Supuran CT, Perrin DM, and Bénard F were the supervisory authors on
iv
this project and were involved throughout the project in concept formation and manuscript
composition.
A version of Chapter 5 has been published [Lau J, Zhang Z, Jenni S, Kuo HT, Liu Z,
Vullo D, Supuran CT, Lin KS, Bénard F. ET Imaging of Carbonic Anhydrase IX Expression of
HT-29 Tumor Xenograft Mice with 68Ga-Labeled Benzenesulfonamides. Mol Pharm,
2016;13(3): 1137-1146]. Zhang Z and I were the lead investigators, responsible for all major
areas of concept formation, data collection and analysis, as well as the majority of manuscript
composition. Jenni S, Kuo HT, Liu Z, and Vullo D were involved in binding affinity,
radiochemistry, and imaging experiments. Supuran CT, Lin KS, and Bénard F were the
supervisory authors on this project and were involved throughout the project in concept
formation and manuscript composition.
In Chapter 6, the CA-IX monoclonal antibodies were obtained through a collaboration
with Drs. Shoukat Dedhar (BC Cancer Agency), Anne Lenferink (National Research Council),
and Maureen O’Connor (National Research Council). Internal names are used for the antibodies.
The biological and physical characterizations of the antibodies were performed by Dr. Paul
McDonald (Dedhar’s Lab).
The research in this thesis was conducted under animal protocols A11-0238 and A11-
0185, which were approved by the Institutional Animal Care Committee of the University of
British Columbia in compliance with the Canadian Council on Animal Care Guidelines.
v
Table of Contents
Abstract .......................................................................................................................................... ii
Preface ........................................................................................................................................... iii
Table of Contents ...........................................................................................................................v
List of Tables ................................................................................................................................ xi
List of Figures .............................................................................................................................. xii
List of Abbreviations and Symbols .......................................................................................... xiv
Acknowledgements .................................................................................................................... xxi
Dedication .................................................................................................................................. xxii
Chapter 1: Introduction ................................................................................................................1
1.1 Nuclear Imaging.............................................................................................................. 1
1.1.1 Single Photon Emission Computed Tomography ....................................................... 3
1.1.2 Positron Emission Tomography .................................................................................. 3
1.1.2.1 Cancer Patient Management with PET ............................................................... 4
1.1.2.2 18F-FDG Imaging ................................................................................................ 5
1.1.3 Role of Functional Imaging in Personalized Cancer Medicine .................................. 5
1.2 Cancer and Tumour Microenvironment .......................................................................... 7
1.2.1 Hypoxia ....................................................................................................................... 7
1.2.1.1 Methods for Detection of Tumour Hypoxia ....................................................... 8
1.3 Carbonic Anhydrase IX as a Surrogate Marker of Hypoxia ........................................... 9
1.3.1 Biochemical Structure of CA-IX .............................................................................. 12
1.3.2 Physiological Function of CA-IX in Cancer ............................................................. 12
1.3.2.1 Intracellular pH Regulation and Survival ......................................................... 12
1.3.2.2 Cell Adhesion, Migration, Invasion, and Metastasis ........................................ 13
1.3.3 Regulation of CA-IX Activity and Abundance ........................................................ 13
1.3.4 Distribution of CA-IX in Normal Tissues and Malignancies ................................... 14
1.3.5 Tumour Models Used for CA-IX Imaging ............................................................... 15
1.3.6 CA-IX Nuclear Imaging Agents ............................................................................... 15
vi
1.3.6.1 Monoclonal Antibodies ..................................................................................... 16
1.3.6.2 Small Molecule Inhibitors ................................................................................. 16
1.3.6.3 Peptides ............................................................................................................. 18
1.3.6.4 Affibodies ......................................................................................................... 19
1.4 Other Imaging Modalities ............................................................................................. 20
1.4.1 Optical Imaging ........................................................................................................ 20
1.4.2 Magnetic Resonance ................................................................................................. 21
1.5 CA-IX Therapeutics in Clinical Development ............................................................. 21
1.6 Thesis Theme and Rationale ......................................................................................... 22
1.6.1 Objectives and Hypotheses ....................................................................................... 23
Chapter 2: 18F-labeled Carbonic Anhydrase IX Inhibitors for Imaging with Positron
Emission Tomography .................................................................................................................24
2.1 Introduction ................................................................................................................... 24
2.2 Materials and Methods .................................................................................................. 25
2.2.1 Chemicals and Instrumentation ................................................................................. 25
2.2.2 Synthesis of 7-(2-fluoroethoxy)coumarin (FEC) ...................................................... 25
2.2.3 Synthesis of 7-(2-tosyloxyethoxy)coumarin ............................................................. 26
2.2.4 Binding Affinity Measurement ................................................................................. 26
2.2.5 Radiosynthesis of 18F-FEC ....................................................................................... 27
2.2.6 Radiosynthesis of 18F-U-104..................................................................................... 28
2.2.7 Stability in Mouse Plasma ........................................................................................ 29
2.2.8 In Vivo Experiments ................................................................................................. 29
2.2.8.1 Tumour Implantation ........................................................................................ 29
2.2.8.2 Biodistribution Studies...................................................................................... 29
2.2.8.3 PET Imaging and Data Analysis: ...................................................................... 30
2.2.9 Immunohistochemistry ............................................................................................. 30
2.3 Results and Discussion ................................................................................................. 30
2.4 Conclusion .................................................................................................................... 36
Chapter 3: 18F-labeled Tertiary Substituted Sulfonamides for PET CA-IX Imaging ...........37
3.1 Introduction ................................................................................................................... 37
vii
3.2 Materials and Methods .................................................................................................. 38
3.2.1 Chemicals and Instrumentation ................................................................................. 38
3.2.2 Syntheses of Precursors and Standards ..................................................................... 38
3.2.2.1 N-(2-hydroxypropyl)-4-methyl-N-(4-methylphenyl)benzenesulfonamide (2a) 38
3.2.2.2 N-(4-Acetylphenyl)-N-(2-hydroxypropyl)-4-methylbenzenesulfonamide (2b) 39
3.2.2.3 N-(4-Chlorophenyl)-N-(2-hydroxypropyl)-4-methylbenzenesulfonamide (2c) 39
3.2.2.4 4-Methyl-N-(4-methylphenyl)-N-(2-tosyloxypropyl)benzenesulfonamide (3a)
……………………………………………………………………………………………40
3.2.2.5 N-(4-Acetylphenyl)-4-methyl-N-(2-tosyloxypropyl)benzenesulfonamide (3b) 40
3.2.2.6 N-(4-Chlorophenyl)-4-methyl-N-(2-tosyloxypropyl)benzenesulfonamide (3c) 40
3.2.2.7 N-(2-Fluoropropyl)-4-methyl-N-(4-methylphenyl)benzenesulfonamide (4a) .. 41
3.2.2.8 N-(4-Acetylphenyl)-N-(2-fluoropropyl)-4-methylbenzenesulfonamide (4b) ... 41
3.2.2.9 N-(4-Chlorophenyl)-N-(2-fluoropropyl)-4-methylbenzenesulfonamide (4c) ... 42
3.2.3 Radiosyntheses of [18F]4a-c ...................................................................................... 42
3.2.4 Stability in Mouse Plasma ........................................................................................ 43
3.2.5 LogD7.4 Measurements.............................................................................................. 43
3.2.6 In Vivo Experiments ................................................................................................. 43
3.2.6.1 Tumour Implantation ........................................................................................ 44
3.2.6.2 PET Imaging and Biodistribution Studies ........................................................ 44
3.3 Results and Discussion ................................................................................................. 44
3.4 Conclusion .................................................................................................................... 49
Chapter 4: Multivalent Approach to Achieve In Vivo Selectivity for CA-IX ........................50
4.1 Introduction ................................................................................................................... 50
4.2 Methods and Materials .................................................................................................. 52
4.2.1 HPLC Analysis ......................................................................................................... 53
4.2.2 Synthesis of Azidoacetyl-AEBS (1) ......................................................................... 53
4.2.3 Synthesis of Azidoacetyl-ABS (2) ............................................................................ 54
4.2.4 Synthesis of AmBF3-AEBS ...................................................................................... 54
4.2.5 Synthesis of AmBF3-ABS......................................................................................... 54
4.2.6 Synthesis of AmBF3-(AEBS)3 .................................................................................. 55
viii
4.2.7 Synthesis of AmBF3-(ABS)3..................................................................................... 55
4.2.8 Binding Affinity Measurements ............................................................................... 55
4.2.9 Radiolabeling ............................................................................................................ 56
4.2.10 Stability in Mouse Plasma .................................................................................... 56
4.2.11 LogD7.4 measurements .......................................................................................... 56
4.2.12 In Vivo Experiments ............................................................................................. 57
4.2.12.1 Cell Line and Animal Model ........................................................................ 57
4.2.12.2 Biodistribution Studies.................................................................................. 57
4.2.12.3 PET/CT Imaging ........................................................................................... 57
4.2.12.4 Data Analysis ................................................................................................ 58
4.3 Results and Discussion ................................................................................................. 58
4.4 Conclusion .................................................................................................................... 66
Chapter 5: Polyaminocarboxylate Conjugated Sulfonamides for 68Ga-labeling and PET
Imaging .........................................................................................................................................68
5.1 Introduction ................................................................................................................... 68
5.2 Methods......................................................................................................................... 70
5.2.1 Reagents and Instrumentation ................................................................................... 70
5.2.2 Chemistry and Radiolabeling .................................................................................... 71
5.2.2.1 Synthesis of 1,4,7,10-tetraazacyclododecane-1,4,7-tris(t-butylacetate)-10-p-
sulfonamidophenylethylacetamide (2) .............................................................................. 71
5.2.2.2 Synthesis of 1,4,7,10-tetraazacyclododecane-1,4,7-triacetic acid, 10-p-
sulfonamidophenylethylacetamide (DOTA-AEBSA, 3) .................................................. 72
5.2.2.3 Synthesis of 1,4,7,10-tetraazacyclododecane-1,4-bis(t-butylacetate)-7,10-bis-p-
sulfonamidophenylethylacetamide (6) .............................................................................. 72
5.2.2.4 Synthesis of 1,4,7,10-tetraazacyclododecane-1,7-diacetic acid, 4,10-bis-p-
sulfonamidophenylethylacetamide (DOTA-(AEBSA)2, 7) .............................................. 73
5.2.2.5 Synthesis of 1,4,7-triazacyclononane-1,4,7-tris-glutamic acid-α-tert-butyl ester-
γ-p-sulfonamidophenylethylamide (10) ............................................................................ 73
5.2.2.6 Synthesis of 1,4,7-triazacyclononane-1,4,7-tris-glutamic acid-γ-p-
sulfonamidophenylethylamide (NOTGA-(AEBSA)3, 11) ................................................ 74
ix
5.2.2.7 General Procedure for the Synthesis of Cold Gallium Standard ...................... 74
5.2.2.8 General Procedure for the Synthesis of 68Ga Tracers ....................................... 75
5.2.3 Binding Affinity Measurement ................................................................................. 75
5.2.4 Stability in Mouse Plasma ........................................................................................ 75
5.2.5 Lipophilicity Measurement ....................................................................................... 76
5.2.6 Cell Line.................................................................................................................... 76
5.2.7 Immunofluorescence of HT-29 Colonies .................................................................. 76
5.2.8 PET Imaging and Biodistribution Studies ................................................................ 77
5.2.9 Statistical Analysis .................................................................................................... 78
5.3 Results and Discussion ................................................................................................. 78
5.4 Conclusion .................................................................................................................... 86
Chapter 6: Antibodies and Antibody Mimetics for Imaging – Pilot Studies ..........................88
6.1 Introduction ................................................................................................................... 88
6.2 Materials and Methods .................................................................................................. 90
6.2.1 Conjugation of p-SCN-Bn-DTPA to mAbs .............................................................. 90
6.2.2 111In Radiolabeling for p-SCN-Bn-DTPA-mAbs ..................................................... 90
6.2.3 Synthesis of Cys-Z09781 .......................................................................................... 91
6.2.4 Conjugation of NOTA to Cys-Z09781 ..................................................................... 91
6.2.5 68Ga Radiolabeling for Cys[NOTA]-Z09781 ........................................................... 92
6.2.6 In Vivo Evaluations .................................................................................................. 92
6.2.6.1 Biodistribution Studies...................................................................................... 92
6.2.6.2 SPECT/CT Imaging .......................................................................................... 93
6.2.6.3 PET/CT Imaging ............................................................................................... 93
6.3 Results and Discussion ................................................................................................. 94
6.4 Conclusion .................................................................................................................. 102
Chapter 7: Conclusion ...............................................................................................................104
7.1 Summary of Study and Findings................................................................................. 104
7.2 Strengths and Limitations of this Study ...................................................................... 105
7.3 Overall Significance and Implications of Research Finding ...................................... 106
7.4 Future Research Directions ......................................................................................... 106
x
7.4.1 Design of Cationic Sulfonamides ........................................................................... 106
7.4.2 CA-IX Tracers as Surrogate Hypoxia Imaging Agents .......................................... 107
7.4.3 Radiotherapy ........................................................................................................... 108
7.4.4 Clinical Translation of CA-IX Imaging Agents ...................................................... 108
Bibliography ...............................................................................................................................110
Appendix .....................................................................................................................................127
xi
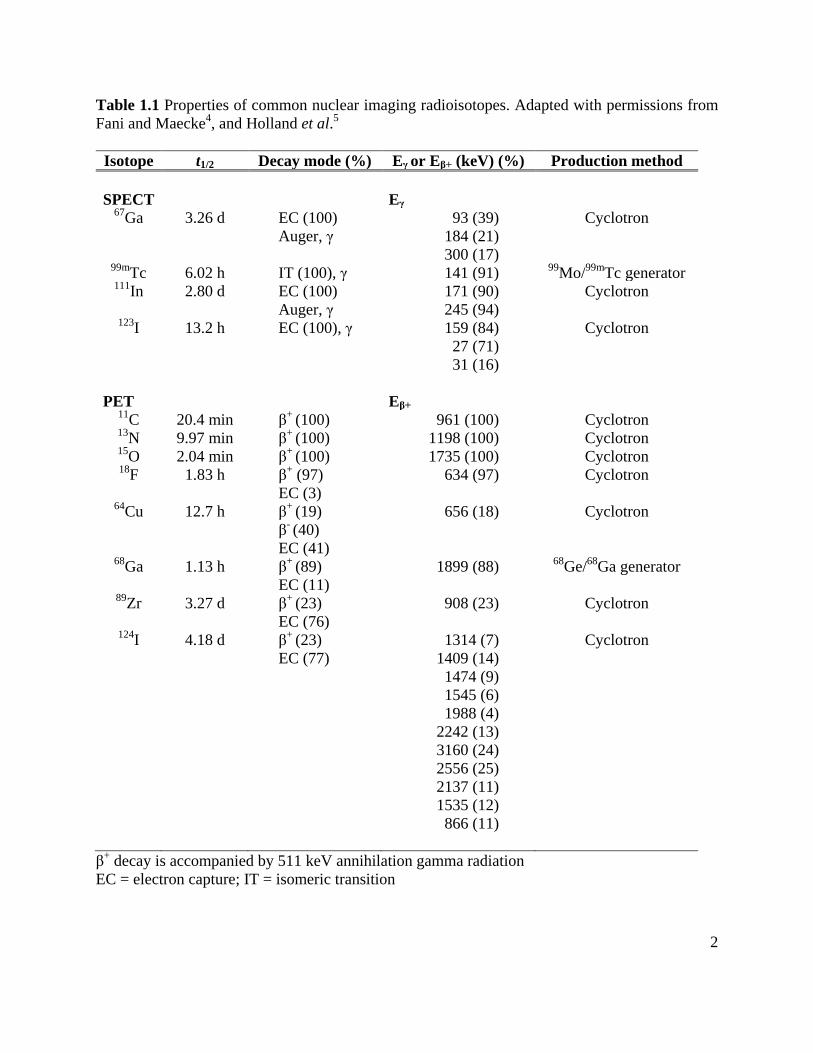
List of Tables
Table 1.1 Properties of common nuclear imaging radioisotopes. .................................................. 2
Table 1.2 Organ/tissue distribution, subcellular localization, CO2 hydrase activity, and affinity
for sulfonamides of the 15 human carbonic anhydrases ............................................................... 11
Table 1.3 CA-IX tissue microarray studies .................................................................................. 15
Table 1.4 CA-IX therapeutic agents in clinical development ...................................................... 22
Table 2.1 Biodistribution data (1 h p.i.; n = 4) of 18F-FEC and 18F-U-104 in NSG mice bearing
HT-29 human colorectal tumour xenografts ................................................................................. 34
Table 3.1 Biodistribution data (1 h p.i.; n = 4) of [18F]4a-c in NSG mice bearing HT-29 human
colorectal tumour xenografts ........................................................................................................ 46
Table 3.2 Reported inhibition constants (Ki, nM) of acetazolamide, HS680, U-104, and tertiary
sulfonamides 4a-c to human CA isoenzymes I, II, IX, XII .......................................................... 49
Table 4.1 HPLC conditions for AmBF3 sulfonamides ................................................................. 53
Table 4.2 Inhibition constants of 18F-AmBF3-sulfonamides to human CA isoenzymes I, II, IX
and XII .......................................................................................................................................... 60
Table 4.3 Biodistribution and tumour-to-nontarget ratios for 18F-AmBF3 sulfonamides ............ 64
Table 5.1 HPLC conditions used for purification, QC and plasma stability assays .................... 71
Table 5.2 Molecular weight and radiolabeling data of 68Ga CA-IX inhibitors ............................ 80
Table 5.3 Binding affinity (Ki) of sulfonamide inhibitors to CA-I, CA-II, CA-IX and CA-XII
were determined via a stopped-flow CO2 hydration assays .......................................................... 81
Table 5.4 Biodistribution and tumour-to-nontarget ratios for 68Ga CA-IX inhibitors ................. 84
Table 6.1 Characterization of mAbs raised against the extracellular domain of CA-IX ............. 89
Table 6.2 Biodistribution and tumour-to-nontarget ratios for 111In-SCN-Bn-DTPA-mAbs ........ 99
Table 6.3 Biodistribution of radiolabeled cG250 immunoconjugates ....................................... 100
xii
List of Figures
Figure 1.1 MicroPET and microSPECT scanners used for preclinical imaging studies at the BC
Cancer Research Centre .................................................................................................................. 1
Figure 1.2 Breast cancer PET imaging with 18F-FDG and 18F-fluoroestradiol ............................. 5
Figure 1.3 Molecular structures of four commonly used 18F-labeled hypoxia PET tracers in the
clinic ................................................................................................................................................ 9
Figure 1.4 Regulation of HIF-1α by proline hydroxylation ......................................................... 10
Figure 1.5 Crystal structure of the catalytic domain of CA-IX ................................................... 12
Figure 1.6 Structures of small molecule inhibitors proposed or used for CA-IX imaging .......... 18
Figure 2.1 Chemical structures of 7-(2-fluoroethoxy)coumarin (Left) and U-104 (Right) ......... 24
Figure 2.2 Synthetic scheme for the preparation of FEC and its radiolabeling precursor ........... 31
Figure 2.3 Radiosynthesis of (A) 18F-FEC and (B) 18F-U-104 .................................................... 32
Figure 2.4 CA-IX expression in HT-29 colorectal cancer model ................................................ 33
Figure 2.5 Representative PET image of 18F-FEC in HT-29 xenograft mice at 55 min p.i. ........ 34
Figure 2.6 Time-activity curve of 18F-FEC in tumour and selected organs/tissues ..................... 35
Figure 2.7 (A) Metabolism of 7-ethoxycoumarin and (B) proposed metabolism of 18F-FEC by
ECOD ............................................................................................................................................ 35
Figure 3.1 Chemical structures of fluorinated tertiary substituted sulfonamides ........................ 37
Figure 3.2 Syntheses of (A) precursors 3a-c and (B-C) standards 4a-c of tertiary sulfonamide
CA-IX inhibitors, and (D) their 18F-labeled analogs [18F]4a-c ..................................................... 45
Figure 3.3 Representative PET maximum intensity projection images of [18F]4a-c at 1 h p.i. in
NSG mice bearing CA-IX expressing HT-29 human colorectal tumour xenografts .................... 48
Figure 4.1 Chemical structures of 18F-AmBF3-AEBS, 18F-AmBF3-ABS, 18F-AmBF3-(AEBS)3
and 18F-AmBF3-(ABS)3 ................................................................................................................ 51
Figure 4.2 Synthesis of (A) azidoacetyl-AEBS 1, (B) azidoacetyl-ABS 2, (C) AmBF3-AEBS and
AmBF3-ABS, and (D) AmBF3-(AEBS)3 and AmBF3-(ABS)3 ..................................................... 59
Figure 4.3 Radiosynthesis of (A) 18F-AmBF3-AEBS and 18F-AmBF3-ABS, and (B) 18F-AmBF3-
(AEBS)3 and 18F-AmBF3-(ABS)3 via 18F-19F isotope exchange reaction .................................... 62
xiii
Figure 4.4 Tumour-to-muscle ratios for 18F-AmBF3 sulfonamides at 1 h p.i. ............................. 65
Figure 4.5 PET/CT images of monomeric 18F-sulfonamides at 1 h p.i. ...................................... 65
Figure 4.6 PET/CT images of trimeric 18F-sulfonamides at 1 h p.i. ............................................ 66
Figure 5.1 Chemical structures of 68Ga-DOTA-AEBSA, 68Ga-DOTA-(AEBSA)2 and 68Ga-
NOTGA-(AEBSA)3 ...................................................................................................................... 69
Figure 5.2 Synthetic scheme for precursors and cold standards .................................................. 79
Figure 5.3 Stability of 68Ga CA-IX inhibitors in mouse plasma .................................................. 80
Figure 5.4 CA-IX expression in HT-29 colorectal cancer model. ............................................... 82
Figure 5.5 Maximal intensity projections of PET/CT and PET with 68Ga tracers at 1 h p.i. ....... 82
Figure 5.6 Two-way ANOVA analysis of tumour/muscle ratio, kidney and liver uptake for 68Ga
CA-IX inhibitors ........................................................................................................................... 83
Figure 5.7 Longitudinal study: uptake of 68Ga-DOTA-AEBSA in HT-29 tumour xenograft
increases as tumour grows ............................................................................................................ 85
Figure 6.1 Engineered protein scaffolds ...................................................................................... 89
Figure 6.2 DTPA conjugations for mAbs .................................................................................... 94
Figure 6.3 Typical radiochromatogram of an 111In radiolabeled mAb, before and after centrifugal
filtration to remove unbound radioisotopes .................................................................................. 95
Figure 6.4 Sequential SPECT/CT images obtained with 111In-SCN-Bn-DTPA-Ab01 and 111In-
SCN-Bn-DTPA-Ab02 ................................................................................................................... 96
Figure 6.5 Sequential SPECT/CT images obtained with 111In-SCN-Bn-DTPA-Ab03 and 111In-
SCN-Bn-DTPA-IgG ..................................................................................................................... 97
Figure 6.6 Site-specific conjugation of NOTA to Cys-Z09781 ................................................. 101
Figure 6.7 PET/CT images of 68Ga-Cys[NOTA]-Z09781 at 2 h p.i. ......................................... 102
Figure 6.8 Biodistribution of 68Ga-Cys[NOTA]-Z09781 in tumour and selected organs at 2 h p.i.
(n = 6) .......................................................................................................................................... 102
Figure 7.1 Maximal intensity projections of PET/CT (Left) and PET alone (Right) with 18F-
FMISO at 3 h p.i. ........................................................................................................................ 107
xiv
List of Abbreviations and Symbols
%ID/g Percentage of injected radioactive dose per gram of tissue
α Alpha particle
β+ Positron
β- Beta particle
γ Gamma ray
°C Degrees Celsius
A Ampere
aa Amino acid
ABS 4-Aminobenzenesulfonamide
ADC Antibody-drug conjugate
ADCC Antibody-dependent cell-mediated cytotoxicity
ADCP Antibody-dependent cell phagocytosis
AEBS 4-(2-Aminoethyl)benzenesulfonamide
AMP Adenosine monophosphate
ANOVA Analysis of variance
Au Arbitrary unit
AU Absorbance unit
AZA Acetazolamide
BCCA British Columbia Cancer Agency
Bn Benzyl
Boc tert-Butyloxycarbonyl protecting group
Bq Becquerel
BRCA1/2 Breast cancer 1/2 gene
CA Carbonic anhydrase
Calcd Calculated
cc Cubic centimeter
CCRCC Clear cell renal cell carcinoma
xv
CDC Complement dependent cytotoxicity
CDCl3 Deuterated chloroform
CH2Cl2 Dichloromethane
CH3CN Acetonitrile
Ci Curie
Cl- Chloride ion
CML Chronic myeloid leukemia
CO2 Carbon dioxide
CT Computed tomography
CuSO4 Copper sulfate
Cys Cysteine
d Day
Da Dalton
DAST Diethylaminosulfur trifluoride
DCC N,N’-Dicyclohexylcarbodiimine
DI Deionized
DIEA N,N-Diisopropylethylamine
Df Desferrioxamine
DMF N,N-Dimethylformamide
DNA Deoxyribose nucleic acid
DOTA 1,4,7,10-Tetraazacyclododecane-N,N′,N″,N‴-tetraacetic acid
DTPA Diethylenetriaminepentaacetic acid
E-I Enzyme-Inhibitor
EC Electron capture
ECOD 7-Ethoxycoumarin O-deethylase
EDC•HCl N-(3-Dimethylaminopropyl)-N′-ethylcarbodiimide hydrochloride
EDT Ethane dithiol
EF5 2-(2-Nitro-1H-imidazol-1-yl)-N-(2,2,3,3,3-pentafluoropropyl)acetamide
EGF Epidermal growth factor
EGFR Epidermal growth factor receptor
xvi
ELISA Enzyme-linked immunosorbent assay
EMT Epithelial mesenchymal transition
EOS End of synthesis
EPR Enhanced permeability and retention
eq Equivalent
ER Estrogen receptor
ESI Electronspray ionization
EtOAc Ethyl acetate
eV Electron volt
FAZA Fluoroazomycin-arabinofuranoside
FEC 7-(2-Fluoroethoxy)coumarin
FDA The Food and Drug Administration 18F-FDG 2-Deoxy-2-[18F]fluoro-D-glucose
Fe3O4 Iron oxide
FMISO Fluoromisonidazole
Fmoc Fluorenylmethyloxycarbonyl
g Gram
GLP Good laboratory practice
h Hour
H+ Hydrogen ion/proton
H2O Water
HBTU 3-[Bis(dimethylamino)methyliumyl]-3H-benzotriazol-1-oxide
hexafluorophosphate
HCl Hydrochloric acid
HCO3- Bicarbonate ion
He Helium gas
HEPES 4-(2-Hydroxyethyl)-1-piperazineethanesulfonic acid
HER2 Human epidermal growth factor 2 receptor
HER3 Human epidermal growth factor 3 receptor
HIF-1α/β Hypoxia-inducible factor 1 alpha/beta
xvii
HIF-2α Hypoxia-inducible factor 2 alpha
HF Hydrogen fluoride
HOBt Hydroxybenzotriazole
HPLC High performance liquid chromatography
HRE Hypoxia response element
HRP Horseradish peroxidase
HX4 Flortanidazole
i.v. Intravenous
IC50 Half maximal inhibitory concentration
IHC Immunohistochemistry
IGF-1R Insulin-like growth factor 1 receptor
IgG Immunoglobulin
IND Investigational New Drug
IRW Inveon Research Workplace software
IT Isomeric transition
K222 Kryptofix 222
Ki Inhibition constant
Kd Dissociation constant
K2CO3 Potassium carbonate
L Litre
LET Linear energy transfer
LogD7.4 Log value of distribution coefficient at pH 7.4,
M Molar concentration
m Meter
m/z Mass-to-charge ratio
mAb Monoclonal antibody
MAG3 Mercaptoacetyltriglycine
MBHA 4-Methylbenzhydrylamine
MeOH Methanol
MIBG Metaiodobenzylguanidine
xviii
min Minute
MgSO4 Magnesium sulfate
mmHg Millimeter of mercury
mol Mole
mp Melting point
MR Magnetic resonance
MTT Molecular targeted therapies
MW Molecular weight
N2 Nitrogen gas
Na+ Sodium ion
NaBH4 Sodium borohydride
NaCl Sodium chloride
NaHCO3 Sodium bicarbonate
NaH2PO4 Monosodium phosphate
NaI Sodium iodide
NaN3 Sodium azide
NaOH Sodium hydroxide
Na2CO3 Sodium carbonate
Na2HPO4 Disodium phosphate
NH4OH Ammonium hydroxide
NHS N-Hydroxysuccinimde
NMR Nuclear magnetic resonance
NOTA 1,4,7-Triazacyclononane-1,4,7-trisacetic acid
NOTGA 1,4,7-Triazacyclononane-1,4,7-tris-(glutaric acid)
NIR Near-infrared
NRC National Research Council
NSCLC Non-small cell lung carcinoma
NSG NOD.Cg-Prkdcscid Il2rgtm1Wjl/SzJ
PBS Phosphate-buffered saline
Pd/C Palladium on carbon
xix
PDGFRβ Beta-type platelet-derived growth factor receptor
PDX Patient derived xenograft
PET Positron emission tomography
PG Proteoglycan-like
pHi Intracellular pH
p.i. Post-injection
PI3K Phosphoinositide 3-kinase
PKA Protein kinase A
pO2 Partial pressure of oxygen
ROI Region of interest
rpm Revolutions per minute
s Second
SbF5 Antimony pentafluoride
SCN Isothiocyanate
SD Standard deviation
SEC Size-exclusion column
SPECT Single photon emission computed tomography
t1/2 Physical half-life
tR Retention time
TBAF Tetrabutylammonium fluoride
TBAHCO3 Tetrabutylammonium bicarbonate
TCEP Tris(2-carboxyethyl)phosphine hydrochloride
TFA Trifluoroacetic acid
THF Tetrahydrofuran
TIS Triisopropylsilane
TMA Trimethylamine
TNFα Tumour necrosis factor alpha
TOF Time of flight
UBC University of British Columbia
UV Ultraviolet

xx
VEGF Vascular endothelial growth factor
VHL von Hippel-Lindau gene
WHO World Health Organization

xxi
Acknowledgements
I would like to thank my supervisor Dr. François Bénard for his guidance and support during my
research. Thank you for believing in me, and giving me the academic freedom to pursue my
research interests. I was constantly inspired by your passion and sagacity for cancer research.
You hold your students to the highest standard and I thank you for always demanding the best of
me.
My sincerest gratitude to the members of my supervisory committee: Drs. Kuo-Shyan Lin, Paul
Schaffer, and Urs Hafeli. Thank you for enriching my understanding of nuclear medicine, and
providing me with research and career advice. Special thanks to Dr. Samuel Aparicio for
introducing me to medical research as a Co-op student, and encouraging me to pursue a graduate
degree. I would like to thank all past and present members of the Bénard (NH, NC, MP, GMD,
HL, ID, GA, MC, FM, SJ, HM, KS, JZ, CCZ, JR, PT, JG, MV, WE, and JK) and Lin (JP, ZZ,
HTK, and SP) labs. Without your support and camaraderie, this project would not have been
successful.
I would like to acknowledge our collaborators, Drs. Shoukat Dedhar, Claudiu T. Supuran and
David M. Perrin, Anne Lenferink, Maureen O’Connor, and generous scholarship support from
the Canadian Institutes of Health Research Frederick Banting and Charles Best Canada Graduate
Scholarship Doctoral Award, the University of British Columbia Four Year Doctoral Fellowship,
and the RIX Family Leading Edge Student Award.
The research presented in this thesis was funded by the following granting agencies: Canadian
Institutes of Health Research, Canadian Cancer Society Research Institute, BC Cancer
Foundation, and BC Leading Edge Endowment Fund.
Finally, my deepest thanks to my friends and family for their unwavering love and support
throughout my years of education. Thank you for all of your sacrifices.

xxii
Dedication
To my parents, Anne Lau and James Lau.
1
Chapter 1: Introduction
1.1 Nuclear Imaging
Nuclear imaging modalities like positron emission tomography (PET) and single photon
emission tomography (SPECT) enable the visualization of pathological processes at high
resolution in real time1, 2. Both modalities use radioactive biomolecules (small molecule
inhibitors, peptides, antibodies, antibody mimetics etc.) as imaging agents to offer high
sensitivity and quantification capabilities2. Depending on the imaging agent administered, PET
and SPECT can be used to annotate drug target expression, or to understand biological
mechanisms that underlie different disease states. In combination with either computed
tomography (CT) or magnetic resonance (MR) to increase anatomic resolution or soft tissue
contrast respectively, PET plays an increasingly important role in cancer diagnosis and
management3. Functional imaging is particularly useful in the case of recurrent or metastatic
cancer, where biopsies may be scarce or unavailable. Given that inter- and intra-tumoural
heterogeneity can significantly affect potential response to treatment, the ability to systemically
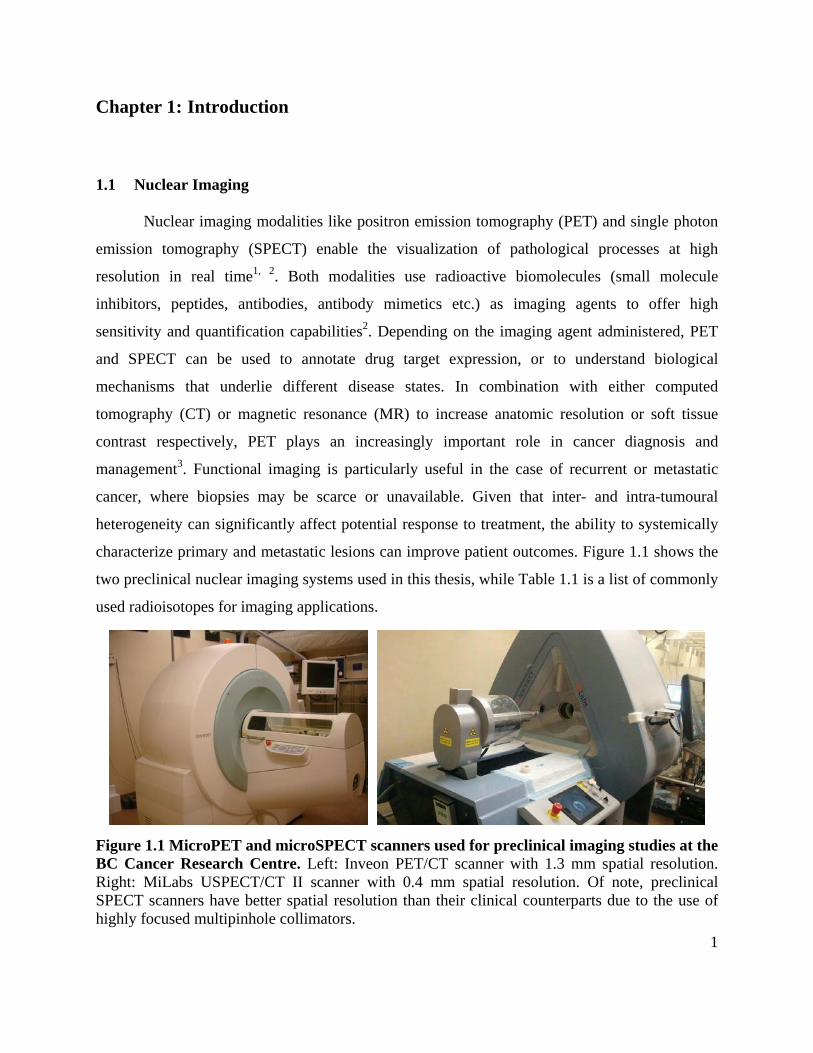
characterize primary and metastatic lesions can improve patient outcomes. Figure 1.1 shows the
two preclinical nuclear imaging systems used in this thesis, while Table 1.1 is a list of commonly
used radioisotopes for imaging applications.
Figure 1.1 MicroPET and microSPECT scanners used for preclinical imaging studies at the BC Cancer Research Centre. Left: Inveon PET/CT scanner with 1.3 mm spatial resolution. Right: MiLabs USPECT/CT II scanner with 0.4 mm spatial resolution. Of note, preclinical SPECT scanners have better spatial resolution than their clinical counterparts due to the use of highly focused multipinhole collimators.
2
Table 1.1 Properties of common nuclear imaging radioisotopes. Adapted with permissions from Fani and Maecke4, and Holland et al.5
Isotope t1/2 Decay mode (%) Eγ or Eβ+ (keV) (%) Production method SPECT
Eγ
67Ga 3.26 d EC (100) Auger, γ
93 (39) 184 (21) 300 (17)
Cyclotron
99mTc 6.02 h IT (100), γ 141 (91) 99Mo/99mTc generator 111In 2.80 d EC (100)
Auger, γ 171 (90) 245 (94)
Cyclotron
123I 13.2 h EC (100), γ
159 (84) 27 (71) 31 (16)
Cyclotron
PET Eβ+ 11C 20.4 min β+ (100) 961 (100) Cyclotron 13N 9.97 min β+ (100) 1198 (100) Cyclotron 15O 2.04 min β+ (100) 1735 (100) Cyclotron 18F 1.83 h β+ (97)
EC (3) 634 (97) Cyclotron
64Cu 12.7 h β+ (19)
β- (40)
EC (41)
656 (18) Cyclotron
68Ga 1.13 h β+ (89) EC (11)
1899 (88) 68Ge/68Ga generator
89Zr 3.27 d β+ (23) EC (76)
908 (23)
Cyclotron
124I 4.18 d β+ (23) EC (77)
1314 (7) 1409 (14) 1474 (9) 1545 (6) 1988 (4)
2242 (13) 3160 (24) 2556 (25) 2137 (11) 1535 (12) 866 (11)
Cyclotron
β+ decay is accompanied by 511 keV annihilation gamma radiation EC = electron capture; IT = isomeric transition
3
1.1.1 Single Photon Emission Computed Tomography
SPECT imaging is performed by administrating a gamma-emitting radioisotope into a
patient, usually by an intravenous injection2, 6. The radioactive decay of the radionuclide emits
single non-directional photons that are detected by gamma cameras. The detected signals are
reconstructed using computer algorithms to generate 2D projections or 3D data sets. SPECT is
widely used clinically due to the availability of 99mTc (99Mo/99mTc generators), an isotope used in
over 80% of nuclear medicine procedures7. SPECT instruments have a large clinical base and are
used routinely for procedures such as bone scans (99mTc-methyl disphosponate)8, 9, myocardial
perfusion imaging (99mTc-tetrofosmin or 99mTc-sestamibi)10-12, and functional brain imaging
(99mTc-exametazime)13. Since single photon emitters are non-directional, lead collimators are
used in clinical instruments to block emissions that are not perpendicular to the detector. This
leads to lower sensitivity and relatively poor spatial resolution, which reduces the detection rate
of small tumours. However, SPECT remains a viable option for imaging selected cancers. For
example, 123I-metaiodobenzylguanidine (123I-MIBG) is an iodinated norepinephrine analogue
that targets the norepinephrine transporters14. An 123I-MIBG scan is a highly specific test used to
detect neuroectodermally derived tumours like pheochromocytoma, ganglioneuroma,
ganglioneuroblastoma, paraganglioma, carcinoid tumour and neuroblastoma15. With continued
improvement in collimation technologies, image reconstruction and processing methods, SPECT
may soon have an expanded role in cancer management6.
1.1.2 Positron Emission Tomography
PET imaging adheres to similar principles to SPECT, with the main difference being the
utilization of positron emitters instead of single photon emitters2. Positron particles (β+, anti-
electrons) are emitted upon decay, and travel a short distance before interacting with electrons2.
An interaction event leads to the annihilation of both a positron and an electron, and produces
two 511 keV photons ejected at almost exactly 180° apart2. Simultaneous detection of these two
photons enables the instrument to replace physical collimation with coincidence detection,
greatly enhancing spatial resolution and sensitivity2. The paired coincidence events are used for
image reconstruction to localize the source of β+ emission in the patient2. Compared to SPECT
instruments, clinical PET scanners are more sensitive, and produce higher contrast images,
4
leading to improved diagnostic accuracy2. Commonly used PET isotopes include 11C (t1/2: 20.4
min), 18F (t1/2: 1.83 h), 68Ga (t1/2: 1.13 h). 64Cu (t1/2: 12.7 h), 124I (t1/2: 4.18 d), 89Zr (t1/2: 3.27 d). 18F is the most popular PET isotope due to its ease of production via a medical cyclotron, and the
widespread use of 18F-FDG for cancer assessment. 68Ga is obtained from commercially available 68Ge/68Ga generator. Together with 64Cu, these isotopes are commonly used for radiolabeling
peptide derivatives/small molecules for cancer imaging. With relatively long half-lives, 89Zr and 124I are mainly used for labeling monoclonal antibodies that have long circulation times.
1.1.2.1 Cancer Patient Management with PET
PET has a significant role in cancer management including diagnosis and staging,
treatment planning, and treatment monitoring. PET is widely considered as a cost-effective
diagnostic modality for many cancers including lung cancer, colorectal cancer, and
lymphomas16. In a large prospective study (22975 scans at 1178 centers in USA), Hillner et al.
reported that PET imaging changed the intended patient management in > 36.5% of all cases17. A
change in management strategy is defined as a change in intended treatment (ex. from surgery to
chemotherapy) or in treatment intent (ex. from curative to palliative). Up to 70% of the patients
were able to avoid invasive surgical procedures after imaging17. While the primary objective of a
PET scan is to facilitate informed decision making by patients and oncologists, this does not
always result in improved outcomes. Patient outcomes are mostly predicated on the efficacy of
available therapeutic options, and there are situations where the best medical course for a patient
is palliative care.
In Canada, there are currently 45 publicly funded PET scanners in 34 centers across the
ten provinces18. Based on a national report, 62668 PET scans were performed from 2011 to
201218. The primary application for PET is oncology, with selected provinces offering scanning
services for cardiology and neurology18. Our institution, the British Columbia Cancer Agency
(BCCA), houses 2 clinical scanners and is funded to perform a total of 7775 scans per year. The
demand and utilization for PET/CT is expected to grow with the continually increasing cancer
incidence rates.
5
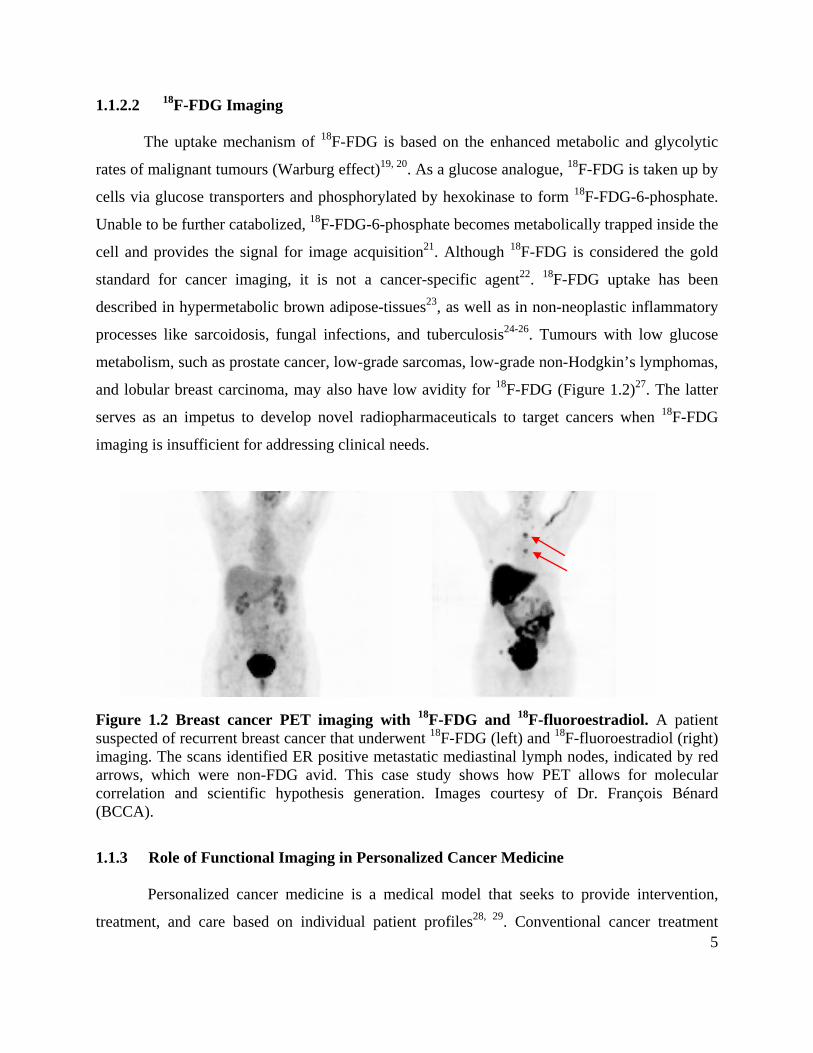
1.1.2.2 18F-FDG Imaging
The uptake mechanism of 18F-FDG is based on the enhanced metabolic and glycolytic
rates of malignant tumours (Warburg effect)19, 20. As a glucose analogue, 18F-FDG is taken up by
cells via glucose transporters and phosphorylated by hexokinase to form 18F-FDG-6-phosphate.
Unable to be further catabolized, 18F-FDG-6-phosphate becomes metabolically trapped inside the
cell and provides the signal for image acquisition21. Although 18F-FDG is considered the gold
standard for cancer imaging, it is not a cancer-specific agent22. 18F-FDG uptake has been
described in hypermetabolic brown adipose-tissues23, as well as in non-neoplastic inflammatory
processes like sarcoidosis, fungal infections, and tuberculosis24-26. Tumours with low glucose
metabolism, such as prostate cancer, low-grade sarcomas, low-grade non-Hodgkin’s lymphomas,
and lobular breast carcinoma, may also have low avidity for 18F-FDG (Figure 1.2)27. The latter
serves as an impetus to develop novel radiopharmaceuticals to target cancers when 18F-FDG
imaging is insufficient for addressing clinical needs.
Figure 1.2 Breast cancer PET imaging with 18F-FDG and 18F-fluoroestradiol. A patient suspected of recurrent breast cancer that underwent 18F-FDG (left) and 18F-fluoroestradiol (right) imaging. The scans identified ER positive metastatic mediastinal lymph nodes, indicated by red arrows, which were non-FDG avid. This case study shows how PET allows for molecular correlation and scientific hypothesis generation. Images courtesy of Dr. François Bénard (BCCA).
1.1.3 Role of Functional Imaging in Personalized Cancer Medicine
Personalized cancer medicine is a medical model that seeks to provide intervention,
treatment, and care based on individual patient profiles28, 29. Conventional cancer treatment
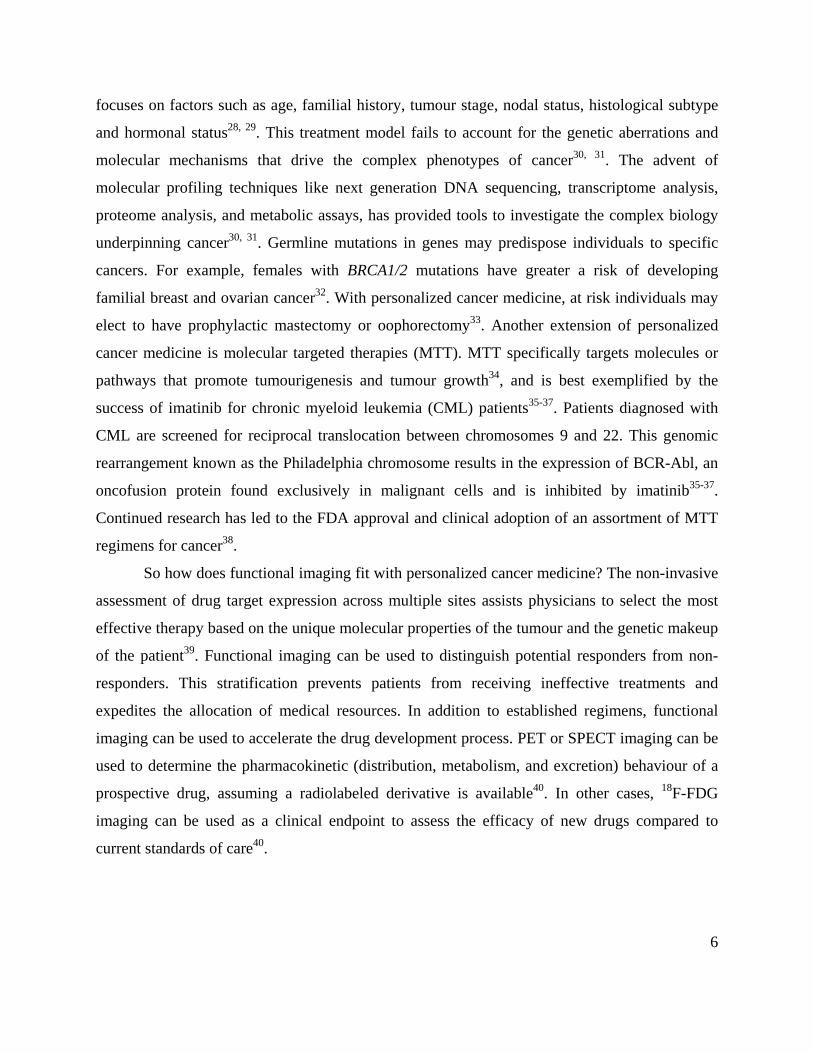
6
focuses on factors such as age, familial history, tumour stage, nodal status, histological subtype
and hormonal status28, 29. This treatment model fails to account for the genetic aberrations and
molecular mechanisms that drive the complex phenotypes of cancer30, 31. The advent of
molecular profiling techniques like next generation DNA sequencing, transcriptome analysis,
proteome analysis, and metabolic assays, has provided tools to investigate the complex biology
underpinning cancer30, 31. Germline mutations in genes may predispose individuals to specific
cancers. For example, females with BRCA1/2 mutations have greater a risk of developing
familial breast and ovarian cancer32. With personalized cancer medicine, at risk individuals may
elect to have prophylactic mastectomy or oophorectomy33. Another extension of personalized
cancer medicine is molecular targeted therapies (MTT). MTT specifically targets molecules or
pathways that promote tumourigenesis and tumour growth34, and is best exemplified by the
success of imatinib for chronic myeloid leukemia (CML) patients35-37. Patients diagnosed with
CML are screened for reciprocal translocation between chromosomes 9 and 22. This genomic
rearrangement known as the Philadelphia chromosome results in the expression of BCR-Abl, an
oncofusion protein found exclusively in malignant cells and is inhibited by imatinib35-37.
Continued research has led to the FDA approval and clinical adoption of an assortment of MTT
regimens for cancer38.
So how does functional imaging fit with personalized cancer medicine? The non-invasive
assessment of drug target expression across multiple sites assists physicians to select the most
effective therapy based on the unique molecular properties of the tumour and the genetic makeup
of the patient39. Functional imaging can be used to distinguish potential responders from non-
responders. This stratification prevents patients from receiving ineffective treatments and
expedites the allocation of medical resources. In addition to established regimens, functional
imaging can be used to accelerate the drug development process. PET or SPECT imaging can be
used to determine the pharmacokinetic (distribution, metabolism, and excretion) behaviour of a
prospective drug, assuming a radiolabeled derivative is available40. In other cases, 18F-FDG
imaging can be used as a clinical endpoint to assess the efficacy of new drugs compared to
current standards of care40.
7
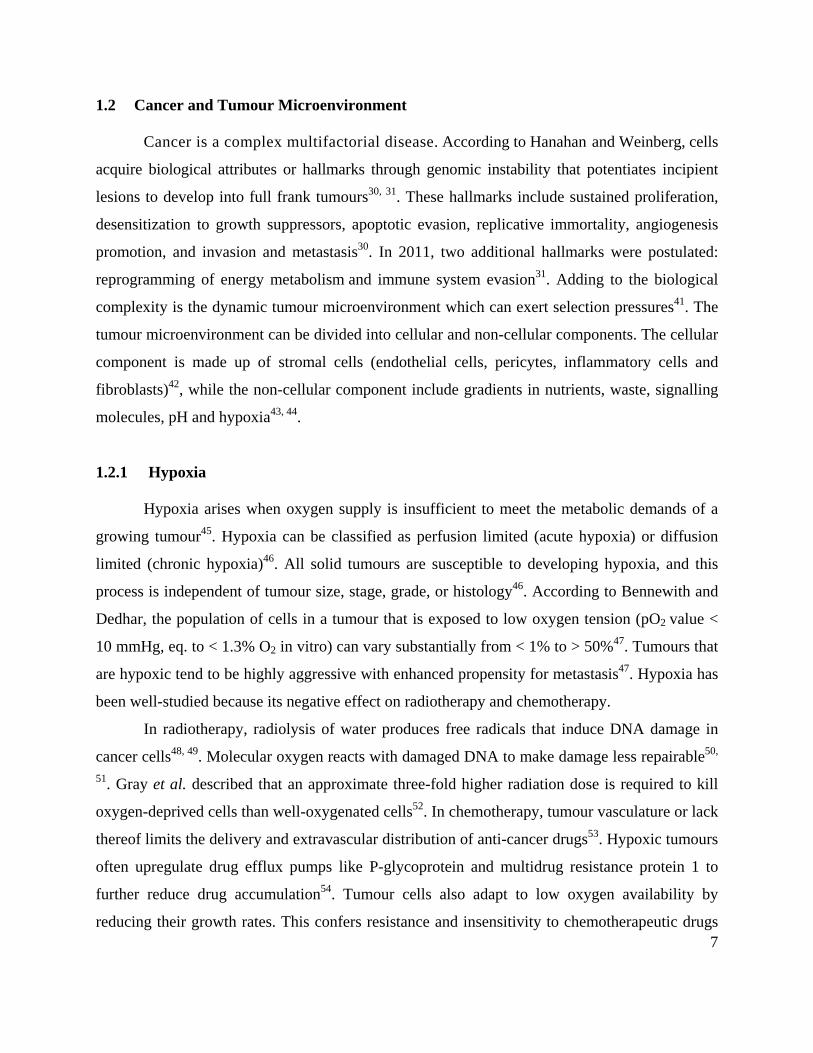
1.2 Cancer and Tumour Microenvironment
Cancer is a complex multifactorial disease. According to Hanahan and Weinberg, cells
acquire biological attributes or hallmarks through genomic instability that potentiates incipient
lesions to develop into full frank tumours30, 31. These hallmarks include sustained proliferation,
desensitization to growth suppressors, apoptotic evasion, replicative immortality, angiogenesis
promotion, and invasion and metastasis30. In 2011, two additional hallmarks were postulated:
reprogramming of energy metabolism and immune system evasion31. Adding to the biological
complexity is the dynamic tumour microenvironment which can exert selection pressures41. The
tumour microenvironment can be divided into cellular and non-cellular components. The cellular
component is made up of stromal cells (endothelial cells, pericytes, inflammatory cells and
fibroblasts)42, while the non-cellular component include gradients in nutrients, waste, signalling
molecules, pH and hypoxia43, 44.
1.2.1 Hypoxia
Hypoxia arises when oxygen supply is insufficient to meet the metabolic demands of a
growing tumour45. Hypoxia can be classified as perfusion limited (acute hypoxia) or diffusion
limited (chronic hypoxia)46. All solid tumours are susceptible to developing hypoxia, and this
process is independent of tumour size, stage, grade, or histology46. According to Bennewith and
Dedhar, the population of cells in a tumour that is exposed to low oxygen tension (pO2 value <
10 mmHg, eq. to < 1.3% O2 in vitro) can vary substantially from < 1% to > 50%47. Tumours that
are hypoxic tend to be highly aggressive with enhanced propensity for metastasis47. Hypoxia has
been well-studied because its negative effect on radiotherapy and chemotherapy.
In radiotherapy, radiolysis of water produces free radicals that induce DNA damage in
cancer cells48, 49. Molecular oxygen reacts with damaged DNA to make damage less repairable50,
51. Gray et al. described that an approximate three-fold higher radiation dose is required to kill
oxygen-deprived cells than well-oxygenated cells52. In chemotherapy, tumour vasculature or lack
thereof limits the delivery and extravascular distribution of anti-cancer drugs53. Hypoxic tumours
often upregulate drug efflux pumps like P-glycoprotein and multidrug resistance protein 1 to
further reduce drug accumulation54. Tumour cells also adapt to low oxygen availability by
reducing their growth rates. This confers resistance and insensitivity to chemotherapeutic drugs
8
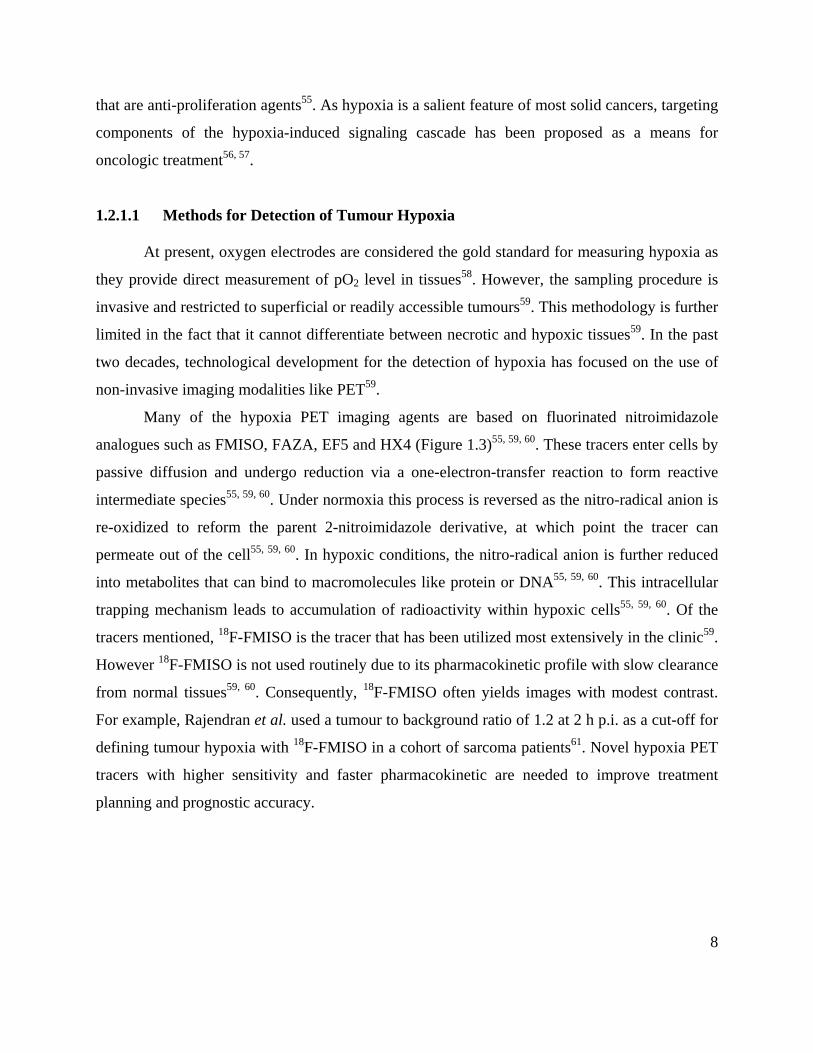
that are anti-proliferation agents55. As hypoxia is a salient feature of most solid cancers, targeting
components of the hypoxia-induced signaling cascade has been proposed as a means for
oncologic treatment56, 57.
1.2.1.1 Methods for Detection of Tumour Hypoxia
At present, oxygen electrodes are considered the gold standard for measuring hypoxia as
they provide direct measurement of pO2 level in tissues58. However, the sampling procedure is
invasive and restricted to superficial or readily accessible tumours59. This methodology is further
limited in the fact that it cannot differentiate between necrotic and hypoxic tissues59. In the past
two decades, technological development for the detection of hypoxia has focused on the use of
non-invasive imaging modalities like PET59.
Many of the hypoxia PET imaging agents are based on fluorinated nitroimidazole
analogues such as FMISO, FAZA, EF5 and HX4 (Figure 1.3)55, 59, 60. These tracers enter cells by
passive diffusion and undergo reduction via a one-electron-transfer reaction to form reactive
intermediate species55, 59, 60. Under normoxia this process is reversed as the nitro-radical anion is
re-oxidized to reform the parent 2-nitroimidazole derivative, at which point the tracer can
permeate out of the cell55, 59, 60. In hypoxic conditions, the nitro-radical anion is further reduced
into metabolites that can bind to macromolecules like protein or DNA55, 59, 60. This intracellular
trapping mechanism leads to accumulation of radioactivity within hypoxic cells55, 59, 60. Of the
tracers mentioned, 18F-FMISO is the tracer that has been utilized most extensively in the clinic59.
However 18F-FMISO is not used routinely due to its pharmacokinetic profile with slow clearance
from normal tissues59, 60. Consequently, 18F-FMISO often yields images with modest contrast.
For example, Rajendran et al. used a tumour to background ratio of 1.2 at 2 h p.i. as a cut-off for
defining tumour hypoxia with 18F-FMISO in a cohort of sarcoma patients61. Novel hypoxia PET
tracers with higher sensitivity and faster pharmacokinetic are needed to improve treatment
planning and prognostic accuracy.
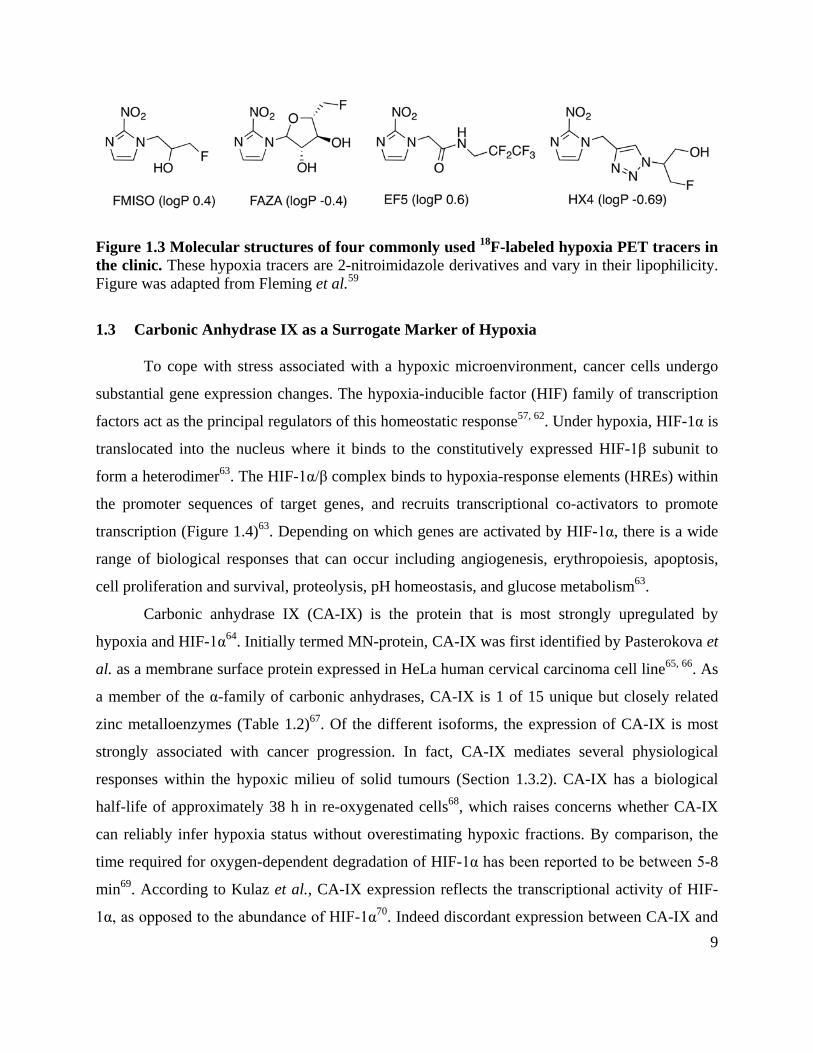
9
Figure 1.3 Molecular structures of four commonly used 18F-labeled hypoxia PET tracers in the clinic. These hypoxia tracers are 2-nitroimidazole derivatives and vary in their lipophilicity. Figure was adapted from Fleming et al.59
1.3 Carbonic Anhydrase IX as a Surrogate Marker of Hypoxia
To cope with stress associated with a hypoxic microenvironment, cancer cells undergo
substantial gene expression changes. The hypoxia-inducible factor (HIF) family of transcription
factors act as the principal regulators of this homeostatic response57, 62. Under hypoxia, HIF-1α is
translocated into the nucleus where it binds to the constitutively expressed HIF-1β subunit to
form a heterodimer63. The HIF-1α/β complex binds to hypoxia-response elements (HREs) within
the promoter sequences of target genes, and recruits transcriptional co-activators to promote
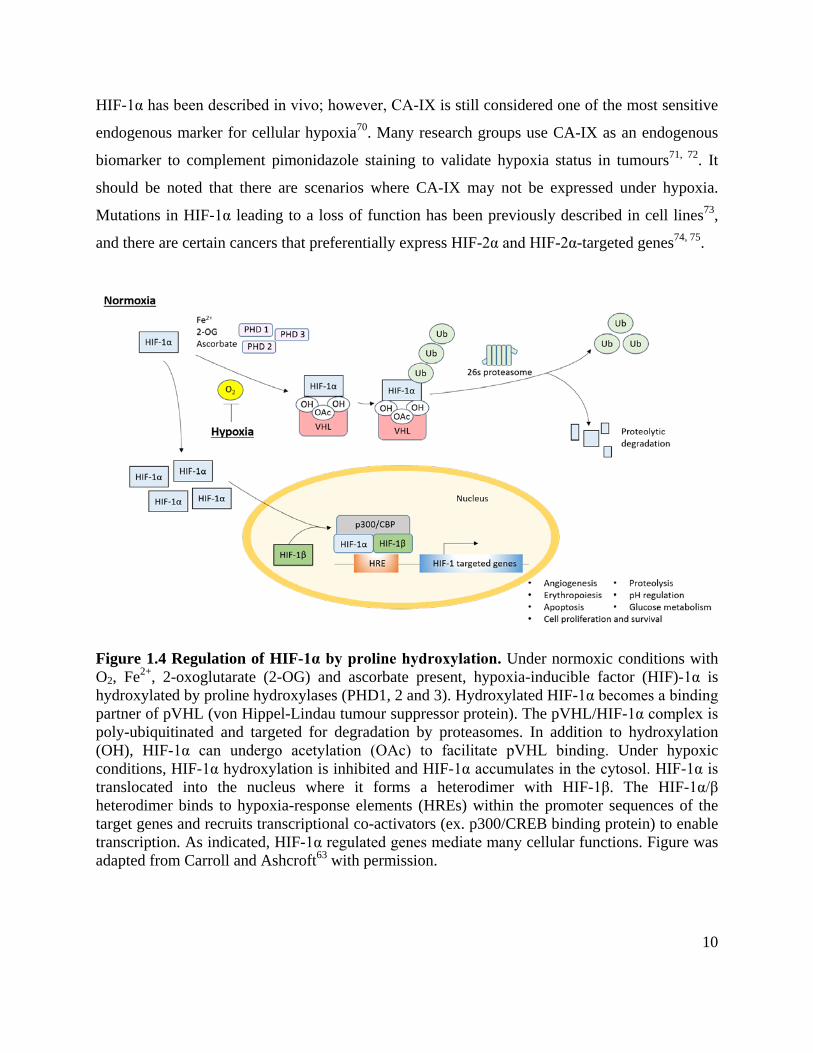
transcription (Figure 1.4)63. Depending on which genes are activated by HIF-1α, there is a wide
range of biological responses that can occur including angiogenesis, erythropoiesis, apoptosis,
cell proliferation and survival, proteolysis, pH homeostasis, and glucose metabolism63.
Carbonic anhydrase IX (CA-IX) is the protein that is most strongly upregulated by
hypoxia and HIF-1α64. Initially termed MN-protein, CA-IX was first identified by Pasterokova et
al. as a membrane surface protein expressed in HeLa human cervical carcinoma cell line65, 66. As
a member of the α-family of carbonic anhydrases, CA-IX is 1 of 15 unique but closely related
zinc metalloenzymes (Table 1.2)67. Of the different isoforms, the expression of CA-IX is most
strongly associated with cancer progression. In fact, CA-IX mediates several physiological
responses within the hypoxic milieu of solid tumours (Section 1.3.2). CA-IX has a biological
half-life of approximately 38 h in re-oxygenated cells68, which raises concerns whether CA-IX
can reliably infer hypoxia status without overestimating hypoxic fractions. By comparison, the
time required for oxygen-dependent degradation of HIF-1α has been reported to be between 5-8
min69. According to Kulaz et al., CA-IX expression reflects the transcriptional activity of HIF-
1α, as opposed to the abundance of HIF-1α70. Indeed discordant expression between CA-IX and
10
HIF-1α has been described in vivo; however, CA-IX is still considered one of the most sensitive
endogenous marker for cellular hypoxia70. Many research groups use CA-IX as an endogenous
biomarker to complement pimonidazole staining to validate hypoxia status in tumours71, 72. It
should be noted that there are scenarios where CA-IX may not be expressed under hypoxia.
Mutations in HIF-1α leading to a loss of function has been previously described in cell lines73,
and there are certain cancers that preferentially express HIF-2α and HIF-2α-targeted genes74, 75.
Figure 1.4 Regulation of HIF-1α by proline hydroxylation. Under normoxic conditions with O2, Fe2+, 2-oxoglutarate (2-OG) and ascorbate present, hypoxia-inducible factor (HIF)-1α is hydroxylated by proline hydroxylases (PHD1, 2 and 3). Hydroxylated HIF-1α becomes a binding partner of pVHL (von Hippel-Lindau tumour suppressor protein). The pVHL/HIF-1α complex is poly-ubiquitinated and targeted for degradation by proteasomes. In addition to hydroxylation (OH), HIF-1α can undergo acetylation (OAc) to facilitate pVHL binding. Under hypoxic conditions, HIF-1α hydroxylation is inhibited and HIF-1α accumulates in the cytosol. HIF-1α is translocated into the nucleus where it forms a heterodimer with HIF-1β. The HIF-1α/β heterodimer binds to hypoxia-response elements (HREs) within the promoter sequences of the target genes and recruits transcriptional co-activators (ex. p300/CREB binding protein) to enable transcription. As indicated, HIF-1α regulated genes mediate many cellular functions. Figure was adapted from Carroll and Ashcroft63 with permission.
11
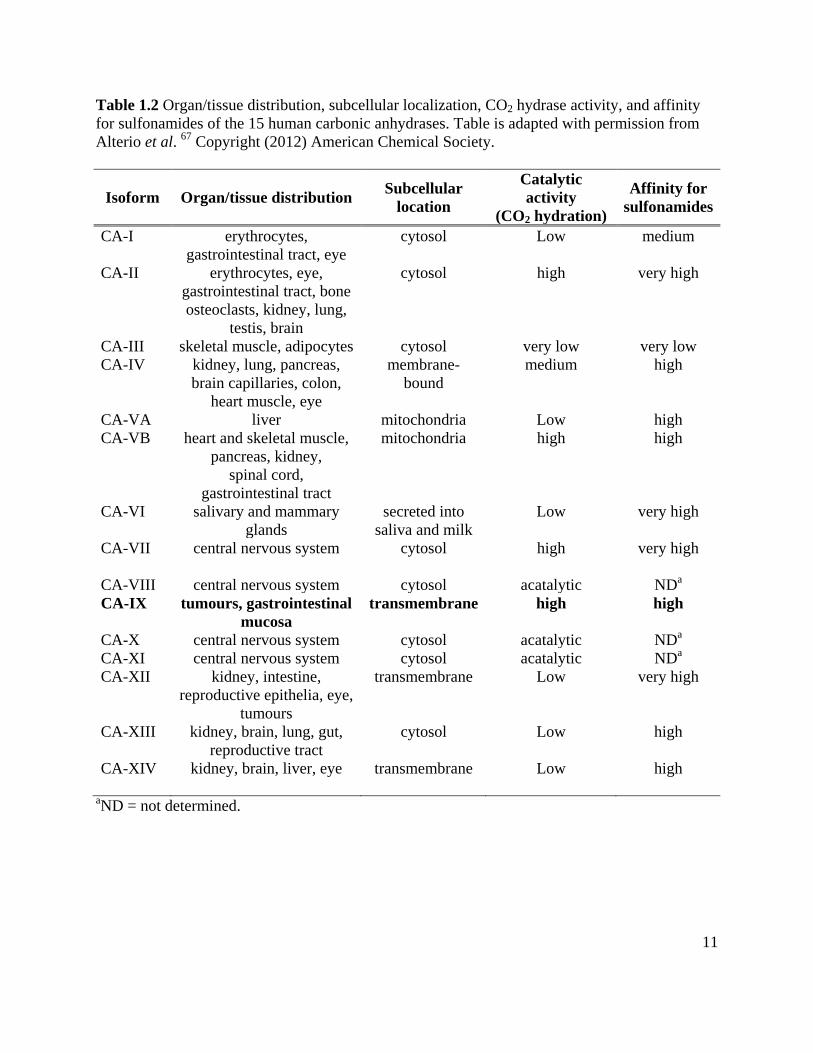
Table 1.2 Organ/tissue distribution, subcellular localization, CO2 hydrase activity, and affinity for sulfonamides of the 15 human carbonic anhydrases. Table is adapted with permission from Alterio et al. 67 Copyright (2012) American Chemical Society.
Isoform Organ/tissue distribution Subcellular location
Catalytic activity
(CO2 hydration)
Affinity for sulfonamides
CA-I erythrocytes, gastrointestinal tract, eye
cytosol Low medium
CA-II erythrocytes, eye, gastrointestinal tract, bone osteoclasts, kidney, lung,
testis, brain
cytosol high very high
CA-III skeletal muscle, adipocytes cytosol very low very low CA-IV kidney, lung, pancreas,
brain capillaries, colon, heart muscle, eye
membrane-bound
medium high
CA-VA liver mitochondria Low high CA-VB heart and skeletal muscle,
pancreas, kidney, spinal cord,
gastrointestinal tract
mitochondria high high
CA-VI salivary and mammary glands
secreted into saliva and milk
Low very high
CA-VII central nervous system cytosol high very high
CA-VIII central nervous system cytosol acatalytic NDa CA-IX tumours, gastrointestinal
mucosa transmembrane high high
CA-X central nervous system cytosol acatalytic NDa CA-XI central nervous system cytosol acatalytic NDa CA-XII kidney, intestine,
reproductive epithelia, eye, tumours
transmembrane Low very high
CA-XIII kidney, brain, lung, gut, reproductive tract
cytosol Low high
CA-XIV kidney, brain, liver, eye transmembrane Low high
aND = not determined.
12
1.3.1 Biochemical Structure of CA-IX
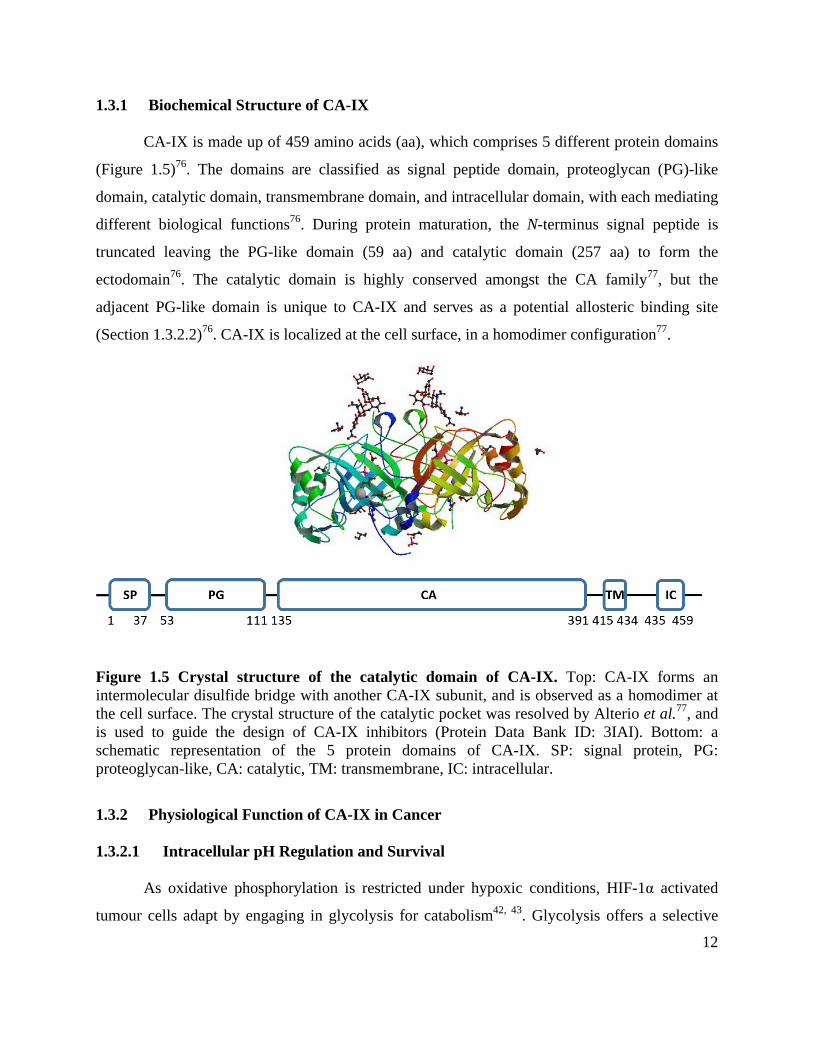
CA-IX is made up of 459 amino acids (aa), which comprises 5 different protein domains
(Figure 1.5)76. The domains are classified as signal peptide domain, proteoglycan (PG)-like
domain, catalytic domain, transmembrane domain, and intracellular domain, with each mediating
different biological functions76. During protein maturation, the N-terminus signal peptide is
truncated leaving the PG-like domain (59 aa) and catalytic domain (257 aa) to form the
ectodomain76. The catalytic domain is highly conserved amongst the CA family77, but the
adjacent PG-like domain is unique to CA-IX and serves as a potential allosteric binding site
(Section 1.3.2.2)76. CA-IX is localized at the cell surface, in a homodimer configuration77.
Figure 1.5 Crystal structure of the catalytic domain of CA-IX. Top: CA-IX forms an intermolecular disulfide bridge with another CA-IX subunit, and is observed as a homodimer at the cell surface. The crystal structure of the catalytic pocket was resolved by Alterio et al.77, and is used to guide the design of CA-IX inhibitors (Protein Data Bank ID: 3IAI). Bottom: a schematic representation of the 5 protein domains of CA-IX. SP: signal protein, PG: proteoglycan-like, CA: catalytic, TM: transmembrane, IC: intracellular.
1.3.2 Physiological Function of CA-IX in Cancer
1.3.2.1 Intracellular pH Regulation and Survival
As oxidative phosphorylation is restricted under hypoxic conditions, HIF-1α activated
tumour cells adapt by engaging in glycolysis for catabolism42, 43. Glycolysis offers a selective
13
advantage for cancer cells as byproducts can participate in downstream anabolic pathways78, 79.
However, this glycolytic switch also produces acidic metabolites that lower intracellular pH
(pHi). Disruption of pHi negatively impacts biological processes including membrane stability,
proliferation, and metabolism80. CA-IX is part of the cellular machinery that maintains pHi
homeostasis81-84. Like other CA isoforms, CA-IX is an efficient catalyst for the reversible
hydration of carbon dioxide to bicarbonate ion and proton (H2O + CO2 ↔ HCO3- + H+)81-84.
HCO3- ions are subsequently brought into the cell by transporter systems (ex. Na+/ HCO3
-
cotransporter, Na+ dependent Cl-/ HCO3- exchanger, anion exchanger) to maintain an alkaline
pHi80. Attenuation of CA-IX activity within hypoxic niches by either small molecule inhibitors
or RNA interference has been shown to reduce cell survival and proliferation85.
1.3.2.2 Cell Adhesion, Migration, Invasion, and Metastasis
CA-IX is involved in the processes of cell adhesion, migration, invasion, and metastasis.
It has been reported that CA-IX binds competitively to β-catenin via its PG-like domain, to
modulate E-cadherin-mediated adherent junctions between cells86. By interfering with E-
cadherin/β-catenin binding, CA-IX destabilizes cell-cell adhesions and promotes cell
motility86. Cytoskeletal rearrangement occurs, followed by cellular detachment. The increase in
migratory capability contributes to epithelial-mesenchymal transition (EMT) and metastasis87.
CA-IX further initiates the metastatic cascade by acidifying the extracellular environment. In the
process of converting CO2 into HCO3-, CA-IX generates H+ that can degrade the extracellular
matrix and activate matrix metalloproteinases88, 89. Pharmacological inhibition of CA-IX has
been shown by our collaborator, Dr. Shoukat Dedhar (BCCA), to obviate pulmonary metastasis
in an aggressive preclinical breast cancer model85.
1.3.3 Regulation of CA-IX Activity and Abundance
Studies have revealed that the intracellular domain of CA-IX is critical for
enzymatic activity90-92. There are three aa residues (443T, 448S, and 449Y) that serve as
potential phosphorylation sites for protein interaction and signal transduction. Under hypoxia,
cyclic-AMP activates PKA kinase which phosphorylates 443T to increase CA-IX activity91. On
the other hand, 449Y phosphorylation is mediated by epidermal growth factor (EGF) and allows
14
CA-IX to interact with PI3K to activate Akt signaling in a positive feedback loop92. As for 448S,
its phosphorylation is considered a negative regulator for CA-IX activity65.
A manner in which CA-IX abundance is regulated is through metalloproteinase-mediated
cleavage of the extracellular domain. This cleavage, also called ectodomain shedding, can be carried
out passively or actively by a TNFα-converting enzyme (TACE/ADAM17)93. Elevated levels of
CA-IX in serum have been reported in renal, vulvar, and breast cancer patients94-96, presumably as a
result of ectodomain shedding. It is hypothesized that this process correlates with tumour burden in
patients, and mediates autocrine and paracrine signaling at the cellular level. A recent preclinical
study has shown that circulating CA-IX ectodomain can be an indicator of apoptosis in response
to cytotoxic drugs97. It is plausible that this process can negatively impact therapy and imaging,
as the accumulation of ectodomain in circulation may divert CA-IX targeting agents away from
tumour sites98.
1.3.4 Distribution of CA-IX in Normal Tissues and Malignancies
In normal physiological conditions, CA-IX expression is generally restricted to the
gastrointestinal tract (duodenum, jejunum and ileum) where it is involved in the process of
differentiation99. Diffuse expression of CA-IX has also been observed in male efferent epithelial
ducts100, and in the basolateral membrane of acinar and ductal epithelia of the pancreas101. In
malignancies, overexpression of CA-IX has been observed in a broad spectrum of cancers
including: breast, lung, colon, cervix, ovary, head and neck, bladder, and renal cancers85, 102-113.
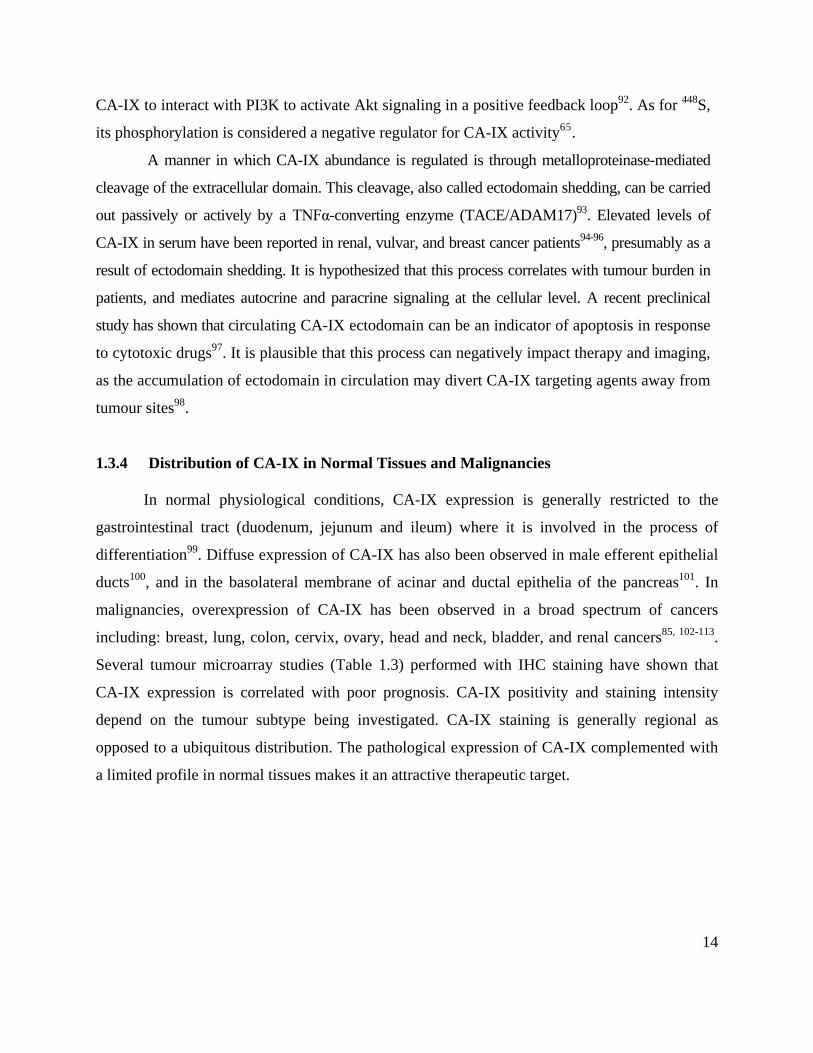
Several tumour microarray studies (Table 1.3) performed with IHC staining have shown that
CA-IX expression is correlated with poor prognosis. CA-IX positivity and staining intensity
depend on the tumour subtype being investigated. CA-IX staining is generally regional as
opposed to a ubiquitous distribution. The pathological expression of CA-IX complemented with
a limited profile in normal tissues makes it an attractive therapeutic target.
15
Table 1.3 CA-IX tissue microarray studies. Table reproduced from McDonald et al.56
Cancer subtype
# of Samples
Total CA-IX +ve %
Prognostic marker Ref Univariate analysis Multivariate analysis
DSS OS MFS DSS OS MFS Breast 3630 16 Yes NR Yes Yes Yes Yes 85 Breast 144 26 NR Yes NR NR Yes NR 114 NSCLC 555 24 Yes Yes NR Yes NS NR 103 Ovarian 205 26 NR Yes NR NR Yes NR 108 Bladder 340 71 NR Yes NR NR Yes NR 111 Astrocytoma 362 78 NR Yes NR NR Yes NR 115
DSS = disease specific survival; OS = overall survival; MFS = metastasis free survival; NSCLC = non-small cell lung carcinoma; NS = not significant; NR = not reported
1.3.5 Tumour Models Used for CA-IX Imaging
Although the pathological role of CA-IX has been studied in many cancer subtypes, two
human cancer models are used extensively in preclinical studies for the development of CA-IX
imaging agents. They are the HT-29 colorectal adenocarcinoma cell line and the SK-RC-52 clear
cell renal cell carcinoma (CCRCC) cell line. The HT-29 cell line was established in Dr. Jorgen
Fogh’s lab (Memorial Sloan Kettering Cancer Center)116, while the SK-RC-52 cell line was
established in Dr. Lloyd Old’s lab (Memorial Sloan Kettering Cancer Center)117. For the HT-29
model, CA-IX expression is observed near perinecrotic areas because of low vasculature density
and diffusion limited hypoxia118. In the SK-RC-52 model, a high expression of CA-IX is
observed due to impaired functionality of the VHL gene leading to constitutive HIF-1α
activation113, 119, 120. Biallelic mutations, loss of heterozygosity or epigenetic silencing are
common causes of VHL inactivation in CCRCC121, 122. Although CA-IX is considered a good
diagnostic/therapeutic target for CCRCC, its expression can be independent of the cellular
hypoxia-response.
1.3.6 CA-IX Nuclear Imaging Agents
This section is meant to provide an overview of the different classes of pharmacological
agents that have been radiolabeled for PET or SPECT imaging. The development and biological
evaluations of CA-IX radiotracers by our group will be discussed in subsequent chapters.
16
1.3.6.1 Monoclonal Antibodies
Monoclonal antibodies (mAbs) are a highly successful class of antigen recognition
molecules for cancer diagnosis and therapy. Given their high specificity to target antigens, mAbs
were hailed as “magic bullets” for cancer. Today, many humanized mAbs like trastuzumab,
bevacizumab, cetuximab, rituximab, and alemtuzumab are employed as cancer therapeutics123,
124. In the case of CA-IX, two mAbs have been at the forefront for clinical use: M75 and cG250.
Both mAbs bind to the PG-like domain of CA-IX and have been evaluated as imaging agents.
M75 was radiolabeled with 125I for preclinical imaging studies118, 125, and is now commercially
available as part of an ELISA kit from Siemens126. On the other hand, cG250 (marketed by
WILEX AG as Rencarex®) has been radiolabeled with an assortment of imaging isotopes
including 124I, 111In, and 89Zr127-129. In a phase III trial (REDUCTANE study), 124I-cG250 had
higher average sensitivity and specificity for the diagnosis of CCRCC compared to contrast-
enhanced computed tomography alone (86.2% and 85.9% for PET/CT vs. 75.5% and 46.8% for
CT)127. Despite the success of mAbs, there is significant interest in developing alternative
approaches for imaging CA-IX in vivo. The high molecular weight of mAbs, combined with
tumour interstitial pressure and aberrant vasculature, could limit tissue penetrance and ability to
bind CA-IX in hypoxic niches130. Moreover, due to slow pharmacokinetic clearance mAb
imaging typically requires a non-ideal delay of 4-7 days post-injection (p.i.) to achieve high
contrast images.
1.3.6.2 Small Molecule Inhibitors
Small molecule inhibitors are promising alternatives to mAb-based imaging. Due to their
low molecular weights, small molecules generally exhibit higher tumour penetration and faster
pharmacokinetics. Furthermore, small molecules are non-immunogenic and easier and less
expensive to produce. Sulfonamides and coumarins are two classes of small molecules that are
efficacious in inhibiting CA-IX activity, but differ in their mechanism of action. Sulfonamides
and isoether derivatives, sulfamates and sulfamides, inhibit CA-IX by forming coordination with
Zn2+ ion of the catalytic domain and displacing H2O131. In contrast, coumarins are suicide
inhibitors that undergo hydrolysis to bind irreversibly at the entrance leading to the catalytic
domain. By sterically hindering substrate binding, coumarins inhibit CA-IX activity132. However
17
given the large number of human CA isoenzymes and the homology shared for the catalytic
domain, it is very challenging to design potent inhibitors specifically targeting a single isoform67.
Of the small molecule inhibitors that have been radiolabeled for CA-IX imaging, only a
subset of them has been evaluated in vivo (Figure 1.6). Apte et al. reported the synthesis of an 18F-labeled sulfonamide derivative (compound A), but no biological data were presented133. Lu
et al. reported the synthesis of a series of 99mTc/Re-labeled benzenesulfonamide derivatives134.
Among them, 99mTc-3d (compound B) exhibited high binding affinity (IC50 = 9 nM) to hypoxic
CA-IX expressing HeLa cells, but no further evaluation in animal imaging study was presented.
Asakawa et al. reported 11C-labeling of three potent benzenesulfonamides (compounds C), but
no biological evaluation data were presented either. Akurathi et al. reported biodistribution data
for 99mTc-labeled sulfonamide derivatives (compounds D-H) in HT-29 tumour xenografts135, 136.
Tracers showed limited retention in tumours (≤ 0.5 %ID/g at 0.5 - 4 h p.i.) with low contrast (≤
1.0 tumour-to-blood ratio). 18F-VM4-037 (compound I) is an ethoxzolamide derivative
developed by Siemens that completed phase II studies137. 18F-VM4-037 showed moderate uptake
in primary CCRCC lesions, but lesions were difficult to visualize without an accompanying CT
due to high background uptake in normal renal parenchyma. 18F-VM4-037 was able to detect
extrarenal lesions for patients that had metastatic disease. Interestingly, Peeters et al. published
preclinical biodistribution/imaging data for 18F-VM4-037 with the tracer reportedly failing to
detect CA-IX expression in either glioma or colorectal cancer xenograft models138. Krall et al.
reported the synthesis and evaluation of a 99mTc-labeled acetazolamide derivative (compound J)
with excellent tumour targeting (22 %ID/g at 3 h p.i.) and image contrast, but results were
obtained with the CA-IX overexpressing SK-RC-52 tumour xenograft model139.
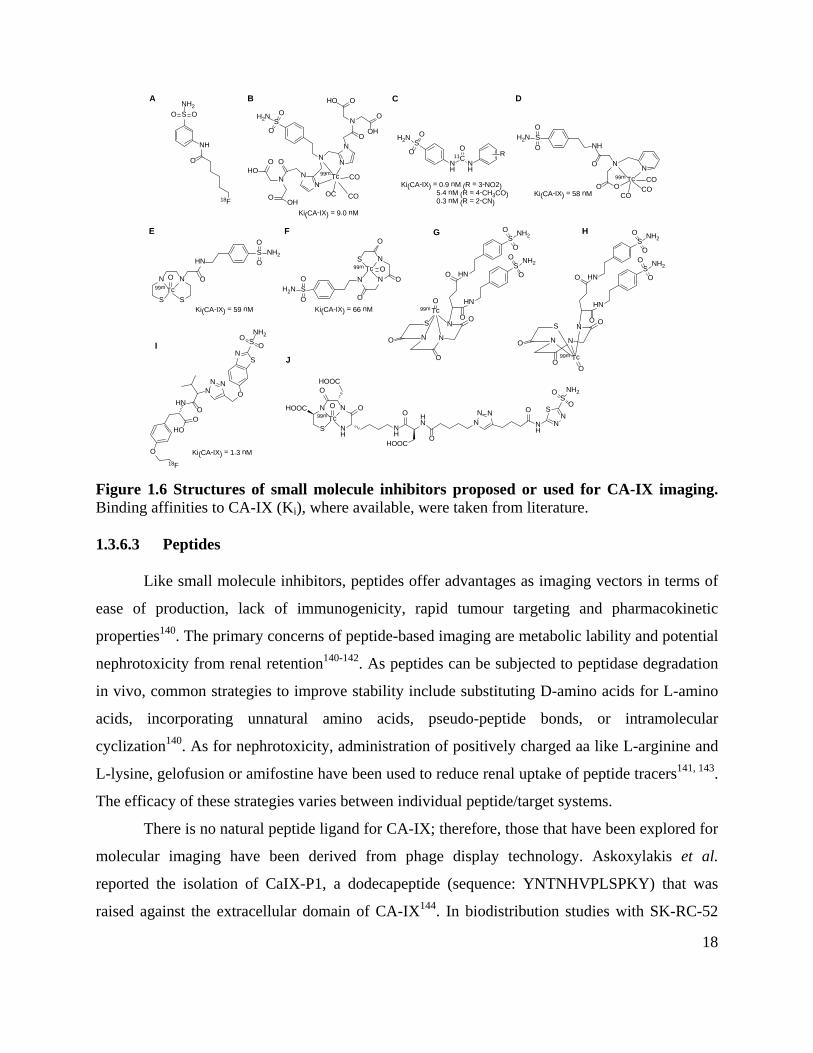
18
SO
OH2N
NH
11CNH
RNH
N N
CO
COCOO O
Tc
D
G
A
H
O
HN
HOO
O
NNN
O
SN
SOO
NH2
SH2N O
O
NN
N
NN
O
N
OHO
O
OH
O
N
OHO
OHO
Tc CO
COOC
C
O
SO
H2N
S NH2HN
ONN
SSTc
O N N
NS
O
O
O
Tc O
I
F
SO ONH2
NH
O
18F
E
S
N N
N
O
O
O
O HN
O
HN
S
S
O
OO
O NH2
NH2
TcO
S
N N
N
O
O
O
O HN
O
HN
S
S
O
OO
O NH2
NH2
TcO
99m
99m
B
99m
99m
99m
18F
Ki(CA-IX) = 9.0 nM
O
O
O
SO
OH2N
Ki(CA-IX) = 0.9 nM (R = 3-NO2) 5.4 nM (R = 4-CH3CO) 0.3 nM (R = 2-CN)
Ki(CA-IX) = 58 nM
Ki(CA-IX) = 59 nM Ki(CA-IX) = 66 nM
Ki(CA-IX) = 1.3 nM
J
NH
NN
STc
OHOOC
OHOOC
O99m
NH
O HN
HOOCO
NNN
NH
O
NN
SS
O
O
NH2
O
99m
Figure 1.6 Structures of small molecule inhibitors proposed or used for CA-IX imaging. Binding affinities to CA-IX (Ki), where available, were taken from literature.
1.3.6.3 Peptides
Like small molecule inhibitors, peptides offer advantages as imaging vectors in terms of
ease of production, lack of immunogenicity, rapid tumour targeting and pharmacokinetic
properties140. The primary concerns of peptide-based imaging are metabolic lability and potential
nephrotoxicity from renal retention140-142. As peptides can be subjected to peptidase degradation
in vivo, common strategies to improve stability include substituting D-amino acids for L-amino
acids, incorporating unnatural amino acids, pseudo-peptide bonds, or intramolecular
cyclization140. As for nephrotoxicity, administration of positively charged aa like L-arginine and
L-lysine, gelofusion or amifostine have been used to reduce renal uptake of peptide tracers141, 143.
The efficacy of these strategies varies between individual peptide/target systems.
There is no natural peptide ligand for CA-IX; therefore, those that have been explored for
molecular imaging have been derived from phage display technology. Askoxylakis et al.
reported the isolation of CaIX-P1, a dodecapeptide (sequence: YNTNHVPLSPKY) that was
raised against the extracellular domain of CA-IX144. In biodistribution studies with SK-RC-52
19
xenograft mice, 131I-CaIX-P1 displayed modest tumour uptake (~2.5 %ID/g) with tumour to
muscle ratio of 4.11 ± 2.44 at 1 h p.i. Attempts to optimize CaIX-P1 via alanine scanning and
truncations led to the identification of CaIX-P1-4-10 (NHVPLSPy)145. Although CaIX-P1-4-10
had approximately 6-fold higher binding ratio than CaIX-P1 in vitro, planar scintigraphy with 125I-CaIX-P1-4-10 was unable to delineate tumour xenografts from background. Due to concerns
of isoform selectivity, the Heidelberg group performed a secondary screen against the PG-like
domain of CA-IX and isolated the dodapeptide PGLR-P1 (NMPKDVTTRMSS)146. However, 125I-PGLR-P1 exhibited micromolar affinity, and uptake value in tumour (0.48 ± 0.20 at 1 h p.i.)
was lower than most normal tissues.
1.3.6.4 Affibodies
Affibody molecules are a class of antibody mimetics that were originally derived from
the B-domain in the IgG-binding region of staphylococcal protein A147. Affibodies are cysteine
free proteins of 58 aa residues (6-7 kDa) that fold into three alpha-helix bundle structures147.
Target specificity is mediated by 13 aa residues147. Tolerant to high temperatures, extreme pHs,
and structural modifications, these scaffolds typically exhibit nano to picomolar affinities to their
targets of interest147, 148. Dr. Vladimir Tolmachev’s group in Uppsula University, Sweden are
experts of this technology, and successfully developed affibodies for imaging HER2, EGFR,
IGF-1R, PDGFRβ, HER3, and CA-IX149-154.
Honarvar et al. reported the successful affibody-mediated imaging of CA-IX expression
in SK-RC-52 xenograft mice with 99mTc-HEHEHE-ZCAIX:1154. 99mTc-HEHEHE-ZCAIX:1
exhibited rapid clearance from blood and normal tissues. At 4 h p.i., tumour uptake was 9.7 ± 0.7
%ID/g, which corresponded to tumour-to-muscle and tumour-to-blood ratios of 104 ± 52 and 53
± 10 respectively. 99mTc-HEHEHE-ZCAIX:1 generated high contrast SPECT images, despite
high retention in kidneys (141 ± 45 %ID/g). The authors concluded that 99mTc-HEHEHE-
ZCAIX:1 may not be suitable for imaging CCRCC; however, it represents a highly promising
imaging vector for detecting CA-IX expression for other cancers pending further investigations.
The high renal uptake of affibodies can be mitigated by the use of non-residualizing
radionuclides or through pre-targeting approaches, with the latter showing great promise with a
HER2-specific affibody155, 156.
20
1.4 Other Imaging Modalities
1.4.1 Optical Imaging
Similar to SPECT and PET, optical imaging requires the administration of a targeting
probe; however, the imaging probe is labeled with a fluorescent molecule in lieu of a
radionuclide157. Following an uptake period, the target fluorescent molecule is excited by an
external laser of appropriate wavelength157. This produces an emission of a longer-wavelength
light, which is detected for acquisition and image processing157. Optical imaging agents are
generally limited in terms of tissue penetrance (cm range) due to signal attenuation, but they
have an emerging role as a complementary intraoperative imaging modality158. Optical agents
can be used by surgeons to ensure that clean/negative surgical resection margins are reached158.
Muselaers et al. used cG250 as a pharmacological vector to produce 125I-labeled
girentuximab-IRDye800CW, with optical images demonstrating good concordance with SPECT
images (31.5 ± 9.6 %ID/g in SK-RC-52 tumours at 72 h p.i.)159. Tafreshi et al. took a
commercially available CA-IX antibody and conjugated it with VivoTag-S 680, termed CA9Ab-
680, for imaging breast cancer lymph node metastasis160. van Brussel et al. used a phage display
library to identify a nanobody, single domain antibody, for optical imaging with
IRDye800CW161. At 2 h p.i., the uptake in CA-IX overexpressing ductal carcinoma in situ mouse
cancer model was 14.1 ± 1.1 %ID/g. Groves et al. reported a series of sulfonamide derivatives
conjugated to near-infrared (NIR) fluorochromes162. One acetazolamide derivative in particular,
HS680, generated high contrast fluorescence molecular tomography images for tumour-bearing
mice (10 %ID in HT-29 tumours at 24 h p.i.) that underwent in vivo hypoxia induction (48 h at
8% O2 levels)163. Wichert and colleagues decribed the use of a dual pharmacophore DNA-
encoded chemical library to identify ligand pairs and facilitate affinity maturation for
pharmacodelivery applications. They identified a novel CA-IX inhibitor consisting of a 4,4-
bis(4-hydroxyphenyl)valeric acid and a succinyl acetazolamide group (A-493/B-202 pair). After
conjugating the A-493/B-202 pair to a NIR dye (compound 8c), imaging studies were performed
in SK-RC-52 tumour-bearing mice. Compound 8c showed high and sustained tumour uptake (10
± 2 %ID/g) at 24 h p.i.164. More recently, Ly et al. reported the synthesis and evaluation of
HypoxyFluor, a dimeric sulfonamide inhibitor conjugated to a S0456 NIR dye165. Although
21
biodistribution data was not available, high contrast images were obtained for HT-29 xenograft
mice at 4 h p.i.
1.4.2 Magnetic Resonance
Magnetic resonance (MR) imaging is a diagnostic modality that can performed without
exposing patients to ionizing radiation166. To perform a study, a patient rests in an MR scanner
and is subjected to a magnetic field166. A radiofrequency pulse is applied to the body, which
causes hydrogen atoms to alter their magnetization alignment relative to the magnetic field166.
The radiofrequency pulse is subsequently switched off to allow the hydrogen atoms to return to
their equilibrium or resting states166. This process emits radio waves that are detected by receiver
coils surrounding the patient. An MR scan is made up of a series of such pulse sequences166. The
contrast observed between tissues is dependent on the differences in relaxation rates166. As
hydrogen atoms are found in abundance in fat and water, MR can produce high contrast images
of soft tissues166.
Probes containing exogenous contrast agents (ex. gadolinium or iron oxide) or stable
isotopes (ex. 13C or 15N) can be used for molecular targeting with MR167, 168. Compared to optical
imaging, there has been limited development for CA-IX targeted MR imaging. As CAs are
responsible for catalyzing the interconversion of CO2 and HCO3−, Gallagher et al. used 13C-
labelled HCO3− as a probe/substrate to assess the functional activity of CA-IX in colorectal
cancer xenograft models169. Chen et al. conjugated CA-IX targeting sulfonamides onto Fe3O4
magnetic nanoparticles for tumour imaging170. According to the authors, higher uptake in HT-29
tumour xenograft was observed compared to control nanoparticles (Fe3O4 particles alone);
however, no quantitative measurements were provided for in vivo studies. Rami et al. reported
the synthesis of a series of sulfonamides that were conjugated to macrocyclic rings that can bind
gadolinium(III), but no imaging experiments were performed171.
1.5 CA-IX Therapeutics in Clinical Development
As summarized in Table 1.4, different CA-IX therapeutic agents have been investigated
in clinical trials. cG250 advanced to a phase III trial (ARISER study), but failed to meet primary
endpoint as an adjuvant therapy for CCRCC patients172. Meanwhile cG250 radiolabeled with
22
cytotoxic radionuclide 177Lu recently concluded phase II clinical studies, with disease
stabilization observed for 9 of 14 patients that had progressive metastatic CCRCC173. However,
myelotoxicity prevented some patients from receiving additional treatment courses. BAY-79-
4620 is an antibody-drug conjugate (ADC) with monomethyl auristatin E as a neoplastic
agent174. During the phase I study, several patients experienced severe adverse events including
death175. This led to the termination of the phase I study, and subsequent discontinuation of
clinical development for BAY-79-4620. SLC-0111 is an ureido-sulfonamide inhibitor developed
for solid tumours176. SLC-0111 is currently in phase I clinical study at three Canadian health
institutions including the BC Cancer Agency. Dubois et al. developed DH-348, a dual-targeting
bioreductive nitroimidazole based sulfonamide that can inhibit CA-IX activity and also act as a
radiation sensitizer177. With promising preclinical results, phase I study for DH-348 is scheduled
to commence in 2016.
Table 1.4 CA-IX therapeutic agents in clinical development.
Compound Generic name Category Indication(s) Stagea
cG250 Girentuximab or Rencarex®
Chimeric antibody Kidney cancer Phase IIIb
177Lu-cG250 177Lu-girentuximab Radiolabeled antibody
Kidney cancer Phase II
3ee9–MMAE BAY-79-4620 Antibody–drug conjugate
Solid tumours Phase Ib
U-104 SLC-0111 Small molecule inhibitor
Solid tumours Phase I
DH-348 DTP348 Small molecule inhibitor
Solid tumours, Head and neck neoplasms
-
aHighest clinical stage reached to date; bNo longer in clinical development
1.6 Thesis Theme and Rationale
Pharmacologic inhibition of CA-IX is achievable through mAbs or small molecule
inhibitors; however, there remains a need for an effective platform to screen for cancers that will
respond to these drugs. Herein, we propose targeting CA-IX and for the diagnosis of aggressive
cancers using PET or SPECT imaging. PET and SPECT are non-invasive imaging modalities
that use radioisotopes to measure metabolic activities or cancer progression. The detection of
23
CA-IX in vivo will allow physicians to prescribe personalized therapeutic treatments, to monitor
treatment response and in turn improve patient outcomes.
Moreover, considering the role of CA-IX in hypoxia-induced signaling, CA-IX
radiotracers have the potential to be surrogate hypoxia imaging agents. The ability to delineate
hypoxic volumes can improve radiation planning (ex. intensity modulated radiotherapy or image-
guided radiotherapy) or direct hypoxia therapeutics (ex. Tirapazamine).
1.6.1 Objectives and Hypotheses
We studied existing and novel ligands which bind to CA-IX expressing tumours to
develop tools to predict and monitor successful response to CA-IX inhibition. Ideal CA-IX
radiotracers are ones that can be easily synthesized with high specific activity and radiochemical
purity. The radiotracer(s) should be stable in plasma, and stay in circulation long enough to
facilitate binding to target tissue. Most significantly, the radiotracer(s) should bind selectively to
CA-IX expressing cancers and be rapidly cleared from non-target tissues (to provide good
tumour to background signal and to reduce effective dose). Therefore, binding affinity,
radiolabeling efficiency, plasma stability, pharmacokinetics, and image quality are criterions that
were evaluated for each prospective CA-IX radiotracer.
For this thesis, we proposed the following hypotheses:
1) Antigen recognition molecules such as small molecule inhibitors, affibodies, and antibodies
can be radiolabelled for in vivo imaging using 18F, 68Ga, 111In, and 89Zr.
2) By matching the appropriate isotope with the biological half-life of the targeting probe, the
expression of CA-IX can be measured with high contrast in vivo by PET or SPECT imaging.
3) CA-IX tracers will show improved tumour-to-nontarget ratios and pharmacokinetics over
established hypoxia PET tracers.
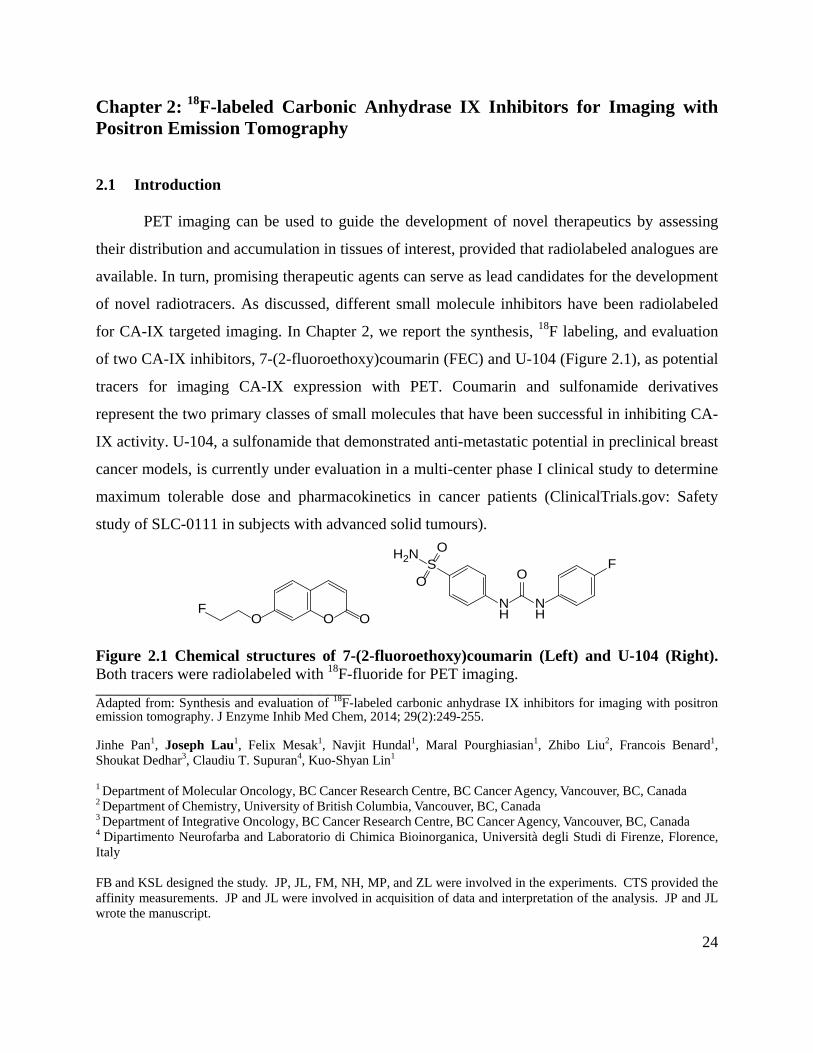
24
Chapter 2: 18F-labeled Carbonic Anhydrase IX Inhibitors for Imaging with Positron Emission Tomography
2.1 Introduction
PET imaging can be used to guide the development of novel therapeutics by assessing
their distribution and accumulation in tissues of interest, provided that radiolabeled analogues are
available. In turn, promising therapeutic agents can serve as lead candidates for the development
of novel radiotracers. As discussed, different small molecule inhibitors have been radiolabeled
for CA-IX targeted imaging. In Chapter 2, we report the synthesis, 18F labeling, and evaluation
of two CA-IX inhibitors, 7-(2-fluoroethoxy)coumarin (FEC) and U-104 (Figure 2.1), as potential
tracers for imaging CA-IX expression with PET. Coumarin and sulfonamide derivatives
represent the two primary classes of small molecules that have been successful in inhibiting CA-
IX activity. U-104, a sulfonamide that demonstrated anti-metastatic potential in preclinical breast
cancer models, is currently under evaluation in a multi-center phase I clinical study to determine
maximum tolerable dose and pharmacokinetics in cancer patients (ClinicalTrials.gov: Safety
study of SLC-0111 in subjects with advanced solid tumours).
O OOF
SO
OH2N
NH
NH
OF
Figure 2.1 Chemical structures of 7-(2-fluoroethoxy)coumarin (Left) and U-104 (Right). Both tracers were radiolabeled with 18F-fluoride for PET imaging. ________________________________ Adapted from: Synthesis and evaluation of 18F-labeled carbonic anhydrase IX inhibitors for imaging with positron emission tomography. J Enzyme Inhib Med Chem, 2014; 29(2):249-255. Jinhe Pan1, Joseph Lau1, Felix Mesak1, Navjit Hundal1, Maral Pourghiasian1, Zhibo Liu2, Francois Benard1, Shoukat Dedhar3, Claudiu T. Supuran4, Kuo-Shyan Lin1
1 Department of Molecular Oncology, BC Cancer Research Centre, BC Cancer Agency, Vancouver, BC, Canada 2 Department of Chemistry, University of British Columbia, Vancouver, BC, Canada 3 Department of Integrative Oncology, BC Cancer Research Centre, BC Cancer Agency, Vancouver, BC, Canada 4 Dipartimento Neurofarba and Laboratorio di Chimica Bioinorganica, Università degli Studi di Firenze, Florence, Italy FB and KSL designed the study. JP, JL, FM, NH, MP, and ZL were involved in the experiments. CTS provided the affinity measurements. JP and JL were involved in acquisition of data and interpretation of the analysis. JP and JL wrote the manuscript.
25
2.2 Materials and Methods
2.2.1 Chemicals and Instrumentation
U-104178 and its radiolabeling precursor 4-nitrophenyl 4-sulfamoylcarbanilate179 were prepared
according to previously published procedures. All other chemicals and solvents were obtained
from commercial sources, and used without further purification. Proton NMR spectra were
obtained using a Bruker (Billerica, MA, USA) Avance 400inv Spectrometer, and were reported
in parts per million downfield from internal tetramethylsilane. Mass analyses were performed
using a Bruker Esquire-LC/MS system with ESI ion source. Purification and quality control of 18F-labeled CA-IX inhibitors were performed on an Agilent (Santa Clara, CA, USA) HPLC
System equipped with a model 1200 quaternary pump, a model 1200 UV absorbance detector,
and a Bioscan (Washington DC, USA) NaI scintillation detector. The radio-detector was
connected to a Bioscan B-FC-1000 Flow-count System, and the output from the Bioscan Flow-
count system was fed into an Agilent 35900E Interface which converted the analog signal to
digital signal. The operation of the Agilent HPLC system was controlled using the Agilent
ChemStation software. The HPLC columns used were a semipreparative column (Phenomenex
C18, 5 µ, 250 × 10 mm) and an analytical column (Eclipse XOB-C18, 5 µ, 150 × 4 mm). 18F-
Fluoride was produced by the 18O(p, n)18F reaction using an Advanced Cyclotron Systems Inc.
(Richmond, BC, Canada) TR19 cyclotron. Radioactivity of 18F-labeled tracers were measured
using a Capintec (Ramsey, NJ, USA) CRC®-25R/W dose calibrator, and the radioactivity of
mouse tissues collected from biodistribution studies were counted using a Packard Cobra II 5000
Series auto-gamma counter. PET imaging experiments were conducted using a Siemens Inveon
microPET/CT scanner.
2.2.2 Synthesis of 7-(2-fluoroethoxy)coumarin (FEC)
A mixture of 7-hydroxycoumarin (0.81 g, 5 mmol), 1-fluoro-2-tosyloxyethane (1.56 g, 7.1
mmol) and K2CO3 (3.45 g, 25 mmol) in DMF (15 mL) was heated at 70 °C for 24 h. After
cooling to room temperature, CH2Cl2 (100 mL) was added to the mixture, and the resulted
solution was washed with water (100 mL × 3). The CH2Cl2 phase was dried with anhydrous
MgSO4, concentrated under reduced pressure, and purified by flash column chromatography on
26
silica gel using 4:6 EtOAc/hexanes to obtain the desired product FEC as a white solid (0.918 g,
84%). 1H NMR (CDCl3) δ 4.28 (dt, J = 27.6, 4.0 Hz, 2H), 4.80 (dt, J = 47.2, 4.0 Hz, 2H), 6.27 (d, J =
9.2 Hz, 1H), 6.83 (d, J = 2.4 Hz, 1H), 6.89 (dd, J = 8.4, 2.4 Hz, 1H), 7.40 (d, J = 8.4 Hz, 1H),
7.65 (d, J = 9.2 Hz, 1H); MS (ESI) calculated for C11H9FO3 (M + H)+ 209.1, found 209.0.
2.2.3 Synthesis of 7-(2-tosyloxyethoxy)coumarin
A solution of 7-hydroxycoumarin (0.81 g, 5 mmol), 1,2-bis(tosyloxy)ethane (2.78 g, 7.5 mmol)
and K2CO3 (3.45 g, 25 mmol) in DMF (15 mL) was heated at 70 °C for 18 h. After cooling to
room temperature, CH2Cl2 (100 mL) was added and the solution was washed with water (100
mL × 3). The CH2Cl2 layer was dried with anhydrous MgSO4, concentrated under reduced
pressure, and chromatographed on silica gel using 1:99 CH3CN/CH2Cl2 to obtain the desired
product as a white solid (0.282 g, 16%). 1H NMR (CDCl3) δ 2.47 (s, 3H), 4.19-4.25 (m, 2H),
4.39-4.45 (m, 2H), 6.28 (d, J = 9.2 Hz, 1H), 6.68 (d, J = 2.4 Hz, 1H), 6.76 (dd, J = 8.4, 2.4 Hz,
1H), 7.34-7.39 (m, 3H), 7.64 (d, J = 9.2 Hz, 1H), 7.83 (d, J = 8.4 Hz, 1H); MS (ESI) calculated
for C18H16O6S (M + H)+ 361.1, found 361.1.
2.2.4 Binding Affinity Measurement
Inhibition constants (Ki) for CA-I, CA-II, CA-IX and CA-XII were determined following
published procedures178. An Applied Photophysics stopped-flow instrument was used for
assaying the CA catalyzed CO2 hydration activity. Phenol red (at 0.2 mM) was used as indicator,
working at the absorbance maximum of 557 nm, with 20 mM HEPES (pH 7.4) and 20 mM
NaBF4 (for maintaining constant the ionic strength), following the initial rates of the CA-
catalyzed CO2 hydration reaction for 10-100 s. The CO2 concentrations ranged from 1.7 to 17
mM for the determination of the kinetic parameters and inhibition constants. For each inhibitor,
at least six traces of the initial 5-10% of the reaction were used for determining the initial
velocity. The uncatalyzed rates were determined in the same manner and subtracted from the
total observed rates. Stock solutions of inhibitor (10 mM) were prepared in distilled-deionized
water, and dilutions up to 0.01 nM were done thereafter with distilled-deionized water. Inhibitor
and enzyme solutions were preincubated together for 15 min at room temperature prior to assay
27
in order to allow for the formation of the E-I complex. The inhibition constants were obtained by
nonlinear least-squares methods using PRISM 3, whereas the kinetic parameters for the
uninhibited enzymes were from Lineweaver-Burk plots, and represent the mean from at least
three different determinations
2.2.5 Radiosynthesis of 18F-FEC
The proton-bombarded H2[18O]O was transferred via He gas push from the cyclotron target
station to a Waters QMA light Sep-Pak cartridge set up in the hot cell. The 18F-fluoride was
trapped in the QMA cartridge, and eluted out into a 4-mL V-shaped reaction vial with a mixture
of water (0.3 mL) and CH3CN (0.3 mL) containing K2CO3 (7 mg) and kryptofix 222 (K222). The
uncapped reaction vial was placed in a heating block, and the solution was heated at 120 °C.
After most of the solvents evaporated, CH3CN (1mL × 2) was added to the reaction vial to
facilitate complete removal of water. A solution of 7-(2-tosyloxyethoxy)coumarin (3 mg) in
DMF (0.5 mL) was added to the reaction vial containing dry K[18F]F/K222. The vial was capped,
and the mixture was heated at 70 °C for 30 min. At the end of heating, the mixture was diluted
with water (1 mL) and purified by HPLC using the semipreparative column eluted with 35%
CH3CN/65% H2O at a flow rate of 4.5 mL/min. The retention time of 18F-FEC was 17.4 min.
The eluting fraction containing 18F-FEC was collected, diluted with water (50 mL), and trapped
on a Waters tC18 light Sep-Pak cartridge. After washing the tC18 light Sep-Pak cartridge with
water (10 mL), 18F-FEC was eluted out with ethanol (0.4 mL), and formulated with saline (4 mL)
for plasma stability study and µPET/CT imaging study. The quality control was performed by
HPLC on the analytical column eluted with 25% CH3CN/75% H2O at a flow rate of 2 mL/min.
The retention time of 18F-FEC was 8.5 min. The specific activity of 18F-FEC was measured using
the analytical HPLC system. It was calculated by dividing the injected radioactivity in 0.2 mL of
final 18F-FEC solution by the mass of FEC in the injected solution. The mass of FEC was
estimated by comparing the UV absorbance obtained from the injection with a previously
prepared standard curve.
28
2.2.6 Radiosynthesis of 18F-U-104
(1) Radiosynthesis of 1-[18F]fluoro-4-nitrobenzene: A solution of 1,4-dinitrobenzene (4 mg) in
DMSO (0.5 mL) was added to a 4-mL reaction vial containing dry K[18F]F/K222. The vial was
capped, and the mixture was heated at 125 °C for 10 min. At the end of the heating, the mixture
was diluted with water (10 mL). The resulted solution was passed through a Waters tC18 plus
Sep-Pak cartridge, and the cartridge was washed with water (10 mL). The trapped 1-[18F]fluoro-
4-nitrobenzene was eluted out of Sep-Pak cartridge with methanol (1.5 mL).
(2) Radiosynthesis of 4-[18F]fluoroaniline: The above solution of 1-[18F]fluoro-4-nitrobenzene in
methanol was added to a vial containing 10% palladium on carbon (4 mg) and sodium
borohydride (10 mg). The resulted mixture was incubated at room temperature for 5 min. The
reaction was quenched by adding 0.1 mL of concentrated HCl and diluted with 1 M NaOH (20
mL). The resulted solution was passed through a Lichrolut EN column (500 mg). The trapped 4-
[18F]fluoroaniline in the Lichrolut EN column was eluted out with THF (2 mL) and dried by
passing the THF solution through a pre-packed column containing celite (125 mg) and
anhydrous MgSO4 (125 mg).
(3) Radiosynthesis of 18F-U-104: The above solution of 4-[18F]fluoroaniline in THF was added to
a 4-mL reaction vial containing 4-nitrophenyl 4-sulfamoylcarbanilate (8 mg) and DIEA (10 µL)
in DMF (0.5 mL). The resulted mixture was heated at 125 °C for 15 min, diluted with water (1
mL), and purified by HPLC using the semipreparative column eluted with 40% MeOH/60% H2O
at a flow rate of 4.5 mL/min. The retention time of 18F-U-104 was 27.4 min. The eluting fraction
containing 18F-U-104 was collected, diluted with water (50 mL), and passed through a Waters
tC18 light Sep-Pak cartridge. The trapped 18F-U-104 on the Sep-Pak cartridge was eluted out
with ethanol (0.4 mL), and formulated with saline (4 mL) for plasma stability and biodistribution
studies. The quality control of 18F-U-104 was performed on HPLC using the analytical column
eluted with 25% CH3CN/75% H2O at a flow rate of 2 mL/min. The retention time of 18F-U-104
was 7.7 min. The specific activity of 18F-U-104 was measured following same procedures as
described for the calculation of specific activity of 18F-FEC.
29
2.2.7 Stability in Mouse Plasma
Aliquots (100 µL) of the 18F-labeled tracer (18F-FEC or 18F-U-104) were incubated with 400 µL
of BALB/c mouse plasma (Innovative Research) for 5, 15, 30, 60, and 120 minutes at 37°C. At
the end of each incubation period, samples were passed through a 0.45 micron filter. The filtered
sample was loaded onto the analytical HPLC to check for metabolite(s) formation, and analysis
was conducted with Agilent ChemStation software.
2.2.8 In Vivo Experiments
HT-29 human colorectal cancer cells were obtained as a gift from Dr. Donald Yapp (BC Cancer
Research Centre, Vancouver, Canada). Cells were cultured in Dulbecco’s Modified Eagle’s
Medium supplemented with 10% fetal bovine serum, 100 U/mL penicillin-streptomycin, and
non-essential amino acids. Mice were maintained and the experiments were conducted in
accordance with the guidelines established by the Canadian Council on Animal Care and
approved by the Animal Ethics Committee of the University of British Columbia.
2.2.8.1 Tumour Implantation
All experiments were performed using NOD.Cg-PrkdcscidIl2rgtm1Wjl/SzJ (NSG) mice bred in-
house at the Animal Research Centre, British Columbia Cancer Research Centre, Vancouver,
Canada. Mice were anesthetized briefly with 2.5% isoflurane in 2.0 L/min of oxygen during cell
implantation. After wiping skin surrounding the injection site with an alcohol prep pad, a 28.5-
Gauge needle was used to subcutaneously implant 5 x 10⁶ HT-29 cells (in 100 µL of 1xPBS and
BD Matrigel Matrix at 1:1 ratio) under the right shoulder. Biodistribution studies and PET/CT
imaging were performed when tumours reached 5-7 mm in diameter.
2.2.8.2 Biodistribution Studies
Tumour bearing mice were injected with ~ 3.7 MBq of 18F-U-104 (100 – 200 µL in saline, i.v.).
After an uptake period of 1 h, mice were euthanized by CO2 asphyxiation. Blood was promptly
withdrawn, and organs/tissues of interest were harvested, rinsed with saline, blotted dry and
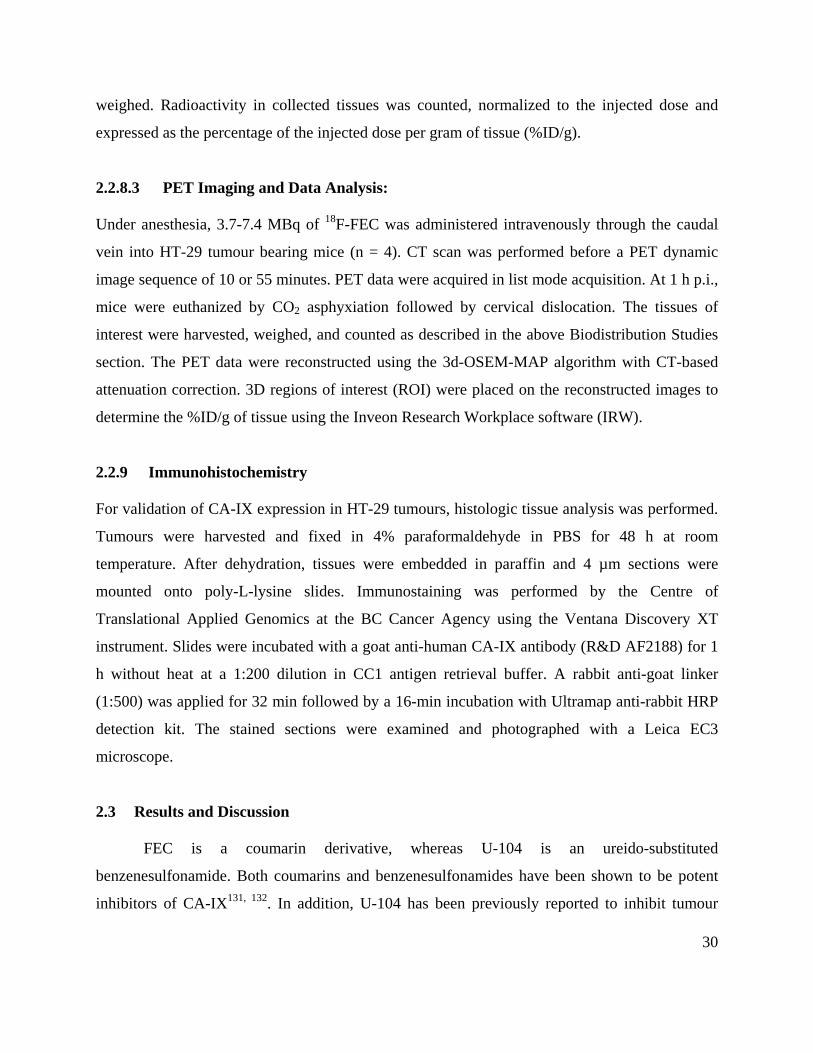
30
weighed. Radioactivity in collected tissues was counted, normalized to the injected dose and
expressed as the percentage of the injected dose per gram of tissue (%ID/g).
2.2.8.3 PET Imaging and Data Analysis:
Under anesthesia, 3.7-7.4 MBq of 18F-FEC was administered intravenously through the caudal
vein into HT-29 tumour bearing mice (n = 4). CT scan was performed before a PET dynamic
image sequence of 10 or 55 minutes. PET data were acquired in list mode acquisition. At 1 h p.i.,
mice were euthanized by CO2 asphyxiation followed by cervical dislocation. The tissues of
interest were harvested, weighed, and counted as described in the above Biodistribution Studies
section. The PET data were reconstructed using the 3d-OSEM-MAP algorithm with CT-based
attenuation correction. 3D regions of interest (ROI) were placed on the reconstructed images to
determine the %ID/g of tissue using the Inveon Research Workplace software (IRW).
2.2.9 Immunohistochemistry
For validation of CA-IX expression in HT-29 tumours, histologic tissue analysis was performed.
Tumours were harvested and fixed in 4% paraformaldehyde in PBS for 48 h at room
temperature. After dehydration, tissues were embedded in paraffin and 4 µm sections were
mounted onto poly-L-lysine slides. Immunostaining was performed by the Centre of
Translational Applied Genomics at the BC Cancer Agency using the Ventana Discovery XT
instrument. Slides were incubated with a goat anti-human CA-IX antibody (R&D AF2188) for 1
h without heat at a 1:200 dilution in CC1 antigen retrieval buffer. A rabbit anti-goat linker
(1:500) was applied for 32 min followed by a 16-min incubation with Ultramap anti-rabbit HRP
detection kit. The stained sections were examined and photographed with a Leica EC3
microscope.
2.3 Results and Discussion
FEC is a coumarin derivative, whereas U-104 is an ureido-substituted
benzenesulfonamide. Both coumarins and benzenesulfonamides have been shown to be potent
inhibitors of CA-IX131, 132. In addition, U-104 has been previously reported to inhibit tumour
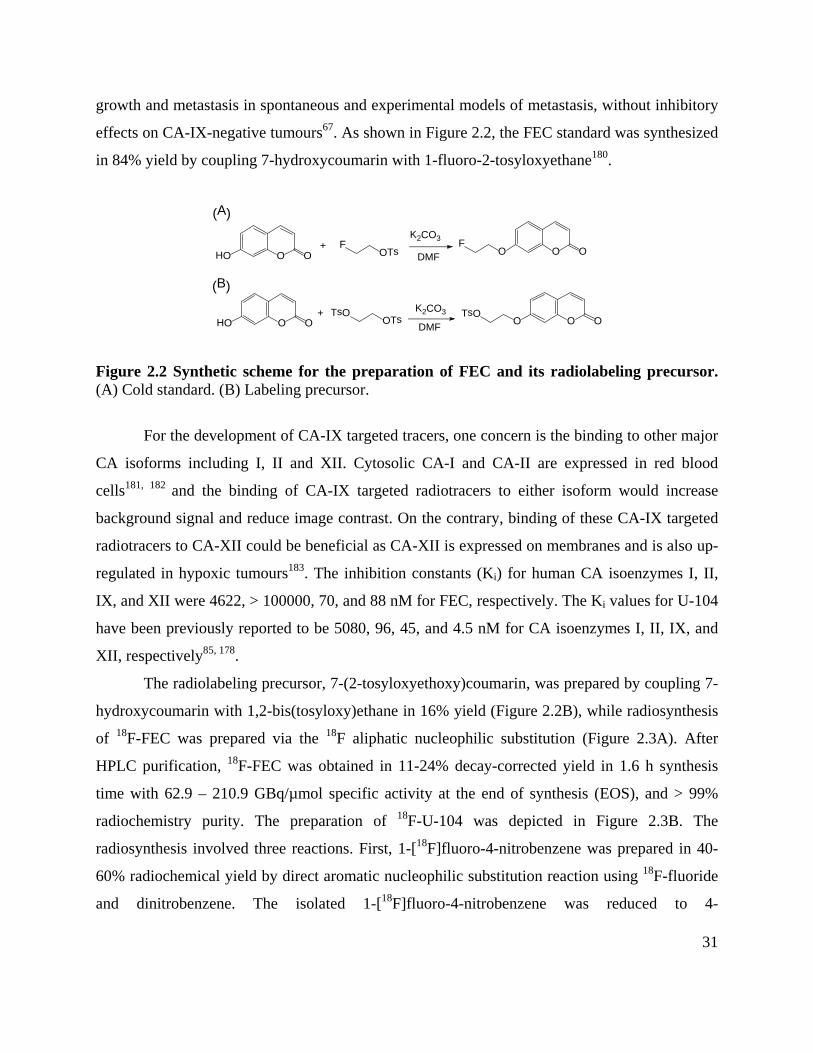
31
growth and metastasis in spontaneous and experimental models of metastasis, without inhibitory
effects on CA-IX-negative tumours67. As shown in Figure 2.2, the FEC standard was synthesized
in 84% yield by coupling 7-hydroxycoumarin with 1-fluoro-2-tosyloxyethane180.
OOF
OOHO O+ F
OTsK2CO3
DMF
(A)
(B)
O OHO+ K2CO3
DMF O OOTsOTsO
OTs
Figure 2.2 Synthetic scheme for the preparation of FEC and its radiolabeling precursor. (A) Cold standard. (B) Labeling precursor.
For the development of CA-IX targeted tracers, one concern is the binding to other major
CA isoforms including I, II and XII. Cytosolic CA-I and CA-II are expressed in red blood
cells181, 182 and the binding of CA-IX targeted radiotracers to either isoform would increase
background signal and reduce image contrast. On the contrary, binding of these CA-IX targeted
radiotracers to CA-XII could be beneficial as CA-XII is expressed on membranes and is also up-
regulated in hypoxic tumours183. The inhibition constants (Ki) for human CA isoenzymes I, II,
IX, and XII were 4622, > 100000, 70, and 88 nM for FEC, respectively. The Ki values for U-104
have been previously reported to be 5080, 96, 45, and 4.5 nM for CA isoenzymes I, II, IX, and
XII, respectively85, 178.
The radiolabeling precursor, 7-(2-tosyloxyethoxy)coumarin, was prepared by coupling 7-
hydroxycoumarin with 1,2-bis(tosyloxy)ethane in 16% yield (Figure 2.2B), while radiosynthesis
of 18F-FEC was prepared via the 18F aliphatic nucleophilic substitution (Figure 2.3A). After
HPLC purification, 18F-FEC was obtained in 11-24% decay-corrected yield in 1.6 h synthesis
time with 62.9 – 210.9 GBq/µmol specific activity at the end of synthesis (EOS), and > 99%
radiochemistry purity. The preparation of 18F-U-104 was depicted in Figure 2.3B. The
radiosynthesis involved three reactions. First, 1-[18F]fluoro-4-nitrobenzene was prepared in 40-
60% radiochemical yield by direct aromatic nucleophilic substitution reaction using 18F-fluoride
and dinitrobenzene. The isolated 1-[18F]fluoro-4-nitrobenzene was reduced to 4-
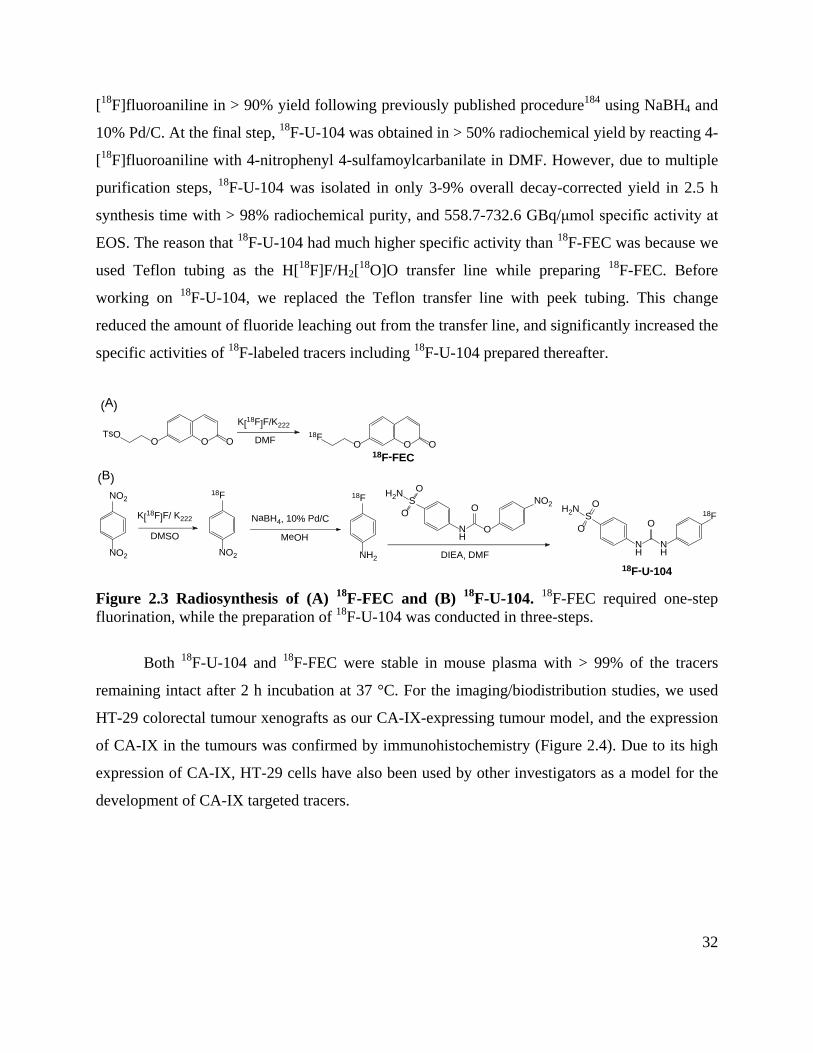
32
[18F]fluoroaniline in > 90% yield following previously published procedure184 using NaBH4 and
10% Pd/C. At the final step, 18F-U-104 was obtained in > 50% radiochemical yield by reacting 4-
[18F]fluoroaniline with 4-nitrophenyl 4-sulfamoylcarbanilate in DMF. However, due to multiple
purification steps, 18F-U-104 was isolated in only 3-9% overall decay-corrected yield in 2.5 h
synthesis time with > 98% radiochemical purity, and 558.7-732.6 GBq/μmol specific activity at
EOS. The reason that 18F-U-104 had much higher specific activity than 18F-FEC was because we
used Teflon tubing as the H[18F]F/H2[18O]O transfer line while preparing 18F-FEC. Before
working on 18F-U-104, we replaced the Teflon transfer line with peek tubing. This change
reduced the amount of fluoride leaching out from the transfer line, and significantly increased the
specific activities of 18F-labeled tracers including 18F-U-104 prepared thereafter.
18F-FEC
18F-U-104
K[18F]F/K222
O OOTsO DMF O OO
18F
NO2
NO2
18F
NO2
18F
NH2
SO
OH2N
NH
NH
O18FK[18F]F/ K222
DMSO
NaBH4, 10% Pd/C
MeOH
DIEA, DMF
SO
OH2N
NH
O
ONO2
(A)
(B)
Figure 2.3 Radiosynthesis of (A) 18F-FEC and (B) 18F-U-104. 18F-FEC required one-step fluorination, while the preparation of 18F-U-104 was conducted in three-steps.
Both 18F-U-104 and 18F-FEC were stable in mouse plasma with > 99% of the tracers
remaining intact after 2 h incubation at 37 °C. For the imaging/biodistribution studies, we used
HT-29 colorectal tumour xenografts as our CA-IX-expressing tumour model, and the expression
of CA-IX in the tumours was confirmed by immunohistochemistry (Figure 2.4). Due to its high
expression of CA-IX, HT-29 cells have also been used by other investigators as a model for the
development of CA-IX targeted tracers.
33
Figure 2.4 CA-IX expression in HT-29 colorectal cancer model. CA-IX expression in cell model was confirmed ex vivo with immunohistochemistry. Scale bar 0.1 mm.
The biodistribution data of 18F-U-104 (Table 2.1) indicated that the radioactivity was
excreted via both renal and hepatobiliary pathways. The uptake in intestines and kidneys at 1 h
p.i. were 13.66 ± 1.23 and 9.71 ± 1.68 %ID/g, respectively. Tumour uptake (%ID/g) of 18F-U-
104 at 1 h p.i. was 0.83 ± 0.06 which was lower than blood (13.92 ± 3.07), muscle (1.19 ± 0.20),
and major organs except brain (0.16 ± 0.01). High blood uptake of 18F-U-104 is likely due to the
binding to CA-II in erythrocytes. U-104 has good affinity (96 nM) for CA-II and it has been
shown that erythrocytes express high level of CA-II181, 182. Due to minimal uptake of 18F-U-104
in HT-29 tumours compared to normal tissues/organs, 18F-U-104 is not suitable for use for CA-
IX targeted imaging.
Biodistribution and PET imaging studies of 18F-FEC showed that the radioactivity was
excreted via both renal and hepatobiliary pathways (Table 2.1, Figure 2.5). In vivo defluorination
of 18F-FEC was likely as uptake in bone (2.09 ± 0.50 %ID/g) was higher than the uptake in both
blood (1.54 ± 0.44 %ID/g) and muscle (0.73 ± 0.13 %ID/g) at 1 h p.i. Tumour uptake of 18F-FEC
was 1.16 ± 0.19 %ID/g at 1 h p.i. The tumours were not visualized from PET image (Figure 2.5)
due to low tumour uptake and very high liver uptake (33.76 ± 8.31 %ID/g at 1 h p.i.). The high
uptake in the liver was not simply due to the hepatobiliary excretion of 18F-FEC as the uptake in
intestines was low (3.14 ± 1.24 %ID/g) and the uptake in the liver did not decrease over time
(Figure 2.6).
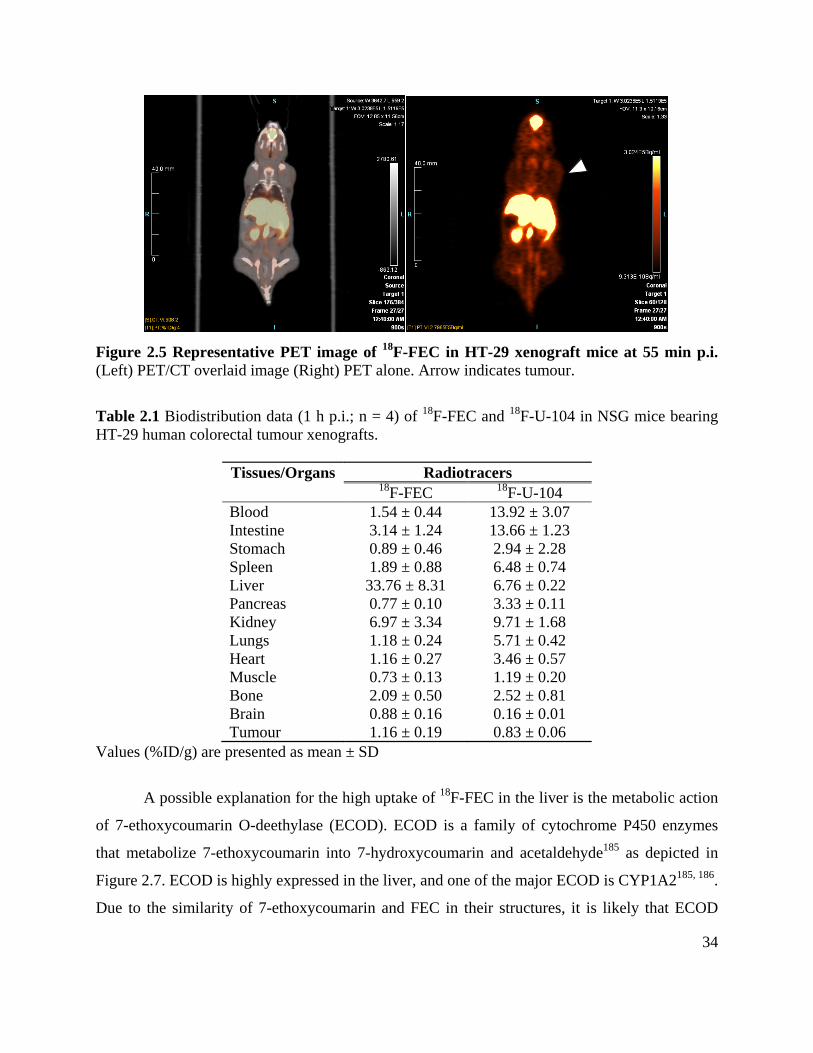
34
Figure 2.5 Representative PET image of 18F-FEC in HT-29 xenograft mice at 55 min p.i. (Left) PET/CT overlaid image (Right) PET alone. Arrow indicates tumour.
Table 2.1 Biodistribution data (1 h p.i.; n = 4) of 18F-FEC and 18F-U-104 in NSG mice bearing HT-29 human colorectal tumour xenografts.
Tissues/Organs Radiotracers 18F-FEC
18F-U-104 Blood 1.54 ± 0.44 13.92 ± 3.07 Intestine 3.14 ± 1.24 13.66 ± 1.23 Stomach 0.89 ± 0.46 2.94 ± 2.28 Spleen 1.89 ± 0.88 6.48 ± 0.74 Liver 33.76 ± 8.31 6.76 ± 0.22 Pancreas 0.77 ± 0.10 3.33 ± 0.11 Kidney 6.97 ± 3.34 9.71 ± 1.68 Lungs 1.18 ± 0.24 5.71 ± 0.42 Heart 1.16 ± 0.27 3.46 ± 0.57 Muscle 0.73 ± 0.13 1.19 ± 0.20 Bone 2.09 ± 0.50 2.52 ± 0.81 Brain 0.88 ± 0.16 0.16 ± 0.01 Tumour 1.16 ± 0.19 0.83 ± 0.06
Values (%ID/g) are presented as mean ± SD
A possible explanation for the high uptake of 18F-FEC in the liver is the metabolic action
of 7-ethoxycoumarin O-deethylase (ECOD). ECOD is a family of cytochrome P450 enzymes
that metabolize 7-ethoxycoumarin into 7-hydroxycoumarin and acetaldehyde185 as depicted in
Figure 2.7. ECOD is highly expressed in the liver, and one of the major ECOD is CYP1A2185, 186.
Due to the similarity of 7-ethoxycoumarin and FEC in their structures, it is likely that ECOD
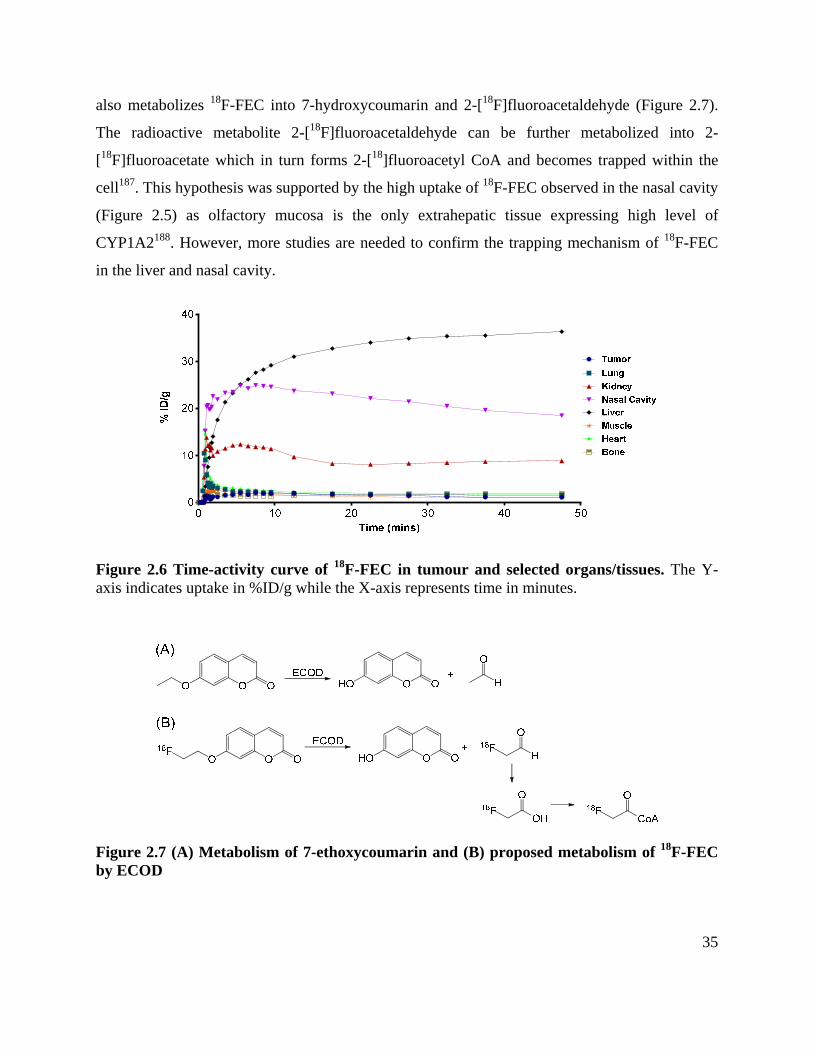
35
also metabolizes 18F-FEC into 7-hydroxycoumarin and 2-[18F]fluoroacetaldehyde (Figure 2.7).
The radioactive metabolite 2-[18F]fluoroacetaldehyde can be further metabolized into 2-
[18F]fluoroacetate which in turn forms 2-[18]fluoroacetyl CoA and becomes trapped within the
cell187. This hypothesis was supported by the high uptake of 18F-FEC observed in the nasal cavity
(Figure 2.5) as olfactory mucosa is the only extrahepatic tissue expressing high level of
CYP1A2188. However, more studies are needed to confirm the trapping mechanism of 18F-FEC
in the liver and nasal cavity.
Figure 2.6 Time-activity curve of 18F-FEC in tumour and selected organs/tissues. The Y-axis indicates uptake in %ID/g while the X-axis represents time in minutes.
Figure 2.7 (A) Metabolism of 7-ethoxycoumarin and (B) proposed metabolism of 18F-FEC by ECOD
36
2.4 Conclusion
We have synthesized two 18F-labeled CA-IX inhibitors, 18F-FEC and 18F-U-104, and
evaluated their potential as CA-IX targeted PET tracers. Both compounds showed good affinity
for CA-IX and excellent stability in mouse plasma. However, their uptake in CA-IX-expressing
HT-29 tumours was minimal which precludes their application as CA-IX imaging agents. The
unexpected trapping of 18F-FEC in the liver and nasal cavity could be due to the metabolism of 18F-FEC by ECOD. Once this is confirmed, 18F-FEC may be potentially used for imaging the
expression/activity of ECOD with PET.
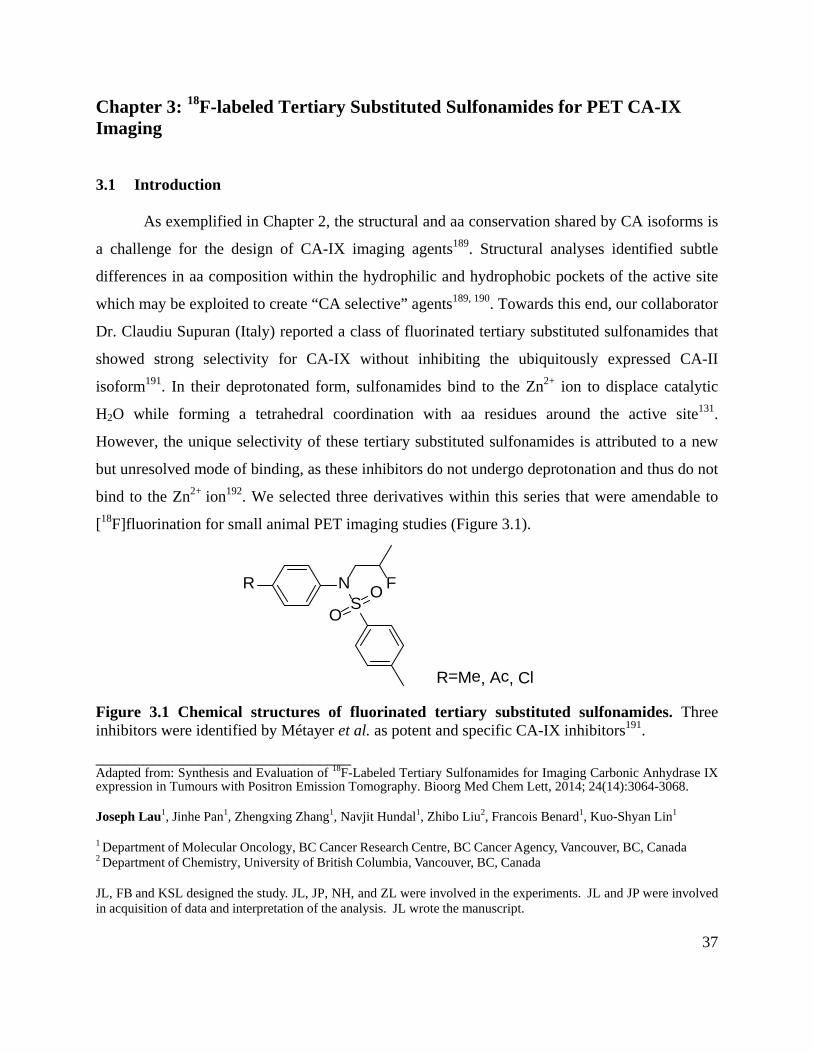
37
Chapter 3: 18F-labeled Tertiary Substituted Sulfonamides for PET CA-IX Imaging
3.1 Introduction
As exemplified in Chapter 2, the structural and aa conservation shared by CA isoforms is
a challenge for the design of CA-IX imaging agents189. Structural analyses identified subtle
differences in aa composition within the hydrophilic and hydrophobic pockets of the active site
which may be exploited to create “CA selective” agents189, 190. Towards this end, our collaborator
Dr. Claudiu Supuran (Italy) reported a class of fluorinated tertiary substituted sulfonamides that
showed strong selectivity for CA-IX without inhibiting the ubiquitously expressed CA-II
isoform191. In their deprotonated form, sulfonamides bind to the Zn2+ ion to displace catalytic
H2O while forming a tetrahedral coordination with aa residues around the active site131.
However, the unique selectivity of these tertiary substituted sulfonamides is attributed to a new
but unresolved mode of binding, as these inhibitors do not undergo deprotonation and thus do not
bind to the Zn2+ ion192. We selected three derivatives within this series that were amendable to
[18F]fluorination for small animal PET imaging studies (Figure 3.1).
R NS
FOO
R=Me, Ac, Cl Figure 3.1 Chemical structures of fluorinated tertiary substituted sulfonamides. Three inhibitors were identified by Métayer et al. as potent and specific CA-IX inhibitors191. ________________________________ Adapted from: Synthesis and Evaluation of 18F-Labeled Tertiary Sulfonamides for Imaging Carbonic Anhydrase IX expression in Tumours with Positron Emission Tomography. Bioorg Med Chem Lett, 2014; 24(14):3064-3068. Joseph Lau1, Jinhe Pan1, Zhengxing Zhang1, Navjit Hundal1, Zhibo Liu2, Francois Benard1, Kuo-Shyan Lin1
1 Department of Molecular Oncology, BC Cancer Research Centre, BC Cancer Agency, Vancouver, BC, Canada 2 Department of Chemistry, University of British Columbia, Vancouver, BC, Canada JL, FB and KSL designed the study. JL, JP, NH, and ZL were involved in the experiments. JL and JP were involved in acquisition of data and interpretation of the analysis. JL wrote the manuscript.
38
3.2 Materials and Methods
3.2.1 Chemicals and Instrumentation
Compounds 1a-c were prepared according to previously published procedures191. All other
chemicals and solvents were obtained from commercial sources, and used without further
purification. Proton NMR spectra were obtained using a Bruker (Billerica, MA, USA) Avance
400inv Spectrometer, and were reported in parts per million downfield from internal
tetramethylsilane. Mass analyses were performed using a Bruker Esquire-LC/MS system with
ESI ion source. Melting points were taken on a Fisher-Johns melting point apparatus (Fisher
Scientific, Pittsburgh, PA) and were uncorrected. Purification and quality control of 18F-labeled
4a-c were performed on an Agilent (Santa Clara, CA, USA) HPLC System equipped with a
model 1200 quaternary pump, a model 1200 UV absorbance detector, and a Bioscan
(Washington DC, USA) NaI scintillation detector. The radio-detector was connected to a
Bioscan B-FC-1000 Flow-count system, and the output from the Bioscan Flow-count system was
fed into an Agilent 35900E Interface which converted the analog signal to digital signal. The
operation of the Agilent HPLC system was controlled using the Agilent ChemStation software.
The HPLC columns used were a semi-preparative column (Phenomenex C18, 5 µ, 250 × 10 mm)
and an analytical column (Eclipse XOB-C18, 5 µ, 150 × 4 mm). 18F-Fluoride was produced by
the 18O(p, n)18F reaction using an Advanced Cyclotron Systems Inc. (Richmond, BC, Canada)
TR19 cyclotron. Radioactivity of 18F-labeled 4a-c were measured using a Capintec (Ramsey, NJ,
USA) CRC®-25R/W dose calibrator, and the radioactivity of mouse tissues collected from
biodistribution studies were counted using a Packard Cobra II 5000 Series auto-gamma counter.
PET imaging experiments were conducted using a Siemens (Malvern, PA, USA) Inveon
microPET/CT scanner.
3.2.2 Syntheses of Precursors and Standards
3.2.2.1 N-(2-hydroxypropyl)-4-methyl-N-(4-methylphenyl)benzenesulfonamide (2a)
A solution of 1a (1.22 g, 4.67 mmol), K2CO3 (1.29 g, 9.35 mmol), and propylene oxide (1.4 mL,
20 mmol) in DMF (6 mL) was heated at 80 °C overnight. After cooling to room temperature, the
reaction mixture was diluted with water (100 mL), and extracted with ethyl acetate (100 mL).
39
The ethyl acetate layer was dried with anhydrous MgSO4, concentrated under reduced pressure,
and chromatographed on silica gel using 35:65 ethyl acetate/hexane to obtain the desired product
2a as a light brown oil (1.38 g, 92%). 1H NMR (CDCl3) δ 7.50 (d, J = 8.2 Hz, 2H, Ar–H), 7.27
(d, J = 8.2 Hz, 2H, Ar–H), 7.12 (d, J = 8.2 Hz, 2H, Ar–H), 6.95 (d, J = 8.2 Hz, 2H, Ar–H), 3.91
– 3.69 (m, 1H, CH), 3.59 (dd, J = 13.7, 8.3 Hz, 1H, CH2), 3.36 (dd, J = 13.7, 3.5 Hz, 1H, CH2),
2.44 (s, 3H, CH3), 2.35 (s, 3H, CH3), 1.15 (d, J = 6.3 Hz, 3H, CH3). MS (ESI) calculated for
C17H21NO3S 319.1, found (M + H)+ 320.3.
3.2.2.2 N-(4-Acetylphenyl)-N-(2-hydroxypropyl)-4-methylbenzenesulfonamide (2b)
Following similar procedures as described for the preparation of 2a by starting with 1b (1.07 g,
3.69 mmol), K2CO3 (1.02 g, 7.38 mmol), and propylene oxide (1.4 mL, 20 mmol) in DMF (6
mL), 1.25 g (98%) of 2b was obtained as a colourless oil after chromatography on silica gel
using 35:65 ethyl acetate/hexane. 1H NMR (CDCl3) δ 7.50 (d, J = 8.2 Hz, 2H, Ar–H), 7.27 (d, J
= 8.2 Hz, 2H, Ar–H), 7.12 (d, J = 8.2 Hz, 2H, Ar–H), 6.95 (d, J = 8.2 Hz, 2H, Ar–H), 3.91 – 3.69
(m, 1H, CH), 3.59 (dd, J = 13.7, 8.3 Hz, 1H, CH2), 3.36 (dd, J = 13.7, 3.5 Hz, 1H, CH2), 2.44 (s,
3H, CH3), 2.35 (s, 3H, CH3), 1.15 (d, J = 6.3 Hz, 3H, CH3). MS (ESI) calculated for C18H21NO4S
347.1, found (M + Na)+ 370.1.
3.2.2.3 N-(4-Chlorophenyl)-N-(2-hydroxypropyl)-4-methylbenzenesulfonamide (2c)
Following similar procedures as described for the preparation of 2a by starting with 1c (1.41 g,
4.14 mmol), K2CO3 (1.14 g, 8.29 mmol), and propylene oxide (1.4 mL, 20 mmol) in DMF (6
mL), 1.40 g (99%) of 2c was obtained as a colourless oil after chromatography on silica gel
using 20:80 ethyl acetate/hexane. 1H NMR (CDCl3) δ 7.48 (d, J = 8.3 Hz, 2H, Ar–H), 7.38 –
7.20 (m, 4H, Ar–H), 7.12 – 6.94 (m, 2H, Ar–H), 3.90 – 3.71 (m, 1H, CH), 3.58 (dd, J = 13.8, 8.1
Hz, 1H, CH2), 3.38 (dd, J = 13.8, 3.8 Hz, 1H, CH2), 2.44 (s, 3H, CH3), 1.17 (d, J = 6.3 Hz, 3H,
CH3). MS (ESI) calculated for C16H18ClNO3S 339.1, found (M + H)+ 340.2.
40
3.2.2.4 4-Methyl-N-(4-methylphenyl)-N-(2-tosyloxypropyl)benzenesulfonamide (3a)
A solution of 2a (1.37 g, 4.29 mmol) in CH2Cl2 (20 mL) was added sequentially to p-
toluenesulfonyl chloride (1.13 g, 5.95 mmol), trimethylamine hydrochloride (410 mg, 4.29
mmol), and diisopropylethylamine (1.42 mL, 8.58 mmol). After stirring at room temperature
overnight, the solution was diluted with CH2Cl2 (80 mL), washed with 1N HCl (100 mL), and
saturated NaHCO3 aqueous solution (100 mL). The CH2Cl2 layer was dried with anhydrous
MgSO4, concentrated under reduced pressure, and chromatographed on silica gel using 25:75
ethyl acetate/hexane to obtain the desired product 3a as a white solid (1.76 mg, 86%), mp: 123-
125°C. 1H NMR (CDCl3) δ 7.69 (d, J = 8.2 Hz, 2H, Ar–H), 7.39 (d, J = 8.2 Hz, 2H, Ar–H), 7.34
– 7.19 (m, 4H, Ar–H), 7.06 (d, J = 8.2 Hz, 2H, Ar–H), 6.77 (d, J = 8.2 Hz, 2H, Ar–H), 4.76 –
4.53 (m, 1H, CH), 3.67 (dd, J = 13.8, 5.5 Hz, 1H, CH2), 3.56 (dd, J = 13.8, 7.1 Hz, 1H, CH2),
2.46 (s, 3H, CH3), 2.43 (s, 3H, CH3), 2.34 (s, 3H, CH3), 1.33 (d, J = 6.3 Hz, 3H, CH3). MS (ESI)
calculated for C24H27NO5S2 473.1, found (M + H)+ 474.2.
3.2.2.5 N-(4-Acetylphenyl)-4-methyl-N-(2-tosyloxypropyl)benzenesulfonamide (3b)
Following similar procedures as described for the preparation of 3a by starting with 2b (380 mg,
1.09 mmol), p-toluenesulfonyl chloride (313 mg, 1.64 mmol), trimethylamine hydrochloride
(105 mg, 1.09 mmol), and diisopropylethylamine (0.38 mL, 2.19 mmol), 424 mg (77%) of 3b
was obtained as a white solid after chromatographed on silica gel using 30:70 ethyl
acetate/hexane. mp: 112-114 °C 1H NMR (CDCl3) δ 7.85 (d, J = 8.5 Hz, 2H, Ar–H), 7.67 (d, J =
8.2 Hz, 2H, Ar–H), 7.37 (d, J = 8.2 Hz, 2H, Ar–H), 7.31 (d, J = 8.1 Hz, 2H, Ar–H), 7.24 (d, J =
8.1 Hz, 2H, Ar–H), 7.05 (d, J = 8.5 Hz, 2H, Ar–H), 4.78 – 4.51 (m, 1H, CH), 3.75 (dd, J = 14.2,
5.6 Hz, 1H, CH2), 3.65 (dd, J = 14.2, 6.5 Hz, 1H, CH2), 2.61 (s, 3H, CH3), 2.46 (s, 3H, CH3),
2.43 (s, 3H, CH3), 1.32 (d, J = 6.3 Hz, 3H, CH3). MS (ESI) calculated for C25H27NO6S2 501.1,
found (M + H)+ 502.2.
3.2.2.6 N-(4-Chlorophenyl)-4-methyl-N-(2-tosyloxypropyl)benzenesulfonamide (3c)
Following similar procedures as described for the preparation of 3a by starting with 2c (353 mg,
1.04 mmol), p-toluenesulfonyl chloride (297 mg, 1.56 mmol), trimethylamine hydrochloride
41
(99.3 mg, 1.04 mmol), and diisopropylethylamine (0.36. mL, 2.08 mmol), 416 mg (91%) of 3c
was obtained as a white solid after chromatographed on silica gel using 17:83 ethyl
acetate/hexane. mp: 150-151 °C 1H NMR (CDCl3) δ 7.67 (d, J = 8.2 Hz, 2H, Ar–H), 7.39 (d, J =
8.2 Hz, 2H, Ar–H), 7.31 (d, J = 8.1 Hz, 2H, Ar–H), 7.27 – 7.18 (m, 4H, Ar–H), 6.84 (d, J = 8.7
Hz, 2H, Ar–H), 4.75 – 4.55 (m, 1H, CH), 3.69 (dd, J = 14.1, 5.5 Hz, 1H, CH2), 3.60 (dd, J =
14.1, 6.5 Hz, 1H, CH2), 2.46 (s, 3H, CH3), 2.43 (s, 3H, CH3), 1.33 (d, J = 6.3 Hz, 3H, CH3). MS
(ESI) calculated for C23H24ClNO5S2 493.1, found (M + H)+ 494.1.
3.2.2.7 N-(2-Fluoropropyl)-4-methyl-N-(4-methylphenyl)benzenesulfonamide (4a)
A solution of 3a (614 mg, 1.30 mmol) in THF (5 mL) was added to tetrabutylammonium
fluoride (1M solution in THF, 3 mL). The resulting solution was heated at 50 °C overnight. After
volatile solvent was removed under reduced pressure, the residue was dissolved in diethyl ether
(100 mL), and washed with water (100 mL). The diethyl ether layer was dried with anhydrous
MgSO4, concentrated under reduced pressure, and chromatographed on silica gel using 15:85
ethyl acetate/hexane to obtain the desired product 4a as a white solid (27 mg, 6.5%), mp: 64-
65°C. 1H NMR (CDCl3) δ 7.49 (d, J = 8.2 Hz, 2H, Ar–H), 7.26 (d, J = 8.1 Hz, 2H, Ar–H), 7.11
(d, J = 8.1 Hz, 2H, Ar–H), 6.95 (d, J = 8.2 Hz, 2H, Ar–H), 4.91 – 4.52 (m, 1H, CH), 3.85 – 3.52
(m, 2H, CH2), 2.43 (s, 3H, CH3), 2.34 (s, 3H, CH3), 1.35 (dd, J = 23.7, 6.3 Hz, 3H, CH3). MS
(ESI) calculated for C17H20FNO2S 321.1, found (M + H)+ 322.3.
3.2.2.8 N-(4-Acetylphenyl)-N-(2-fluoropropyl)-4-methylbenzenesulfonamide (4b)
A solution of diethylaminosulfur trifluoride (0.387 mL, 1.78 mmol) in CH2Cl2 (2 mL) was added
dropwise to a solution of 2b (310 mg, 0.89 mmol) in anhydrous CH2Cl2 (10 mL). After stirring at
room temperature overnight, the solution was diluted with CH2Cl2 (80 mL) and washed with
saturated NaHCO3 aqueous solution (100 mL). The CH2Cl2 layer was dried with anhydrous
MgSO4, concentrated under reduced pressure, and chromatographed on silica gel using 25:75
ethyl acetate/hexane to obtain the desired product 4b as a white solid (73.2 mg, 23%), mp: 97-
99°C. 1H NMR (CDCl3) δ 7.91 (d, J = 8.5 Hz, 2H, Ar–H), 7.46 (d, J = 8.2 Hz, 2H, Ar–H), 7.34 –
7.12 (m, 4H, Ar–H), 4.98 – 4.60 (m, 1H, CH), 3.90 – 3.60 (m, 2H, CH2), 2.61 (s, 3H, CH3), 2.43
42
(s, 3H, CH3), 1.36 (dd, J = 23.7, 6.3 Hz, 3H, CH3). MS (ESI) calculated for C18H20FNO3S 349.1,
found (M + H)+ 350.2.
3.2.2.9 N-(4-Chlorophenyl)-N-(2-fluoropropyl)-4-methylbenzenesulfonamide (4c)
Following similar procedures as described for the preparation of 4b by starting with 2c (500 mg,
1.47 mmol) and diethylaminosulfur trifluoride (0.638 mL, 2.94 mmol), 219 mg (44%) of 4c was
obtained as a white solid after chromatography on silica gel using 16:84 ethyl acetate/hexane.
mp: 73-74 °C 1H NMR (CDCl3) δ 7.48 (d, J = 8.2 Hz, 2H, Ar–H), 7.32 – 7.22 (m, 4H, Ar–H),
7.01 (d, J = 8.2 Hz, 2H, Ar–H), 4.93 – 4.56 (m, 1H, CH), 3.81 – 3.55 (m, 2H, CH2), 2.44 (s, 3H,
CH3), 1.35 (dd, J = 23.7, 6.3 Hz, 3H, CH3). MS (ESI) calculated for C16H17ClFNO2S 341.1,
found (M + H)+ 342.2.
3.2.3 Radiosyntheses of [18F]4a-c
The proton-bombarded H2[18O]O was transferred via He gas from the cyclotron target station to
a Waters QMA light Sep-Pak cartridge set up in a hot cell. The 18F-fluoride was trapped in the
QMA cartridge, and eluted out into a 4-mL V-shaped reaction vial with a mixture of 0.1 mL
TBAHCO3 (0.5 M in CH3CN, 0.1 mL), water (0.3 mL) and CH3CN (0.6 mL). The uncapped
reaction vial was placed in a heating block, and the solution was heated at 120 °C. After most of
the solvents evaporated, CH3CN (1 mL × 2) was added to the reaction vial to facilitate complete
removal of water. A solution of tosylate precursor 3a-c (3 mg) in DMF (0.5 mL) was added to
the reaction vial. The vial was capped, and the mixture was heated at 125 °C for 20 min. At the
end of heating, the mixture was diluted with water (1 mL) and purified by HPLC using the semi-
preparative column eluted with 65% CH3CN in water at a flow rate of 4.5 mL/min for [18F]4a
and [18F]4c, or 55% CH3CN at a flow rate of 4.5 mL/min for [18F]4b. The retention times of
[18F]4a-c were 14.6, 15.2, and 14.9 min, respectively. The eluting fraction containing the desired 18F-labeled tracer was collected, diluted with water (50 mL), and trapped on a Waters tC18 light
Sep-Pak cartridge. After washing the tC18 light Sep-Pak cartridge with water (10 mL), 18F-
labeled tracer was eluted out with ethanol (0.4 mL), and formulated with saline (4 mL) for
plasma stability, biodistribution, and µPET/CT imaging studies. Quality control was performed
by HPLC on the analytical column eluted with 65% CH3CN in water at a flow rate of 2.0
43
mL/min for [18F]4a and [18F]4c, and 55% CH3CN in water at a flow rate of 2.0 mL/min for
[18F]4b. The retention times of [18F]4a-c were 7.12, 8.14, and 8.17 min, respectively. The
specific activities of [18F]4a-c were measured using the analytical HPLC system. It was
calculated by dividing the injected radioactivity in 0.2 mL of final 18F-labeled tracer solution by
the mass of the tracer in the injected solution. The mass of the tracer was estimated by comparing
the UV absorbance obtained from the injection with a previously prepared standard curve.
3.2.4 Stability in Mouse Plasma
100 µL aliquots of [18F]4a-c were incubated with 400 µL of BALB/c mouse plasma (available
from Innovative Research) for 5, 15, 30, 60, and 120 minutes at 37 °C. At the end of each
incubation period, samples were passed through a 0.45 micron filter. The filtered samples were
loaded onto the analytical radio-HPLC to check for the presence of metabolite(s), and analyses
were conducted with Agilent ChemStation software.
3.2.5 LogD7.4 Measurements
LogD7.4 was determined according to previously published procedures193. Briefly, an aliquot of 18F-labeled tracer was added to a vial containing 2.5 ml of octanol and 2.5 ml of 0.1 M phosphate
buffer (pH=7.4). The mixture was vortexed for 2 min and then centrifuged at 5,000 rpm for 2
min. A sample of the octanol (0.1 ml) and buffer (1 ml) layers was taken and counted in a well-
type counter. LogD7.4 was calculated using the following equation: LogD7.4 = log10 [((counts in
octanol phase) × 10)/(counts in buffer phase)]. The major portion of the octanol layer (2.0 ml)
was diluted with 0.5 ml of octanol and mixed with a fresh portion of 2.5 ml of phosphate buffer.
The equilibration procedure described above was repeated until a constant value of LogD7.4 was
obtained.
3.2.6 In Vivo Experiments
Mice were maintained and in vivo experiments were conducted in accordance with the
guidelines established by the Canadian Council on Animal Care and approved by the Animal
Ethics Committee of the University of British Columbia.
44
3.2.6.1 Tumour Implantation
All experiments were performed using NOD.Cg-PrkdcscidIl2rgtm1Wjl/SzJ (NSG) mice bred in-
house at the Animal Research Centre, British Columbia Cancer Research Centre, Vancouver,
Canada. Mice were anesthetized briefly with 2.5% isoflurane in 2.0 L/min of oxygen during cells
implantation. After wiping skin surrounding the injection site with an alcohol prep pad, a 31-
Gauge needle was used to subcutaneously implant 5 x 10⁶ HT-29 cells (in 100 µL of 1 x PBS
and BD Matrigel Matrix at 1:1 ratio) under the right shoulder. Biodistribution studies and
PET/CT imaging were performed when tumours reached 5-7mm in diameter.
3.2.6.2 PET Imaging and Biodistribution Studies
Under anesthesia, 3.7-7.4 MBq of 18F-labeled tracer was administered intravenously through the
caudal vein into HT-29 tumour bearing mice (n = 4 per tracer). CT scan was performed before a
PET dynamic image sequence of 55 minutes. PET data were acquired in list mode acquisition.
At 1 h p.i. mice were euthanized by CO2 asphyxiation followed by cervical dislocation. Tissues
of interest (blood, fat, intestine, stomach, spleen, liver, pancreas, kidney, lung, heart, muscle,
bone, brain, and tumour) were harvested. Tissues of interest were rinsed with saline (exception
of blood), blotted dry, weighed and counted to determine the percentage of injected dose per
gram (%ID/g) of tissue. The PET data were reconstructed using the 3d-OSEM-MAP algorithm
with CT-based attenuation correction. 3D regions of interest (ROI) were placed on the
reconstructed images to determine the %ID/g of tissue using the Inveon Research Workplace
software (IRW).
3.3 Results and Discussion
The synthesis of standards 4a-c and their respective radiolabeling tosylate precursors 3a-
c are illustrated in Figure 3.2. The starting sulfonamides 1a-c were prepared according to
published procedures191. Coupling of sulfonamides 1a-c with excess propylene oxide in DMF in
the presence of K2CO3 as base afforded the desired secondary alcohols 2a-c in excellent yield
(92-99%). Initially, we attempted to prepare mesylate precursors for radiolabeling. However, we
found out that it was difficult to separate the desired mesylates from their respective alcohol
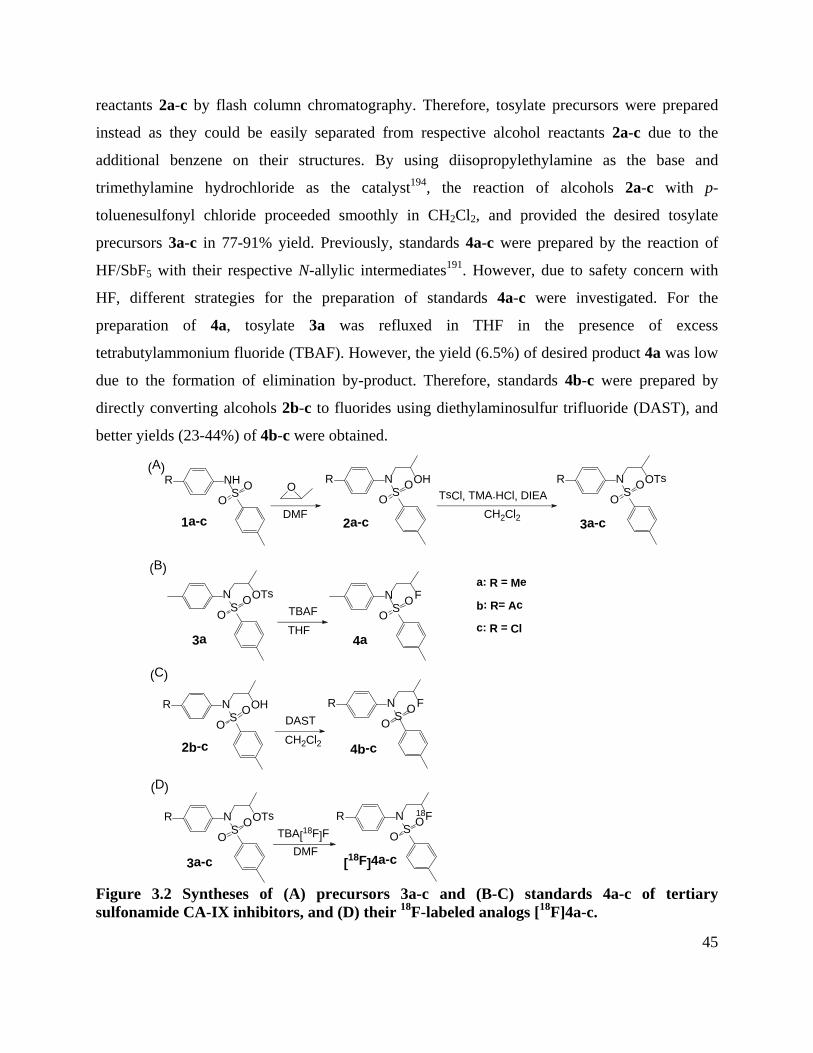
45
reactants 2a-c by flash column chromatography. Therefore, tosylate precursors were prepared
instead as they could be easily separated from respective alcohol reactants 2a-c due to the
additional benzene on their structures. By using diisopropylethylamine as the base and
trimethylamine hydrochloride as the catalyst194, the reaction of alcohols 2a-c with p-
toluenesulfonyl chloride proceeded smoothly in CH2Cl2, and provided the desired tosylate
precursors 3a-c in 77-91% yield. Previously, standards 4a-c were prepared by the reaction of
HF/SbF5 with their respective N-allylic intermediates191. However, due to safety concern with
HF, different strategies for the preparation of standards 4a-c were investigated. For the
preparation of 4a, tosylate 3a was refluxed in THF in the presence of excess
tetrabutylammonium fluoride (TBAF). However, the yield (6.5%) of desired product 4a was low
due to the formation of elimination by-product. Therefore, standards 4b-c were prepared by
directly converting alcohols 2b-c to fluorides using diethylaminosulfur trifluoride (DAST), and
better yields (23-44%) of 4b-c were obtained.
R NHSO
O R NSO
OOH R NSO
OOTs
NSO
OOTs NSO
OF
R NSO
OOH R NSO
OF
R NSO
OOTs R NSO
O18F
(A)
(B)
(C)
(D)
O
DMF
CH2Cl2
DAST
THFTBAF
CH2Cl2
TsCl, TMA.HCl, DIEA
DMFTBA[18F]F
1a-c 2a-c 3a-c
2b-c 4b-c
3a 4a
3a-c [18F]4a-c
a: R = Me
b: R= Ac
c: R = Cl
Figure 3.2 Syntheses of (A) precursors 3a-c and (B-C) standards 4a-c of tertiary sulfonamide CA-IX inhibitors, and (D) their 18F-labeled analogs [18F]4a-c.
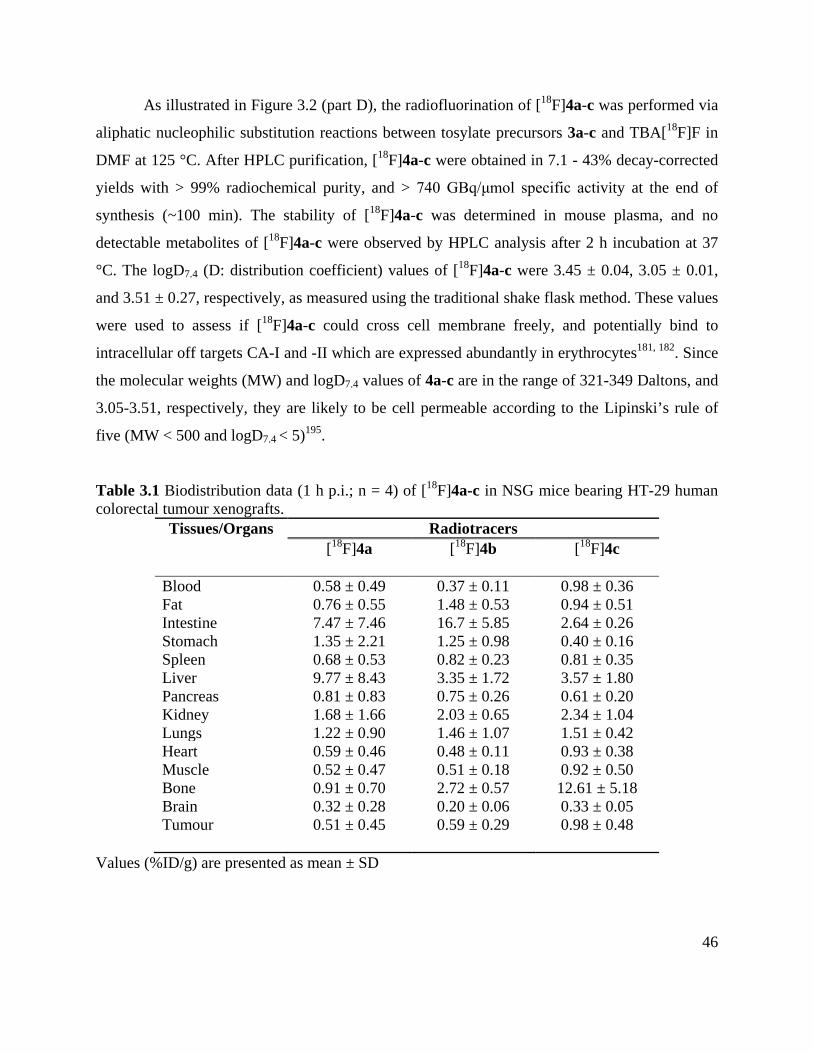
46
As illustrated in Figure 3.2 (part D), the radiofluorination of [18F]4a-c was performed via
aliphatic nucleophilic substitution reactions between tosylate precursors 3a-c and TBA[18F]F in
DMF at 125 °C. After HPLC purification, [18F]4a-c were obtained in 7.1 - 43% decay-corrected
yields with > 99% radiochemical purity, and > 740 GBq/μmol specific activity at the end of
synthesis (~100 min). The stability of [18F]4a-c was determined in mouse plasma, and no
detectable metabolites of [18F]4a-c were observed by HPLC analysis after 2 h incubation at 37
°C. The logD7.4 (D: distribution coefficient) values of [18F]4a-c were 3.45 ± 0.04, 3.05 ± 0.01,
and 3.51 ± 0.27, respectively, as measured using the traditional shake flask method. These values
were used to assess if [18F]4a-c could cross cell membrane freely, and potentially bind to
intracellular off targets CA-I and -II which are expressed abundantly in erythrocytes181, 182. Since
the molecular weights (MW) and logD7.4 values of 4a-c are in the range of 321-349 Daltons, and
3.05-3.51, respectively, they are likely to be cell permeable according to the Lipinski’s rule of
five (MW < 500 and logD7.4 < 5)195.
Table 3.1 Biodistribution data (1 h p.i.; n = 4) of [18F]4a-c in NSG mice bearing HT-29 human colorectal tumour xenografts.
Tissues/Organs Radiotracers [18F]4a [18F]4b [18F]4c
Blood 0.58 ± 0.49 0.37 ± 0.11 0.98 ± 0.36 Fat 0.76 ± 0.55 1.48 ± 0.53 0.94 ± 0.51 Intestine 7.47 ± 7.46 16.7 ± 5.85 2.64 ± 0.26 Stomach 1.35 ± 2.21 1.25 ± 0.98 0.40 ± 0.16 Spleen 0.68 ± 0.53 0.82 ± 0.23 0.81 ± 0.35 Liver 9.77 ± 8.43 3.35 ± 1.72 3.57 ± 1.80 Pancreas 0.81 ± 0.83 0.75 ± 0.26 0.61 ± 0.20 Kidney 1.68 ± 1.66 2.03 ± 0.65 2.34 ± 1.04 Lungs 1.22 ± 0.90 1.46 ± 1.07 1.51 ± 0.42 Heart 0.59 ± 0.46 0.48 ± 0.11 0.93 ± 0.38 Muscle 0.52 ± 0.47 0.51 ± 0.18 0.92 ± 0.50 Bone 0.91 ± 0.70 2.72 ± 0.57 12.61 ± 5.18 Brain 0.32 ± 0.28 0.20 ± 0.06 0.33 ± 0.05 Tumour 0.51 ± 0.45 0.59 ± 0.29 0.98 ± 0.48
Values (%ID/g) are presented as mean ± SD
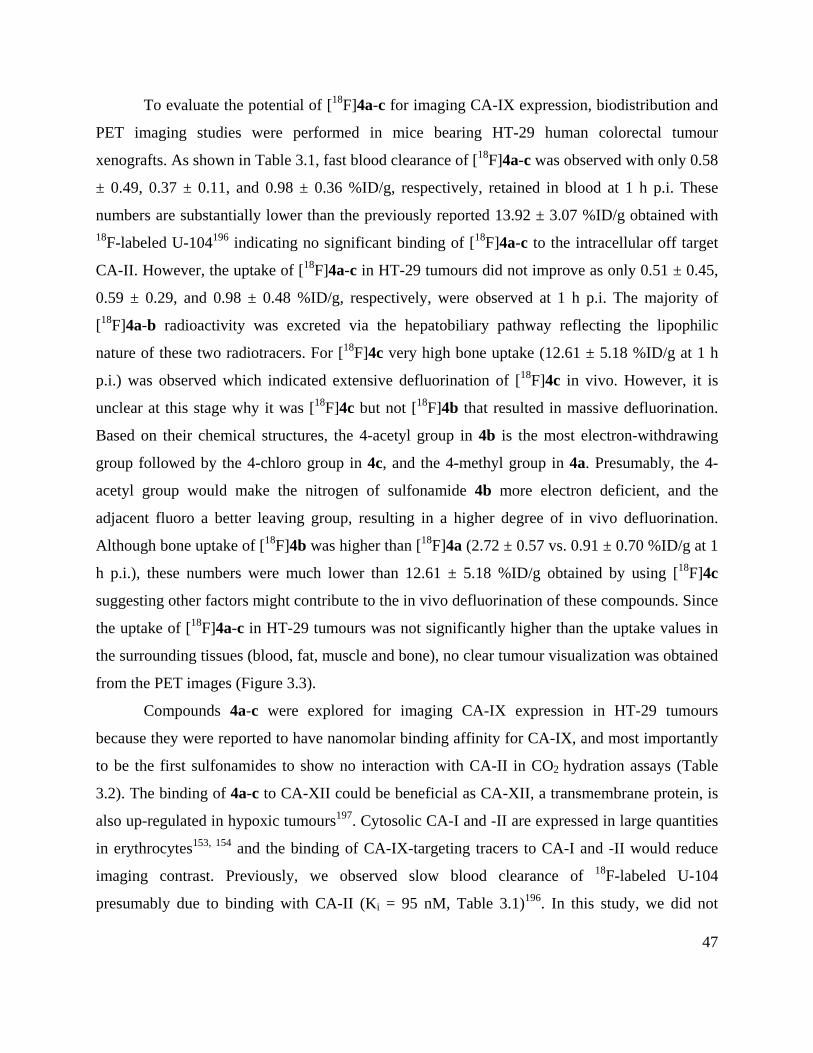
47
To evaluate the potential of [18F]4a-c for imaging CA-IX expression, biodistribution and
PET imaging studies were performed in mice bearing HT-29 human colorectal tumour
xenografts. As shown in Table 3.1, fast blood clearance of [18F]4a-c was observed with only 0.58
± 0.49, 0.37 ± 0.11, and 0.98 ± 0.36 %ID/g, respectively, retained in blood at 1 h p.i. These
numbers are substantially lower than the previously reported 13.92 ± 3.07 %ID/g obtained with 18F-labeled U-104196 indicating no significant binding of [18F]4a-c to the intracellular off target
CA-II. However, the uptake of [18F]4a-c in HT-29 tumours did not improve as only 0.51 ± 0.45,
0.59 ± 0.29, and 0.98 ± 0.48 %ID/g, respectively, were observed at 1 h p.i. The majority of
[18F]4a-b radioactivity was excreted via the hepatobiliary pathway reflecting the lipophilic
nature of these two radiotracers. For [18F]4c very high bone uptake (12.61 ± 5.18 %ID/g at 1 h
p.i.) was observed which indicated extensive defluorination of [18F]4c in vivo. However, it is
unclear at this stage why it was [18F]4c but not [18F]4b that resulted in massive defluorination.
Based on their chemical structures, the 4-acetyl group in 4b is the most electron-withdrawing
group followed by the 4-chloro group in 4c, and the 4-methyl group in 4a. Presumably, the 4-
acetyl group would make the nitrogen of sulfonamide 4b more electron deficient, and the
adjacent fluoro a better leaving group, resulting in a higher degree of in vivo defluorination.
Although bone uptake of [18F]4b was higher than [18F]4a (2.72 ± 0.57 vs. 0.91 ± 0.70 %ID/g at 1
h p.i.), these numbers were much lower than 12.61 ± 5.18 %ID/g obtained by using [18F]4c
suggesting other factors might contribute to the in vivo defluorination of these compounds. Since
the uptake of [18F]4a-c in HT-29 tumours was not significantly higher than the uptake values in
the surrounding tissues (blood, fat, muscle and bone), no clear tumour visualization was obtained
from the PET images (Figure 3.3).
Compounds 4a-c were explored for imaging CA-IX expression in HT-29 tumours
because they were reported to have nanomolar binding affinity for CA-IX, and most importantly
to be the first sulfonamides to show no interaction with CA-II in CO2 hydration assays (Table
3.2). The binding of 4a-c to CA-XII could be beneficial as CA-XII, a transmembrane protein, is
also up-regulated in hypoxic tumours197. Cytosolic CA-I and -II are expressed in large quantities
in erythrocytes153, 154 and the binding of CA-IX-targeting tracers to CA-I and -II would reduce
imaging contrast. Previously, we observed slow blood clearance of 18F-labeled U-104
presumably due to binding with CA-II (Ki = 95 nM, Table 3.1)196. In this study, we did not
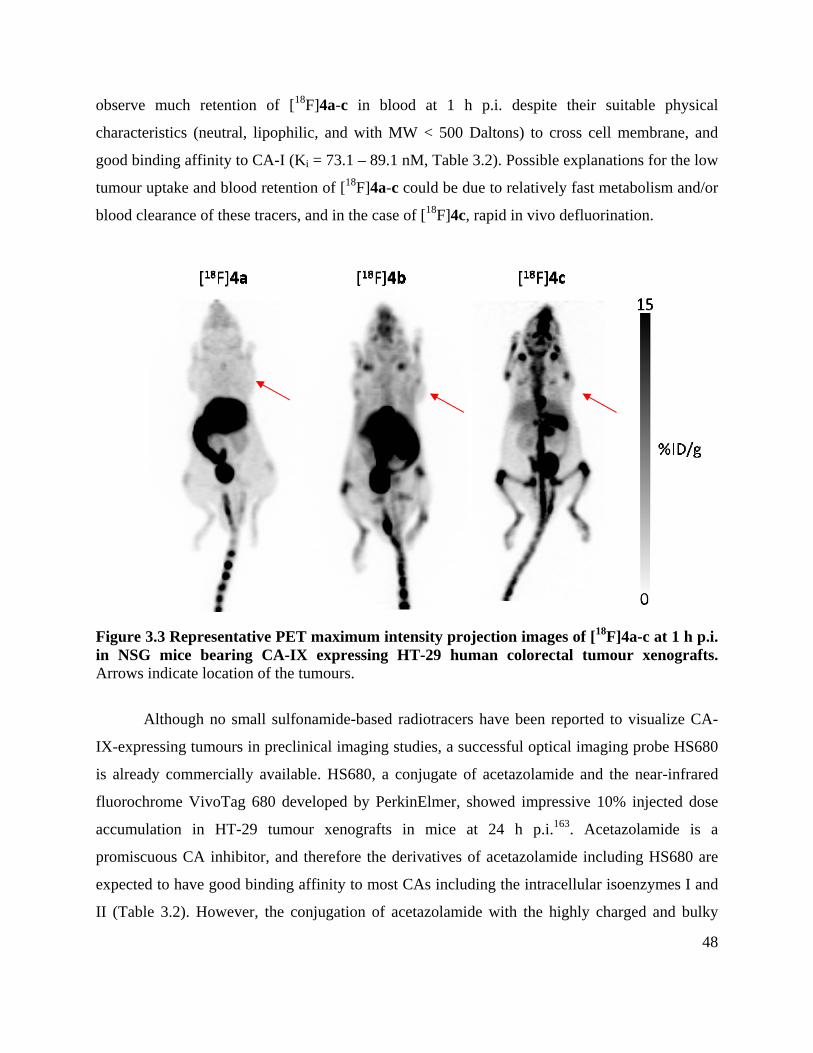
48
observe much retention of [18F]4a-c in blood at 1 h p.i. despite their suitable physical
characteristics (neutral, lipophilic, and with MW < 500 Daltons) to cross cell membrane, and
good binding affinity to CA-I (Ki = 73.1 – 89.1 nM, Table 3.2). Possible explanations for the low
tumour uptake and blood retention of [18F]4a-c could be due to relatively fast metabolism and/or
blood clearance of these tracers, and in the case of [18F]4c, rapid in vivo defluorination.
Figure 3.3 Representative PET maximum intensity projection images of [18F]4a-c at 1 h p.i. in NSG mice bearing CA-IX expressing HT-29 human colorectal tumour xenografts. Arrows indicate location of the tumours.
Although no small sulfonamide-based radiotracers have been reported to visualize CA-
IX-expressing tumours in preclinical imaging studies, a successful optical imaging probe HS680
is already commercially available. HS680, a conjugate of acetazolamide and the near-infrared
fluorochrome VivoTag 680 developed by PerkinElmer, showed impressive 10% injected dose
accumulation in HT-29 tumour xenografts in mice at 24 h p.i.163. Acetazolamide is a
promiscuous CA inhibitor, and therefore the derivatives of acetazolamide including HS680 are
expected to have good binding affinity to most CAs including the intracellular isoenzymes I and
II (Table 3.2). However, the conjugation of acetazolamide with the highly charged and bulky
49
(MW > 1,000 Daltons) VivoTag 680 prevents it from crossing the cell membrane and binding to
intracellular off targets. The success of HS680 could be a valuable lesson for the future design of
radiotracers for imaging CA-IX expression with PET or SPECT. Instead of radiolabeling CA-IX-
specific inhibitors which may be difficult to synthesize, the design of cell-impermeable
sulfonamide-based radiotracers represents an easier and quicker solution. This could be
achieved, for example, by conjugating the CA-targeting sulfonamide moiety with a
polyaminocarboxylate chelator for labeling with radiometal such as 68Ga, 64Cu, or 111In for
imaging. The radiometal-polyaminocarboxylate-chelator complexes are generally highly
hydrophilic and charged, and would prevent the radiolabeled sulfonamide conjugates from
entering cells. Another promising alternative is the use of a multivalent design. This approach
combines several CA-targeting sulfonamides into one single molecule, which could potentially
enhance binding affinity to CA-IX and afford cell impermeability from accumulation of MW.
Table 3.2 Reported inhibition constants (Ki, nM) of acetazolamide178, HS680162, U-104178, and tertiary sulfonamides 4a-c191 to human CA isoenzymes I, II, IX and XII.
Errors in the range of 5-10% of the reported value from three different assays.
3.4 Conclusion
In conclusion, we successfully synthesized and radiolabeled tertiary
benzenesulfonamides 4a-c, and evaluated their potential as CA-IX imaging agents. Despite their
good affinity and selectivity for CA-IX, imaging and biodistribution data showed only minimal
tumour uptake in xenograft mice relative to normal tissues. Therefore, [18F]4a-c are not suitable
for CA-IX targeted molecular imaging.
Compounds CA-I CA-II CA-IX CA-XII acetazolamide 250 12 25 5.7
HS680 - 248 7.5 35 U-104 5,080 95 45 4.5
4a (R = Me) 73.1 Not active 9.3 33.6 4b (R = Ac) 89.1 Not active 9.6 83.8 4c (R = Cl) 77.3 Not active 9.1 100
R NSO
OF
50
Chapter 4: Multivalent Approach to Achieve In Vivo Selectivity for CA-IX
4.1 Introduction
The application of small molecule inhibitors as PET tracers can be challenged by several
effects such as non-specific uptake in cells, poor clearance from blood198, and rapid metabolic
defluorination with accompanying bone uptake199, 200. In addition, 18F-labeling in high yield and
at high specific activity often presents a significant challenge in the development of new PET
tracers201. Yet even when conditions for clinically useful radiolabeling have been met, non-
specific uptake due to association with off-target enzyme isoforms of greater abundance can
result in images marked by low tumour to background ratios. Lipophilicity can also enhance
non-specific uptake in some cases. As shown in Chapters 2 and 3, the development of CA-IX
targeting agents can be hindered by a combination of these factors.
We hypothesized that a multivalent enzyme inhibitor would restrict intracellular
accumulation and enhance specific binding to an extracellular tumour target. To accomplish this,
we utilized a radiosynthon that readily enables grafting of various ligands to a pentaerythritol
core while allowing for facile radiolabeling at high specific activity with Curie-levels of 18F-
activity. Recently, we communicated this method for linking both peptides and small molecule
inhibitors in a trivalent motif202. Here we expand the application of this method to address the
imaging potential of two related enzyme inhibitors and report detailed findings on how this
method can be used to reduce nonspecific intracellular accumulation. ________________________________ Adapted from: Trimeric Radiofluorinated Sulfonamide Derivatives to Achieve In Vivo Selectivity for Carbonic Anhydrase IX-Targeted Cancer Imaging. J Nuc Med, 2015;56(9): 1434-1440. Joseph Lau1*, Zhibo Liu2*, Kuo-Shyan Lin1, Jinhe Pan1, Zhengxing Zhang1, Daniella Vullo3, Claudiu T. Supuran3, David M. Perrin2, Francois Benard1
1 Department of Molecular Oncology, BC Cancer Research Centre, BC Cancer Agency, Vancouver, BC, Canada 2 Department of Chemistry, University of British Columbia, Vancouver, BC, Canada 3 Dipartimento Neurofarba and Laboratorio di Chimica Bioinorganica, Università degli Studi di Firenze, Florence, Italy JL, KSL, DMP, and FB designed the study. JL, ZL, JP, ZZ, and DV were involved in the experiments. CTS provided the affinity measurements. JL and ZL were involved in acquisition of data and interpretation of the analysis. JL and ZL wrote the manuscript.
*Co-First Author
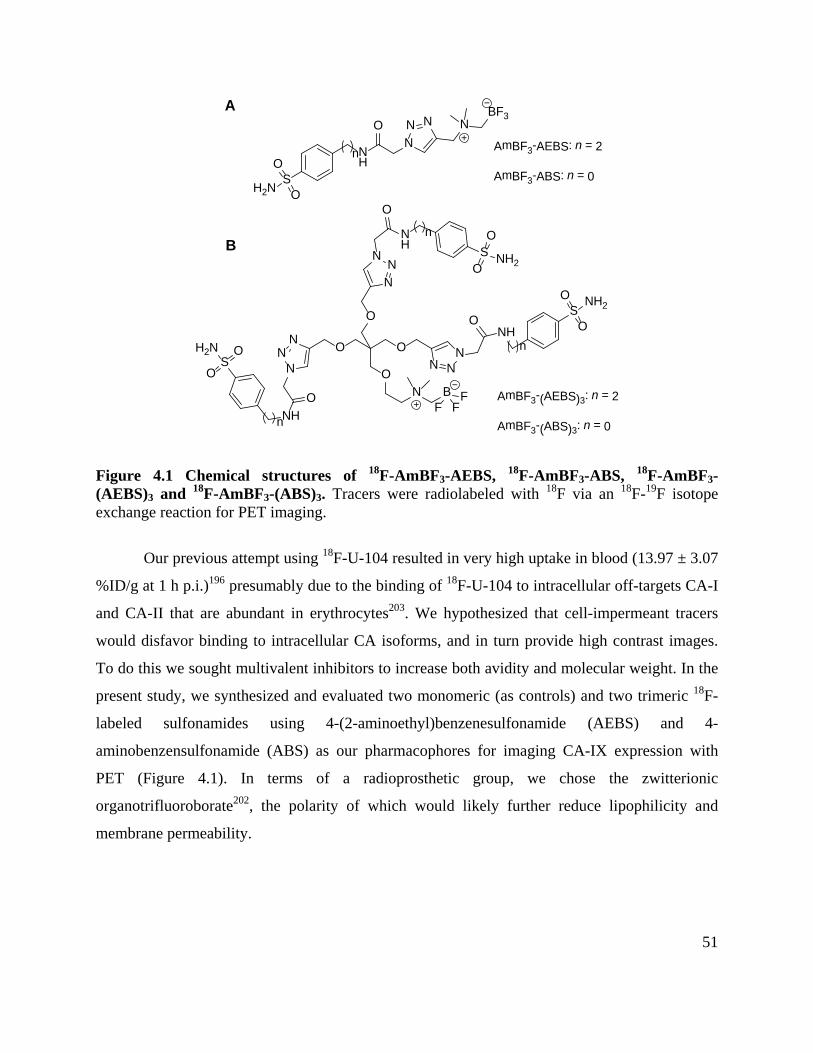
51
H2NS
NH
ONN N N
BF3
O
O
AmBF3-AEBS: n = 2
AmBF3-ABS: n = 0
AmBF3-(AEBS)3: n = 2
AmBF3-(ABS)3: n = 0
O
O
ONN
N
NN
N
O
NH
nS NH2
O
O
N NN
ONH
n
SNH2
O
O
ON B F
FFO
NH
SH2N O
O
A
B
n
n
Figure 4.1 Chemical structures of 18F-AmBF3-AEBS, 18F-AmBF3-ABS, 18F-AmBF3-(AEBS)3 and 18F-AmBF3-(ABS)3. Tracers were radiolabeled with 18F via an 18F-19F isotope exchange reaction for PET imaging.
Our previous attempt using 18F-U-104 resulted in very high uptake in blood (13.97 ± 3.07
%ID/g at 1 h p.i.)196 presumably due to the binding of 18F-U-104 to intracellular off-targets CA-I
and CA-II that are abundant in erythrocytes203. We hypothesized that cell-impermeant tracers
would disfavor binding to intracellular CA isoforms, and in turn provide high contrast images.
To do this we sought multivalent inhibitors to increase both avidity and molecular weight. In the
present study, we synthesized and evaluated two monomeric (as controls) and two trimeric 18F-
labeled sulfonamides using 4-(2-aminoethyl)benzenesulfonamide (AEBS) and 4-
aminobenzensulfonamide (ABS) as our pharmacophores for imaging CA-IX expression with
PET (Figure 4.1). In terms of a radioprosthetic group, we chose the zwitterionic
organotrifluoroborate202, the polarity of which would likely further reduce lipophilicity and
membrane permeability.
52
4.2 Methods and Materials
AmBF3-conjugated alkyne 3204, AmBF3-conjugated alkyne 4205, and 2-chloro-N-(4-sulfamoyl-
phenyl)-acetamide206 were prepared according to published procedures. Other chemicals were
obtained from commercial sources, and used without further purification. 18F-fluoride Trap &
Release columns were purchased from ORTG Inc. (Oakdale, TN). C18 light Sep-Pak cartridges
(1cc, 50 mg) were obtained from Waters (Milford, MA). BALB/c mouse plasma was obtained
from Innovative Research (Novi, MI). Mass analyses were performed using a Bruker (Billerica,
MA) Esquire-LC/MS system with ESI ion source. Purification and quality control of cold and 18F-labeled sulfonamides were performed on an Agilent HPLC system equipped with a model
1200 quaternary pump, a model 1200 UV detector, and a Bioscan (Washington, DC) NaI
scintillation detector. The radio-detector was connected to a Bioscan B-FC-1000 Flow-count
system, and the output from the Bioscan Flow-count system was fed into an Agilent 35900E
interface which converted the analog signal to digital signal. Operation of the Agilent HPLC
system was controlled using the Agilent ChemStation software. Radioactivity of 18F-labeled
tracers was measured using a Capintec (Ramsey, NJ) CRC®-25R/W dose calibrator, and the
radioactivity of mouse tissues collected from biodistribution studies were counted using a
Packard (Meriden, CT) Cobra II 5000 Series auto-gamma counter.
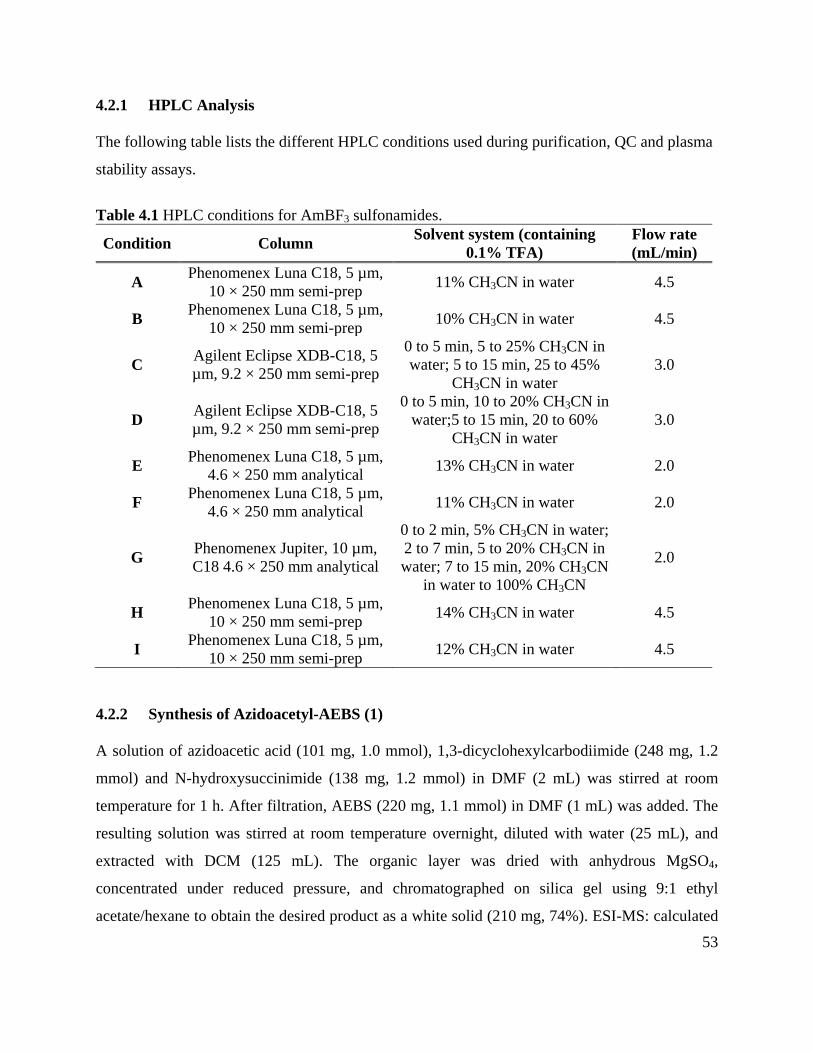
53
4.2.1 HPLC Analysis
The following table lists the different HPLC conditions used during purification, QC and plasma
stability assays.
Table 4.1 HPLC conditions for AmBF3 sulfonamides.
Condition Column Solvent system (containing 0.1% TFA)
Flow rate (mL/min)
A Phenomenex Luna C18, 5 µm, 10 × 250 mm semi-prep 11% CH3CN in water 4.5
B Phenomenex Luna C18, 5 µm, 10 × 250 mm semi-prep 10% CH3CN in water 4.5
C Agilent Eclipse XDB-C18, 5 µm, 9.2 × 250 mm semi-prep
0 to 5 min, 5 to 25% CH3CN in water; 5 to 15 min, 25 to 45%
CH3CN in water 3.0
D Agilent Eclipse XDB-C18, 5 µm, 9.2 × 250 mm semi-prep
0 to 5 min, 10 to 20% CH3CN in water;5 to 15 min, 20 to 60%
CH3CN in water 3.0
E Phenomenex Luna C18, 5 µm, 4.6 × 250 mm analytical 13% CH3CN in water 2.0
F Phenomenex Luna C18, 5 µm, 4.6 × 250 mm analytical 11% CH3CN in water 2.0
G Phenomenex Jupiter, 10 µm, C18 4.6 × 250 mm analytical
0 to 2 min, 5% CH3CN in water; 2 to 7 min, 5 to 20% CH3CN in water; 7 to 15 min, 20% CH3CN
in water to 100% CH3CN
2.0
H Phenomenex Luna C18, 5 µm, 10 × 250 mm semi-prep 14% CH3CN in water 4.5
I Phenomenex Luna C18, 5 µm, 10 × 250 mm semi-prep 12% CH3CN in water 4.5
4.2.2 Synthesis of Azidoacetyl-AEBS (1)
A solution of azidoacetic acid (101 mg, 1.0 mmol), 1,3-dicyclohexylcarbodiimide (248 mg, 1.2
mmol) and N-hydroxysuccinimide (138 mg, 1.2 mmol) in DMF (2 mL) was stirred at room
temperature for 1 h. After filtration, AEBS (220 mg, 1.1 mmol) in DMF (1 mL) was added. The
resulting solution was stirred at room temperature overnight, diluted with water (25 mL), and
extracted with DCM (125 mL). The organic layer was dried with anhydrous MgSO4,
concentrated under reduced pressure, and chromatographed on silica gel using 9:1 ethyl
acetate/hexane to obtain the desired product as a white solid (210 mg, 74%). ESI-MS: calculated
54
for azidoacetyl-AEBS 1 C10H13N5O3S 283.07, found [M+H]+ 284.07. 1H-NMR (CD3CN-D2O): δ
2.85 (t, 3.7 Hz, 2H), 3.47 (m, 4.4 Hz, 2H), 5.67 (s, 2H), 7.43 (d, 7.5 Hz, 2H), 7.78 (d, 7.5 Hz,
2H).
4.2.3 Synthesis of Azidoacetyl-ABS (2)
A mixture of 2-chloro-N-(4-sulfamoyl-phenyl)-acetamide (353 mg, 1.4 mmol) and sodium azide
(102 mg, 1.6 mmol) in DMSO (5 mL) was stirred at room temperature overnight. The reaction
mixture was diluted with water (12.5 mL) and extracted with ether (75 mL). The organic layer
was dried with anhydrous MgSO4, concentrated under reduced pressure, and recrystallized with
water to obtain the desired product as a white solid (313 mg, 60%). ESI-MS: calculated for
azidoacetyl-ABS 2 C8H9N5O3S 255.04, found [M+H]+ 256.04. 1H-NMR (DMSO-d6): δ 4.07 (s,
2H), 7.25 (s, 2H), 7.75 (m, 4H), 10.5 (s, 1H).
4.2.4 Synthesis of AmBF3-AEBS
A 1.5-mL Eppendorf tube was loaded with AmBF3-conjugated alkyne 3 (10 mg, 61 µmol),
azidoacetyl-AEBS 1 (10 mg, 35 µmol), aqueous CuSO4 (1.0 M, 56.3 µL), sodium ascorbate (1.0
M, 140.7 µL) and DMF (150 µL). This mixture was allowed to react at 45 °C for 2 h and then
purified by HPLC (Condition A, tR = 22.3 min) to obtain AmBF3-AEBS in 41% yield. ESI-MS:
calculated for AmBF3-AEBS C16H24BF3N6O3S 448.2, found [M+Na] + 471.2. 1H-NMR (DMSO-
d6): δ 2.23 (m, 2H), 2.50 (m, 2H), 2.82 (t, 7.1 Hz, 2H), 2.93 (s, 6H), 4.53 (s, 2H), 5.16 (s, 2H),
7.31 (s, 2H), 7.41 (d, 8.3 Hz, 2H), 7.75 (d, 8.3 Hz, 2H), 8.30 (s, 1H), 8.48 (t, 5.5 Hz, 1H).
4.2.5 Synthesis of AmBF3-ABS
A 1.5-mL Eppendorf tube was loaded with AmBF3-conjugated alkyne 3 (10 mg, 61 µmol),
azidoacetyl-ABS 2 (10 mg, 39 µmol), aqueous CuSO4 (1.0 M, 62.7 µL), sodium ascorbate (1.0
M, 156.8 µL) and DMF (150 µL). This mixture was allowed to react at 45 °C for 2 h and then
purified by HPLC (Condition B, tR = 22.1 min) to obtain AmBF3-ABS in 40% yield. ESI-MS:
calculated for AmBF3-ABS C14H20BF3N6O3S 420.1, found [M+Na]+ 443.2. 1H-NMR (DMSO-
55
d6): δ 2.24 (m, 2H), 2.95 (s, 6H), 4.57 (s, 2H), 5.47 (s, 2H), 7.27 (s, 2H), 7.76 (q, 8.0 Hz, 9.0 Hz,
4H), 8.41 (s, 1H), 10.86 (s, 1H).
4.2.6 Synthesis of AmBF3-(AEBS)3
A 1.5-mL Eppendorf tube was loaded with AmBF3-conjugated alkyne 4 (5 mg, 12.3 µmol),
azidoacetyl-AEBS 1 (12.1 mg, 44 µmol), aqueous CuSO4 (1.0 M, 5 µL), sodium ascorbate (1.0
M, 12.5 µL) and 5% NH4OH (in 1:1 CH3CN/H2O, 50 µL). This mixture was allowed to react at
45 °C for 2 h and then purified by HPLC (Condition C, tR = 12.8 min) to obtain AmBF3-
(AEBS)3 in 47% yield. ESI-MS: calculated for AmBF3-(AEBS)3 C49H68BF3N16O13S3 1252.44,
found [M+H]+ 1253.49. 1H-NMR (CD3CN-D2O): δ 2.71 (s, 2H), 2.88 (m, 8H), 3.17 (s, 6H), 3.47
(q, 4.4 Hz, 6H), 3.63 (t, 2.7 Hz, 2H), 3.80 (s, 8H), 4.19 (s, 6H), 5.67 (s, 6H), 7.43 (d, 7.4 Hz,
2H), 7.78 (d, 7.4 Hz, 2H).
4.2.7 Synthesis of AmBF3-(ABS)3
A 1.5-mL Eppendorf tube was loaded with AmBF3-conjugated alkyne 4 (5 mg, 12.3 µmol),
azidoacetyl-ABS 2 (11.0 mg, 44 µmol), aqueous CuSO4 (1.0 M, 5 µL), sodium ascorbate (1.0 M,
12.5 µL) and 5% NH4OH (in 1:1 CH3CN/H2O, 50 µL). The mixture was allowed to react at 45
°C for 2 h, and then purified by HPLC (Condition D, tR = 13.1 min) to obtain AmBF3-(ABS)3 in
55% yield. ESI-MS: calculated for AmBF3-(ABS)3 C43H56BF3N16O13S3 1168.34, found [M+H]+
1169.40 1H-NMR (CD3CN-D2O): δ 4.16 (s, 6H), 4.30 (s, 2H), 4.61 (m, 4H), 4.72 (s, 8H), 5.77
(s, 6H), 6.54 (s, 6H), 8.94 (d, 9.0 Hz, 6H), 9.03 (d, 9.0 Hz, 6H), 9.16 (s, 3H).
4.2.8 Binding Affinity Measurements
Inhibition constants (Ki) of AmBF3-AEBS, AmBF3-ABS, and AmBF3-(AEBS)3 and AmBF3-
(ABS)3 for CA-I, -II, -IX and -XII were determined using the CA catalyzed CO2 hydration
stopped-flow assays following published procedures178.
56
4.2.9 Radiolabeling
100-150 nmol of 19F-AmBF3-AEBS, 19F-AmBF3-ABS, 19F-AmBF3-(AEBS)3 or 19F-AmBF3-
(ABS)3 was resuspended with aqueous pyridazine-HCl buffer (15-20 µL, 1M, pH = 2) and DMF
(15-20 µL) in a polypropylene tube. No carrier-added 18F-fluoride was obtained by bombardment
of H218O with 18 MeV protons, followed by trapping on an anion exchange column (9 mg,
QMA, chloride form). The 18F-fluoride was eluted off with saline (100 µL) into the reaction vial.
The reaction mixture was heated at 80 °C for 20 min, and quenched with 5% aqueous NH4OH (2
mL). The quenched solution was loaded onto a C18 light Sep-Pak cartridge. 18F-Fluoride was
removed by washing the cartridge with DI water (5 mL × 2). 18F-AmBF3-AEBS, 18F-AmBF3-
ABS, 18F-AmBF3-(AEBS)3 or 18F-AmBF3-(ABS)3 was eluted off the cartridge with 0.5 mL 4:1
ethanol/saline and diluted with saline (5 mL) for stability and biodistribution/imaging studies.
Samples were removed for QC analysis by HPLC using Condition E for 18F-AmBF3-AEBS (tR =
8.0 min), Condition F for 18F-AmBF3-ABS (tR = 7.9 min), or Condition G for 18F-AmBF3-
(AEBS)3 (tR = 12.4 min) and 18F-AmBF3-(ABS)3 (tR = 11.9 min).
4.2.10 Stability in Mouse Plasma
20 µL of 18F-AmBF3-AEBS, 18F-AmBF3-ABS, 18F-AmBF3-(AEBS)3 or 18F-AmBF3-(ABS)3 was
added to mouse plasma (500 µL) and incubated at 37 °C for 2 h. The reaction was quenched by
adding 1 mL CH3CN to the plasma solution. The quenched solution was centrifuged, and the
supernatant was collected, filtered and analyzed by HPLC using Condition H for 18F-AmBF3-
AEBS (tR = 13.0 min), Condition I for 18F-AmBF3-ABS (tR = 15.4 min), or Condition G for 18F-
AmBF3-(AEBS)3 (tR = 12.4 min) and 18F-AmBF3-(ABS)3 (tR = 11.9 min).
4.2.11 LogD7.4 measurements
An aliquot of 18F-AmBF3-AEBS, 18F-AmBF3-ABS, 18F-AmBF3-(AEBS)3 or 18F-AmBF3-(ABS)3
was added to a Falcon tube containing 4 mL of octanol and 1.5 mL of phosphate buffer (0.1 M,
pH = 7.4). The mixture was vortexed for 2 min and centrifuged at 5,000 rpm for 2 min. Samples
of the octanol (3.5 mL) and buffer (1 mL) layers were taken and counted. LogD7.4 was calculated
using the following equation: LogD7.4 = log10[(counts in octanol phase/3.5)/(counts in buffer
57
phase)]. The major portion of the phosphate buffer layer (1 mL) was diluted with 0.5 mL of
phosphate buffer and mixed with octanol (4 mL). The equilibration procedure described above
was repeated until a constant value of LogD7.4 was obtained.
4.2.12 In Vivo Experiments
4.2.12.1 Cell Line and Animal Model
All animal studies were performed in accordance with the Canadian Council on Animal Care
guidelines and approved by the Animal Care Committee of the University of British Columbia.
HT-29 human colorectal cancer cells were obtained as a gift from Dr. Donald Yapp (BC Cancer
Research Centre, Vancouver, Canada). HT-29 cells were cultured in Dulbecco’s Modified
Eagle’s Medium supplemented with 10% fetal bovine serum 100 U/mL penicillin-streptomycin,
and non-essential amino acids. Male NOD.Cg-PrkdcscidIl2rgtm1Wjl/SzJ (NSG) mice bred in-house
at the Animal Research Centre, BC Cancer Research Centre were used. Mice were
subcutaneously inoculated with 5 × 10⁶ HT-29 cells in the right dorsal flank. Biodistribution
studies and PET/CT imaging were performed when tumours reached 7-9 mm in diameter.
4.2.12.2 Biodistribution Studies
Tumour bearing mice were injected with ~ 0.37 MBq of 18F-labeled tracer (100 – 200 µL in
saline, i.v.). For blocking experiments, mice were intravenously pre-injected with 10 mg/kg
acetazolamide 1 h (100 – 200 µL in saline, i.v.) before administering the radiotracer. After an
uptake period of 0.5, 1, or 2 h, mice were euthanized by CO2 asphyxiation. Blood was promptly
withdrawn, and organs/tissues of interest were harvested, rinsed with saline, blotted dry and
weighed. Radioactivity in collected tissues was counted, normalized to the injected dose and
expressed as the percentage of the injected dose per gram of tissue (%ID/g).
4.2.12.3 PET/CT Imaging
Imaging experiments were performed using a Siemens (Erlangen, Germany) Inveon micro
PET/CT scanner. Tumour bearing mice were injected with ~ 3.7 MBq of 18F-labeled tracer (100
– 200 µL in saline, i.v.). For blocking experiments, mice were intravenously pre-injected with 10
58
mg/kg acetazolamide 1 h (100 – 200 µL in saline, i.v.) before administering the radiotracer. At
0.5, 1, or 2 h p.i., a 10-min PET acquisition scan was performed, which was preceded by a 10-
min CT scan. Body temperature of mice was maintained at 37 °C with the use of thermal pads.
PET data were acquired in list mode acquisition, reconstructed using the 3d-OSEM-MAP
algorithm with CT-based attenuation correction, and co-registered for alignment. At the
conclusion of the imaging study, mice were euthanized and processed for biodistribution as
described above.
4.2.12.4 Data Analysis
All statistics were performed using Prism 6 software (GraphPad). For Table 4.3, P values for the
difference of tracer uptake in mouse tissues between unblocked and blocked groups were
calculated using a Student’s t-test (unpaired, one-tailed) and values < 0.05 were considered
statistically significant. For Figure 4.4, P values for the difference of tumour/muscle ratios
between monomer and trimer were calculated using a Student’s t-test (unpaired, two-tailed) and
values < 0.05 were considered statistically significant.
4.3 Results and Discussion
The highly conserved catalytic domain of CA isoforms represents a major challenge for
the design of CA-IX selective imaging agents131. Off-target binding to intracellular CAs can
significantly reduce tumour binding and image contrast 203. Strategies to confer CA-IX
selectivity for small molecule inhibitors have focused on limiting transport across the plasma
membrane. These include incorporating bulky entities like FITC, albumin-binders, sugar
derivatives, or charged species to CA targeting pharmacophores207-211. Based on these findings,
we initiated the development of multivalent PET tracers for imaging CA-IX expression in
tumours.
Previously, our group reported the synthesis of a dual-mode imaging agent by coupling
rhodamine and cycloRGD to an AmBF3-conjugated alkyne 4 amendable for 18F-labeling212.
Using the modular adaptability of this synthon, we coupled three AEBS/ABS moieties via
copper-catalyzed azide alkyne cycloaddition to target CA-IX expression. To the best of our
knowledge, there are few examples of such multimeric inhibitors that have been labeled for
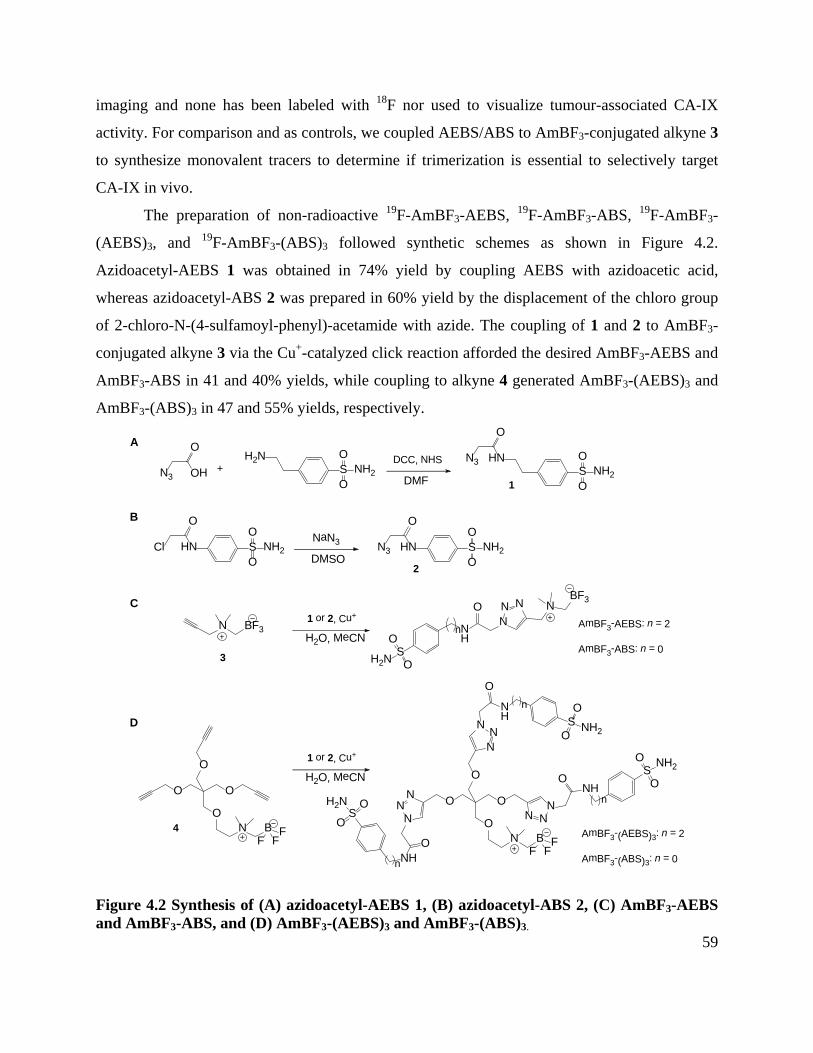
59
imaging and none has been labeled with 18F nor used to visualize tumour-associated CA-IX
activity. For comparison and as controls, we coupled AEBS/ABS to AmBF3-conjugated alkyne 3
to synthesize monovalent tracers to determine if trimerization is essential to selectively target
CA-IX in vivo.
The preparation of non-radioactive 19F-AmBF3-AEBS, 19F-AmBF3-ABS, 19F-AmBF3-
(AEBS)3, and 19F-AmBF3-(ABS)3 followed synthetic schemes as shown in Figure 4.2.
Azidoacetyl-AEBS 1 was obtained in 74% yield by coupling AEBS with azidoacetic acid,
whereas azidoacetyl-ABS 2 was prepared in 60% yield by the displacement of the chloro group
of 2-chloro-N-(4-sulfamoyl-phenyl)-acetamide with azide. The coupling of 1 and 2 to AmBF3-
conjugated alkyne 3 via the Cu+-catalyzed click reaction afforded the desired AmBF3-AEBS and
AmBF3-ABS in 41 and 40% yields, while coupling to alkyne 4 generated AmBF3-(AEBS)3 and
AmBF3-(ABS)3 in 47 and 55% yields, respectively.
O
O
O
ON B F
FF
SHNO
ONH2
O
SO
ONH2
H2NN3
O
OH +DCC, NHS
DMFSO
ONH2
HNN3
O
1
DMSO
NaN3Cl SHNO
ONH2
O
N3
2
A
B
C
1 or 2, Cu+
H2O, MeCN
AmBF3-(AEBS)3: n = 2
AmBF3-(ABS)3: n = 0
4
O
O
ONN
N
NNN
O
NH
n
S NH2
O
O
N NN
ONH
n
SNH2
O
O
ON B F
FFO
NHn
SH2N O
O
BF3N
3
1 or 2, Cu+
H2O, MeCN
H2N S
NH
ONN N N
BF3
O
O
n AmBF3-AEBS: n = 2
AmBF3-ABS: n = 0
D
Figure 4.2 Synthesis of (A) azidoacetyl-AEBS 1, (B) azidoacetyl-ABS 2, (C) AmBF3-AEBS and AmBF3-ABS, and (D) AmBF3-(AEBS)3 and AmBF3-(ABS)3.
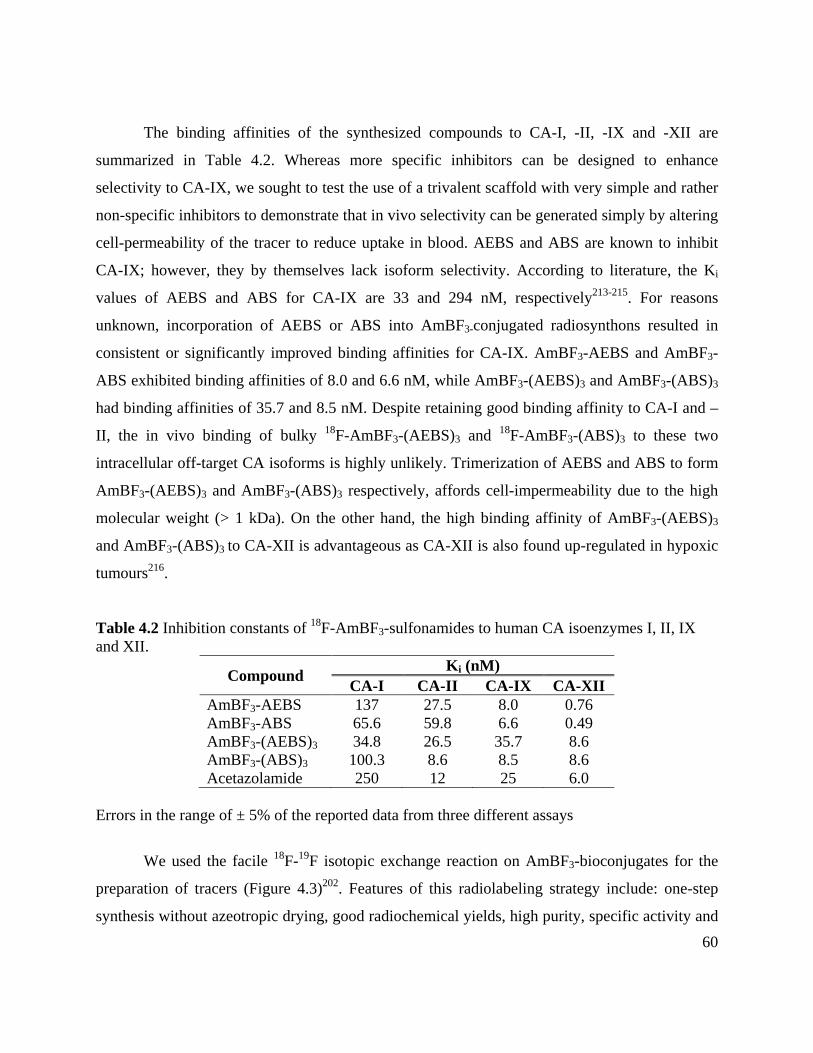
60
The binding affinities of the synthesized compounds to CA-I, -II, -IX and -XII are
summarized in Table 4.2. Whereas more specific inhibitors can be designed to enhance
selectivity to CA-IX, we sought to test the use of a trivalent scaffold with very simple and rather
non-specific inhibitors to demonstrate that in vivo selectivity can be generated simply by altering
cell-permeability of the tracer to reduce uptake in blood. AEBS and ABS are known to inhibit
CA-IX; however, they by themselves lack isoform selectivity. According to literature, the Ki
values of AEBS and ABS for CA-IX are 33 and 294 nM, respectively213-215. For reasons
unknown, incorporation of AEBS or ABS into AmBF3-conjugated radiosynthons resulted in
consistent or significantly improved binding affinities for CA-IX. AmBF3-AEBS and AmBF3-
ABS exhibited binding affinities of 8.0 and 6.6 nM, while AmBF3-(AEBS)3 and AmBF3-(ABS)3
had binding affinities of 35.7 and 8.5 nM. Despite retaining good binding affinity to CA-I and –
II, the in vivo binding of bulky 18F-AmBF3-(AEBS)3 and 18F-AmBF3-(ABS)3 to these two
intracellular off-target CA isoforms is highly unlikely. Trimerization of AEBS and ABS to form
AmBF3-(AEBS)3 and AmBF3-(ABS)3 respectively, affords cell-impermeability due to the high
molecular weight (> 1 kDa). On the other hand, the high binding affinity of AmBF3-(AEBS)3
and AmBF3-(ABS)3 to CA-XII is advantageous as CA-XII is also found up-regulated in hypoxic
tumours216.
Table 4.2 Inhibition constants of 18F-AmBF3-sulfonamides to human CA isoenzymes I, II, IX and XII.
Compound Ki (nM) CA-I CA-II CA-IX CA-XII
AmBF3-AEBS 137 27.5 8.0 0.76 AmBF3-ABS 65.6 59.8 6.6 0.49 AmBF3-(AEBS)3 34.8 26.5 35.7 8.6 AmBF3-(ABS)3 100.3 8.6 8.5 8.6 Acetazolamide 250 12 25 6.0
Errors in the range of ± 5% of the reported data from three different assays
We used the facile 18F-19F isotopic exchange reaction on AmBF3-bioconjugates for the
preparation of tracers (Figure 4.3)202. Features of this radiolabeling strategy include: one-step
synthesis without azeotropic drying, good radiochemical yields, high purity, specific activity and
61
in vitro/vivo stability, and relative ease of purification without HPLC202. This approach for 18F-
labeling has been successfully applied to RGD and somatostatin analogs for cancer imaging205,
212. Starting with 23.3 – 38.5 GBq of 18F-fluoride, 18F-AmBF3-AEBS, 18F-AmBF3-ABS, 18F-
AmBF3-(AEBS)3, and 18F-AmBF3-(ABS)3 were obtained in 24.8 ± 2.2%, 26.4 ± 10.2%, 28.0 ±
3.5% and 26.9 ± 5.6% nondecay-corrected radiochemical yields (n = 3) with corresponding
specific activities of 185 ± 22, 141 ± 11, 66 ± 9, and 49 ± 12 GBq/µmol, respectively. After C18
Sep-Pak purification, > 95% radiochemical purity was obtained for all tracers based on HPLC
radio-chromatograms. These radiosynthesis data (radiochemical yield and specific activity) are
comparable with those previously reported for other AmBF3-conjugates205, 212.
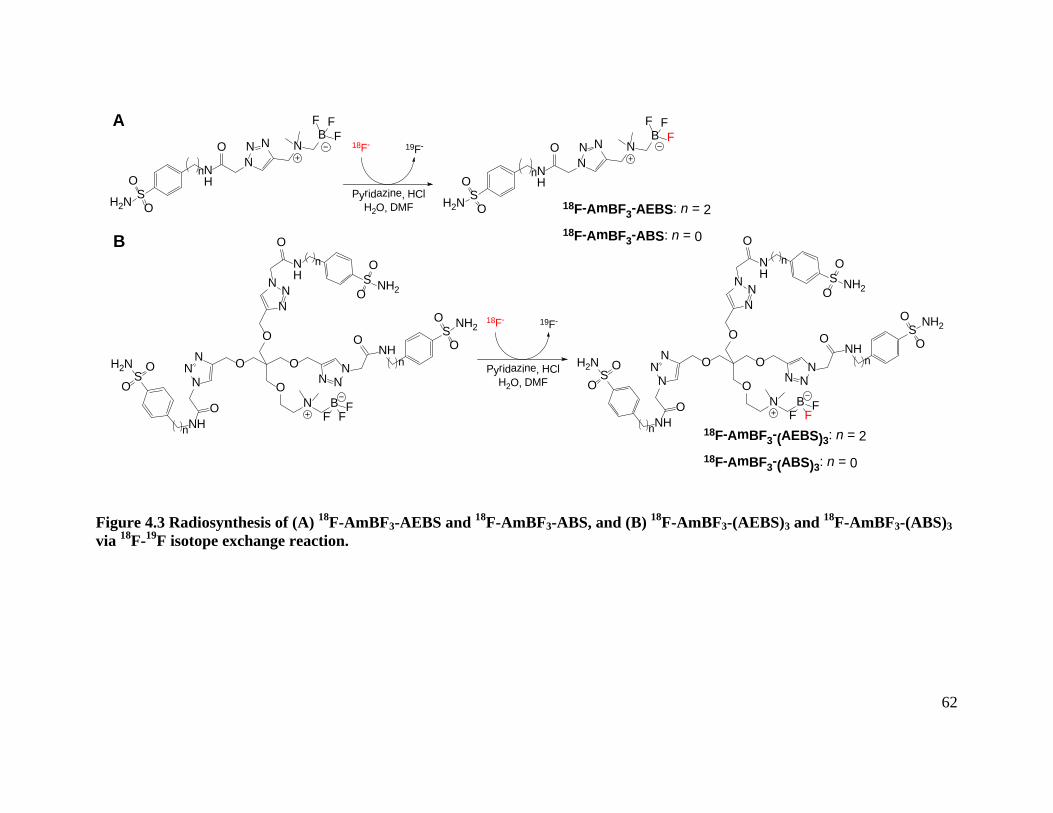
62
Pyridazine, HClH2O, DMF
18F- 19F-
O
O
ONN
N
NNN
O
NH
n
S NH2
O
O
N NN
ONH
n
SNH2
O
O
ON B F
FFO
NHn
SH2N O
O
O
O
ONN
N
NNN
O
NH
n
S NH2
O
O
N NN
ONH
n
SNH2
O
O
ON B F
FFO
NHn
SH2N O
O
18F-AmBF3-AEBS: n = 2
18F-AmBF3-ABS: n = 0
H2N S
NH
ONN N N
B
O
O
FF F
n
H2N S
NH
ONN N N
B
O
O
FF F
n
B
A
18F-AmBF3-(AEBS)3: n = 2
18F-AmBF3-(ABS)3: n = 0
Pyridazine, HClH2O, DMF
18F- 19F-
Figure 4.3 Radiosynthesis of (A) 18F-AmBF3-AEBS and 18F-AmBF3-ABS, and (B) 18F-AmBF3-(AEBS)3 and 18F-AmBF3-(ABS)3 via 18F-19F isotope exchange reaction.
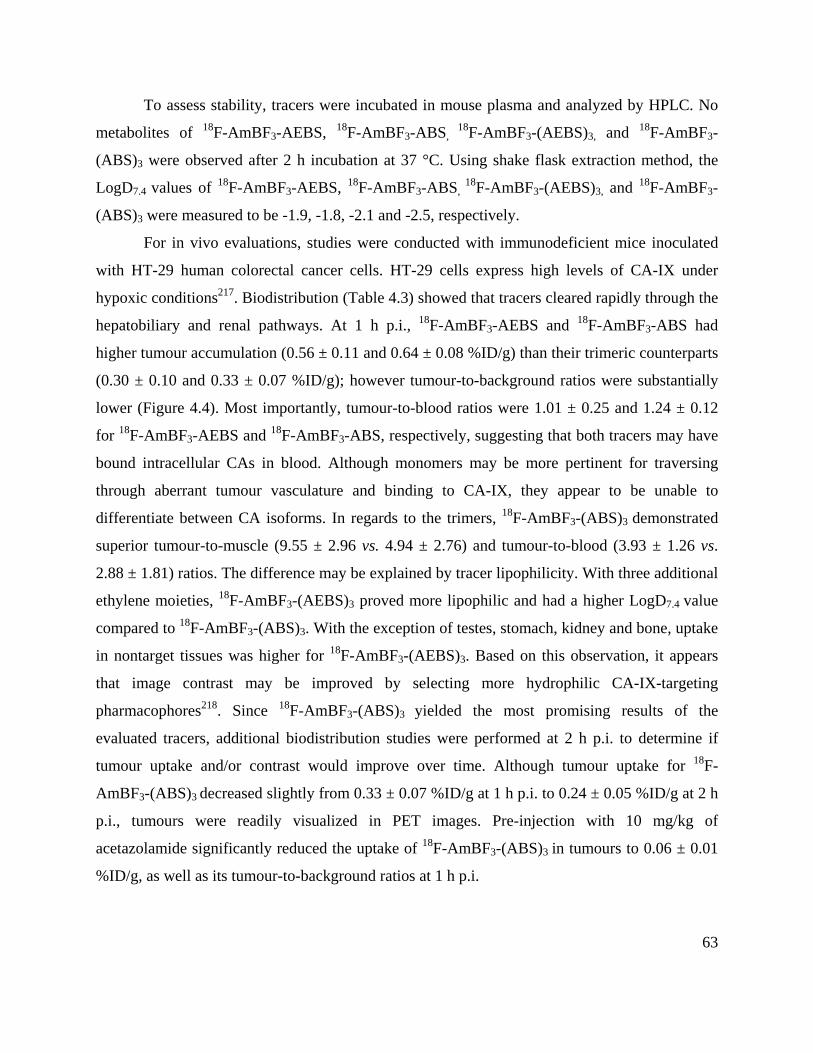
63
To assess stability, tracers were incubated in mouse plasma and analyzed by HPLC. No
metabolites of 18F-AmBF3-AEBS, 18F-AmBF3-ABS, 18F-AmBF3-(AEBS)3, and 18F-AmBF3-
(ABS)3 were observed after 2 h incubation at 37 °C. Using shake flask extraction method, the
LogD7.4 values of 18F-AmBF3-AEBS, 18F-AmBF3-ABS, 18F-AmBF3-(AEBS)3, and 18F-AmBF3-
(ABS)3 were measured to be -1.9, -1.8, -2.1 and -2.5, respectively.
For in vivo evaluations, studies were conducted with immunodeficient mice inoculated
with HT-29 human colorectal cancer cells. HT-29 cells express high levels of CA-IX under
hypoxic conditions217. Biodistribution (Table 4.3) showed that tracers cleared rapidly through the
hepatobiliary and renal pathways. At 1 h p.i., 18F-AmBF3-AEBS and 18F-AmBF3-ABS had
higher tumour accumulation (0.56 ± 0.11 and 0.64 ± 0.08 %ID/g) than their trimeric counterparts
(0.30 ± 0.10 and 0.33 ± 0.07 %ID/g); however tumour-to-background ratios were substantially
lower (Figure 4.4). Most importantly, tumour-to-blood ratios were 1.01 ± 0.25 and 1.24 ± 0.12
for 18F-AmBF3-AEBS and 18F-AmBF3-ABS, respectively, suggesting that both tracers may have
bound intracellular CAs in blood. Although monomers may be more pertinent for traversing
through aberrant tumour vasculature and binding to CA-IX, they appear to be unable to
differentiate between CA isoforms. In regards to the trimers, 18F-AmBF3-(ABS)3 demonstrated
superior tumour-to-muscle (9.55 ± 2.96 vs. 4.94 ± 2.76) and tumour-to-blood (3.93 ± 1.26 vs.
2.88 ± 1.81) ratios. The difference may be explained by tracer lipophilicity. With three additional
ethylene moieties, 18F-AmBF3-(AEBS)3 proved more lipophilic and had a higher LogD7.4 value
compared to 18F-AmBF3-(ABS)3. With the exception of testes, stomach, kidney and bone, uptake
in nontarget tissues was higher for 18F-AmBF3-(AEBS)3. Based on this observation, it appears
that image contrast may be improved by selecting more hydrophilic CA-IX-targeting
pharmacophores218. Since 18F-AmBF3-(ABS)3 yielded the most promising results of the
evaluated tracers, additional biodistribution studies were performed at 2 h p.i. to determine if
tumour uptake and/or contrast would improve over time. Although tumour uptake for 18F-
AmBF3-(ABS)3 decreased slightly from 0.33 ± 0.07 %ID/g at 1 h p.i. to 0.24 ± 0.05 %ID/g at 2 h
p.i., tumours were readily visualized in PET images. Pre-injection with 10 mg/kg of
acetazolamide significantly reduced the uptake of 18F-AmBF3-(ABS)3 in tumours to 0.06 ± 0.01
%ID/g, as well as its tumour-to-background ratios at 1 h p.i.
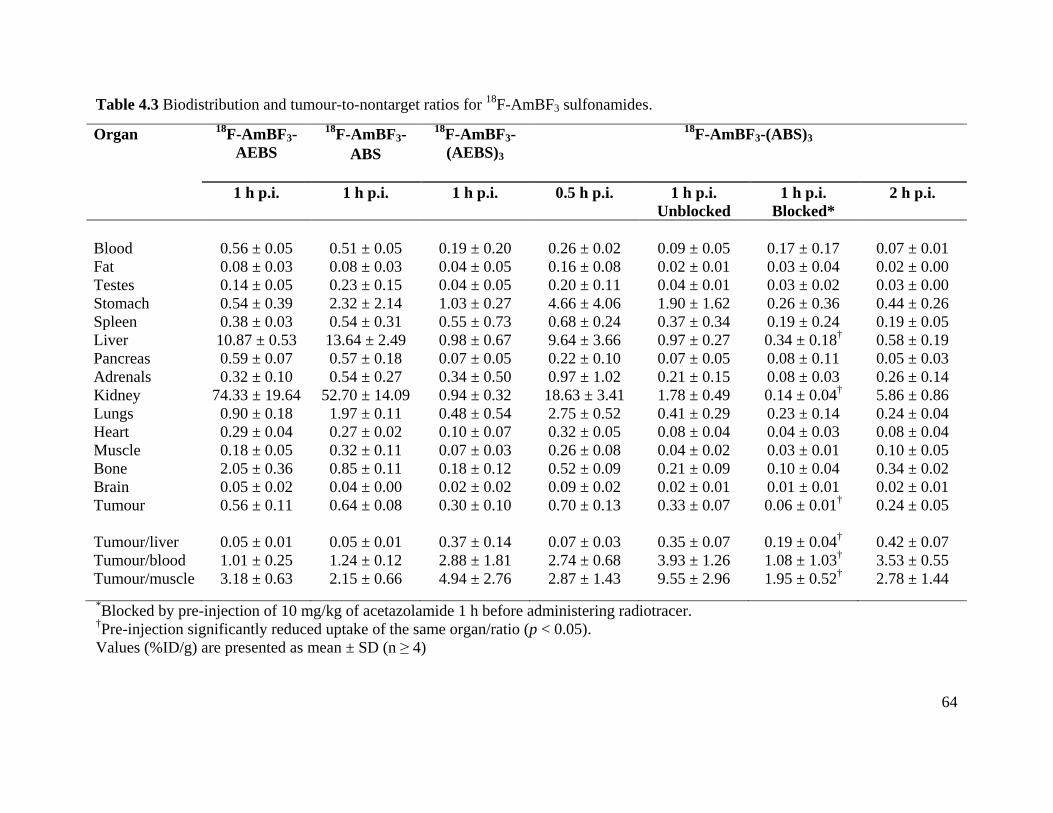
64
Table 4.3 Biodistribution and tumour-to-nontarget ratios for 18F-AmBF3 sulfonamides.
Organ 18F-AmBF3-AEBS
18F-AmBF3-ABS
18F-AmBF3-(AEBS)3
18F-AmBF3-(ABS)3
1 h p.i.
1 h p.i. 1 h p.i.
0.5 h p.i.
1 h p.i. Unblocked
1 h p.i. Blocked*
2 h p.i.
Blood 0.56 ± 0.05 0.51 ± 0.05 0.19 ± 0.20 0.26 ± 0.02 0.09 ± 0.05 0.17 ± 0.17 0.07 ± 0.01 Fat 0.08 ± 0.03 0.08 ± 0.03 0.04 ± 0.05 0.16 ± 0.08 0.02 ± 0.01 0.03 ± 0.04 0.02 ± 0.00 Testes 0.14 ± 0.05 0.23 ± 0.15 0.04 ± 0.05 0.20 ± 0.11 0.04 ± 0.01 0.03 ± 0.02 0.03 ± 0.00 Stomach 0.54 ± 0.39 2.32 ± 2.14 1.03 ± 0.27 4.66 ± 4.06 1.90 ± 1.62 0.26 ± 0.36 0.44 ± 0.26 Spleen 0.38 ± 0.03 0.54 ± 0.31 0.55 ± 0.73 0.68 ± 0.24 0.37 ± 0.34 0.19 ± 0.24 0.19 ± 0.05 Liver 10.87 ± 0.53 13.64 ± 2.49 0.98 ± 0.67 9.64 ± 3.66 0.97 ± 0.27 0.34 ± 0.18† 0.58 ± 0.19 Pancreas 0.59 ± 0.07 0.57 ± 0.18 0.07 ± 0.05 0.22 ± 0.10 0.07 ± 0.05 0.08 ± 0.11 0.05 ± 0.03 Adrenals 0.32 ± 0.10 0.54 ± 0.27 0.34 ± 0.50 0.97 ± 1.02 0.21 ± 0.15 0.08 ± 0.03 0.26 ± 0.14 Kidney 74.33 ± 19.64 52.70 ± 14.09 0.94 ± 0.32 18.63 ± 3.41 1.78 ± 0.49 0.14 ± 0.04† 5.86 ± 0.86 Lungs 0.90 ± 0.18 1.97 ± 0.11 0.48 ± 0.54 2.75 ± 0.52 0.41 ± 0.29 0.23 ± 0.14 0.24 ± 0.04 Heart 0.29 ± 0.04 0.27 ± 0.02 0.10 ± 0.07 0.32 ± 0.05 0.08 ± 0.04 0.04 ± 0.03 0.08 ± 0.04 Muscle 0.18 ± 0.05 0.32 ± 0.11 0.07 ± 0.03 0.26 ± 0.08 0.04 ± 0.02 0.03 ± 0.01 0.10 ± 0.05 Bone 2.05 ± 0.36 0.85 ± 0.11 0.18 ± 0.12 0.52 ± 0.09 0.21 ± 0.09 0.10 ± 0.04 0.34 ± 0.02 Brain 0.05 ± 0.02 0.04 ± 0.00 0.02 ± 0.02 0.09 ± 0.02 0.02 ± 0.01 0.01 ± 0.01 0.02 ± 0.01 Tumour 0.56 ± 0.11 0.64 ± 0.08 0.30 ± 0.10 0.70 ± 0.13 0.33 ± 0.07 0.06 ± 0.01† 0.24 ± 0.05 Tumour/liver 0.05 ± 0.01 0.05 ± 0.01 0.37 ± 0.14
0.07 ± 0.03
0.35 ± 0.07
0.19 ± 0.04†
0.42 ± 0.07
Tumour/blood 1.01 ± 0.25 1.24 ± 0.12 2.88 ± 1.81 2.74 ± 0.68 3.93 ± 1.26 1.08 ± 1.03† 3.53 ± 0.55 Tumour/muscle 3.18 ± 0.63 2.15 ± 0.66 4.94 ± 2.76 2.87 ± 1.43 9.55 ± 2.96 1.95 ± 0.52† 2.78 ± 1.44 *Blocked by pre-injection of 10 mg/kg of acetazolamide 1 h before administering radiotracer. †Pre-injection significantly reduced uptake of the same organ/ratio (p < 0.05). Values (%ID/g) are presented as mean ± SD (n ≥ 4)
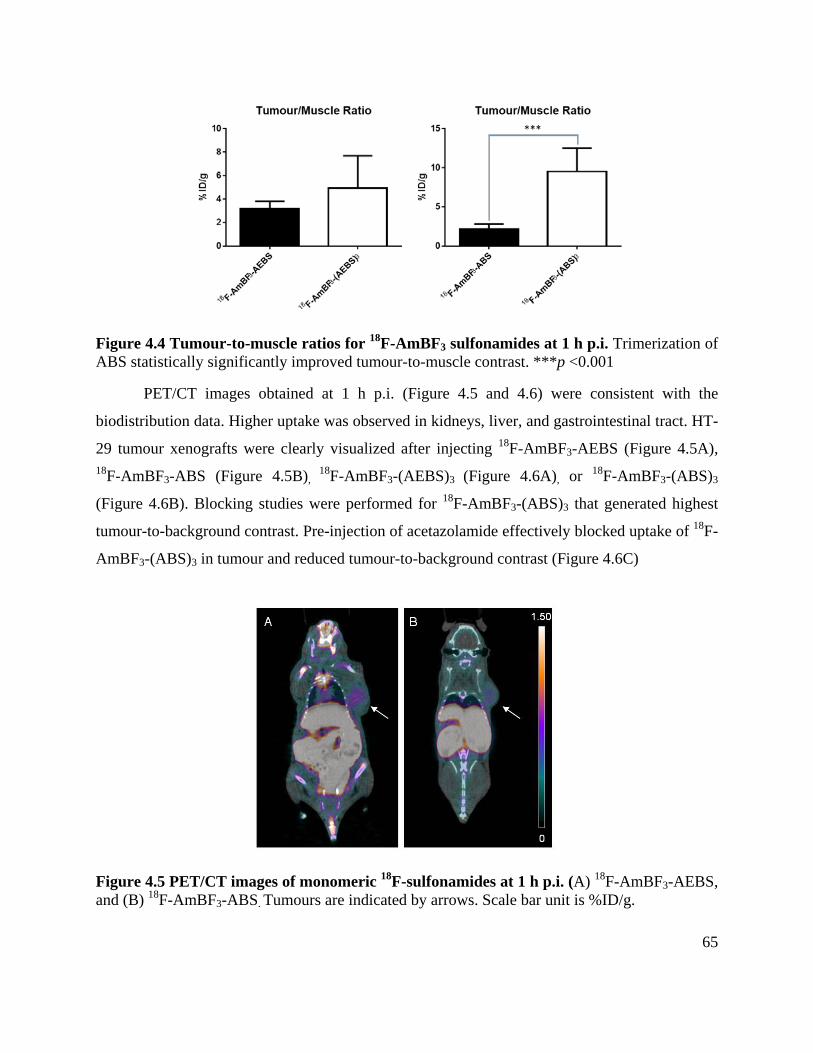
65
Figure 4.4 Tumour-to-muscle ratios for 18F-AmBF3 sulfonamides at 1 h p.i. Trimerization of ABS statistically significantly improved tumour-to-muscle contrast. ***p <0.001
PET/CT images obtained at 1 h p.i. (Figure 4.5 and 4.6) were consistent with the
biodistribution data. Higher uptake was observed in kidneys, liver, and gastrointestinal tract. HT-
29 tumour xenografts were clearly visualized after injecting 18F-AmBF3-AEBS (Figure 4.5A), 18F-AmBF3-ABS (Figure 4.5B),
18F-AmBF3-(AEBS)3 (Figure 4.6A), or 18F-AmBF3-(ABS)3
(Figure 4.6B). Blocking studies were performed for 18F-AmBF3-(ABS)3 that generated highest
tumour-to-background contrast. Pre-injection of acetazolamide effectively blocked uptake of 18F-
AmBF3-(ABS)3 in tumour and reduced tumour-to-background contrast (Figure 4.6C)
Figure 4.5 PET/CT images of monomeric 18F-sulfonamides at 1 h p.i. (A) 18F-AmBF3-AEBS, and (B) 18F-AmBF3-ABS. Tumours are indicated by arrows. Scale bar unit is %ID/g.
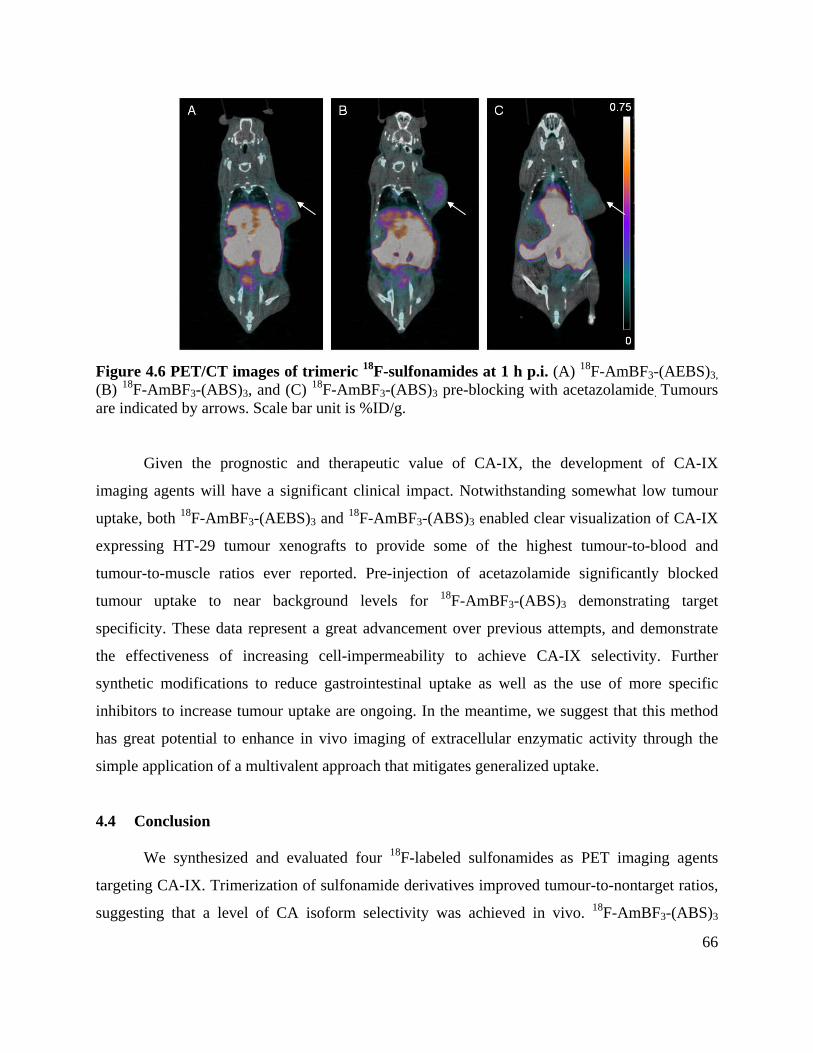
66
Figure 4.6 PET/CT images of trimeric 18F-sulfonamides at 1 h p.i. (A) 18F-AmBF3-(AEBS)3, (B) 18F-AmBF3-(ABS)3, and (C) 18F-AmBF3-(ABS)3 pre-blocking with acetazolamide. Tumours are indicated by arrows. Scale bar unit is %ID/g.
Given the prognostic and therapeutic value of CA-IX, the development of CA-IX
imaging agents will have a significant clinical impact. Notwithstanding somewhat low tumour
uptake, both 18F-AmBF3-(AEBS)3 and 18F-AmBF3-(ABS)3 enabled clear visualization of CA-IX
expressing HT-29 tumour xenografts to provide some of the highest tumour-to-blood and
tumour-to-muscle ratios ever reported. Pre-injection of acetazolamide significantly blocked
tumour uptake to near background levels for 18F-AmBF3-(ABS)3 demonstrating target
specificity. These data represent a great advancement over previous attempts, and demonstrate
the effectiveness of increasing cell-impermeability to achieve CA-IX selectivity. Further
synthetic modifications to reduce gastrointestinal uptake as well as the use of more specific
inhibitors to increase tumour uptake are ongoing. In the meantime, we suggest that this method
has great potential to enhance in vivo imaging of extracellular enzymatic activity through the
simple application of a multivalent approach that mitigates generalized uptake.
4.4 Conclusion
We synthesized and evaluated four 18F-labeled sulfonamides as PET imaging agents
targeting CA-IX. Trimerization of sulfonamide derivatives improved tumour-to-nontarget ratios,
suggesting that a level of CA isoform selectivity was achieved in vivo. 18F-AmBF3-(ABS)3

67
showed specific and selective uptake in CA-IX expressing tumour xenografts with good contrast.
The use of multivalent enzyme inhibitors represents a viable strategy to selectively image
extracellular enzyme activity with PET.
68
Chapter 5: Polyaminocarboxylate Conjugated Sulfonamides for 68Ga-labeling and PET Imaging
5.1 Introduction
Carbonic anhydrases (CA) are a large family of zinc metalloenzymes that share a highly
conserved protein domain for catalysis.131 Whereas most CAs are found intracellularly (ex. CA-I
and CA-II are expressed in high abundance in erythrocytes), CA-IX and CA-XII are the two
isoforms that reside at the extracellular surface6, 15. Although CA-XII is also ectopically
expressed by cancers in response to hypoxia, it has lower expression profile and catalytic activity
than CA-IX219. Based on the spatial distribution of the various CA isoforms, small molecule
inhibitors that are cell impermeable have enhanced selectivity for CA-IX. Different strategies to
confer CA-IX selectivity include introducing bulk (fluorophores, albumin binders, glycosylation,
multimeric design)207-210, 220 net charge (pyridinio sulfonamides)221, 222, and/or enhancing
hydrophilicity (polyaminocarboxylate chelators)223-225. Rami et al. synthesized several series of
aromatic sulfonamides conjugated to DTPA, DOTA, and TETA chelators for Cu2+ complexation,
and proposed their application for PET imaging223. While these Cu2+ sulfonamide complexes
retained binding affinity to CA-I/II (Ki: 54-81 nM), negligible amounts were detected in red
blood cells after direct incubation for 3 h due to cell impermeability223.
________________________________ Adapted from: PET Imaging of Carbonic Anhydrase IX Expression of HT-29 Tumor Xenograft Mice with 68Ga-Labeled Benzenesulfonamides. Mol Pharm, 2016;13(3): 1137-1146. Joseph Lau1*, Zhengxing Zhang1*, Silvia Jenni1, Hsiou-Ting Kuo1, Zhibo Liu2, Daniella Vullo3, Claudiu T. Supuran3, Kuo-Shyan Lin1,4, Francois Benard1,4
1 Department of Molecular Oncology, BC Cancer Research Centre, BC Cancer Agency, Vancouver, BC, Canada 2 Department of Chemistry, University of British Columbia, Vancouver, BC, Canada 3 Dipartimento Neurofarba and Laboratorio di Chimica Bioinorganica, Università degli Studi di Firenze, Florence, Italy 4 Department of Radiology, University of British Columbia, Vancouver, BC, Canada JL, ZZ, KSL, and FB designed the study. JL, ZZ, SJ, HTK , ZL, and DV were involved in the experiments. CTS provided the affinity measurements. JL and ZZ were involved in acquisition of data and interpretation of the analysis. JL and ZZ wrote the manuscript.
*Co-First Author
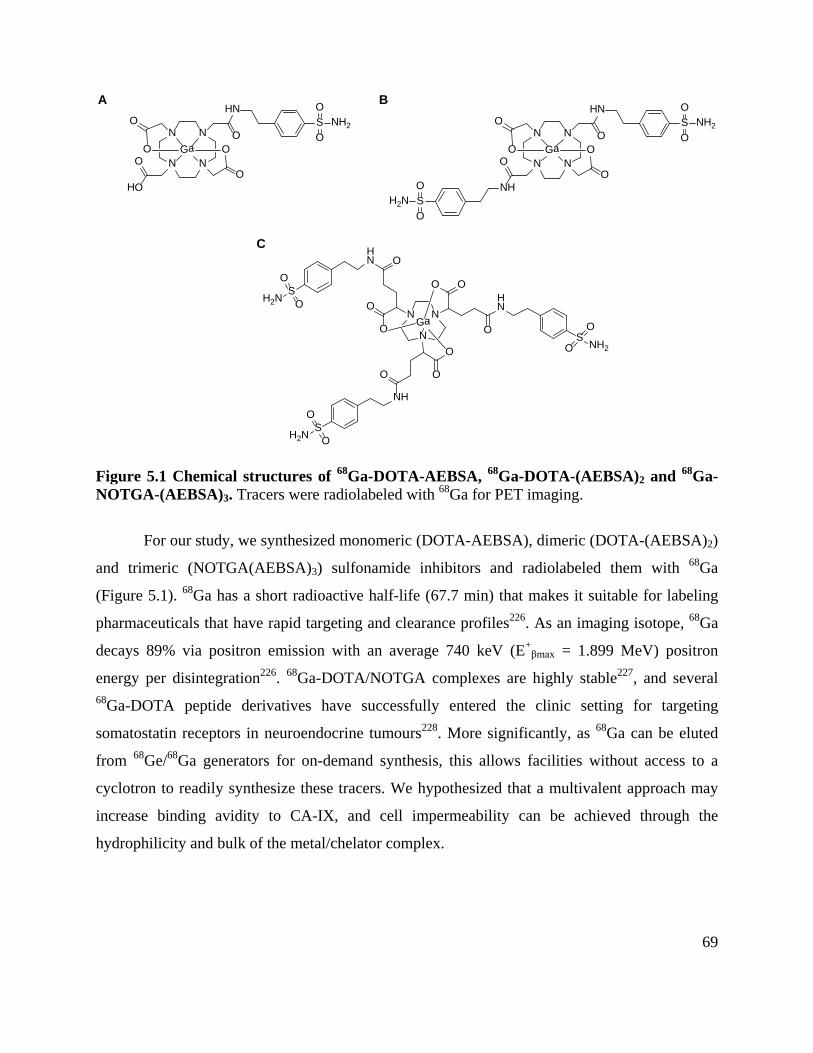
69
N N
NN
O
HN
GaO
O
O
OO
HO
S NH2N N
NN
O
HN
GaO
O
O
OO
NH
S NH2
SH2N
N
N N
OOHN
O
O
O
NH
O
O
O
HN O
SNH2
SH2N
Ga O
O
O
O
SH2N
O
O
O
O
O
O
O
OA B
C
Figure 5.1 Chemical structures of 68Ga-DOTA-AEBSA, 68Ga-DOTA-(AEBSA)2 and 68Ga-NOTGA-(AEBSA)3. Tracers were radiolabeled with 68Ga for PET imaging.
For our study, we synthesized monomeric (DOTA-AEBSA), dimeric (DOTA-(AEBSA)2)
and trimeric (NOTGA(AEBSA)3) sulfonamide inhibitors and radiolabeled them with 68Ga
(Figure 5.1). 68Ga has a short radioactive half-life (67.7 min) that makes it suitable for labeling
pharmaceuticals that have rapid targeting and clearance profiles226. As an imaging isotope, 68Ga
decays 89% via positron emission with an average 740 keV (E+βmax = 1.899 MeV) positron
energy per disintegration226. 68Ga-DOTA/NOTGA complexes are highly stable227, and several 68Ga-DOTA peptide derivatives have successfully entered the clinic setting for targeting
somatostatin receptors in neuroendocrine tumours228. More significantly, as 68Ga can be eluted
from 68Ge/68Ga generators for on-demand synthesis, this allows facilities without access to a
cyclotron to readily synthesize these tracers. We hypothesized that a multivalent approach may
increase binding avidity to CA-IX, and cell impermeability can be achieved through the
hydrophilicity and bulk of the metal/chelator complex.
70
5.2 Methods
5.2.1 Reagents and Instrumentation
All chemicals and solvents unless otherwise specified were obtained from commercial sources,
and used without further purification. Tri-tert-butyl 1,4,7,10-tetraazacyclododecane-1,4,7,10-
tetraacetate (1) was purchased from TCI America (Portland, OR). 1,7-Di-tert-butyl 1,4,7,10-
tetraazacyclododecane-1,4,7,10-tetraacetate (5) and 1,4,7-triazacyclononane-1,4,7-tris-glutamic
acid-α-tert-butyl ester-γ-succinimidyl ester (9) were synthesized according to literature
methods229, 230. Proton NMR spectra were obtained using a Bruker (Billerica, MA) Avance 300
spectrometer, and were reported in parts per million downfield from the peak of internal
tetramethylsilane. High resolution electrospray-ionization mass spectrometry (ESI-MS) was
performed on a Waters Micromass LCT TOF instrument. Purification and quality control of 68Ga-labeled CA-IX inhibitors were performed on an Agilent (Santa Clara, CA) HPLC system
equipped with a model 1200 quaternary pump, a model 1200 UV absorbance detector
(wavelength preset at 220 nm), and a Bioscan (Washington, DC) NaI scintillation detector. The
HPLC columns used were a semipreparative column (Phenomenex C18, 5 µ, 250 × 10 mm) and
an analytical column (Phenomenex Luna C18, 5 µ, 250 × 4.6 mm). The HPLC conditions used
for the purification and quality control of cold and radiolabeled compounds are shown in Table
5.1. [68Ga]GaCl3 was eluted from either a 30-mCi 68Ge/68Ga generator from Eckert & Ziegler
(Berlin, Germany) or a 50-mCi generator from iThemba LABS (Faure, South Africa).
Radioactivity of 68Ga-labeled tracers were measured using a Capintec (Ramsey, NJ) CRC®-
25R/W dose calibrator.
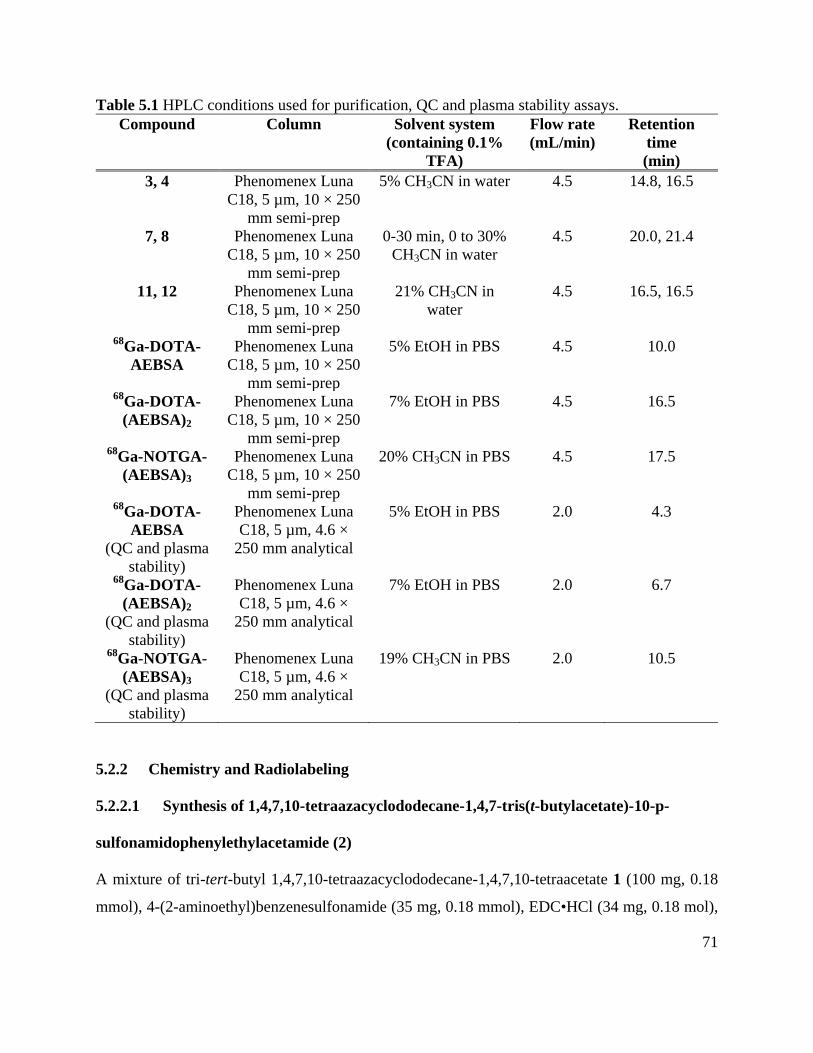
71
Table 5.1 HPLC conditions used for purification, QC and plasma stability assays. Compound Column Solvent system
(containing 0.1% TFA)
Flow rate (mL/min)
Retention time (min)
3, 4 Phenomenex Luna C18, 5 µm, 10 × 250
mm semi-prep
5% CH3CN in water 4.5 14.8, 16.5
7, 8 Phenomenex Luna C18, 5 µm, 10 × 250
mm semi-prep
0-30 min, 0 to 30% CH3CN in water
4.5 20.0, 21.4
11, 12 Phenomenex Luna C18, 5 µm, 10 × 250
mm semi-prep
21% CH3CN in water
4.5 16.5, 16.5
68Ga-DOTA-AEBSA
Phenomenex Luna C18, 5 µm, 10 × 250
mm semi-prep
5% EtOH in PBS 4.5 10.0
68Ga-DOTA-(AEBSA)2
Phenomenex Luna C18, 5 µm, 10 × 250
mm semi-prep
7% EtOH in PBS 4.5 16.5
68Ga-NOTGA-(AEBSA)3
Phenomenex Luna C18, 5 µm, 10 × 250
mm semi-prep
20% CH3CN in PBS 4.5 17.5
68Ga-DOTA-AEBSA
(QC and plasma stability)
Phenomenex Luna C18, 5 µm, 4.6 ×
250 mm analytical
5% EtOH in PBS 2.0 4.3
68Ga-DOTA-(AEBSA)2
(QC and plasma stability)
Phenomenex Luna C18, 5 µm, 4.6 ×
250 mm analytical
7% EtOH in PBS 2.0 6.7
68Ga-NOTGA-(AEBSA)3
(QC and plasma stability)
Phenomenex Luna C18, 5 µm, 4.6 ×
250 mm analytical
19% CH3CN in PBS 2.0 10.5
5.2.2 Chemistry and Radiolabeling
5.2.2.1 Synthesis of 1,4,7,10-tetraazacyclododecane-1,4,7-tris(t-butylacetate)-10-p-
sulfonamidophenylethylacetamide (2)
A mixture of tri-tert-butyl 1,4,7,10-tetraazacyclododecane-1,4,7,10-tetraacetate 1 (100 mg, 0.18
mmol), 4-(2-aminoethyl)benzenesulfonamide (35 mg, 0.18 mmol), EDC•HCl (34 mg, 0.18 mol),
72
ethyldiisopropylamine (30 µL, 0.18 mmol), and HOBt(hydroxybenzotriazole)•H2O (27 mg, 0.18
mmol) in DMF (5 mL) was stirred at room temperature for 24 h, and then the solvent was
removed under reduced pressure. Ethyl acetate (50 mL) was added to the residue, and then the
mixture was washed successively with 0.5 M NaOH (50 mL × 2), saturated aqueous NaHCO3
solution (50 mL), and brine (50 mL). The organic layer was dried over magnesium sulfate before
evaporation. The residue was obtained as a white powder and used for the next reaction without
further purification. Yield: 71 mg (0.09 mmol, 52%). 1H NMR (300 MHz, CDCl3) δ 9.09 (s, 1H,
CONH), 7.86 (d, J = 8.1 Hz, 2H, Ar–H), 7.48 (d, J = 8.1 Hz, 2H, Ar–H), 5.59 (s, 2H, NH2), 3.78
– 3.28 (m, 6H, CH2), 3.14 – 2.65 (m, 10H, CH2), 2.31 – 1.92 (m, 12H, CH2), 1.47 (s, 27H, CH3);
HRMS(ESI) Calcd. for C36H62N6O9S: m/z 755.4377 ([M+H]+); Found: m/z 755.4373 ([M+H]+).
5.2.2.2 Synthesis of 1,4,7,10-tetraazacyclododecane-1,4,7-triacetic acid, 10-p-
sulfonamidophenylethylacetamide (DOTA-AEBSA, 3)
A solution of 2 (20 mg, 0.026 mmol) in 1:1 TFA/CH2Cl2 (2 mL) was stirred at room temperature
overnight. Solvent was evaporated and CH2Cl2 (10 mL × 2) was added and subsequently
removed under reduced pressure to remove excess TFA. The residue was dissolved in de-ionized
water and purified by HPLC to yield 3·xTFA as a white solid (17 mg). 1H NMR (D2O,
300 MHz) δ 7.86 (d, J = 8.0 Hz, 2H, Ar–H), 7.51 (d, J = 8.0 Hz, 2H, Ar–H), 4.11 – 3.65 (m, 6H,
CH2), 3.64 – 3.48 (m, 4H, CH2), 3.42 – 3.00 (m, 14H, CH2), 2.98 – 2.82 (m, 4H, CH2);
HRMS(ESI) Calcd. for C24H38N6O9S: m/z 587.2499 ([M+H]+); Found: m/z 587.2507 ([M+H]+).
5.2.2.3 Synthesis of 1,4,7,10-tetraazacyclododecane-1,4-bis(t-butylacetate)-7,10-bis-p-
sulfonamidophenylethylacetamide (6)
A mixture of 1,7-di-tert-butyl 1,4,7,10-tetraazacyclododecane-1,4,7,10-tetraacetate 5 (150 mg,
0.29 mmol), 4-(2-aminoethyl)benzenesulfonamide (116 mg, 0.58 mmol), EDC•HCl (111 mg,
0.58 mol), ethyldiisopropylamine (101 µL, 0.58 mmol), and HOBt•H2O (89 mg, 0.58 mmol) in
DMF (5 mL) was stirred at room temperature for 24 h, and solvent was removed under reduced
pressure. Ethyl acetate (50 mL) was added to the residue, and then the mixture was washed
successively with 0.5 M NaOH (50 mL × 2), saturated aqueous NaHCO3 solution (50 mL), and
73
brine (50 mL). The organic layer was dried over magnesium sulfate before evaporation. The
residue was obtained as a white powder and used for next reaction without further purification.
Yield: 57 mg (0.06 mmol, 22%). 1H NMR (300 MHz, d6-DMSO) δ 8.27 (s, 2H, CONH), 7.82 –
7.67 (m, 4H, Ar–H), 7.47 – 7.35 (m, 4H, Ar–H), 5.80 (s, 4H, NH2), 3.27 – 3.10 (m, 6H, CH2),
3.05 – 2.90 (m, 6H, CH2), 2.87 – 2.75 (m, 6H, CH2), 2.72 – 2.57 (m, 6H, CH2), 2.30 – 1.94 (m,
8H, CH2), 1.41 (s, 18H, CH3); HRMS(ESI) Calcd. for C40H64N8O10S2: m/z 881.4265 ([M+H]+);
Found: m/z 881.4277 ([M+H]+).
5.2.2.4 Synthesis of 1,4,7,10-tetraazacyclododecane-1,7-diacetic acid, 4,10-bis-p-
sulfonamidophenylethylacetamide (DOTA-(AEBSA)2, 7)
A solution of 6 (50 mg, 0.06 mmol) in 1:1 TFA/CH2Cl2 (2 mL) was stirred at room temperature
overnight. Solvent was evaporated and CH2Cl2 (10 mL × 2) was added and then removed under
reduced pressure to remove excess TFA. The residue was dissolved in de-ionized water and
purified by HPLC to give 7·xTFA as a white solid (26 mg). 1H NMR (D2O, 300 MHz) δ 7.81 (d,
J = 8.0 Hz, 4H, Ar–H), 7.44 (d, J = 8.0 Hz, 4H, Ar–H), 3.90 – 3.59 (m, 4H, CH2), 3.59 – 3.33 (m,
8H, CH2), 3.33 – 2.98 (m, 12H, CH2), 2.96 – 2.74 (m, 8H, CH2); HRMS(ESI) Calcd. for
C32H48N8O10S2: m/z 769.3013 ([M+H]+); Found: m/z 769.3028 ([M+H]+).
5.2.2.5 Synthesis of 1,4,7-triazacyclononane-1,4,7-tris-glutamic acid-α-tert-butyl ester-γ-
p-sulfonamidophenylethylamide (10)
A mixture of 1,4,7-triazacyclononane-1,4,7-tris-glutamic acid-α-tert-butyl ester-γ-succinimidyl
ester 9 (680 mg, 0.70 mmol), 4-(2-aminoethyl)benzenesulfonamide (459 mg, 2.29 mmol) and
ethyldiisopropylamine (399 µL, 2.29 mmol) in DMF (50 mL) was initially stirred at room
temperature for 24 h before incubation at 50oC for an additional 24 h. Excess solvent was
removed under reduced pressure. Water (100 mL) was added and the resultant mixture was
extracted with CHCl3 (100 mL × 3). The combined organic phase was dried over magnesium
sulfate before evaporation. Residue was loaded onto a silica gel column and eluted using a
mixture of EtOAc/methanol (10:1 to 5:1). The product was obtained as a white foam. Yield: 283
mg (0.23 mmol, 33%). 1H NMR (300 MHz, d6-DMSO) δ 7.95 (s, 3H, CONH), 7.73 (d, J = 8.2
74
Hz, 6H, Ar–H), 7.37 (d, J = 8.2 Hz, 6H, Ar–H), 7.28 (s, 6H, NH2), 3.14 – 3.00 (m, 4H, CH2),
2.85 – 2.75 (m, 10H, CH2), 2.69 – 2.55 (m, 6H, CH2), 2.25 – 2.05 (m, 7H, CH2), 1.83 – 1.55 (m,
12H, CH2), 1.40 (s, 27H, CH3); HRMS(ESI) Calcd. for C57H87N9O15S3: m/z 1234.5562
([M+H]+); Found: m/z 1234.5559 ([M+H]+).
5.2.2.6 Synthesis of 1,4,7-triazacyclononane-1,4,7-tris-glutamic acid-γ-p-
sulfonamidophenylethylamide (NOTGA-(AEBSA)3, 11)
A solution of 10 (100 mg, 0.081 mmol) in 1:1 TFA/CH2Cl2 (2 mL) was stirred at room
temperature overnight. The solvent was evaporated and CH2Cl2 (10 mL × 2) was added and then
removed under reduced pressure to remove excess TFA. The residue was dissolved in de-ionized
water and purified by HPLC to yield 11·xTFA as a white solid (70 mg). 1H NMR (300 MHz,
DMSO) δ 8.08 (s, 3H, CONH), 7.74 (d, J = 8.1 Hz, 6H, Ar–H), 7.37 (d, J = 8.1 Hz, 6H, Ar–H),
7.30 (s, 6H, NH2), 3.37 – 3.14 (m, 11H, CH2), 3.13 – 2.87 (m, 9H, CH2), 2.84 – 2.70 (m, 7H,
CH2), 2.37 – 2.18 (m, 6H, CH2), 2.06 – 1.88 (m, 6H, CH2); HRMS(ESI) Calcd. for
C45H63N9O15S3: m/z 1065.3684 ([M+H]+); Found: m/z 1066.3666 ([M+H]+).
5.2.2.7 General Procedure for the Synthesis of Cold Gallium Standard
A solution of the corresponding precursor in sodium acetate buffer (0.5 mL, 0.1 M, pH = 4.0)
and 5 equiv. of natGaCl3 was stirred at 80 oC for 15 min. The mixture was purified by HPLC to
give the corresponding gallium complexes as a white fluffy solid.
natGa-DOTA-AEBSA (4) Yield: 69%. 1H NMR (D2O, 300 MHz) δ 7.95 (d, J = 8.2 Hz, 2H, Ar–
H), 7.60 (d, J = 8.2 Hz, 2H, Ar–H), 4.21 – 3.85 (m, 8H, CH2), 3.78 – 3.32 (m, 16H, CH2), 3.14 –
2.92 (m, 4H, CH2); HRMS(ESI) Calcd. for C24H35GaN6O9S: m/z 653.1520 ([M+H]+); Found:
m/z 653.1516 ([M+H]+).
natGa-DOTA-(AEBSA)2 (8) Yield: 61%. 1H NMR (300 MHz, D2O) δ 7.94 (d, J = 8.2 Hz, 4H,
Ar–H), 7.59 (d, J = 8.0 Hz, 4H, Ar–H), 4.06 – 3.88 (m, 4H, CH2), 3.79 – 3.50 (m, 16H, CH2),
75
3.48 – 3.23 (m, 4H, CH2), 3.17 – 2.91 (m, 8H, CH2); HRMS(ESI) Calcd. for C32H46GaN8O10S2:
m/z 835.2034 ([M]+); Found: m/z 835.2039 ([M]+). natGa-NOTGA-(AEBSA)3 (12) Yield: 72%. 1H NMR (300 MHz, DMSO) δ 8.02 (s, 3H,
CONH), 7.74 (d, J = 8.2 Hz, 6H, Ar–H), 7.40 (d, J = 8.2 Hz, 6H, Ar–H), 7.29 (s, 6H, NH2), 3.30
– 3.19 (m, 10H, CH2), 3.17 – 2.90 (m, 10H, CH2), 2.90 – 2.67 (m, 10H, CH2), 2.41 – 2.26 (m,
3H, CH2), 2.18 – 1.98 (m, 3H, CH2), 1.95 – 1.77 (m, 3H, CH2); HRMS(ESI) Calcd. for
C45H60GaN9O15S3: m/z 1130.2549 ([M-H]-); Found: m/z 1130.2570 ([M-H]-).
5.2.2.8 General Procedure for the Synthesis of 68Ga Tracers
68GaCl3 was purified following published procedures231. A HEPES buffer (0.50 mL, 2 M, pH =
5.0) solution of the corresponding precursor (30 µg for 68Ga-DOTA-AEBSA, and 40 µg for 68Ga-DOTA-(AEBSA)2 and 68Ga-NOTGA-(AEBSA)3) and purified 68GaCl3 (0.19-1.30 GBq for 68Ga-DOTA-AEBSA, 0.19-1.41 GBq for 68Ga-DOTA-(AEBSA)2, and 0.19-0.70 GBq for 68Ga-
NOTGA-(AEBSA)3) was heated in the microwave for 1 min. Reaction mixtures were purified by
HPLC. 68Ga-DOTA-AEBSA and 68Ga-DOTA-(AEBSA)2 were collected in fractions and used
directly for in vitro and in vivo studies. 68Ga-NOTGA-(AEBSA)3 was collected, diluted with
water, and loaded onto a C18 Sep-Pak cartridge to remove acetonitrile. The trapped 68Ga-
NOTGA-(AEBSA)3 was eluted off the cartridge with ethanol and diluted with saline for in vitro
and in vivo studies.
5.2.3 Binding Affinity Measurement
Inhibition constants (Ki) of AmBF3-AEBS, AmBF3-ABS, and AmBF3-(AEBS)3 and AmBF3-
(ABS)3 for CA-I, -II, -IX and -XII were determined using the CA catalyzed CO2 hydration
stopped-flow assays following published procedures178.
5.2.4 Stability in Mouse Plasma
Following published procedures, 100 µL aliquots of tracer were incubated with 400 µL of
BALB/c mouse plasma (Innovative Research) for 2 h at 37 °C231. After incubation, sample was
76
quenched with 70% CH3CN, passed through a 0.45 µm filter, and loaded on to a radio-HPLC
system for analysis.
5.2.5 Lipophilicity Measurement
Values of octanol:water distribution coefficient at pH 7.4 (LogD7.4) were determined for the
radiotracers using a shake flask method as previously described231. Aliquots (2 μL) of the 68Ga-
labeled tracers were added to 15 mL conical centrifuge tubes containing 3 mL of octanol and 3
mL of phosphate buffer (0.1 M, pH 7.4). The mixture was vortexed for 1 min and centrifuged at
5,000 rpm for 10 min. Samples of the octanol (1 mL) and aqueous (1 mL) phases were taken and
counted on a gamma counter. LogD7.4 was calculated using the following equation: LogD7.4 =
Log10[(counts in octanol phase)/(counts in buffer phase)].
5.2.6 Cell Line
HT-29 human colorectal cancer cells were obtained as a gift from Dr. Donald Yapp (BC Cancer
Research Centre, Vancouver, Canada). Cells were cultured in Dulbecco’s Modified Eagle’s
Medium supplemented with 10% fetal bovine serum, 100 U/mL penicillin-streptomycin, and
non-essential amino acids. Cells were incubated at 37 °C in an atmosphere containing 5% CO2
and used for in vitro or in vivo experiments when 80-90% confluence was reached.
5.2.7 Immunofluorescence of HT-29 Colonies
This study was performed following published procedures232. Matrigel (52 µL) was added to
individual wells of an 8-well chamber slide and allowed to solidify at 37 °C for 30 min. Cells (~
1000) cultured in media + 2% matrigel in 300 µL were seeded per well. Cultures were incubated
at 37 °C in an atmosphere containing 5% CO2 for 21 days before fixation for
immunocytochemistry. Growth medium was refreshed every four days with media + 2%
matrigel. For immunofluorescence, colonies were fixed with 2% paraformaldehyde for 25 min at
room temperature and permeabilized with PBS + 0.5% Triton-X for 10 min at 4 °C. After three
rinses with PBS + 0.1 M glycine for 10 min, samples were rinsed once for 5 min with IF buffer
(130 mM NaCl, 7 mM Na2HPO4, 3.5 mM NaH2PO4, 7.7 mM NaN3, 0.1% bovine serum
77
albumin, 0.2% Triton X-100, 0.05% Tween-20) and blocked for 2.5 h in IF buffer containing
10% serum. CA-IX was stained with phycoerythrin-conjugated mouse-anti CA-IX antibody
(R&D Systems) at 4 °C overnight. Cells were counterstained with Oregon Green 488 phalloidin
(Invitrogen) for 20 min and Draq5 (Biostatus Limited) for 5 min. Imaging was performed on a
Nikon Eclipse C1 confocal laser scanning microscope (Melville, NY) equipped with 488 nm,
561 nm, and 638 nm lasers.
5.2.8 PET Imaging and Biodistribution Studies
All animal studies were performed in accordance with the Canadian Council on Animal Care
guidelines and approved by the Animal Care Committee of the University of British Columbia.
Male immunodeficient NOD.Cg-PrkdcscidIl2rgtm1Wjl/SzJ (NSG) mice bred in-house at the Animal
Research Centre, BC Cancer Research Centre were used for this study. Under anesthesia with
2.5% isoflurane in 2.0 L/min of oxygen, mice were subcutaneously inoculated with 5 × 10⁶ HT-
29 cells (in 100 µL PBS and BD Matrigel Matrix at 1:1 ratio) under the right dorsal flank.
Biodistribution studies and PET/CT imaging were performed when tumours reached 7-9 mm in
diameter.
PET imaging studies of 68Ga-labeled tracers were conducted using a Siemens Inveon
microPET/CT scanner. Under 2.5% isoflurane anesthesia in oxygen at 2.0 L/min, 3.7-7.4 MBq
of 68Ga-DOTA-AEBSA, 68Ga-DOTA-(AEBSA)2 or 68Ga-NOTGA-(AEBSA)3 in a volume of
200 µL was administered intravenously through the caudal vein. For blocking experiments, mice
were intravenously pre-injected with 10 or 20 mg/kg acetazolamide 1 h (100 – 200 µL in saline,
i.v.) before administering the radiotracer. At 1 h post-injection (p.i.), a 10 min PET scan was
performed. For anatomical localization, a 10 min CT scan was performed prior to each PET
acquisition. The body temperature of mice was maintained at 37 °C with the use of thermal pads.
PET data were acquired in list mode acquisition, reconstructed using the 3d-OSEM-MAP
algorithm with CT-based attenuation correction. Three-dimensional regions of interests (ROIs)
were placed on the reconstructed images to determine the %ID/g of tissue using the Inveon
Acquisition Workplace software (conversion factor was predetermined using a 68Ge/68Ga
source).
78
Biodistribution studies were performed to confirm the quantitative ROI uptake values observed
from PET scans. At 1 h p.i., mice were euthanized by cervical dislocation. Tissues of interest
(blood, testes, stomach, intestine, spleen, liver, pancreas, kidney, lung, heart, tumour, muscle,
bone and brain) were collected. Tissues were rinsed with PBS (except blood), blotted dry,
weighed, and measured on a Packard Cobra II 5000 Series auto-gamma counter.
5.2.9 Statistical Analysis
All statistics were performed using Prism 6 software (GraphPad). For Figure 5.6, P values for the
differences between tumour/muscle ratio, kidney and liver uptake were calculated using a two-
way ANOVA test adjusted for multiple comparisons using the Holm-Šídák method. Values <
0.05 were considered statistically significant. For Table 5.4, P values for the difference of tracer
uptake in mouse tissues between unblocked and blocked groups were calculated using a two-
tailed t-test adjusted for multiple comparisons using the Holm-Šídák method. Values < 0.05 were
considered statistically significant.
5.3 Results and Discussion
The synthesis scheme for the precursors and standards are shown in Figure 5.2. One to
three 4-(2-aminoethyl)benzenesulfonamide (AEBSA) moieties were conjugated to either DOTA
(monomer and dimer) or NOTGA (trimer) chelators to obtain the radiolabeling precursors.
Results of the radiolabeling experiments are summarized in Table 5.2. All three tracers were
successfully radiolabeled with 68Ga with average decay-corrected isolated yields of ≥ 64% (n ≥
3). The specific activities measured were 536.5 ± 187.1, 269.5 ± 176.9, and 50.9 ± 8.4
GBq/µmol for 68Ga-DOTA-AEBSA, 68Ga-DOTA-(AEBSA)2, and 68Ga-NOTGA-(AEBSA)3
respectively. After purification by radio-HPLC, tracers were obtained in ≥ 97.5% average
radiochemical purity for in vitro and in vivo experiments.
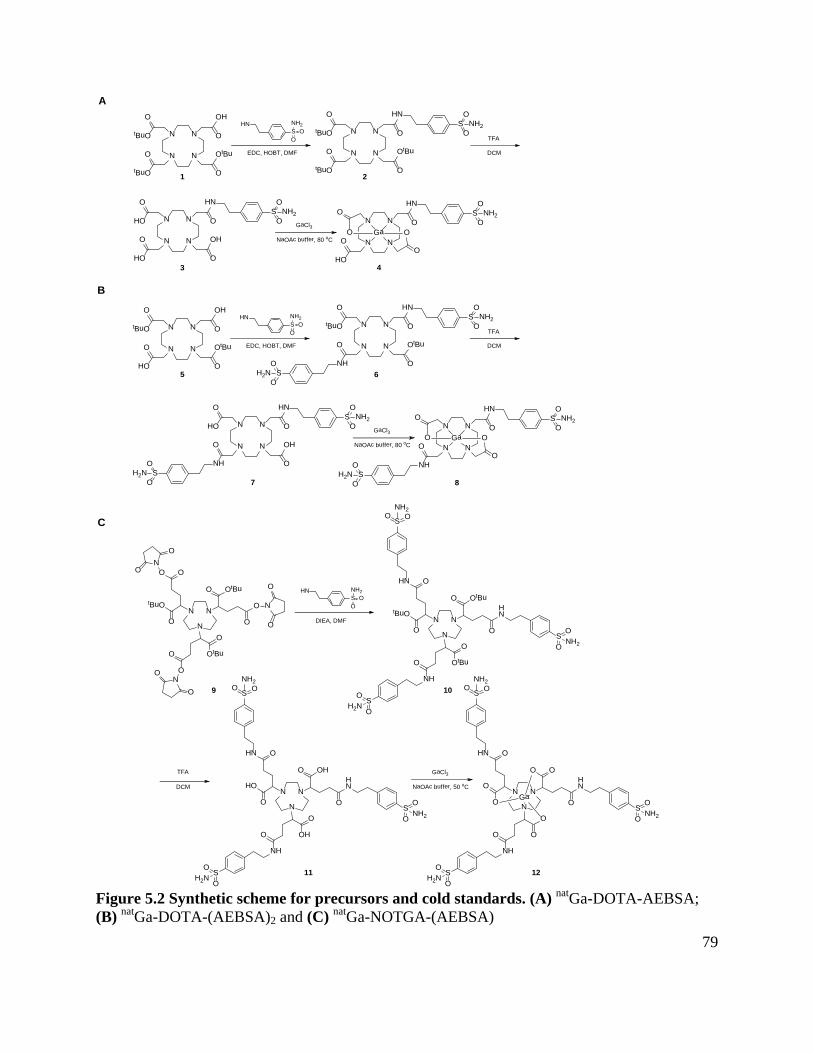
79
DIEA, DMF
EDC, HOBT, DMF
HNS OO
NH2
TFA
2
3 4
GaCl3
NaOAc buffer, 80 oC
N N
NN
O
HN
GaO
O
O
OO
HO
SO
ONH2N N
NN
O
HN
O
HO
SO
ONH2
OH
O
HO
O
N N
NN
O
HN
O
tBuO
SO
ONH2
OtBu
O
tBuO
O
N N
NN
O
O
tBuO
OtBu
O
tBuO
O OH
EDC, HOBT, DMF
HNS OO
NH2
TFA
GaCl3
NaOAc buffer, 80 oC
N N
NN
O
HN
GaO
O
O
OO
NH
SO
ONH2N N
NN
O
HN
O
NH
SO
ONH2
OH
O
HO
O
N N
NN
O
HN
O
NH
SO
ONH2
OtBu
O
tBuO
O
N N
NN
O
O
HO
OtBu
O
tBuO
O OH
SO
OH2N
SO
OH2N S
O
OH2N
6
7 8
N
N N
OtBuO
O
O
N
O
O
OtBu
O
O
O
NO
O
tBuO
O
O ON
O
O
N
N N
OtBuOHN
O
OtBu
O
NH
O
tBuO
O
HN O
SO
ONH2
SO
OH2N
SO O
NH2
N
N N
OHOHN
O
OH
O
NH
O
HO
O
HN O
SO
ONH2
SO
OH2N
SO O
NH2
GaCl3
NaOAc buffer, 50 oC
N
N N
OOHN
O
O
O
NH
O
O
O
HN O
SO
ONH2
SO
OH2N
SO O
NH2
Ga
10
11 12
A
B
C
1
5
9
HNS OO
NH2
DCM
DCM
DCM
TFA
Figure 5.2 Synthetic scheme for precursors and cold standards. (A) natGa-DOTA-AEBSA; (B) natGa-DOTA-(AEBSA)2 and (C) natGa-NOTGA-(AEBSA)
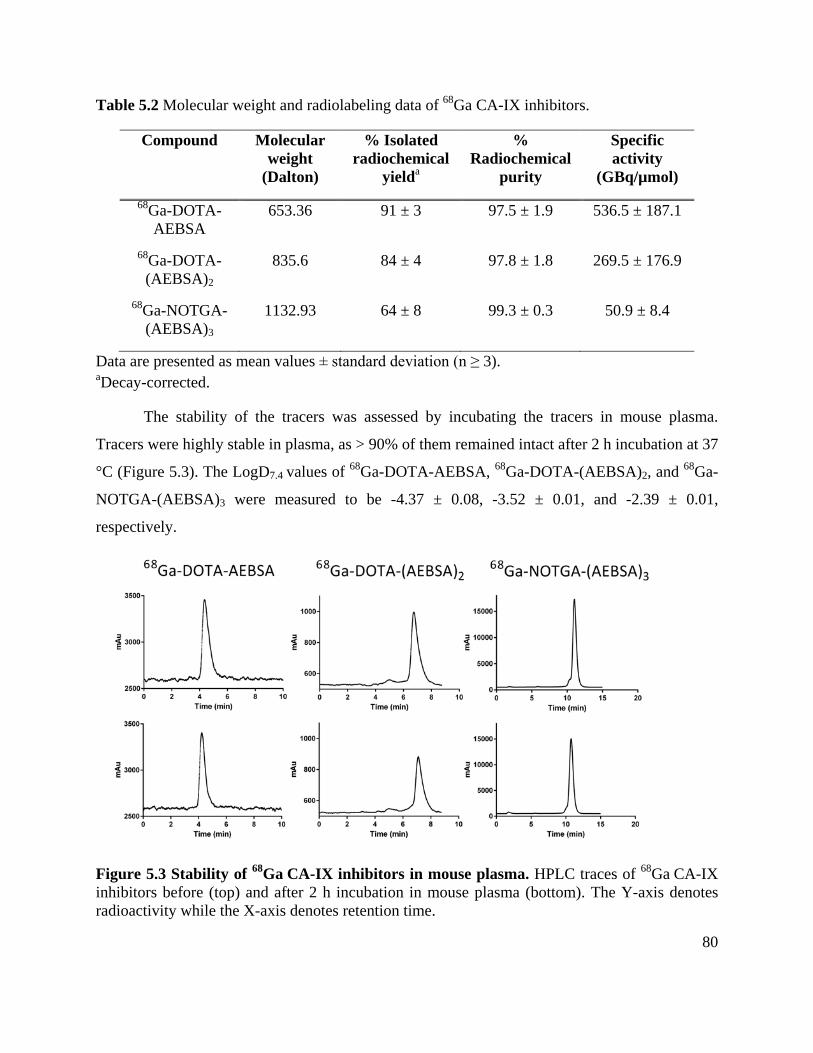
80
Table 5.2 Molecular weight and radiolabeling data of 68Ga CA-IX inhibitors.
Compound Molecular weight
(Dalton)
% Isolated radiochemical
yielda
% Radiochemical
purity
Specific activity
(GBq/µmol) 68Ga-DOTA-
AEBSA 653.36 91 ± 3 97.5 ± 1.9 536.5 ± 187.1
68Ga-DOTA-(AEBSA)2
835.6 84 ± 4 97.8 ± 1.8 269.5 ± 176.9
68Ga-NOTGA-(AEBSA)3
1132.93 64 ± 8 99.3 ± 0.3 50.9 ± 8.4
Data are presented as mean values ± standard deviation (n ≥ 3). aDecay-corrected.
The stability of the tracers was assessed by incubating the tracers in mouse plasma.
Tracers were highly stable in plasma, as > 90% of them remained intact after 2 h incubation at 37
°C (Figure 5.3). The LogD7.4 values of 68Ga-DOTA-AEBSA, 68Ga-DOTA-(AEBSA)2, and 68Ga-
NOTGA-(AEBSA)3 were measured to be -4.37 ± 0.08, -3.52 ± 0.01, and -2.39 ± 0.01,
respectively.
Figure 5.3 Stability of 68Ga CA-IX inhibitors in mouse plasma. HPLC traces of 68Ga CA-IX inhibitors before (top) and after 2 h incubation in mouse plasma (bottom). The Y-axis denotes radioactivity while the X-axis denotes retention time.
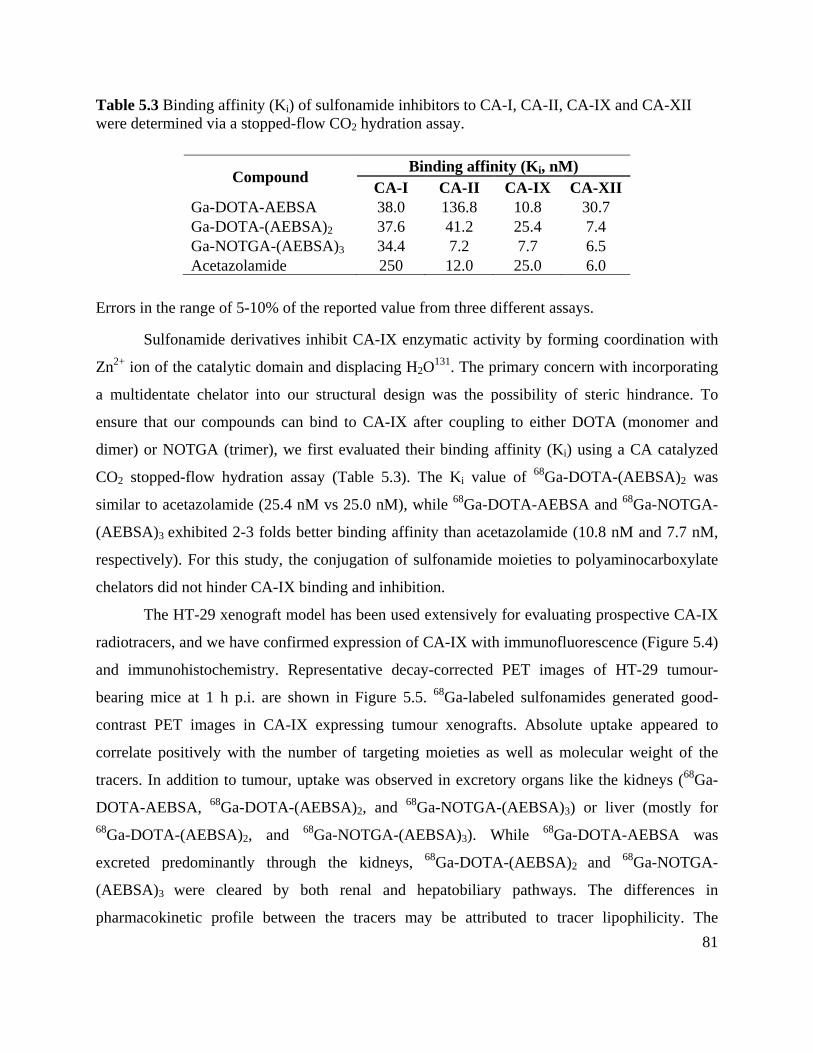
81
Table 5.3 Binding affinity (Ki) of sulfonamide inhibitors to CA-I, CA-II, CA-IX and CA-XII were determined via a stopped-flow CO2 hydration assay.
Errors in the range of 5-10% of the reported value from three different assays.
Sulfonamide derivatives inhibit CA-IX enzymatic activity by forming coordination with
Zn2+ ion of the catalytic domain and displacing H2O131. The primary concern with incorporating
a multidentate chelator into our structural design was the possibility of steric hindrance. To
ensure that our compounds can bind to CA-IX after coupling to either DOTA (monomer and
dimer) or NOTGA (trimer), we first evaluated their binding affinity (Ki) using a CA catalyzed
CO2 stopped-flow hydration assay (Table 5.3). The Ki value of 68Ga-DOTA-(AEBSA)2 was
similar to acetazolamide (25.4 nM vs 25.0 nM), while 68Ga-DOTA-AEBSA and 68Ga-NOTGA-
(AEBSA)3 exhibited 2-3 folds better binding affinity than acetazolamide (10.8 nM and 7.7 nM,
respectively). For this study, the conjugation of sulfonamide moieties to polyaminocarboxylate
chelators did not hinder CA-IX binding and inhibition.
The HT-29 xenograft model has been used extensively for evaluating prospective CA-IX
radiotracers, and we have confirmed expression of CA-IX with immunofluorescence (Figure 5.4)
and immunohistochemistry. Representative decay-corrected PET images of HT-29 tumour-
bearing mice at 1 h p.i. are shown in Figure 5.5. 68Ga-labeled sulfonamides generated good-
contrast PET images in CA-IX expressing tumour xenografts. Absolute uptake appeared to
correlate positively with the number of targeting moieties as well as molecular weight of the
tracers. In addition to tumour, uptake was observed in excretory organs like the kidneys (68Ga-
DOTA-AEBSA, 68Ga-DOTA-(AEBSA)2, and 68Ga-NOTGA-(AEBSA)3) or liver (mostly for 68Ga-DOTA-(AEBSA)2, and 68Ga-NOTGA-(AEBSA)3). While 68Ga-DOTA-AEBSA was
excreted predominantly through the kidneys, 68Ga-DOTA-(AEBSA)2 and 68Ga-NOTGA-
(AEBSA)3 were cleared by both renal and hepatobiliary pathways. The differences in
pharmacokinetic profile between the tracers may be attributed to tracer lipophilicity. The
Compound Binding affinity (Ki, nM)
CA-I CA-II CA-IX CA-XII Ga-DOTA-AEBSA 38.0 136.8 10.8 30.7 Ga-DOTA-(AEBSA)2 37.6 41.2 25.4 7.4 Ga-NOTGA-(AEBSA)3 34.4 7.2 7.7 6.5 Acetazolamide 250 12.0 25.0 6.0
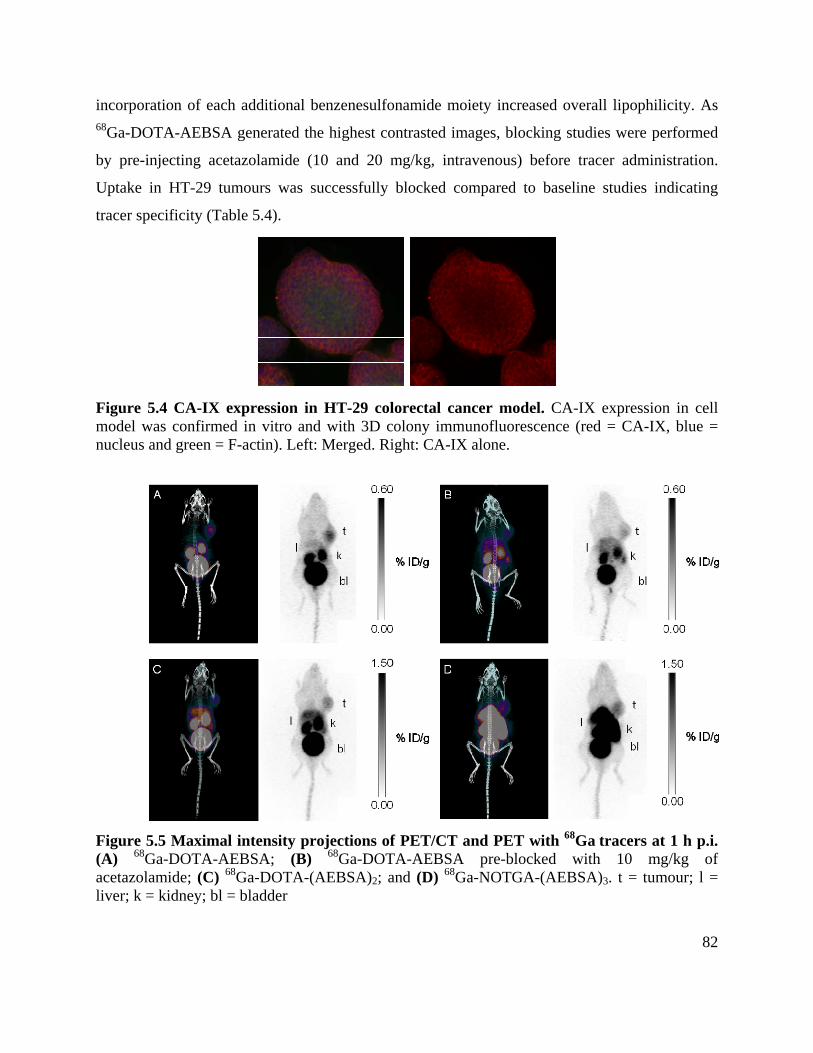
82
incorporation of each additional benzenesulfonamide moiety increased overall lipophilicity. As 68Ga-DOTA-AEBSA generated the highest contrasted images, blocking studies were performed
by pre-injecting acetazolamide (10 and 20 mg/kg, intravenous) before tracer administration.
Uptake in HT-29 tumours was successfully blocked compared to baseline studies indicating
tracer specificity (Table 5.4).
Figure 5.4 CA-IX expression in HT-29 colorectal cancer model. CA-IX expression in cell model was confirmed in vitro and with 3D colony immunofluorescence (red = CA-IX, blue = nucleus and green = F-actin). Left: Merged. Right: CA-IX alone.
Figure 5.5 Maximal intensity projections of PET/CT and PET with 68Ga tracers at 1 h p.i. (A) 68Ga-DOTA-AEBSA; (B) 68Ga-DOTA-AEBSA pre-blocked with 10 mg/kg of acetazolamide; (C) 68Ga-DOTA-(AEBSA)2; and (D) 68Ga-NOTGA-(AEBSA)3. t = tumour; l = liver; k = kidney; bl = bladder
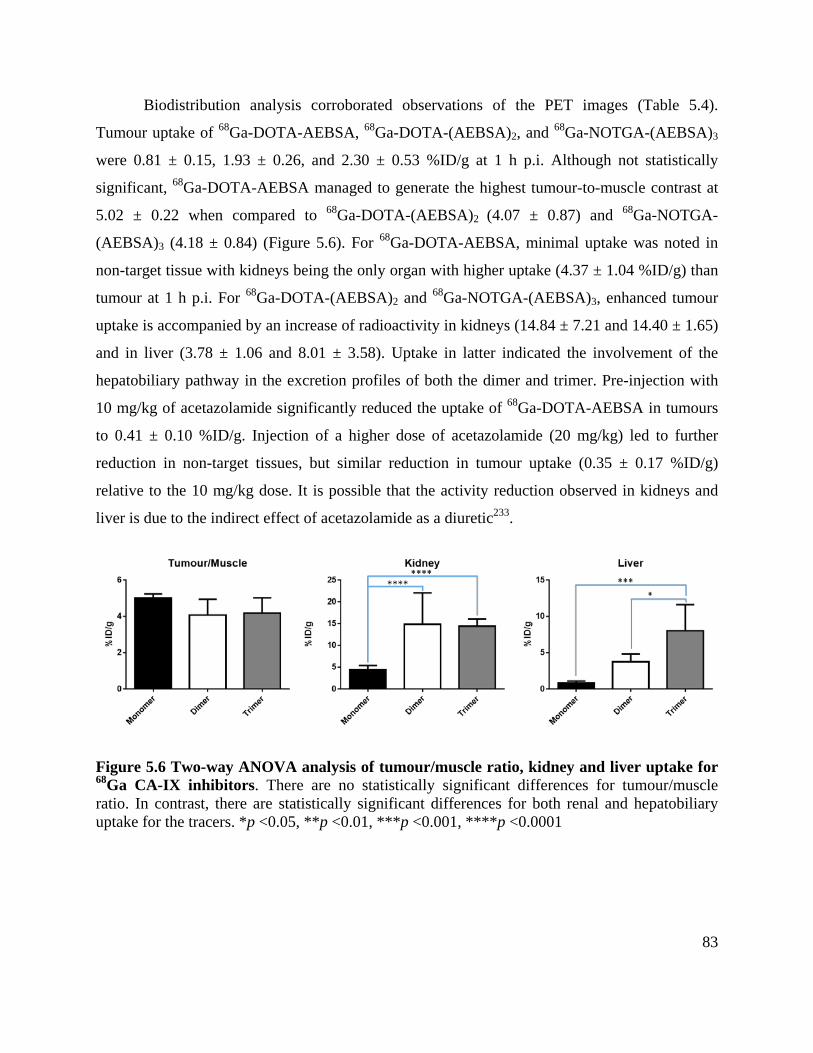
83
Biodistribution analysis corroborated observations of the PET images (Table 5.4).
Tumour uptake of 68Ga-DOTA-AEBSA, 68Ga-DOTA-(AEBSA)2, and 68Ga-NOTGA-(AEBSA)3
were 0.81 ± 0.15, 1.93 ± 0.26, and 2.30 ± 0.53 %ID/g at 1 h p.i. Although not statistically
significant, 68Ga-DOTA-AEBSA managed to generate the highest tumour-to-muscle contrast at
5.02 ± 0.22 when compared to 68Ga-DOTA-(AEBSA)2 (4.07 ± 0.87) and 68Ga-NOTGA-
(AEBSA)3 (4.18 ± 0.84) (Figure 5.6). For 68Ga-DOTA-AEBSA, minimal uptake was noted in
non-target tissue with kidneys being the only organ with higher uptake (4.37 ± 1.04 %ID/g) than
tumour at 1 h p.i. For 68Ga-DOTA-(AEBSA)2 and 68Ga-NOTGA-(AEBSA)3, enhanced tumour
uptake is accompanied by an increase of radioactivity in kidneys (14.84 ± 7.21 and 14.40 ± 1.65)
and in liver (3.78 ± 1.06 and 8.01 ± 3.58). Uptake in latter indicated the involvement of the
hepatobiliary pathway in the excretion profiles of both the dimer and trimer. Pre-injection with
10 mg/kg of acetazolamide significantly reduced the uptake of 68Ga-DOTA-AEBSA in tumours
to 0.41 ± 0.10 %ID/g. Injection of a higher dose of acetazolamide (20 mg/kg) led to further
reduction in non-target tissues, but similar reduction in tumour uptake (0.35 ± 0.17 %ID/g)
relative to the 10 mg/kg dose. It is possible that the activity reduction observed in kidneys and
liver is due to the indirect effect of acetazolamide as a diuretic233.
Figure 5.6 Two-way ANOVA analysis of tumour/muscle ratio, kidney and liver uptake for 68Ga CA-IX inhibitors. There are no statistically significant differences for tumour/muscle ratio. In contrast, there are statistically significant differences for both renal and hepatobiliary uptake for the tracers. *p <0.05, **p <0.01, ***p <0.001, ****p <0.0001
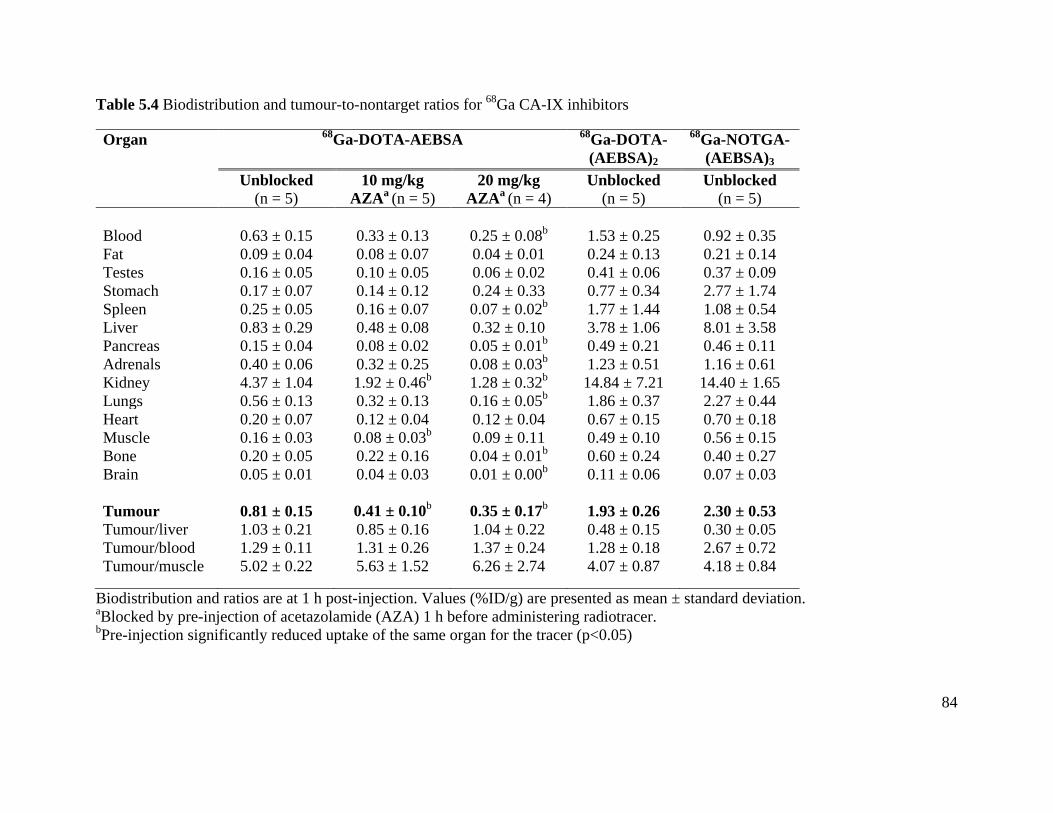
84
Table 5.4 Biodistribution and tumour-to-nontarget ratios for 68Ga CA-IX inhibitors
Organ 68Ga-DOTA-AEBSA
68Ga-DOTA-(AEBSA)2
68Ga-NOTGA-(AEBSA)3
Unblocked (n = 5)
10 mg/kg AZAa (n = 5)
20 mg/kg AZAa (n = 4)
Unblocked (n = 5)
Unblocked (n = 5)
Blood
0.63 ± 0.15
0.33 ± 0.13
0.25 ± 0.08b
1.53 ± 0.25
0.92 ± 0.35
Fat 0.09 ± 0.04 0.08 ± 0.07 0.04 ± 0.01 0.24 ± 0.13 0.21 ± 0.14 Testes 0.16 ± 0.05 0.10 ± 0.05 0.06 ± 0.02 0.41 ± 0.06 0.37 ± 0.09 Stomach 0.17 ± 0.07 0.14 ± 0.12 0.24 ± 0.33 0.77 ± 0.34 2.77 ± 1.74 Spleen 0.25 ± 0.05 0.16 ± 0.07 0.07 ± 0.02b 1.77 ± 1.44 1.08 ± 0.54 Liver 0.83 ± 0.29 0.48 ± 0.08 0.32 ± 0.10 3.78 ± 1.06 8.01 ± 3.58 Pancreas 0.15 ± 0.04 0.08 ± 0.02 0.05 ± 0.01b 0.49 ± 0.21 0.46 ± 0.11 Adrenals 0.40 ± 0.06 0.32 ± 0.25 0.08 ± 0.03b 1.23 ± 0.51 1.16 ± 0.61 Kidney 4.37 ± 1.04 1.92 ± 0.46b 1.28 ± 0.32b 14.84 ± 7.21 14.40 ± 1.65 Lungs 0.56 ± 0.13 0.32 ± 0.13 0.16 ± 0.05b 1.86 ± 0.37 2.27 ± 0.44 Heart 0.20 ± 0.07 0.12 ± 0.04 0.12 ± 0.04 0.67 ± 0.15 0.70 ± 0.18 Muscle 0.16 ± 0.03 0.08 ± 0.03b 0.09 ± 0.11 0.49 ± 0.10 0.56 ± 0.15 Bone 0.20 ± 0.05 0.22 ± 0.16 0.04 ± 0.01b 0.60 ± 0.24 0.40 ± 0.27 Brain 0.05 ± 0.01 0.04 ± 0.03 0.01 ± 0.00b 0.11 ± 0.06 0.07 ± 0.03
Tumour 0.81 ± 0.15 0.41 ± 0.10b 0.35 ± 0.17b 1.93 ± 0.26 2.30 ± 0.53 Tumour/liver 1.03 ± 0.21 0.85 ± 0.16 1.04 ± 0.22 0.48 ± 0.15 0.30 ± 0.05 Tumour/blood 1.29 ± 0.11 1.31 ± 0.26 1.37 ± 0.24 1.28 ± 0.18 2.67 ± 0.72 Tumour/muscle 5.02 ± 0.22 5.63 ± 1.52 6.26 ± 2.74 4.07 ± 0.87 4.18 ± 0.84
Biodistribution and ratios are at 1 h post-injection. Values (%ID/g) are presented as mean ± standard deviation. aBlocked by pre-injection of acetazolamide (AZA) 1 h before administering radiotracer. bPre-injection significantly reduced uptake of the same organ for the tracer (p<0.05)
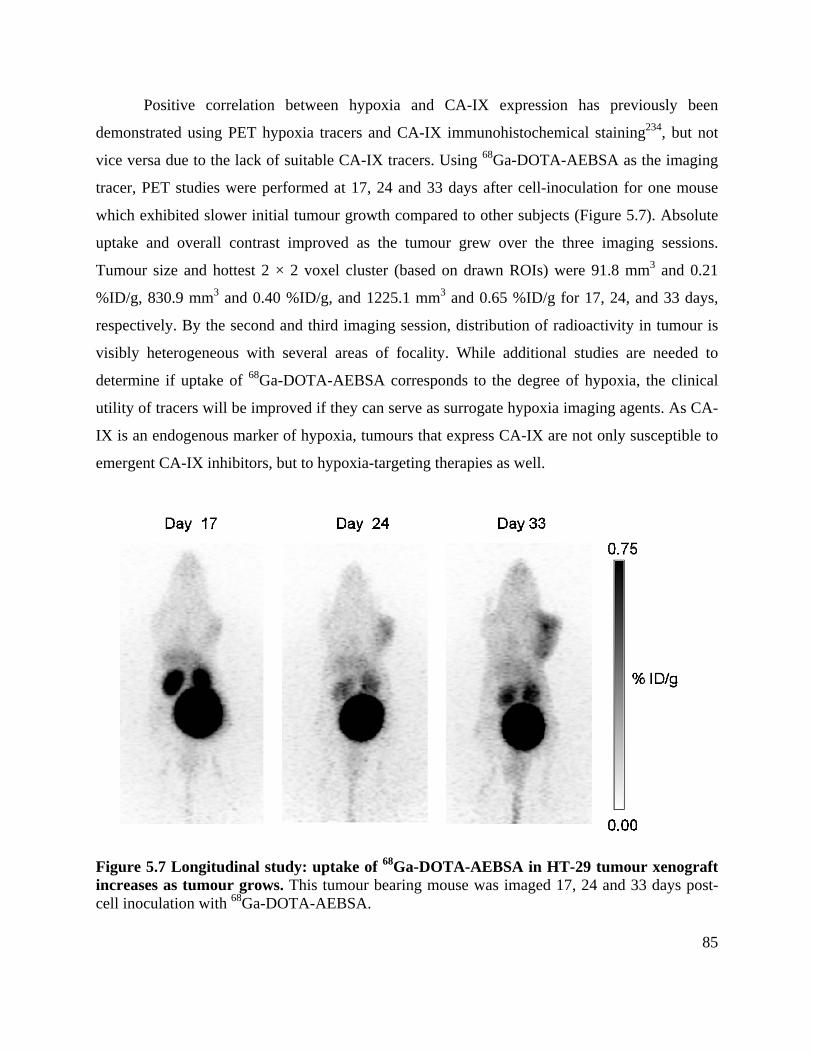
85
Positive correlation between hypoxia and CA-IX expression has previously been
demonstrated using PET hypoxia tracers and CA-IX immunohistochemical staining234, but not
vice versa due to the lack of suitable CA-IX tracers. Using 68Ga-DOTA-AEBSA as the imaging
tracer, PET studies were performed at 17, 24 and 33 days after cell-inoculation for one mouse
which exhibited slower initial tumour growth compared to other subjects (Figure 5.7). Absolute
uptake and overall contrast improved as the tumour grew over the three imaging sessions.
Tumour size and hottest 2 × 2 voxel cluster (based on drawn ROIs) were 91.8 mm3 and 0.21
%ID/g, 830.9 mm3 and 0.40 %ID/g, and 1225.1 mm3 and 0.65 %ID/g for 17, 24, and 33 days,
respectively. By the second and third imaging session, distribution of radioactivity in tumour is
visibly heterogeneous with several areas of focality. While additional studies are needed to
determine if uptake of 68Ga-DOTA-AEBSA corresponds to the degree of hypoxia, the clinical
utility of tracers will be improved if they can serve as surrogate hypoxia imaging agents. As CA-
IX is an endogenous marker of hypoxia, tumours that express CA-IX are not only susceptible to
emergent CA-IX inhibitors, but to hypoxia-targeting therapies as well.
Figure 5.7 Longitudinal study: uptake of 68Ga-DOTA-AEBSA in HT-29 tumour xenograft increases as tumour grows. This tumour bearing mouse was imaged 17, 24 and 33 days post-cell inoculation with 68Ga-DOTA-AEBSA.
86
Historically the clinical detection of CA-IX has mainly been facilitated by the mAb
cG250. cG250 binds to the proteoglycan-like domain of CA-IX and have been explored for
imaging127-129 and therapy172, 173. 124I-cG250 advanced to phase III clinical trials for the diagnosis
of CCRCC with PET,127 but whether this antibody will be available for clinical use remains
unclear. The high molecular weight of mAbs combined with slow uptake kinetics and high cost
of 124I, could limit their usefulness or clinical acceptance. On the other hand, there is significant
interest in developing small molecule inhibitors for imaging CA-IX in vivo.
The development of CA-IX inhibitors as PET imaging agents have been met with limited
success. Those that have been evaluated in the pre-clinical setting have shown low tumour
uptake, lack of isoform selectivity, and/or instability in vivo.196, 235-237 Recently, we reported the
synthesis and biological evaluations of four 18F-labeled sulfonamide derivatives for CA-IX
imaging.220 For each tracer, HT-29 tumour xenografts were readily visualized with good contrast
(tumour-to-muscle ratios of 3.18-9.55). In vivo selectivity for CA-IX was achieved through the
use of a multivalent design; however, absolute uptake in tumour remained low (0.30-0.64 %ID/g
at 1 h p.i.). Furthermore, high sequestration of activity in liver and GI tract precludes their use
for imaging lesions in these organs. By comparison, all three tracers presented in this chapter had
higher absolute uptake with comparable contrasts. 68Ga-DOTA-AEBSA and to a lesser extent 68Ga-DOTA-(AEBSA)2 showed favourable pharmacokinetic profiles that will enable detection
of lesions within the abdominal thorax. Given the prognostic and therapeutic significance of CA-
IX, we believe that polyaminocarboxylate chelator-conjugated sulfonamides warrant further
investigation as promising imaging agents. Further optimization could be possible by tailoring
charge properties or hydrophilicity of the multimeric compounds to decrease liver accumulation
and hepatobiliary clearance.
5.4 Conclusion
We have demonstrated that 68Ga-labeled benzenesulfonamide inhibitors can be used for
non-invasive imaging of CA-IX. Easily produced, with favourable pharmacokinetics and rapid
tumour targeting, these tracers represent attractive alternatives to conventional mAb-based
imaging systems. Clinically, these nanomolar affinity compounds could enable physicians to
determine if patients’ tumours express sufficiently high levels of CA-IX to evaluate their

87
suitability for treatments. As CA-IX is considered an endogenous marker for hypoxia in certain
cancer subtypes, these compounds might be useful for hypoxia imaging. Further validation is
warranted to assess the suitability of these compounds for this application.
88
Chapter 6: Antibodies and Antibody Mimetics for Imaging – Pilot Studies
6.1 Introduction
The advent of hybridoma technology in conjunction with advancements in serological
techniques has made mAbs one of the more powerful pharmacological tools for basic research
and medicine123, 238. The tumouricidal effects of mAbs are derived from several mechanisms105.
mAbs can cause direct cell death by abrogating cell signaling and inducing apoptosis105, or by
delivering cytotoxic drugs or radiation as antibody conjugates239, 240. Additionally, mAbs can
elicit indirect immune-mediated cell killing through antibody-dependent cell-mediated
cytotoxicity (ADCC), complement dependent cytotoxicity (CDC), or antibody-dependent cell
phagocytosis (ADCP)241-243.
Since its discovery in 1986, the mAb cG250 has been investigated extensively for CA-IX
targeted therapy244, 245. cG250 was evaluated as adjuvant therapy for CCRCC patients in a phase
III clinical study; however, it failed to meet primary endpoint as no improvement in median
disease-free survival was observed compared to placebo172, 246. While cG250 has been shown to
facilitate ADCC247, it does not inhibit CA-IX enzymatic activity as it binds to the PG-like
domain. It has been hypothesized that mAbs that can inhibit CA-IX activity and induce immune-
mediated cell killing would be more efficacious than cG250220. As such, different research
groups have focused on developing mAbs that target the catalytic site of CA-IX248-251. In
collaboration with Drs. Shoukat Dedhar (BCCA), Anne Lenferink (NRC) and Maureen
O’Connor (NRC) who are interested in developing therapeutic agents targeting CA-IX, we
evaluated 3 high‐affinity mAbs raised against the extracellular domain of CA-IX (Table 6.1).
Two of these mAbs bind the PG-like domain of CA-IX, while the epitope for the remaining
mAb was determined to be the catalytic domain. We conjugated these antibodies with DTPA
as a chelator, followed by radiolabeling with 111In, using non‐selective polyclonal IgG as a
negative control. SPECT imaging studies were performed to evaluate mAb uptake in vivo and to
guide therapeutic development of ADCs.
________________________________ The work presented in this chapter is not published. The mAbs used for radiolabeling and imaging experiments were obtained from our collaborators Drs. Shoukat Dedhar (BCCA), Anne Lenferink (NRC), and Maureen O’Connor (NRC).
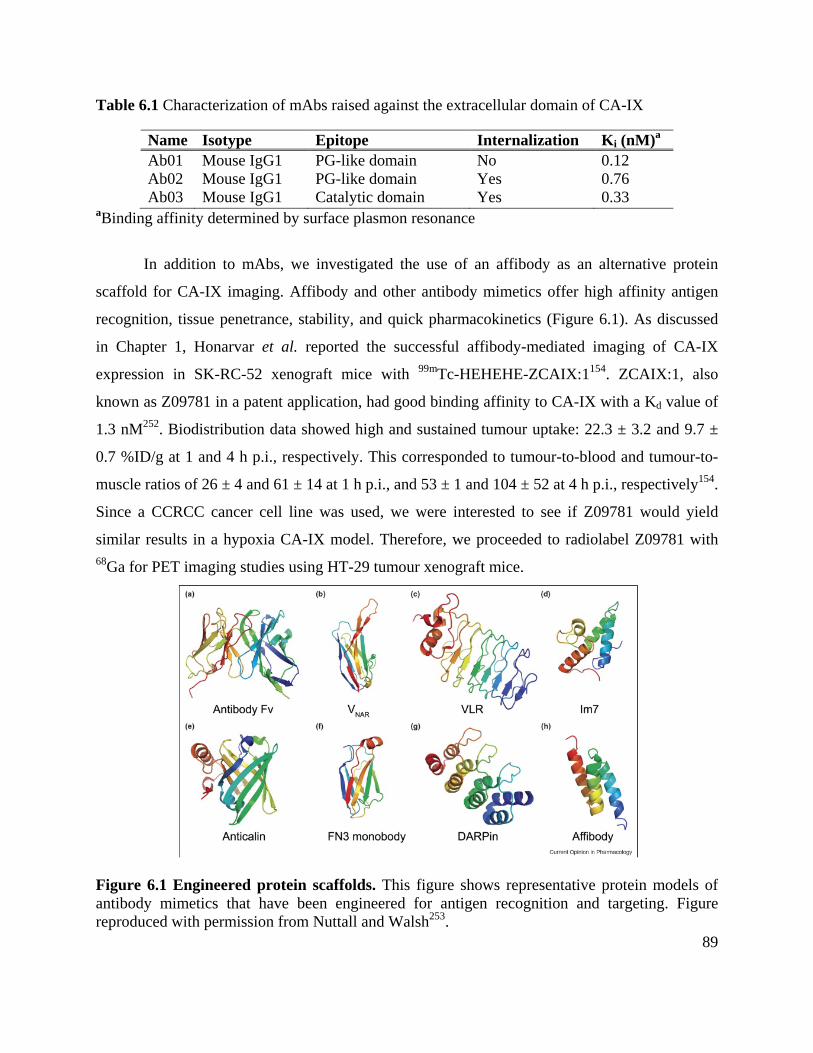
89
Table 6.1 Characterization of mAbs raised against the extracellular domain of CA-IX
Name Isotype Epitope Internalization Ki (nM)a Ab01 Mouse IgG1 PG-like domain No 0.12 Ab02 Mouse IgG1 PG-like domain Yes 0.76 Ab03 Mouse IgG1 Catalytic domain Yes 0.33
aBinding affinity determined by surface plasmon resonance
In addition to mAbs, we investigated the use of an affibody as an alternative protein
scaffold for CA-IX imaging. Affibody and other antibody mimetics offer high affinity antigen
recognition, tissue penetrance, stability, and quick pharmacokinetics (Figure 6.1). As discussed
in Chapter 1, Honarvar et al. reported the successful affibody-mediated imaging of CA-IX
expression in SK-RC-52 xenograft mice with 99mTc-HEHEHE-ZCAIX:1154. ZCAIX:1, also
known as Z09781 in a patent application, had good binding affinity to CA-IX with a Kd value of
1.3 nM252. Biodistribution data showed high and sustained tumour uptake: 22.3 ± 3.2 and 9.7 ±
0.7 %ID/g at 1 and 4 h p.i., respectively. This corresponded to tumour-to-blood and tumour-to-
muscle ratios of 26 ± 4 and 61 ± 14 at 1 h p.i., and 53 ± 1 and 104 ± 52 at 4 h p.i., respectively154.
Since a CCRCC cancer cell line was used, we were interested to see if Z09781 would yield
similar results in a hypoxia CA-IX model. Therefore, we proceeded to radiolabel Z09781 with 68Ga for PET imaging studies using HT-29 tumour xenograft mice.
Figure 6.1 Engineered protein scaffolds. This figure shows representative protein models of antibody mimetics that have been engineered for antigen recognition and targeting. Figure reproduced with permission from Nuttall and Walsh253.
90
6.2 Materials and Methods
All chemicals and solvents unless otherwise specified were obtained from commercial sources,
and used without further purification. The three CA-IX mAbs were obtained from the National
Research Council (NRC). Mouse polyclonal IgG1 control was purchased commercially from
Sigma. Purification and quality control of precursors and radiotracers were performed on an
Agilent (Santa Clara, CA) HPLC system equipped with a model 1200 quaternary pump, a model
1200 UV absorbance detector, and a Bioscan (Washington, DC) NaI scintillation detector. The
HPLC columns used were a size exclusion column (Phenomenex SEC-3000, 5 µ, 300 × 7.8 mm),
a semipreparative column (Phenomenex C18, 5 µ, 250 × 10 mm), and an analytical column
(Phenomenex Luna C18, 5 µ, 250 × 4.6 mm). [68Ga]GaCl3 was eluted from either a 30-mCi 68Ge/68Ga generator from Eckert & Ziegler (Berlin, Germany) or a 50-mCi generator from
iThemba LABS (Faure, South Africa). Radioactivity of tracers were measured using a Capintec
(Ramsey, NJ) CRC®-25R/W dose calibrator. The radioactivity of mouse tissues collected from
biodistribution studies were counted using a Perkin Elmer (Waltham, MA) Wizard2 2480
automatic gamma counter.
6.2.1 Conjugation of p-SCN-Bn-DTPA to mAbs
mAbs with excipients were first washed with PBS and recovered by centrifugal purification. For
each mAb, 1 mg was conjugated with p-SCN-Bn-DTPA (Macrocyclics) in 500 µL of PBS
(buffered to pH 8.9 with 0.1 M Na2CO3). A 5:1 molar ratio of chelator to mAb was used and the
reactions were allowed to proceed overnight at room temperature with gentle agitation. After
incubation, the reactant mixtures were purified using using 50 kDa amicon filters (Millipore) to
remove any unconjugated chelator. p-SCN-Bn-DTPA-mAb conjugates were washed thrice
with PBS before being resuspended in 0.15 M ammonium acetate (pH 5.5) and stored as 0.1
mg aliquots at ‐20 °C.
6.2.2 111In Radiolabeling for p-SCN-Bn-DTPA-mAbs
111In was purchased from Nordion (Vancouver, Canada) as [111In]InCl3 solution. 0.9% NaCl
solution was added to create a ~185 MBq/100 µL stock solution. In a reaction vial, 500 µL of
91
0.1 M HEPES solution (pH 5.5) was added to 100 µL of [111In]InCl3. For each mAb, 0.4
mg of p-SCN-Bn-DTPA-mAb conjugates were added to the 111In/HEPES solution and incubated
for 1 h at room temperature. The crude reactions were purified using 50 kDa amicon filters
(Millipore) and radiochemical purity was determined by SEC HPLC analysis per published
procedures254.
6.2.3 Synthesis of Cys-Z09781
The synthesis of Cys-Z09781 was performed using the standard Fmoc solid-phase approach on
an AAPPTec Endeavor 90 peptide synthesizer (Louisville, KT). Starting with Fmoc-Lys(Boc)-
Rink-Amide-MBHA resin, the Nα-Fmoc protecting group was removed by 20% piperidine in
DMF. Subsequently, each Fmoc-protected aa was coupled to the sequence with standard in situ
activating reagent HBTU (3 eq), HOBT (3 eq), DIEA (6 eq), in DMF. The process was repeated
until the sequence was completed (CAEAKYAKENLFAGWEIDDLPNLTEDQRNAFIYKLW
DDPSQSSELLSEAKKLNDSQAPK). At the end of elongation, the peptides were cleaved from
resin and all protecting groups were concomitantly removed by treatment TFA/TIS/DI
water/EDT/Thioanisole/Phenol at 81.5/1.0/5.0/2.5/5.0/5.0 ratio for 4 h at room temperature. The
solution was filtered and the peptide was precipitated with 10 times volume of diethyl ether. The
precipitate was collected by centrifugation, dissolved in water, and lyophilized. The dried
product was resuspended in water and purified by HPLC on a semipreparative column using 25-
35% acetonitrile gradient containing 0.1% TFA in 30 min at a flow rate of 4.5 mL/min (tR: 24.3
min). MS(ESI) Calcd. for Cys-Z09781: m/z 6741.67; Found: m/z 6746.80 ([M+5H]5+).
6.2.4 Conjugation of NOTA to Cys-Z09781
A cysteine residue was introduced at the N-terminus of the affibody to facilitate site-specific
conjugation with thiol-maleimide chemistry. In a 4-mL reaction vial, 1.9 mg of purified Cys-
Z09781 was dissolved in 950 µL of 0.2 M ammonium acetate (pH 6.5) and incubated with 10 µL
of 0.5 M TCEP and 0.46 mg of maleimido-mono-amide-NOTA (Macrocyclics). The reaction
was allowed to proceed at 40 °C for 2 h with gentle agitation under inert conditions (vial filled
with N2 gas). The reaction was purified by HPLC on a semipreparative column using 20-40%
92
acetonitrile gradient containing 0.1% TFA in 30 min at a flow rate of 4.5 mL/min (tR: 22.1 min).
MS(ESI) Calcd. for Cys[NOTA]-Z09781: m/z 7167.15; Found: m/z 7173.59 ([M+5H]5+).
6.2.5 68Ga Radiolabeling for Cys[NOTA]-Z09781
68GaCl3 was purified following published procedures231. Purified 68GaCl3 (806 – 899 MBq in 0.5
mL) was added to 100 µg of Cys[NOTA]-Z09781 in 0.7 mL of 2 M HEPES buffer (pH 5.0) with
5% glycerol. Reaction was heated using a Danby DMW7700WDB microwave (Finday, OH) at
power setting 2 for 1 min. For purification, the reaction was loaded onto a PD10 column, and
eluted with 0.9% saline in fractions. The fractions containing the radiolabeled product were
pooled and a small aliquot was subsequently taken for QC HLPC. Radiochemical yield, purity
and specific activity, was determined by HPLC on an analytical column eluted with 31%
acetonitrile at a flow rate of 2 mL/min (tR: 10.8 min).
6.2.6 In Vivo Evaluations
All animal studies were performed in accordance with the Canadian Council on Animal Care
guidelines and approved by the Animal Care Committee of the University of British Columbia.
Male immunodeficient NOD.Cg-PrkdcscidIl2rgtm1Wjl/SzJ (NSG) mice bred in-house at the Animal
Research Centre, BC Cancer Research Centre were used for this study. Under anesthesia with
2.5% isoflurane in 2.0 L/min of oxygen, mice were subcutaneously inoculated with 5 × 10⁶ HT-
29 cells (in 100 µL PBS and BD Matrigel Matrix at 1:1 ratio) under the right dorsal flank.
Biodistribution studies and imaging were performed when tumours reached 7-9 mm in diameter.
6.2.6.1 Biodistribution Studies
Tumour bearing mice were injected intravenously with ~0.37 MBq of 68Ga-Cys[NOTA]-Z09781
or ~3.7 MBq of 111In-labeled mAb. After an uptake period of either 2, 72, or 168 h, mice were
euthanized by CO2 asphyxiation. Blood was promptly withdrawn, and organs/tissues of interest
were harvested, rinsed with saline, blotted dry and weighted. Radioactivity in collected tissues
was counted, normalized to the injected dose and expressed as the percentage of the injected
dose per gram of tissue (%ID/g).
93
6.2.6.2 SPECT/CT Imaging
Tumour bearing mice were injected intravenously with ~37 MBq of 111In-labeled mAb. After
injection, mice were allowed to recover and roam freely in their cages. At selected time points,
mice were sedated with 2% isoflurane inhalation and placed in a MILabs (Utrecht,
Netherlands) U-SPECT II/CT scanner for image acquisition. Body temperature was maintained
by a heating pad during acquisition. A 5 min baseline CT scan was obtained for localization with
voltage setting at 60 kV and current at 615 μA. A single static emission scan was acquired for 1
h using an ultra-high-resolution multi-pinhole rat-mouse (1 mm pinhole size) collimator. Data
were acquired in list mode acquisition, reconstructed using the U-SPECT II software, and co-
registered for alignment. The SPECT images were reconstructed using maximum-likelihood
expectation maximization (3 iterations), pixel-based ordered subset expectation maximization
(16 subsets) and a post-processing filter (Gaussian blurring) of 0.5mm centered at photopeaks
171 keV and 245 keV with a 20% window width. Imaging files were visualized with either
PMOD or Inveon Research Workplace software. At the conclusion of the final imaging time
point, mice were euthanized and processed for biodistribution as described above.
6.2.6.3 PET/CT Imaging
PET imaging studies of 68Ga-Cys[NOTA]-Z09781 were conducted using a Siemens Inveon
microPET/CT scanner. Under 2.5% isoflurane anesthesia in oxygen at 2.0 L/min, 3.7-7.4 MBq
of 68Ga-Cys[NOTA]-Z09781 in a volume of 200 µL was administered intravenously through the
caudal vein. Under 2.5% isoflurane anesthesia in oxygen at 2.0 L/min, 3.7-7.4 MBq of 68Ga-
Cys[NOTA]-Z09781 in a volume of 200 µL was administered intravenously through the caudal
vein. At 2 h p.i., a CT-based attenuation scan was performed with exposure settings of 60kV,
500 µA and 500 ms, using three sequential bed positions with a 33% overlap, and 220 degree
continuous rotation prior to the 10 min PET acquisition. The body temperature of mice was
maintained at 37 °C with the use of thermal pads. The PET list mode data were converted into a
sinogram file with default 3D histogram settings prior to reconstruction using 2 iterations of 3D -
Ordered Subset-Expectation Maximization (3D OSEM) and 18 iterations of Maximum A Priori
(MAP). At the conclusion of the final imaging time point, mice were euthanized and processed
for biodistribution as described above.
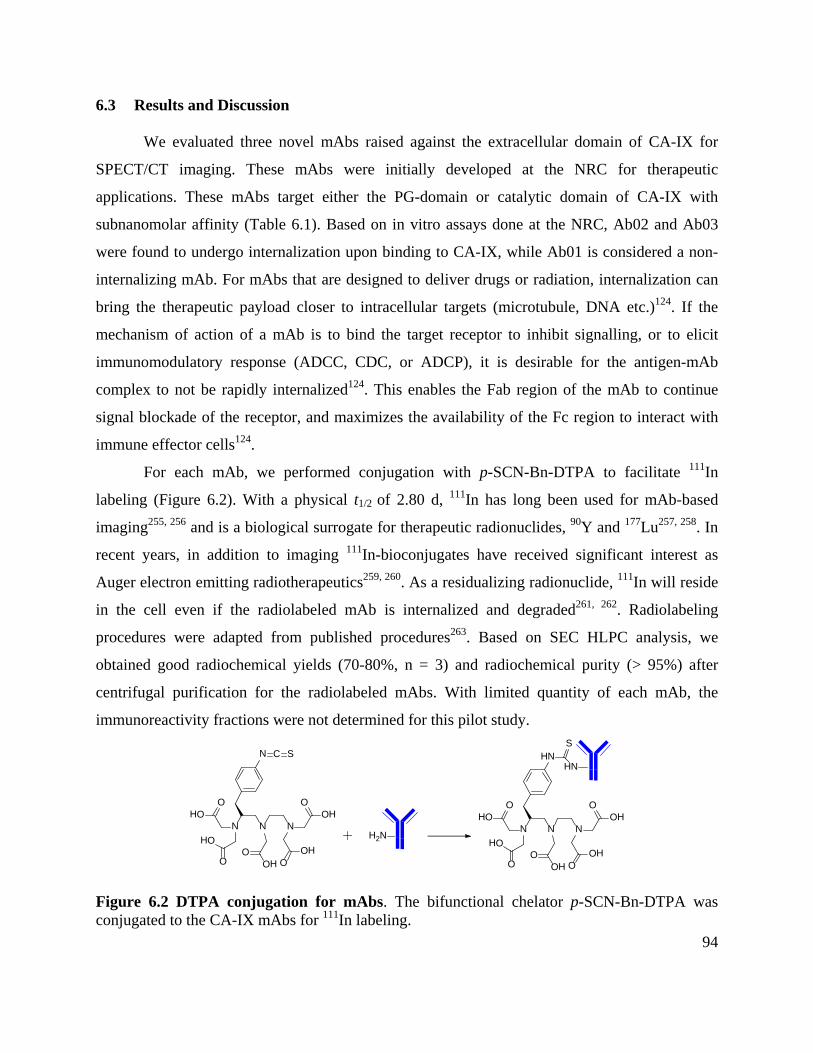
94
6.3 Results and Discussion
We evaluated three novel mAbs raised against the extracellular domain of CA-IX for
SPECT/CT imaging. These mAbs were initially developed at the NRC for therapeutic
applications. These mAbs target either the PG-domain or catalytic domain of CA-IX with
subnanomolar affinity (Table 6.1). Based on in vitro assays done at the NRC, Ab02 and Ab03
were found to undergo internalization upon binding to CA-IX, while Ab01 is considered a non-
internalizing mAb. For mAbs that are designed to deliver drugs or radiation, internalization can
bring the therapeutic payload closer to intracellular targets (microtubule, DNA etc.)124. If the
mechanism of action of a mAb is to bind the target receptor to inhibit signalling, or to elicit
immunomodulatory response (ADCC, CDC, or ADCP), it is desirable for the antigen-mAb
complex to not be rapidly internalized124. This enables the Fab region of the mAb to continue
signal blockade of the receptor, and maximizes the availability of the Fc region to interact with
immune effector cells124.
For each mAb, we performed conjugation with p-SCN-Bn-DTPA to facilitate 111In
labeling (Figure 6.2). With a physical t1/2 of 2.80 d, 111In has long been used for mAb-based
imaging255, 256 and is a biological surrogate for therapeutic radionuclides, 90Y and 177Lu257, 258. In
recent years, in addition to imaging 111In-bioconjugates have received significant interest as
Auger electron emitting radiotherapeutics259, 260. As a residualizing radionuclide, 111In will reside
in the cell even if the radiolabeled mAb is internalized and degraded261, 262. Radiolabeling
procedures were adapted from published procedures263. Based on SEC HLPC analysis, we
obtained good radiochemical yields (70-80%, n = 3) and radiochemical purity (> 95%) after
centrifugal purification for the radiolabeled mAbs. With limited quantity of each mAb, the
immunoreactivity fractions were not determined for this pilot study.
N
N N
OHO
NOH
O
OHO
OOH
HO
O
H2N
C SHN
N N
OHO
NOH
O
OHO
OOH
HO
O
SHN
Figure 6.2 DTPA conjugation for mAbs. The bifunctional chelator p-SCN-Bn-DTPA was conjugated to the CA-IX mAbs for 111In labeling.
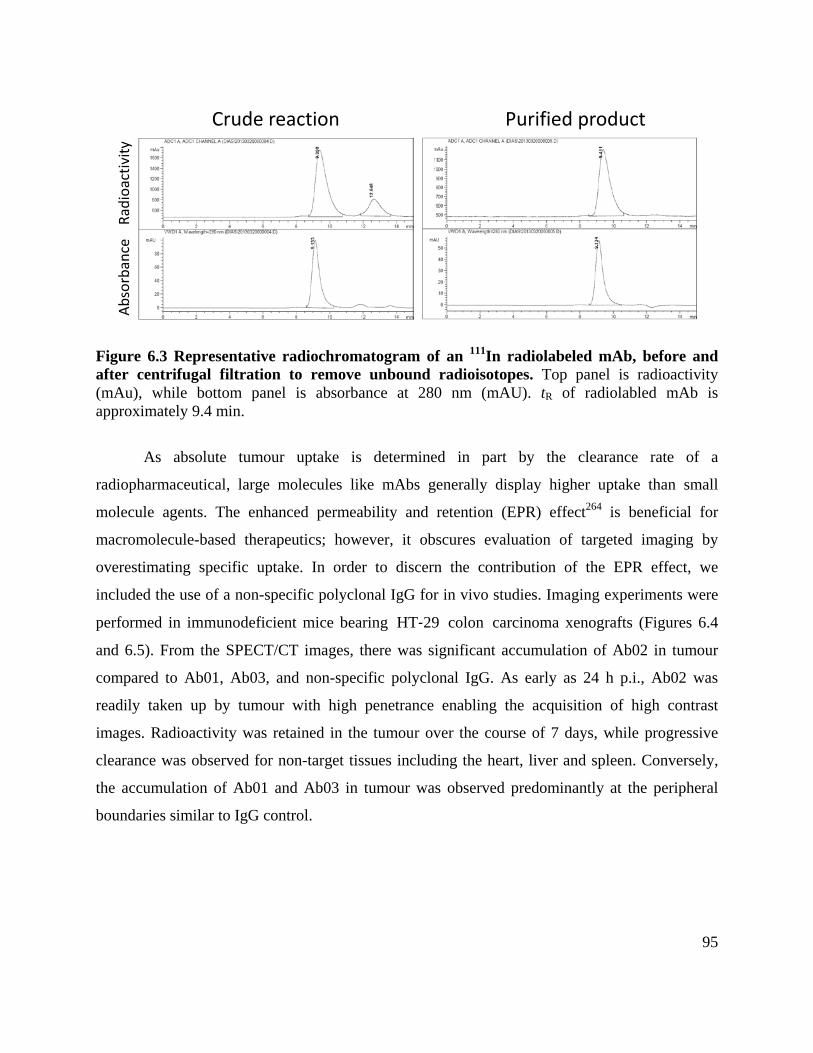
95
Figure 6.3 Representative radiochromatogram of an 111In radiolabeled mAb, before and after centrifugal filtration to remove unbound radioisotopes. Top panel is radioactivity (mAu), while bottom panel is absorbance at 280 nm (mAU). tR of radiolabled mAb is approximately 9.4 min.
As absolute tumour uptake is determined in part by the clearance rate of a
radiopharmaceutical, large molecules like mAbs generally display higher uptake than small
molecule agents. The enhanced permeability and retention (EPR) effect264 is beneficial for
macromolecule-based therapeutics; however, it obscures evaluation of targeted imaging by
overestimating specific uptake. In order to discern the contribution of the EPR effect, we
included the use of a non-specific polyclonal IgG for in vivo studies. Imaging experiments were
performed in immunodeficient mice bearing HT‐29 colon carcinoma xenografts (Figures 6.4
and 6.5). From the SPECT/CT images, there was significant accumulation of Ab02 in tumour
compared to Ab01, Ab03, and non-specific polyclonal IgG. As early as 24 h p.i., Ab02 was
readily taken up by tumour with high penetrance enabling the acquisition of high contrast
images. Radioactivity was retained in the tumour over the course of 7 days, while progressive
clearance was observed for non-target tissues including the heart, liver and spleen. Conversely,
the accumulation of Ab01 and Ab03 in tumour was observed predominantly at the peripheral
boundaries similar to IgG control.
Crude reaction Purified product Ra
dioa
ctiv
ity
Abso
rban
ce
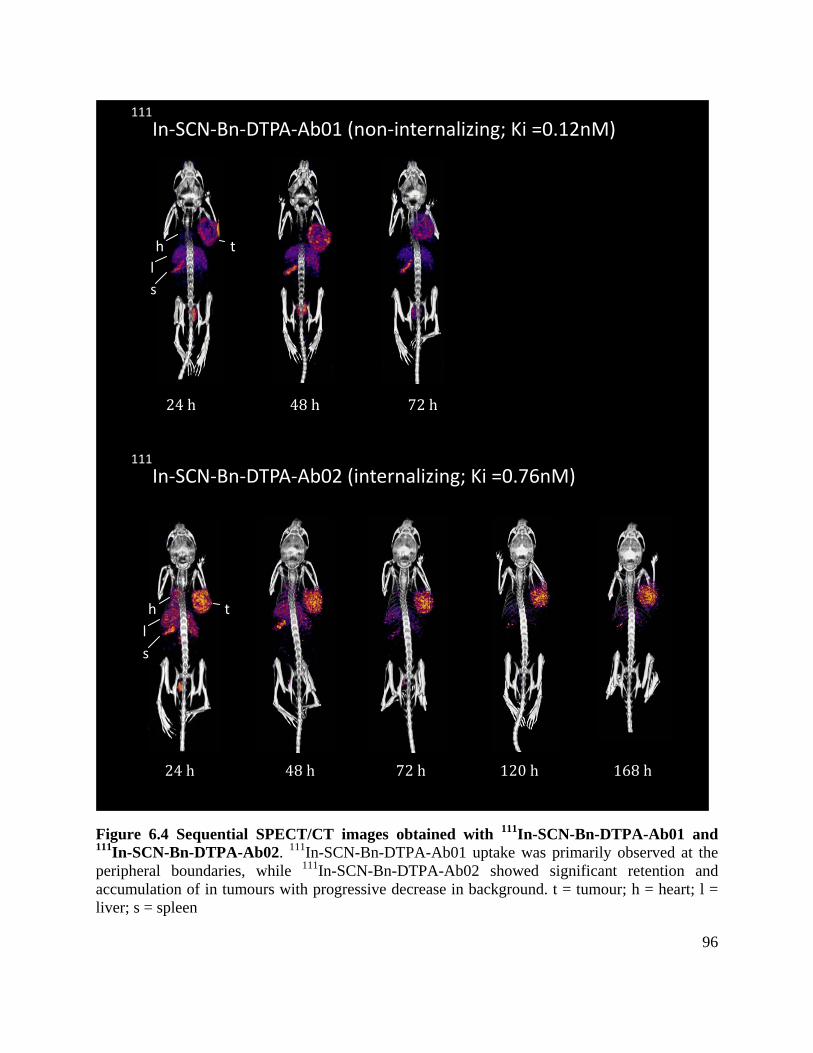
96
Figure 6.4 Sequential SPECT/CT images obtained with 111In-SCN-Bn-DTPA-Ab01 and 111In-SCN-Bn-DTPA-Ab02. 111In-SCN-Bn-DTPA-Ab01 uptake was primarily observed at the peripheral boundaries, while 111In-SCN-Bn-DTPA-Ab02 showed significant retention and accumulation of in tumours with progressive decrease in background. t = tumour; h = heart; l = liver; s = spleen
s l
t h
111In-SCN-Bn-DTPA-Ab01 (non-internalizing; Ki =0.12nM)
111
In-SCN-Bn-DTPA-Ab02 (internalizing; Ki =0.76nM)
s l
t h
24 h 48 h 72 h
24 h 48 h 72 h 120 h 168 h
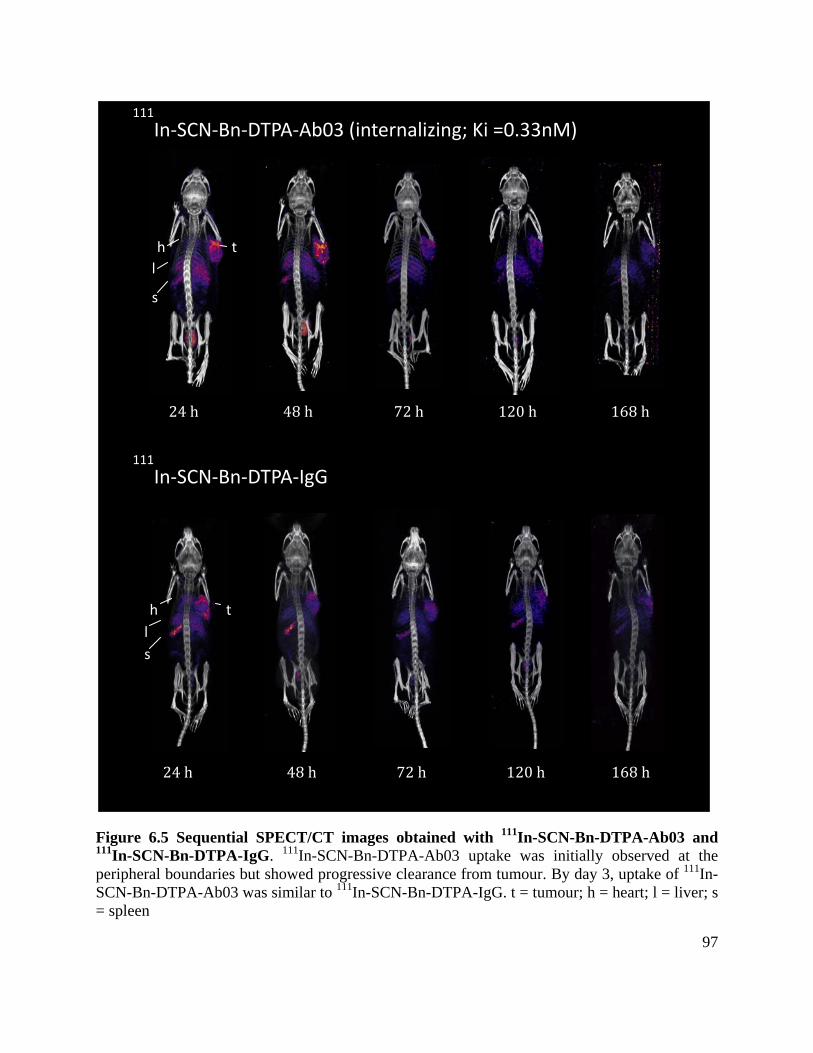
97
Figure 6.5 Sequential SPECT/CT images obtained with 111In-SCN-Bn-DTPA-Ab03 and 111In-SCN-Bn-DTPA-IgG. 111In-SCN-Bn-DTPA-Ab03 uptake was initially observed at the peripheral boundaries but showed progressive clearance from tumour. By day 3, uptake of 111In-SCN-Bn-DTPA-Ab03 was similar to 111In-SCN-Bn-DTPA-IgG. t = tumour; h = heart; l = liver; s = spleen
111In-SCN-Bn-DTPA-Ab03 (internalizing; Ki =0.33nM)
111
In-SCN-Bn-DTPA-IgG
thl
s
24 h 48 h 72 h 120 h 168 h
thls
24 h 48 h 72 h 120 h 168 h
98
Since mAbs circulate in the blood for many days, this provides opportunities for
repeated antigen-mAb interactions and progressive accumulation of tumour-specific mAbs. In
contrast, non-specific mAbs typically exhibit transient passive accumulation followed by
progressive clearance from the tumours. Biodistribution studies were performed to determine
absolute uptake in tumour and non-target tissues (Table 6.2). Of the evaluated mAbs, the highest
tumour uptake was observed for Ab02 (37.84 ± 4.69 %ID/g at 72 h p.i.). The uptake of Ab02 in
tumour was approximately two-fold higher than Ab01 (19.09 ± 4.81 %ID/g) and Ab03 (18.38 ±
3.07 %ID/g). With the exception of blood, spleen, and tumour, uptake in non-target tissues were
relatively consistent for each mAb. A potential reason for the enhanced uptake of Ab02 is its
slow rate of clearance from blood (20.62 ± 4.33 %ID/g at 72 h p.i.). At 168 h p.i., uptake in
tumour for Ab02 was 35.64 %ID/g, suggesting that there is retention at the tumour site. By
comparison, the uptake of the polyclonal IgG control was 14.01 ± 0.23 %ID/g at 168 h p.i. While
Ab02 yielded promising data, further studies are needed to fully assess its potential for targeting
CA-IX (greater sample size at multiple time points).
As cG250 is considered the metric novel mAbs targeting CA-IX are evaluated against, an
overview of the different radiolabeled cG250 immunoconjugates that have been investigated in
preclinical setting is provided in Table 6.3. In the most comprehensive study to date, Brouwers et
al. demonstrated that radionuclide and chelation selection can affect stability, biodistribution and
therapeutic efficacy of radioimmunotherapy with cG250265. Depending on the
radioisotope/chelator combination used, tumour uptake ranged from 14.0 ± 3.0 %ID/g (for 125I-
cG250) to 113.3 ± 24.7 %ID/g (for 177Lu-SCN-Bz-DTPA-cG250) at 3 d p.i. Brouwers et al.
evaluated 111In-DTPA-cG250 for targeting SK-RC-52 tumour xenografts (4.9 ± 2.9 %ID/g at 3 d
p.i.); however the studies were performed in nude rats266. The study that offers the fairest
comparison would be the one performed by Carlin et al. using 111In-DOTA-cG250 with the HT-
29 model (20.1 ± 4.8 %ID/g at 2 d p.i.)217. Ideally, for future studies we will be able to obtain
cG250 and perform a side-by-side comparison with our CA-IX mAbs while holding variables
like isotope, chelator, tumour model, host, and timepoint consistent.
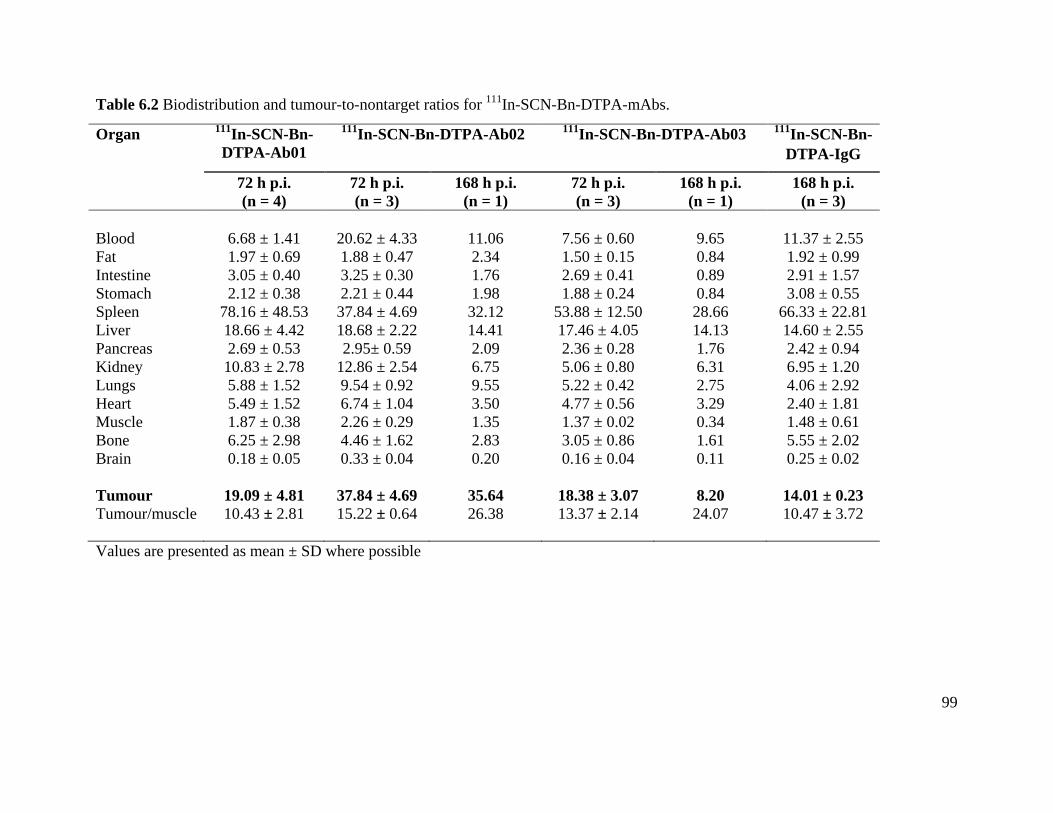
99
Table 6.2 Biodistribution and tumour-to-nontarget ratios for 111In-SCN-Bn-DTPA-mAbs.
Organ 111In-SCN-Bn-DTPA-Ab01
111In-SCN-Bn-DTPA-Ab02 111In-SCN-Bn-DTPA-Ab03 111In-SCN-Bn-DTPA-IgG
72 h p.i. (n = 4)
72 h p.i. (n = 3)
168 h p.i. (n = 1)
72 h p.i. (n = 3)
168 h p.i. (n = 1)
168 h p.i. (n = 3)
Blood 6.68 ± 1.41 20.62 ± 4.33 11.06 7.56 ± 0.60 9.65 11.37 ± 2.55 Fat 1.97 ± 0.69 1.88 ± 0.47 2.34 1.50 ± 0.15 0.84 1.92 ± 0.99 Intestine 3.05 ± 0.40 3.25 ± 0.30 1.76 2.69 ± 0.41 0.89 2.91 ± 1.57 Stomach 2.12 ± 0.38 2.21 ± 0.44 1.98 1.88 ± 0.24 0.84 3.08 ± 0.55 Spleen 78.16 ± 48.53 37.84 ± 4.69 32.12 53.88 ± 12.50 28.66 66.33 ± 22.81 Liver 18.66 ± 4.42 18.68 ± 2.22 14.41 17.46 ± 4.05 14.13 14.60 ± 2.55 Pancreas 2.69 ± 0.53 2.95± 0.59 2.09 2.36 ± 0.28 1.76 2.42 ± 0.94 Kidney 10.83 ± 2.78 12.86 ± 2.54 6.75 5.06 ± 0.80 6.31 6.95 ± 1.20 Lungs 5.88 ± 1.52 9.54 ± 0.92 9.55 5.22 ± 0.42 2.75 4.06 ± 2.92 Heart 5.49 ± 1.52 6.74 ± 1.04 3.50 4.77 ± 0.56 3.29 2.40 ± 1.81 Muscle 1.87 ± 0.38 2.26 ± 0.29 1.35 1.37 ± 0.02 0.34 1.48 ± 0.61 Bone 6.25 ± 2.98 4.46 ± 1.62 2.83 3.05 ± 0.86 1.61 5.55 ± 2.02 Brain 0.18 ± 0.05 0.33 ± 0.04 0.20 0.16 ± 0.04 0.11 0.25 ± 0.02 Tumour 19.09 ± 4.81 37.84 ± 4.69 35.64 18.38 ± 3.07 8.20 14.01 ± 0.23 Tumour/muscle 10.43 ± 2.81
15.22 ± 0.64
26.38
13.37 ± 2.14 24.07 10.47 ± 3.72
Values are presented as mean ± SD where possible
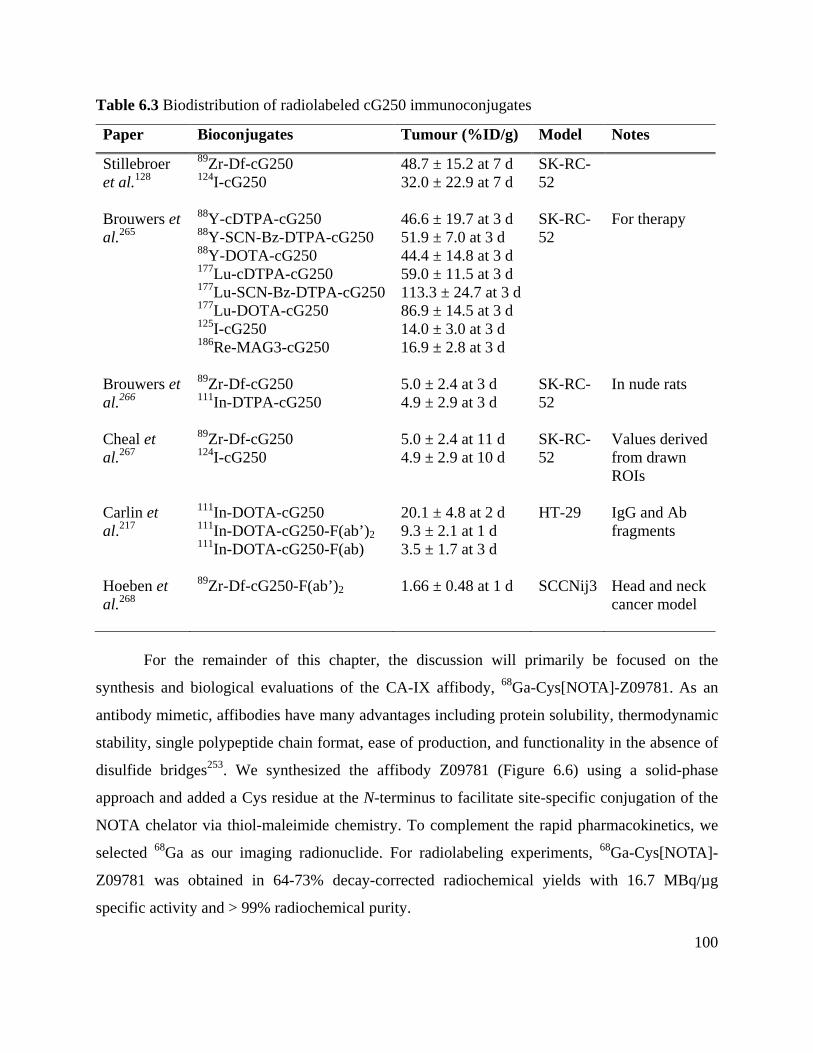
100
Table 6.3 Biodistribution of radiolabeled cG250 immunoconjugates
For the remainder of this chapter, the discussion will primarily be focused on the
synthesis and biological evaluations of the CA-IX affibody, 68Ga-Cys[NOTA]-Z09781. As an
antibody mimetic, affibodies have many advantages including protein solubility, thermodynamic
stability, single polypeptide chain format, ease of production, and functionality in the absence of
disulfide bridges253. We synthesized the affibody Z09781 (Figure 6.6) using a solid-phase
approach and added a Cys residue at the N-terminus to facilitate site-specific conjugation of the
NOTA chelator via thiol-maleimide chemistry. To complement the rapid pharmacokinetics, we
selected 68Ga as our imaging radionuclide. For radiolabeling experiments, 68Ga-Cys[NOTA]-
Z09781 was obtained in 64-73% decay-corrected radiochemical yields with 16.7 MBq/µg
specific activity and > 99% radiochemical purity.
Paper Bioconjugates Tumour (%ID/g) Model Notes
Stillebroer et al.128
89Zr-Df-cG250 124I-cG250
48.7 ± 15.2 at 7 d 32.0 ± 22.9 at 7 d
SK-RC-52
Brouwers et al.265
88Y-cDTPA-cG250 88Y-SCN-Bz-DTPA-cG250 88Y-DOTA-cG250 177Lu-cDTPA-cG250 177Lu-SCN-Bz-DTPA-cG250 177Lu-DOTA-cG250 125I-cG250 186Re-MAG3-cG250
46.6 ± 19.7 at 3 d 51.9 ± 7.0 at 3 d 44.4 ± 14.8 at 3 d 59.0 ± 11.5 at 3 d 113.3 ± 24.7 at 3 d 86.9 ± 14.5 at 3 d 14.0 ± 3.0 at 3 d 16.9 ± 2.8 at 3 d
SK-RC-52
For therapy
Brouwers et al.266
89Zr-Df-cG250 111In-DTPA-cG250
5.0 ± 2.4 at 3 d 4.9 ± 2.9 at 3 d
SK-RC-52
In nude rats
Cheal et al.267
89Zr-Df-cG250 124I-cG250
5.0 ± 2.4 at 11 d 4.9 ± 2.9 at 10 d
SK-RC-52
Values derived from drawn ROIs
Carlin et al.217
111In-DOTA-cG250 111In-DOTA-cG250-F(ab’)2 111In-DOTA-cG250-F(ab)
20.1 ± 4.8 at 2 d 9.3 ± 2.1 at 1 d 3.5 ± 1.7 at 3 d
HT-29 IgG and Ab fragments
Hoeben et al.268
89Zr-Df-cG250-F(ab’)2
1.66 ± 0.48 at 1 d SCCNij3 Head and neck cancer model
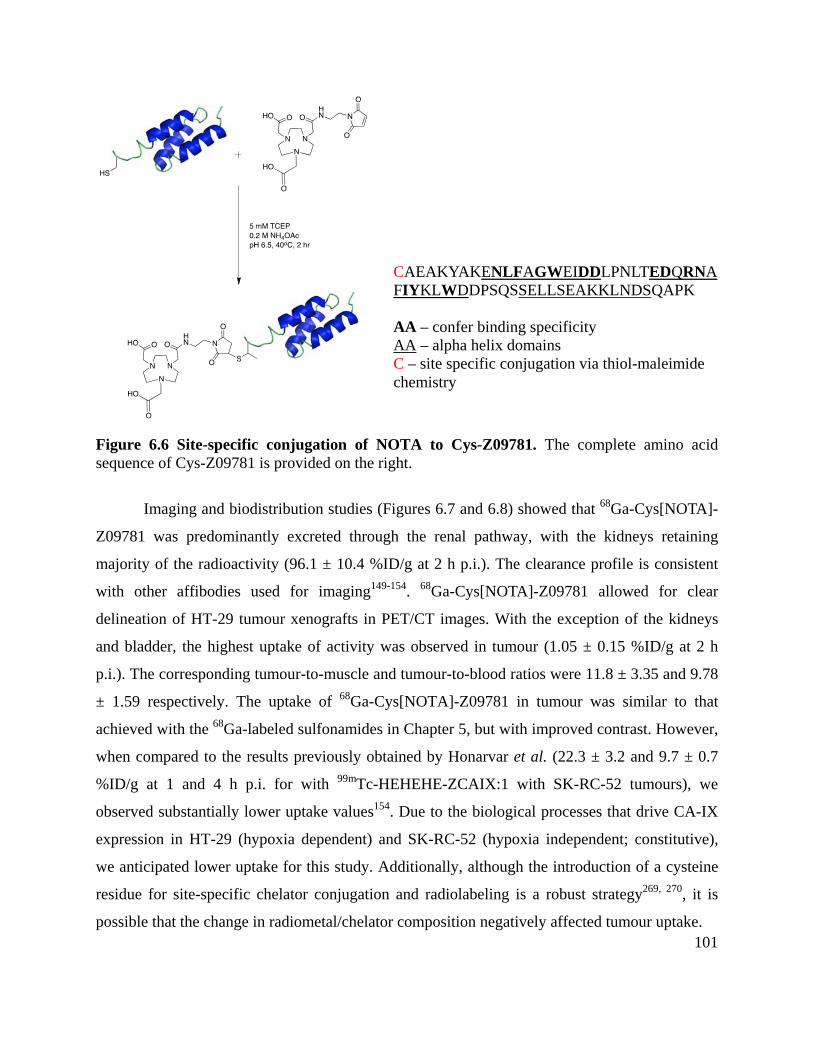
101
Figure 6.6 Site-specific conjugation of NOTA to Cys-Z09781. The complete amino acid sequence of Cys-Z09781 is provided on the right.
Imaging and biodistribution studies (Figures 6.7 and 6.8) showed that 68Ga-Cys[NOTA]-
Z09781 was predominantly excreted through the renal pathway, with the kidneys retaining
majority of the radioactivity (96.1 ± 10.4 %ID/g at 2 h p.i.). The clearance profile is consistent
with other affibodies used for imaging149-154. 68Ga-Cys[NOTA]-Z09781 allowed for clear
delineation of HT-29 tumour xenografts in PET/CT images. With the exception of the kidneys
and bladder, the highest uptake of activity was observed in tumour (1.05 ± 0.15 %ID/g at 2 h
p.i.). The corresponding tumour-to-muscle and tumour-to-blood ratios were 11.8 ± 3.35 and 9.78
± 1.59 respectively. The uptake of 68Ga-Cys[NOTA]-Z09781 in tumour was similar to that
achieved with the 68Ga-labeled sulfonamides in Chapter 5, but with improved contrast. However,
when compared to the results previously obtained by Honarvar et al. (22.3 ± 3.2 and 9.7 ± 0.7
%ID/g at 1 and 4 h p.i. for with 99mTc-HEHEHE-ZCAIX:1 with SK-RC-52 tumours), we
observed substantially lower uptake values154. Due to the biological processes that drive CA-IX
expression in HT-29 (hypoxia dependent) and SK-RC-52 (hypoxia independent; constitutive),
we anticipated lower uptake for this study. Additionally, although the introduction of a cysteine
residue for site-specific chelator conjugation and radiolabeling is a robust strategy269, 270, it is
possible that the change in radiometal/chelator composition negatively affected tumour uptake.
CAEAKYAKENLFAGWEIDDLPNLTEDQRNAFIYKLWDDPSQSSELLSEAKKLNDSQAPK AA – confer binding specificity AA – alpha helix domains C – site specific conjugation via thiol-maleimide chemistry
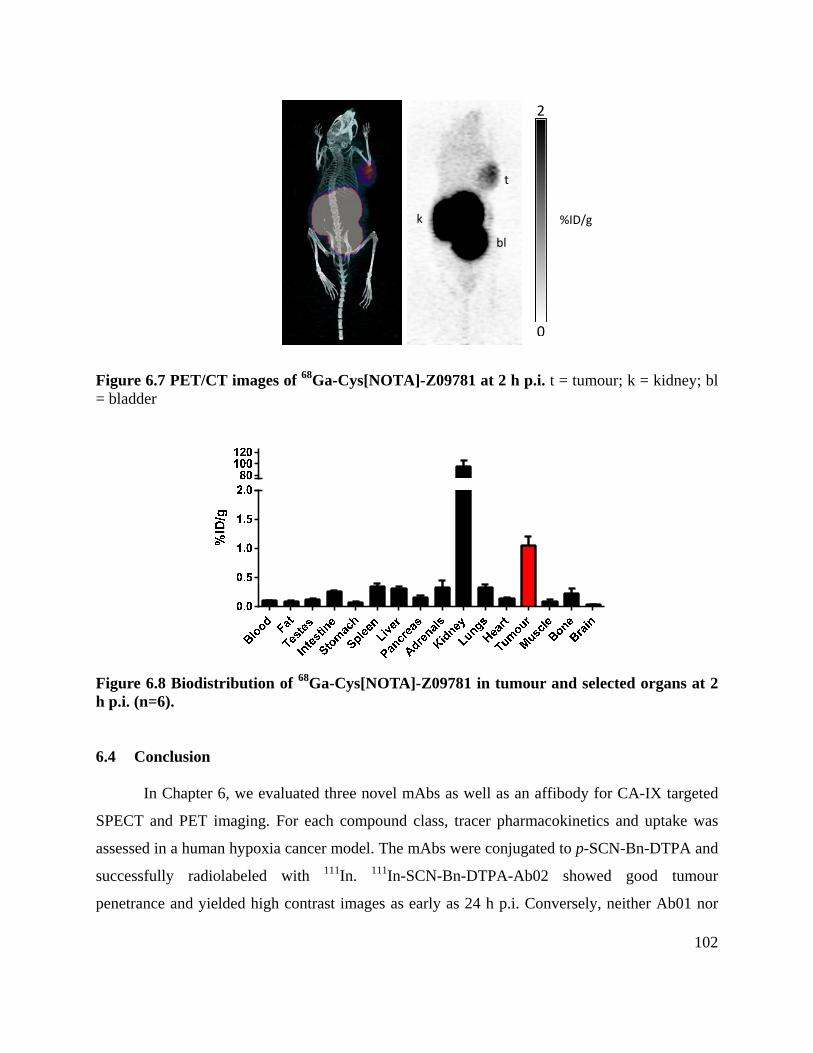
102
Figure 6.7 PET/CT images of 68Ga-Cys[NOTA]-Z09781 at 2 h p.i. t = tumour; k = kidney; bl = bladder
Figure 6.8 Biodistribution of 68Ga-Cys[NOTA]-Z09781 in tumour and selected organs at 2 h p.i. (n=6). 6.4 Conclusion
In Chapter 6, we evaluated three novel mAbs as well as an affibody for CA-IX targeted
SPECT and PET imaging. For each compound class, tracer pharmacokinetics and uptake was
assessed in a human hypoxia cancer model. The mAbs were conjugated to p-SCN-Bn-DTPA and
successfully radiolabeled with 111In. 111In-SCN-Bn-DTPA-Ab02 showed good tumour
penetrance and yielded high contrast images as early as 24 h p.i. Conversely, neither Ab01 nor
2
%ID/g
0
t
k
bl

103
Ab03 showed any significant accumulation in tumour compared to Ab02. As for affibody
imaging, 68Ga-Cys[NOTA]-Z09781 enabled clear visualization of HT-29 tumour xenografts with
good contrast. Blocking studies are needed to determine tracer specificity of 68Ga-Cys[NOTA]-
Z09781.
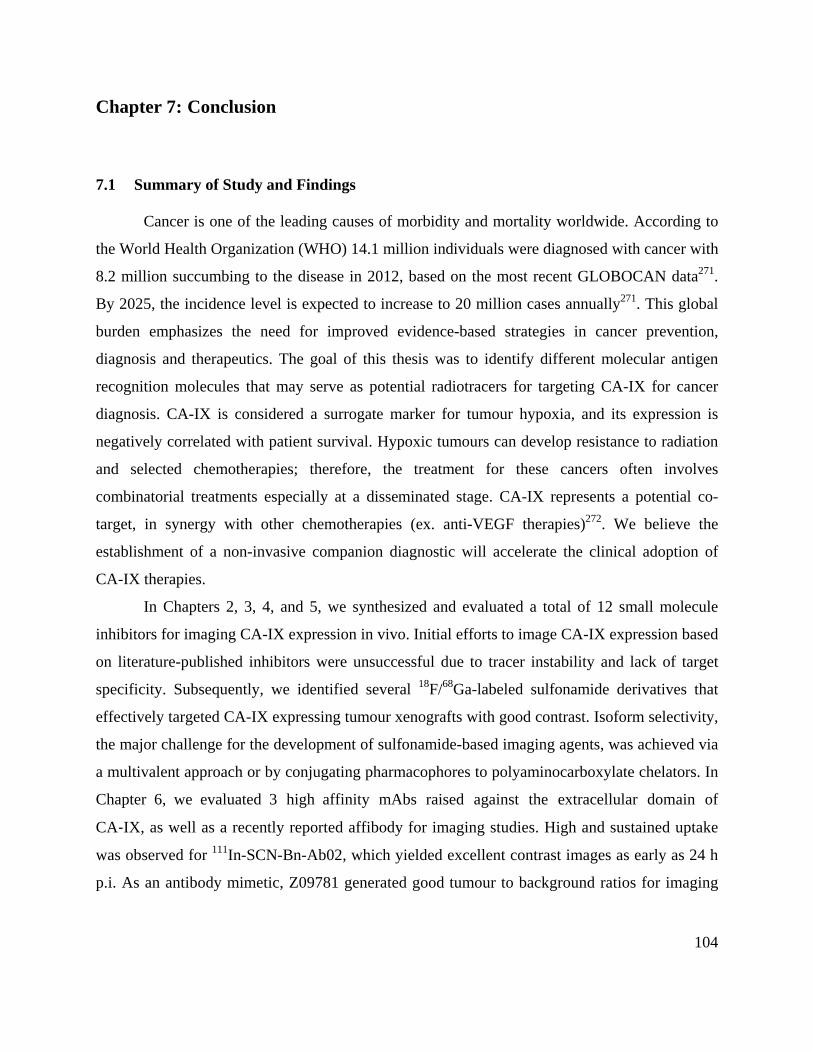
104
Chapter 7: Conclusion
7.1 Summary of Study and Findings
Cancer is one of the leading causes of morbidity and mortality worldwide. According to
the World Health Organization (WHO) 14.1 million individuals were diagnosed with cancer with
8.2 million succumbing to the disease in 2012, based on the most recent GLOBOCAN data271.
By 2025, the incidence level is expected to increase to 20 million cases annually271. This global
burden emphasizes the need for improved evidence-based strategies in cancer prevention,
diagnosis and therapeutics. The goal of this thesis was to identify different molecular antigen
recognition molecules that may serve as potential radiotracers for targeting CA-IX for cancer
diagnosis. CA-IX is considered a surrogate marker for tumour hypoxia, and its expression is
negatively correlated with patient survival. Hypoxic tumours can develop resistance to radiation
and selected chemotherapies; therefore, the treatment for these cancers often involves
combinatorial treatments especially at a disseminated stage. CA-IX represents a potential co-
target, in synergy with other chemotherapies (ex. anti-VEGF therapies)272. We believe the
establishment of a non-invasive companion diagnostic will accelerate the clinical adoption of
CA-IX therapies.
In Chapters 2, 3, 4, and 5, we synthesized and evaluated a total of 12 small molecule
inhibitors for imaging CA-IX expression in vivo. Initial efforts to image CA-IX expression based
on literature-published inhibitors were unsuccessful due to tracer instability and lack of target
specificity. Subsequently, we identified several 18F/68Ga-labeled sulfonamide derivatives that
effectively targeted CA-IX expressing tumour xenografts with good contrast. Isoform selectivity,
the major challenge for the development of sulfonamide-based imaging agents, was achieved via
a multivalent approach or by conjugating pharmacophores to polyaminocarboxylate chelators. In
Chapter 6, we evaluated 3 high affinity mAbs raised against the extracellular domain of
CA‐IX, as well as a recently reported affibody for imaging studies. High and sustained uptake
was observed for 111In-SCN-Bn-Ab02, which yielded excellent contrast images as early as 24 h
p.i. As an antibody mimetic, Z09781 generated good tumour to background ratios for imaging
105
hypoxia-induced CA-IX expression but absolute uptake was substantially lower than mAb-
based imaging.
7.2 Strengths and Limitations of this Study
There were a number of strengths and limitations associated with this study. Our study
represents a comprehensive evaluation of different antigen recognition molecules targeting CA-
IX. With small molecule inhibitors, we explored two distinct strategies (valency and
hydrophilicity) to confer CA-IX specificity. Through this process, we produced several tracers
that not only enabled tumour visualization, but represented significant advancement over
previous attempts. We pursued radiolabeling strategies that incorporated either 18F or 68Ga. Both
radionuclides have short t1/2, which are well-suited for biomolecules that display fast
pharmacokinetics. Just as important, the general availability of 18F (cyclotron) or 68Ga
(generator) suggests that these compounds can be readily adopted by other radiopharmaceutical
facilities. Another strength in our research is the ability to guide development of emerging CA-
IX therapeutics. SPECT imaging with 111In-SCN-Bn-DTPA-mAbs provided meaningful
information regarding targeting efficiency, tissue penetrance, and pharmacokinetics.
Collectively, this thesis has strong translational components that can drive the growth of CA-IX
diagnostics and therapeutics, which is important for personalizing medicine. As potential
surrogates for hypoxia imaging, CA-IX tracers hold advantages for tumour-to-nontarget ratios
and pharmacokinetics compared to established hypoxia PET agents (ex. FMISO, etc).
We used the HT-29 human colorectal cancer cell line for the evaluation of our
radiotracers. Although this enabled us to compare our findings with previously published reports,
further validation with additional cancer cell lines or patient derived xenograft (PDX) models are
needed to confirm tracer utility. PDX models can better recapitulate the phenotype of cancer
patients in terms of genomics, metastatic potential, and drug responsiveness; however, long
tumour graft latency and variable engraftment rates may be limiting factors273, 274. In Chapter 5,
we performed a longitudinal imaging study with 68Ga-DOTA-AEBSA for one mouse and
observed increase in focal uptake over three imaging sessions. We hypothesized that the non-
homogeneous distribution of activity corresponded with CA-IX expression within hypoxic
niches, but validation studies are required. Finally in Chapter 6, we evaluated three mAbs raised
106
against the extracellular domain of CA-IX as potential imaging agents. While promising results
were obtained, the hybridoma cells producing the mAbs were low yielding and we did not have
enough samples to complete analytical/imaging studies.
7.3 Overall Significance and Implications of Research Finding
Due to its role in mediating cell survival and distant metastasis under hypoxic conditions,
CA-IX has emerged as a promising therapeutic and imaging biomarker. Although cG250 failed
to meet primary endpoint in the phase III ARISER study, retrospective subset analysis revealed
that patients with high CA-IX scores (> 2.0) experienced statistically significant improvement in
disease-free survival after receiving treatment172, 246. CA-IX scoring for each patient was derived
by multiplying staining intensity (1-3) by the fraction of positive cells (0-1). This finding
highlights the potential effectiveness of anti-CA-IX therapies in the clinic, given proper patient
stratification. Our research serves as a quantitative and non-invasive imaging platform for
physicians to determine if patients’ tumours express sufficiently high levels of CA-IX to make
them candidates for treatments targeting this protein. Additionally, radiotracers may be useful for
optimizing therapeutic dosage, and for assessing patients’ response to treatments. Given the
broad expression profile of CA-IX in solid cancers we anticipate that our findings will have a
positive impact on cancer management leading to improved patient outcomes and quality of life.
7.4 Future Research Directions
7.4.1 Design of Cationic Sulfonamides
Leveraging the cell-surface expression of CA-IX, the design of CA-IX imaging agents
has revolved around membrane impermeability. In this thesis, we pursued two approaches for
developing cell-impermeable small molecule inhibitors. In Chapter 4, we used click chemistry to
synthesize two trivalent sulfonamide inhibitors. The accumulation of MW served to limit passive
perfusion into the cell. In Chapter 5, we conjugated a sulfonamide derivative to different
polyaminocarboxylate chelators to enhance tracer hydrophilicity. With both strategies, we were
able to observe uptake in HT-29 tumour xenografts with good visualization in PET images. A
third strategy that we are interested in exploring is the introduction of a cationic motif onto
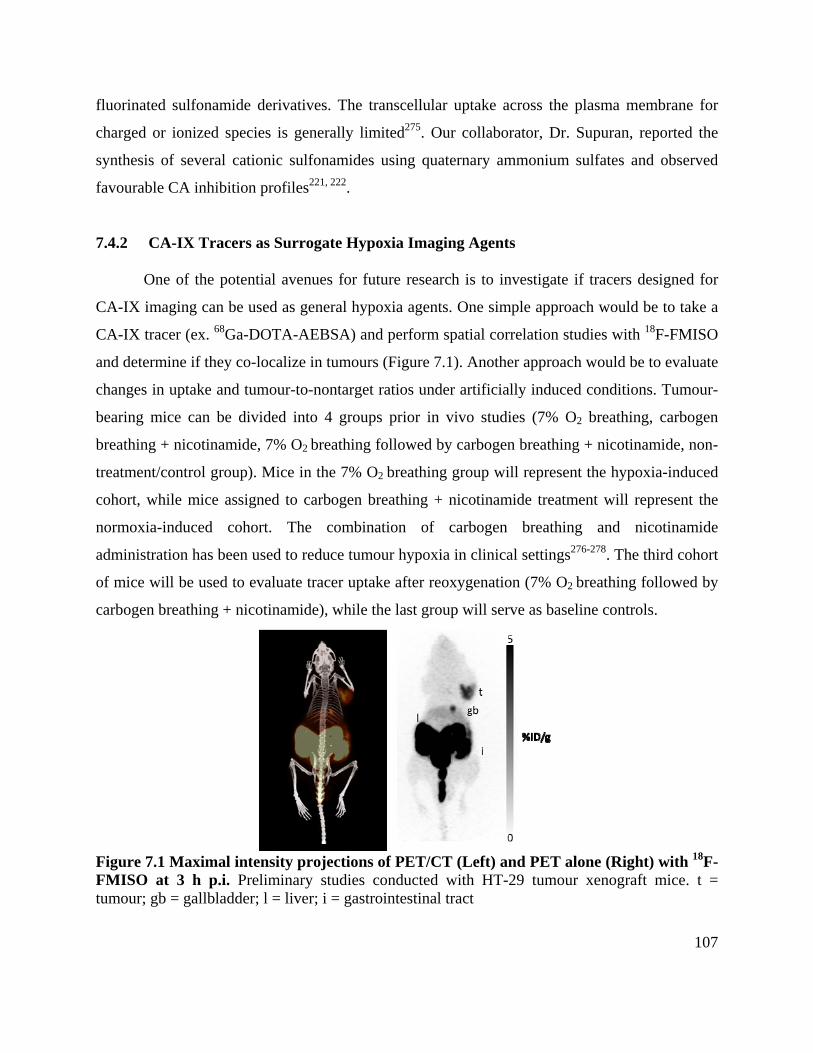
107
fluorinated sulfonamide derivatives. The transcellular uptake across the plasma membrane for
charged or ionized species is generally limited275. Our collaborator, Dr. Supuran, reported the
synthesis of several cationic sulfonamides using quaternary ammonium sulfates and observed
favourable CA inhibition profiles221, 222.
7.4.2 CA-IX Tracers as Surrogate Hypoxia Imaging Agents
One of the potential avenues for future research is to investigate if tracers designed for
CA-IX imaging can be used as general hypoxia agents. One simple approach would be to take a
CA-IX tracer (ex. 68Ga-DOTA-AEBSA) and perform spatial correlation studies with 18F-FMISO
and determine if they co-localize in tumours (Figure 7.1). Another approach would be to evaluate
changes in uptake and tumour-to-nontarget ratios under artificially induced conditions. Tumour-
bearing mice can be divided into 4 groups prior in vivo studies (7% O2 breathing, carbogen
breathing + nicotinamide, 7% O2 breathing followed by carbogen breathing + nicotinamide, non-
treatment/control group). Mice in the 7% O2 breathing group will represent the hypoxia-induced
cohort, while mice assigned to carbogen breathing + nicotinamide treatment will represent the
normoxia-induced cohort. The combination of carbogen breathing and nicotinamide
administration has been used to reduce tumour hypoxia in clinical settings276-278. The third cohort
of mice will be used to evaluate tracer uptake after reoxygenation (7% O2 breathing followed by
carbogen breathing + nicotinamide), while the last group will serve as baseline controls.
Figure 7.1 Maximal intensity projections of PET/CT (Left) and PET alone (Right) with 18F-FMISO at 3 h p.i. Preliminary studies conducted with HT-29 tumour xenograft mice. t = tumour; gb = gallbladder; l = liver; i = gastrointestinal tract
108
7.4.3 Radiotherapy
Promising CA-IX tracers should be tested for their usefulness as radiotherapeutic agents.
This can be done by replacing imaging radionuclides with therapeutic radionuclides. Alpha (α),
beta (β-), Auger electron emitters, and conversion electron emitters are classes of radionuclides
that exert tumouricidal effects through radiation-induced DNA damage279-286. α-Particle emitters
have the highest linear energy transfer (LET) and can cause more irreparable double-stranded
DNA breaks280. They have a short tissue range (µm), which is advantageous for treating micro-
metastasis where there are concerns of depositing energy beyond anatomical boundaries280. α-
Particles are not dependent on tumour oxygenation279, which is ideal considering CA-IX’s
expression in hypoxic niches. Although a higher concentration of β- emitters is needed for
comparable cell kill compared to α emitters, β- emitters have a longer tissue range (mm)281. The
long range of β- emitters results in a “crossfire” effect where multiple cells can be targeted when
only one binding event occurs281. Implicitly the crossfire effect decreases the need to target every
cell, which is a challenge given the intrinsic heterogeneity of cancer. Auger electrons are low-
energy electrons that are ejected from the atom in response to a downward transition of electrons
within orbital shells282, 283. Since they have subcellular range (nm), Auger electrons must enter
target cells to ensure proper delivery of radiation dose282, 283. Conversion electrons are
monoenergetic orbital electrons that are ejected from unstable nuclei during the process of
internal conversion. With high LET and a limited tissue range (nm), conversion electrons deliver
high localized dose to diseased tissues285, 287. The radiometals used for therapy applications, 225Ac, 212Pb, and 213Bi (α), 90Y and 177Lu (β−), 111In (Auger), and 114mSn (conversion electron) can
be labeled onto CA-IX targeting moieties via bifunctional chelators287-289. For example, 111In-
SCN-Bn-DTPA-Ab02 investigated for SPECT imaging in Chapter 6 can be used for Auger-
electron emitting therapy.
7.4.4 Clinical Translation of CA-IX Imaging Agents
To translate research findings into clinical setting, radiopharmaceuticals require
dosimetry and acute toxicity studies for IND applications290. For dosimetry, biodistribution data
can be used to estimate potential radiation absorbed doses for humans using the OLINDA/EXM
software291. On the other hand, acute toxicity studies are more comprehensive. Healthy rats are
109
intravenously administered the radiotracer at 100-1000 times the expected human dose or saline
solution (control group). Animals are monitored, weighed on a daily basis, with blood chemistry
(complete blood cell count, hematocrit, hemoglobin, serum creatinine, and alanine
aminotransferease) and necropsy performed after 14 days to discern potential differences
between the treated and control groups292. We have an in-house Investigational Drug Program at
the BCCA that is well-equipped to perform biodistribution and toxicology studies under GLP
conditions. Pending optimization to prolong bioavailability to increase overall uptake and
contrast, we believe that 68Ga-DOTA-AEBSA discussed in Chapter 5 is an encouraging
candidate for future clinical translation.
110
Bibliography
1. Weissleder R, Mahmood U. Molecular imaging. Radiology 2001;219(2): 316-33. 2. Cherry SR, Sorenson JA, Phelps ME. Physics in nuclear medicine. 4th ed. Philadelphia: Elsevier/Saunders, 2012. 3. Gambhir SS. Molecular imaging of cancer with positron emission tomography. Nat Rev Cancer 2002;2(9): 683-93. 4. Fani M, Maecke HR. Radiopharmaceutical development of radiolabelled peptides. Eur J Nucl Med Mol Imaging 2012;39 Suppl 1: S11-30. 5. Holland JP, Williamson MJ, Lewis JS. Unconventional nuclides for radiopharmaceuticals. Mol Imaging 2010;9(1): 1-20. 6. Seo Y, Mari C, Hasegawa BH. Technological development and advances in single-photon emission computed tomography/computed tomography. Semin Nucl Med 2008;38(3): 177-98. 7. Van Noorden R. Radioisotopes: The medical testing crisis. Nature 2013;504(7479): 202-4. 8. Iagaru A, Young P, Mittra E, Dick DW, Herfkens R, Gambhir SS. Pilot prospective evaluation of 99mTc-MDP scintigraphy, 18F NaF PET/CT, 18F FDG PET/CT and whole-body MRI for detection of skeletal metastases. Clin Nucl Med 2013;38(7): e290-6. 9. Subramanian G, McAfee JG, Blair RJ, Kallfelz FA, Thomas FD. Technetium-99m-methylene diphosphonate--a superior agent for skeletal imaging: comparison with other technetium complexes. J Nucl Med 1975;16(8): 744-55. 10. Zaret BL, Rigo P, Wackers FJ, et al. Myocardial perfusion imaging with 99mTc tetrofosmin. Comparison to 201Tl imaging and coronary angiography in a phase III multicenter trial. Tetrofosmin International Trial Study Group. Circulation 1995;91(2): 313-9. 11. Medrano R, Lowry RW, Young JB, et al. Assessment of myocardial viability with 99mTc sestamibi in patients undergoing cardiac transplantation. A scintigraphic/pathological study. Circulation 1996;94(5): 1010-7. 12. Baggish AL, Boucher CA. Radiopharmaceutical agents for myocardial perfusion imaging. Circulation 2008;118(16): 1668-74. 13. Nakamura K, Tukatani Y, Kubo A, et al. The behavior of 99mTc-hexamethylpropyleneamineoxime (99mTc-HMPAO) in blood and brain. Eur J Nucl Med 1989;15(2): 100-7. 14. DuBois SG, Matthay KK. Radiolabeled metaiodobenzylguanidine for the treatment of neuroblastoma. Nucl Med Biol 2008;35 Suppl 1: S35-48. 15. Carrasquillo JA, Chen CC. 131 I-MIBG Therapy. In: Strauss HW, Mariani G, Volterrani D, Larson SM, editors. Nuclear Oncology Pathophysiology and Clinical Applications. New York: Springer 2013:691-714. 16. Buck AK, Herrmann K, Stargardt T, Dechow T, Krause BJ, Schreyogg J. Economic evaluation of PET and PET/CT in oncology: evidence and methodologic approaches. J Nucl Med Technol 2010;38(1): 6-17. 17. Hillner BE, Siegel BA, Liu D, et al. Impact of positron emission tomography/computed tomography and positron emission tomography (PET) alone on expected management of patients with cancer: initial results from the National Oncologic PET Registry. J Clin Oncol 2008;26(13): 2155-61.
111
18. Garland S, Morrison A. Publicly Funded Uses of PET Scans in Canada. Environmental Scan. Ottawa, Canada: Canadian Agency for Drugs and Technologies in Health, 2015:1-11. 19. Kim JW, Dang CV. Cancer's molecular sweet tooth and the Warburg effect. Cancer Res 2006;66(18): 8927-30. 20. Nabi HA, Zubeldia JM. Clinical applications of (18)F-FDG in oncology. J Nucl Med Technol 2002;30(1): 3-9; quiz 10-1. 21. Pauwels EK, Sturm EJ, Bombardieri E, Cleton FJ, Stokkel MP. Positron-emission tomography with [18F]fluorodeoxyglucose. Part I. Biochemical uptake mechanism and its implication for clinical studies. J Cancer Res Clin Oncol 2000;126(10): 549-59. 22. Griffeth LK. Use of PET/CT scanning in cancer patients: technical and practical considerations. Proc (Bayl Univ Med Cent) 2005;18(4): 321-30. 23. Bauwens M, Wierts R, van Royen B, et al. Molecular imaging of brown adipose tissue in health and disease. Eur J Nucl Med Mol Imaging 2014;41(4): 776-91. 24. Sobic-Saranovic D, Artiko V, Obradovic V. FDG PET imaging in sarcoidosis. Semin Nucl Med 2013;43(6): 404-11. 25. Vorster M, Sathekge MM, Bomanji J. Advances in imaging of tuberculosis: the role of (1)(8)F-FDG PET and PET/CT. Curr Opin Pulm Med 2014;20(3): 287-93. 26. Glaudemans AW, de Vries EF, Galli F, Dierckx RA, Slart RH, Signore A. The use of (18)F-FDG-PET/CT for diagnosis and treatment monitoring of inflammatory and infectious diseases. Clin Dev Immunol 2013;2013: 623036. 27. Rohren EM, Turkington TG, Coleman RE. Clinical applications of PET in oncology. Radiology 2004;231(2): 305-32. 28. Mansour JC, Schwarz RE. Molecular mechanisms for individualized cancer care. J Am Coll Surg 2008;207(2): 250-8. 29. Harris TJ, McCormick F. The molecular pathology of cancer. Nat Rev Clin Oncol 2010;7(5): 251-65. 30. Hanahan D, Weinberg RA. The hallmarks of cancer. Cell 2000;100(1): 57-70. 31. Hanahan D, Weinberg RA. Hallmarks of cancer: the next generation. Cell 2011;144(5): 646-74. 32. Welcsh PL, King MC. BRCA1 and BRCA2 and the genetics of breast and ovarian cancer. Hum Mol Genet 2001;10(7): 705-13. 33. Meijers-Heijboer H, Brekelmans CT, Menke-Pluymers M, et al. Use of genetic testing and prophylactic mastectomy and oophorectomy in women with breast or ovarian cancer from families with a BRCA1 or BRCA2 mutation. J Clin Oncol 2003;21(9): 1675-81. 34. Sawyers C. Targeted cancer therapy. Nature 2004;432(7015): 294-7. 35. Cohen MH, Williams G, Johnson JR, et al. Approval summary for imatinib mesylate capsules in the treatment of chronic myelogenous leukemia. Clin Cancer Res 2002;8(5): 935-42. 36. Johnson JR, Bross P, Cohen M, et al. Approval summary: imatinib mesylate capsules for treatment of adult patients with newly diagnosed philadelphia chromosome-positive chronic myelogenous leukemia in chronic phase. Clin Cancer Res 2003;9(6): 1972-9. 37. Druker BJ. Imatinib and chronic myeloid leukemia: validating the promise of molecularly targeted therapy. Eur J Cancer 2002;38 Suppl 5: S70-6. 38. Neal JW, Sledge GW. Decade in review-targeted therapy: successes, toxicities and challenges in solid tumours. Nat Rev Clin Oncol 2014;11(11): 627-8.
112
39. Medical imaging in personalised medicine: a white paper of the research committee of the European Society of Radiology (ESR). Insights Imaging 2015;6(2): 141-55. 40. Gupta N, Price PM, Aboagye EO. PET for in vivo pharmacokinetic and pharmacodynamic measurements. Eur J Cancer 2002;38(16): 2094-107. 41. Quail DF, Joyce JA. Microenvironmental regulation of tumor progression and metastasis. Nat Med 2013;19(11): 1423-37. 42. Balkwill FR, Capasso M, Hagemann T. The tumor microenvironment at a glance. J Cell Sci 2012;125(Pt 23): 5591-6. 43. Mbeunkui F, Johann DJ, Jr. Cancer and the tumor microenvironment: a review of an essential relationship. Cancer Chemother Pharmacol 2009;63(4): 571-82. 44. Parks SK, Chiche J, Pouyssegur J. Disrupting proton dynamics and energy metabolism for cancer therapy. Nat Rev Cancer 2013;13(9): 611-23. 45. Blagosklonny MV. Antiangiogenic therapy and tumor progression. Cancer Cell 2004;5(1): 13-7. 46. Walsh JC, Lebedev A, Aten E, Madsen K, Marciano L, Kolb HC. The clinical importance of assessing tumor hypoxia: relationship of tumor hypoxia to prognosis and therapeutic opportunities. Antioxid Redox Signal 2014;21(10): 1516-54. 47. Bennewith KL, Dedhar S. Targeting hypoxic tumour cells to overcome metastasis. BMC Cancer 2011;11: 504. 48. Rockwell S, Dobrucki IT, Kim EY, Marrison ST, Vu VT. Hypoxia and radiation therapy: past history, ongoing research, and future promise. Curr Mol Med 2009;9(4): 442-58. 49. Yoshimura M, Itasaka S, Harada H, Hiraoka M. Microenvironment and radiation therapy. Biomed Res Int 2013;2013: 685308. 50. Grimes DR, Partridge M. A mechanistic investigation of the oxygen fixation hypothesis and oxygen enhancement ratio. Biomed Phys Eng Express 2015;1(4): 045209. 51. Bertout JA, Patel SA, Simon MC. The impact of O2 availability on human cancer. Nat Rev Cancer 2008;8(12): 967-75. 52. Gray LH, Conger AD, Ebert M, Hornsey S, Scott OC. The concentration of oxygen dissolved in tissues at the time of irradiation as a factor in radiotherapy. Br J Radiol 1953;26(312): 638-48. 53. Minchinton AI, Tannock IF. Drug penetration in solid tumours. Nat Rev Cancer 2006;6(8): 583-92. 54. Rohwer N, Cramer T. Hypoxia-mediated drug resistance: novel insights on the functional interaction of HIFs and cell death pathways. Drug Resist Updat 2011;14(3): 191-201. 55. Krohn KA, Link JM, Mason RP. Molecular imaging of hypoxia. J Nucl Med 2008;49 Suppl 2: 129S-48S. 56. McDonald PC, Dedhar S. Carbonic anhydrase IX (CAIX) as a mediator of hypoxia-induced stress response in cancer cells. Subcell Biochem 2014;75: 255-69. 57. Wilson WR, Hay MP. Targeting hypoxia in cancer therapy. Nat Rev Cancer 2011;11(6): 393-410. 58. Hockel M, Knoop C, Schlenger K, et al. Intratumoral pO2 predicts survival in advanced cancer of the uterine cervix. Radiother Oncol 1993;26(1): 45-50. 59. Fleming IN, Manavaki R, Blower PJ, et al. Imaging tumour hypoxia with positron emission tomography. Br J Cancer 2015;112(2): 238-50. 60. Mees G, Dierckx R, Vangestel C, Van de Wiele C. Molecular imaging of hypoxia with radiolabelled agents. Eur J Nucl Med Mol Imaging 2009;36(10): 1674-86.
113
61. Rajendran JG, Wilson DC, Conrad EU, et al. [(18)F]FMISO and [(18)F]FDG PET imaging in soft tissue sarcomas: correlation of hypoxia, metabolism and VEGF expression. Eur J Nucl Med Mol Imaging 2003;30(5): 695-704. 62. Harris AL. Hypoxia--a key regulatory factor in tumour growth. Nat Rev Cancer 2002;2(1): 38-47. 63. Carroll VA, Ashcroft M. Targeting the molecular basis for tumour hypoxia. Expert Rev Mol Med 2005;7(6): 1-16. 64. Potter C, Harris AL. Hypoxia inducible carbonic anhydrase IX, marker of tumour hypoxia, survival pathway and therapy target. Cell Cycle 2004;3(2): 164-7. 65. Pastorekova S, Zavadova Z, Kostal M, Babusikova O, Zavada J. A novel quasi-viral agent, MaTu, is a two-component system. Virology 1992;187(2): 620-6. 66. Pastorek J, Pastorekova S, Callebaut I, et al. Cloning and characterization of MN, a human tumor-associated protein with a domain homologous to carbonic anhydrase and a putative helix-loop-helix DNA binding segment. Oncogene 1994;9(10): 2877-88. 67. Alterio V, Di Fiore A, D'Ambrosio K, Supuran CT, De Simone G. Multiple binding modes of inhibitors to carbonic anhydrases: how to design specific drugs targeting 15 different isoforms? Chem Rev 2012;112(8): 4421-68. 68. Rafajova M, Zatovicova M, Kettmann R, Pastorek J, Pastorekova S. Induction by hypoxia combined with low glucose or low bicarbonate and high posttranslational stability upon reoxygenation contribute to carbonic anhydrase IX expression in cancer cells. Int J Oncol 2004;24(4): 995-1004. 69. Moroz E, Carlin S, Dyomina K, et al. Real-time imaging of HIF-1alpha stabilization and degradation. PLoS One 2009;4(4): e5077. 70. Kaluz S, Kaluzova M, Liao SY, Lerman M, Stanbridge EJ. Transcriptional control of the tumor- and hypoxia-marker carbonic anhydrase 9: A one transcription factor (HIF-1) show? Biochim Biophys Acta 2009;1795(2): 162-72. 71. He F, Deng X, Wen B, et al. Noninvasive molecular imaging of hypoxia in human xenografts: comparing hypoxia-induced gene expression with endogenous and exogenous hypoxia markers. Cancer Res 2008;68(20): 8597-606. 72. Olive PL, Aquino-Parsons C, MacPhail SH, et al. Carbonic anhydrase 9 as an endogenous marker for hypoxic cells in cervical cancer. Cancer Res 2001;61(24): 8924-9. 73. Morris MR, Hughes DJ, Tian YM, et al. Mutation analysis of hypoxia-inducible factors HIF1A and HIF2A in renal cell carcinoma. Anticancer Res 2009;29(11): 4337-43. 74. Li Z, Bao S, Wu Q, et al. Hypoxia-inducible factors regulate tumorigenic capacity of glioma stem cells. Cancer Cell 2009;15(6): 501-13. 75. Holmquist-Mengelbier L, Fredlund E, Lofstedt T, et al. Recruitment of HIF-1alpha and HIF-2alpha to common target genes is differentially regulated in neuroblastoma: HIF-2alpha promotes an aggressive phenotype. Cancer Cell 2006;10(5): 413-23. 76. Pastorekova S, Barathova M, Kopacek J, Pastorek J. Carbonic Anhydrase Inhibitors Targeting Cancer: Therapeutic, Immunologic, and Diagnostic Tools Targeting Isoforms IX and XII. In: Supuran CT, Winum JY, editors. Drug Design of Zinc-Enzyme Inhibitors: Functional, Structural, and Disease Applications. Hoboken, NJ, USA: John Wiley & Sons, Inc., 2009:193-222. 77. Alterio V, Hilvo M, Di Fiore A, et al. Crystal structure of the catalytic domain of the tumor-associated human carbonic anhydrase IX. Proc Natl Acad Sci U S A 2009;106(38): 16233-8.

114
78. Brahimi-Horn MC, Pouyssegur J. Hypoxia in cancer cell metabolism and pH regulation. Oxygen Sensing and Hypoxia-Induced Responses 2007;43: 165-78. 79. Boyer MJ, Tannock IF. Regulation of Intracellular Ph in Tumor-Cell Lines - Influence of Microenvironmental Conditions. Cancer Research 1992;52(16): 4441-47. 80. Parks SK, Chiche J, Pouyssegur J. pH Control Mechanisms of Tumor Survival and Growth. Journal of Cellular Physiology 2011;226(2): 299-308. 81. Hilvo M, Baranauskiene L, Salzano AM, et al. Biochemical characterization of CA IX, one of the most active carbonic anhydrase isozymes. J Biol Chem 2008;283(41): 27799-809. 82. Bartosova M, Parkkila S, Pohlodek K, et al. Expression of carbonic anhydrase IX in breast is associated with malignant tissues and is related to overexpression of c-erbB2. J Pathol 2002;197(3): 314-21. 83. Swietach P, Wigfield S, Cobden P, Supuran CT, Harris AL, Vaughan-Jones RD. Tumor-associated carbonic anhydrase 9 spatially coordinates intracellular pH in three-dimensional multicellular growths. J Biol Chem 2008;283(29): 20473-83. 84. Swietach P, Wigfield S, Supuran CT, Harris AL, Vaughan-Jones RD. Cancer-associated, hypoxia-inducible carbonic anhydrase IX facilitates CO2 diffusion. BJU Int 2008;101 Suppl 4: 22-4. 85. Lou Y, McDonald PC, Oloumi A, et al. Targeting tumor hypoxia: suppression of breast tumor growth and metastasis by novel carbonic anhydrase IX inhibitors. Cancer Res 2011;71(9): 3364-76. 86. Svastova E, Zilka N, Zat'ovicova M, et al. Carbonic anhydrase IX reduces E-cadherin-mediated adhesion of MDCK cells via interaction with beta-catenin. Exp Cell Res 2003;290(2): 332-45. 87. Shin HJ, Rho SB, Jung DC, Han IO, Oh ES, Kim JY. Carbonic anhydrase IX (CA9) modulates tumor-associated cell migration and invasion. J Cell Sci 2011;124(Pt 7): 1077-87. 88. Overall CM, Kleifeld O. Tumour microenvironment - opinion: validating matrix metalloproteinases as drug targets and anti-targets for cancer therapy. Nat Rev Cancer 2006;6(3): 227-39. 89. Kessenbrock K, Plaks V, Werb Z. Matrix metalloproteinases: regulators of the tumor microenvironment. Cell 2010;141(1): 52-67. 90. Hulikova A, Zatovicova M, Svastova E, et al. Intact intracellular tail is critical for proper functioning of the tumor-associated, hypoxia-regulated carbonic anhydrase IX. FEBS Lett 2009;583(22): 3563-8. 91. Ditte P, Dequiedt F, Svastova E, et al. Phosphorylation of carbonic anhydrase IX controls its ability to mediate extracellular acidification in hypoxic tumors. Cancer Res 2011;71(24): 7558-67. 92. Dorai T, Sawczuk IS, Pastorek J, Wiernik PH, Dutcher JP. The role of carbonic anhydrase IX overexpression in kidney cancer. Eur J Cancer 2005;41(18): 2935-47. 93. Zatovicova M, Sedlakova O, Svastova E, et al. Ectodomain shedding of the hypoxia-induced carbonic anhydrase IX is a metalloprotease-dependent process regulated by TACE/ADAM17. Br J Cancer 2005;93(11): 1267-76. 94. Zavada J, Zavadova Z, Zat'ovicova M, Hyrsl L, Kawaciuk I. Soluble form of carbonic anhydrase IX (CA IX) in the serum and urine of renal carcinoma patients. Br J Cancer 2003;89(6): 1067-71.
115
95. Kock L, Mahner S, Choschzick M, et al. Serum carbonic anhydrase IX and its prognostic relevance in vulvar cancer. Int J Gynecol Cancer 2011;21(1): 141-8. 96. Brown-Glaberman U, Marron M, Chalasani P, et al. Circulating Carbonic Anhydrase IX and Antiangiogenic Therapy in Breast Cancer. Dis Markers 2016;2016: 9810383. 97. Vidlickova I, Dequiedt F, Jelenska L, et al. Apoptosis-induced ectodomain shedding of hypoxia-regulated carbonic anhydrase IX from tumor cells: a double-edged response to chemotherapy. BMC Cancer 2016;16(1): 239. 98. Srinivasarao M, Galliford CV, Low PS. Principles in the design of ligand-targeted cancer therapeutics and imaging agents. Nat Rev Drug Discov 2015;14(3): 203-19. 99. Saarnio J, Parkkila S, Parkkila AK, et al. Immunohistochemistry of carbonic anhydrase isozyme IX (MN/CA IX) in human gut reveals polarized expression in the epithelial cells with the highest proliferative capacity. J Histochem Cytochem 1998;46(4): 497-504. 100. Karhumaa P, Kaunisto K, Parkkila S, et al. Expression of the transmembrane carbonic anhydrases, CA IX and CA XII, in the human male excurrent ducts. Mol Hum Reprod 2001;7(7): 611-6. 101. Kivela AJ, Parkkila S, Saarnio J, et al. Expression of transmembrane carbonic anhydrase isoenzymes IX and XII in normal human pancreas and pancreatic tumours. Histochem Cell Biol 2000;114(3): 197-204. 102. Tan EY, Yan M, Campo L, et al. The key hypoxia regulated gene CAIX is upregulated in basal-like breast tumours and is associated with resistance to chemotherapy. Br J Cancer 2009;100(2): 405-11. 103. Ilie M, Mazure NM, Hofman V, et al. High levels of carbonic anhydrase IX in tumour tissue and plasma are biomarkers of poor prognostic in patients with non-small cell lung cancer. Br J Cancer 2010;102(11): 1627-35. 104. Kim SJ, Rabbani ZN, Vollmer RT, et al. Carbonic anhydrase IX in early-stage non-small cell lung cancer. Clin Cancer Res 2004;10(23): 7925-33. 105. Korkeila E, Talvinen K, Jaakkola PM, et al. Expression of carbonic anhydrase IX suggests poor outcome in rectal cancer. Br J Cancer 2009;100(6): 874-80. 106. Hutchison GJ, Valentine HR, Loncaster JA, et al. Hypoxia-inducible factor 1alpha expression as an intrinsic marker of hypoxia: correlation with tumor oxygen, pimonidazole measurements, and outcome in locally advanced carcinoma of the cervix. Clin Cancer Res 2004;10(24): 8405-12. 107. Kim JY, Shin HJ, Kim TH, et al. Tumor-associated carbonic anhydrases are linked to metastases in primary cervical cancer. J Cancer Res Clin Oncol 2006;132(5): 302-8. 108. Choschzick M, Oosterwijk E, Muller V, et al. Overexpression of carbonic anhydrase IX (CAIX) is an independent unfavorable prognostic marker in endometrioid ovarian cancer. Virchows Arch 2011;459(2): 193-200. 109. Beasley NJ, Wykoff CC, Watson PH, et al. Carbonic anhydrase IX, an endogenous hypoxia marker, expression in head and neck squamous cell carcinoma and its relationship to hypoxia, necrosis, and microvessel density. Cancer Res 2001;61(13): 5262-7. 110. Hoogsteen IJ, Marres HA, Wijffels KI, et al. Colocalization of carbonic anhydrase 9 expression and cell proliferation in human head and neck squamous cell carcinoma. Clin Cancer Res 2005;11(1): 97-106. 111. Klatte T, Seligson DB, Rao JY, et al. Carbonic anhydrase IX in bladder cancer: a diagnostic, prognostic, and therapeutic molecular marker. Cancer 2009;115(7): 1448-58.
116
112. Bui MH, Seligson D, Han KR, et al. Carbonic anhydrase IX is an independent predictor of survival in advanced renal clear cell carcinoma: implications for prognosis and therapy. Clin Cancer Res 2003;9(2): 802-11. 113. Stillebroer AB, Mulders PF, Boerman OC, Oyen WJ, Oosterwijk E. Carbonic anhydrase IX in renal cell carcinoma: implications for prognosis, diagnosis, and therapy. Eur Urol 2010;58(1): 75-83. 114. Hussain SA, Ganesan R, Reynolds G, et al. Hypoxia-regulated carbonic anhydrase IX expression is associated with poor survival in patients with invasive breast cancer. Br J Cancer 2007;96(1): 104-9. 115. Haapasalo JA, Nordfors KM, Hilvo M, et al. Expression of carbonic anhydrase IX in astrocytic tumors predicts poor prognosis. Clin Cancer Res 2006;12(2): 473-7. 116. Fogh J, Fogh JM, Orfeo T. One hundred and twenty-seven cultured human tumor cell lines producing tumors in nude mice. J Natl Cancer Inst 1977;59(1): 221-6. 117. Ebert T, Bander NH, Finstad CL, Ramsawak RD, Old LJ. Establishment and characterization of human renal cancer and normal kidney cell lines. Cancer Res 1990;50(17): 5531-6. 118. Chrastina A, Zavada J, Parkkila S, et al. Biodistribution and pharmacokinetics of 125I-labeled monoclonal antibody M75 specific for carbonic anhydrase IX, an intrinsic marker of hypoxia, in nude mice xenografted with human colorectal carcinoma. Int J Cancer 2003;105(6): 873-81. 119. Ivanov SV, Kuzmin I, Wei MH, et al. Down-regulation of transmembrane carbonic anhydrases in renal cell carcinoma cell lines by wild-type von Hippel-Lindau transgenes. Proc Natl Acad Sci U S A 1998;95(21): 12596-601. 120. Liu Z, Smyth FE, Renner C, Lee FT, Oosterwijk E, Scott AM. Anti-renal cell carcinoma chimeric antibody G250: cytokine enhancement of in vitro antibody-dependent cellular cytotoxicity. Cancer Immunol Immunother 2002;51(3): 171-7. 121. Shuin T, Kondo K, Torigoe S, et al. Frequent somatic mutations and loss of heterozygosity of the von Hippel-Lindau tumor suppressor gene in primary human renal cell carcinomas. Cancer Res 1994;54(11): 2852-5. 122. Herman JG, Latif F, Weng Y, et al. Silencing of the VHL tumor-suppressor gene by DNA methylation in renal carcinoma. Proc Natl Acad Sci U S A 1994;91(21): 9700-4. 123. Scott AM, Allison JP, Wolchok JD. Monoclonal antibodies in cancer therapy. Cancer Immun 2012;12: 14. 124. Scott AM, Wolchok JD, Old LJ. Antibody therapy of cancer. Nat Rev Cancer 2012;12(4): 278-87. 125. Chrastina A, Pastorekova S, Pastorek J. Immunotargeting of human cervical carcinoma xenograft expressing CA IX tumor-associated antigen by 125I-labeled M75 monoclonal antibody. Neoplasma 2003;50(1): 13-21. 126. Wind TC, Messenger MP, Thompson D, Selby PJ, Banks RE. Measuring carbonic anhydrase IX as a hypoxia biomarker: differences in concentrations in serum and plasma using a commercial enzyme-linked immunosorbent assay due to influences of metal ions. Ann Clin Biochem 2011;48(Pt 2): 112-20. 127. Divgi CR, Uzzo RG, Gatsonis C, et al. Positron emission tomography/computed tomography identification of clear cell renal cell carcinoma: results from the REDECT trial. J Clin Oncol 2013;31(2): 187-94.
117
128. Stillebroer AB, Franssen GM, Mulders PF, et al. ImmunoPET imaging of renal cell carcinoma with (124)I- and (89)Zr-labeled anti-CAIX monoclonal antibody cG250 in mice. Cancer Biother Radiopharm 2013;28(7): 510-5. 129. Stillebroer AB, Zegers CM, Boerman OC, et al. Dosimetric analysis of 177Lu-cG250 radioimmunotherapy in renal cell carcinoma patients: correlation with myelotoxicity and pretherapeutic absorbed dose predictions based on 111In-cG250 imaging. J Nucl Med 2012;53(1): 82-9. 130. Firer MA, Gellerman G. Targeted drug delivery for cancer therapy: the other side of antibodies. J Hematol Oncol 2012;5: 70. 131. Supuran CT. Carbonic anhydrases: novel therapeutic applications for inhibitors and activators. Nat Rev Drug Discov 2008;7(2): 168-81. 132. Carta F, Maresca A, Scozzafava A, Supuran CT. Novel coumarins and 2-thioxo-coumarins as inhibitors of the tumor-associated carbonic anhydrases IX and XII. Bioorg Med Chem 2012;20(7): 2266-73. 133. Apte SD, Chin FT, Graves EE. Synthesis of a New PET Radiotracer Targeting Carbonic Anhydrase IX. Journal of Labelled Compounds and Radiopharmaceuticals 2009;52(S1): S408. 134. Lu G, Hillier SM, Maresca KP, et al. Synthesis and SAR of novel Re/99mTc-labeled benzenesulfonamide carbonic anhydrase IX inhibitors for molecular imaging of tumor hypoxia. J Med Chem 2013;56(2): 510-20. 135. Akurathi V, Dubois L, Celen S, et al. Development and biological evaluation of (9)(9)mTc-sulfonamide derivatives for in vivo visualization of CA IX as surrogate tumor hypoxia markers. Eur J Med Chem 2014;71: 374-84. 136. Akurathi V, Dubois L, Lieuwes NG, et al. Synthesis and biological evaluation of a 99mTc-labelled sulfonamide conjugate for in vivo visualization of carbonic anhydrase IX expression in tumor hypoxia. Nucl Med Biol 2010;37(5): 557-64. 137. Turkbey B, Lindenberg ML, Adler S, et al. PET/CT imaging of renal cell carcinoma with (18)F-VM4-037: a phase II pilot study. Abdom Radiol (NY) 2016;41(1): 109-18. 138. Peeters SG, Dubois L, Lieuwes NG, et al. [F]VM4-037 MicroPET Imaging and Biodistribution of Two In Vivo CAIX-Expressing Tumor Models. Mol Imaging Biol 2015. 139. Krall N, Pretto F, Mattarella M, Muller C, Neri D. A technetium 99m-labeled ligand of carbonic anhydrase IX selectively targets renal cell carcinoma in vivo. J Nucl Med 2016. 140. Lee S, Xie J, Chen X. Peptide-based probes for targeted molecular imaging. Biochemistry 2010;49(7): 1364-76. 141. Rolleman EJ, Melis M, Valkema R, Boerman OC, Krenning EP, de Jong M. Kidney protection during peptide receptor radionuclide therapy with somatostatin analogues. Eur J Nucl Med Mol Imaging 2010;37(5): 1018-31. 142. Vegt E, Melis M, Eek A, et al. Renal uptake of different radiolabelled peptides is mediated by megalin: SPECT and biodistribution studies in megalin-deficient mice. Eur J Nucl Med Mol Imaging 2011;38(4): 623-32. 143. Vegt E, de Jong M, Wetzels JF, et al. Renal toxicity of radiolabeled peptides and antibody fragments: mechanisms, impact on radionuclide therapy, and strategies for prevention. J Nucl Med 2010;51(7): 1049-58. 144. Askoxylakis V, Garcia-Boy R, Rana S, et al. A new peptide ligand for targeting human carbonic anhydrase IX, identified through the phage display technology. PLoS One 2010;5(12): e15962.
118
145. Rana S, Nissen F, Marr A, et al. Optimization of a novel peptide ligand targeting human carbonic anhydrase IX. PLoS One 2012;7(5): e38279. 146. Rana S, Nissen F, Lindner T, et al. Screening of a novel peptide targeting the proteoglycan-like region of human carbonic anhydrase IX. Mol Imaging 2013;12(8). 147. Lofblom J, Feldwisch J, Tolmachev V, Carlsson J, Stahl S, Frejd FY. Affibody molecules: engineered proteins for therapeutic, diagnostic and biotechnological applications. FEBS Lett 2010;584(12): 2670-80. 148. Tolmachev V, Orlova A, Nilsson FY, Feldwisch J, Wennborg A, Abrahmsen L. Affibody molecules: potential for in vivo imaging of molecular targets for cancer therapy. Expert Opin Biol Ther 2007;7(4): 555-68. 149. Orlova A, Magnusson M, Eriksson TL, et al. Tumor imaging using a picomolar affinity HER2 binding affibody molecule. Cancer Res 2006;66(8): 4339-48. 150. Tolmachev V, Friedman M, Sandstrom M, et al. Affibody molecules for epidermal growth factor receptor targeting in vivo: aspects of dimerization and labeling chemistry. J Nucl Med 2009;50(2): 274-83. 151. Orlova A, Hofstrom C, Strand J, et al. [99mTc(CO)3]+-(HE)3-ZIGF1R:4551, a new Affibody conjugate for visualization of insulin-like growth factor-1 receptor expression in malignant tumours. Eur J Nucl Med Mol Imaging 2013;40(3): 439-49. 152. Tolmachev V, Varasteh Z, Honarvar H, et al. Imaging of platelet-derived growth factor receptor beta expression in glioblastoma xenografts using affibody molecule 111In-DOTA-Z09591. J Nucl Med 2014;55(2): 294-300. 153. Orlova A, Malm M, Rosestedt M, et al. Imaging of HER3-expressing xenografts in mice using a (99m)Tc(CO) 3-HEHEHE-Z HER3:08699 affibody molecule. Eur J Nucl Med Mol Imaging 2014;41(7): 1450-9. 154. Honarvar H, Garousi J, Gunneriusson E, et al. Imaging of CAIX-expressing xenografts in vivo using 99mTc-HEHEHE-ZCAIX:1 affibody molecule. Int J Oncol 2015;46(2): 513-20. 155. Altai M, Perols A, Tsourma M, et al. Feasibility of Affibody-Based Bioorthogonal Chemistry-Mediated Radionuclide Pretargeting. J Nucl Med 2016;57(3): 431-6. 156. Honarvar H, Westerlund K, Altai M, et al. Feasibility of Affibody Molecule-Based PNA-Mediated Radionuclide Pretargeting of Malignant Tumors. Theranostics 2016;6(1): 93-103. 157. Luker GD, Luker KE. Optical imaging: current applications and future directions. J Nucl Med 2008;49(1): 1-4. 158. van Leeuwen FW, de Jong M. Molecular imaging: the emerging role of optical imaging in nuclear medicine. Eur J Nucl Med Mol Imaging 2014;41(11): 2150-3. 159. Muselaers CH, Stillebroer AB, Rijpkema M, et al. Optical Imaging of Renal Cell Carcinoma with Anti-Carbonic Anhydrase IX Monoclonal Antibody Girentuximab. J Nucl Med 2014;55(6): 1035-40. 160. Tafreshi NK, Bui MM, Bishop K, et al. Noninvasive detection of breast cancer lymph node metastasis using carbonic anhydrases IX and XII targeted imaging probes. Clin Cancer Res 2012;18(1): 207-19. 161. van Brussel AS, Adams A, Oliveira S, et al. Hypoxia-Targeting Fluorescent Nanobodies for Optical Molecular Imaging of Pre-Invasive Breast Cancer. Mol Imaging Biol 2015. 162. Groves K, Bao B, Zhang J, et al. Synthesis and evaluation of near-infrared fluorescent sulfonamide derivatives for imaging of hypoxia-induced carbonic anhydrase IX expression in tumors. Bioorg Med Chem Lett 2012;22(1): 653-7.
119
163. Bao B, Groves K, Zhang J, et al. In vivo imaging and quantification of carbonic anhydrase IX expression as an endogenous biomarker of tumor hypoxia. PLoS One 2012;7(11): e50860. 164. Wichert M, Krall N, Decurtins W, et al. Dual-display of small molecules enables the discovery of ligand pairs and facilitates affinity maturation. Nat Chem 2015;7(3): 241-9. 165. Lv PC, Roy J, Putt KS, Low PS. Evaluation of a Carbonic Anhydrase IX-Targeted Near-Infrared Dye for Fluorescence-Guided Surgery of Hypoxic Tumors. Mol Pharm 2016. 166. Berger A. Magnetic resonance imaging. BMJ 2002;324(7328): 35. 167. Gallagher FA. An introduction to functional and molecular imaging with MRI. Clin Radiol 2010;65(7): 557-66. 168. Kurhanewicz J, Vigneron DB, Brindle K, et al. Analysis of cancer metabolism by imaging hyperpolarized nuclei: prospects for translation to clinical research. Neoplasia 2011;13(2): 81-97. 169. Gallagher FA, Sladen H, Kettunen MI, et al. Carbonic Anhydrase Activity Monitored In Vivo by Hyperpolarized 13C-Magnetic Resonance Spectroscopy Demonstrates Its Importance for pH Regulation in Tumors. Cancer Res 2015;75(19): 4109-18. 170. Chen W, Han Y, Qian Y, Tang J, Hu H, Shen Y. Preparation and Imaging Study of Tumor-targeting MRI Contrast Agent Based on Fe3O4 Nanoparticles. Chem Lett 2015;44(12): 1771-73. 171. Rami M, Montero JL, Dubois L, et al. Carbonic anhydrase inhibitors: Gd(III) complexes of DOTA- and TETA-sulfonamide conjugates targeting the tumor associated carbonic anhydrase isozymes IX and XII. New J Chem 2010;34: 2139-44. 172. Belldegrun AS, Chamie K, Klopfer P, et al. ARISER: A randomized double blind phase III study to evaluate adjuvant cG250 treatment versus placebo in patients with high risk ccRCC - Results and implications for adjuvant clinical trials. ASCO Annual Meeting 2013, 2013:Abstract 4507. 173. Muselaers CH, Boers-Sonderen MJ, van Oostenbrugge TJ, et al. Phase 2 Study of Lutetium 177-Labeled Anti-Carbonic Anhydrase IX Monoclonal Antibody Girentuximab in Patients with Advanced Renal Cell Carcinoma. Eur Urol 2015. 174. Petrul HM, Schatz CA, Kopitz CC, et al. Therapeutic mechanism and efficacy of the antibody-drug conjugate BAY 79-4620 targeting human carbonic anhydrase 9. Mol Cancer Ther 2012;11(2): 340-9. 175. BAY 79-4620/12671 Clinical Study Report Bayer HealthCare Pharmaceuticals, Inc., 2014. 176. Supuran CT, Winum JY. Designing carbonic anhydrase inhibitors for the treatment of breast cancer. Expert Opin Drug Discov 2015;10(6): 591-7. 177. Dubois L, Peeters SG, van Kuijk SJ, et al. Targeting carbonic anhydrase IX by nitroimidazole based sulfamides enhances the therapeutic effect of tumor irradiation: a new concept of dual targeting drugs. Radiother Oncol 2013;108(3): 523-8. 178. Pacchiano F, Carta F, McDonald PC, et al. Ureido-substituted benzenesulfonamides potently inhibit carbonic anhydrase IX and show antimetastatic activity in a model of breast cancer metastasis. J Med Chem 2011;54(6): 1896-902. 179. Baker BR, Hurlbut JA. Irreversible enzyme inhibitors. 53. Proteolytic enzymes. XI. Inhibition of guinea pig complement by substituted phenoxyacetamides. J Med Chem 1969;12(3): 415-9. 180. Wilson AA, Dasilva JN, Houle S. Synthesis of two radiofluorinated cocaine analogues using distilled 2-[18F]fluoroethyl bromide. Appl Radiat Isot 1995;46(8): 765-70.
120
181. Gokce B, Gencer N, Arslan O, Turkoglu SA, Alper M, Kockar F. Evaluation of in vitro effects of some analgesic drugs on erythrocyte and recombinant carbonic anhydrase I and II. J Enzyme Inhib Med Chem 2012;27(1): 37-42. 182. Senturk M, Gulcin I, Beydemir S, Kufrevioglu OI, Supuran CT. In Vitro inhibition of human carbonic anhydrase I and II isozymes with natural phenolic compounds. Chem Biol Drug Des 2011;77(6): 494-9. 183. Guler OO, De Simone G, Supuran CT. Drug design studies of the novel antitumor targets carbonic anhydrase IX and XII. Curr Med Chem 2010;17(15): 1516-26. 184. Hendricks JA, Keliher EJ, Marinelli B, Reiner T, Weissleder R, Mazitschek R. In vivo PET imaging of histone deacetylases by 18F-suberoylanilide hydroxamic acid (18F-SAHA). J Med Chem 2011;54(15): 5576-82. 185. Kim KH, Isin EM, Yun CH, Kim DH, Guengerich FP. Kinetic deuterium isotope effects for 7-alkoxycoumarin O-dealkylation reactions catalyzed by human cytochromes P450 and in liver microsomes. Rate-limiting C-H bond breaking in cytochrome P450 1A2 substrate oxidation. FEBS J 2006;273(10): 2223-31. 186. Yamazaki H, Inoue K, Mimura M, Oda Y, Guengerich FP, Shimada T. 7-Ethoxycoumarin O-deethylation catalyzed by cytochromes P450 1A2 and 2E1 in human liver microsomes. Biochem Pharmacol 1996;51(3): 313-9. 187. Tewson TJ, Welch MJ. Preparation and preliminary biodistribution of "no carrier added" fluorine1-8 fluoroethanol. J Nucl Med 1980;21(6): 559-64. 188. Ling G, Gu J, Genter MB, Zhuo X, Ding X. Regulation of cytochrome P450 gene expression in the olfactory mucosa. Chem Biol Interact 2004;147(3): 247-58. 189. Pinard MA, Mahon B, McKenna R. Probing the surface of human carbonic anhydrase for clues towards the design of isoform specific inhibitors. Biomed Res Int 2015;2015: 453543. 190. McKenna R, Supuran CT. Carbonic anhydrase inhibitors drug design. Subcell Biochem 2014;75: 291-323. 191. Metayer B, Mingot A, Vullo D, Supuran CT, Thibaudeau S. New superacid synthesized (fluorinated) tertiary benzenesulfonamides acting as selective hCA IX inhibitors: toward a new mode of carbonic anhydrase inhibition by sulfonamides. Chem Commun (Camb) 2013;49(54): 6015-7. 192. Metayer B, Martin-Mingot A, Vullo D, Supuran CT, Thibaudeau S. Superacid synthesized tertiary benzenesulfonamides and benzofuzed sultams act as selective hCA IX inhibitors: toward understanding a new mode of inhibition by tertiary sulfonamides. Org Biomol Chem 2013;11(43): 7540-9. 193. Lin KS, Ding YS, Kim SW, Kil KE. Synthesis, enantiomeric resolution, F-18 labeling and biodistribution of reboxetine analogs: promising radioligands for imaging the norepinephrine transporter with positron emission tomography. Nucl Med Biol 2005;32(4): 415-22. 194. Yoshida Y, Sakakura Y, Aso N, Okada S, Tanabe Y. Practical and efficient methods for sulfonylation of alcohols using Ts(Ms)Cl/Et3N and catalytic Me3H·HCl as combined base: Promising alternative to traditional pyridine. Tetrahedron 1999;55(8): 2183-92. 195. Lipinski CA, Lombardo F, Dominy BW, Feeney PJ. Experimental and computational approaches to estimate solubility and permeability in drug discovery and development settings. Adv Drug Deliv Rev 2001;46(1-3): 3-26.
121
196. Pan J, Lau J, Mesak F, et al. Synthesis and evaluation of 18F-labeled carbonic anhydrase IX inhibitors for imaging with positron emission tomography. J Enzyme Inhib Med Chem 2014;29(2): 249-55. 197. Chiche J, Ilc K, Laferriere J, et al. Hypoxia-inducible carbonic anhydrase IX and XII promote tumor cell growth by counteracting acidosis through the regulation of the intracellular pH. Cancer Res 2009;69(1): 358-68. 198. Kniess T, Laube M, Bergmann R, et al. Radiosynthesis of a (1)(8)F-labeled 2,3-diarylsubstituted indole via McMurry coupling for functional characterization of cyclooxygenase-2 (COX-2) in vitro and in vivo. Bioorg Med Chem 2012;20(11): 3410-21. 199. Vasdev N, Dorff PN, O'Neil JP, Chin FT, Hanrahan S, VanBrocklin HF. Metabolic stability of 6,7-dialkoxy-4-(2-, 3- and 4-[18F]fluoroanilino)quinazolines, potential EGFR imaging probes. Bioorg Med Chem 2011;19(9): 2959-65. 200. Liu H, Liu S, Miao Z, et al. Development of 18F-labeled picolinamide probes for PET imaging of malignant melanoma. J Med Chem 2013;56(3): 895-901. 201. Cai LS, Shuiyu L, Pike VW. Chemistry with [18F]Fluoride Ion. Eur J Org Chem 2008;2008(17): 2853-73. 202. Liu Z, Pourghiasian M, Radtke MA, et al. An organotrifluoroborate for broadly applicable one-step (18) f-labeling. Angew Chem Int Ed Engl 2014;53(44): 11876-80. 203. Geers C, Gros G. Carbon dioxide transport and carbonic anhydrase in blood and muscle. Physiol Rev 2000;80(2): 681-715. 204. Liu Z, Radtke MA, Wong MQ, Lin KS, Yapp DT, Perrin DM. Dual Mode Fluorescent F-PET Tracers: Efficient Modular Synthesis of Rhodamine-[cRGD]-[F]-Organotrifluoroborate, Rapid, and High Yielding One-Step F-Labeling at High Specific Activity, and Correlated in Vivo PET Imaging and ex Vivo Fluorescence. Bioconjug Chem 2014. 205. Liu Z, Pourghiasian M, Benard F, Pan J, Lin KS, Perrin DM. Preclinical evaluation of a high-affinity 18F-trifluoroborate octreotate derivative for somatostatin receptor imaging. J Nucl Med 2014;55(9): 1499-505. 206. Sarathi Addy P, Saha B, Pradeep Singh ND, et al. 1,3,5-Trisubstituted benzenes as fluorescent photoaffinity probes for human carbonic anhydrase II capture. Chem Commun (Camb) 2013;49(19): 1930-2. 207. Ahlskog JK, Dumelin CE, Trussel S, Marlind J, Neri D. In vivo targeting of tumor-associated carbonic anhydrases using acetazolamide derivatives. Bioorg Med Chem Lett 2009;19(16): 4851-6. 208. Dubois L, Douma K, Supuran CT, et al. Imaging the hypoxia surrogate marker CA IX requires expression and catalytic activity for binding fluorescent sulfonamide inhibitors. Radiother Oncol 2007;83(3): 367-73. 209. Wilkinson BL, Bornaghi LF, Houston TA, Innocenti A, Supuran CT, Poulsen SA. A novel class of carbonic anhydrase inhibitors: glycoconjugate benzene sulfonamides prepared by "click-tailing". J Med Chem 2006;49(22): 6539-48. 210. Cecchi A, Hulikova A, Pastorek J, et al. Carbonic anhydrase inhibitors. Design of fluorescent sulfonamides as probes of tumor-associated carbonic anhydrase IX that inhibit isozyme IX-mediated acidification of hypoxic tumors. J Med Chem 2005;48(15): 4834-41. 211. Dubois L, Peeters S, Lieuwes NG, et al. Specific inhibition of carbonic anhydrase IX activity enhances the in vivo therapeutic effect of tumor irradiation. Radiother Oncol 2011;99(3): 424-31.
122
212. Liu Z, Radtke MA, Wong MQ, Lin KS, Yapp DT, Perrin DM. Dual mode fluorescent (18)F-PET tracers: efficient modular synthesis of rhodamine-[cRGD]2-[(18)F]-organotrifluoroborate, rapid, and high yielding one-step (18)F-labeling at high specific activity, and correlated in vivo PET imaging and ex vivo fluorescence. Bioconjug Chem 2014;25(11): 1951-62. 213. Vullo D, Franchi M, Gallori E, et al. Carbonic anhydrase inhibitors: inhibition of the tumor-associated isozyme IX with aromatic and heterocyclic sulfonamides. Bioorg Med Chem Lett 2003;13(6): 1005-9. 214. Thiry A, Ledecq M, Cecchi A, et al. Ligand-based and structure-based virtual screening to identify carbonic anhydrase IX inhibitors. Bioorg Med Chem 2009;17(2): 553-7. 215. Temperini C, Innocenti A, Scozzafava A, Parkkila S, Supuran CT. The coumarin-binding site in carbonic anhydrase accommodates structurally diverse inhibitors: the antiepileptic lacosamide as an example and lead molecule for novel classes of carbonic anhydrase inhibitors. J Med Chem 2010;53(2): 850-4. 216. Pastorekova S, Zatovicova M, Pastorek J. Cancer-associated carbonic anhydrases and their inhibition. Curr Pharm Des 2008;14(7): 685-98. 217. Carlin S, Khan N, Ku T, Longo VA, Larson SM, Smith-Jones PM. Molecular targeting of carbonic anhydrase IX in mice with hypoxic HT29 colorectal tumor xenografts. PLoS One 2010;5(5): e10857. 218. Rami M, Dubois L, Parvathaneni NK, et al. Hypoxia-targeting carbonic anhydrase IX inhibitors by a new series of nitroimidazole-sulfonamides/sulfamides/sulfamates. J Med Chem 2013;56(21): 8512-20. 219. Neri D, Supuran CT. Interfering with pH regulation in tumours as a therapeutic strategy. Nat Rev Drug Discov 2011;10(10): 767-77. 220. Lau J, Liu Z, Lin KS, et al. Trimeric Radiofluorinated Sulfonamide Derivatives to Achieve In Vivo Selectivity for Carbonic Anhydrase IX-Targeted PET Imaging. J Nucl Med 2015;56(9): 1434-40. 221. Casey JR, Morgan PE, Vullo D, Scozzafava A, Mastrolorenzo A, Supuran CT. Carbonic anhydrase inhibitors. Design of selective, membrane-impermeant inhibitors targeting the human tumor-associated isozyme IX. J Med Chem 2004;47(9): 2337-47. 222. Scozzafava A, Briganti F, Ilies MA, Supuran CT. Carbonic anhydrase inhibitors: synthesis of membrane-impermeant low molecular weight sulfonamides possessing in vivo selectivity for the membrane-bound versus cytosolic isozymes. J Med Chem 2000;43(2): 292-300. 223. Rami M, Cecchi A, Montero JL, et al. Carbonic anhydrase inhibitors: design of membrane-impermeant copper(II) complexes of DTPA-, DOTA-, and TETA-tailed sulfonamides targeting the tumor-associated transmembrane isoform IX. ChemMedChem 2008;3(11): 1780-8. 224. Rami M, Winum JY, Innocenti A, Montero JL, Scozzafava A, Supuran CT. Carbonic anhydrase inhibitors: copper(II) complexes of polyamino-polycarboxylamido aromatic/heterocyclic sulfonamides are very potent inhibitors of the tumor-associated isoforms IX and XII. Bioorg Med Chem Lett 2008;18(2): 836-41. 225. Dilworth JR, Pascu SI, Waghorn PA, et al. Synthesis of sulfonamide conjugates of Cu(II), Ga(III), In(III), Re(V) and Zn(II) complexes: carbonic anhydrase inhibition studies and cellular imaging investigations. Dalton Trans 2015;44(11): 4859-73. 226. Fani M, Andre JP, Maecke HR. 68Ga-PET: a powerful generator-based alternative to cyclotron-based PET radiopharmaceuticals. Contrast Media Mol Imaging 2008;3(2): 67-77.
123
227. Berry DJ, Ma Y, Ballinger JR, et al. Efficient bifunctional gallium-68 chelators for positron emission tomography: tris(hydroxypyridinone) ligands. Chem Commun (Camb) 2011;47(25): 7068-70. 228. Maecke HR, Hofmann M, Haberkorn U. (68)Ga-labeled peptides in tumor imaging. J Nucl Med 2005;46 Suppl 1: 172S-8S. 229. Mukai T, Suwada J, Sano K, Okada M, Yamamoto F, Maeda M. Design of Ga-DOTA-based bifunctional radiopharmaceuticals: two functional moieties can be conjugated to radiogallium-DOTA without reducing the complex stability. Bioorg Med Chem 2009;17(13): 4285-9. 230. Singh AN, Liu W, Hao G, et al. Multivalent bifunctional chelator scaffolds for gallium-68 based positron emission tomography imaging probe design: signal amplification via multivalency. Bioconjug Chem 2011;22(8): 1650-62. 231. Lin KS, Pan J, Amouroux G, et al. In vivo radioimaging of bradykinin receptor b1, a widely overexpressed molecule in human cancer. Cancer Res 2015;75(2): 387-93. 232. Burleigh A, McKinney S, Brimhall J, et al. A co-culture genome-wide RNAi screen with mammary epithelial cells reveals transmembrane signals required for growth and differentiation. Breast Cancer Research 2015;17. 233. Kassamali R, Sica DA. Acetazolamide: a forgotten diuretic agent. Cardiol Rev 2011;19(6): 276-8. 234. Carlin S, Zhang H, Reese M, Ramos NN, Chen Q, Ricketts SA. A comparison of the imaging characteristics and microregional distribution of 4 hypoxia PET tracers. J Nucl Med 2014;55(3): 515-21. 235. Lau J, Pan J, Zhang Z, et al. Synthesis and evaluation of (18)F-labeled tertiary benzenesulfonamides for imaging carbonic anhydrase IX expression in tumours with positron emission tomography. Bioorg Med Chem Lett 2014;24(14): 3064-8. 236. Sneddon D, Poulsen SA. Agents described in the Molecular Imaging and Contrast Agent Database for imaging carbonic anhydrase IX expression. J Enzyme Inhib Med Chem 2014;29(5): 753-63. 237. Peeters SG, Dubois L, Lieuwes NG, et al. [(18)F]VM4-037 MicroPET Imaging and Biodistribution of Two In Vivo CAIX-Expressing Tumor Models. Mol Imaging Biol 2015;17(5): 615-9. 238. Kohler G, Milstein C. Continuous cultures of fused cells secreting antibody of predefined specificity. Nature 1975;256(5517): 495-7. 239. Peters C, Brown S. Antibody-drug conjugates as novel anti-cancer chemotherapeutics. Biosci Rep 2015;35(4). 240. Larson SM, Carrasquillo JA, Cheung NK, Press OW. Radioimmunotherapy of human tumours. Nat Rev Cancer 2015;15(6): 347-60. 241. Seidel UJ, Schlegel P, Lang P. Natural killer cell mediated antibody-dependent cellular cytotoxicity in tumor immunotherapy with therapeutic antibodies. Front Immunol 2013;4: 76. 242. Lachmann P. Complement before molecular biology. Mol Immunol 2006;43(6): 496-508. 243. Gul N, van Egmond M. Antibody-Dependent Phagocytosis of Tumor Cells by Macrophages: A Potent Effector Mechanism of Monoclonal Antibody Therapy of Cancer. Cancer Res 2015;75(23): 5008-13.
124
244. Oosterwijk E, Ruiter DJ, Hoedemaeker PJ, et al. Monoclonal antibody G 250 recognizes a determinant present in renal-cell carcinoma and absent from normal kidney. Int J Cancer 1986;38(4): 489-94. 245. Oosterwijk-Wakka JC, Boerman OC, Mulders PF, Oosterwijk E. Application of monoclonal antibody G250 recognizing carbonic anhydrase IX in renal cell carcinoma. Int J Mol Sci 2013;14(6): 11402-23. 246. Chamie K, Klopfer P, Bevan P, et al. Carbonic anhydrase-IX score is a novel biomarker that predicts recurrence and survival for high-risk, nonmetastatic renal cell carcinoma: Data from the phase III ARISER clinical trial. Urol Oncol 2015;33(5): 204 e25-33. 247. Surfus JE, Hank JA, Oosterwijk E, et al. Anti-renal-cell carcinoma chimeric antibody G250 facilitates antibody-dependent cellular cytotoxicity with in vitro and in vivo interleukin-2-activated effectors. J Immunother Emphasis Tumor Immunol 1996;19(3): 184-91. 248. Ahlskog JK, Schliemann C, Marlind J, et al. Human monoclonal antibodies targeting carbonic anhydrase IX for the molecular imaging of hypoxic regions in solid tumours. Br J Cancer 2009;101(4): 645-57. 249. Xu C, Lo A, Yammanuru A, et al. Unique biological properties of catalytic domain directed human anti-CAIX antibodies discovered through phage-display technology. PLoS One 2010;5(3): e9625. 250. Chang DK, Moniz RJ, Xu Z, et al. Human anti-CAIX antibodies mediate immune cell inhibition of renal cell carcinoma in vitro and in a humanized mouse model in vivo. Mol Cancer 2015;14: 119. 251. Zatovicova M, Jelenska L, Hulikova A, et al. Carbonic anhydrase IX as an anticancer therapy target: preclinical evaluation of internalizing monoclonal antibody directed to catalytic domain. Curr Pharm Des 2010;16(29): 3255-63. 252. Abrahmsen L, Hoiden-Guthenberg I, Gunneriusson E. New polypeptides. Sweden, 2014. 253. Nuttall SD, Walsh RB. Display scaffolds: protein engineering for novel therapeutics. Curr Opin Pharmacol 2008;8(5): 609-15. 254. Vosjan MJ, Perk LR, Visser GW, et al. Conjugation and radiolabeling of monoclonal antibodies with zirconium-89 for PET imaging using the bifunctional chelate p-isothiocyanatobenzyl-desferrioxamine. Nat Protoc 2010;5(4): 739-43. 255. Buckley RG, Searle F. An efficient method for labelling antibodies with 111In. FEBS Lett 1984;166(1): 202-4. 256. Fairweather DS, Bradwell AR, Dykes PW, Vaughan AT, Watson-James SF, Chandler S. Improved tumour localisation using indium-111 labelled antibodies. Br Med J (Clin Res Ed) 1983;287(6386): 167-70. 257. Vallabhajosula S, Kuji I, Hamacher KA, et al. Pharmacokinetics and biodistribution of 111In- and 177Lu-labeled J591 antibody specific for prostate-specific membrane antigen: prediction of 90Y-J591 radiation dosimetry based on 111In or 177Lu? J Nucl Med 2005;46(4): 634-41. 258. Pan MH, Gao DW, Feng J, et al. Biodistributions of 177Lu- and 111In-labeled 7E11 antibodies to prostate-specific membrane antigen in xenograft model of prostate cancer and potential use of 111In-7E11 as a pre-therapeutic agent for 177Lu-7E11 radioimmunotherapy. Mol Imaging Biol 2009;11(3): 159-66. 259. Kong G, Johnston V, Ramdave S, Lau E, Rischin D, Hicks RJ. High-administered activity In-111 octreotide therapy with concomitant radiosensitizing 5FU chemotherapy for treatment of
125
neuroendocrine tumors: preliminary experience. Cancer Biother Radiopharm 2009;24(5): 527-33. 260. Costantini DL, Bateman K, McLarty K, Vallis KA, Reilly RM. Trastuzumab-resistant breast cancer cells remain sensitive to the auger electron-emitting radiotherapeutic agent 111In-NLS-trastuzumab and are radiosensitized by methotrexate. J Nucl Med 2008;49(9): 1498-505. 261. Williams SP. Tissue distribution studies of protein therapeutics using molecular probes: molecular imaging. AAPS J 2012;14(3): 389-99. 262. Mukai T, Namba S, Arano Y, et al. Synthesis and evaluation of a monoreactive DOTA derivative for indium-111-based residualizing label to estimate protein pharmacokinetics. J Pharm Pharmacol 2002;54(8): 1073-81. 263. Misri R, Saatchi K, Ng SS, Kumar U, Hafeli UO. Evaluation of (111)In labeled antibodies for SPECT imaging of mesothelin expressing tumors. Nucl Med Biol 2011;38(6): 885-96. 264. Fang J, Nakamura H, Maeda H. The EPR effect: Unique features of tumor blood vessels for drug delivery, factors involved, and limitations and augmentation of the effect. Adv Drug Deliv Rev 2011;63(3): 136-51. 265. Brouwers AH, van Eerd JE, Frielink C, et al. Optimization of radioimmunotherapy of renal cell carcinoma: labeling of monoclonal antibody cG250 with 131I, 90Y, 177Lu, or 186Re. J Nucl Med 2004;45(2): 327-37. 266. Brouwers A, Verel I, Van Eerd J, et al. PET radioimmunoscintigraphy of renal cell cancer using 89Zr-labeled cG250 monoclonal antibody in nude rats. Cancer Biother Radiopharm 2004;19(2): 155-63. 267. Cheal SM, Punzalan B, Doran MG, et al. Pairwise comparison of 89Zr- and 124I-labeled cG250 based on positron emission tomography imaging and nonlinear immunokinetic modeling: in vivo carbonic anhydrase IX receptor binding and internalization in mouse xenografts of clear-cell renal cell carcinoma. Eur J Nucl Med Mol Imaging 2014;41(5): 985-94. 268. Hoeben BA, Kaanders JH, Franssen GM, et al. PET of hypoxia with 89Zr-labeled cG250-F(ab')2 in head and neck tumors. J Nucl Med 2010;51(7): 1076-83. 269. Altai M, Perols A, Karlstrom AE, et al. Preclinical evaluation of anti-HER2 Affibody molecules site-specifically labeled with 111In using a maleimido derivative of NODAGA. Nucl Med Biol 2012;39(4): 518-29. 270. Ahlgren S, Wallberg H, Tran TA, et al. Targeting of HER2-expressing tumors with a site-specifically 99mTc-labeled recombinant affibody molecule, ZHER2:2395, with C-terminally engineered cysteine. J Nucl Med 2009;50(5): 781-9. 271. Stewart BN, Wild CP. World Cancer Report 2014. Lyon, France: International Agency for Research on Cancer, 2014. 272. McIntyre A, Patiar S, Wigfield S, et al. Carbonic anhydrase IX promotes tumor growth and necrosis in vivo and inhibition enhances anti-VEGF therapy. Clin Cancer Res 2012;18(11): 3100-11. 273. Siolas D, Hannon GJ. Patient-derived tumor xenografts: transforming clinical samples into mouse models. Cancer Res 2013;73(17): 5315-9. 274. Tentler JJ, Tan AC, Weekes CD, et al. Patient-derived tumour xenografts as models for oncology drug development. Nat Rev Clin Oncol 2012;9(6): 338-50. 275. Basavaraj S, Betageri GV. Can formulation and drug delivery reduce attrition during drug discovery and development-review of feasibility, benefits and challenges. Acta Pharm Sin B 2014;4(1): 3-17.
126
276. Laurence VM, Ward R, Dennis IF, Bleehen NM. Carbogen breathing with nicotinamide improves the oxygen status of tumours in patients. Br J Cancer 1995;72(1): 198-205. 277. Robinson SP, Howe FA, Stubbs M, Griffiths JR. Effects of nicotinamide and carbogen on tumour oxygenation, blood flow, energetics and blood glucose levels. Br J Cancer 2000;82(12): 2007-14. 278. Janssens GO, Rademakers SE, Terhaard CH, et al. Accelerated radiotherapy with carbogen and nicotinamide for laryngeal cancer: results of a phase III randomized trial. J Clin Oncol 2012;30(15): 1777-83. 279. Wulbrand C, Seidl C, Gaertner FC, et al. Alpha-particle emitting 213Bi-anti-EGFR immunoconjugates eradicate tumor cells independent of oxygenation. PLoS One 2013;8(5): e64730. 280. Mulford DA, Scheinberg DA, Jurcic JG. The promise of targeted {alpha}-particle therapy. J Nucl Med 2005;46 Suppl 1: 199S-204S. 281. Ercan MT, Caglar M. Therapeutic radiopharmaceuticals. Curr Pharm Des 2000;6(11): 1085-121. 282. O'Donoghue JA. Strategies for selective targeting of Auger electron emitters to tumor cells. J Nucl Med 1996;37(4 Suppl): 3S-6S. 283. O'Donoghue JA, Wheldon TE. Targeted radiotherapy using Auger electron emitters. Phys Med Biol 1996;41(10): 1973-92. 284. Krishnamurthy GT, Swailem FM, Srivastava SC, et al. Tin-117m(4+)DTPA: pharmacokinetics and imaging characteristics in patients with metastatic bone pain. J Nucl Med 1997;38(2): 230-7. 285. Srivastava SC. The role of electron-emitting radiopharmaceuticals in the palliative treatment of metastatic bone pain and for radiosynovectomy: applications of conversion electron emitter Tin-117m Braz Arch Biol Technol 2007;50: 49-62. 286. Srivastava SC, Atkins HL, Krishnamurthy GT, et al. Treatment of metastatic bone pain with tin-117m Stannic diethylenetriaminepentaacetic acid: a phase I/II clinical study. Clin Cancer Res 1998;4(1): 61-8. 287. Stevenson NR, St. George G, Simon J, et al. Methods of producing high specific activity Sn-117m with commercial cyclotrons. J Radioanal Nucl Chem 2015;305: 99-108. 288. Price EW, Orvig C. Matching chelators to radiometals for radiopharmaceuticals. Chem Soc Rev 2014;43(1): 260-90. 289. Atkins HL, Mausner LF, Srivastava SC, Meinken GE, Cabahug CJ, D'Alessandro T. Tin-117m(4+)-DTPA for palliation of pain from osseous metastases: a pilot study. J Nucl Med 1995;36(5): 725-9. 290. Holbein ME. Understanding FDA regulatory requirements for investigational new drug applications for sponsor-investigators. J Investig Med 2009;57(6): 688-94. 291. Stabin MG, Sparks RB, Crowe E. OLINDA/EXM: the second-generation personal computer software for internal dose assessment in nuclear medicine. J Nucl Med 2005;46(6): 1023-7. 292. Lam K, Chan C, Done SJ, Levine MN, Reilly RM. Preclinical pharmacokinetics, biodistribution, radiation dosimetry and acute toxicity studies required for regulatory approval of a Clinical Trial Application for a Phase I/II clinical trial of (111)In-BzDTPA-pertuzumab. Nucl Med Biol 2015;42(2): 78-84.
127
Appendix
This appendix lists awards received, and publications that were published, were accepted, or currently under review, for my graduate degree. AWARDS AND SCHOLARSHIPS 2015 BC Cancer Agency Lloyd Skarsgard Research Excellence Prize 2015 UBC Interdisciplinary Graduate Student Network Travel Award 2014 UBC Faculty of Graduate Studies Travel Award 2014 World Molecular Imaging Congress Student Travel Stipend 2014 UBC Faculty of Medicine Graduate Award 2014-2017 UBC Four Year Doctoral Fellowship 2014-2016 CIHR Doctoral Award - Frederick Banting and Charles Best Canada Graduate
Scholarships 2013 Canadian Cancer Society Research Institute Travel Award 2013 CIHR Institute of Cancer Research Travel Award 2013 BC Cancer Foundation John Jambor Knowledge Fund 2013 International Symposium on Radiopharmaceutical Sciences Travel Bursary 2013 CIHR Institute Community Support Travel Award 2013 UBC Interdisciplinary Oncology Program Travel Award 2013 UBC College for Interdisciplinary Studies Graduate Award 2012-2016 RIX Family Leading Edge Student Award 2011 UBC Graduate Entrance Scholarship PUBLICATIONS Published Refereed Journal Articles
1) Lau J┼, Zhang Z┼, Jenni S, Kuo HT, Liu Z, Vullo D, Supuran CT, Dedhar S, Lin KS, Bénard F. “PET imaging of carbonic anhydrase IX expression in HT29 tumour xenograft mice with 68Ga-labeled benzenesulfonamides,” Molecular Pharmaceutics, 2016, 13(3): 1137–1146.
2) Zhang Z, Jenni S, Zhang C, Merkens H, Lau J, Liu Z, Perrin DM, Bénard F, Lin KS. “Synthesis and evaluation of 18F-trifluoroborate derivatives of triphenlyphosphonium for myocardial perfusion imaging,” Bioorganic & Medicinal Chemistry Letters, 2016; 26(7):1675-1679.
3) Zhang Z, Lau J, Kuo HT, Zhang C, Hundal-Jabal N, Colpo N, Bénard F, Lin KS. “Synthesis and evaluation of 18F-labeled 4-nitrobenzyl derivatives for imaging tumor hypoxia with positron emission tomography: comparison of 2-[18F]fluoroethyl carbonate and 2-[18F]fluoroethyl carbamate,” Bioorganic & Medicinal Chemistry Letters, 2016; 26(2): 584-588.
4) Lau J┼, Liu Z┼, Lin KS, Pan J, Zhang Z, Vullo D, Supuran CT, Perrin DM, Bénard F. “Trimeric radiofluorinated sulfonamide derivatives to achieve in vivo selectivity for carbonic anhydrase IX-targeted PET imaging,” Journal of Nuclear Medicine, 2015; 56(9): 1434-1440.
128
5) Lin KS, Amouroux G, Pan J, Zhang Z, Jenni S, Lau J, Liu Z, Hundal-Jabal N, Colpo N, Bénard F. “Comparative Studies of Three Gallium-68-labeled [des-Arg10]Kallidin Derivatives for Imaging Bradykinin B1 Receptor Expression with Positron Emission Tomography,” Journal of Nuclear of Medicine, 2015; 56(4): 622-627.
6) Lin KS, Pan J, Amouroux G, Turashvili G, Mesak F, Hundal-Jabal N, Pourghiasian M, Lau J, Jenni S, Aparicio SJ, Bénard F. “In vivo imaging of bradykinin receptor B1 using radiolabeled peptides,” Cancer Research, 2015; 75(2): 387- 393.
7) Liu Z, Amouroux G, Zhang Z, Pan J, Hundal-Jabal N, Colpo N, Lau J, Perrin DM, Bénard F, Lin KS. “18F-Trifluoroborate Derivatives of [Des-Arg10]Kallidin for Imaging Bradykinin B1 Receptor Expression with Positron Emission Tomography,” Molecular Pharmaceutics, 2015; 12(3): 974-982.
8) Liu Z, Pourghiasian M, Radtke A, Lau J, Pan J, Dias GM, Yapp D, Lin KS, Bénard F, Schaffer P, Perrin DM. “An Organotrifluoroborate for Broadly Applicable One-step 18F-labelling,” Angewandte Chemie International Edition, 2014; 53(44): 11876-11880.
9) Lau J, Pan J, Zhang Z, Hundal N, Liu Z, Bénard F, Lin KS. “Synthesis and evaluation of 18F-labeled tertiary sulfonamides for imaging carbonic anhydrase IX expression in tumours with positron emission tomography,” Bioorganic & Medicinal Chemistry Letters, 2014; 24(14): 3064-3068.
10) Pan J, Lau J, Mesak F, Hundal N, Pourghiasian M, Liu Z, Bénard F, Shoukat D, Supuran C, Lin KS. “Synthesis and evaluation of 18F-labeled carbonic anhydrase IX inhibitors for imaging with positron emission tomography,” Journal of Enzyme Inhibition and Medicinal Chemistry, 2014; 29(2): 249-255.
11) Pan J, Pourghiasian M, Hundal N, Lau J, Bénard F, Shoukat D, Lin KS. “2-[18F]Fluoroethanol and 3-[18F]fluoropropanol: facile preparation, biodistribution in mice, and their application as nucleophiles in the synthesis of [18F]fluoroalkyl aryl ester and ether PET tracers,” Nuclear Medicine and Biology, 2013; 40(6): 850-857.
12) Li Y, Liu Z, Harwig CW, Pourghiasian M, Lau J, Lin KS, Schaffer P, Bénard F, Perrin DM. “18F-Click Labeling of a Bombesin Antagonist with an Alkyne-18F-ArBF3-: in vivo PET Imaging of Tumors Expressing the GRP-Receptor,” American Journal of Nuclear Medicine and Molecular Imaging, 2013; 3(1):57-70.
Manuscript in Review 13) Zhang C, Pan J, Lin KS, Dude I, Lau J, Merkens H, Jenni S, Guérin B, Bénard F.
“Targeting the neuropeptide Y1 receptor for cancer imaging by positron emission tomography using novel novel truncated peptides,” submitted to Molecular Pharmaceutics.
14) Croucher DR, Iconomou M, Hastings JF, Kennedy SP, Shearer RF, McKenna J, Wan A, Lau J, Aparicio S, Saunders DN. “Bimolecular complementation affinity purification (BiCAP) reveals dimer-specific protein interactions for ERBB2 dimers,” submitted to Science Signalling.
15) Zhang Z, Kuo HT, Lau J, Jenni S, Zhang C, Zeisler J, Bénard F, Lin KS. “Design, synthesis and evaluation of 18F-labeled bradykinin B1 receptor-targeting small molecules for PET imaging,” submitted to Bioorganic & Medicinal Chemistry Letters.
129
16) Zhang Z, Zhang C, Lau J, Colpo N, Bénard F, Lin KS. “One-step synthesis of 4-[18F]fluorobenzyltriphenylphosphonium cation for imaging with positron emission tomography,” submitted to Journal of Labelled Compounds and Radiopharmaceuticals.
┼ Denotes shared first author
Accepted Abstracts 1) Lau J, Kuo HT, Pan J, Zhang C, Lin KS, Bénard F. “Synthesis and evaluation of a 68Ga-
labeled affibody for imaging carbonic anhydrase IX expression,” accepted to The Annual Congress of the European Association of Nuclear Medicine, Barcelona, Spain, 2016.
2) Kuo HT, Pan J, Merkens H, Lau J, Zhang C, Liu Z, Perrin DM, Bénard F, Lin KS. “Synthesis and comparative evaluation of three 18F-AmBF3 derivatives of Glu-ureido-Lys for imaging PSMA expression in prostate cancer with positron emission tomography,” submitted to The Annual Congress of the European Association of Nuclear Medicine, Barcelona, Spain, 2016.
3) Lau J, Pan J, Kuo HT, Hundal-Jabal N, Lin KS, Bénard F. “Exploration of hyperbranched polyglycerols as an imaging scaffold for targeting CA-IX expression with SPECT,” accepted to The Annual Meeting of Society of Nuclear Medicine and Molecular Imaging, San Diego, California, USA, 2016.
4) Pan J, Nakai M, Lau J, Storr T, Bénard F, Lin KS. “Design, synthesis, and evaluation of technetium-99m labeled sulfocoumarin and benzenesulfonamide derivatives for imaging carbonic anhydrase IX expression with single-photon emission computed tomography,” accepted to The Annual Meeting of Society of Nuclear Medicine and Molecular Imaging, San Diego, California, USA, 2016.
5) Zhang Z, Jenni S, Zhang C, Lau J, Merkens H, Liu Z, Perrin DM, Bénard F, Lin KS. “Synthesis and comparative evaluation of four 18F-trifluoroborate derivatives of triphenylphosphonium for myocardial perfusion imaging,” accepted to The Annual Meeting of Society of Nuclear Medicine and Molecular Imaging, San Diego, California, USA, 2016.
6) Zhang C, Pan J, Lin KS, Dude I, Lau J, Merkens H, Jenni S, Guérin B, Bénard F. “Targeting the neuropeptide Y1 receptor with novel truncated peptides using positron emission tomography,” accepted to The Annual Meeting of Society of Nuclear Medicine and Molecular Imaging, San Diego, California, USA, 2016.
7) Kuo HT, Pan J, Lin KS, Merkens H, Lau J, Zhang C, Liu Z, Perrin DM, Bénard F. “Synthesis and Evaluation of 18F-AmBF3-PSMA Derivatives as PET Imaging Agents for Prostate Cancer,” accepted to The Annual Meeting of Society of Nuclear Medicine and Molecular Imaging, San Diego, California, USA, 2016.
8) Kuo HT, Pan J, Zhang C, Rousseau J, Lau J, Bénard F, Lin KS. “A novel AmBF3-succinimide prosthetic group for facile 18F-labeling of biomolecules,” accepted to The Annual Meeting of Society of Nuclear Medicine and Molecular Imaging, San Diego, California, USA, 2016.
9) Kuo HT, Zhang Z, Jenni S, Lau J, Zhang C, Bénard F, Lin KS. “Synthesis and evaluation of an 18F-labeled bradykinin B1 receptor-targeting small molecule for PET imaging,” accepted to The Annual Meeting of Society of Nuclear Medicine and Molecular Imaging, San Diego, California, USA, 2016.
130
10) Rousseau J, Dias GM, Ramogida CF, Lau J, English W, Vuckovic M, Lin KS, Schaffer P, Bénard F. “Optimizing conditions to minimize antibody requirements for 89Zr radiolabeling,” accepted to The Annual Meeting of Society of Nuclear Medicine and Molecular Imaging, San Diego, California, USA, 2016.
11) Lin KS, Pan J, Zhang Z, Lau J, Jenni S, Hundal-Jabal N, Colpo N, Liu Z, Perrin DM, Bénard F. “Application of the 18F-19F isotope exchange reaction on an ammoniomethyl trifluoroborate moiety for the design of tumor-targeting PET tracers,” accepted to the International Chemical Congress of Pacific Basin Societies, Honolulu, Hawaii, 2015.
12) Zhang Z, Lau J, Colpo N, Bénard F, Lin KS. “Radiosynthesis and evaluation of 2-[18F]fluoroethyl 4-nitrobenzyl carbonate for imaging tumor hypoxia with positron emission tomography,” accepted to the European Association of Nuclear Medicine, Hamburg, Germany, 2015
13) Lau J, Pan J, Zhang C, Zhang Z, Colpo N, Lin KS, Bénard F. “Synthesis and biological evaluation of a novel 18F-labeled sulfonamide for imaging carbonic anhydrase IX expression with PET,” accepted to the World Molecular Imaging Congress, Honolulu, Hawaii, 2015.
14) Zhang Z, Lau J, Colpo N, Bénard F, Lin KS. “Radiosynthesis and evaluation of 4-nitrobenzyl N-2-[18F]fluoroethyl carbamate for imaging tumor hypoxia with positron emission tomography,” accepted to the World Molecular Imaging Congress, Honolulu, Hawaii, 2015.
15) Zhang C, Pan J, Lau J, Colpo N, Jenni S, Park S, Lin KS, Bénard F. “In vitro and in vivo evaluation of a novel BVD15 analogue for neuropeptide Y receptor imaging with positron emission tomography,” accepted to the World Molecular Imaging Congress, Honolulu, Hawaii, 2015.
16) Dias GM, Lau J, Jenni S, Colpo N, Lin KS, Bénard F. “Antibody radiolabeing: Improving tumour contrast in vivo by blocking the neonatal Fc receptor with IgG,” accepted to the World Molecular Imaging Congress, Hawaii, USA, 2015.
17) Pan J, Lau J, Hundal-Jabal N, Zhang Z, Zhang C, Bénard F, Lin KS. “Synthesis and evaluation of a 18F-labled 1,3,5-triazine-substituted benzenesulfonamide for imaging carbonic anhydrase IX expression in tumors with positron emission tomography,” accepted to the World Molecular Imaging Congress, Hawaii, USA, 2015.
18) Lau J, Liu Z, Pan J, Zhang Z, Perrin DM, Lin KS, Bénard F. “Trimeric 18F-AmBF3-sulfonamides for imaging carbonic anhydrase IX expression,” accepted to Society of Nuclear Medicine and Molecular Imaging Annual Meeting, Baltimore, USA, 2015.
19) Perrin DM, Lin KS, Benard F, Yapp DT, Liu Z, Pourghiasian M, Lau J, Zhang Z, Jenni S. “A new 18F-RBF3 radioprosthetic for one step aqueous labeling of peptides and other ligands: meeting the challenge of radiosynthetic ease and preclinical impact i.e. high specific activity and high T:NT ratios,” accepted to Society of Nuclear Medicine and Molecular Imaging Annual Meeting, Baltimore, USA, 2015.
20) Lau J, Pan J, Mesak F, Hundal N, Pourghiasian M, Dias G, Dedhar S; Supuran C, Bénard F, Lin, KS. “Hyperbranched polyglycerols as a vector for molecular targeted imaging of carbonic anhydrase IX expression with SPECT,” accepted to World Molecular Imaging Conference, Seoul, Korea, 2014
21) Lau J, McDonald PC, Dias GM, Dedhar S, Lenferink A, Lin KS, O’Connor M, Bénard F.“SPECT imaging with novel 111In labeled anti-carbonic anhydrase IX monoclonal
131
antibodies:comparison between internalizing and non-internalizing antibodies,” accepted to Society of Nuclear Medicine and Molecular Imaging Annual Meeting, St. Louis, USA, 2014.
22) Lau J, Zhang Z, Hundal-Jabal N, Liu Z, Bénard F, Lin KS. “Synthesis and evaluation of monomeric, dimeric and trimeric benzenesulfonamide derivatives for imaging carbonic anhydrase IX with PET,” accepted to Society of Nuclear Medicine and Molecular Imaging Annual Meeting, St. Louis, USA, 2014.
23) Dias GM, Zhang Z, Lau J, Bénard F, Lin KS. “Diethylenetriaminetetrahydroxamic acid: a potential chelator for labeling antibody with Zr-89 for PET imaging,” accepted to Society of Nuclear Medicine and Molecular Imaging Annual Meeting, St. Louis, USA, 2014.
24) Dias GM, Lau J, Bénard F, Lin KS. “99mTc(CO)3-DTPA-ABSA2: synthesis and evaluation for imaging carbonic anhydrase IX expression in hypoxic tumors with SPECT,” accepted to Society of Nuclear Medicine and Molecular Imaging Annual Meeting, St. Louis, USA, 2014.
25) Lau J, Pan J, Zhang Z, Hundal N, Liu Z, Bénard F, Lin KS. “Synthesis and evaluation of 18Flabeled tertiary sulfonamides for imaging carbonic anhydrase IX expression in tumors with positron emission tomography,” accepted to European Symposium on Radiopharmacy and Radiopharmaceuticals, Pamplona, Spain, 2014.
26) Lau J, Pan J, Zhang Z, Hundal N, Jenni S, Bénard F, Lin KS. “Radiosynthesis and biological evaluation of 3-[18F]fluoroabiraterone for imaging CYP17A1 expression with positron emission tomography,” accepted to European Symposium on Radiopharmacy and Radiopharmaceuticals, Pamplona, Spain, 2014.
27) Lau J, Pan J, Hundal N, Pourghiasian M, Liu Z, Bénard F, Lin KS. "Radiosynthesis and biological evaluation of an 18F-labeled tertiary substituted benzenesulfonamide for targeting carbonic anhydrase IX with positron emission tomography," accepted to Canadian Cancer Research Conference, Toronto, Canada, 2013.
28) Zhang Z, Lau J, Hundal N, Pourghiasian M, Jenni S, Dias G, Liu Z, Bénard F, Lin KS. "Radiosynthesis and biological evaluation of 68Ga-NOTGA-(AEBSA)3 for diagnostic molecular-targeted imaging of carbonic anhydrase IX in cancers," accepted to Canadian Cancer Research Conference, Toronto, Canada, 2013.
29) Liu Z, Amouroux G, Pan J, Pourghiasian M, Hundal N, Lau J, Zhang Z, Bénard F, Lin KS, Perrin D. “The first PET imaging study of an 18F-labeled B1R-targeting ligands via a “kit” [18F]B-F bond formation," accepted to Canadian Cancer Research Conference, Toronto, Canada, 2013
30) Lau J, Zhang Z, Hundal N, Algara T, Liu Z, Bénard F, Lin KS. “Radiosynthesis and biological evaluation of 68Ga-DOTA-AEBSA for imaging carbonic anhydrase IX expression with positron emission tomography,” accepted to World Molecular Imaging Conference, Savannah, Georgia, USA, 2013.
31) Liu Z, Lau J, Pan J, Pourghiasian M, Algara T, Perrin D, Bénard F, Lin KS. “Facile synthesis and biological evaluation of an 18F-labeled 4-(2-minoethyl)benzenesulfonamide (AEBS) trimer for imaging carbonic anhydrase IX expression with positron emission tomography,” accepted to World Molecular Imaging Conference, Savannah, Georgia, USA, 2013.
132
32) Liu Z, Amouroux G, Pan J, Pourghiasian M, Hundal N, Lau J, Dias G, Zhang Z, Bénard F, Lin KS, Perrin D. “First biological evaluation and facile radiosynthesis of an F-18 labeled peptide for imaging bradykinin B1 receptor expression with positron emission tomography,” accepted to World Molecular Imaging Conference, Savannah, Georgia, USA, 2013.
33) Pourghiasian M, Pan J, Lau J, Dias G, Hundal N, Liu Z, Bénard F, Lin KS. “Trapping of 2-[18F]fluoroacetyl-CoA in the cell: a promising strategy for imaging enzymatic activity with positron emission tomography,” accepted to World Molecular Imaging Conference, Savannah, Georgia, USA, 2013.
34) Pourghiasian M, Pan J, Hundal N, Lau J, Bénard F, Lin KS. “Zr-75 cell line: a promising tumor model for imaging somatostatin receptor SST2a expression in breast cancer by positron emission tomography,” accepted to World Molecular Imaging Conference, Savannah, Georgia, USA, 2013.
35) Zhang Z, Pourghiasian M, Pan J, Lau J, Hundal N, Bénard F, Lin KS. “Synthesis and evaluation of 21-[18F]fluoro-17α-hydroxyprogesterone for imaging the activity of CYP17A1 with positron emission tomography,” accepted to Annual Congress of the European Association of Nuclear Medicine, Lyon, France, 2013.
36) Pan J, Mesak F, Pourghiasian M, Hundal N, Lau J, Bénard F, Lin KS. “Successful imaging of human bradykinin B1 receptor expression in tumor xenografts in mice with positron emission tomography,” Journal of Nuclear Medicine, 2013; 54: 19P.
37) Pan J, Lau J, Hundal N, Pourghiasian M, Dedhar S, Supuran C, Bénard F, Lin KS. “Synthesis and evaluation of an 18F-labeled sulfonamide inhibitor for imaging carbonic anhydrase IX expression in cancers,” Journal of Nuclear Medicine, 2013; 54: 215P.
38) Pourghiasian M, Pan J, Lau J, Hundal N, Jenni S, Bénard F, Lin KS. “2-[18F]Fluoroethanol and 3-[18F]fluoropropanol: facile preparation, biodistribution in mice, and their application in the radiosynthesis of PET tracers,” Journal of Nuclear Medicine, 2013; 54: 221-222P.
39) Pan J, Mesak F, Pourghiasian M, Hundal N, Lau J, Bénard F, Lin KS. “Design, synthesis and evaluation of a gallium-68-labeled bradykinin derivative for imaging B1 receptor expression in cancers with positron emission tomography,” Journal of Labelled Compounds and Radiopharmaceuticals, 2013; 56: S393.
40) Lau J, Pan J, Mesak F, Hundal N, Pourghiasian M, Dias G, Dedhar S; Supuran C, Bénard F, Lin, KS. “Synthesis and evaluation of an 18F-labelled coumarin derivative for imaging carbonic anhydrase IX expression in cancers with Positron Emission Tomography,” Journal of Labelled Compounds and Radiopharmaceuticals, 2013; 56: S405.
Oral Presentations
1) “Imaging carbonic anhydrase IX expression in hypoxic niches with different antigen recognition molecules”. Thursday Oncology Training Seminars, BC Cancer Research Centre, Vancouver, Canada, December 4th 2015.
2) “Trimeric 18F-AmBF3-sulfonamides for imaging carbonic anhydrase IX expression”. Society of Nuclear Medicine and Molecular Imaging Annual Meeting, Baltimore, USA, June 10th 2015.
133
3) “Targeting tumour microenvironment: Development of carbonic anhydrase IX imaging agents”. Thursday Oncology Training Seminars, BC Cancer Research Centre, Vancouver, Canada, November 20th 2014.
4) “Synthesis and evaluation of monomeric, dimeric and trimeric benzenesulfonamide derivatives for imaging carbonic anhydrase IX with PET”. Society of Nuclear Medicine and Molecular Imaging Annual Meeting, St. Louis, USA, June 10th 2014.
5) “Targeting carbonic anhydrase IX expression non-invasively using PET/CT and SPECT/CT modalities”. Thursday Oncology Training Seminars, BC Cancer Research Centre, Vancouver, Canada, May 1st 2014.
6) “Synthesis and evaluation of 18F-labeled tertiary sulfonamides for imaging carbonic anhydrase IX expression in tumors with positron emission tomography”. European Symposium on Radiopharmacy and Radiopharmaceuticals, Pamplona, Spain, April 25th 2014.
7) “Radiosynthesis and biological evaluation of 3-[18F]fluoroabiraterone for imaging CYP17A1 expression with positron emission tomography”. European Symposium on Radiopharmacy and Radiopharmaceuticals, Pamplona, Spain, April 25th 2014.
8) “Molecular Targeted Imaging of Carbonic Anhydrase IX with Positron Emission Tomography”. Knowledge Translation Seminar, BC Cancer Research Centre, Vancouver, Canada, April 4th 2013.