target crashes and safety benefits estimation methodology
TRANSCRIPT

DOT HS 811 998 April 2014
Target Crashes and Safety Benefits Estimation Methodology For Pedestrian Crash Avoidance/Mitigation Systems

DISCLAIMER
This publication is distributed by the U.S. Department of Transportation, National Highway Traffic Safety Administration, in the interest of information exchange. The opinions, findings, and conclusions expressed in this publication are those of the authors and not necessarily those of the Department of Transportation or the National Highway Traffic Safety Administration. The United States Government assumes no liability for its contents or use thereof. If trade or manufacturers’ names or products are mentioned, it is because they are considered essential to the object of the publication and should not be construed as an endorsement. The United States Government does not endorse products or manufacturers.
Suggested APA Format Citation:
Yanagisawa, M., Swanson, E., & Najm, W. G. (2014, April). Target crashes and safety benefits estimation methodology for pedestrian crash avoidance/mitigation systems. (Report No. DOT HS 811 998). Washington, DC: National Highway Traffic Safety Administration

i
REPORT DOCUMENTATION PAGE Form Approved OMB No. 0704-0188
Public reporting burden for this collection of information is estimated to average 1 hour per response, including the time for reviewing instructions, searching existing data sources, gathering and maintaining the data needed, and completing and reviewing the collection of information. Send comments regarding this burden estimate or any other aspect of this collection of information, including suggestions for reducing this burden, to Washington Headquarters Services, Directorate for Information Operations and Reports, 1215 Jefferson Davis Highway, Suite 1204, Arlington, VA 22202-4302, and to the Office of Management and Budget, Paperwork Reduction Project (0704-0188), Washington, DC 20503.
1. AGENCY USE ONLY (Leave blank)
2. REPORT DATE
April 2014
3. REPORT TYPE AND DATES COVERED
4. TITLE AND SUBTITLE
Target Crashes and Safety Benefits Estimation Methodology for Pedestrian Crash Avoidance/Mitigation Systems
5. FUNDING NUMBERS
Inter-Agency Agreement
DTNH22-11-V-00055
HS2A 6. AUTHOR(S)
Mikio Yanagisawa, Elizabeth Swanson, and Wassim G. Najm
7. PERFORMING ORGANIZATION NAME(S) AND ADDRESS(ES)
John A. Volpe National Transportation Systems Center U.S. Department of Transportation Cambridge, MA 02142
8. PERFORMING ORGANIZATION REPORT NUMBER
DOT-VNTSC-NHTSA-13-02
9. SPONSORING/MONITORING AGENCY NAME(S) AND ADDRESS(ES)
National Highway Traffic Safety Administration 1200 New Jersey Avenue SE Washington, DC 20590
10. SPONSORING/MONITORING AGENCY REPORT NUMBER
DOT HS 811 998
11. SUPPLEMENTARY NOTES
12a. DISTRIBUTION/AVAILABILITY STATEMENT
Document is available to the public from the National Technical Information Service www.ntis.gov.
12b. DISTRIBUTION CODE
13. ABSTRACT
Through the analysis of national crash databases from the National Highway Traffic Safety Administration, pre-crash scenarios are identified, prioritized, and described for the development of objective tests for pedestrian crash avoidance/mitigation (PCAM) systems. PCAM systems address vehicle-pedestrian crashes where a light vehicle is moving forward on a collision path with a detected pedestrian. “Light vehicle” includes any passenger car, van, minivan, sport utility vehicle, or light pickup truck with a gross vehicle weight rating up to 10,000 pounds. These systems, through the use of driver warning, brake assist, or autonomous braking, will attempt to avoid, or at least mitigate the injury severity of an imminent crash with a pedestrian by reducing the speed of the vehicle prior to impact, thus resulting in a potential safety benefit. An analysis in terms of vehicle and pedestrian maneuvers identified four recommended scenarios to maximize potential safety benefits for PCAM systems. Simple safety benefit estimation is presented in terms of the methodology, equations, assumptions, and key parameters used to estimate potential system effectiveness and safety benefits. Safety benefits, in terms of pedestrian injuries avoided and pedestrian injuries mitigated, are expressed in terms of reductions in annual harm measures. 14. SUBJECT TERMS
Pedestrian, pedestrian crash avoidance/mitigation systems, pre-crash scenarios, light contributing factors, system effectiveness, harm measures, safety benefits
vehicles, 15. NUMBER OF PAGES
103
16. PRICE CODE
17. SECURITY CLASSIFICATION OF REPORT
Unclassified
18. SECURITY CLASSIFICATION OF THIS PAGE
Unclassified
19. SECURITY CLASSIFICATION OF ABSTRACT
Unclassified
20. LIMITATION OF ABSTRACT
NSN
7540-01-280-5500 Standard Form 298 (Rev. 2-89) Prescribed by ANSI Std. 239-18
298-102

ii
TABLE OF CONTENTS
1 Introduction ...........................................................................................................................1
1.1 Pedestrian Crash Problem ...................................................................................................... 1
1.2 Target Pedestrian Crashes ...................................................................................................... 2
1.3 Data Sources .......................................................................................................................... 3
1.3.1 General Estimates System .................................................................................................... 3
1.3.2 Fatality Analysis Reporting System ..................................................................................... 4
1.3.3 Pedestrian Crash Data Study ................................................................................................ 4
1.3.4 Not-in-Traffic Surveillance .................................................................................................. 4
1.4 Literature Review................................................................................................................... 5
1.4.1 Insurance Institute for Highway Safety ................................................................................ 5
1.4.2 Autonomous Emergency Braking Test Group ..................................................................... 6
1.4.3 National Traffic Safety and Environment Laboratory, Japan .............................................. 6
1.4.4 European Harm Functions .................................................................................................... 7
1.4.5 Advanced Forward-Looking Safety Systems ....................................................................... 8
1.4.6 National Highway Traffic Safety Administration ................................................................ 9
2 Identification and Prioritization of Pedestrian Pre-Crash Scenarios ............................10
2.1 Vehicle-Pedestrian Maneuver Matrix .................................................................................. 10
2.2 Physical Settings .................................................................................................................. 15
2.2.1 Intersection Type ................................................................................................................ 15
2.2.2 Roadway ............................................................................................................................. 16
2.2.3 Recommendations for Priority Scenarios ........................................................................... 17
3 Statistical Description of Priority Pedestrian Pre-Crash Scenarios...............................20
3.1 Environmental Factors ......................................................................................................... 21
3.1.1 Atmospheric Condition ...................................................................................................... 21
3.1.2 Light Condition .................................................................................................................. 23
3.1.3 Surface Condition ............................................................................................................... 23
3.2 Contributing Factors for Priority Scenarios ......................................................................... 26
3.2.1 Traffic Flow and Lanes ...................................................................................................... 26
3.2.2 Travel Speed and Speed Limit ........................................................................................... 30
3.2.3 Vision Obscured ................................................................................................................. 30

iii
3.2.4 Driver Alcohol Involvement .............................................................................................. 33
3.3 Pedestrian Characteristics .................................................................................................... 35
3.3.1 Pedestrian Age .................................................................................................................... 35
3.3.2 Pedestrian Gender ............................................................................................................... 37
3.3.3 Average Person Sizes ......................................................................................................... 37
3.3.4 Pedestrian Alcohol Involvement ........................................................................................ 39
3.3.5 Pedestrian Harm Function .................................................................................................. 41
4 Pedestrian Fatality Locations ............................................................................................43
5 Safety Benefit Estimation ...................................................................................................45
5.1 General Equation of Safety Benefits.................................................................................... 45
5.2 General Equation of System Effectiveness .......................................................................... 45
5.2.1 Assumptions ....................................................................................................................... 47
5.2.2 Crash Database Adjustment Factors ................................................................................... 47
5.3 Harm Measures .................................................................................................................... 48
5.3.1 Annual Harm ...................................................................................................................... 48
5.3.2 Harm Ratio ......................................................................................................................... 50
5.3.3 Average Harm Function ..................................................................................................... 51
5.3.4 Curve Fitting/ Smoothing of Average Harm Function ....................................................... 54
5.4 PCAM Objective Tests ........................................................................................................ 55
5.4.1 PCAM System Performance .............................................................................................. 56
5.5 Pedestrian Distribution......................................................................................................... 58
5.5.1 Determination of Test Performance Data Application ....................................................... 61
5.5.2 Distribution of Pedestrians in Baseline and PCAM Intervention Cases ............................ 62
5.6 System Effectiveness ........................................................................................................... 68
5.7 Potential Safety Benefits ...................................................................................................... 69
6 Conclusion and Recommendations ...................................................................................71
7 References ............................................................................................................................74
Appendix A ...................................................................................................................................76
Appendix B ...................................................................................................................................85
Appendix C ...................................................................................................................................87

iv
LIST OF FIGURES
Figure 1. Pedestrians Struck by Light Vehicles in the First Events of the Crashes by Year .......... 2 Figure 2. Target Pre-Crash Scenario Parameters ............................................................................ 3 Figure 3. Vehicle Maneuver for Striking Vehicles Within GES .................................................. 10 Figure 4. Pedestrian Maneuvers Within GES ............................................................................... 11 Figure 5. Vehicle Maneuver for Striking Vehicles Based on FARS ............................................ 14 Figure 6. Pedestrian Maneuvers/Contributing Factors Based on FARS....................................... 14 Figure 7. Recommended Scenarios for PCAM Priority Pre-Crash Scenarios .............................. 18 Figure 8. Atmospheric Conditions by Priority Scenarios for All GES Cases .............................. 22 Figure 9. Atmospheric Conditions by Priority Scenarios for GES Fatalities ............................... 22 Figure 10. Atmospheric Conditions by Priority Scenarios for FARS Cases ................................ 22 Figure 11. Light Conditions by Priority Scenarios for All GES Cases ........................................ 24 Figure 12. Light Conditions by Priority Scenarios for GES Fatalities ......................................... 24 Figure 13. Light Conditions by Priority Scenarios for FARS ...................................................... 24 Figure 14. Surface Conditions by Priority Scenarios for All GES Cases ..................................... 25 Figure 15. Surface Conditions by Priority Scenarios for GES Fatalities ...................................... 25 Figure 16. Surface Conditions by Priority Scenarios for FARS Cases......................................... 25 Figure 17. Traffic Flow by Priority Scenarios for All GES Cases ............................................... 27 Figure 18. Traffic Flow by Priority Scenarios for GES Fatalities ................................................ 28 Figure 19. Traffic Flow by Priority Scenarios for FARS Cases ................................................... 29 Figure 20. Vision Obstructions by Priority Scenarios for All GES Cases.................................... 32 Figure 21. Vision Obstructions by Priority Scenarios for GES Fatalities .................................... 32 Figure 22. Vision Obstructions by Priority Scenarios for FARS Cases ....................................... 32 Figure 23. Vision Obstructions by Priority Scenarios for PCDS Cases ....................................... 32 Figure 24. Driver Distraction by Priority Scenarios for All GES Cases ...................................... 34 Figure 25. Driver Distraction by Priority Scenarios for GES Fatalities ....................................... 34 Figure 26. Pedestrian Age by Priority Scenario for All GES Cases ............................................. 36 Figure 27. Pedestrian Age by Priority Scenario for GES Fatalities .............................................. 36 Figure 28. Pedestrian Age by Priority Scenario for FARS Cases ................................................. 36 Figure 29. Person Average Height Based on CDS Data ............................................................... 38 Figure 30. Person Average Weight Based on CDS Data .............................................................. 38 Figure 31. Pedestrian Impairment by Priority Scenarios for All GES Cases ............................... 40 Figure 32. Pedestrian Impairment by Priority Scenarios for GES Fatalities ................................ 40 Figure 33. Harm Function for Priority Scenario 1 ........................................................................ 42 Figure 34. Harm Function for Priority Scenario 2 ........................................................................ 42 Figure 35. Harm Function for Priority Scenario 3 ........................................................................ 42 Figure 36. Harm Function for Priority Scenario 4 ........................................................................ 42 Figure 37. Pedestrian Fatalities Google Map for Alabama ........................................................... 44 Figure 38. Comparison of Pedestrian Distributions by KABCO Scale Between PCDS and GES ............................................................................................................................................... 53

v
Figure 39. Average Speed Reduction (mph) for Vehicle C in S1 Scenarios ................................ 58 Figure 40. Smoothed Baseline and PCAM Pedestrian Distribution for S1 Scenario With Pedestrian Running and No Obstruction for Actual PCDS Cases ................................................ 67 Figure 41. Smoothed Baseline and PCAM Pedestrian Distribution for S1 Scenario With Pedestrian Running and No Obstruction for Weighted PCDS Cases ........................................... 67 Figure 42. Smoothed Baseline and PCAM Pedestrian Distribution for S1 Scenario With Pedestrian Walking and No Obstruction for Actual PCDS Cases ................................................ 68 Figure 43. Smoothed Baseline and PCAM Pedestrian Distribution for S1 Scenario With Pedestrian Walking and No Obstruction for Weighted PCDS Cases ........................................... 68 Figure 44. Smoothed Baseline and PCAM-Applicable Pedestrian Distribution for Actual PCDS Counts for S2 Scenario, Pedestrian Walking, No Obstruction .......................................... 87 Figure 45. Smoothed Baseline and PCAM-Applicable Pedestrian Distribution for Weighted PCDS Cases for S2 Scenario, Pedestrian Walking, No Obstruction ............................................ 87 Figure 46. Smoothed Baseline and PCAM-Applicable Pedestrian Distribution for Actual PCDS Counts for S3 Scenario, Pedestrian Walking, No Obstruction .......................................... 88 Figure 47. Smoothed Baseline and PCAM-Applicable Pedestrian Distribution for Weighted PCDS Cases for S3 Scenario, Pedestrian Walking, No Obstruction ............................................ 88

vi
List of Tables
Table 1. Target Pedestrian Crashes From National Databases ....................................................... 2 Table 2. Vehicle-Pedestrian Pre-Crash Scenarios Ranked by GES Frequency for PCAM Target Crashes .............................................................................................................................. 12 Table 3. Vehicle-Pedestrian Pre-Crash Scenarios Ranked by Direct Economic Cost and Functional Years Lost for PCAM Target Crashes Based on 2005-2009 GES ............................. 13 Table 4. Intersection Type for PCAM Target Pedestrians ............................................................ 15 Table 5. Pedestrian Location for PCAM Target Crashes ............................................................. 16 Table 6. Pedestrians in Relation to the Roadway in PCAM Target Crashes ................................ 16 Table 7. Roadway Alignment for PCAM Target Crashes ............................................................ 17 Table 8. Roadway Profile for PCAM Target Crashes .................................................................. 17 Table 9. Economic Cost, Functional Years Lost, and Weight of GES Cases for the Four Priority Pedestrian Pre-Crash Scenarios ....................................................................................... 19 Table 10. Pedestrian Fatalities in FARS by the Four Priority Pre-Crash Scenarios ..................... 20 Table 11. Pedestrian Direction in PCDS by the Four Priority Pre-Crash Scenarios .................... 20 Table 12. Number of Travel Lanes by Priority Scenarios for All GES Cases on Non-Divided Roadways ...................................................................................................................................... 27 Table 13. Number of Travel Lanes by Priority Scenarios for GES Fatalities on Non-Divided Roadways ...................................................................................................................................... 28 Table 14. Number of Travel Lanes by Priority Scenarios for FARS Cases on Non-Divided Roadways ...................................................................................................................................... 29 Table 15. Breakdown of GES Cases for Speed-Related Factor by Priority Scenarios ................. 30 Table 16. Alcohol Involvement by Priority Scenarios for GES Vehicle-Pedestrian Crashes ...... 33 Table 17. Pedestrian Gender by Priority Scenarios in GES and FARS ........................................ 37 Table 18. Pedestrian Alcohol Involvement by Priority Scenarios Based on GES Data ............... 39 Table 19. 2008-2010 United States Pedestrian Fatality Counts ................................................... 44 Table 20. Adjustment Factors for PCDS Pedestrian Case Counts................................................ 48 Table 21. KABCO-MAIS Injury Level Conversion ..................................................................... 49 Table 22. Pedestrian Crash Annual Harm Measures by Priority Scenarios Based on 2009 GES ...................................................................................................................................... 50 Table 23. Estimation of αm Based on 2009 GES Statistics .......................................................... 50 Table 24. Estimation of αm Based on PCDS Data ........................................................................ 51 Table 25. Average Harm Functions Based on Actual PCDS Case Counts .................................. 52 Table 26. Adjustment Factors of PCDS Pedestrian Case Counts for Average Harm Estimation ..................................................................................................................................... 52 Table 27. Average Harm Functions Based on Weighted PCDS Case Counts .............................. 53 Table 28. Smoothed Average Harm Functions ............................................................................. 55 Table 29. PCAM Functional Tests Performed by CAMP ............................................................ 56

vii
Table 30. Speed Reduction Results for Vehicle C in an S1 Scenario With a Running Pedestrian ...................................................................................................................................... 57 Table 31. Speed Reduction Results for Vehicle C in an S1 Scenario With a Walking Pedestrian ...................................................................................................................................... 57 Table 32. Distribution of Pedestrians by Impact Speed in Target and PCAM-Applicable Crashes .......................................................................................................................................... 59 Table 33. Distribution of Pedestrians by Priority Pre-Scenarios in Baseline PCAM-Applicable Crashes Based on Actual PCDS Case Counts .............................................................................. 60 Table 34. Distribution of Pedestrians by Priority Pre-Crash Scenarios in Baseline PCAM-Applicable Crashes Based on Weighted PCDS Cases .................................................................. 61 Table 35. Unsmoothed Baseline and PCAM-Applicable Pedestrian Distribution for S1 Scenario, Pedestrian Running, No Obstruction ....................................................................... 63 Table 36. Unsmoothed Baseline and PCAM-Applicable Pedestrian Distribution for S1 Scenario, Pedestrian Walking, No Obstruction ....................................................................... 64 Table 37. Smoothed Baseline and PCAM-Applicable Pedestrian Distribution for S1 Scenario With Pedestrian Running and No Obstruction ......................................................... 65 Table 38. Smoothed Baseline and PCAM-Applicable Pedestrian Distribution for S1 Scenario With Pedestrian Walking and No Obstruction ......................................................... 66 Table 39. Estimates of PCAM System Effectiveness in S1 Scenario........................................... 69 Table 40. System Benefits Estimation for S1 Scenario With No Obstruction and Pedestrian Running ......................................................................................................................................... 70 Table 41. System Benefits Estimation for S1 Scenario With No Obstruction and Pedestrian Walking ......................................................................................................................................... 70 Table 42. GES All Cases - Travel Speed Versus Posted Speed Limit for S1 Pre-Crash Scenario......................................................................................................................................... 76 Table 43. GES All Cases - Travel Speed Versus Posted Speed Limit for S1 Pre-Crash Scenario Percentage ...................................................................................................................... 76 Table 44. GES All Cases - Travel Speed Versus Posted Speed Limit for S2 Pre-Crash Scenario......................................................................................................................................... 77 Table 45. GES All Cases - Travel Speed Versus Posted Speed Limit for S2 Pre-Crash Scenario Percentage ..................................................................................................................................... 77 Table 46. GES All Cases - Travel Speed Versus Posted Speed Limit for S3 Pre-Crash Scenario......................................................................................................................................... 77 Table 47. GES All Cases - Travel Speed Versus Posted Speed Limit for S3 Pre-Crash Scenario Percentage ...................................................................................................................... 78 Table 48. GES All Cases - Travel Speed Versus Posted Speed Limit for S4 Pre-Crash Scenario......................................................................................................................................... 78 Table 49. GES All Cases - Travel Speed Versus Posted Speed Limit for S4 Pre-Crash Scenario Percentage ...................................................................................................................... 78

viii
Table 50. GES Fatalities Only - Travel Speed Versus Posted Speed Limit for S1 Pre-Crash Scenario......................................................................................................................................... 79 Table 51. GES Fatalities Only - Travel Speed Versus Posted Speed Limit for S1 Pre-Crash Scenario Percentage ...................................................................................................................... 79 Table 52. GES Fatalities Only - Travel Speed Versus Posted Speed Limit for S4 Pre-Crash Scenario......................................................................................................................................... 80 Table 53. GES Fatalities Only - Travel Speed Versus Posted Speed Limit for S4 Pre-Crash Scenario Percentage ...................................................................................................................... 80 Table 54. FARS Travel Speed Versus Posted Speed Limit for S1 Pre-Crash Scenario ............... 81 Table 55. FARS Travel Speed Versus Posted Speed Limit for S1 Pre-Crash Scenario Percentage ..................................................................................................................................... 81 Table 56. FARS Travel Speed Versus Posted Speed Limit for S2 Pre-Crash Scenario ............... 82 Table 57. FARS Travel Speed Versus Posted Speed Limit for S2 Pre-Crash Scenario Percentage ..................................................................................................................................... 82 Table 58. FARS Travel Speed Versus Posted Speed Limit for S3 Pre-Crash Scenario ............... 83 Table 59. FARS Travel Speed Versus Posted Speed Limit for S3 Pre-Crash Scenario Percentage ..................................................................................................................................... 83 Table 60. FARS Travel Speed Versus Posted Speed Limit for S4 Pre-Crash Scenario ............... 84 Table 61. FARS Travel Speed Versus Posted Speed Limit for S4 Pre-Crash Scenario Percentage ..................................................................................................................................... 84 Table 62. Links to State Fatality Maps ......................................................................................... 85
ix
LIST OF ACRONYMS
AEB autonomous emergency braking Bm reduction in annual harm measure m CAMP Crash Avoidance Metrics Partnership CDS Crashworthiness Data System CIB crash imminent braking DEC direct economic cost DBS dynamic brake support FARS Fatality Analysis Reporting System FYL functional years lost GES General Estimates System GIDAS German In-Depth Accident Study GPS global positioning system GVWR gross vehicle weight rating hm(i) average harm m to a pedestrian struck at impact speed bin Hm(Baseline) total harm m cost without PCAM intervention (baseline harm) Hm(PCAM) total harm m cost with PCAM intervention IIHS Insurance Institute for Highway Safety ISn impact speed bin n J-SAE Society of Automotive Engineers of Japan m harm measure MAIS Maximum Abbreviated Injury Scale NHTSA National Highway Traffic Safety Administration NiTS Not-in-Traffic Surveillance Nm annual value of harm measure m in target crash scenario
OBaseline(i) proportion of pedestrians struck by baseline vehicles at impact speed bin i
OPCAM(i) proportion of pedestrians struck by PCAM-equipped vehicles at impact speed bin i
OTS On-the-Spot, a British crash-reporting system pBA PCAM activation rate PCAM pedestrian crash avoidance/mitigation PCDS Pedestrian Crash Data Study
ppedinj(PCAM) probability of pedestrian struck by the front-end of a moving vehicle equipped with PCAM
ppedinj(Baseline) probability of pedestrian struck by the front-end of a moving vehicle not equipped with PCAM
ROAD Real-World Operational Assessment Data

x
SEm PCAM effectiveness in reducing annual harm measure m S1 Scenario 1, Vehicle Going Straight & Pedestrian Crossing Road S2 Scenario 2, Vehicle Turning Right & Pedestrian Crossing Road S3 Scenario 3, Vehicle Turning Left & Pedestrian Crossing Road S4 Scenario 4, Vehicle Going Straight & Pedestrian Along/Against Traffic TTC time-to-collision vFSS Advanced Forward-Looking Safety Systems
αm ratio of harm value m in PCAM-applicable crash scenario in target crash scenario

xi
EXECUTIVE SUMMARY
This report presents the results of a research effort in support of a collaborative project aimed at preventing or reducing the severity of vehicle-pedestrian crashes through the use of pedestrian crash avoidance/mitigation (PCAM) systems. PCAM systems use forward-looking detection sensors, typically RADAR and/or cameras, that will detect pedestrians in front of a forward-moving vehicle. PCAM systems warn the driver of an imminent crash with a pedestrian, provide brake assist to the driver, and/or apply automatic braking, to avoid or mitigate the injury severity of vehicle-pedestrian crashes. This analysis is focused on vehicle-pedestrian crashes involving a light vehicle moving forward and contacting a pedestrian in the first harmful event. “Light vehicle” includes any passenger car, van, minivan, sport utility vehicle, or light pickup truck with a gross vehicle weight rating up to 10,000 pounds. The most frequent and fatal pre-crash scenarios were identified through the analysis of national crash databases from the National Highway Traffic Safety Administration during 2005 to 2009. Pre-crash scenarios are prioritized and selected for the development of objective tests to estimate the preliminary system effectiveness of prototype PCAM systems. The following four pre-crash scenarios, in terms of vehicle and pedestrian maneuvers, are recommended to maximize the potential safety benefits of PCAM systems.
S1 - Vehicle going straight and pedestrian crossing the road S2 - Vehicle turning right and pedestrian crossing the road S3 - Vehicle turning left and pedestrian crossing the road S4 - Vehicle going straight and pedestrian walking along/against traffic
These four recommended pre-crash scenarios resulted in 98 percent of all functional years lost (FYL) and direct economic cost (DEC) of all vehicle-pedestrian crashes, but accounted for only 46 percent of all national cases. The FYL harm measure is a non-monetary value that sums the years of life lost to fatal injury and the years of functional capacity lost to nonfatal injury. The DEC measure includes lost productivity, medical costs, legal and court costs, emergency service costs, insurance administration costs, travel delay, property damage, and workplace losses. Scenario 1 is the most frequent pre-crash scenario and has the highest values for the FYL and DEC measures. Scenarios 2 and 3 address the common vehicle turning scenarios observed in the crash data. Although these scenarios result in less severe injuries, PCAM systems will need to function correctly within these scenarios to help avoid collisions as well as to ensure proper functionality. Scenario 4 has the highest fatality rate and requires PCAM systems to have high-accuracy pedestrian detection that operates at high travel speeds. Crash contributing factors were examined to identify physical settings, environmental conditions, pedestrian characteristics, and other circumstances for the development of objective tests and use as input to the safety benefit estimation methodology. The analysis of physical settings and factors such as vehicle location, pedestrian location, roadway alignment, roadway profile, atmospheric and light conditions, and surface conditions was performed to support the efficiency optimization of PCAM technology by addressing the most common situations. Pedestrian characteristics such as age, gender, and size, along with other contributing factors including traffic flow, number of travel lanes, obstructions, pedestrian direction, and driver and pedestrian

xii
physiological conditions, were examined to aid in the development of algorithms to accurately detect pedestrians. Statistics from the crash databases were obtained to aid research of PCAM systems in terms of functionality, operation, applicability, and effectiveness. Based on the analysis of crash databases, the highest frequencies of pedestrian crashes occur:
• at speeds of 30 miles per hour or less, • at intersections, • on non-divided roads, • in clear and dry weather, • on dry roads, • during daylight, and • without driver alcohol involvement.
Less severe injuries were associated with lower impact speeds, typically at intersections and/or involving vehicle-turning scenarios. The majority of crashes involving fatalities:
• occurred at higher impact speeds, • involved pedestrians on the roadway outside of the crosswalk, • occurred at non-junctions, • were associated with darkness, • had pedestrian alcohol involvement, and • involved pedestrians older than 29 years.
A safety benefit estimation methodology was presented and exercised as an example of concept, only to the S1 scenario since the baseline crash data, test data results, and results from target population yielded limited samples for the other three scenarios. The potential annual safety benefits were estimated from multiplying the following three values obtained from crash statistics and objective tests of PCAM prototypes:
1. Annual value of harm in the target crash scenario (extracted from crash databases) 2. Ratio of the harm value in the PCAM-applicable crash scenario (i.e., driver of the vehicle
did not apply the brakes and the vehicle remained in control prior to striking the pedestrian) over the harm value in the target crash scenario (extracted crash databases)
3. PCAM effectiveness in preventing or reducing the severity of vehicle-pedestrian crashes (derived from objective test data and crash databases)
The safety benefit analysis is based on the assumptions that 100 percent of the fleet is equipped with PCAM systems and there is 100-percent system availability and detection without false activations. The system effectiveness is derived only from automatic braking and the analysis assumes that the driver did not apply the brakes prior to impact. Unintended consequences are not considered in the analysis.

1
1 INTRODUCTION This report describes the results of a research project in support of a cooperative agreement between the National Highway Traffic Safety Administration and Crash Avoidance Metrics Partnership for the development of pre-crash sensing applications aimed at preventing collisions or reducing pedestrian injuries in vehicle-pedestrian crashes. Under the agreement, previous work completed from the crash imminent braking project [1] was leveraged to further develop pedestrian crash avoidance/mitigation (PCAM) systems. These systems address vehicle-pedestrian crashes where a light vehicle is moving forward when a pedestrian is detected and an ensuing collision is imminent without driver/vehicle intervention. Light vehicle includes any passenger car, van, minivan, sport utility vehicle, or light pickup truck with a gross vehicle weight rating up to 10,000 pounds. Such systems are designed to avoid or mitigate injury to pedestrians through the use of warning systems and advanced braking technologies. Specifically, this report describes the technical support that the Volpe Center provided to NHTSA through the prioritization of vehicle-pedestrian maneuvers and the identification of target pre-crash scenarios for the development of objective tests and performance guidelines. In addition, the Volpe Center provided technical support to the PCAM Pedestrian Real-World Operational Assessment Data (ROAD) trip aimed at the characterization of PCAM systems under real-world conditions to gain information for operational objective test scenarios. Objective tests were designed and conducted by CAMP. Using system performance data from these objective tests, the Volpe Center conducted an exercise to demonstrate the safety benefit estimation methodology with potential system effectiveness and safety benefit estimates for PCAM prototype systems. 1.1 Pedestrian Crash Problem From 2005 to 2009, there have been over 28,460,000 traffic crashes, of which approximately 311,000 (1.1%) involved pedestrians who were struck by light vehicles in the first harmful events. The first harmful event is the first injury or damage-producing event in the crash. These pedestrian crashes resulted in 17,697 pedestrian fatalities as reported by the Fatality Analysis Reporting System. On average, 62,300 pedestrians are involved in vehicle-pedestrian crashes per year according to the General Estimates System[2]; of these crashes, FARS reported 3,539 annual pedestrian fatalities. In 2009, an estimated 5,945,400 in-traffic vehicle crashes with a light vehicle occurred, including 29,819 fatalities. Of these crashes, only about one percent involved pedestrians. Although the frequency of pedestrians involved varies, Figure 1 illustrates a decreasing trend in the total number of pedestrian fatalities per year. In terms of the percent of total traffic fatalities, the rate of pedestrian fatalities has increased from 11.2 percent in 2005 to 12.1 percent in 2009 according to NHTSA’s traffic safety facts for pedestrians.

2
0
1,000
2,000
3,000
4,000
5,000
6,000
7,000
8,000
2005 2006 2007 2008 2009
No.
of P
edes
tria
ns
Calender Year
Count of Pedestrians Per Year
GES (x10) FARS
Figure 1. Pedestrians Struck by Light Vehicles in the First Events of the Crashes by Year
1.2 Target Pedestrian Crashes In support of the development of objective tests and performance guidelines for PCAM systems, the crash analysis focused on priority pedestrian pre-crash scenarios. PCAM systems use forward-looking sensors, typically RADAR and/or cameras that will detect pedestrians in front of a forward moving vehicle. System algorithms are designed to identify pedestrians, estimate time-to-collision, and assess the necessary activation of warning systems, brake pre-fill, or automatic braking to avoid or mitigate the severity of the collision. Table 1 quantifies the target pedestrian crash problem based on 2005-2009 GES and FARS statistics.
Table 1. Target Pedestrian Crashes From National Databases
Forward Moving Vehicle & 1st Event 299,786 96.2% 11,792 66.6%Other Scenarios 11,706 3.8% 5,905 33.4%
Total Pedestrian Crashes 311,492 100.0% 17,697 100.0%
GES FARS
Pedestrian Cases (2005-2009) Pre-Crash Scenario
The crash analysis focused on the 299,786 pedestrian (11,792 fatalities) cases to identify and prioritize pre-crash scenarios and contributing factors for the development of objective tests for PCAM systems. Identifying the most frequent and fatal pre-crash scenarios aided in the creation

3
of accurate objective tests and allowed the opportunity to obtain the highest safety benefit for pedestrians. Pre-crash scenarios are addressed in terms of vehicle maneuvers and pedestrian maneuvers immediately prior to the crash. Contributing factors identify physical settings, environmental conditions, pedestrian characteristics, and other circumstances for development of objective tests, performance guidelines, systems algorithms, and their input into the safety benefit estimation methodology. The analysis of physical settings and factors, such as vehicle location, pedestrian location, roadway alignment, roadway profile, atmospheric and light conditions, and surface conditions aim to optimize the efficiency of PCAM technology by addressing the most common situations. Pedestrian characteristics such as age, gender, and size, along with other contributing factors including traffic flow, number of travel lanes, obstructions, pedestrian direction, and driver and pedestrian physiological conditions, aid in the development of algorithms and system processing to obtain the most accurate pedestrian detection. Statistical descriptions of each target scenario are identified according to the items as shown in Figure 2.
Environmental Conditions•Atmospheric•Lighting• Road Surface
Contributing Factors•Traffic Flow and Lanes•Travel Speed & Speed Limit•Vision Obstruction• Driver Alcohol Involvement• Driver Distraction
Pedestrian
•Age•Gender•Size•Alcohol Involvement•Harm Functions
Figure 2. Target Pre-Crash Scenario Parameters
1.3 Data Sources
Data sources for the characterization of target pre-crash scenarios were derived from NHTSA national crash databases, including the GES, FARS, and Pedestrian Crash Data Study (PCDS) [3]. Each database was chosen specifically to maximize the sample size and provide proper variables for a complete and accurate analysis.
1.3.1 General Estimates System
GES data come from a nationally representative sample of in-traffic police-reported vehicle crashes. In order for a vehicle crash to be eligible for the GES, a police accident report must be completed and it must involve at least one vehicle traveling on a traffic-way in which property damage, injury, or death resulted. GES data contain a variety of pre-crash variables for the accurate characterization of the events leading up to the crash for an estimated 55,000 crashes each year. The GES is limited by the content and accuracy of police reports.

4
For a GES case to be included in the PCAM analysis, the crash must involve a forward moving light vehicle striking a pedestrian in the first event within the 5-year span of 2005 to 2009. To achieve this, imputed variables of vehicle maneuver and non-motorist action were used to eliminate parked and backing vehicles and to assess the pedestrian maneuver. GES also contains police report information on physical settings, environmental conditions, and other contributing factors and circumstances. Note that GES data contain information on fatalities, but since this information is collected from police reports and weighted based on a probability sample, the results may differ from those in other databases, such as the FARS described below. 1.3.2 Fatality Analysis Reporting System FARS data is a complete nationwide census consisting of data regarding all fatal injuries suffered in crashes involving a vehicle in traffic for both occupants and non-occupants. FARS only reports deaths of persons within 30 days of being involved in a reported traffic crash. FARS data contains in-depth analysis for contributing factors to fatalities, including any violations, travel speed, environmental factors, obstructions, and pedestrian characteristics. For a FARS case to be included in the PCAM analysis, the same filters were applied as the GES and resulting vehicle maneuver and pedestrian-related factor variables were analyzed. Pedestrian-related factors combine physical and emotional pedestrian states and vision obstructions that contributed to the fatality; however, this variable is only coded in approximately 67 percent of all pedestrian fatalities. 1.3.3 Pedestrian Crash Data Study PCDS was a special investigation study conducted by NHTSA from 1996 to 1998, which collected traffic-related data for pedestrian crashes. The PCDS was designed to determine the pre-crash parameters of vehicle-pedestrian collisions as well as resulting injury and detailed medical information on the pedestrians. The PCDS also collected detailed schematics depicting the exact crash scene to determine pre-crash scenarios and detailed conditions. The schematics in the PCDS were manually analyzed to capture information that is not readily available in any other database, such as pedestrian direction, number of travel lanes crossed by the pedestrian, and any abnormal pre-crash scenarios that could potentially be addressed by or deceive a PCAM system. The PCDS also contains information that can be directly compared to other databases for validity, such as environmental conditions and physical settings. 1.3.4 Not-in-Traffic Surveillance
The Not-in-Traffic Surveillance is a currently active, special investigation study that examines non-traffic related vehicle incidents (i.e., occurring in a driveway, alley, or non-moving vehicle) from emergency room reports and death certificates. NiTS contains information on issues such as front-overs or back-overs (a vehicle moving forward or backward at a very low speed off the roadway that ran over a person), as well as other non-traffic related fatalities involving vehicles. NiTS incidents primarily involve dependent persons, such as children. NiTS contains basic environmental characteristics that surround these incidents and give insight to the size of the

5
front-over and back-over problem. This report does not address the incidents represented in NiTS because PCAM systems are not designed to target these types of crashes. 1.4 Literature Review
A literature review was performed to gain any information on previous research in the field of pedestrian pre-crash scenarios and the development of objective test procedures for forward-looking pre-crash sensing systems. 1.4.1 Insurance Institute for Highway Safety
The Insurance Institute for Highway Safety conducted a crash analysis study to determine the most frequent and harmful vehicle-pedestrian pre-crash scenarios in forward-moving single-vehicle crashes between 2005 and 2009[4]. In 2009 alone, 4,092 pedestrians sustained fatal injuries accounting for 12 percent of all traffic fatalities within the United States[5]. This study was performed to identify priority pre-crash scenarios for development of pedestrian detection systems for light vehicles. Within the 5-year span, approximately 330,000 pedestrians were involved in crashes nationwide, resulting in 20,824 fatalities. Out of all pedestrians, 317,460 (96.2%) involved passenger vehicles and 230,000 (69.7%) were struck by the front of the vehicle. For fatalities, 16,659 (80%) involved passenger vehicles and 15,785 (75.8%) were struck by the front of the vehicle. Of the 330,000 pedestrians, 224,000 involved a pedestrian that was struck by the front of a passenger vehicle, resulting in 13,193 fatalities. Within the group of these pedestrians, 95 percent were crossing the road (77% of fatalities). For all pedestrians crossing the road, 63 percent involved a vehicle going straight (72% of fatalities). Within this pre-crash scenario, there was no object obstructing the view of the striking vehicle’s driver in 54 percent of struck pedestrians (61% of fatalities). Three pre-crash scenarios were identified for single-vehicle pedestrian crashes involving the front of the vehicle.
1. Vehicle traveling straight with a pedestrian crossing 2. Vehicle traveling straight with a pedestrian moving in-line with traffic 3. Vehicle turning with a pedestrian crossing
These three pre-crash scenarios contributed to 215,000 crashes and 12,124 fatalities in the 5-year span. These pre-crash scenarios had 28,000 (13%) crashes in which an object obstructed the driver’s view, resulting in 2,056 (16%) fatalities. Other key findings included the occurrence of 93,000 crashes in non-daylight conditions (9,320 fatalities), 25,000 crashes in inclement weather (1,239 fatalities), and 160,000 crashes on roads with posted speed limit less than 40 mph (4,446 fatalities). Moreover, 33,000 struck pedestrians were under 13 years old (633 fatalities). Finally, vehicle braking was reported in only 21,000 crashes (1,563 fatalities).

6
1.4.2 Autonomous Emergency Braking Test Group The Autonomous Emergency Braking Test Group[6] set out to develop test procedures for AEB systems. To develop test procedures, an analysis of the in-depth crash reporting systems from Great Britain, STATS19 and On-the-Spot, were analyzed. These were the studies. A repeatable cluster analysis was performed on both datasets to create a hierarchical data structure that would group similar cases, identifying the most frequent pre-crash scenarios. For the year 2008, STATS19 contained 230,905 road user accidents, 28,482 (8%) of which were pedestrians. Of these pedestrian cases, 10,574 had complete information surrounding a crash where a passenger vehicle was traveling forward and the initial point-of-impact was the front of the vehicle. The resulting clusters showed the most common vehicle-pedestrian pre-crash scenarios:
1. Vehicle going straight with a child pedestrian crossing in daylight with no inclement weather, posted speed limits between 10 and 30 mph, with the pedestrian sustaining slight injuries, and with these variations:
a. An object obstructing the driver’s view; and b. In darkness, wet weather, and with adult males sustaining serious or fatal injuries.
2. Vehicle turning at low speeds with low-injury outcomes and the same dominant environmental factors as Scenario 1.
3. Vehicle going straight at higher speeds with an adult male pedestrian stationary in the road or walking along with traffic, in the dark, and with the pedestrian sustaining serious or fatal injuries.
The OTS contained 7,665 cases, in which 175 cases were selected based on the same criteria as STATS19, a forward-moving passenger car with initial point-of-impact being the front of the vehicle. The results were grouped into the following clusters:
1. Vehicle going straight with the pedestrian walking in daylight with no inclement weather, no obstruction, a mean travel speed of 43 km/h (26.7 mph), a reduction of impact speed of 7 km/h (4.3 mph), and with these variations:
a. Younger children running from the left with a tendency to be obstructed; and b. Wet weather and darkness consisting of adult pedestrians.
2. Vehicle turning at a mean travel speed of 37 km/h (23.0 mph) striking a child running into the roadway from the right and with a reduction of impact speed of 11 km/h (6.8 mph).
1.4.3 National Traffic Safety and Environment Laboratory, Japan The Society of Automotive Engineers of Japan (J-SAE) used data collected from drive recorders, including video, and national data based on real-world traffic accidents in Japan to ascertain the feasibility of using near-miss incidents to understand pre-crash scenarios for vehicle-pedestrian collisions[7].

7
Between 2005 and 2009, J-SAE fitted one hundred taxis in Japan with drive recorders in Tokyo. A forward-facing video camera and three accelerometers recorded all near-miss interactions in vehicle-vehicle, vehicle-pedestrian, and vehicle-bicycle events. Resulting data consisted of 163 vehicle-pedestrian near-miss events, 76 daytime incidents and 86 nighttime incidents. Of all 163 incidents, 36 incidents involved an adult pedestrian crossing the road at a crosswalk in an intersection in the daytime compared to 48 at night. In contrast, 20 incidents involved an adult pedestrian crossing the road, not at a crosswalk in a non-intersection compared to 29 at night. Select cases, 103 in total, were analyzed for estimating time-to-collision. The average TTC was calculated to determine thresholds for system activation. The average TTC for 49 cases where the pedestrian approached from the right was 1.8 seconds, as compared to 1.6 seconds when the pedestrian approached from the left. Video analysis showed that the pedestrian had tendencies to come out from behind obstructions, including buildings, parked vehicles, and moving vehicles. When a pedestrian was unobstructed, a mean TTC of 2.9 seconds was observed, as compared to a range of 1.2 - 1.4 seconds for various obstructions. To compare the near-miss incidents, 12,283 real-world pedestrian fatalities from 1999 to 2003 were analyzed. Of the fatalities during the daytime, 67 percent of pedestrians were crossing the road compared to 74 percent in near-miss incidents. On the other hand, 78 percent of all fatalities at night involved a pedestrian crossing the road compared to 69 percent of near-miss incidents. 1.4.4 European Harm Functions
Collaborators from Folksam Research, Chalmers University of Technology, Swedish Transport Administration, Karolinska Institutet, Vectura Consulting, and Monash University Accident Research Centre investigated the validity of using a single risk function for various pedestrians by analyzing crash data collected in Europe[8]. Findings showed that the risk for older pedestrians is almost 10 times higher than those of younger pedestrians. Crash data between 2003 and 2010 from Sweden and Germany (Federal Highway Research Institute, BASt) were analyzed to identify contributing factors to pedestrian injury, including age, speed limit, and injury sustained. Various risk functions, which serve as a link between crash severity and injury, were developed for various pedestrian groups. Results showed that there are two key relations within the risk curve that must be identified. First, the common relation between fatal and all injuries should be identified and compared between various groups. Second, the ratio between “fatal” and “fatal plus serious” injuries should be assessed. These two relations will vary between age and impact speeds; a lower impact speed may have lower fatalities and serious injuries, but more overall injuries, while higher impact speeds will have higher fatalities, but lower overall injuries. Pedestrians under 45 and between 45 to 64 years old had fatality rates of less than 1 and 2 percent, respectively, while pedestrians over 65 had a fatality rate of 9 percent when involved in crashes where the posted speed limit was 50 km/h (31.1 mph). The “fatal” to “fatal plus serious” injury ratio, the other key factor, showed that pedestrians under 45 had a ratio of 3.6, 45 to 64 had a ratio of 8.7, while 65 and older had a ratio of 23.7 when involved in crashes where the posted speed limit was 50 km/h. Findings for posted speed limits of 70 km/h (43.5 mph) also

8
showed similar trends. Pedestrians under 45 years had a smaller fatality rate compared to pedestrians between 45 and 64 years, and 65 years and above, with 8, 11.5, and 24 percent, respectively. These values are significantly higher than values for speed limits of 50 km/h; however, the increase in ratio between “fatal” and “fatal plus serious” injuries increases at a higher rate. Ratios for pedestrians were 15.7 for pedestrians under 45, 23.8 for pedestrians 45 to 64 , and 43.1 for pedestrians over 65. Overall, the risk of serious injury for older pedestrians is significantly higher than those of younger pedestrians. 1.4.5 Advanced Forward-Looking Safety Systems Members of the Advanced Forward-Looking Safety Systems (vFSS) group designed a set of objective test procedures for the development and assessment of preventive pedestrian protective systems in light vehicles [9]. The vFSS analyzed the German In-Depth Accident Study, German insurers, Accident Database of the Allianz Technology Center, and DEKRA databases to prioritize pre-crash scenarios and their contributing factors, including vehicle speed, pedestrian speed, pedestrian direction, and possible obstructions to block the pedestrian from the driver’s view. A total of 320,614 accidents occurred in Germany in 2008, and 22,272 of these accidents involved pedestrians during the day, and 14,398 involved pedestrians at night. Of these pedestrians, 357 suffered fatal injuries in the daytime compared to 99 in the nighttime. A breakdown of daylight pedestrian fatalities showed only 26 occurred in rural areas while 226 occurred in urban areas; the trend is reversed for nighttime fatalities at 241 and 130, respectively. Of all 653 pedestrian fatalities, 246 occurred in the colder months of November and December, with 182 fatalities occurring in the dark. Six scenarios were identified by vFSS as typical pedestrian scenarios, each involving a passenger vehicle moving forward and striking a pedestrian with the front of the vehicle:
1. Vehicle going straight and driver reacting with a brake maneuver and an adult pedestrian walking from the right;
2. Vehicle going straight and driver reacting with a brake maneuver at night, dawn, or dusk and a child pedestrian running in from the left;
3. Vehicle turning left and driver reacting with a brake maneuver and an adult pedestrian walking from the right;
4. Vehicle turning right and driver reacting with a brake maneuver and an adult pedestrian walking from the left;
5. Vehicle going straight and driver reacting with a brake maneuver and a child pedestrian running in from the right from behind an obstruction; and
6. Vehicle going straight in the dark at high speeds with the pedestrian walking in-line with traffic on the right.
From these six scenarios, vFSS developed four test scenarios that would assess the effectiveness of protective pedestrian systems. The scenarios were condensed from a technological standpoint, assuming that the turning scenario radar mimicked those of vehicles going straight with an obstruction, leaving four scenarios where the vehicle is going straight. Minor variations between

9
the scenarios included pedestrian speed, pedestrian size, and distance at which the pedestrian is detected by the system. The vehicle speed was constant in these test scenarios. 1.4.6 National Highway Traffic Safety Administration An estimated 70,000 pedestrian crashes resulting in 5,294 fatalities occurred in 1998, which was 1.1 percent of all traffic-related crashes and 14.3 percent of all traffic-related fatalities within the same year. A cooperative agreement between NHTSA and the Volpe Center produced a report summarizing the vehicle-pedestrian crash problem from 1995 to 1998 in the United States in accordance with the development of the Intelligent Vehicle Initiative[10]. Ten basic pre-crash scenarios were identified in the 4-year span within GES and FARS:
1. Vehicle going straight and pedestrian crossing at a non-junction; 2. Vehicle going straight and pedestrian crossing at an intersection; 3. Vehicle going straight and pedestrian darting into the road at a non-junction; 4. Vehicle turning left and pedestrian crossing at an intersection; 5. Vehicle turning right and pedestrian crossing at intersection; 6. Vehicle going straight and pedestrian walking along the road at a non-junction; 7. Vehicle going straight and pedestrian darting into the road at an intersection; 8. Vehicle backing up; 9. Vehicle going straight and pedestrian is not in the roadway at a non-junction; and 10. Vehicle going straight and pedestrian playing or working in the road at a non-junction.
The majority of crashes occurred in areas with posted speed limits of 25 to 35 mph. In four of the top 10 scenarios involving intersections, 45 percent of the crashes had a three-color signal while 36 percent had no controlling device or sign. Key contributing factors played significant roles in the top 10 scenarios, such as vision obstructions in scenarios with a pedestrian darting, driver alcohol involvement and night-time conditions when a pedestrian is along the roadway at a non-junction, and pedestrian alcohol involvement when a pedestrian was crossing the road in a crosswalk. Younger pedestrians 5 to 9 years old were the most susceptible to vehicle-pedestrian crashes accounting for almost 14 percent of all pedestrians involved. Involvement of younger pedestrians increased to approximately 35 percent in scenarios when the pedestrian is darting into the roadway. Pedestrians 5 to 24 years old composed 46 percent of all pedestrian crashes, and pedestrians 30 to 34 years old accounted for 14 percent of all pedestrians. The most severe injuries were received in scenarios occurring away from intersections; the most fatal was the scenario of a vehicle going straight with a pedestrian walking along the road at a non-junction.

10
2 IDENTIFICATION AND PRIORITIZATION OF PEDESTRIAN PRE-CRASH
SCENARIOS An analysis was conducted to identify and prioritize pedestrian pre-crash scenarios from vehicle-pedestrian maneuvers in the GES and FARS data sets. Both GES and FARS contain useful information to determine the most frequent and most fatal vehicle-pedestrian maneuvers. PCDS data were used as a supplement to the GES and FARS data to help identify pedestrian locations and directions. Prioritization of these pre-crash scenarios aided the development of objective test procedures for PCAM systems. The results of the crash analysis and objective tests helped to derive performance measures and predict the potential safety benefits for PCAM systems. 2.1 Vehicle-Pedestrian Maneuver Matrix As mentioned in Section 1.2, GES data over a 5-year span from 2005 to 2009 included 299,786 pedestrians involved in crashes that could be addressed by PCAM systems. Figure 3 and Figure 4 show the distribution of vehicle maneuvers and pedestrian maneuvers for all pedestrians, respectively. Based on GES statistics, 87 percent of vehicles were traveling straight, turning left, or turning right as seen in Figure 3. The remaining 13 percent encompassed 12 various vehicle maneuver categories, including “other.” For pedestrian maneuvers, 78 percent of pedestrians had no recorded action, improper crossing, or darting/running onto the road as seen in Figure 4. “No action” signifies that the police report had no record of the pedestrian making an action; this does not necessarily mean that the pedestrian did nothing. A small portion, equivalent to 5 percent, of pedestrians were walking with or against traffic. The remaining 18 percent consist of ambiguous actions or maneuvers. “Other actions” and “unknown actions” account for a total of 10 percent.
61%
17%
9%3% 3% 2% 1% 1% 1% 1% < 1% < 1% < 1% < 1% < 1%
0%
10%
20%
30%
40%
50%
60%
70%
Perc
ent
Vehicle Maneuvers (GES)
Figure 3. Vehicle Maneuver for Striking Vehicles Within GES

11
39%
21%18%
5% 5% 5% 4%1% 1% < 1% < 1%
0%5%
10%15%20%25%30%35%40%45%
Perc
ent
Pedestrian Maneuvers (GES)
Figure 4. Pedestrian Maneuvers Within GES
The categorization of these cases by vehicle maneuver and non-motorist action yielded 113 possible vehicle-pedestrian maneuver combinations or pre-crash scenarios. After eliminating all maneuvers coded as “other,” “unknown,” or “no action,” 67 combinations remained and comprised a total of 148,871 pedestrians. These 67 combinations were ranked by frequency and the top 20 pre-crash scenarios are shown in Table 2. These scenarios account for 94 percent of all vehicle-pedestrian pre-crash scenarios (excluding other, unknown, and no action). Within the top 10 scenarios, 88 percent of pedestrians are involved in three vehicle maneuvers: going straight, turning left, or turning right. Within these cases, there are six pedestrian maneuvers including improper crossing, darting/running into road, playing in road, walking with traffic, walking against traffic, and being inattentive. These six pedestrian maneuvers can be combined into three scenarios: crossing the road, walking with/against traffic, and inattentive. Inattentive is more a state of mind as opposed to a physical action, and since the pedestrian action is unknown, these cases were not used in this analysis.

12
Table 2. Vehicle-Pedestrian Pre-Crash Scenarios Ranked by GES Frequency for PCAM Target
Crashes
Rank Pre-Crash ScenarioAverage Annual
Frequency% Frequency
1 Going Straight & Improper Crossing Of Roadway Or Intersection 10,034 34%2 Going Straight & Darting or Running Into Road 9,585 32%3 Going Straight & Playing, Working, Sitting, Lying, Standing, etc. In Roadway 1,730 6%4 Going Straight & Walking With Traffic 1,693 6%5 Turning left & Improper Crossing Of Roadway Or Intersection 1,156 4%6 Going Straight & Walking Against Traffic 620 2%7 Going Straight & Inattentive (Talking, Eating, Etc.) 529 2%8 Turning right & Improper Crossing Of Roadway Or Intersection 393 1%9 Turning left & Darting or Running Into Road 301 1%
10 Turning left & Playing, Working, Sitting, Lying, Standing, etc. In Roadway 300 1%11 Negotiating a curve & Improper Crossing Of Roadway Or Intersection 221 1%12 Negotiating a curve & Darting or Running Into Road 215 1%13 Decelerating in traffic lane & Darting or Running Into Road 210 1%14 Starting in traffic lane & Playing, Working, Sitting, Lying, Standing, etc. In Roadway 201 1%15 Starting in traffic lane & Darting or Running Into Road 171 1%16 Starting in traffic lane & Improper Crossing Of Roadway Or Intersection 170 1%17 Changing lanes & Improper Crossing Of Roadway Or Intersection 168 1%18 Turning left & Jogging 152 1%19 Negotiating a curve & Walking With Traffic 150 1%20 Decelerating in traffic lane & Improper Crossing Of Roadway Or Intersection 132 0%21 Remaing scenarios (excluding other, unknown, no actions) 1,643 6%
29,774 100%TotalBased on GES data from 2005-2009
The frequency of these crashes gives an indication to the rate at which these pre-crash scenarios occur; however, they give little information about the outcome, or resulting injury to the pedestrian. The DEC and FYL are harm measures derived from the maximum injury severities associated with the pedestrian, along with other criteria. Table 3 shows the order of the pre-crash scenarios as ranked by the DEC harm measure. Data show that, although frequent, vehicle-turning scenarios result in less harm to vehicles, pedestrians, and the surrounding area. This is most likely due to the lower impact speeds associated with vehicles making turns at intersections. The FYL associated with each scenario is also presented in Table 3. If ranked by FYL, the order would be similar to the DEC rank with the exception of three pre-crash scenarios exchanging positions: 11↔12, 15↔16, and 19↔20.

13
Table 3. Vehicle-Pedestrian Pre-Crash Scenarios Ranked by Direct Economic Cost and Functional Years Lost for PCAM Target Crashes Based on 2005-2009 GES
Rank Pre-Crash Scenario Average Annual DEC
Average Annual FYL
1 Going Straight & Improper Crossing Of Roadway Or Intersection 6,619,858,706$ 47,514 2 Going Straight & Darting or Running Into Road 2,697,348,891$ 19,932 3 Going Straight & Playing, Working, Sitting, Lying, Standing, etc. In Roadway 1,344,380,386$ 9,668 4 Going Straight & Walking With Traffic 1,024,554,247$ 7,375 5 Going Straight & Inattentive (Talking, Eating, Etc.) 340,907,817$ 2,397 6 Negotiating a curve & Improper Crossing Of Roadway Or Intersection 222,547,446$ 1,578 7 Negotiating a curve & Walking With Traffic 222,175,881$ 1,549 8 Going Straight & Walking Against Traffic 198,475,792$ 1,447 9 Turning left & Improper Crossing Of Roadway Or Intersection 119,929,420$ 924
10 Changing lanes & Playing, Working, Sitting, Lying, Standing, etc. In Roadway 82,482,423$ 578
11* Passing or overtaking another vehicle & Darting or Running Into Road 77,673,884$ 547 12* Turning right & Improper Crossing Of Roadway Or Intersection 71,090,053$ 558 13 Going Straight & Non-Motorist Pushing A Vehicle 66,739,687$ 481 14 Decelerating in traffic lane & Darting or Running Into Road 58,692,995$ 454
15* Decelerating in traffic lane & Improper Crossing Of Roadway Or Intersection 46,229,579$ 335 16* Changing lanes & Improper Crossing Of Roadway Or Intersection 41,660,886$ 367 17 Turning left & Darting or Running Into Road 40,852,191$ 334 18 Turning left & Playing, Working, Sitting, Lying, Standing, etc. In Roadway 37,864,909$ 304
19* Entering a parking position & Improper Crossing Of Roadway Or Intersection 28,154,164$ 197 20* Starting in traffic lane & Playing, Working, Sitting, Lying, Standing, etc. In Roadway 27,004,899$ 221 21 Remaining Scenarios (excluding other, unknown, no actions) 305,997,975$ 2,343
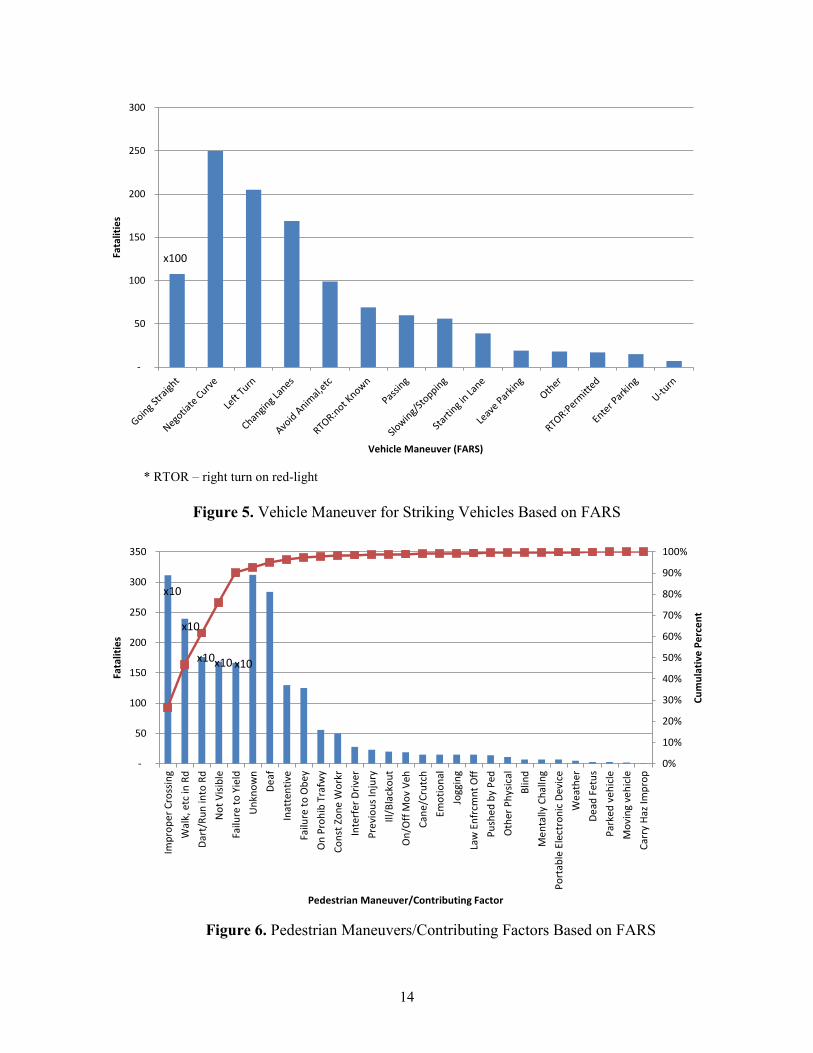
13,674,622,232$ 99,102 Total* Denotes scenarios that would change order if ranked by FYL, versus the DEC rank shown Figure 5 shows the breakdown for the 11,792 pedestrians in FARS for the various vehicle maneuvers of the striking vehicle. The vehicle traveling straight scenario accounted for the greatest number of fatalities at 91 percent or 10,700 fatalities. More complicated vehicle maneuvers accounted for the remaining 9 percent, which could be due to the fact that complex maneuvers are performed at lower speeds. Figure 6 shows the contributing factors of pedestrians in FARS fatalities. Approximately 90 percent of pedestrians were included in the categories of “improper crossing of roadway or intersection,” “walk, etc., in the road,” “dart/run into the road,” “not visible,” or “failure to yield.” These categories typically involve situations where the driver of the striking vehicle had little time to react. As a consequence, more fatalities can occur if the driver does not apply the brakes and has higher impact-speed crashes with the pedestrian. As mentioned prior, pedestrian maneuvers were coded in “contributing factors” that only list three key contributing factors to the fatality, including pedestrian maneuver, distraction, impairment, and other activities. Because of this, a pedestrian maneuver may not have been coded within the incident and thus be excluded from this analysis. This does not render FARS data irrelevant; it merely decreases the effective sample size and is reflected when comparing GES fatalities to FARS fatalities.
14
-
50
100
150
200
250
300Fa
talit
ies
Vehicle Maneuver (FARS)
x100
* RTOR – right turn on red-light
Figure 5. Vehicle Maneuver for Striking Vehicles Based on FARS
0%
10%
20%
30%
40%
50%
60%
70%
80%
90%
100%
-
50
100
150
200
250
300
350
Impr
oper
Cro
ssin
gW
alk,
etc
in R
dDa
rt/R
un in
to R
dN
ot V
isibl
eFa
ilure
to Y
ield
Unk
now
nDe
afIn
atte
ntiv
eFa
ilure
to O
bey
On
Proh
ib T
rafw
yCo
nst Z
one
Wor
krIn
terf
er D
river
Prev
ious
Inju
ryIll
/Bla
ckou
tO
n/O
ff M
ov V
ehCa
ne/C
rutc
hEm
otio
nal
Jogg
ing
Law
Enf
rcm
nt O
ffPu
shed
by
Ped
Oth
er P
hysic
alBl
ind
Men
tally
Cha
llng
Port
able
Ele
ctro
nic
Devi
ceW
eath
erDe
ad F
etus
Park
ed v
ehic
leM
ovin
g ve
hicl
eCa
rry
Haz I
mpr
op
Cum
ulat
ive
Perc
ent
Fata
litie
s
Pedestrian Maneuver/Contributing Factor
x10
x10
x10x10 x10
Figure 6. Pedestrian Maneuvers/Contributing Factors Based on FARS

15
2.2 Physical Settings
Physical settings include roadway junctions, interchanges, profiles, and alignments. Results of this analysis are presented in subsequent sections, along with recommendations for priority pre-crash scenarios. Subsequent statistical descriptions and analysis are presented in terms of these priority pre-crash scenarios. 2.2.1 Intersection Type Three databases contain variables that identify the general location of vehicle-pedestrian collisions. The GES, PCDS, and FARS contain a variable that identifies non-interchange locations as intersections, non-junctions, or driveway/alley access roadways. Table 4 shows the breakdown of non-interchange locations in these three databases. As mentioned, the variation in coding between GES and FARS led to the discrepancies in reported fatalities; particularly with GES reporting more fatalities than FARS. Intersection and intersection-related collisions accounted for 54 percent of all GES cases and 48 percent of all PCDS cases. Intersections tend to have the most frequent occurrences; however, due to lower impact speeds, they also tend to have fewer fatalities at 20 percent based on FARS. The GES reported 64 percent of fatalities at non-junction areas while FARS had a higher percentage at 76 percent. Non-junction crashes typically involve higher speeds resulting in more severe injuries.
Table 4. Intersection Type for PCAM Target Pedestrians
IntersectionIntersection
RelatedDriveway/Alley
Related Non-JunctionOther Non-Interchange
GES (All) 72,160 89,175 121,269 2,418 14,764 - 299,786 PCDS 41 209 42 207 15 3 - 517 GES (Fatal) 1,527 2,116 7,805 257 569 - 12,273 FARS 1,538 854 165 8,922 55 254 4 11,792 GES (All) % 24% 30% 0% 40% 1% 5% 0% 100%PCDS % 8% 40% 8% 40% 3% 1% 0% 100%GES (Fatal) % 12% 17% 0% 64% 2% 5% 0% 100%FARS % 13% 7% 1% 76% 0% 2% 0% 100%
Non-InterchangeInterchange
Related TotalUnknown
The GES and FARS data sets were used to obtain a breakdown of pedestrian locations as shown in Table 5. This variable identifies the location of the pedestrian at the time of impact. This pedestrian location variable differs from Table 4 in that it focuses on identifying intersections and crosswalks as opposed to interchange areas. An even distribution exists in all pedestrian cases in the GES: 48 percent occurred at non-intersections while 50 percent happened at intersections. However, most pedestrian fatalities occurred at non-intersections (69% in GES and 81% in FARS). Based on GES statistics, 93 percent of pedestrians were in the roadway (6% were other/unknown), regardless of intersection or non-intersection. Within the confines of an intersection, 44 percent of pedestrians were reported in the crosswalk. For non-intersections,

16
mid-block crosswalks are less common, leading to 90 percent of pedestrians cited as not in the crosswalk. For fatalities, there is a shift towards incidents with pedestrians not in crosswalks. For pedestrian fatalities, over 80 percent in GES and 93 percent in FARS involved pedestrians on the roadway outside of a crosswalk, regardless of intersection or non-intersection locations. However, within intersections, about two thirds of fatalities were outside of the crosswalk, while non-intersection values were higher at above 92 percent. As noted earlier, fatalities occur most often with higher impact speeds; a pedestrian not in a crosswalk could indicate that the driver of the vehicle is unaware of potential pedestrian activity and thus has a latent response when a conflict occurs.
Table 5. Pedestrian Location for PCAM Target Crashes
In CrosswalkOn Roadway
(Not Crosswalk)Not On
RoadwayOther/
UnknownIn Crosswalk/
Bike PathOn Roadway
(Not Crosswalk)Not On
RoadwayOther/
UnknownGES (All) 12 65,188 81,532 - 2,437 4,104 129,430 - 10,099 6,983 299,786 GES (Fatal) - 1,120 2,134 - 72 218 7,831 - 435 463 12,273 FARS - 636 1,541 10 33 64 9,393 62 18 35 11,792 GES (All) % 0% 22% 27% 0% 1% 1% 43% 0% 3% 2% 100%GES (Fatal) % 0% 9% 17% 0% 1% 2% 64% 0% 4% 4% 100%FARS % 0% 5% 13% 0% 0% 1% 80% 1% 0% 0% 100%
Other/ Unknown
Non-IntersectionIntersectionIn Crosswalk - Unknown If Intersection
Total
2.2.2 Roadway To further identify the location and geography for vehicle-pedestrian collisions, Table 6 provides statistics about pedestrian relation to the roadway when struck. Pedestrians were on the road in more than 93 percent of the cases independent of injury severity. The high proportion of pedestrians on the roadway, from Table 5 and Table 6, shows the need for focus on pedestrian detection on the immediate roadway and travel path; however, systems must be capable of identifying pedestrians outside the roadway and recognizing a potential impending threat.
Table 6. Pedestrians in Relation to the Roadway in PCAM Target Crashes
RoadwayMedian/
Seperator
2-Way Left Turn
LaneGore
In Parking Lane/Zone
Off Roadway
Roadside Shoulder
Outside Trafficway/
Right of Way
Unknown Total
GES (All) 282,890 611 956 13 3,153 717 4,815 4,992 738 901 299,786 GES (Fatal) 11,369 71 22 52 202 370 145 41 12,273 FARS 11,552 10 11 3 6 6 29 146 17 12 11,792 GES (All) % 94% 0% 0% 0% 1% 0% 2% 2% 0% 0% 100%GES (Fatal) % 93% 0% 1% 0% 0% 0% 2% 3% 1% 0% 100%FARS % 98% 0% 0% 0% 0% 0% 0% 1% 0% 0% 100%
To further define the physical settings of target pedestrian crashes, Table 7 and Table 8 show the distribution of the roadway geometry and profile from GES, PCDS, and FARS. In all databases, over 92 percent of pedestrians were struck on a straight road and over 77 percent were on a level road. These results show the need for focus on roadways that are straight and level for the development of objective tests. However, it is important to note the small percentages of pedestrians who were associated with curves or hillcrests, as these areas may cause false or missed activations.

17
Table 7. Roadway Alignment for PCAM Target Crashes
Straight Curve Unknown TotalGES (All) 288,346 11,440 299,786 PCDS 495 22 517
GES (Fatal) 11,341 932 12,273 FARS 10,957 760 75 11,792 GES (All) % 96% 4% 100%PCDS % 96% 4% 100%GES (Fatal) % 92% 8% 100%FARS % 93% 6% 1% 100%
Table 8. Roadway Profile for PCAM Target Crashes
Level Grade Hillcrest Sag Unknown TotalGES (All) 263,350 33,391 2,860 185 299,786 PCDS 411 101 5 - 517
GES (Fatal) 9,419 2,421 433 - 12,273 FARS 9,492 1,758 191 26 325 11,792 GES (All) % 88% 11% 1% 0% 12%PCDS % 79% 20% 1% 0% 21%GES (Fatal) % 77% 20% 4% 0% 23%FARS % 80% 15% 2% 0% 3% 20%
2.2.3 Recommendations for Priority Scenarios Based on the results of the crash analysis discussed above, it is recommended that vehicle and pedestrian maneuvers be linked to allow for further refinement of the development of objective tests. Three distinct vehicle maneuvers and two pedestrian maneuvers were identified as more common and injury prone; theses maneuvers were vehicle going straight, vehicle turning right, vehicle turning left, pedestrian crossing, and pedestrian walking along the road. In addition, there was an almost even split for pedestrian involvement at intersection or non-intersections and high fatality rates for pedestrians along the side of the road at non-junctions. Therefore, the following four scenarios were proposed for further analysis in the development of objective tests, as seen in Figure 7.

18
Figure 7. Recommended Scenarios for PCAM Priority Pre-Crash Scenarios
These four scenarios address the most frequent and injury-prone vehicle-pedestrian maneuvers as seen in the GES, FARS, and PCDS. They also address all of the most frequent conditions involved with intersections, pedestrian location, crosswalks, and road geometry. Scenario 1 encompasses the most frequent scenario, a vehicle going straight on a level road with a pedestrian crossing the road. This scenario can be refined independent of intersection and crosswalk because PCAM systems will have to perform in similar manners regardless of these variables. Scenarios 2 and 3 deal with common turning scenarios observed in the crash data. Scenario 2 involves a vehicle turning right at an intersection on a level road with a pedestrian crossing the road. Scenario 3 is similar to Scenario 2 but with a vehicle turning left. These scenarios can be refined independent of the crosswalk because PCAM systems will have to perform in similar manners. Although these scenarios result in less severe injuries, these are frequent and involve complex driver and pedestrian maneuvers that can be significantly aided by PCAM systems. The final scenario, Scenario 4, is a highly fatal scenario and cannot be overlooked. This scenario involves a pedestrian walking along a level road, with or against

19
traffic, and the vehicle traveling straight at a non-intersection. This scenario can be refined independent of crosswalk.
2.2.3.1 Societal Cost and Number of Fatalities of the Four Priority Scenarios
To quantify the problem size for the priority pre-crash scenarios, a modified analysis of economic cost and functional years lost was performed from the information in Section 2.1, Table 3. The four recommended scenarios encompass 98 percent of direct economic costs and functional years lost for all vehicle-pedestrian scenarios as shown in Table 9. Although, these four scenarios only account for 46 percent of all GES pedestrian cases, this proportion gives little insight to injury severity of the pedestrian. As noted before, S1 is the most frequent pre-crash scenario while S4 has the second highest fatality value. The number of pedestrians in FARS for each of the four priority scenarios is shown in Table 10. The vehicle going straight while a pedestrian crosses the road scenario, S1, accounts for 64 percent of fatalities. Scenario S4, a vehicle is going straight while the pedestrian is alongside the road walking with/against traffic, has the second highest fatality count at 24 percent. Table 9. Economic Cost, Functional Years Lost, and Weight of GES Cases for the Four Priority
Pedestrian Pre-Crash Scenarios
DEC FYL WeightS1 Going Straight & Crossing Road 57,934,710,384$ 418,940 115,339 S2 Turning Right & Crossing Road 355,450,266$ 2,788 1,966 S3 Turning Left & Crossing Road 993,232,597$ 7,808 8,787 S4 Going Straight & Along/Against Traffic 7,559,728,038$ 54,257 12,510
1,529,989,874$ 11,716 161,185 68,373,111,158$ 495,509 299,786
S1 Going Straight & Crossing Road 85% 85% 38%S2 Turning Right & Crossing Road 1% 1% 1%S3 Turning Left & Crossing Road 1% 2% 3%S4 Going Straight & Along/Against Traffic 11% 11% 4%
2% 2% 54%100% 100% 100%
Other Scenarios (Excluding other, unknown, no action)Total
Other Scenarios (Excluding other, unknown, no action)Total
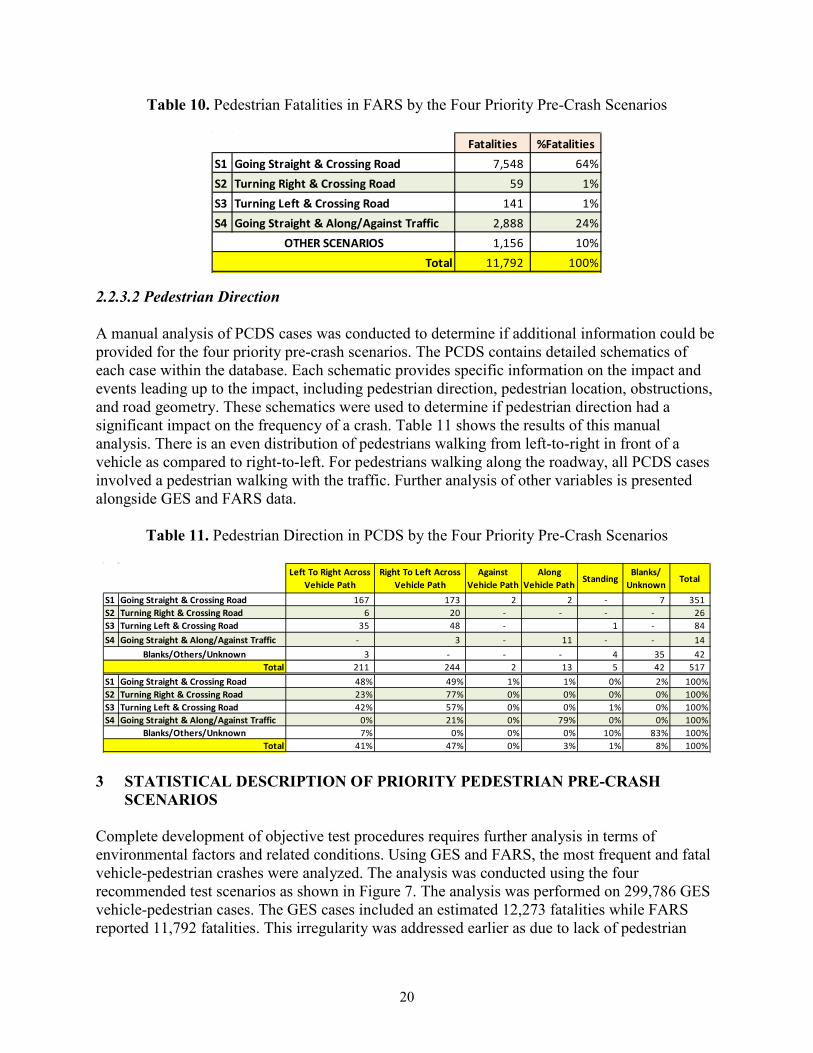
20
Table 10. Pedestrian Fatalities in FARS by the Four Priority Pre-Crash Scenarios
Fatalities %FatalitiesS1 Going Straight & Crossing Road 7,548 64%S2 Turning Right & Crossing Road 59 1%S3 Turning Left & Crossing Road 141 1%S4 Going Straight & Along/Against Traffic 2,888 24%
1,156 10%11,792 100%
OTHER SCENARIOSTotal
2.2.3.2 Pedestrian Direction
A manual analysis of PCDS cases was conducted to determine if additional information could be provided for the four priority pre-crash scenarios. The PCDS contains detailed schematics of each case within the database. Each schematic provides specific information on the impact and events leading up to the impact, including pedestrian direction, pedestrian location, obstructions, and road geometry. These schematics were used to determine if pedestrian direction had a significant impact on the frequency of a crash. Table 11 shows the results of this manual analysis. There is an even distribution of pedestrians walking from left-to-right in front of a vehicle as compared to right-to-left. For pedestrians walking along the roadway, all PCDS cases involved a pedestrian walking with the traffic. Further analysis of other variables is presented alongside GES and FARS data.
Table 11. Pedestrian Direction in PCDS by the Four Priority Pre-Crash Scenarios
Left To Right Across Vehicle Path
Right To Left Across Vehicle Path
Against Vehicle Path
Along Vehicle Path Standing
Blanks/ Unknown Total
S1 Going Straight & Crossing Road 167 173 2 2 - 7 351 S2 Turning Right & Crossing Road 6 20 - - - - 26 S3 Turning Left & Crossing Road 35 48 - 1 - 84 S4 Going Straight & Along/Against Traffic - 3 - 11 - - 14
3 - - - 4 35 42 211 244 2 13 5 42 517
S1 Going Straight & Crossing Road 48% 49% 1% 1% 0% 2% 100%S2 Turning Right & Crossing Road 23% 77% 0% 0% 0% 0% 100%S3 Turning Left & Crossing Road 42% 57% 0% 0% 1% 0% 100%S4 Going Straight & Along/Against Traffic 0% 21% 0% 79% 0% 0% 100%
7% 0% 0% 0% 10% 83% 100%41% 47% 0% 3% 1% 8% 100%
Blanks/Others/UnknownTotal
Blanks/Others/UnknownTotal
3 STATISTICAL DESCRIPTION OF PRIORITY PEDESTRIAN PRE-CRASH
SCENARIOS Complete development of objective test procedures requires further analysis in terms of environmental factors and related conditions. Using GES and FARS, the most frequent and fatal vehicle-pedestrian crashes were analyzed. The analysis was conducted using the four recommended test scenarios as shown in Figure 7. The analysis was performed on 299,786 GES vehicle-pedestrian cases. The GES cases included an estimated 12,273 fatalities while FARS reported 11,792 fatalities. This irregularity was addressed earlier as due to lack of pedestrian
21
movement data from FARS. It is noteworthy that the GES did not report any fatalities in the turning left scenario, S3. 3.1 Environmental Factors Environmental factors include atmospheric, light, and surface conditions. 3.1.1 Atmospheric Condition Figure 8 illustrates the distribution of atmospheric conditions for the four priority scenarios based on GES cases. More than 80 percent of all cases occur in normal weather conditions; this is most likely due to the frequency and tendency of pedestrians to be outside during clear weather. Figure 9 depicts the distribution of fatalities in GES by weather conditions and scenarios. Figure 10 shows the fatalities reported in FARS with almost 90 percent of all fatalities occurring in normal weather conditions.

22
0.00
0.10
0.20
0.30
0.40
0.50
0.60
0.70
0.80
0.90
1.00
Prop
ortio
n
Atmospheric Condition
S1 S2 S3 S4 OTHER SCENARIOS
Figure 8. Atmospheric Conditions by Priority Scenarios for
All GES Cases
0.00
0.10
0.20
0.30
0.40
0.50
0.60
0.70
0.80
0.90
1.00
Prop
ortio
n
AtmosphericCondition
S1 S2 S3 S4 OTHER SCENARIOS
Figure 9. Atmospheric Conditions by Priority Scenarios for
GES Fatalities
0.00
0.10
0.20
0.30
0.40
0.50
0.60
0.70
0.80
0.90
1.00
Prop
ortio
n
Atmospheric Condition
S1 S2 S3 S4 OTHER SCENARIOS
Figure 10. Atmospheric Conditions by Priority Scenarios for
FARS Cases

23
3.1.2 Light Condition Light conditions can significantly degrade vision-based systems by impacting false or missed activations due to poor lighting conditions. The systems may have to incorporate more features, which could simultaneously address atmospheric issues. Figure 11 shows the distribution of all GES cases in various lighting conditions for the priority scenarios. For GES cases, all scenarios, excluding S4, occur in daylight conditions over half the time. S4 has a higher proportion, 61 percent, associated with dark conditions. This fact could influence the high number of fatalities shown in S4, since drivers may not see the pedestrian and have a late, if any, reaction to the conflict. The GES fatalities, shown in Figure 12, illustrate this trend as well; fatalities have a high occurrence in some variation of dark or poorly lit conditions. Similar trends are seen for FARS as shown in Figure 13; there are a significant amount of fatalities that occur in darker conditions. Based on the data, PCAM systems would be effective in these scenarios if they have the capability to detect pedestrians in light and dark conditions; this potentially can be done through a fusion of video and radar sensors, as well as supplemental technology such as thermal imaging. 3.1.3 Surface Condition Surface conditions can affect pedestrian detection sensors through glare and reflections (in combination with atmospheric and lighting conditions). To aid in the development of objective tests, the surface condition variable was analyzed. As seen in Figure 14, approximately 80 percent of GES incidents occur on dry roads regardless of the priority scenario. GES fatalities show a similar trend in Figure 15; the most frequent surface condition is a normal dry surface, occurring in over 80 percent of all cases. The FARS data, as shown in Figure 16, support this as well, with high rates of fatalities occurring on dry roadways. In all datasets, a slight proportion of pedestrian crashes occur on wet roads and an even smaller proportion occurs in worse conditions of snow, slush, or ice. If PCAM systems include the use of autonomous control or pre-fill braking, information on the road surface condition would be beneficial to improve system performance.

24
0.00
0.10
0.20
0.30
0.40
0.50
0.60
0.70
Prop
ortio
n
Lighting Condition
S1 S2 S3 S4 OTHER SCENARIOS
Figure 11. Light Conditions by Priority Scenarios for All GES
Cases
0.00
0.10
0.20
0.30
0.40
0.50
0.60
0.70
0.80
0.90
1.00
Prop
ortio
n
Lighting Condition
S1 S2 S3 S4 OTHER SCENARIOS
Figure 12. Light Conditions by Priority Scenarios for GES
Fatalities
0.00
0.10
0.20
0.30
0.40
0.50
0.60
0.70
0.80
Prop
ortio
n
Lighting Condition
S1 S2 S3 S4 OTHER SCENARIOS
Figure 13. Light Conditions by Priority Scenarios for FARS

25
0.00
0.10
0.20
0.30
0.40
0.50
0.60
0.70
0.80
0.90
Prop
ortio
n
Surface Condition
S1 S2 S3 S4 OTHER SCENARIOS
Figure 14. Surface Conditions by Priority Scenarios for All
GES Cases
0.00
0.10
0.20
0.30
0.40
0.50
0.60
0.70
0.80
0.90
1.00
Prop
ortio
n
SurfaceCondition
S1 S2 S3 S4 OTHER SCENARIOS
Figure 15. Surface Conditions by Priority Scenarios for GES
Fatalities
0.00
0.10
0.20
0.30
0.40
0.50
0.60
0.70
0.80
0.90
1.00
Prop
ortio
n
SurfaceCondition
S1 S2 S3 S4 OTHER SCENARIOS
Figure 16. Surface Conditions by Priority Scenarios for FARS
Cases

26
3.2 Contributing Factors for Priority Scenarios Contributing factors for the four priority scenarios are defined in terms of traffic flow and lanes, travel speed and speed limit, vision obstructions, and driver characteristics. 3.2.1 Traffic Flow and Lanes Road geometry information in terms of traffic flow and number of lanes is useful in defining the range of radar and vision sensors. Technology limitations affect the capabilities of sensing pedestrians past multiple lanes or located behind obstructions. The traffic flow of GES and FARS cases was analyzed by identifying the medians, barriers, and number of lanes. The majority of pedestrian crashes, as well as fatalities, occur on non-divided roadways, including two-way roadways with a two-way-left-turn lane located in the middle of the road. Approximately 53 percent of S1, S2, and S3 cases occur on these types of roads as reported in the GES, while 75 percent occur in the S4 scenario as shown in Figure 17. Excluding cases that were unknown, non-divided roadways with two lanes encompassed the highest frequency of pedestrian crashes, followed by roadways with four lanes or more, as seen in Table 12. Results from a similar analysis for fatalities based on GES and FARS data are shown in Figure 18 and Figure 19, respectively. Although S1 and S4 have a relatively high percentage of fatalities occurring on divided roadways, systems will more than likely not be able to detect objects past a median and/or barrier thus imitating a non-divided roadway. GES statistics reveal that the majority of pedestrian fatalities occur on non-divided roadways, with the majority of incidents occurring on two-lane roads, excluding S1, as seen in Table 13. FARS had over 55 percent of pedestrian fatalities struck on non-divided roadways in all four priority scenarios, with S1 accounting for the lowest percentage. Of these fatalities, over 56 percent of them happen on two-lane roadways, with S1 accounting for the lowest percentage, as shown in Table 14.

27
0.00
0.10
0.20
0.30
0.40
0.50
0.60
0.70
0.80
0.90Pr
opor
tion
Traffic Flow
S1 S2 S3 S4 OTHER SCENARIOS
* 2WLTL ≡ Two-way-left-turn-lane
Figure 17. Traffic Flow by Priority Scenarios for All GES Cases
Table 12. Number of Travel Lanes by Priority Scenarios for All GES Cases on Non-Divided Roadways
One Two Three Four + Unknown Total %One %Two %Three %Four + %Unknown %Total
S1 Going Straight & Crossing Road 112 31,987 2,909 19,111 7,235 61,354 0% 52% 5% 31% 12% 100%S2 Turning Right & Crossing Road - 318 12 307 421 1,058 0% 30% 1% 29% 40% 100%S3 Turning Left & Crossing Road 79 1,927 349 1,667 602 4,624 2% 42% 8% 36% 13% 100%S4 Going Straight & Along/Against Traffic 58 7,672 328 570 1,410 10,039 1% 76% 3% 6% 14% 100%
599 40,883 4,601 16,242 11,985 74,311 1% 55% 6% 22% 16% 100%
848 82,788 8,199 37,897 21,653 151,386 1% 55% 5% 25% 14% 100%Total
OTHER SCENARIOS
Not Physically Divided Roadway

28
0.00
0.10
0.20
0.30
0.40
0.50
0.60
0.70
0.80
0.90
1.00
Prop
ortio
n
Traffic Flow
S1 S2 S3 S4 OTHER SCENARIOS
* 2WLTL ≡ Two-way-left-turn-lane
Figure 18. Traffic Flow by Priority Scenarios for GES Fatalities
Table 13. Number of Travel Lanes by Priority Scenarios for GES Fatalities on Non-Divided Roadways
One Two Three Four + Unknown Total %One %Two %Three %Four + %Unknown %Total
S1 Going Straight & Crossing Road - 1,823 254 1,657 248 3,982 0% 46% 6% 42% 6% 100%S2 Turning Right & Crossing Road - 16 - - - 16 0% 100% 0% 0% 0% 100%S3 Turning Left & Crossing Road - - - - - - 0% 0% 0% 0% 0% 0%S4 Going Straight & Along/Against Traffic - 559 28 130 10 727 0% 77% 4% 18% 1% 100%
- 1,255 115 1,145 222 2,738 0% 46% 4% 42% 8% 100%
- 3,653 398 2,932 480 7,462 0% 49% 5% 39% 6% 100%
Not Physically Divided Roadway
OTHER SCENARIOS
Total

29
0.00
0.10
0.20
0.30
0.40
0.50
0.60
0.70
0.80
Prop
ortio
n
Traffic Flow
S1 S2 S3 S4 OTHER SCENARIOS
* 2WLTL ≡ Two-way-left-turn-lane
Figure 19. Traffic Flow by Priority Scenarios for FARS Cases
Table 14. Number of Travel Lanes by Priority Scenarios for FARS Cases on Non-Divided Roadways
One Two Three Four + Unknown Total %One %Two %Three %Four + %Unknown %Total
S1 Going Straight & Crossing Road - 2,312 129 1,655 28 4,124 0% 56% 3% 40% 1% 100%S2 Turning Right & Crossing Road - 30 1 14 1 46 0% 65% 2% 30% 2% 100%S3 Turning Left & Crossing Road - 68 5 32 - 105 0% 65% 5% 30% 0% 100%S4 Going Straight & Along/Against Traffic 2 1,566 25 344 4 1,941 0% 81% 1% 18% 0% 100%
- 546 21 180 7 754 0% 72% 3% 24% 1% 100%
2 4,522 181 2,225 40 6,970 0% 65% 3% 32% 1% 100%
Not Physically Divided Roadway
OTHER SCENARIOS
Total

30
3.2.2 Travel Speed and Speed Limit GES and FARS cases are compiled heavily from police reports; therefore it is difficult to accurately obtain a vehicle travel speed at the time of impact. To ascertain some knowledge of vehicle travel speed and impact speed, GES cases were analyzed for the speeding-related factor. GES contains a variable labeled as “speed related” that identifies vehicles that were speeding at the time of the collision. However, this does not mean the driver was cited for speeding, but that the police officer reported that excessive speed was a contributing factor to the collision. The FARS database did not contain the speed-related variable at the time of this analysis. Table 15 shows the breakdown of GES cases by priority scenario and the “speed related” variable. The majority of cases do not have speeding as being a factor. As a result, if travel speed is not reported, it may be assumed that the driver was travelling close to the posted speed limit of the road. Appendix A shows the travel speed versus the posted speed limit for the GES cases, fatalities in GES, and FARS cases for each of the four priority scenarios.
Table 15. Breakdown of GES Cases for Speed-Related Factor by Priority Scenarios
Yes No Unknown Total %Yes %No %Unknown %TotalS1 Going Straight & Crossing Road 2,898 101,752 10,689 115,339 3% 88% 9% 100%S2 Turning Right & Crossing Road 1,820 146 1,966 0% 93% 7% 100%S3 Turning Left & Crossing Road 181 8,506 100 8,787 2% 97% 1% 100%S4 Going Straight & Along/Against Traffic 411 8,114 3,985 12,510 3% 65% 32% 100%
5,633 115,795 39,756 161,185 3% 72% 25% 100%9,123 235,986 54,676 299,786 3% 79% 18% 100%
S1 Going Straight & Crossing Road 133 6,762 338 7,233 2% 93% 5% 100%S2 Turning Right & Crossing Road 16 16 0% 100% 0% 100%S3 Turning Left & Crossing Road - - 0% 0% 0% 0%S4 Going Straight & Along/Against Traffic 183 642 178 1,003 18% 64% 18% 100%
456 2,329 1,236 4,022 11% 58% 31% 100%772 9,749 1,753 12,273 6% 79% 14% 100%
Total
Total
Fata
litie
sAl
l Cas
es
OTHER SCENARIOS
OTHER SCENARIOS
The analysis conducted to determine travel speed ranges uses the travel speed and posted travel speed variables, while assuming the vehicle is not excessively speeding nor deliberately going slowly. As mentioned, the travel speed variable is recorded as reported on the police report and thus can contain many unknowns; more than half of the reported cases record an unknown travel speed. To improve the analysis, the sample size of GES cases was increased by including additional years (2002 through 2004) to the sample so that the range became 2002-2009. The extra years yielded 56,537 additional cases to the current total of 138,601 cases. The analysis shows that there is a relationship between travel speed and posted speed limit. This relationship suggests that the estimated travel speed is in a range of ± 10 mph of the posted speed limit. From this relationship, it can be noted that the majority of cases occurred at 35 mph or less, with fatalities occurring at a slightly higher travel speed of approximately 35 to 45 mph. The combination of these speed variables suggests that PCAM systems should function as high as 50 mph and should be very accurate at speeds below 35 mph. 3.2.3 Vision Obscured
Drivers often cite visual obstructions as a key contributor towards vehicle-pedestrian crashes. Obstructions can include external objects (cars, signs), weather (glare, snow, rain), environment

31
(trees, curves, hills), or internal objects (blind spots, stickers). The contributing factor of visual obstructions was investigated using GES, FARS, and PCDS databases. For all GES cases, only 19 percent of S1 cases and 15 percent of S3 cases were reported to have an obstruction, while S2 and S4 contained an obstruction in only 9 percent of all police-reported cases as shown in Figure 20. A similar trend exists for GES fatalities as shown in Figure 21 with 16 percent recorded driver obstructions in S1 and lower counts in S4 at 5 percent. However, there were no obstructions reported in the right-turning scenario. FARS reported higher proportions of obscured vision, with as much as 23 percent of fatalities in S4 as shown in Figure 22. It is noteworthy that the variable used in FARS to determine obstructed vision was the contributing factor variable encompassing other factors such as the driver being ill, unconscious, inattentive, the pedestrian darting into the road, or the pedestrian improperly crossing. FARS only attributes a maximum of three of these factors to each case and this variable was only reported in two thirds of the cases. The manual analysis of PCDS cases provided lower obstruction values with reported obstruction in only 7 percent of S1 cases as shown in Figure 23. Vision-based sensors can supplement radar sensors in distinguishing pedestrians from obstructions, as well as pedestrians coming from external obstructions such as another vehicle, structure, sign, etc. In addition, PCAM systems should be able to operate despite other obstructions or conditions such as glare, hills, curves, blind spots, etc.
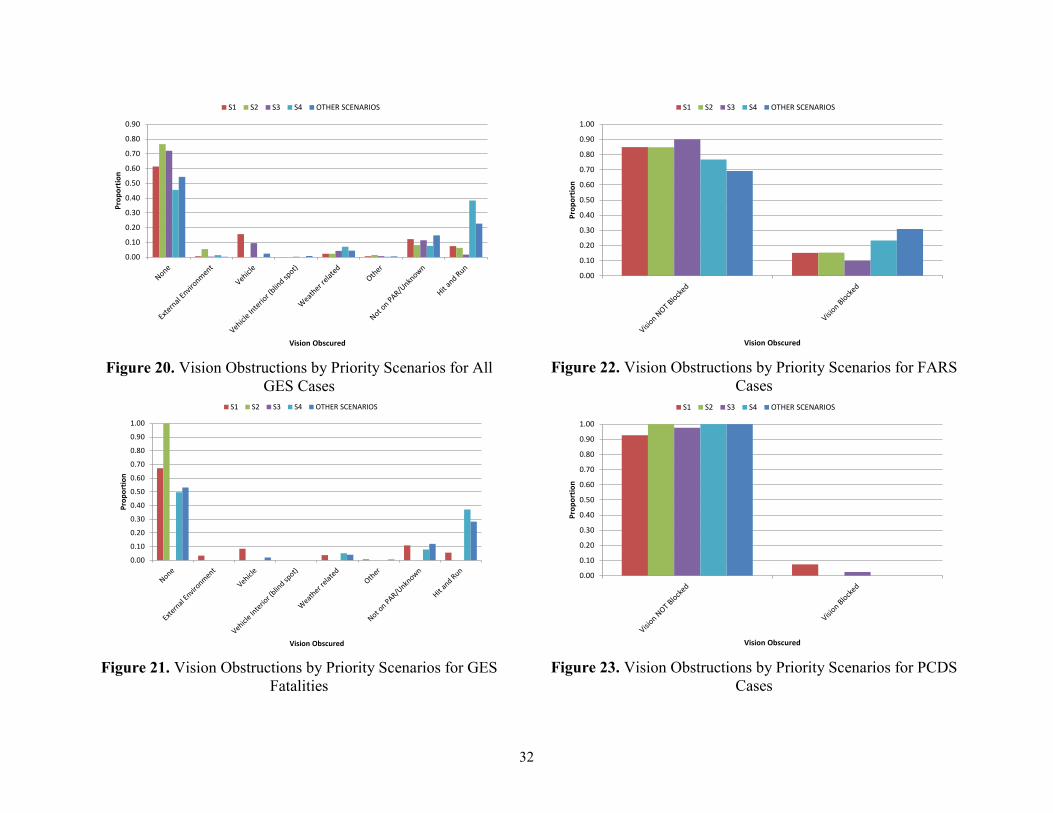
32
0.00
0.10
0.20
0.30
0.40
0.50
0.60
0.70
0.80
0.90Pr
opor
tion
Vision Obscured
S1 S2 S3 S4 OTHER SCENARIOS
Figure 20. Vision Obstructions by Priority Scenarios for All
GES Cases
0.00
0.10
0.20
0.30
0.40
0.50
0.60
0.70
0.80
0.90
1.00
Prop
ortio
n
Vision Obscured
S1 S2 S3 S4 OTHER SCENARIOS
Figure 21. Vision Obstructions by Priority Scenarios for GES
Fatalities
0.00
0.10
0.20
0.30
0.40
0.50
0.60
0.70
0.80
0.90
1.00
Prop
ortio
n
Vision Obscured
S1 S2 S3 S4 OTHER SCENARIOS
Figure 22. Vision Obstructions by Priority Scenarios for FARS
Cases
0.00
0.10
0.20
0.30
0.40
0.50
0.60
0.70
0.80
0.90
1.00
Prop
ortio
n
Vision Obscured
S1 S2 S3 S4 OTHER SCENARIOS
Figure 23. Vision Obstructions by Priority Scenarios for PCDS
Cases

33
3.2.4 Driver Alcohol Involvement Since PCAM systems may not receive input from an alcohol-impaired driver, in addition to a warning, the system should be capable of autonomous braking. In order to determine the proportion of alcohol-impaired drivers, the “alcohol involvement” variable from GES was queried. The majority of GES cases did not involve alcohol. At most, 15 percent of all GES cases had alcohol involvement by drivers in S4 and the next highest was S2 with an alcohol involvement of 7 percent as seen below in Table 16. In contrast, 39 percent of the fatal GES cases for S4 showed that the driver had alcohol involvement.
Table 16. Alcohol Involvement by Priority Scenarios for GES Vehicle-Pedestrian Crashes
Alchohol Involved
No Alcohol Total% Alchohol
Involved% No
Alcohol% Total
12,011 149,174 161,185 7% 93% 100%S1 Going Straight & Crossing Road 3,921 111,418 115,339 3% 97% 100%S2 Turning Right & Crossing Road 130 1,836 1,966 7% 93% 100%S3 Turning Left & Crossing Road 58 8,728 8,787 1% 99% 100%S4 Going Straight & Along/Against Traffic 1,871 10,639 12,510 15% 85% 100%
17,991 281,795 299,786 6% 94% 100%475 3,547 4,022 12% 88% 100%
S1 Going Straight & Crossing Road 307 6,926 7,233 4% 96% 100%S2 Turning Right & Crossing Road - 16 16 0% 100% 100%S3 Turning Left & Crossing Road - - - 0% 0% 0%S4 Going Straight & Along/Against Traffic 391 612 1,003 39% 61% 100%
1,173 11,100 12,273 10% 90% 100%
All C
ases
OTHER SCENARIOS
Total
Fata
litite
s
OTHER SCENARIOS
Total Alcohol plays a significant role in driver impairment and crashes; however, other factors may also contribute to pedestrian crashes such as driver distraction as seen in Figure 24 and Figure 25. GES data show that distraction was not reported or unknown in most cases, accounting for over 70 percent of the cases in all priority scenarios. Distraction was cited in the remaining cases including inattention, outside events, or cell phone use. Distraction was reported in as much as 28 percent of crashes in S2. Distraction was coded infrequently in GES fatalities with only 17 percent of drivers being distracted in the S4 scenario as shown in Figure 25. The lack of cited distractions can stem from the lack of the driver response and unwillingness to admit to being distracted, or the inability of police reports to have accurate records of known distractions. However, PCAM systems can mitigate or eliminate pedestrian injuries and reduce crash counts in cases where drivers are distracted or inattentive for any reason.

34
0.00
0.10
0.20
0.30
0.40
0.50
0.60
0.70
0.80
Prop
ortio
n
Driver Distraction
S1 S2 S3 S4 OTHER SCENARIOS
Figure 24. Driver Distraction by Priority Scenarios for All GES Cases
0.00
0.10
0.20
0.30
0.40
0.50
0.60
0.70
0.80
0.90
1.00
Prop
ortio
n
Driver Distraction
S1 S2 S3 S4 OTHER SCENARIOS
Figure 25. Driver Distraction by Priority Scenarios for GES Fatalities

35
3.3 Pedestrian Characteristics PCAM systems will use forward looking sensors, typically RADAR and/or cameras, to identify pedestrians of all sizes. To be most effective, the system must be accurate in distinguishing pedestrians from background objects and obstructions. Sensor systems should be focused on targeting only pedestrians so that false activations can be minimized. Systems may use movement to supplement algorithms to help identify pedestrians; however, pedestrian movement can be erratic at times. Pedestrian characteristics including age, gender, size, alcohol/drug consumption, and harm functions are discussed in this section. 3.3.1 Pedestrian Age Pedestrian age was analyzed using the GES and FARS databases to gather insight on pedestrian size; generally, people grow bigger as they age and potentially get smaller in the elder years. The age of pedestrians involved in the four priority scenarios does not greatly vary, as seen from Figure 26, Figure 27, and Figure 28. Based on GES statistics, pedestrians under the age of 21 were frequently involved in vehicle-pedestrian collisions with as many as 49 percent in S1 and as little as 14 percent in S2. However, this statistic did not translate into a high fatality rate as compared to only 8 and 13 percent, respectively. The highest fatality rate was seen in older pedestrians, specifically between the ages of 41 and 50 years old at 22 percent in S1 and 26 percent in S4. Pedestrians above the age of 29 accounted for more than 60 percent of all fatalities in each scenario based on GES data.

36
0.00
0.05
0.10
0.15
0.20
0.25
0.30
0.35
Prop
ortio
n
Age (years)
S1 S2 S3 S4 OTHER SCENARIOS
Figure 26. Pedestrian Age by Priority Scenario for All GES
Cases
0.00
0.05
0.10
0.15
0.20
0.25
0.30
Prop
ortio
n
Age (years)
S1 S3 S4 OTHER SCENARIOS
Figure 27. Pedestrian Age by Priority Scenario for GES
Fatalities *Note that Scenario 2 only has one weighted case at 81-90 years
0.00
0.05
0.10
0.15
0.20
0.25
0.30
Prop
ortio
n
Age (years)
S1 S2 S3 S4 OTHER SCENARIOS
Figure 28. Pedestrian Age by Priority Scenario for FARS
Cases
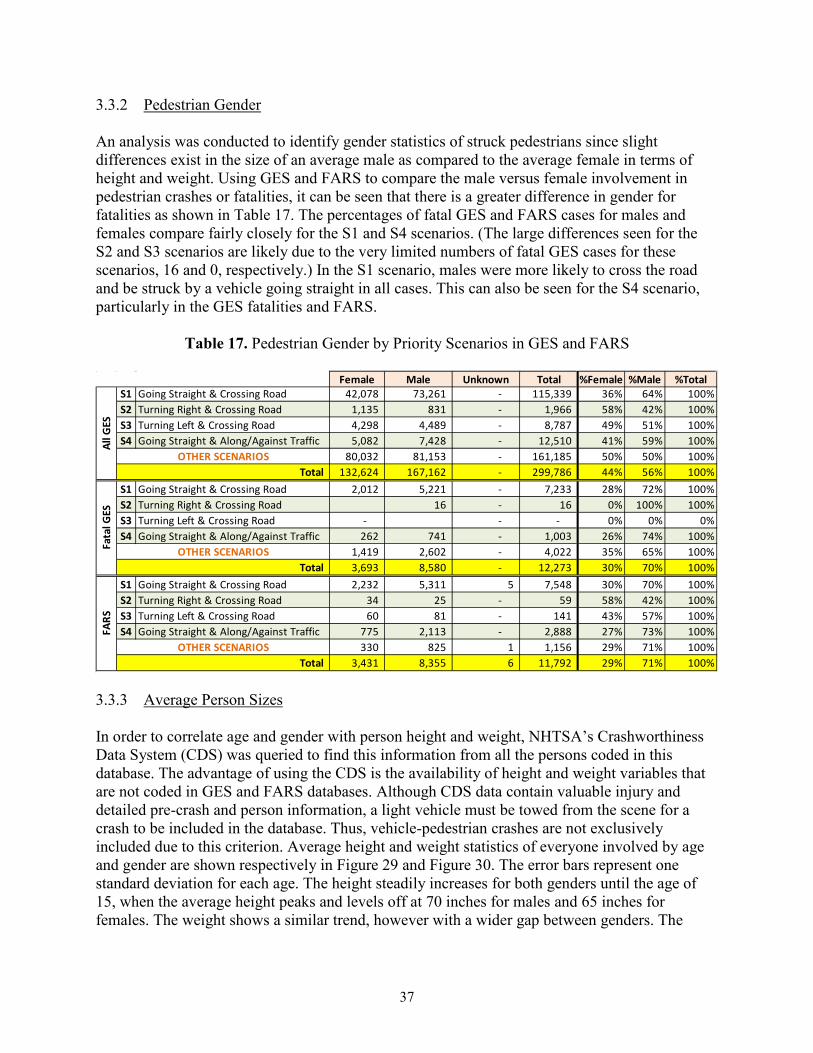
37
3.3.2 Pedestrian Gender An analysis was conducted to identify gender statistics of struck pedestrians since slight differences exist in the size of an average male as compared to the average female in terms of height and weight. Using GES and FARS to compare the male versus female involvement in pedestrian crashes or fatalities, it can be seen that there is a greater difference in gender for fatalities as shown in Table 17. The percentages of fatal GES and FARS cases for males and females compare fairly closely for the S1 and S4 scenarios. (The large differences seen for the S2 and S3 scenarios are likely due to the very limited numbers of fatal GES cases for these scenarios, 16 and 0, respectively.) In the S1 scenario, males were more likely to cross the road and be struck by a vehicle going straight in all cases. This can also be seen for the S4 scenario, particularly in the GES fatalities and FARS.
Table 17. Pedestrian Gender by Priority Scenarios in GES and FARS
Female Male Unknown Total %Female %Male %TotalS1 Going Straight & Crossing Road 42,078 73,261 - 115,339 36% 64% 100%S2 Turning Right & Crossing Road 1,135 831 - 1,966 58% 42% 100%S3 Turning Left & Crossing Road 4,298 4,489 - 8,787 49% 51% 100%S4 Going Straight & Along/Against Traffic 5,082 7,428 - 12,510 41% 59% 100%
80,032 81,153 - 161,185 50% 50% 100%132,624 167,162 - 299,786 44% 56% 100%
S1 Going Straight & Crossing Road 2,012 5,221 - 7,233 28% 72% 100%S2 Turning Right & Crossing Road 16 - 16 0% 100% 100%S3 Turning Left & Crossing Road - - - 0% 0% 0%S4 Going Straight & Along/Against Traffic 262 741 - 1,003 26% 74% 100%
1,419 2,602 - 4,022 35% 65% 100%3,693 8,580 - 12,273 30% 70% 100%
S1 Going Straight & Crossing Road 2,232 5,311 5 7,548 30% 70% 100%S2 Turning Right & Crossing Road 34 25 - 59 58% 42% 100%S3 Turning Left & Crossing Road 60 81 - 141 43% 57% 100%S4 Going Straight & Along/Against Traffic 775 2,113 - 2,888 27% 73% 100%
330 825 1 1,156 29% 71% 100%3,431 8,355 6 11,792 29% 71% 100%Total
All G
ESFa
tal G
ESFA
RS
OTHER SCENARIOSTotal
OTHER SCENARIOSTotal
OTHER SCENARIOS
3.3.3 Average Person Sizes In order to correlate age and gender with person height and weight, NHTSA’s Crashworthiness Data System (CDS) was queried to find this information from all the persons coded in this database. The advantage of using the CDS is the availability of height and weight variables that are not coded in GES and FARS databases. Although CDS data contain valuable injury and detailed pre-crash and person information, a light vehicle must be towed from the scene for a crash to be included in the database. Thus, vehicle-pedestrian crashes are not exclusively included due to this criterion. Average height and weight statistics of everyone involved by age and gender are shown respectively in Figure 29 and Figure 30. The error bars represent one standard deviation for each age. The height steadily increases for both genders until the age of 15, when the average height peaks and levels off at 70 inches for males and 65 inches for females. The weight shows a similar trend, however with a wider gap between genders. The

38
weight steadily increases until age 15 and becomes level at around 200 pounds for males and 160 pounds for females. A slight loss of weight is observed as people get older.
-
10
20
30
40
50
60
70
80
0 10 20 30 40 50 60 70 80 90 100
Aver
age
Heig
ht (I
n)
Age (Yrs)
Female Male
Figure 29. Person Average Height Based on CDS Data
-
50
100
150
200
250
300
0 10 20 30 40 50 60 70 80 90 100
Aver
age
Wei
ght
(lbs)
Age (Yrs)
Female Male
Figure 30. Person Average Weight Based on CDS Data

39
3.3.4 Pedestrian Alcohol Involvement Pedestrian alcohol involvement is shown in Table 18 for the four priority scenarios based on GES statistics. The majority of GES cases showed that alcohol is not a factor. Pedestrians in the S4 scenario had the highest alcohol involvement at 16 percent, followed by the S1 scenario at 13 percent. The two turning scenarios each had pedestrians who had 7 percent involvement with alcohol. Conversely, for those crashes involving fatalities, alcohol played a major role. All four scenarios showed that alcohol was more likely to be associated with a pedestrian who was fatally injured in a crash in over 68 percent of the cases. This could be due to the erratic behavior of an intoxicated pedestrian who may wander into the street unexpectedly.
Table 18. Pedestrian Alcohol Involvement by Priority Scenarios Based on GES Data
Alchohol Involved
No Alcohol Total% Alchohol
Involved% No
Alcohol% Total
S1 Going Straight & Crossing Road 14,810 100,529 115,339 13% 87% 100%S2 Turning Right & Crossing Road 130 1,836 1,966 7% 93% 100%S3 Turning Left & Crossing Road 628 8,159 8,787 7% 93% 100%S4 Going Straight & Along/Against Traffic 2,025 10,484 12,510 16% 84% 100%
9,485 151,700 161,185 6% 94% 100%27,078 272,708 299,786 9% 91% 100%
S1 Going Straight & Crossing Road 4,932 2,301 7,233 68% 32% 100%S2 Turning Right & Crossing Road 16 16 100% 0% 100%S3 Turning Left & Crossing Road - - 0% 0% 0%S4 Going Straight & Along/Against Traffic 845 158 1,003 84% 16% 100%
3,430 592 4,022 85% 15% 100%9,222 3,051 12,273 75% 25% 100%
OTHER SCENARIOSTotal
All C
ases
OTHER SCENARIOSTotal
Fata
litite
s
Pedestrian impairment is shown for all cases and fatalities respectively in Figure 31 and Figure 32 based on GES data. The majority of GES pedestrian cases were not impaired. This was true for over 74 percent of the cases for all four priority scenarios. Physically impaired (other) was the highest impairment category present, but the value for each scenario was 8 percent or below. This category includes physical impairments that were not specifically defined or could not be attributed to one of the other factors. The GES fatalities showed that 15 and 10 percent of fatalities were due to a physical impairment in S1 and S4, respectively. S4 also included 5 percent of cases due to illness and blackout. FARS variables were not included in this analysis since the variables were not consistent among the GES and FARS at the time of the analysis. Impaired pedestrians can have unpredictable movements into the roadway. PCAM systems would be effective in these scenarios if they were able to account for the erratic behaviors associated with an impaired pedestrian.

40
0.000.100.200.300.400.500.600.700.800.901.00
Prop
ortio
n
Pedestrian Impairment
S1 S2 S3 S4 OTHER SCENARIOS
Figure 31. Pedestrian Impairment by Priority Scenarios for All GES Cases
0.00
0.10
0.20
0.30
0.40
0.50
0.60
Prop
ortio
n
Pedestrian Impairment
S1 S2 S3 S4 OTHER SCENARIOS
Figure 32. Pedestrian Impairment by Priority Scenarios for GES Fatalities
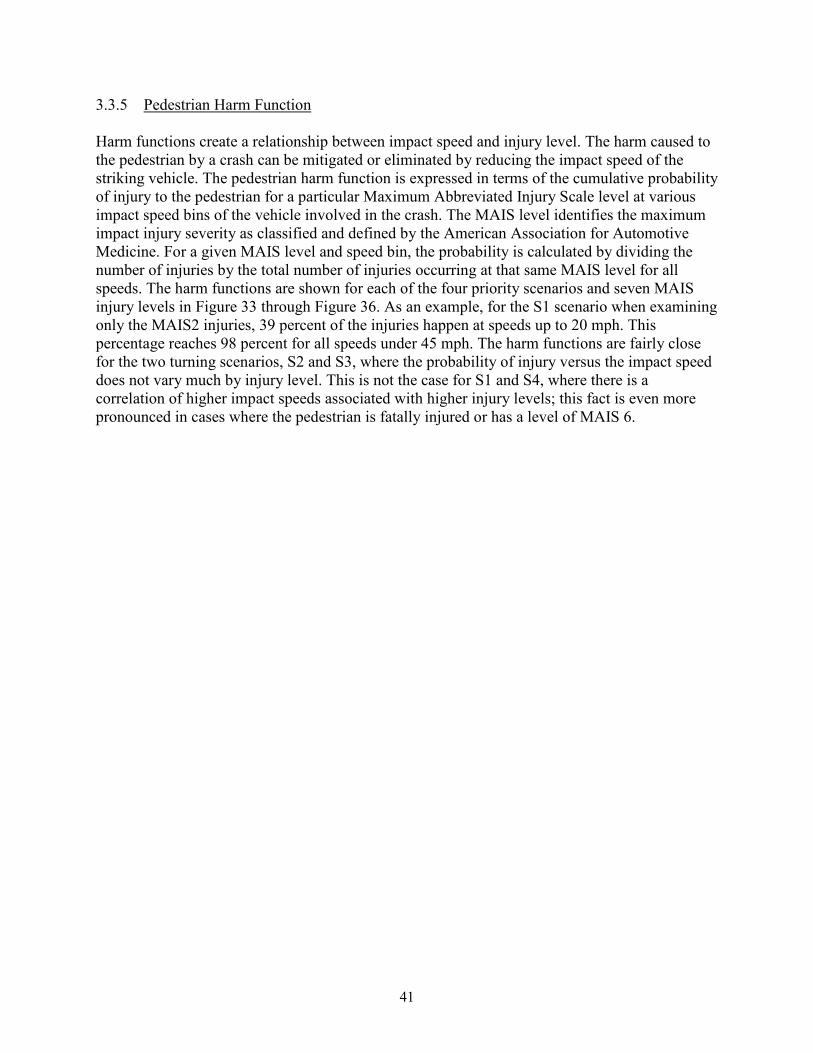
41
3.3.5 Pedestrian Harm Function Harm functions create a relationship between impact speed and injury level. The harm caused to the pedestrian by a crash can be mitigated or eliminated by reducing the impact speed of the striking vehicle. The pedestrian harm function is expressed in terms of the cumulative probability of injury to the pedestrian for a particular Maximum Abbreviated Injury Scale level at various impact speed bins of the vehicle involved in the crash. The MAIS level identifies the maximum impact injury severity as classified and defined by the American Association for Automotive Medicine. For a given MAIS level and speed bin, the probability is calculated by dividing the number of injuries by the total number of injuries occurring at that same MAIS level for all speeds. The harm functions are shown for each of the four priority scenarios and seven MAIS injury levels in Figure 33 through Figure 36. As an example, for the S1 scenario when examining only the MAIS2 injuries, 39 percent of the injuries happen at speeds up to 20 mph. This percentage reaches 98 percent for all speeds under 45 mph. The harm functions are fairly close for the two turning scenarios, S2 and S3, where the probability of injury versus the impact speed does not vary much by injury level. This is not the case for S1 and S4, where there is a correlation of higher impact speeds associated with higher injury levels; this fact is even more pronounced in cases where the pedestrian is fatally injured or has a level of MAIS 6.

42
-
0.10
0.20
0.30
0.40
0.50
0.60
0.70
0.80
0.90
1.00
Cum
ulat
ive
Prob
abili
ty o
f Inj
ury
Impact Speed (mph)
MAIS 0 MAIS 1 MAIS 2 MAIS 3 MAIS 4 MAIS 5 MAIS 6
Figure 33. Harm Function for Priority Scenario 1
-
0.10
0.20
0.30
0.40
0.50
0.60
0.70
0.80
0.90
1.00
Cum
ulat
ive P
roba
bilit
y of I
njur
y
Impact Speed (mph)
MAIS 0 MAIS 1 MAIS 2 MAIS 3 MAIS 4 MAIS 5 MAIS 6
Figure 34. Harm Function for Priority Scenario 2
-
0.10
0.20
0.30
0.40
0.50
0.60
0.70
0.80
0.90
1.00
Cum
ulat
ive
Prob
abili
ty o
f Inj
ury
Impact Speed (mph)
MAIS 0 MAIS 1 MAIS 2 MAIS 3 MAIS 4 MAIS 5 MAIS 6
Figure 35. Harm Function for Priority Scenario 3
-
0.10
0.20
0.30
0.40
0.50
0.60
0.70
0.80
0.90
1.00
Cum
ulat
ive
Prob
abili
ty o
f Inj
ury
Impact Speed (mph)
MAIS 0 MAIS 1 MAIS 2 MAIS 3 MAIS 4 MAIS 5 MAIS 6
Figure 36. Harm Function for Priority Scenario 4

43
4 PEDESTRIAN FATALITY LOCATIONS Data from FARS were queried to determine most common locations within the United States where pedestrian fatalities occurred. The information obtained was used to directly support CAMP’s Real-World Operational Assessment Data (ROAD) trip. This effort encompasses an actual driving road tour in which prototype PCAM systems were used in actual traffic locations. These locations were selected to maximize exposure to pedestrian pre-crash scenarios and desired traffic, atmospheric, and roadway condition addressed in previous sections. The PCAM systems will be assessed in terms of various characteristics such as pedestrian detection, activation criteria, unintended consequences, etc. All crashes in which a pedestrian was struck in the first event by a light vehicle moving forward were obtained from the 2008 through 2010 FARS database. The yearly fatality count for each of the 50 States and the District of Columbia are shown in Table 19. FARS data were used as the only database with readily available latitude and longitude information. Ideally, a mapping of all pedestrian incidents, regardless of injury level, would be used; however, the GES is a nationally representative sampling of police reports, therefore limiting sample size and accuracy. Overall, pedestrian fatalities accounted for a total of 9,652 cases. California had the greatest total pedestrian fatalities with a total of 1,309 fatalities, in contrast to 8 pedestrian deaths recorded in Vermont for the same time period. As a minimum, the route planning for the ROAD trip included trips to California, Florida, and New York since these States account for 32 percent of the fatalities occurring in the United States. In order to focus on specific areas within each State, GPS information associated with each fatality was used to provide geographical locations of high frequency crash areas. A custom Google map was created containing markers for each case for the 50 States and the District of Columbia. Note that in some instances, the GPS location of the case is not known and the marker is placed on a point on the equator. A sample map of the pedestrian fatalities that occurred in Alabama during 2008-2010 is shown in Figure 37. At the left of the map, the total number of fatalities is provided for each year. Appendix B contains information on the links to the Google Map Web sites. If an internet connection to an individual map is enabled, then access to each individual crash can be obtained by either clicking on the interactive links on the left of the map or on the map itself. The naming convention of each individual crash is as follows.
Crash identifier # AL08-1-10416 where: AL - State abbreviation
08 - Last 2 digits of the year 1 - Sequential numbering of cases within FARS consistent with State and year 10416 - FARS case number Although infrequent, multiple fatalities occurring in the same crash have identical case numbers defined but with different sequential numbers associated with each fatality. Note that in some States with high numbers of pedestrian fatalities such as California, the maps may span multiple pages with each individual page capable of containing 200 fatalities. Localities of dense fatalities and cities with close proximity were the focus for the ROAD trip destinations.

44
Table 19. 2008-2010 United States Pedestrian Fatality Counts
2008 2009 2010 2008 2009 20101 California 460 421 428 1,309 14% 27 Oregon 41 27 43 111 1%2 Florida 394 385 394 1,173 12% 28 Colorado 31 43 29 103 1%3 Texas 291 244 249 784 8% 29 Nevada 42 26 30 98 1%4 New York 193 210 213 616 6% 30 New Mexico 29 33 27 89 1%5 North Carolina 118 116 129 363 4% 31 Arkansas 34 25 27 86 1%6 Georgia 102 117 120 339 4% 32 Connecticut 30 20 30 80 1%7 New Jersey 111 115 101 327 3% 33 Minnesota 21 28 30 79 1%8 Pennsylvania 105 105 109 319 3% 34 Utah 28 14 23 65 1%9 Michigan 101 96 109 306 3% 35 Hawaii 17 13 19 49 1%
10 Maryland 102 86 71 259 3% 36 Delaware 18 12 12 42 0%11 Arizona 93 69 95 257 3% 37 Kansas 13 19 8 40 0%12 Illinois 94 80 75 249 3% 38 Iowa 9 16 13 38 0%13 Louisiana 87 88 59 234 2% 39 West Virginia 9 19 10 38 0%14 South Carolina 80 79 73 232 2% 40 Maine 11 11 9 31 0%15 Ohio 79 65 76 220 2% 41 Idaho 10 8 10 28 0%16 Virginia 59 59 53 171 2% 42 Montana 7 13 6 26 0%17 Tennessee 45 54 64 163 2% 43 Rhode Island 9 13 4 26 0%18 Alabama 56 44 44 144 1% 44 Wash. D.C. 8 7 10 25 0%19 Washington 49 48 47 144 1% 45 New Hampshire 7 7 8 22 0%20 Mississippi 45 50 43 138 1% 46 South Dakota 7 4 8 19 0%21 Massachusetts 54 36 46 136 1% 47 Alaska 2 8 5 15 0%22 Missouri 45 54 36 135 1% 48 Nebraska 3 7 5 15 0%23 Kentucky 50 33 45 128 1% 49 North Dakota 4 2 4 10 0%24 Indiana 42 34 48 124 1% 50 Wyoming 5 1 3 9 0%25 Wisconsin 47 29 41 117 1% 51 Vermont 1 4 3 8 0%26 Oklahoma 40 24 49 113 1% Totals 3,338 3,121 3,193 9,652 100%
FARS Fatality CountTotal %Rank State
FARS Fatality CountTotal Rank State%
Figure 37. Pedestrian Fatalities Google Map for Alabama

45
5 SAFETY BENEFIT ESTIMATION This section presents the methodology to estimate potential system effectiveness and safety benefits for PCAM prototype systems. A PCAM-equipped vehicle has the ability to avoid or decrease the severity of an imminent crash with a pedestrian by reducing the speed of the vehicle prior to impact, thus resulting in a safety benefit. A general equation of safety benefits and system effectiveness is presented. System effectiveness is dependent on the ratio of the total harm with PCAM intervention to the total harm without PCAM intervention (baseline). NHTSA crash data related to a pedestrian struck in the first harmful event by a light vehicle traveling forward were queried to obtain the average harm functions. Objective tests are used to determine PCAM system performance in target crash scenarios and the results are applied to the target crash population. PCAM-applicable target crashes are those that involve a vehicle in which the driver did not apply the brakes and the vehicle did not lose control upon impact with the pedestrians. Safety benefits are expressed in reductions of annual harm measures in terms of pedestrian injuries avoided and pedestrian injuries mitigated. 5.1 General Equation of Safety Benefits Potential safety benefits in terms of a specific harm measure, m, are estimated from the following equation: Bm = Nm × αm × SEm (1) where:
Bm ≡ Benefit or reduction in annual harm measure, m Nm ≡ Annual value of harm measure, m, in target crash scenario (i.e., vehicle moving
forward and striking the pedestrian by the front end in the first harmful event) αm ≡ Ratio of harm measure, m, in PCAM-applicable crash scenario (i.e., driver did not
apply the brakes and the vehicle remained in control prior to striking the pedestrian) over harm measure, m, in target crash scenario
SEm ≡ PCAM effectiveness in reducing annual harm measure, m (defined in Section 5.2) The harm measure, m, is defined for two values, m1 and m2, where:
m1 ≡ Number of pedestrians with a Maximum Abbreviated Injury Scale (MAIS) injury of 2 and above (MAIS2+)
m2 ≡ Number of pedestrians with a MAIS3+ injury
5.2 General Equation of System Effectiveness
The value of PCAM effectiveness in reducing the annual harm, SEm, is estimated using crash statistics and system performance test data. The system effectiveness is determined based on the number of pedestrian injuries that are mitigated and avoided. The crash mitigation portion of the system effectiveness of the PCAM system is described in terms of the ratio of the total harm with PCAM, Hm(PCAM), to the total harm without PCAM, Hm(Baseline), given that a crash has occurred. The pedestrian injury avoidance portion of the system effectiveness is described in

46
terms of the ratio of the probability of a pedestrian injury with PCAM, ppedinj(PCAM), to the probability of a pedestrian injury without PCAM, ppedinj(Baseline), for the pedestrian injuries that were avoided. The equation of system effectiveness in terms of harm measure, m, is shown below:
(2)
where for an avoided pedestrian injury: ppedinj(PCAM) ≡ Probability of pedestrian struck by the front-end of a moving vehicle
equipped with PCAM ppedinj(Baseline) ≡ Probability of pedestrian struck by the front-end of a moving vehicle
not equipped with PCAM
The total harm, Hm, for PCAM intervention and baseline cases is expressed in terms of the average harm and proportion of pedestrians struck at each of the 16 impact speed bins used in this analysis as shown below in Equations (3) and (4). Impact speed bins are used to determine relative frequency of impact speeds in pedestrian crashes based on 5 km/h (3.1 mph) bins, starting from 0 km/h (bin 1) to above 75 km/h (46.6 mph) (bin 16). Hm(PCAM) ≡ Total harm, m, with PCAM intervention: (3)
Hm(Baseline) ≡ Total harm, m, without PCAM intervention (baseline harm): (4)
where: hm(i) ≡ Average harm, m, to a pedestrian struck by the front-end of a moving vehicle at
impact speed bin, i OPCAM(i) ≡ Proportion of pedestrians struck in PCAM-applicable crash scenario by
vehicles equipped with PCAM and traveling at impact speed bin, i OBaseline(i) ≡ Proportion of pedestrians struck in PCAM-applicable crash scenario by
vehicles not equipped with PCAM (baseline) and traveling at impact speed bin, i
Pedestrian Injury
Mitigation
Pedestrian Injury
Avoidance

47
5.2.1 Assumptions
The safety benefit estimation does not account for any unintended consequences and assumes that all light vehicles are equipped with PCAM systems. Moreover, it is assumed that the PCAM system has 100 percent true activation rate without any false activation, the driver in PCAM-applicable crashes did not apply the brakes, and a warning system may improve this; however, the methodology in this report also assumes the driver does not apply the brakes and the system effectiveness is derived only from autonomous braking. The methodology does not account for different types of road conditions, lighting, or adverse weather. Thus, the safety benefit estimation assumes the best case scenario; system performance is independent of vehicle prototype and the best performing system in the objective tests is used in the calculations. It should be noted that the performance of prototype systems in the objective tests does not reflect the observed performance of an individual PCAM system or more mature prototypes. Finally, the analysis is based on a simplified methodology and is limited by available data due to small sample sizes, unknowns in the data, etc., which can be addressed in future research with modifications such as adding additional crash years, imputing variables, etc., to provide more accurate results.
5.2.2 Crash Database Adjustment Factors To calculate the travel speed before impact and the impact speed bin i, the “travel speed” variable in the 2009 GES crash database was examined. The total sample of 1,042 pedestrian cases struck by the front-end of the vehicle contained a high number of unknowns for travel speed (748 cases or about 72%). There were 288 pedestrian cases (28%) struck by vehicles traveling over 2 mph. Accounting for vehicles not braking and in control, there were 211 pedestrian cases with only 54 cases (26%) with coded travel speeds over 2 mph. Because of the high number of unknown travel speed variables, the PCDS crash database was used as an alternative data source to represent the number of pedestrians that were struck and their corresponding injury level resulting from a given impact speed. However, PCDS contains 552 pedestrian cases and does not provide case weight values to represent the national pedestrian crash statistics. Note that since the PCDS contains only vehicles with older model years (1988-1999), the relationship between impact speed and pedestrian injury may be substantially different for current vehicles. To provide a speed-injury relationship based on newer vehicle models rather than the older models present in the PCDS crash database, the GES crash database variables, “travel speed,” “speed limit,” and “speed related” (indicating whether speed is a contributing factor to the cause of the crash) could be used as a rough surrogate for impact speed to provide either the primary or a comparative assessment of the impact speed-pedestrian injury relationship. Follow-on analysis could use this approach but note that the high number of unknowns of the GES coded variables may cause problems with the analysis and multiple years of data should be explored. The 16 impact speed bins selected for this analysis span from under 5 km/h (3.1 mph) to over 75 km/h (46.6 mph). To match the injury severity of the PCDS cases in the target crash population to the 2009 GES cases, adjustment factors were obtained to apply to each PCDS case. The PCDS provides injury level data in both the MAIS and KABCO scale. The PCDS contains 448 cases with KABCO codes in which the pedestrian was struck by the front end of a light vehicle moving forward.

48
Table 20 shows the distribution of these pedestrians by the KABCO injury level for the PCDS and 2009 GES. The highlighted column provides the PCDS case weight required to match the GES and PCDS injury distributions. The appropriate factor is applied to each PCDS case according to the corresponding KABCO level. Note that adjustment factors for the PCDS case counts are better determined by matching the distributions of variables that directly affect the injury severity resulting from a given speed (e.g., age, gender, vehicle type) and other variables that arise in the benefits computation, rather than matching the injury distributions only. However, this analysis is constrained by the availability of PCDS cases in the various desired distributions.
Table 20. Adjustment Factors for PCDS Pedestrian Case Counts
KABCO Scale PCDS Case Weights Total
O - No injury 4 0.9% 50 0.1% 12.39 50
C - Possible injury 105 23.4% 8,872 24.3% 84.49 8,872
B - Nonincapacitating injury 113 25.2% 14,572 39.9% 128.96 14,572
A - Incapacitating injury 150 33.5% 8,417 23.1% 56.11 8,417
K - Fatal injury 51 11.4% 2,031 5.6% 39.83 2,031
U - Injured - severity unknown 7 1.6% 1,682 4.6% 240.35 1,682
Unknown if injured 18 4.0% - 0.0% - -
Total 448 100.0% 35,623 97.6% 35,623
PCDS 2009 GES
5.3 Harm Measures The values for the annual harm, Nm, the ratio of harm, αm, and the average harm function are presented in this section. These values are presented for two harm measures, m1 and m2, and are equal to the number of pedestrians injured at MAIS2+ and MAIS3+, respectively. 5.3.1 Annual Harm
The value of Nm is obtained from the 2009 GES crash database[2] by querying the distribution of pedestrians by KABCO injury scale in crashes that involved a light vehicle moving forward (i.e., not stopped in traffic lane, disabled or parked in travel lane, backing up, etc.) and striking the pedestrian by the front end of the vehicle in the first armful event. Approximately 35,623 pedestrians were struck within the limits of these conditions and KABCO injuries were retrieved. The KABCO data is based on information coded in police reports and may contain some inaccurate or missing information on the injury levels. Table 21 provides a matrix used to translate the KABCO distribution into MAIS distribution. Using the conversion table, the injury KABCO injuries were translated to MAIS values and results for annual harm were calculated as:
• N1 = 8,598 pedestrians injured at MAIS 2+ • N2 = 4,502 pedestrians injured at MAIS 3+

49
Table 21. KABCO-MAIS Injury Level Conversion
The FARS data set is recommended for examining fatalities since it is a more accurate representation of fatalities; however, only the GES was used since the variables used to identify the pre-crash scenarios were not available in FARS at the time of this analysis. These variables are made available starting with 2010 FARS. Table 22 shows the results of further breakdown of the target population into categories consistent with the objective test scenarios. Note that the objective tests and scenarios are discussed later in this section. The annual harm in terms of MAIS2+ and MAIS3+ is shown for each of the four priority scenarios according to whether there was a physical obstruction to the driver’s view of the pedestrian and whether the pedestrian was running or walking. The 2009 GES cases were filtered to include curves, hills, buildings, trees, in-transport and parked vehicles, etc. to represent physical obstructions. The cases did not include obstructions due to the weather, glare, lighting, etc. to maintain consistency with the test conditions. The pedestrian “walking” cases included those which the pedestrian was walking with or against traffic, crossing the road, playing working, sitting, lying, or standing in the road, etc. The “running” cases included darting, running, and jogging in the road. Note that the case counts are low after filtering for pedestrian maneuver and obstruction, especially in the S2, S3, and S4 scenarios; initially, there were not many cases for the target population in these scenarios especially after filtering for the drivers that did not apply the brake in a vehicle that remained in control before impact with a pedestrian.
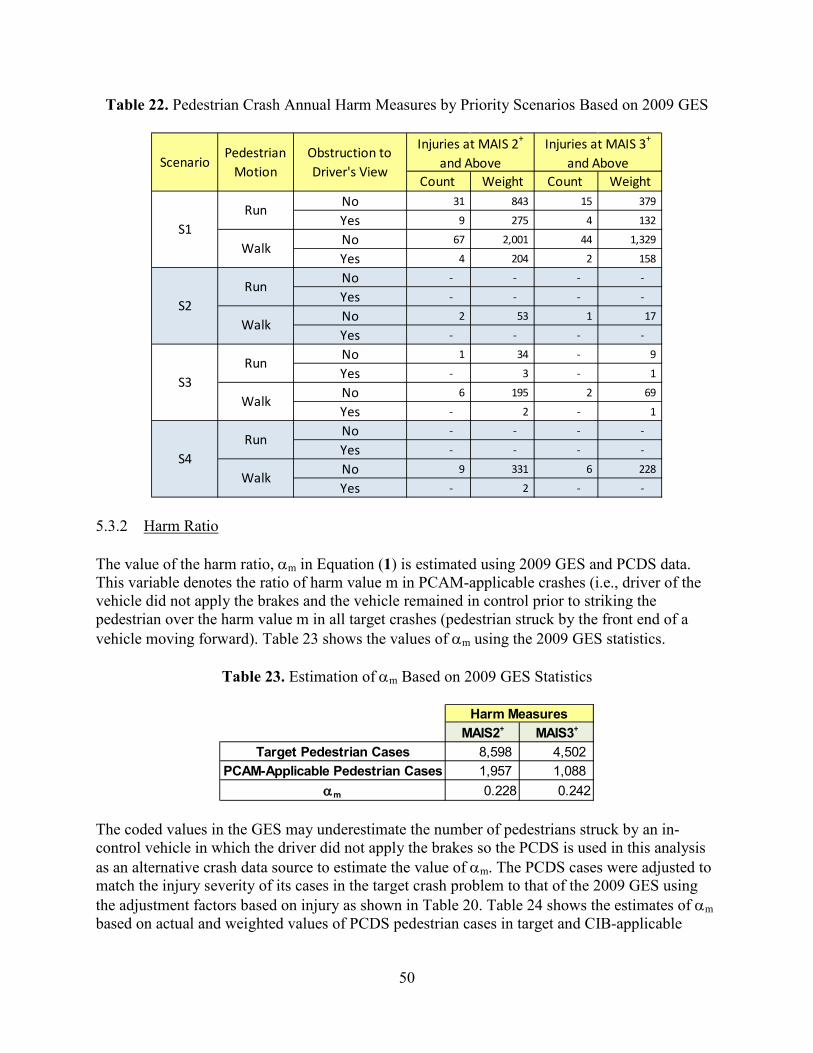
50
Table 22. Pedestrian Crash Annual Harm Measures by Priority Scenarios Based on 2009 GES
Count Weight Count WeightNo 31 843 15 379
Yes 9 275 4 132
No 67 2,001 44 1,329
Yes 4 204 2 158
No - - - -
Yes - - - -
No 2 53 1 17
Yes - - - -
No 1 34 - 9
Yes - 3 - 1
No 6 195 2 69
Yes - 2 - 1
No - - - -
Yes - - - -
No 9 331 6 228
Yes - 2 - -
S1
S2
S3
S4
Run
Walk
Run
Walk
Run
Walk
Run
Walk
Injuries at MAIS 2+
and AboveInjuries at MAIS 3+
and AboveObstruction to Driver's View
Pedestrian Motion
Scenario
5.3.2 Harm Ratio
The value of the harm ratio, αm in Equation (1) is estimated using 2009 GES and PCDS data. This variable denotes the ratio of harm value m in PCAM-applicable crashes (i.e., driver of the vehicle did not apply the brakes and the vehicle remained in control prior to striking the pedestrian over the harm value m in all target crashes (pedestrian struck by the front end of a vehicle moving forward). Table 23 shows the values of αm using the 2009 GES statistics.
Table 23. Estimation of αm Based on 2009 GES Statistics
MAIS2+ MAIS3+
Target Pedestrian Cases 8,598 4,502 PCAM-Applicable Pedestrian Cases 1,957 1,088
αm 0.228 0.242
Harm Measures
The coded values in the GES may underestimate the number of pedestrians struck by an in-control vehicle in which the driver did not apply the brakes so the PCDS is used in this analysis as an alternative crash data source to estimate the value of αm. The PCDS cases were adjusted to match the injury severity of its cases in the target crash problem to that of the 2009 GES using the adjustment factors based on injury as shown in Table 20. Table 24 shows the estimates of αm based on actual and weighted values of PCDS pedestrian cases in target and CIB-applicable

51
crashes. As seen in Table 23 and Table 24, estimates of αm are an average of 1.6 times higher in the PCDS than in the 2009 GES based on actual and weighted case counts.
Table 24. Estimation of αm Based on PCDS Data
MAIS2+ MAIS3+ MAIS2+ MAIS3+
Target Pedestrian Cases 259 175 17,919 10,483 PCAM-Applicable Pedestrian Cases 101 67 6,454 3,727
αm 0.390 0.383 0.360 0.356
Harm MeasuresPCDS Counts PCDS Weight*
*The PCDS case counts were adjusted to match the injury severity to the 2009 GES to obtain national estimates.
5.3.3 Average Harm Function Harm functions create a relationship between impact speed and pedestrian injury, quantifying the probability of a pedestrian being injured at a specific level when struck at a specific speed. The analysis of the PCDS crash database yielded 448 pedestrian cases in the target crash scenario injured at MAIS 0-6 with 74 cases without impact speed information. There is an additional pedestrian case with MAIS code of 7 not included in this analysis. Table 25 shows the values of hm(i) based on actual counts of PCDS cases. The target crash scenario includes all pedestrians struck by the front of a vehicle moving forward (i.e., the vehicle is not stopped in a traffic lane, disabled or parked in travel lane or backing up). The “other” category of the pre-event movement variable is included in the harm analysis since this category may incorporate cases in which the vehicle is being pushed prior to the crash and therefore, consistent with the vehicle moving forward. However, it is excluded from the target crash analysis since the vehicle was being pushed prior to the crash. As discussed in the previous section, the PCDS case counts were adjusted to match their injury severity to that of the 2009 GES. The PCDS contains 449 cases with KABCO codes, in which the pedestrian was struck by the front end of a vehicle moving forward including the code 97 in the pre-event movement variable. The 2009 GES estimates accounted for 36,513 pedestrians struck in a similar crash scenario (slightly higher than the 35,623 pedestrians mentioned above due to the inclusion of the code 97 in the MANEUV_I variable). Table 26 shows the distribution of these pedestrians by the KABCO injury level for the PCDS and 2009 GES. The highlighted column provides the adjustment factors assigned to each PCDS case for each corresponding KABCO level to match the GES and PCDS injury distributions as described in Section 5.2.2.

52
Table 25. Average Harm Functions Based on Actual PCDS Case Counts
IS<5 1 14 4 0.286 0 0.0005≤IS<10 2 38 8 0.211 4 0.10510≤IS<15 3 47 12 0.255 1 0.02115≤IS<20 4 61 28 0.459 15 0.24620≤IS<25 5 26 16 0.615 6 0.23125≤IS<30 6 34 19 0.559 10 0.29430≤IS<35 7 34 21 0.618 17 0.50035≤IS<40 8 30 21 0.700 16 0.53340≤IS<45 9 20 17 0.850 12 0.60045≤IS<50 10 12 11 0.917 10 0.83350≤IS<55 11 9 9 1.000 7 0.77855≤IS<60 12 13 12 0.923 11 0.84660≤IS<65 13 10 10 1.000 9 0.90065≤IS<70 14 7 7 1.000 7 1.00070≤IS<75 15 4 4 1.000 3 0.75075≤IS 16 15 15 1.000 15 1.000
Impact Speed, IS (km/h)
Bin MAIS 0-6 MAIS2+ pMAIS2+ MAIS3+ pMAIS3+
Table 26. Adjustment Factors of PCDS Pedestrian Case Counts for Average Harm Estimation
KABCO Scale PCDS Case Weights Total
O - No injury 4 0.9% 50 0.1% 12.39 50
C - Possible injury 106 23.6% 9,499 26.0% 89.62 9,499
B - Nonincapacitating injury 113 25.2% 14,749 40.4% 130.52 14,749
A - Incapacitating injury 150 33.4% 8,482 23.2% 56.55 8,482
K - Fatal injury 51 11.4% 2,051 5.6% 40.22 2,051
U - Injured - severity unknown 7 1.6% 1,682 4.6% 240.35 1,682
Unknown if injured 18 4.0% - 0.0% - -
Total 449 100.0% 36,513 100.0% 36,513
PCDS - Raw Counts 2009 GES

53
0.0%
5.0%
10.0%
15.0%
20.0%
25.0%
30.0%
35.0%
40.0%
45.0%
O C B A K IU U
Prop
ortio
n of
Ped
estr
ians
Injury Severity
PCDS 2009 GES
Figure 38. Comparison of Pedestrian Distributions by KABCO Scale Between PCDS and GES Figure 38 compares the distributions of pedestrians by KABCO level between the actual PCDS counts and 2009 GES estimates. As seen in Figure 38, the PCDS cases are slightly more severe than the GES. Table 27 replicates the average harm data presented in Table 25 by using the weighted PCDS case counts.
Table 27. Average Harm Functions Based on Weighted PCDS Case Counts
IS<5 1 1,336 351 0.262 - 0.0005≤IS<10 2 3,382 446 0.132 153 0.04510≤IS<15 3 4,446 1,135 0.255 90 0.02015≤IS<20 4 5,646 2,203 0.390 989 0.17520≤IS<25 5 2,500 1,555 0.622 520 0.20825≤IS<30 6 2,645 1,242 0.469 583 0.22030≤IS<35 7 3,141 1,813 0.577 1,552 0.49435≤IS<40 8 2,774 1,796 0.647 1,258 0.45440≤IS<45 9 1,314 1,037 0.789 573 0.43645≤IS<50 10 736 606 0.823 549 0.74650≤IS<55 11 550 550 1.000 453 0.82455≤IS<60 12 801 671 0.837 614 0.76760≤IS<65 13 558 558 1.000 427 0.76665≤IS<70 14 347 347 1.000 347 1.00070≤IS<75 15 226 226 1.000 170 0.75075≤IS 16 628 628 1.000 628 1.000
MAIS3+ pMAIS3+Impact Speed
Bin MAIS 0-6 MAIS2+ pMAIS2+

54
5.3.4 Curve Fitting/ Smoothing of Average Harm Function The average harm functions expressed in terms of the probability of an MAIS 2+ injury or a MAIS 3+ injury, pMAIS 2+ and pMAIS 3+, based on the actual PCDS case counts in Table 25 and the weighted PCDS counts in Table 27 were fitted or smoothed to appropriate curves. The harm functions were fitted to the following equation using a programmed function to minimize the sum of squared errors:
(5)
where ISn ≡ Impact speed bin # Table 28 presents the average harm values from the smoothed functions for the actual and weighted PCDS case counts. The constants used in Equation (5) for each harm function are as follows:
Actual PCDS case counts • pMAIS 2+: a = 0.38 and b = 4.84 • pMAIS 3+: a = 0.43 and b = 7.63
Weighted PCDS case counts • pMAIS 2+: a = 0.36 and b = 5.46 • pMAIS 3+: a = 0.40 and b = 8.41

55
Table 28. Smoothed Average Harm Functions
pMAIS2+ pMAIS3+ pMAIS2+ pMAIS3+1 0.187 0.055 0.166 0.048 2 0.252 0.082 0.222 0.071 3 0.331 0.121 0.291 0.102 4 0.420 0.174 0.371 0.145 5 0.515 0.245 0.459 0.202 6 0.609 0.332 0.549 0.275 7 0.695 0.433 0.636 0.362 8 0.770 0.540 0.715 0.458 9 0.831 0.643 0.783 0.558 10 0.878 0.734 0.838 0.654 11 0.913 0.809 0.881 0.739 12 0.939 0.867 0.914 0.809 13 0.958 0.909 0.939 0.863 14 0.971 0.939 0.957 0.904 15 0.980 0.959 0.969 0.934 16 0.986 0.973 0.978 0.955
Smoothed ≡ Original data was fitted to a specified function*The PCDS case counts were adjusted to match the injury severity to the 2009 GES to obtain national estimates.
PCDS Weight*PCDS CountImpact Speed, IS
(km/h)
5.4 PCAM Objective Tests CAMP used previous work completed from the CIB project[1], PCAM Pedestrian ROAD trip, and the identification of target pre-crash scenarios for the development of objective tests and performance guidelines to further develop PCAM systems. Functional tests were performed using vehicles equipped with sensors to detect a simulated pedestrian. The tests were assessed for performance, functionality, repeatability, and limitations. Three vehicles were used equipped with various sensor and crash avoidance technologies, including forward facing radar and/or with video sensors and dynamic brake support. The pedestrian was simulated using a mannequin suspended from a test rig, which moved on an adjustable motorized track designed to match the contour of the road. The tests were conducted for the four priority pre-crash scenarios, but more emphasis was placed on the S1 and S4 scenarios due to the higher occurrence of crashes and number of fatalities in these scenarios as identified in this report. The tests were conducted for various conditions such as pedestrian direction, light conditions, obstructions, test vehicle speeds, pedestrian speeds, and PCAM functions. The number of functional tests performed is shown in Table 29. Operational test scenarios that were derived from the PCAM ROAD trip provided additional tests which had the potential to trigger undesirable system activations.

56
Table 29. PCAM Functional Tests Performed by CAMP
S1 Stop in Lane Center 10 10 10
S1 Transition to night Crossing, Twiglight 23 0 41S1 Night Crossing, Night 8 0 13
S4 Static In Vehicle Lane 29 0 20S4 Moving In Vehicle Lane 32 34 21
S2 Vehicle Right Turn 10 10 4S3 Vehicle Left Turn 20 12 9
S1* Centered Crossing 145 39 169S1** Far Edge Crossing 45 26 20
Scenario Description Vehicle A Vehicle B Vehicle C
*Indicates tests where the mannequin strikes at center of test vehicle if no braking occurs ** Indicates tests where the mannequin strikes at far edge of test vehicle if no braking occurs 5.4.1 PCAM System Performance Approximately 900 tests were conducted using three different vehicles, including characterization and functional tests. As noted in Table 29, various test combinations were conducted between vehicles (Vehicles A, B, C), scenarios (S1, S2, S3, S4), pedestrian speeds (static, walk, run), pedestrian directions (right-left, left-right, away, toward), vehicle speeds (5, 10, 15, 25 mph), and obstruction timing (none, 1300 ms, 2700 ms). This set of combinations yielded 101 unique functional tests and 28 unique operational tests. The task of determining which tests results should be applied to the pedestrian data focused on: the best performing vehicle per scenario, deciding which parameters were of most importance, applicability towards the baseline crash data, and statistically significant differences between tests. Based on a preliminary analysis of activation, avoidance, and mitigation rates, Vehicle C performed the best in S1; Vehicle B performed the best in S2 and S3, and Vehicle A performed the best in S4. Next, certain test features that could not easily be determined or had no statistically significant difference between test results were combined. For example, pedestrian direction could only be determined from schematics in PCDS and an even representation of pedestrian direction was found; there was also a minimal difference between test results. Obstruction timing, early reveal of the pedestrian (2,700 ms before impact) and late reveal (1,300 ms before impact) could not be determined from crash data but it had minimal difference in test results between the different timings; however, it was different compared to having no obstruction at all. The sample was reduced to 59 total tests consisting of 69 percent-S1, 5 percent-S2, 7 percent-S3, and 19 percent-S4 cases. A preliminary analysis of baseline crash data, test data results, and results from target population yielded small samples for various scenarios; for this reason, this report will focus on S1 with a pedestrian crossing with no obstruction, both running and walking. Results from the S1 activation tests are displayed for a pedestrian running and pedestrian walking in Table 30 and Table 31 respectively. The average speed reduction in the S1 scenarios described above for the test vehicle speeds is shown below in Figure 39. Results show that vehicle speed and pedestrian speed have a significant impact on speed reduction at higher speeds. These test results were applied to baseline crash data to obtain pedestrian distributions with PCAM intervention, as described in subsequent sections.
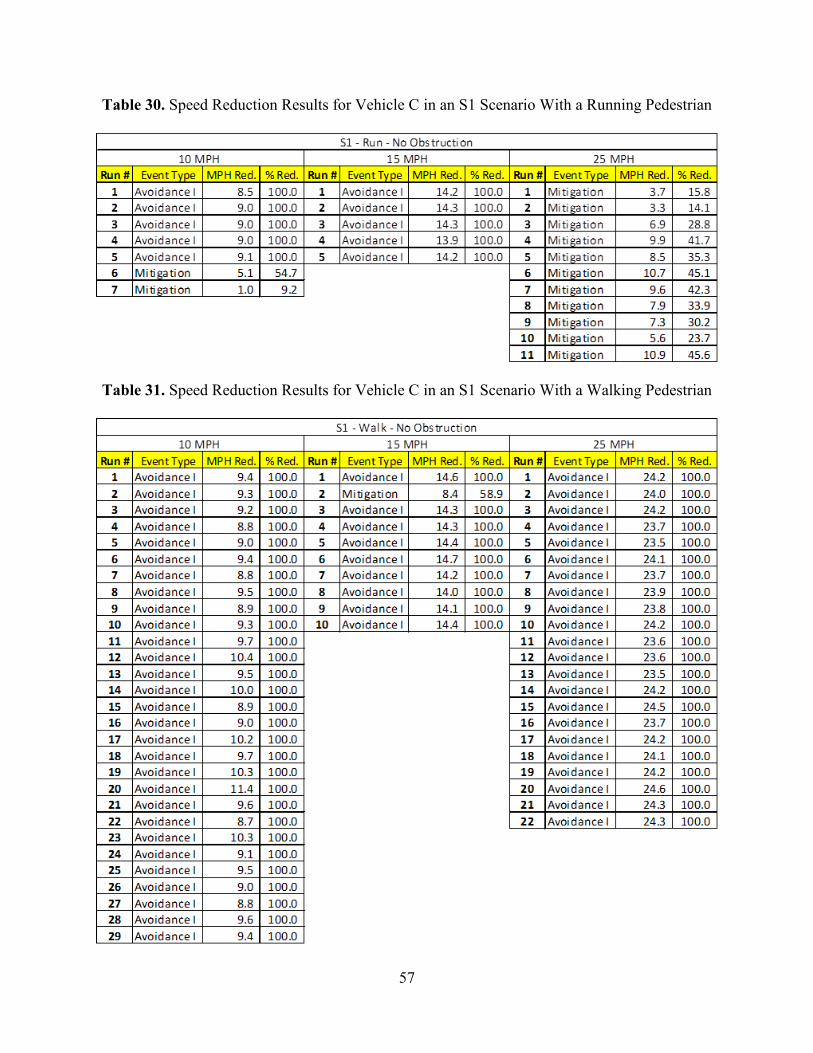
57
Table 30. Speed Reduction Results for Vehicle C in an S1 Scenario With a Running Pedestrian
Table 31. Speed Reduction Results for Vehicle C in an S1 Scenario With a Walking Pedestrian

58
Figure 39. Average Speed Reduction (mph) for Vehicle C in S1 Scenarios
5.5 Pedestrian Distribution In order to determine the distribution of pedestrians in baseline PCAM-applicable crashes by impact speed, target crashes must be filtered to only include vehicles moving forward in which the driver did not apply the brakes and the vehicle did not lose control (PCAM applicability) prior to striking the pedestrian by the front end of the vehicle. PCDS data was chosen as it contained the most complete data; PCDS crash data contains 448 target crash cases and 169 PCAM-applicable crash cases. Table 32 shows the statistics of the pedestrian distribution for the target and PCAM-applicable crashes based on actual and weighted PCDS case counts. There are 150 cases with known impact speeds for PCAM-applicable crashes based on the actual PCDS count and 11,743 cases based on the weighted PCDS count. The distribution of the PCAM-applicable cases by the priority pre-crash scenarios, S1, S2, S3, and S4, are shown in Table 33 and Table 34 for actual and weighted cases, respectively. There were 9 actual case counts and 948 weighted cases that did not fall into one of these scenarios. An especially limited distribution for the S2 and S4 scenarios was observed. For this reason, this report will focus on exercising the safety benefit estimation methodology for the S1 scenario.
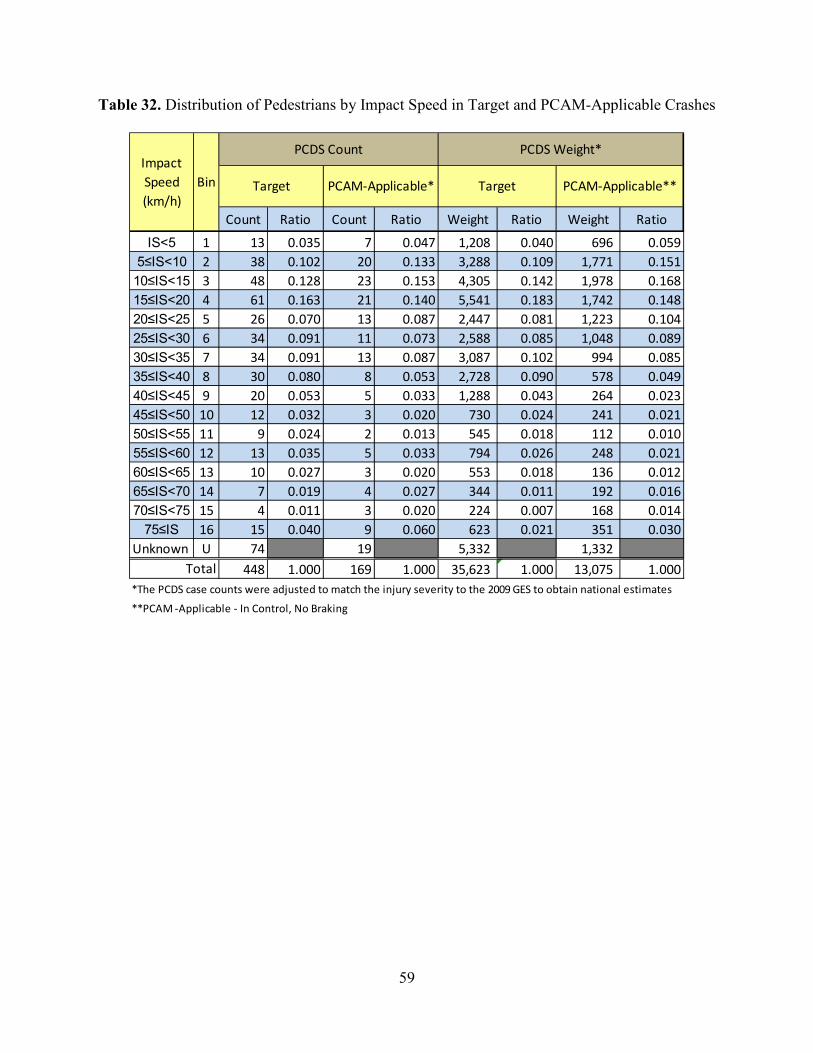
59
Table 32. Distribution of Pedestrians by Impact Speed in Target and PCAM-Applicable Crashes
Count Ratio Count Ratio Weight Ratio Weight Ratio
IS<5 1 13 0.035 7 0.047 1,208 0.040 696 0.0595≤IS<10 2 38 0.102 20 0.133 3,288 0.109 1,771 0.15110≤IS<15 3 48 0.128 23 0.153 4,305 0.142 1,978 0.16815≤IS<20 4 61 0.163 21 0.140 5,541 0.183 1,742 0.14820≤IS<25 5 26 0.070 13 0.087 2,447 0.081 1,223 0.10425≤IS<30 6 34 0.091 11 0.073 2,588 0.085 1,048 0.08930≤IS<35 7 34 0.091 13 0.087 3,087 0.102 994 0.08535≤IS<40 8 30 0.080 8 0.053 2,728 0.090 578 0.04940≤IS<45 9 20 0.053 5 0.033 1,288 0.043 264 0.02345≤IS<50 10 12 0.032 3 0.020 730 0.024 241 0.02150≤IS<55 11 9 0.024 2 0.013 545 0.018 112 0.01055≤IS<60 12 13 0.035 5 0.033 794 0.026 248 0.02160≤IS<65 13 10 0.027 3 0.020 553 0.018 136 0.01265≤IS<70 14 7 0.019 4 0.027 344 0.011 192 0.01670≤IS<75 15 4 0.011 3 0.020 224 0.007 168 0.01475≤IS 16 15 0.040 9 0.060 623 0.021 351 0.030
Unknown U 74 19 5,332 1,332 448 1.000 169 1.000 35,623 1.000 13,075 1.000
**PCAM -Applicable - In Control, No Braking
*The PCDS case counts were adjusted to match the injury severity to the 2009 GES to obtain national estimates
Impact Speed (km/h)
Bin
Total
PCDS Count PCDS Weight*
Target PCAM-Applicable* Target PCAM-Applicable**

60
Table 33. Distribution of Pedestrians by Priority Pre-Scenarios in Baseline PCAM-Applicable Crashes Based on Actual PCDS Case Counts
Other
Count Obasel ine(i) Count Obasel ine(i) Count Obasel ine(i) Count Obasel ine(i) Count Obasel ine(i) CountIS<5 1 7 0.047 3 0.035 1 0.071 1 0.026 1 0.250 1
5≤IS<10 2 20 0.133 7 0.082 7 0.500 5 0.132 - - 110≤IS<15 3 23 0.153 5 0.059 4 0.286 13 0.342 - - 115≤IS<20 4 21 0.140 6 0.071 1 0.071 13 0.342 - - 120≤IS<25 5 13 0.087 8 0.094 1 0.071 4 0.105 - - - 25≤IS<30 6 11 0.073 8 0.094 - - - - 1 0.250 230≤IS<35 7 13 0.087 10 0.118 - - 2 0.053 - - 135≤IS<40 8 8 0.053 8 0.094 - - - - - - - 40≤IS<45 9 5 0.033 5 0.059 - - - - - - - 45≤IS<50 10 3 0.020 3 0.035 - - - - - - - 50≤IS<55 11 2 0.013 2 0.024 - - - - - - - 55≤IS<60 12 5 0.033 5 0.059 - - - - - - - 60≤IS<65 13 3 0.020 2 0.024 - - - - - - 165≤IS<70 14 4 0.027 4 0.047 - - - - - - - 70≤IS<75 15 3 0.020 1 0.012 - - - - 2 0.500 - 75≤IS 16 9 0.060 8 0.094 - - - - - - 1
Total 150 1.000 85 1.000 14 1.000 38 1.000 4 1.000 9
Impact Speed (km/h)
Bin Total PCAM-Applicable
PCAM-Applicable - In Control/No Braking
S1 S2 S3 S4

61
Table 34. Distribution of Pedestrians by Priority Pre-Crash Scenarios in Baseline PCAM-Applicable Crashes Based on Weighted PCDS Cases
Other
Weight Obasel ine(i) Weight Obasel ine(i) Weight Obasel ine(i) Weight Obasel ine(i) Weight Obasel ine(i) WeightIS<5 1 696 0.059 270 0.042 84 0.089 84 0.027 129 0.396 129
5≤IS<10 2 1,771 0.151 769 0.121 462 0.485 410 0.130 - - 129 10≤IS<15 3 1,978 0.168 410 0.065 310 0.325 1,018 0.322 - - 240 15≤IS<20 4 1,742 0.148 511 0.080 40 0.042 1,135 0.359 - - 56 20≤IS<25 5 1,223 0.104 797 0.125 56 0.059 370 0.117 - - - 25≤IS<30 6 1,048 0.089 779 0.122 - - - - 84 0.259 185 30≤IS<35 7 994 0.085 724 0.114 - - 141 0.045 - - 129 35≤IS<40 8 578 0.049 578 0.091 - - - - - - - 40≤IS<45 9 264 0.023 264 0.042 - - - - - - - 45≤IS<50 10 241 0.021 241 0.038 - - - - - - - 50≤IS<55 11 112 0.010 112 0.018 - - - - - - - 55≤IS<60 12 248 0.021 248 0.039 - - - - - - - 60≤IS<65 13 136 0.012 96 0.015 - - - - - - 40 65≤IS<70 14 192 0.016 192 0.030 - - - - - - - 70≤IS<75 15 168 0.014 56 0.009 - - - - 112 0.345 - 75≤IS 16 351 0.030 311 0.049 - - - - - - 40
Total 11,743 1.000 6,359 1.000 952 1.000 3,158 1.000 326 1.000 948
Impact Speed (km/h)
Bin
PCAM-Applicable - In Control/No Braking
Total PCAM-Applicable
S1 S2 S3 S4
*The PCDS case counts were adjusted to match the injury severity to the 2009 GES to obtain national estimates. 5.5.1 Determination of Test Performance Data Application An analysis was conducted to determine which performance data should be applied to which scenarios, as noted in above sections. Further breakdown of the 141 PCDS cases by S1, S2, S3, and S4 was done to match the categories consistent with the test conditions. Cases were categorized by:
• Obstruction/no obstruction, and • Pedestrian running versus walking.
The performance of PCAM systems may depend on the travel speed of the vehicle and is not necessarily constant across all travel speeds. Moreover, the PCAM activation rate (pBA) may also vary across different travel speeds. It is recommended that objective tests for a specific scenario be conducted with at least three sets of initial speed conditions. Based on these three conditions, PCAM system performance curves can be derived for all speeds and later applied to the baseline PCAM-applicable crash cases to estimate OPCAM(i). Limitations in crash data, PCAM-applicable sample sizes by priority pre-crash scenarios, and available test data limit the potential analysis. A thorough analysis of PCDS data for baseline crash data showed that small sample sizes exist for breakdowns with the above conditions, thus limiting this analysis to the S1 scenario conditions of no obstruction, pedestrian walking and pedestrian running.

62
Data from the objective test results were applied to baseline crash data through Monte Carlo simulation in order to determine resulting impact speeds with PCAM intervention. This method picks a random impact speed reduction value from the test runs and uses pre-determined number of iterations per baseline case. For various impact speeds, appropriate test data were applied to corresponding speeds; impact speeds under 10 mph used the 10 mph test condition, impact speeds between 11 and 20 mph used the 15 mph test condition, and impact speeds above 21 mph used the 25 mph test condition.
5.5.2 Distribution of Pedestrians in Baseline and PCAM Intervention Cases The baseline pedestrian count for the S1 scenario without an obstruction, with a pedestrian running and for all vehicle speeds was obtained and the results are shown in Table 35 for the actual (35 cases) and weighted (2,398 cases) PCDS cases. This represents the values of OBaseline(i) from Equation (4). To estimate the function, OPCAM(i), appropriate test data was used as input in the simulation and the resulting speed was subtracted from the baseline impact speeds and cases were redistributed to the appropriate impact speed bins. Note that the first impact speed bin, 0, signifies that a crash was avoided. There are no cases in this bin in the baseline since no crashes were avoided. With PCAM intervention, a number of crashes are avoided due to the reduction in speed. Results shown in Table 35 for the actual PCDS show that 26,900 of the 35,000 simulated cases (8%) were in impact speed bin 0, resulting in an 8 percent effectiveness injury avoidance for the PCAM system. These cases represent a situation where the pedestrian avoided injury. The weighted PCDS was higher at 11 percent of the pedestrians avoiding injury. The PCAM system effectiveness is calculated based on the system potentially avoiding a crash involving pedestrian injury and if a collision is not prevented a ratio of reduction of harm with and without the system for impact speed bins 1-16. Table 36 shows the unsmoothed baseline and PCAM-Applicable pedestrian distribution for S1 Scenario with a pedestrian walking and no obstruction.

63
Table 35. Unsmoothed Baseline and PCAM-Applicable Pedestrian Distribution for S1 Scenario, Pedestrian Running, No Obstruction
PCDS Count
PCDS Weight*
PCDS Count
PCDS Weight*
PCDS Count
PCDS Weight*
PCDS Count
PCDS Weight*
IS<5 0 2,683 255,698 0.08 0.11 5≤IS<10 1 - - 2,420 221,972 - - 0.08 0.11 10≤IS<15 2 1 84 8,897 644,379 0.03 0.04 0.27 0.29 15≤IS<20 3 2 185 - - 0.06 0.08 - - 20≤IS<25 4 - - 533 55,403 - - 0.02 0.03 25≤IS<30 5 1 129 2,406 189,666 0.03 0.05 0.07 0.09 30≤IS<35 6 4 297 3,039 217,598 0.11 0.12 0.09 0.10 35≤IS<40 7 6 426 3,369 231,395 0.17 0.18 0.11 0.12 40≤IS<45 8 4 354 1,684 98,043 0.11 0.15 0.05 0.05 45≤IS<50 9 4 208 1,666 106,301 0.11 0.09 0.05 0.04 50≤IS<55 10 3 241 1,029 57,738 0.09 0.10 0.03 0.03 55≤IS<60 11 1 56 1,007 56,504 0.03 0.02 0.03 0.03 60≤IS<65 12 1 56 621 34,845 0.03 0.02 0.02 0.02 65≤IS<70 13 1 56 629 32,558 0.03 0.02 0.02 0.01 70≤IS<75 14 1 56 745 32,683 0.03 0.02 0.02 0.02 75≤IS 15 1 56 1,140 46,215 0.03 0.02 0.04 0.02
16 5 192 3,132 116,666 0.14 0.08 0.09 0.05
35 2,398 35,000 239,766
26,900 25,738
8,100 214,029
Proportion w/PCAM
(OPCAM) Impact Speed
Pedestrian Injuriess Avoided with PCAM
Total for Potential Pedestrian Injury Mitigation
Proportion w/o PCAM
(Obaseline)With PCAM Baseline w/o PCAMImpact
Speed Bin
Total
*The PCDS case counts were adjusted to match the injury severity to the 2009 GES to obtain national estimates.Unsmoothed ≡ Original data

64
Table 36. Unsmoothed Baseline and PCAM-Applicable Pedestrian Distribution for S1 Scenario, Pedestrian Walking, No Obstruction
PCDS Count
PCDS Weight*
PCDS Count
PCDS Weight*
PCDS Count
PCDS Weight*
PCDS Count
PCDS Weight*
IS<5 0 17,125 1,516,625 0.41 0.48 5≤IS<10 1 2 185 8,142 693,915 0.05 0.06 0.33 0.43 10≤IS<15 2 5 556 4,953 351,574 0.12 0.18 0.20 0.22 15≤IS<20 3 3 225 1,281 88,644 0.07 0.07 0.05 0.05 20≤IS<25 4 5 382 2,584 140,138 0.12 0.12 0.10 0.09 25≤IS<30 5 5 410 1,915 89,800 0.12 0.13 0.08 0.06 30≤IS<35 6 3 353 2,185 103,305 0.07 0.11 0.09 0.06 35≤IS<40 7 4 298 815 32,459 0.10 0.09 0.03 0.02 40≤IS<45 8 3 168 1,194 47,553 0.07 0.05 0.05 0.03 45≤IS<50 9 1 56 806 32,100 0.02 0.02 0.03 0.02 50≤IS<55 10 - - - - - - - - 55≤IS<60 11 1 56 - - 0.02 0.02 - - 60≤IS<65 12 3 152 899 35,804 0.07 0.05 0.04 0.02 65≤IS<70 13 1 40 101 4,022 0.02 0.01 0.00 0.00 70≤IS<75 14 3 136 - - 0.07 0.04 - - 75≤IS 15 - - - - - - - -
16 3 119 - - 0.07 0.04 - -
42 3,136 42,000 3,135,939
17,125 1,516,625
24,875 1,619,314
Total
Proportion w/PCAM
(OPCAM)
*The PCDS case counts were adjusted to match the injury severity to the 2009 GES to obtain national estimates.Unsmoothed ≡ Original data
Impact Speed
Impact Speed
Bin
Baseline w/o PCAM With PCAM
Proportion w/o PCAM
(Obaseline)
Pedestrian Injuriess Avoided with PCAM
Total for Potential Pedestrian Injury Mitigation
The pedestrian proportions by impact speed from Table 35, OBaseline and OPCAM, were smoothed using a programmed function to minimize the sum of squared errors for the pedestrian running scenario with no obstruction. Results are shown in Table 37 for the actual and weighted PCDS cases for the pedestrian running and in Table 38 for the pedestrian walking. The equation is as follows:
(7) Where:
• OBaseline(i) - actual PCDS cases: θ = 0.8, m = 7.9, and σ = 0.40 • OBaseline(i) - weighted PCDS cases: θ = 0.8, m = 7.8, and σ = 0.4

65
• OPCAM(i) - actual PCDS cases: θ = 0.9, m = 2.5, and σ = 1.2 • OPCAM(i) - weighted PCDS cases: θ = 0.88, m = 2.2, and σ = 1.25
ISn ≡ impact speed bin #
Table 37. Smoothed Baseline and PCAM-Applicable Pedestrian Distribution for S1 Scenario
With Pedestrian Running and No Obstruction
PCDS Count
PCDS Weight*
PCDS Count
PCDS Weight*
0 0.08 0.11 1 0.00 0.00 0.09 0.18 2 0.00 0.00 0.24 0.25 3 0.00 0.00 0.16 0.15 4 0.02 0.03 0.11 0.10 5 0.07 0.07 0.07 0.07 6 0.11 0.11 0.05 0.05 7 0.13 0.14 0.04 0.04 8 0.13 0.14 0.03 0.03 9 0.12 0.12 0.03 0.02
10 0.10 0.10 0.02 0.02 11 0.08 0.08 0.02 0.01 12 0.06 0.06 0.01 0.01 13 0.05 0.04 0.01 0.01 14 0.03 0.03 0.01 0.01 15 0.02 0.02 0.01 0.01 16 0.06 0.06 0.10 0.05
*The PCDS case counts were adjusted to match the injury severity to the 2009 GES to obtain national estimates.Smoothed ≡ Original data was fitted to a specified function
Proportion
(Obaseline)Proportion
(OPCAM) Impact Speed Bin

66
Table 38. Smoothed Baseline and PCAM-Applicable Pedestrian Distribution for S1 Scenario With Pedestrian Walking and No Obstruction
PCDS Count
PCDS Weight*
PCDS Count
PCDS Weight*
0 0.41 0.48 1 0.04 0.07 0.34 0.35 2 0.11 0.15 0.19 0.20 3 0.13 0.15 0.11 0.11 4 0.12 0.13 0.08 0.07 5 0.10 0.11 0.06 0.05 6 0.09 0.08 0.04 0.04 7 0.07 0.06 0.03 0.03 8 0.06 0.05 0.03 0.03 9 0.05 0.04 0.02 0.02
10 0.04 0.03 0.02 0.02 11 0.03 0.02 0.02 0.02 12 0.03 0.02 0.02 0.01 13 0.02 0.02 0.01 0.01 14 0.02 0.01 0.01 0.01 15 0.01 0.01 0.01 0.01 16 0.09 0.05 0.01 0.02
*The PCDS case counts were adjusted to match the injury severity to the 2009 GES to obtain national estimates.Smoothed ≡ Original data was fitted to a specified function
Impact Speed Bin
Proportion
(Obaseline)Proportion
(OPCAM)
Figure 40 and Figure 41 are plots of the smoothed pedestrian distributions found above for baseline and PCAM intervention cases for the actual and weighted PCDS data. The effects of PCAM intervention causes a shift to the left of the baseline curve with a higher peak of pedestrian proportions occurring at lower speeds. The same data are shown for the walking scenario in Figure 42 and Figure 43. Note that impact speed bin 16 includes all impact speeds occurring over 75 km/h versus a 5 km/h range. Appendix C contains the pedestrian distribution charts for the S2 and S3 smoothed values for the pedestrian walking without an obstruction for comparison. These two scenarios had applicable test data, but since the target populations were extremely limited, the benefits calculation was not included in the report.

67
Figure 40. Smoothed Baseline and PCAM Pedestrian Distribution for S1 Scenario With Pedestrian Running and No Obstruction for Actual PCDS Cases
-
0.05
0.10
0.15
0.20
0.25
0.30
1 2 3 4 5 6 7 8 9 10 11 12 13 14 15 16
Pede
stria
n Pr
opor
tion
Impact Speed Bin
Baseline PCAM
Figure 41. Smoothed Baseline and PCAM Pedestrian Distribution for S1 Scenario With Pedestrian Running and No Obstruction for Weighted PCDS Cases
-
0.05
0.10
0.15
0.20
0.25
0.30
1 2 3 4 5 6 7 8 9 10 11 12 13 14 15 16
Pede
stria
n Pr
opor
tion
Impact Speed Bin
Baseline PCAM

68
Figure 42. Smoothed Baseline and PCAM Pedestrian Distribution for S1 Scenario With Pedestrian Walking and No Obstruction for Actual PCDS Cases
-
0.05
0.10
0.15
0.20
0.25
0.30
0.35
0.40
1 2 3 4 5 6 7 8 9 10 11 12 13 14 15 16
Pede
stria
n Pr
opor
tion
Impact Speed Bin
Baseline PCAM
Figure 43. Smoothed Baseline and PCAM Pedestrian Distribution for S1 Scenario With Pedestrian Walking and No Obstruction for Weighted PCDS Cases
-
0.05
0.10
0.15
0.20
0.25
0.30
0.35
0.40
1 2 3 4 5 6 7 8 9 10 11 12 13 14 15 16
Pede
stria
n Pr
opor
tion
Impact Speed Bin
Baseline PCAM
5.6 System Effectiveness System effectiveness estimations were calculated for pedestrian injury mitigation and pedestrian injury avoidance terms as defined earlier. Table 39 lists the results as a function of the two harm measures according to the scenarios of the pedestrian running and walking with no obstruction for the actual and weighted PCDS cases. For the pedestrian running scenario there is an 8 percent (actual) and 11 percent (weighted) system effectiveness in the pedestrian injuries that are avoided; for a pedestrian walking, results show an increase to 41 percent (actual) and 48 percent (weighted). The system effectiveness for injury mitigation (reduction of harm) is 28 percent for the actual PCDS cases and 35 percent for the weighted PCDS cases for all pedestrian injuries injured at an MAIS2+. Results are slightly higher for the injuries MAIS3+. System effectiveness

69
is approximately double the values in the pedestrian walking versus running scenarios in terms of the pedestrian mitigation.
Table 39. Estimates of PCAM System Effectiveness in S1 Scenario
PCDS Count
PCDSWeight*
Harm Measure
PCDS Count
PCDS Weight*
pMAIS2+ 0.28 0.35
pMAIS3+ 0.35 0.44
pMAIS2+ 0.60 0.67
pMAIS3+ 0.75 0.83
Pedestrian Injury Mitigation System Effectiveness
S1Pedestrian
Walking
0.08 S1
Pedestrian Running
PCAM Scenario
0.11
0.41 0.48
Pedestrian Injury Avoidance
*The PCDS case counts were adjusted to match the injury severity to the 2009 GES to obtain national estimates.
5.7 Potential Safety Benefits Potential safety benefits are expected from the ability of the PCAM-equipped vehicle to avoid and mitigate crashes by a reduction in vehicle speed. As stated earlier estimates for the potential annual safety benefits are calculated by multiplying the following three terms:
1. Annual value of harm measure in target crash scenario (i.e., vehicle moving forward and striking the pedestrian by the front end in the first harmful event)
2. Ratio of harm value in PCAM-applicable crash scenario (i.e., driver did not apply the brakes and the vehicle remained in control prior to striking the pedestrian) over harm value in target crash scenario.
3. PCAM effectiveness in reducing annual harm measure The smoothed data for the weighted PCDS cases in the S1 scenario showed a total of 843 pedestrians in the PCAM-applicable crash scenario who sustained injuries at MAIS2+ according to 2009 GES statistics as shown in Table 22. The corresponding ratio of harm value was .36 and the system effectiveness was 52 percent. This resulted in a total potential safety benefit estimation of 158. Values for the additional categories of system benefits are shown for the S1 scenario with no obstruction to the driver for a running pedestrian crossing the road in Table 40 and for the same scenario with a pedestrian walking in Table 41.

70
Table 40. System Benefits Estimation for S1 Scenario With No Obstruction and Pedestrian
Running
PCDS Count
PCDS Weight
PCDS Count
PCDS Weight
pMAIS2+ 3 106 5 158pMAIS3+ 2 59 3 85
Unsmooth Smooth
*The PCDS case counts were adjusted to match the injury severity to the 2009 GES to obtain national estimates.Smoothed ≡ Original data (Unsmooth) fitted to a specified function
Table 41. System Benefits Estimation for S1 Scenario With No Obstruction and Pedestrian
Walking
PCDS Count
PCDS Weight
PCDS Count
PCDS Weight
pMAIS2+ 16 480 16 453pMAIS3+ 13 391 11 317
*The PCDS case counts were adjusted to match the injury severity to the 2009 GES to obtain national estimates.Smoothed ≡ Original data (Unsmooth) fitted to a specified function
Unsmooth Smooth
A higher value for estimated benefits occurs in the S1 scenario with the pedestrian walking versus scenarios where the pedestrian is running. The greatest number of estimated benefits is achieved for pedestrian injuries occurring at MAIS2+. Note that these estimates are low because there were limited data to accurately define target population, limited test data, and small sample sizes. Further enhancements to these restrictions may yield higher potential safety benefits. The FARS data set is recommended for examining fatalities since it is a more accurate representation of fatalities; however, only the GES was used since the variables used to identify the pre-crash scenarios were not available in FARS at the time of this analysis. These variables are made available starting with 2010 FARS. The safety benefits estimation calculation for the S2, S3, and S4 scenarios are not included in the report. Although there was applicable test data, the target populations were extremely limited.

71
6 CONCLUSION AND RECOMMENDATIONS
An analysis of the physical settings for pre-crash scenarios and vehicle-pedestrian maneuvers identified four recommended scenarios to maximize the potential safety benefits of PCAM systems. The scenarios are:
S1 - Vehicle going straight and pedestrian crossing the road, S2 - Vehicle turning right and pedestrian crossing the road, S3 - Vehicle turning left and pedestrian crossing the road, and S4 - Vehicle going straight and pedestrian walking along/against traffic.
These scenarios address all of the most frequent conditions involved with intersections, pedestrian location, crosswalks, and road geometry. Although the four scenarios accounted for only 46 percent of all national cases, this value provides little information on injury severity to the pedestrian. These four recommended scenarios encompassed 98 percent of all functional years lost and direct economic cost of all vehicle-pedestrian crashes. Scenario 1 is the most frequent pre-crash scenario and therefore has the highest values for the functional years lost and direct economic cost measures. Scenarios 2 and 3 address the common turning scenarios observed in the crash data. Although these scenarios result in less severe injuries, PCAM systems need to function correctly within these scenarios to avoid collisions in these situations. Scenario 4 has the highest fatality rate and requires PCAM systems to have high-accuracy pedestrian detection that operates at high travel speeds. Crash contributing factors were examined to identify physical settings, environmental conditions, pedestrian characteristics, and other circumstances for the development of objective tests and use as input to the safety benefits estimation methodology. The analysis of physical settings and factors, such as vehicle location, pedestrian location, roadway alignment, roadway profile, atmospheric and light conditions, and surface conditions was performed to support the efficiency optimization of PCAM technology by addressing the most common situations. Pedestrian characteristics such as age, gender, and size, along with other contributing factors including traffic flow, number of travel lanes, obstructions, pedestrian direction, and driver and pedestrian physiological conditions, were examined to aid in the development of algorithms to accurately detect pedestrians. The statistical analysis of the crash databases included some of the following observations.
Highest Pedestrian Crash Frequencies • Most crashes occur at speeds of 30 mph or less. • Intersections tend to have the most frequent occurrences. • Majority of crashes, as well as fatalities, occur on non-divided roads. • Majority of all GES cases do not involve alcohol for the driver, but 39 percent of fatal
GES cases for S4 involve alcohol for the driver. • More than 80 percent of all cases occur in clear and dry weather conditions. • Dry roads are associated with over 80 percent of the cases; this statistic is similar for
fatalities.

72
• Scenarios S1, S2, and S3 occur more often in daylight, whereas scenario S4 occurs more often in dark conditions.
Fatalities/ Severe Injuries
• Fatalities tend to occur most often with higher impact speeds of 35 to 40 mph. • Pedestrian alcohol involvement is associated with fatally injured pedestrians in over
68 percent of the cases. • Most fatalities involve pedestrians on the roadway outside of a crosswalk. • Pedestrians older than 29 account for more than 60 percent of all fatalities. • Non-junction incidents are more prone to higher speeds resulting in more severe
injuries. • More fatalities are associated with darkness.
Less Severe Injuries
• Although frequent, vehicle-turning scenarios result in less severe injuries to pedestrians, which are most likely due to the lower impact speeds.
• Due to lower impact speeds, intersections tend to have fewer fatalities. The PCDS data were used to supplement the limitations in impact speed variables encountered in the GES data. Because PCDS contains older model years it may not represent the injury levels associated with the vehicles on the road today. To provide a speed-injury relationship based on newer vehicle models rather than the older models present in the PCDS crash database, the GES crash database variables, “travel speed,” “speed limit,” and “speed related” (indicating whether speed is a contributing factor to the cause of the crash), could be used as a rough surrogate for impact speed to provide either the primary or a comparative assessment of the impact speed-pedestrian injury relationship. Follow-on analysis could use this approach, but note that the high number of unknowns of the GES coded variables may cause problems with the analysis and multiple years of data should be explored. Objective tests were performed using vehicles equipped with sensors to detect a simulated pedestrian for the four priority scenarios defined above. The objective tests placed more emphasis on the S1 and S4 scenarios due to the higher occurrence of crashes and number of fatalities in these scenarios as identified in this report. Limitations in the preliminary analysis of baseline crash data and results from target population yielded small samples for various scenarios and for this reason the tests were only applied to the S1 scenario with no obstruction to the driver’s view of a pedestrian crossing the road while walking and running. The potential annual safety benefits were calculated from the values obtained from crash statistics and objective tests of PCAM prototypes for the annual value of harm in the target crash scenario, the ratio of the harm value in the PCAM-applicable crash scenario (i.e., driver of the vehicle did not apply the brakes and the vehicle remained in control prior to striking the pedestrian) over the harm value in the target crash scenario, and the PCAM effectiveness in reducing annual for the two harm measures, MAIS2+ and MAIS3+. The methodology used to calculate the benefits is based on the following assumptions and limitations that may change in further research efforts:

73
• No unintended consequences, • 100 percent of vehicles equipped with PCAM systems, • 100 percent true activation rate of PCAM system, • No false activations, • No brake application prior to impact, • System effectiveness derived only from automatic braking, • Does not account for different types of road conditions, lighting, or adverse weather, • System performance is independent of vehicle prototype; best performing system in the
objective test is used in the calculations, and • Objective tests do not reflect the observed performance of an individual PCAM system or
more mature prototypes.
The analysis was based on a simplified methodology and limitations in the data analysis due to small sample sizes, unknowns in the data, etc., can be addressed in future research with modifications such as adding additional crash years, imputing variables, etc.. to provide more accurate results. In the future, limitations to the data might be also addressed by NHTSA’s Data Modernization Project which is a multi-year project aimed at examining ways to enhance the crash data to keep pace with emerging technologies. Specifically related to this project, the modernization task seeks to examine issues such as expanding the data collection sample by collecting more pre and post data, extending the scope of the data collection to pedestrians, and updating the data variables.

74
7 REFERENCES [1] Crash Avoidance Metrics Partnership. (2010, June). Crash Imminent Braking (CIB) Second
Annual Report. (Report No. DOT HS 811 341). Washington, DC: National Highway Traffic Safety Administration. Available at www.nhtsa.gov/DOT/NHTSA/NVS/Crash%20Avoidance/Technical%20Publications/2010/811341.pdf
[2] National Center for Statistics and Analysis. (2010, August). National Automotive Sampling
System (NASS) General Estimates System (GES) Analytical User's Manual 1988-2009. (Report No. DOT HS 811 355).Washington, DC: National Highway Traffic Safety Administration. Available at www-nrd.nhtsa.dot.gov/Pubs/811355.pdf
[3] National Center for Statistics and Analysis. (2002, June). National Automotive Sampling
System Pedestrian Crash Data Study - 1996 Data Collection, Coding, and Editing Manual. Washington, DC: National Highway Traffic Safety Administration. Available at ftp://ftp.nhtsa.dot.gov/ped/96PedMan.pdf
[4] Jermakian, J. S., & Zuby, D. S. (2001, April). Primary Pedestrian Crash Scenarios: Factors
Relevant to the Design of Pedestrian Detection Systems. Arlington, VA: Insurance Institute for Highway Safety.
[5] Insurance Institute for Highway Safety. (2011, March). Big Strides. (Status Report, Vol. 46,
No. 3, March 30, 2011). Arlington, VA. [6] Lenard, J., Danton, R. Avery, M., Weeks, A., Zuby, D., & Kühn, M. (2011). Typical
Pedestrian Accident Scenarios for the Testing of Autonomous Emergency Braking Systems (Paper No. 11-0196). Proceedings of the 22nd International Technical Conference on the Enhanced Safety of Vehicles, Washington, DC, June 2011.
[7] Matsui, Y., Takahashi, K., Imaizumi, R., & Ando, K. (2011). Car-to-Pedestrian Contact
Situations in Near-Miss Incidents and Real-World Accidents in Japan. (Paper No. 11-0164). Proceedings of the 22nd International Technical Conference on the Enhanced Safety of Vehicles, Washington, DC, June 2011.
[8] Kullgren, A., Lie, A., Strandroth, J., Rizzi, M., & Tingvall, C. (2011). The Importance of Age
for Injury Severity Among Car Drivers and Pedestrians. (Paper No. 11-0225). Proceedings of the 22nd International Technical Conference on the Enhanced Safety of Vehicles, Washington, DC, June 2011.
[9] Niewöhner, W., Roth, F., Gwehenberger, J., Gruber, C., Kuehn, M., Sferco, R., Pastor, C.,
Nagel, U., & Stanzel, M. (2011). Proposal for a Test Procedure of Assistance Systems Regarding Preventive Pedestrian Protection (Paper No. 11-0393). Proceedings of the 22nd International Technical Conference on the Enhanced Safety of Vehicles, Washington, DC, June 2011.

75
[10] DaSilva, M., Smith, J., & Najm, W. (2003, April). Analysis of Pedestrian Crashes, (Report
No. DOT HS 809 585). Washington, DC: National Highway Traffic Safety Administration.

76
APPENDIX A Table 42. GES All Cases - Travel Speed Versus Posted Speed Limit for S1 Pre-Crash Scenario
5 10 15 20 25 30 35 40 45 50 55 60 65 70 75 No Limit Total
0 17 15 32 1 - 5 201 2,565 845 960 83 219 41 28 4,943 6 - 10 87 515 2,544 545 1,323 132 557 86 11 5,801 11 - 15 780 476 3,269 712 833 172 727 57 16 68 7,110 16 - 20 55 82 3,672 332 1,761 648 704 104 54 7,411 21 - 25 14 83 349 4,859 1,020 2,661 313 929 80 10,308 26 - 30 12 42 1,508 1,210 3,560 896 951 11 62 35 23 8,310 31 - 35 12 805 212 4,454 1,299 1,079 122 170 14 45 8,212 36 - 40 77 98 956 2,236 1,676 107 155 19 5,322 41 - 45 16 50 112 3,099 136 202 127 35 3,776 46 - 50 35 28 178 244 477 460 19 32 1,474 51 - 55 19 35 669 39 762 56 - 60 67 154 221 61 - 65 104 5 412 521 66 - 70 54 21 76 71 - 75 13 52 55 120 86 - 90 55 55 Not Reported 13 61 331 1,234 509 1,098 200 252 64 129 18 19 31 3,958 Unknown 65 623 2,182 2,526 36,173 22,230 31,996 11,683 12,229 1,911 4,720 1,452 731 426 30 1,242 130,218
Total 65 737 3,902 3,805 56,738 27,766 49,715 17,952 22,824 2,932 6,845 1,683 1,594 586 106 1,380 198,632
Posted Speed Limit
Trav
el S
peed
(mph
)
S1 - Going Straight & Crossing
Table 43. GES All Cases - Travel Speed Versus Posted Speed Limit for S1 Pre-Crash Scenario
Percentage
5 10 15 20 25 30 35 40 45 50 55 60 65 70 75 No Limit0 - - - - 0.54 - - - - - - 0.46 - - - - 32 0.00
1 - 5 - - 0.04 - 0.52 0.17 0.19 0.02 0.04 - - - 0.01 - - 0.01 4,943 0.02 6 - 10 - 0.02 0.09 - 0.44 0.09 0.23 0.02 0.10 - 0.01 - - - - 0.00 5,801 0.03 11 - 15 - - 0.11 0.07 0.46 0.10 0.12 0.02 0.10 - 0.01 - 0.00 - - 0.01 7,110 0.04 16 - 20 - - 0.01 0.01 0.50 0.04 0.24 0.09 0.09 0.01 0.01 - - - - - 7,411 0.04 21 - 25 - 0.00 0.01 0.03 0.47 0.10 0.26 0.03 0.09 - 0.01 - - - - - 10,308 0.05 26 - 30 - - 0.00 0.01 0.18 0.15 0.43 0.11 0.11 0.00 0.01 0.00 0.00 - - - 8,310 0.04 31 - 35 - - 0.00 - 0.10 0.03 0.54 0.16 0.13 0.01 0.02 0.00 0.01 - - - 8,212 0.04 36 - 40 - - - - 0.01 0.02 0.18 0.42 0.31 0.02 0.03 0.00 - - - - 5,322 0.03 41 - 45 - - - - 0.00 - 0.01 0.03 0.82 0.04 0.05 - 0.03 0.01 - - 3,776 0.02 46 - 50 - - - - - 0.02 0.02 0.12 0.17 0.32 0.31 0.01 0.02 - - - 1,474 0.01 51 - 55 - - - - - 0.02 0.05 - - - 0.88 0.05 - - - - 762 0.00 56 - 60 - - - - - - - - - - - 0.30 0.70 - - - 221 0.00 61 - 65 - - - - - - - - 0.20 - - 0.01 0.79 - - - 521 0.00 66 - 70 - - - - - - - - - - - - - 0.72 0.28 - 76 0.00 71 - 75 - - - - - - - - - - - - 0.11 0.43 0.46 - 120 0.00 86 - 90 - - - - - - - - 1.00 - - - - - - - 55 0.00 Not Reported - 0.00 0.02 0.08 0.31 0.13 0.28 0.05 0.06 0.02 0.03 0.00 - 0.00 - 0.01 3,958 0.02 Unknown 0.00 0.00 0.02 0.02 0.28 0.17 0.25 0.09 0.09 0.01 0.04 0.01 0.01 0.00 0.00 0.01 130,218 0.66
65 737 3,902 3,805 56,738 27,766 49,715 17,952 22,824 2,932 6,845 1,683 1,594 586 106 1,380 198,632 1.00 0.00 0.00 0.02 0.02 0.29 0.14 0.25 0.09 0.11 0.01 0.03 0.01 0.01 0.00 0.00 0.01 1.00
S1 - Going Straight & Crossing
Posted Speed Limit (mph)Total
Trav
el S
peed
(mph
)
Total

77
Table 44. GES All Cases - Travel Speed Versus Posted Speed Limit for S2 Pre-Crash Scenario
15 25 30 35 40 45 50 55 No Limit Total1 - 5 70 361 538 31 69 52 51 1,172 6 - 10 10 21 31 122 15 198 11 - 15 15 12 21 12 60 16 - 20 26 51 77 21 - 25 18 18 Not Reported 54 17 35 12 118 Unknown 16 768 163 655 33 143 291 2,069
Total 16 906 588 1,297 106 256 52 122 369 3,713
Trav
el S
peed
(mph
)
Posted Speed LimitS2- Turning Right & Crossing
Table 45. GES All Cases - Travel Speed Versus Posted Speed Limit for S2 Pre-Crash Scenario Percentage
15 25 30 35 40 45 50 55 No Limit1 - 5 - 0.06 0.31 0.46 0.03 0.06 0.04 - 0.04 1,172 0.32 6 - 10 - - 0.05 - 0.10 0.16 - 0.61 0.07 198 0.05 11 - 15 - 0.25 0.20 - 0.35 0.21 - - - 60 0.02 16 - 20 - - 0.34 0.66 - - - - - 77 0.02 21 - 25 - - - 1.00 - - - - - 18 0.00 Not Reported - 0.46 0.14 0.30 - - - - 0.10 118 0.03 Unknown 0.01 0.37 0.08 0.32 0.02 0.07 - - 0.14 2,069 0.56
16 906 588 1,297 106 256 52 122 369 3,713 1.00 0.00 0.24 0.16 0.35 0.03 0.07 0.01 0.03 0.10 1.00
S2- Turning Right & Crossing
Posted Speed Limit (mph)Total
Trav
el S
peed
(mph
)
Total
Table 46. GES All Cases - Travel Speed Versus Posted Speed Limit for S3 Pre-Crash Scenario
10 20 25 30 35 40 45 50 55 70 No Limit Total1 - 5 855 32 120 36 52 346 1,441 6 - 10 16 393 185 767 56 68 15 52 1,551 11 - 15 91 46 174 34 88 54 40 528 16 - 20 129 33 80 17 45 24 328 21 - 25 37 30 68 135 26 - 30 23 35 57 Not Reported 26 35 77 30 17 21 39 247 Unknown 15 431 2,414 2,358 2,249 382 244 32 113 19 295 8,551
Total 15 446 3,969 2,720 3,535 590 513 32 203 19 797 12,838
Posted Speed Limit
Trav
el S
peed
(mph
)
S3- Turning Left & Crossing

78
Table 47. GES All Cases - Travel Speed Versus Posted Speed Limit for S3 Pre-Crash Scenario Percentage
10 20 25 30 35 40 45 50 55 70 No Limit1 - 5 - - 0.59 0.02 0.08 0.03 0.04 - - - 0.24 1,441 0.11 6 - 10 - 0.01 0.25 0.12 0.49 0.04 0.04 - 0.01 - 0.03 1,551 0.12 11 - 15 - - 0.17 0.09 0.33 0.06 0.17 - 0.10 - 0.08 528 0.04 16 - 20 - - 0.39 0.10 0.25 0.05 0.14 - - - 0.07 328 0.03 21 - 25 - - 0.28 0.22 0.50 - - - - - - 135 0.01 26 - 30 - - 0.39 - - 0.61 - - - - - 57 0.00 Not Reported - - 0.11 0.14 0.31 0.12 0.07 - 0.09 - 0.16 247 0.02 Unknown 0.00 0.05 0.28 0.28 0.26 0.04 0.03 0.00 0.01 0.00 0.03 8,551 0.67
15 446 3,969 2,720 3,535 590 513 32 203 19 797 12,838 1.00 0.00 0.03 0.31 0.21 0.28 0.05 0.04 0.00 0.02 0.00 0.06 1.00
Total
S3- Turning Left & Crossing
Posted Speed Limit (mph)Total
Trav
el S
peed
(mph
)
Table 48. GES All Cases - Travel Speed Versus Posted Speed Limit for S4 Pre-Crash Scenario
10 15 20 25 30 35 40 45 50 55 60 65 70 No Limit Total1 - 5 130 24 10 12 105 281 6 - 10 246 271 517 11 - 15 135 115 133 12 395 16 - 20 114 61 16 191 21 - 25 237 127 60 55 20 498 26 - 30 207 144 170 70 35 17 643 31 - 35 340 26 191 62 618 36 - 40 260 21 91 141 131 645 41 - 45 35 139 216 150 540 46 - 50 17 84 68 12 197 377 51 - 55 286 105 391 56 - 60 45 62 14 121 66 - 70 13 67 80 Not Reported 405 40 36 27 13 23 21 564 Unknown 31 188 365 4,253 2,048 1,738 539 963 204 1,236 76 14 107 11,762
Total 31 188 365 5,986 2,467 2,861 993 1,755 294 2,286 90 132 67 107 17,624
Trav
el S
peed
(mph
)
Posted Speed LimitS4 - Going Straight & Walking Along/Against Traffic
Table 49. GES All Cases - Travel Speed Versus Posted Speed Limit for S4 Pre-Crash Scenario
Percentage
10 15 20 25 30 35 40 45 50 55 60 65 70 No Limit1 - 5 - - - 0.46 0.08 0.04 - 0.04 - 0.37 - - - - 281 0.02 6 - 10 - - - 0.48 - 0.52 - - - - - - - - 517 0.03 11 - 15 - - - 0.34 0.29 0.34 - 0.03 - - - - - - 395 0.02 16 - 20 - - - 0.60 0.32 - 0.08 - - - - - - - 191 0.01 21 - 25 - - - 0.48 - 0.25 - 0.12 0.11 0.04 - - - - 498 0.03 26 - 30 - - - 0.32 0.22 0.26 0.11 0.05 - 0.03 - - - - 643 0.04 31 - 35 - - - - - 0.55 0.04 0.31 - 0.10 - - - - 618 0.04 36 - 40 - - - 0.40 - 0.03 0.14 0.22 - 0.20 - - - - 645 0.04 41 - 45 - - - - 0.06 - 0.26 0.40 - 0.28 - - - - 540 0.03 46 - 50 - - - - - 0.04 0.22 0.18 0.03 0.52 - - - - 377 0.02 51 - 55 - - - - - - - - - 0.73 - 0.27 - - 391 0.02 56 - 60 - - - - - - - 0.37 - 0.51 0.12 - - - 121 0.01 66 - 70 - - - - - - - - - - - 0.17 0.83 - 80 0.00 Not Reported - - - 0.72 0.07 0.06 0.05 0.02 0.04 0.04 - - - - 564 0.03 Unknown 0.00 0.02 0.03 0.36 0.17 0.15 0.05 0.08 0.02 0.11 0.01 0.00 - 0.01 11,762 0.67
31 188 365 5,986 2,467 2,861 993 1,755 294 2,286 90 132 67 107 17,624 1.00 0.00 0.01 0.02 0.34 0.14 0.16 0.06 0.10 0.02 0.13 0.01 0.01 0.00 0.01 1.00
Total
S4 - Going Straight & Walking Along/Against
Posted Speed Limit (mph)Total
Trav
el S
peed
(mph
)

79
Table 50. GES Fatalities Only - Travel Speed Versus Posted Speed Limit for S1 Pre-Crash
Scenario
15 20 25 30 35 40 45 50 55 60 65 70 75 Total1 - 5 105 15 105 226 6 - 10 105 50 155 11 - 15 12 12 24 16 - 20 12 19 11 12 55 21 - 25 69 48 16 133 26 - 30 65 199 118 382 31 - 35 9 543 86 417 12 1,069 36 - 40 18 324 154 204 55 756 41 - 45 35 35 1,184 13 95 1,361 46 - 50 18 123 139 108 411 19 819 51 - 55 45 24 70 56 - 60 31 141 172 61 - 65 104 134 238 66 - 70 35 21 56 71 - 75 13 52 55 120 86 - 90 55 55 Not Reported 20 39 19 39 117 Unknown 29 195 599 1,067 508 729 177 767 371 236 129 15 4,822
Total 105 29 382 791 2,318 925 3,080 354 1,357 446 536 216 92 10,629
Posted Speed Limit
Trav
el S
peed
(mph
)
S1 - Going Straight & Crossing
Table 51. GES Fatalities Only - Travel Speed Versus Posted Speed Limit for S1 Pre-Crash Scenario Percentage
15 20 25 30 35 40 45 50 55 60 65 70 751 - 5 - - 0.47 - 0.07 - 0.47 - - - - - - 226 0.02 6 - 10 0.68 - - - 0.32 - - - - - - - - 155 0.01 11 - 15 - - - 0.50 - - 0.50 - - - - - - 24 0.00 16 - 20 - - 0.22 0.34 0.21 - 0.22 - - - - - - 55 0.01 21 - 25 - - 0.52 0.36 0.12 - - - - - - - - 133 0.01 26 - 30 - - - 0.17 0.52 - 0.31 - - - - - - 382 0.04 31 - 35 - - - 0.01 0.51 0.08 0.39 - - - 0.01 - - 1,069 0.10 36 - 40 - - - 0.02 0.43 0.20 0.27 0.07 - - - - - 756 0.07 41 - 45 - - - - 0.03 0.03 0.87 0.01 0.07 - - - - 1,361 0.13 46 - 50 - - - - 0.02 0.15 0.17 0.13 0.50 0.02 - - - 819 0.08 51 - 55 - - - - - - - - 0.65 0.35 - - - 70 0.01 56 - 60 - - - - - - - - - 0.18 0.82 - - 172 0.02 61 - 65 - - - - - - 0.44 - - - 0.56 - - 238 0.02 66 - 70 - - - - - - - - - - - 0.62 0.38 56 0.01 71 - 75 - - - - - - - - - - 0.11 0.43 0.46 120 0.01 86 - 90 - - - - - - 1.00 - - - - - - 55 0.01 Not Reported - - - 0.17 0.33 0.16 - - 0.33 - - - - 117 0.01 Unknown - 0.01 0.04 0.12 0.22 0.11 0.15 0.04 0.16 0.08 0.05 0.03 0.00 4,822 0.45
105 29 382 791 2,318 925 3,080 354 1,357 446 536 216 92 10,629 1.00 0.01 0.00 0.04 0.07 0.22 0.09 0.29 0.03 0.13 0.04 0.05 0.02 0.01 1.00
Total
TotalS1 - Going Straight &
CrossingPosted Speed Limit (mph)
Trav
el S
peed
(mph
)
Note that for GES fatalities, Scenarios S2 and S3, each have 16 unknown cases in the 30 mph posted speed limit category.

80
Table 52. GES Fatalities Only - Travel Speed Versus Posted Speed Limit for S4 Pre-Crash Scenario
15 25 30 35 40 45 50 55 60 70 Total31 - 35 81 16 97 36 - 40 27 20 46 41 - 45 139 80 219 46 - 50 35 12 12 59 51 - 55 63 63 56 - 60 45 14 59 66 - 70 15 15 Unknown 16 41 103 271 111 74 32 426 15 1,089
Total 16 41 103 352 327 231 44 489 30 15 1,648
Posted Speed Limit
Trav
el S
peed
(mph
)
S4 - Going Straight & Walking Along/Against Traffic
Table 53. GES Fatalities Only - Travel Speed Versus Posted Speed Limit for S4 Pre-Crash Scenario Percentage
15 25 30 35 40 45 50 55 60 7031 - 35 - - - 0.84 0.16 - - - - - 97 0.06 36 - 40 - - - - 0.58 0.42 - - - - 46 0.03 41 - 45 - - - - 0.64 0.36 - - - - 219 0.13 46 - 50 - - - - 0.59 0.21 0.21 - - - 59 0.04 51 - 55 - - - - - - - 1.00 - - 63 0.04 56 - 60 - - - - - 0.76 - - 0.24 - 59 0.04 66 - 70 - - - - - - - - - 1.00 15 0.01 Unknown 0.01 0.04 0.09 0.25 0.10 0.07 0.03 0.39 0.01 - 1,089 0.66
16 41 103 352 327 231 44 489 30 15 1,648 1.00 0.01 0.03 0.06 0.21 0.20 0.14 0.03 0.30 0.02 0.01 1.00
Trav
el S
peed
(mph
)
Total
Total
S4 - Going Straight & Walking Along/Against
Posted Speed Limit (mph)

81
Table 54. FARS Travel Speed Versus Posted Speed Limit for S1 Pre-Crash Scenario
No Limit 5 10 15 20 25 30 35 40 45 50 55 60 65 70 75 99 Total
1 - 5 1 3 1 1 1 1 1 9 6 - 10 2 1 2 2 1 1 9 11 - 15 8 3 6 2 1 20 16 - 20 1 1 29 9 11 10 61 21 - 25 1 71 20 46 11 8 3 2 2 164 26 - 30 1 1 2 24 57 90 48 31 2 5 3 1 265 31 - 35 1 20 27 292 80 76 6 12 1 2 517 36 - 40 1 1 4 10 95 197 196 18 25 5 4 556 41 - 45 1 2 4 24 54 379 39 66 2 8 2 581 46 - 50 4 1 17 18 60 81 77 6 13 2 279 51 - 55 1 7 13 20 11 198 10 22 3 1 286 56 - 60 2 5 7 5 2 45 30 46 11 153 61 - 65 2 1 3 2 6 2 23 7 143 10 1 200 66 - 70 1 1 1 6 51 51 2 113 71 - 75 1 1 1 6 12 3 24 76 - 80 2 1 2 1 1 7 86 - 90 1 1 2 91 - 95 1 1 2 >97 1 1 1 3 >151 1 1 Not Reported 5 1 2 4 8 176 301 605 455 549 186 315 192 218 43 6 36 3,102 Unknown 14 1 1 3 8 168 128 186 133 151 101 124 9 38 16 1 112 1,194
Total 25 2 3 11 21 515 565 1,393 1,037 1,483 453 901 263 556 150 13 157 7,548
S1 - Going Straight & Crossing
Trav
el S
peed
(mph
)
Posted Speed Limit (mph)
Table 55. FARS Travel Speed Versus Posted Speed Limit for S1 Pre-Crash Scenario Percentage
No Limit 5 10 15 20 25 30 35 40 45 50 55 60 65 70 75 991 - 5 0.11 - - - - 0.33 0.11 0.11 0.11 0.11 - - 0.11 - - - - 9 0.00 6 - 10 - - - 0.22 0.11 0.22 - 0.22 0.11 - - 0.11 - - - - - 9 0.00 11 - 15 - - - - - 0.40 0.15 0.30 0.10 0.05 - - - - - - - 20 0.00 16 - 20 0.02 - - 0.02 - 0.48 0.15 0.18 0.16 - - - - - - - - 61 0.01 21 - 25 - - - - 0.01 0.43 0.12 0.28 0.07 0.05 0.02 0.01 - - - - 0.01 164 0.02 26 - 30 0.00 - - 0.00 0.01 0.09 0.22 0.34 0.18 0.12 0.01 0.02 - 0.01 - - 0.00 265 0.04 31 - 35 0.00 - - - - 0.04 0.05 0.56 0.15 0.15 0.01 0.02 - 0.00 - - 0.00 517 0.07 36 - 40 0.00 - - - 0.00 0.01 0.02 0.17 0.35 0.35 0.03 0.04 0.01 0.01 - - - 556 0.07 41 - 45 0.00 - - - - 0.00 0.01 0.04 0.09 0.65 0.07 0.11 0.00 0.01 - - 0.00 581 0.08 46 - 50 - - - - - 0.01 0.00 0.06 0.06 0.22 0.29 0.28 0.02 0.05 0.01 - - 279 0.04 51 - 55 - - - - - 0.00 - 0.02 0.05 0.07 0.04 0.69 0.03 0.08 0.01 - 0.00 286 0.04 56 - 60 - - - - - - 0.01 0.03 0.05 0.03 0.01 0.29 0.20 0.30 0.07 - - 153 0.02 61 - 65 - - - - - 0.01 0.01 0.02 0.01 0.03 0.01 0.12 0.04 0.72 0.05 0.01 - 200 0.03 66 - 70 - - - - - - - 0.01 0.01 - 0.01 0.05 - 0.45 0.45 0.02 - 113 0.01 71 - 75 - - - - - - 0.04 0.04 0.04 - - - - 0.25 0.50 0.13 - 24 0.00 76 - 80 - - - - - - - - 0.29 - 0.14 - - 0.29 0.14 - 0.14 7 0.00 86 - 90 - - - - - - - 0.50 - - - - - 0.50 - - - 2 0.00 91 - 95 - - - - - - - - - - - 0.50 0.50 - - - - 2 0.00 >97 - - - - - 0.33 - - 0.33 - - 0.33 - - - - - 3 0.00 >151 - - - - - - - - - - - - - - 1.00 - - 1 0.00 Not Reported 0.00 0.00 0.00 0.00 0.00 0.06 0.10 0.20 0.15 0.18 0.06 0.10 0.06 0.07 0.01 0.00 0.01 3,102 0.41 Unknown 0.01 0.00 0.00 0.00 0.01 0.14 0.11 0.16 0.11 0.13 0.08 0.10 0.01 0.03 0.01 0.00 0.09 1,194 0.16
25 2 3 11 21 515 565 1,393 1,037 1,483 453 901 263 556 150 13 157 7,548 1.00 0.00 0.00 0.00 0.00 0.00 0.07 0.07 0.18 0.14 0.20 0.06 0.12 0.03 0.07 0.02 0.00 0.02 1.00
Total
Total
S1 - Going Straight & Crossing
Posted Speed Limit (mph)
Trav
el S
peed
(mph
)

82
Table 56. FARS Travel Speed Versus Posted Speed Limit for S2 Pre-Crash Scenario
15 20 25 30 35 40 45 50 99 Total1 - 5 2 2 2 6 6 - 10 1 1 1 1 4 11 - 15 2 1 1 4 16 - 20 1 1 21 - 25 1 1 86 - 90 1 1 Not Reported 6 7 10 2 2 1 2 30 Unknown 1 6 1 1 3 12
Total 1 1 18 7 16 6 3 2 5 59
Trav
el S
peed
(mph
)
S2 - Turning Right & Crossing Posted Speed Limit (mph)
Table 57. FARS Travel Speed Versus Posted Speed Limit for S2 Pre-Crash Scenario Percentage
15 20 25 30 35 40 45 50 991 - 5 - - 0.33 - 0.33 0.33 - - - 6 0.10 6 - 10 0.25 - 0.25 - 0.25 0.25 - - - 4 0.07 11 - 15 - - 0.50 - 0.25 - - 0.25 - 4 0.07 16 - 20 - - - - - - 1.00 - - 1 0.02 21 - 25 - - 1.00 - - - - - - 1 0.02 86 - 90 - - - - 1.00 - - - - 1 0.02 Not Reported - - 0.20 0.23 0.33 0.07 0.07 0.03 0.07 30 0.51 Unknown - 0.08 0.50 - 0.08 0.08 - - 0.25 12 0.20
1 1 18 7 16 6 3 2 5 59 1.00 0.02 0.02 0.31 0.12 0.27 0.10 0.05 0.03 0.08 1.00
Total
Total
Trav
el S
peed
(mph
)
Posted Speed Limit (mph)S2 - Turning Right & Crossing

83
Table 58. FARS Travel Speed Versus Posted Speed Limit for S3 Pre-Crash Scenario
15 20 25 30 35 40 45 50 99 Total1 - 5 1 4 3 1 1 10 6 - 10 1 3 3 7 11 - 15 3 2 2 1 1 9 16 - 20 1 2 1 1 5 21 - 25 2 2 4 >97 1 1 Not Reported 3 8 20 26 5 5 1 2 70 Unknown 13 5 4 3 1 1 8 35
Total 4 1 32 28 40 13 10 2 11 141
Trav
el S
peed
(mph
)
S3 - Turning Left & Crossing Posted Speed Limit (mph)
Table 59. FARS Travel Speed Versus Posted Speed Limit for S3 Pre-Crash Scenario Percentage
15 20 25 30 35 40 45 50 991 - 5 - 0.10 0.40 - 0.30 0.10 0.10 - - 10 0.07 6 - 10 0.14 - 0.43 - 0.43 - - - - 7 0.05 11 - 15 - - 0.33 0.22 0.22 0.11 - - 0.11 9 0.06 16 - 20 - - 0.20 - 0.40 0.20 0.20 - - 5 0.04 21 - 25 - - - - - 0.50 0.50 - - 4 0.03 >97 - - - 1.00 - - - - - 1 0.01 Not Reported 0.04 - 0.11 0.29 0.37 0.07 0.07 0.01 0.03 70 0.50 Unknown - - 0.37 0.14 0.11 0.09 0.03 0.03 0.23 35 0.25
4 1 32 28 40 13 10 2 11 141 1.00 0.03 0.01 0.23 0.20 0.28 0.09 0.07 0.01 0.08 1.00
S3 - Turning Left & Crossing
Posted Speed Limit (mph)
Trav
el S
peed
(mph
)
Total
Total

84
Table 60. FARS Travel Speed Versus Posted Speed Limit for S4 Pre-Crash Scenario
No Limit 10 15 20 25 30 35 40 45 50 55 60 65 70 75 99 Total1 - 5 1 2 1 4 6 - 10 3 3 11 - 15 3 1 1 1 1 1 8 16 - 20 2 10 1 4 3 1 21 21 - 25 16 7 9 2 4 1 1 40 26 - 30 3 13 24 22 5 3 1 1 72 31 - 35 9 8 89 18 18 4 10 156 36 - 40 1 6 2 17 39 52 4 17 2 2 142 41 - 45 3 1 7 13 140 13 42 2 3 1 225 46 - 50 1 7 5 24 32 71 1 5 1 147 51 - 55 2 4 2 13 4 190 2 8 1 2 228 56 - 60 1 1 1 3 3 2 22 25 23 2 83 61 - 65 1 1 8 3 48 7 2 1 71 66 - 70 3 1 4 1 21 31 1 62 71 - 75 1 1 4 3 4 13 76 - 80 2 1 1 1 5 81 - 85 1 1 91 - 95 1 1 >97 1 1 Not Reported 1 1 2 80 96 173 129 181 66 274 52 83 40 6 22 1,206 Unknown 2 1 4 35 46 66 59 56 11 60 4 18 6 1 30 399
Total 3 1 2 12 183 189 400 278 501 141 705 92 218 92 15 56 2,888
S4 - Going Straight & Along/Against Posted Speed Limit (mph)
Trav
el S
peed
(mph
)
Table 61. FARS Travel Speed Versus Posted Speed Limit for S4 Pre-Crash Scenario Percentage
No Limit 10 15 20 25 30 35 40 45 50 55 60 65 70 75 99
1 - 5 - - 0.25 - 0.50 - - - - - - - - - - 0.25 4 0.00 6 - 10 - - - - 1.00 - - - - - - - - - - - 3 0.00 11 - 15 - - - - 0.38 0.13 0.13 0.13 0.13 - 0.13 - - - - - 8 0.00 16 - 20 - - - 0.10 0.48 0.05 0.19 - 0.14 - 0.05 - - - - - 21 0.01 21 - 25 - - - - 0.40 0.18 0.23 0.05 0.10 0.03 0.03 - - - - - 40 0.01 26 - 30 - - - 0.04 0.18 0.33 0.31 0.07 0.04 - 0.01 - 0.01 - - - 72 0.02 31 - 35 - - - - 0.06 0.05 0.57 0.12 0.12 0.03 0.06 - - - - - 156 0.05 36 - 40 - - - 0.01 0.04 0.01 0.12 0.27 0.37 0.03 0.12 0.01 0.01 - - - 142 0.05 41 - 45 - - - - 0.01 0.00 0.03 0.06 0.62 0.06 0.19 0.01 0.01 - - 0.00 225 0.08 46 - 50 - - - - 0.01 - 0.05 0.03 0.16 0.22 0.48 0.01 0.03 0.01 - - 147 0.05 51 - 55 - - - - - 0.01 0.02 0.01 0.06 0.02 0.83 0.01 0.04 0.00 0.01 - 228 0.08 56 - 60 - - - - 0.01 0.01 0.01 0.04 0.04 0.02 0.27 0.30 0.28 0.02 - - 83 0.03 61 - 65 - - - - 0.01 - - - - 0.01 0.11 0.04 0.68 0.10 0.03 0.01 71 0.02 66 - 70 - - - - - - - - 0.05 0.02 0.06 0.02 0.34 0.50 - 0.02 62 0.02 71 - 75 - - - - - - - 0.08 - - 0.08 - 0.31 0.23 0.31 - 13 0.00 76 - 80 - - - - - - - - - 0.40 0.20 - 0.20 0.20 - - 5 0.00 81 - 85 - - - - - - - - - - - - 1.00 - - - 1 0.00 91 - 95 - - - - - - - - - - 1.00 - - - - - 1 0.00 >97 - - - - - - - 1.00 - - - - - - - - 1 0.00 Not Reported 0.00 0.00 - 0.00 0.07 0.08 0.14 0.11 0.15 0.05 0.23 0.04 0.07 0.03 0.00 0.02 1,206 0.42 Unknown 0.01 - 0.00 0.01 0.09 0.12 0.17 0.15 0.14 0.03 0.15 0.01 0.05 0.02 0.00 0.08 399 0.14
3 1 2 12 183 189 400 278 501 141 705 92 218 92 15 56 2,888 1.00 0.00 0.00 0.00 0.00 0.06 0.07 0.14 0.10 0.17 0.05 0.24 0.03 0.08 0.03 0.01 0.02 1.00
S4 - Going Straight & Along/Against Total
Total
Trav
el S
peed
(mph
)
Posted Speed Limit (mph)

85
APPENDIX B
Table 62. Links to State Fatality Maps
# State Uniform Resource Locator (URL)
1 Alabama https://maps.google.com/maps/ms?msid=213789326663695081249.0004d1d8fa0cf4e88706b&msa=0
2 Alaska https://maps.google.com/maps/ms?msid=213789326663695081249.0004d1edf45d83fd8bf8a&msa=0
3 Arizona https://maps.google.com/maps/ms?msid=213789326663695081249.0004d1ee06334f37877c2&msa=0
4 Arkansas https://maps.google.com/maps/ms?msid=213789326663695081249.0004d1ee0cd719e8a314f&msa=0
5 California https://maps.google.com/maps/ms?msid=213789326663695081249.0004d1ee23cb2789c34f2&msa=0
6 Colorado https://maps.google.com/maps/ms?msid=213789326663695081249.0004d1ee2d650cda40abf&msa=0
7 Connecticut https://maps.google.com/maps/ms?msid=213789326663695081249.0004d1ee337d917af16ce&msa=0
8 Delaware https://maps.google.com/maps/ms?msid=213789326663695081249.0004d1ee3c7d53b8ba6cf&msa=0
9 Florida https://maps.google.com/maps/ms?msid=213789326663695081249.0004d1ee45ba2c95d647b&msa=0
10 Georgia https://maps.google.com/maps/ms?msid=213789326663695081249.0004d1ee4bbd331a8289b&msa=0
11 Hawaii https://maps.google.com/maps/ms?msid=213789326663695081249.0004d1ee5ee8c7aab9e1e&msa=0
12 Idaho https://maps.google.com/maps/ms?msid=213789326663695081249.0004d1ee66d2a536268bb&msa=0
13 Illinois https://maps.google.com/maps/ms?msid=213789326663695081249.0004d1ee6c1b7e1e077e1&msa=0
14 Indiana https://maps.google.com/maps/ms?msid=213789326663695081249.0004d1ee742da8703c479&msa=0
15 Iowa https://maps.google.com/maps/ms?msid=213789326663695081249.0004d1ee77648b4946dce&msa=0
16 Kansas https://maps.google.com/maps/ms?msid=213789326663695081249.0004d1ee7af7685246765&msa=0
17 Kentucky https://maps.google.com/maps/ms?msid=213789326663695081249.0004d1ee7e32175069155&msa=0
18 Louisiana https://maps.google.com/maps/ms?msid=213789326663695081249.0004d1ee8083c19057e28&msa=0
19 Maine https://maps.google.com/maps/ms?msid=213789326663695081249.0004d1ee878c67f86f1a4&msa=0
20 Maryland https://maps.google.com/maps/ms?msid=213789326663695081249.0004d1ee8a71a3f4cb7c6&msa=0
21 Massachusetts https://maps.google.com/maps/ms?msid=213789326663695081249.0004d1ee8df1a6f97facb&msa=0
22 Michigan https://maps.google.com/maps/ms?msid=213789326663695081249.0004d1ee921d8439f2e9f&msa=0
23 Minnesota https://maps.google.com/maps/ms?msid=213789326663695081249.0004d1ee955af234a6a28&msa=0
24 Mississippi https://maps.google.com/maps/ms?msid=213789326663695081249.0004d1ee987bf0058d9be&msa=0
25 Missouri https://maps.google.com/maps/ms?msid=213789326663695081249.0004d1ee9c95692fe604a&msa=0
26 Montana https://maps.google.com/maps/ms?msid=213789326663695081249.0004d1ee9f66a22f0dde1&msa=0
27 Nebraska https://maps.google.com/maps/ms?msid=213789326663695081249.0004d1eea2375631dea0d&msa=0
28 Nevada https://maps.google.com/maps/ms?msid=213789326663695081249.0004d1eea49dd764bffcb&msa=0
29 New Hampshire
https://maps.google.com/maps/ms?msid=213789326663695081249.0004d1eea72b52426be8a&msa=0
30 New Jersey https://maps.google.com/maps/ms?msid=213789326663695081249.0004d1eeab436ebc21053&msa=0
31 New Mexico https://maps.google.com/maps/ms?msid=213789326663695081249.0004d1eeb4e966eb0a8e8&msa=0
32 New York https://maps.google.com/maps/ms?msid=213789326663695081249.0004d1eece20767d05e64&msa=0
33 North Carolina https://maps.google.com/maps/ms?msid=213789326663695081249.0004d1eed16a8c6df2689&msa=0
34 North Dakota https://maps.google.com/maps/ms?msid=213789326663695081249.0004d1eed573d31c9fd14&msa=0
35 Ohio https://maps.google.com/maps/ms?msid=213789326663695081249.0004d1eed794673b572d7&msa=0

86
# State Uniform Resource Locator (URL)
36 Oklahoma https://maps.google.com/maps/ms?msid=213789326663695081249.0004d1eedb2d6d5065f4a&msa=0
37 Oregon https://maps.google.com/maps/ms?msid=213789326663695081249.0004d1eedf9787e37ce1c&msa=0
38 Pennsylvania https://maps.google.com/maps/ms?msid=213789326663695081249.0004d1eee210f7e6746e8&msa=0
39 Rhode Island https://maps.google.com/maps/ms?msid=213789326663695081249.0004d1eeed98c5a717ab0&msa=0
40 South Carolina https://maps.google.com/maps/ms?msid=213789326663695081249.0004d1eef2d8b63284878&msa=0
41 South Dakota https://maps.google.com/maps/ms?msid=213789326663695081249.0004d1eef610953c25a42&msa=0
42 Tennessee https://maps.google.com/maps/ms?msid=213789326663695081249.0004d1eef8a1499e2148c&msa=0
43 Texas https://maps.google.com/maps/ms?msid=213789326663695081249.0004d1eefc013558d797e&msa=0
44 Utah https://maps.google.com/maps/ms?msid=213789326663695081249.0004d1eeff55d41809e44&msa=0
45 Vermont https://maps.google.com/maps/ms?msid=213789326663695081249.0004d1ef0194e8ad18732&msa=0
46 Virginia https://maps.google.com/maps/ms?msid=213789326663695081249.0004d1ef03e2de8deb19d&msa=0
47 Washington, DC
https://maps.google.com/maps/ms?msid=213789326663695081249.0004d1ef072747544a3a5&msa=0
48 Washington https://maps.google.com/maps/ms?msid=213789326663695081249.0004d1ef0a5e81f7ac52c&msa=0
49 West Virginia https://maps.google.com/maps/ms?msid=213789326663695081249.0004d1ef0c90c77902238&msa=0
50 Wisconsin https://maps.google.com/maps/ms?msid=213789326663695081249.0004d1ef0f7d0438a0357&msa=0
51 Wyoming https://maps.google.com/maps/ms?msid=213789326663695081249.0004d1ef122fcf1192e55&msa=0

87
APPENDIX C Smoothed ≡ Original data (the “unsmoothed” data) fitted to a specified function Figure 44. Smoothed Baseline and PCAM-Applicable Pedestrian Distribution for Actual PCDS
Counts for S2 Scenario, Pedestrian Walking, No Obstruction
-
0.10
0.20
0.30
0.40
0.50
0.60
0.70
0.80
1 2 3 4 5 6 7 8 9 10 11 12 13 14 15 16
Pede
stria
n Pr
opor
tion
Impact Speed Bin
Baseline PCAM
Figure 45. Smoothed Baseline and PCAM-Applicable Pedestrian Distribution for Weighted PCDS Cases for S2 Scenario, Pedestrian Walking, No Obstruction
-
0.10
0.20
0.30
0.40
0.50
0.60
0.70
0.80
1 2 3 4 5 6 7 8 9 10 11 12 13 14 15 16
Pede
stria
n Pr
opor
tion
Impact Speed Bin
Baseline PCAM

88
Figure 46. Smoothed Baseline and PCAM-Applicable Pedestrian Distribution for Actual PCDS Counts for S3 Scenario, Pedestrian Walking, No Obstruction
- 0.05 0.10 0.15 0.20 0.25 0.30 0.35 0.40 0.45
1 2 3 4 5 6 7 8 9 10 11 12 13 14 15 16
Pede
stria
n Pr
opor
tion
Impact Speed Bin
Baseline PCAM
Figure 47. Smoothed Baseline and PCAM-Applicable Pedestrian Distribution for Weighted PCDS Cases for S3 Scenario, Pedestrian Walking, No Obstruction
-
0.10
0.20
0.30
0.40
0.50
0.60
1 2 3 4 5 6 7 8 9 10 11 12 13 14 15 16
Pede
stria
n Pr
opor
tion
Impact Speed Bin
Baseline PCAM

DOT HS 811 998 April 2014
10222-041614-v2