tardir/tiffs/a357948 - defense technical information center christine wagener-hul^e, ltcol, usaf....
TRANSCRIPT

LOAN DOCUMENT PHOTOGRAPH THIS SHEET
LEVEL INVENTORY
* DOCUMENT IDENTIOCATION
DISTRIBUTION STATEMENT A: Approved for Public Release -
Distribution Unlimited
DISTRIBUTION STATEMENT
hwwm fw ims one me UNANNOUNCED JUSTIFICATION
T
DISTRIBUTION/
AVAILABILITY CODEf
DISTMBlmON AVAILABILITY AND/0* SPECIAL
QlL
DATE ACCESSIONED
DISTRIBUTION STAMP
DATE RETURNED
19981216 036
H A N D L E
iw I T H
DATE RECEIVED IN DTIC REGISTERED OR CERTIFIED NUMBER
PHOTOGRAPH THIS SHEET AND RETURN TO DTIC-FDAC
DTIC^TOA DOCUMENT PROCESSING SHEET
LOAN DOCUMENT
c A R E
mvUU!UfflMUAvUU!UUURf ITOOt BHXHAIBTED.
AL/EQ-TR-1997-0029
mtä
"DEHÄLOCOCCOIDESETHENOGENES" STRAIN 195, A NOVEL EUBACTERIUM THAT REDUCTIVELY
DECHLORINATES TETRACHLOROETHENE (PCE) TO ETHENE
XAVIER MAYMO-GATELL CORNELL UNIVERSITY
SCHOOL OF CIVIL AND ENVIRONMENTAL ENGINEERING HOLLISTERHALL
ITHACA NY 14853-3501
SEPT 1997
FINAL REPORT: AUG 1993 - OCT 1996
Approved for public release: distribution is unlimited.
AIR FORCE RESEARCH LABORATORY MATERIALS & MANUFACTURING DIRECTORATE AIRBASE & ENVIRONMENTAL TECHNOLOGY DIVISION TYNDALL AFB FL 32403-5323

/■■
NOTICES
This report was prepared as an account of work sponsored by an agency of the United States Government. Neither the United States Government nor any agency thereof, nor any employees, nor any of their contractors, subcontractors, nor their employees, make any warranty, expressed or implied, or assume any legal liability or responsibility for the accuracy, completeness, or usefulness or any privately owned rights. Reference herein to any specific commercial process, or service by trade name, trademark, manufacturer, or otherwise does not necessarily constitute or imply its endorsement, recommendation, or favoring by the United States Government or any agency, contractor, or subcontractor thereof. The views and opinions of the authors expressed herein do not necessarily state or reflect those of the United States Government or any agency, contractor, or subcontractor thereof.
When Government drawings, specifications, or other data are used for any purpose other than in connection with a definitely Government-related procurement, the United States Government incurs no responsibility or any obligations, whatsoever. The fact that the Government may have formulated or in any way supplied the said drawings, specifications, or other data, is not to be regarded by implication, or otherwise in any manner construed, as licensing the holder or any other person or corporation; or as conveying any rights or permission to manufacture, use, or sell any patented invention that may in anyway be related thereto.
This technical report has been reviewed by the Public Affairs Office (PA) and is releasable to the National Technical Information Service (NTIS) where it will be available to the general public, including foreign nationals.
This report has been reviewed and is approved for publication.
DESTRUCTION NOTICE: DESTROY BY ANY METHOD THAT WILL PREVENT DISCLOSURE OF CONTENTS OR RECONSTRUCTION OF THE DOCUMENT.
TIMOTHY G. WILEY, Maj, USAF, BSC Biosystems Area Manager
ANDREW D. POULIS Scientific & Technical Info Prog Mgr
AJU
CHRISTINE WAGENER-HUL^E, LtCol, USAF. BSC Chief, Environmental Technology Development Branch
1EIL J. LAMB, Col, USAF, BSC NEIL J. LAMB, Col, USAF, BSC Chief, Airbase & Environmental Technology Division

REPORT DOCUMENTATION PAGE 1 Form Approved OMB No. 0704-0188
Public reporting burden for this collection of information is estimated to average 1 hour per response, including the time for reviewing instructions, searching <«ri«ting data sources, gathering and maintaining the data needed, and completing and reviewing the collection of information. Send comments regarding this burden estimate or any other aspect of this collection of information, including suggestions for reducing this burden, to Washington Headquarters Services, Directorate for Information Operations and Reports, 1215 Jefferson Davis Highway, Suite 1204, Arlington, VA 22202-4302, and to the Office of Management and Budget, Paperwork Reduction Project (0704-0188). Washington, DC 20503.
1. AGENCY USE ONLY (Leave blank) 2. REPORT DATE Sep 1997
3. REPORT TYPE AND DATES COVERED
Final Report Aug 93 - Oct 96
4. TITLE AND SUBTITLE
"Dehalococcoides ethenogenes" Strain 195, A Novel Eubacterium that Reductively Dechlorinates Tetrachloroethene (PCE) to Ethene
6. AUTHOR(S)
Xavier Maymo-Gatell
5. FUNDING NUMBERS
7. PERFORMING ORGANIZATION NAMES(S) AND ADDRESS(ES) Cornell University School of Civil and Environmental Engineering Hollister Hall Ithaca, NY 14853-3501
8. PERFORMING ORGANIZATION REPORT NUMBER
9. SPONSORING/MONITORING AGENCY NAME(S) AND ADDRESS(ES) AFRL/MLQ 139 Barnes Drive, Suite 2 Tyndall AFB FL 32403-5323
10. SPONSORING/MONITORING AGENCY REPORT NUMBER
AL/EQ-TR-1997-0029
11. SUPPLEMENTARY NOTES Availability of this report is specified on reverse of front cover. Officer: Catherine Vogel (904) 283-6208, DSN 523-6208
AFRL/MLQ Project
12a. DISTRIBUTION/AVAILABILITY STATEMENT Approved for public release; distribution is unlimited.
(PA Case File # 98-501)
12b. DISTRIBUTION CODE
A
13. ABSTRACT (Maximum 200 words) Tetrachloroethene (PCE) is a human carcinogen, and together with trichloroethene (TCE), is widely used. Due to improper handling, they are among the most frequently found groundwater pollutants. A purified, PCE-dechlorinating enrichment culture was developed. This non-methanogenic, non-acetogenic culture could grow with H2 as the electron donor, indicating that H2/PCE serves as an electron donor/acceptor for energy conservation and growth. A novel anaerobic bacterium which dechlorinates PCE to the non- toxic product ethene (ETH), ""Dehalococcoides ethenogenes" strain 195, was isolated from this enrichment. This is the first pure culture capable of complete PCE dechlorination. "£>. ethenogenes" strain 195 is an irregular coccus with an optimal growth temperature of 35°C and pH of 6.8-7.5; Phylogenetic analysis indicates that it is a eubacterium which shows no affiliation to known groups. Electron donors tested other than H2 were not utilized nor were electron donors other than TCE, cis- dichloroethene (cis-DCE), 1,1-DCE, and dichloroethane, which could be freely interchanged and were dechlorinated to ETH. This organism could not grow on vinyl chloride or trans-DCE when provided as sole electron acceptors, but both were dechlorinated cometabolically by cells previously grown on PCE. The reduction of VC to ETH was the rate-limiting reaction to the complete dechlorination of PCE. PCE, TCE, cis-DCE, and 1,1-DCE inhibited ETH formation from VC when present, but, at low concentrations, their dechlorination coexisted with ETH production. Cultures grown on cis-DCE as sole electron acceptor could not dechlorinate PCE unless PCE and cis-DCE were added together.
14. SUBJECT TERMS Hydrogen donor, anaerobic reductive dechlorination, tetrachloroethene, anaerobic enrichment culture, methanogenesis, acetogenesis, trichloroethylene, TCE
PCE, 15. NUMBER OF PAGES
232
16. PRICE CODE
17. SECURITY CLASSIFICATION OF REPORT
Unclassified
18. SECURITY CLASSIFICATION OF REPORT
Unclassified
19. SECURITY CLASSIFICATION OF REPORT
Unclassified
20. LIMITATION OF ABSTRACT
UL
NSN 7540-01-280-5500 Standard Form 298 (Rev. 2-89) Prescribed by ANSI Std. Z39-18 298-102

UNCLASSIFIED SECURITY CLASSIFICATION OF THIS PAGE
CLASSIFIED BY:
DECLASSIFY ON:
n SECURITY CLASSIFICATION OF THIS PAGE
UNCLASSIFIED

PREFACE
This report was submitted as a dissertation to the Graduate School at Cornell University, Ithaca, NY, in partial fulfillment for the degree of Doctor of Philosophy. The dissertation covers work performed by Mr. Xavier Maymo-Gatell. The effort was partially funded by the Armstrong Laboratory Environmental Quality Directorate (AL/EQ) (now known as the Air Force Research Laboratory, Materials and Manufacturing Directorate, Airbase and Environmental Division, AFRL/MLQ).
This dissertation is being published in its original format because of its interest to the worldwide scientific and engineering community. It covers work performed between August 1993 and January 1998. The AL/EQ Project Manager was Ms. Catherine M. Vogel.
HI (The reverse of this page is blank.)
/
BIOGRAPHICAL SKETCH
"Only reason can convince us of those three fimdamental truths without a recognition of which there can be no effective liberty: that what we believe is not necessarily true; that what we like is not necessarily good; and that all questions are open"
CliveBett, 1881-1964, Civüization (1928), ch. 5.
Francesc Xavier Maymö i Gatell was born in Barcelona,
overlooking the Mediterranean Sea, on the 5th of July of 1966. He
attended the Universität de Barcelona for five enjoyable and required
years where, in 1991, he received the degree of Llicenciat en Ciencies
Biolögiques. In the summer of 1989 he came to the USA and worked
at Lake Grove School, Long Island, NY. In the summer of 1990 he did
an internship in microbiology at the University of Massachusetts at
Amherst, under the supervision of Prof. S. Goodwin. From 1990 to
1992 he worked as a research assistant at the Departament de
Microbiologia at the Universität de Barcelona under the direction of
Prof. R. Guerrero. In 1991 he was granted a privately endowed
fellowship from the "La Caixa" Foundation, to seek an advanced
degree in the USA. He came to Cornell University in August 1992 to
pursue the accomplishment of a Ph.D. in Microbiology and, in the
little spare time left, he and Susanna were married at this university.
He finished his Ph. D. in the Spring of 1997 under the supervision of
Prof. S. H. Zinder.
in

/■
To Susanna,
whose intelligence and simplicity have brightened my life forever.
IV

/
ACKNOWLEDGEMENTS
Many people have influenced both my personality and my work,
the latter feeding often from the former. They have all left indelible
imprints that contributed to make this Ph. D. possible. I wish I could
name them all.
I would like to express my deepest thanks to Susanna, the
person with whom I share my life, for her constant support and
encouragement, for her patience, love and sacrifices and for helping
me accomplish what was once an unattainable dream. I wish to thank
my parents; they taught me the discipline and allowed me the freedom
to get here. Together with all in my family and friends, they have
always supported me in this adventure. I also thank all my friends in
the US, specially Ivan Tosques, Jim Alfano and Karin van Dijk, Pav
Sethi, Jeff Bonano, Yok Lan Teh, Stefano Fern, and Indi for making
my times in this country so much more rewarding and unforgettable.
I wish to express my sincerest gratitude to Dr. Stephen Zinder,
adviser and chairman of my special committee, for giving me the
opportunity to come to Cornell University. His trust, excellent
academic advice, and support are very much appreciated. I thank Dr.
Eugene Madsen and Dr. Jane Gibson, for serving in my special
committee. Their constant availability and helpful suggestions have
also made this possible. I wish to thank Dr. James Gossett and Dr.
Emili Montesinos for their profound insights into my research. I also
thank Dr. James Russell, Dr. E. Madsen and everybody in their
laboratories for letting me use some of their equipment and for being

so nice to me. I thank my lab partners and all the undergraduate
students for contributing, each in their special way, to make my
research and my days better. My thanks to Dr. William Ghiorse and
Dr. Parthasarathy for sharing their profound knowledge of
microscopy. Also my thanks to Barbara Eaglesham, Lynne Anguish,
Rhea Garen, Sharon Best, Carole Daugherty and Shannon Caldwell
for their technical assistance with microscopy and photomicroscopy. I
thank Daniel Miller, Corien Bakermans, Kevin McKenna and Donna
Fennell for their studies and technical assistance and also the staff of
the Section of Microbiology for their patience and help. This research
was supported by the United States Air Force's Armstrong Laboratory,
Environmental Quality Directorate, Tyndall Air Force Base, Florida,
and by the Cornell Center for Advanced Technology in Biotechnology,
which is sponsored by the New York State Science and Technology
Foundation, a consortium of industries, and the National Science
Foundation.
I shall always be in debt to the "La Caixa" Foundation,
Catalonia, for providing the exceptional fellowship that allowed me to
come to the U.S. and to Dr. Ricard Guerrero, of the Universität de
Barcelona, for believing in me and for being a truly outstanding and
generous mentor.
VI

/■
TABLE OF CONTENTS
Page
BIOGRAPHICAL SKETCH iii
ACKNOWLEDGEMENTS v
CHAPTER ONE. Introduction 1 References 18
CHAPTER TWO. Characterization of an H2-utilizing enrich- ment culture that reductively dechlorinates PCE to ETH in the absence of methanogen esis and acetogenesis 24
Abstract 24 Introduction 25 Materials and methods 28 Results 33 Discussion 48 References 54
CHAPTER THREE. Isolation and characterization of a novel bac- terium capable of reductively dechlorinating PCE to ETH 57
Abstract 57 Introduction 58 Materials and methods 59 Results 65 Discussion 90 References 94
CHAPTER FOUR. Further characterization of "Dehalococcoides ethenogenes" strain 195 98
Abstract 98 Introduction 99 Materials and methods 100 Results 103 Discussion 114 References 117
Vll

/.
CHAPTER FIVE. Substrate utilization by "Dehalococcoides ethenogenes" strain 195 119
Abstract 119 Introduction .' 120 Materials and methods 121 Results 123 Discussion 142 References 148
CHAPTER SIX. Reductive dechlorination of cis-DCE by "Dehalococcoides ethenogenes" strain 195 150
Abstract 150 Introduction 151 Materials and methods 151 Results 153 Discussion 166 References 171
CHAPTER SEVEN. VC dechlorination to ETH by "Dehalococcoides ethenogenes" strain 195 173
Abstract 173 Introduction 174 Materials and methods 175 Results 176 Discussion 188 References 194
APPENDIX A. Virus-like particles associated with "Dehalococcoides ethenogenes" strain 195 197 References 212
APPENDIX B.
APPENDIX C.
Nutrient studies: sludge supernatant (SS) ... 213
Nutrient studies: substitution of the cell extract from the mixed butyrate/PCE culture 219
vni

LIST OF TABLES
TABLE
TABLE
2.2
3.1
Page
TABLE 2.1 Most probable number (MPN) determinations for microbial populations in a methanol/PCE culture 34
Effect of e" donors on PCE dechlorination and acetogenesis by the purified H2/PCE culture 39
Effect of various nutrient amendments on product formation by cultures transferred into ABSS- supplemented medium with 0.3 g/1 ampicillin 69
TABLE 3.2 Substrates required, utilized and not utilized by Strain 195 82
5.1 Relative rates of chloroaliphatic degradation 147
C. 1 Effects of different nutrient amendments on the growth of Strain DSR 221
TABLE
TABLE
IX

/■
LIST OF FIGURES
Page
FIG. 1.1 Sequential reductive dechlorination of chloroethenes 9
FIG. 2.1 Model for carbon and e" flow in a methanol/PCE anaerobic mixed culture 27
FIG. 2.2 Product formation by the purified H2/PCE culture .. 36
FIG. 2.3 Loss of PCE, VC and ETH into and/or through the stoppers 38
FIG. 2.4 Product formation by the purified H2/PCE culture in the presence or absence of 2 mM Na acetate 41
FIG. 2.5 PCE dechlorination by the purified H2/PCE culture in the presence or absence of the vitamin solution .. 43
FIG. 2.6 Product formation by cultures incubated under different vitamin treatments 44
FIG. 2.7 PCE dechlorination by the purified H2/PCE culture under different concentrations of vitamin B12 46
FIG. 2.8 PCE dechlorination by cultures amended with different percentages of lyophilized SS 47
FIG. 3.1 Conversion of PCE to less chlorinated ethenes by a purified H2/PCE culture incubated in agar roll tubes 66
FIG. 3.2 Product formation from PCE by cultures exposed for the first time to ampicillin, vancomycin and tetracycline 68
FIG. 3.3 Product formation by cultures grown in the presence of ampicillin, amended with either extract from a butyrate/PCE or a methanol/PCE culture 72
FIG. 3.4 VC and ETH produced with different amounts of butyrate/PCE culture extract 74
FIG. 3.5 PCE degradation by "D. ethenogenes" strain 195 grown on ampicillin, ABSS and butyrate/PCE culture extract 75
FIG. 3.6 Product formation from PCE by "D. ethenogenes" strain 195 grown with either the citosolic extract or the
x

/
particulate fracüon of a butyrate/PCE culture 76
FIG. 3.7 Ability to support PCE dechlorination by the filtrate and retentate of a butyrate/PCE culture extract 78
FIG. 3.8 Protein growth curve, cell counts and dechlorination of PCE by "D. ethenogenes" strain 195 79
FIG. 3.9 Time course for the conversion of PCE to ETH by "D. ethenogenes" strain 195 79
FIG. 3.10 Formation of VC and ETH with formate or hydrogen as e" donors 84
FIG. 3.13 Unrooted phylogenetic tree generated for the 16S rDNA sequence from "D. ethenogenes" strain 195 89
FIG. 4.1 Optimal temperature of incubation for the dechlorination of PCE by "D. ethenogenes" strain 195 104
FIG. 4.2 Optimal pH of incubation for the dechlorination of PCE by "D. ethenogenes" strain 195 106
FIG. 4.3 Effects of oxygen on PCE dechlorination 108
FIG. 4.4 Effects of different medium osmolalities on PCE dechlorination 109
FIG. 4.5 PCE dechlorination by cultures growing for a second generation in media of different osmolalities Ill
FIG. 5.1 Dechlorination of PCE; TCE; cis-DCE; trans-DCE; 1,1 -DCE; VC; and DCAby "D. ethenogenes" strain 195 124
FIG. 5.2 ETH and VC produced from VC and trans-DCE 125
FIG. 5.3 Dechlorination of a single high dose of PCE 127
FIG. 5.4 Dechlorination of a single dose of TCE 128
FIG. 5.5 Dechlorination of TCE when used as sole e" acceptor 130
FIG. 5.6 Substrate interchangeability in cultures grown on TCE 131
FIG. 5.7 Dechlorination of 1,1-DCE when used as sole e" acceptor 133
FIG. 5.8 Substrate interchangeability in cultures grown on 1,1-DCE 134
XI

/
FIG. 5.9 DCE isomers and TCE produced and consumed by a slow growing culture of "D. ethenogenes" strain 195 135
FIG. 5.10 Dechlorination of trans-DCE in grown cultures 137
FIG. 5.11 Semilogarithmic plot of trans-DCE disappearance .. 138
FIG. 5.12 Dechlorination of DCA when used as sole e~ acceptor 140
FIG. 5.13 Substrate interchangeability in cultures grown on DCA 141
FIG. 6.1 Effects of adding different amounts of cis-DCE to cultures as sole e" acceptor 154
FIG. 6.2 Effect of adding high amounts of cis-DCE after feeding the culture with PCE 156
FIG. 6.3 Substrate interchangeability in cultures grown on cis-DCE 157-58
FIG. 6.4 PCE disappearance and product formation by "D. ethenogenes" strain 195 grown with cis-DCE 160
FIG. 6.5 PCE disappearance in transfers grown on cis-DCE .. 161
FIG. 6.6 Dechlorination of PCE and cis-DCE when fed together to a grown culture 163
FIG. 6.7 Dechlorination of PCE and cis-DCE when fed together at the time of inoculation with a PCE grown inoculum 164
FIG. 6.8 Dechlorination of PCE and cis-DCE when fed together at the time of inoculation with a cis-DCE grown inoculum 165
FIG. 7.1 VC dechlorination to ETH in the absence and presence of PCE at the time of inoculation 177-78
FIG. 7.2 ETH production by "D. ethenogenes" strain 195 181
FIG. 7.3 ETH formation in relation to the presence or absence of PCE during growth 182-83
FIG. 7.4 ETH production from VC during the presence and absence of chloroethenes during growth 185
FIG. 7.5 Total ETH and VC production from PCE added with hexadecane 186
Xll

/
FIG. 7.6 Close up of Fig. 7.5 showing ETH and VC production from PCE during the first 11 days 189
FIG. A. 1 Products of dechlorination from PCE in a third generation by "D. ethenogenes" strain 195 199
FIG. A.4 PCE dechlorination by "D. ethenogenes" strain 195 transferred from the slow-dechlorinating, heavily infected culture 208
FIG. B. 1 Cultures transferred in the presence or absence of CA, YE, and SS 214
FIG. B.2 Cultures transferred in SS and no CA, or CA and no SS, or CA, AS-II and no SS 216
FIG. C. 1 VC and ETH formation by "D. ethenogenes" strain 195 195 grown with extracts from a butyrate/PCE culture and Strain DSR 223
FIG. C.2 VC and ETH production by "D. ethenogenes" strain 195 grown with extracts from a butyrate/PCE culture and the pellet and supernatant fractions of Strain DSR 224
FIG. C.3 Second generation PCE dechlorination by "D. ethenogenes" grown with extracts from a butyrate /PCE culture and the pellet and supernatant fractions of Strain DSR 225
FIG. C.4 PCE dechlorination by "D. ethenogenes" strain 195 grown with the different cell extracts in the presence and absence of CA and YE 227
FIG. C.5 PCE dechlorination by "D. ethenogenes" strain 195 to which extract from the butyrate/PCE culture or a culture of Strain DSR were added 229
FIG. C.6 PCE dechlorination in third generation co-cultures 231
Xlll
/
LIST OF ILLUSTRATIONS
Page
FIG. 2.9 Photomicrographs of the purified H2/PCE culture showing short rods, long rod and irregular cooci... 49
FIG. 3.11 Thin-section uranyl acetate-stained e" micrographs of coccoid and flattened cells of "D. ethenogenes" strain 195 85-86
FIG. 3.12 Phase contrast and epifluorescence micrographs of cell wall preparations of E. coli DH5a and "D. ethenogenes" strain 195 stained with wheat germ agglutinin 88
FIG. 4.6 Platinum-replica images of "D. ethenogenes" strain 195 112-13
FIG. A.2 Negatively stained cell preparations 201-03
FIG. A.3 Negatively stained viral particles 207
xiv

LIST OF ABBREVIATIONS
BES 2-Bromoethane sulfonic acid
DBA 1,2-Dibromoethane
DCA 1,2-Dichloroethane
DCE Dichloroethene (the three isomers are abbre-
viated: cis-DCE, trans-DCE and 1,1-DCE)
e" Electron
ETH Ethene
GC Gas chromatogaph
H2 Hydrogen
HDC Hexadecane
MPN Most probable number
PCE Tetrachloroethene (perchloroethylene)
SS Anaerobic sewage digestor sludge supernatant
TCE Trichloroethene
VC Vinyl chloride
VFA Volatile fatty acids solution
v/v Volume per volume
YE Yeast extract
xv
/
"Dehalococcoides etherwgenes" strain 195
A NOVEL EUBACTERIUM THAT REDUCTIVELY DECHLORINATES
TETRACHLOROETHENE (PCE) TO ETHENE
Xavier Maymö-Gatell, Ph.D.
Cornell University 1997
Tetrachloroethene (perchloroethylene, PCE) is a human
carcinogen, and together with trichloroethene (TCE), they are widely
used organic solvents. Due to the improper handling of these
chloroethenes, they are among the most frequently found pollutants
in groundwater.
A purified, PCE-dechlorinating enrichment culture was
developed. This non-methanogenic, non-acetogenic culture could grow
with H2 as the electron donor, indicating that H2/PCE serve as an
electron donor/acceptor pair for energy conservation and growth.
A novel anaerobic bacterium which dechlorinates PCE to the
non-toxic product ethene (ETH), "Dehalococcoides ethenogenes" strain
195, was isolated from this enrichment. This is the first pure culture
capable of complete PCE dechlorination. Isolation entailed using the
antibiotic ampicillin and supplementing the growth medium with
cyanocobalamin, anaerobic digestor sludge supernatant (SS), acetate
(as carbon source) and cell-free extracts from mixed cultures. "D.
ethenogenes" strain 195 is an irregular coccus with an optimal growth
temperature of 35°C and pH of 6.8-7.5. Its cell envelope did not react
with a peptidoglycan-specific lectin and it contains a protein S-layer.
Phylogenetic analysis of its 16S rDNA sequence indicates that it is a
eubacterium which shows no affiliation to known groups.
Electron donors tested other than H2 were not utilized nor were
electron acceptors other than TCE, cis-dichloroethene (cis-DCE), 1,1-
DCE and dichloroethane (DCA), which could be freely interchanged
and were dechlorinated to ETH. This organism could not grow on
vinyl chloride (VC) or trans-DCE when provided as sole electron
acceptors, but both were dechlorinated cometabolically by cells
previously grown on PCE. The reduction of VC to ETH was the rate-
limiting reaction to the complete dechlorination of PCE. PCE, TCE,
cis-DCE and 1,1 -DCE inhibited ETH formation from VC when
present, but, at low concentrations, their dechlorination coexisted
with ETH production. Cultures grown on cis-DCE as sole electron
acceptor could not dechlorinate PCE unless PCE and cis-DCE were
added together.
These findings significantly increase our knowledge of the
diversity of organisms capable of reductive dechlorination, knowledge
crucial to understanding and manipulating the in situ dechlorination
of chloroethenes.

CHAPTER ONE
INTRODUCTION
"You people never cared for land or deer or bear. When we dig roots, we make little holes. When we burn grass for grasshoppers, we don't ruin things. We shake down acorns and pinenuts. We don't chop down the trees. But you people plow up the ground, pull down the trees, kill everything. The tree says, "Don't hurt me. lam sore". But you chop it down and cut it up. The rock says, "Don't hurt me. I am sore". But you blast rocks and scatter them on the ground. You people pay no attention. How can the spirit of the Earth like you?... Everywhere you people have touched it, it is sore."
Holy Wintu Indian woman, California, speaking of the destruction of the land by gold and hydraulic mining. (Edited excerpt).
For centuries, the awareness of a polluted environment has
been present in the minds of people having to live with the
consequences of their industrialized society. From the mining
exploitation of metals by Romans to the "Chemical Era", deleterious
side effects of important processes have occurred. The Industrial
Revolution started in England during the last century resulted in an
incredibly rapid improvement in living standards. This improvement
was directly bound to industries and discoveries of new, useful
materials that were easier and cheaper to make and gave better
results than the ones used previously. We ate and dressed better, and
traveled faster, but in doing so we didn't take into consideration the
dangers coming from the toxic derivatives originating from the
production of our commodities, until they started to affect us
negatively. The realization that something had to be done came at a
/
time when these compounds had already deeply affected a large
portion of the other life forms on this planet. It was realized in the
1960s and 70s in the United States, and later in other industrialized
countries, that recalcitrant xenobiotics had become widely distributed
throughout the environment. The widespread pollution of soils,
sediments and groundwater created hazardous conditions that still,
in great measure, have to be dealt with.
1.1 Chlorinated ethenes: uses, problems and solutions.
Since the 1950s, the production of halogenated compounds in
the modern world has grown to quantities so important that can only
be understood if we take into account the success with which these
substances have been used in our industrialized society. In 1985, over
25 billion pounds of halogenated solvents were produced only in the
United States, about five-fold more than what was produced in 1960
(58). Three of the most quantitatively important halogenated
compounds produced are chlorinated ethenes: tetrachloroethene
(perchloroethylene or PCE), trichloroethene (TCE) and vinyl chloride
(chloroethene or VC). PCE and TCE are common organic solvents and
chemical feed stocks with attractive properties: they are nearly
inflammable and non corrosive, and the fact that they do not pose an
acute toxicological hazard has mistakenly induced people to use them
quite indiscriminately. These compounds have been utilized in a
variety of activities: from commercial and industrial dry-cleaning to
metal degreasing of industrial and military machinery and equipment,
as well as in the production of brake and carburetor cleaners, electri-

3;
cal insulators and spot removers (9, 11).
In 1985, about 700 million pounds of PCE were produced in the
United States (58). It is estimated that about 7.8 billion kilograms of
PCE have been synthesized and distributed in the United States since
1945 (1). It is no wonder that with such widespread and intensive use
of PCE and TCE, together with their improper handling, storage, and
disposal, these volatile organic compounds are among the most
frequently found pollutants in groundwater (63).
PCE and VC are human carcinogens (23), while TCE and the
rest of chlorinated ethenes: cis-dichloroethene (cis-DCE), trans-DCE
and 1,1-DCE are suspected carcinogens. All these compounds are
listed as volatile organic contaminants under the 1986 Safe Drinking
Water Act Amendments, and they are subject to rigorous regulation
because of their long-term toxicological threads (24).
Considerable effort and resources have been expended in trying
to remediate large quantities of these chlorinated ethenes in the
environment. In the last ten years, important advances have been
made in the development of techniques for the clean-up of polluted
environments. Environmental engineers have developed both physical
and chemical methods to remove chloroethenes from soils and waters
(e.g., groundwater extraction followed by adsorption to activated
carbon or air-stripping of volatile compounds). Soil is presently
remediated by incineration or extraction with solvents. However,
these techniques are expensive, can be inefficient, and have different
drawbacks. Soil incineration deeply perturbs the environment it
intends to remediate, and adsorption and stripping techniques merely

/■
carry the contaminant/s from one place onto another.
By contrast, the degradation of chlorinated ethenes by bacteria
(bioremediation/biodegradation) has opened a new field of
opportunity for a potentially cheaper, effective and environmentally
respectful manner of dealing with this problem. It is true that
halogenated compounds are considered xenobiotics (technologically
created compounds). Nevertheless, there are more than 200 different
halogenated organic compounds which are produced by bacteria, algae
and sponges (10, 42, 64), and these substances appear to be degraded
by some microorganisms. This indirectly implies that many of the
xenobiotics released into the environment during this century may
not be as foreign to Nature as we thought they were. It is therefore
probable that many different microorganisms may posses the ability
to degrade one or more of these xenobiotics (and this is indeed what
microbiologists are starting to realize). However present, our ability to
biodegrade chlorinated ethenes and other contaminants in situ or in
special facilities directly depends on the information we are able to
determine about the bacteria involved, their nutrient requirements,
the optimal biodegradation conditions, the physiology of the
processes, and the possible formation of toxic intermediates, all of
which need to be better understood. I hope that the work presented in
this dissertation will add a few important bricks to the wall of
information required to effectively bioremediate chlorinated ethenes.
1.2 Aerobic degradation of chlorinated ethenes.
Even though since the early 80s both microbiologists and envi-

ronmental engineers have pursued the finding of a microorganism
able to dechlorinate PCE in the presence of oxygen, there has been no
success. Under aerobic conditions, therefore, PCE is considered to be
non biodegradable. On the other hand, in many instances TCE, the
DCE isomers and VC have been proven to be biodegraded under
aerobic conditions by several bacterial species, including
pseudomonads and other diverse groups (6, 12, 26, 39, 44, 45, 59).
Organisms capable of degrading ethenes with three or fewer
chlorine atoms have been found to contain oxygenases (mono and
dioxygenases). These are enzymes often of low specificity which
produce unstable intermediates. In the case of chloroethenes, these
intermediates are rapidly converted mainly to CO2 and Cl" (45).
TCE degrading monooxygenases have been studied in
methanotrophs (methane-utilizing, aerobic bacteria). In the
laboratory, dechlorination of TCE and its derivatives has been
demonstrated in several publications (26, 37, 65). Although not all
monooxygenases catalyze TCE degradation (61), several pure cultures
of bacteria containing both the soluble and the particulate form of
methane monooxygenase have been reported to do so (37, 45, 57).
Dioxygenases have also been demonstrated to be responsible for
TCE degradation. These enzymes, present in some heterotrophic
bacteria, normally require the presence of an aromatic compound,
such as toluene or phenol (43), to be active. TCE degradation
mediated by dioxygenases has been reported in enrichment (25) and
pure cultures (27, 36, 62), and also in Escherichia colU in which TCE is
degraded by a constitutively expressed toluene dioxygenase (67).

/
Even though it is clear that TCE, the DCE isomers and VC
dechlorination occurs under aerobic conditions, the microorganisms
responsible for these biotransformations are (with the exception of
VC) unable to utilize these chlorinated ethenes as growth substrates.
None of these compounds can be used as a source of carbon and/or
energy and, therefore, their oxidation is considered to be a fortuitous
(cometabolic) process which renders slow rates of degradation. Even
so, these cometabolic pathways have been used as a bioremediation
technology in above-ground treatment systems (2, 19, 40, 55) and to
demonstrate and apply the degradation of TCE in situ (34, 51, 52).
However, all these attempts have to deal with the difficulty of
supplying the indigenous bacteria with both oxygen and methane, as
well as with toluene or phenol. An exception to cometabolic
degradation is Mycobacterium LI E (32)], which is capable of growing on
VC as its only source of carbon and energy. Mineralization of VC has
also been demonstrated in groundwater samples (12).
1.3 Anaerobic degradation of chlorinated ethenes.
As described in the previous point, PCE is non-biodegradable
under aerobic conditions, and TCE, even though it is cometabolically
transformed, is quite recalcitrant. In the absence of oxygen, however,
both PCE and TCE are degraded by natural microbial communities,
mixed microbial enrichment cultures and pure cultures.
In general, there are four different reaction types that transform
halogenated compounds (59). The first two, substitution and
dehydrodehalogenation, do not change the oxidation state of the

/
Substrate and, hence, do not require e" donors or acceptors. In a
substitution, the halogen is replaced by a nucleophile, like OH" or
HS". In a dehydrodehalogenation, a double bond is formed when a
halogen and its concomitant or subsequent hydrogen are removed.
The other two reaction types, oxidation and reduction, do require the
presence of external e" donors or acceptors.
Reductive transformations of halogenated compounds are,
again, classified in 4 basic reaction types (59): (a) dmalo-elirnination,
in which two halogens from an aliphatic compound are excluded from
the molecule previous to the formation of a carbon-carbon double
bond; (b) coupling, in which free radicals are involved; (c) hydrolytic
reduction, in which a two-e" reduction of a polyhalogenated carbon is
followed by hydrolysis; and (d) hydrogenolysis, a reductive
dehalogenation in which a halogen substituent is replaced by a
hydrogen (i.e., RCl+2H++2e"=RH+H++Cl"). The latter is the most
common of the four processes encountered and it is the reaction type
to which the research presented in this dissertation refers.
Certain anaerobes, including methanogens and sulfidogens, are
rich in reduced transition-metal coenzymes (such as hemes, vitamin
B12, and the methanogenic cofactor F430) and can carry out a slow
cometabolic reductive dehalogenation of chloroethenes and other
haloorganics with first-order kinetics (18, 29). Nevertheless, some
anaerobes can reduce the carbon-chlorine bond, by hydrogenolysis, as
an e" accepting reaction for energy conservation and growth,
essentially a form of anaerobic respiration (41). The E°' half-reaction
values for reductive dechlorination of chloroethenes are +0.36 to

8
+0.58 v (59), making their reduction more energetically favorable than
methanogenesis (E°'=-0.24 v) or sulfate reduction (E°'=-0.22 v). The
step-by-step sequence for the reductive dechlorination of PCE to ETH
by hydrogenolysis is shown in Fig. 1.1.
Biotransformation of chlorinated and other halogenated
aliphatics has been demonstrated under different e" acceptor
regimens: from nitrate-reducing conditions (6), to sulfate-reducing
conditions (3), to methanogenic conditions (28), the latter being the
most common in which dehalogenation occurs. Since the early
studies by Bouwer et oL (7), considerable evidence has accrued in
studies of anaerobic microcosms and mixed cultures for reductive
dechlorination of PCE to TCE (22), DCE isomers (3, 31, 50), or VC
(28, 60). More importantly, complete dechlorination to ETH (16, 17,
28), ethane (13, 54), or CO2 (60) has been reported. Partial and
complete PCE dechlorination has been demonstrated also in situ (5, 8,
38, 47), although the environmental parameters governing this
processes are still poorly understood.
Of the three possible DCE isomers formed from TCE
dechlorination, cis-DCE seems to predominate over trans-DCE, 1,1-
DCE being the least significant (4, 46, 47). Also, contrary to what
happens under aerobic conditions, in the absence of oxygen higher
chlorinated compounds are easier to degrade than lesser chlorinated
ones (22). Because the less chlorinated ethenes (mainly VC) are
regulated as harmful contaminants, incomplete PCE dechlorination is
of little benefit to an anaerobic environment. The clear formation of
nontoxic products from PCE, like ETH and ethane, indicate the
/■

/
X I V
II
I I
ü A
x> CM
I O V
II
A ü A
CM
X Ü
V II
Ä 1 Ö
X I- LU
>
(0 ill O Q
X CM
J X o V
II
o o ü f
CM
O O V
II
_A_ Ü o
Ul Ü
Ul o Q.
a x Its -M .. <U 0) o*o o*S ^5 O
Ui •— -t-» >>
Ed „r
• • ,ü -aw £u &Q JSÄ o 03 >> VXi S -a £~ u £ o <y
2 ß «Ö ft* "O p
Ul «4-1 —'
O a) — «1
. C oj Ui
nat
io
isom
o 3 o
T3
o 3 i
*-* <u <u •S-ö Ä CJ -M 4-1 <U «J .
T3 Q s 1-4 u o 2 £2 «a ■rt CJ TJ CJ — <D 3*0 >
"O «* •c U CD <u ^ w "0
■aü Ui
+3 _ CO
ö Ü Mi
3 3 § p Sf-s Ui V -4-J CJ
CO u u o f—«
<H fa (U . O ^
X
K +■>
CM
5 Cd 3
g£s fa H u
J 10
potential for complete anaerobic in situ detoxification of
chloroethenes, either under existing environmental conditions
(natural attenuation), or by addition of e- donors and nutrients
(accelerated bioremediation). However, there needs to be a greater
understanding of the organisms and factors involved in the reductive
dechlorination process to understand why, for example, some
anaerobic systems only partially dechlorinate PCE, while others effect
complete dechlorination.
1.4 Reductive dechlorination of PCE by pure cultures.
The microorganisms responsible for reductive dechlorination of
PCE and the other chloroethenes are beginning to be identified. Some
of these organisms cometabolize PCE to lesser chlorinated products.
Probably the best example is Desulfomonile tiedjei (15), a sulfate-
reducing eubacterium which, coupling growth on formate to the
reductive dechlorination of 3-chlorobenzoate, cometabolizes PCE to
TCE (20). In studies by Fathepure et cd. (20, 21) PCE was also
cometabolized to TCE by Methanosarcina sp. and Methanosarcina
mazei, both coupling methane production to PCE reduction. The
drawback for these cultures is that the rates of chloroethene
degradation, as in nearly all cometabolic reactions, are exceedingly
slow. For example D. tiedjei dechlorinates PCE to TCE at a rate of
2.34 nmol per mg protein per day; Methanosarcina sp. and M. mazei
produced 0.84 and 0.48 nmol TCE per mg protein per day respectively.
Very recently, several organisms have been isolated under
anaerobic conditions which can use PCE as a respiratory e" acceptor,

11
coupling its reduction to growth. In 1993, Holliger et cd. described
Dehalobacter restrictus (formerly strain PER-K23) (33), the main
component of a highly purified enrichment culture. This Gram-
positive bacterium dechlorinated PCE to cts-DCE and it was unable to
use any e" donor provided other than H2 and formate and only used
PCE or TCE as e" acceptors. This organism dechlorinated PCE
optimally at pH 6.8 to 7.6 and at temperatures of 25 to 35°C.
Dehalospirillum multlvorans' isolation was described by Scholz-
Muramatsu et cd. in 1995 (49). This organism was isolated from
activated sludge using pyruvate and PCE as energy substrates. Its 16S
rDNA sequence places it as a new genus into the epsilon subdivision
of Proteobacteria (it clusters with Gram-negative sulfate-reducing
bacteria and campylobacters). D. multivorans grew on several e"
acceptors (fumarate, nitrate and PCE), several other e" donors
(pyruvate, lactate, ethanol, H2, formate, and glycerol), and acetate as
a carbon source. Its growth yield was of 1.6 g cell dry weight per mol
chloride released, and it dechlorinated PCE to cis-DCE at a rate of 3
|imol per hour per mg cell protein. This organism dechlorinated PCE
at an optimal pH of around 7.5 and at a temperature of 25 to 35°C.
Desulfitobacterium sp. strain PCE1 was isolated from an
enrichment culture by Gerritse et al in 1996 (30). Its 16S rDNA
analysis clustered it with Gram-positive sulfate-reducing bacteria, in
the genus Desulfitobacterium. Its optimum growth occurred at pH 7.2
to 7.8 and at temperatures of 34 to 38°C. This organism also had a
wider metabolic versatility than D. restrictus. It utilized as e- donors:
lactate, pyruvate, formate, butyrate, succinate and ethanol; and as e"

12
acceptors: PCE, 3-chloro-4-hydroxy-phenylacetate, 2-chlorophenol,
2,4,6-trichlorophenol, thiosulfate, sulfite and fumarate. Strain PCE1
could also grow fermentatively with pyruvate. The main product of
PCE degradation was TCE, although small amounts of cis-DCE and
trans-DCE were produced (<5%).
Enterobacter sp. strain MS-1 was isolated from a contaminated
site in 1996 by Sharma and McCarty (53). This organism is a
facultatively aerobic bacterium that reductively dechlorinates PCE to
cis-DCE in the absence of oxygen, at a rate of 0.5 nmol per hour per
mg (dry weight) of cells. PCE dechlorination requires the presence of
glucose, pyruvate, lactate, formate, acetate, yeast extract or a mixture
of amino acids as e" donors. Another facultative aerobe, Enterobacter
agglomerans biogroup 5, was also reported to reduce PCE to cis-DCE
(53). Deckard et al. (14) reported a different facultative aerobic
organism that degrades PCE. Chloride was produced but no
intermediates were found and it was suggested that PCE was the
source of carbon whereas oxygen served as the e" acceptor (however,
this has not been confirmed).
Strain TT4B, a Gram-negative rod, was isolated from anaerobic
contaminated sediments by Krumholz et ah in 1996 (35). This strain
used acetate or pyruvate as e" donors and PCE, TCE, ferric
nitrilotriacetate or fumarate as the e- acceptors. Strain TT4B can
tolerate levels of PCE of up to 0.1 mM, much lower than the amount
tolerated by Enterobacter sp. strain MS-1, which was 10 mM.
The metabolic and evolutionary differences existing amongst all
these organisms provide an initial view of what is likely to be a high

' 13
diversity of organisms capable of reductive dechlorination of
chloroethenes. The rates of chloroethene degradation in all these
cases are far more rapid than those of cometabolic reactions, which in
turn creates authentic possibilities for the anaerobic bioremediation
of contaminated sites. None of the microorganisms isolated so far,
however, is capable of dechlorinating PCE to a lesser chlorinated
ethene than eis- 1,2-DCE.
1.5 Development of the PCE-to-ETH culture at Cornell
University.
In 1989, Freedman and Gossett, at Cornell University's
Environmental Engineering Laboratory, were the first to report PCE
dechlorination to ETH. With their experiments, they demonstrated
the potential for anaerobic dechlorination of low levels of PCE (3 to
4.5 nmol/1) to an environmentally acceptable product (ETH) (28).
The culture was originally obtained from the Ithaca Wastewater
Treatment Plant, which has since been replaced by a newer plant.
First-generation bottles consisted of 100% material developed from
anaerobic digestor sludge and were incubated at 35°C. Subsequent
transfers were done under methanogenic conditions with 2 to 10% v/v
inocula. Dechlorination of PCE to ETH was observed in all transfers,
including the first-generation bottles. An experiment performed on
sixth-generation cultures showed that [14C]PCE was being
transformed almost exclusively to [14C]VC and [14C]ETH. The last
step of dechlorination (VC to ETH) appeared to be rate limiting and,
indeed, there was persistence of some VC even after 270 days after the

M'
start of ETH formation by the culture. An e" donor was required to
support dechlorination. Glucose, acetate, formate, and H2 could be
utilized as e" donors, yet it was methanol that facilitated the greatest
conversion of PCE to ETH. 2-bromoethanesulfonate (BES), a selective
inhibitor of methyl-coenzyme M reductase (the enzyme which
catalyzes the last step of methanogenesis), stopped the formation of
methane and, at the same time, the dechlorination of PCE further
than TCE. This led to the hypothesis that a methanogen was
responsible for the dechlorination of PCE.
As the PCE doses administered to the methanol/PCE culture
gradually increased, this enrichment culture evolved to a point where
nominal concentrations of up to 550 |imol/l PCE were being almost
completely dechlorinated (99% ETH, 1% VC) in just 4 days (17). In
these experiments by DiStefano, Gossett and Zinder, VC was still
accumulated by the culture and its reduction proved to be the rate
limiting reaction.
The high amounts of PCE added to the methanol/PCE culture
caused a decline in methane production (at a PCE concentration of
about 250 (imol/1) and nearly completely inhibited methanogenesis (at
a PCE concentration of about 550 ^imol/1). This was supported by
unpublished results by Zinder (66) in which populations of methanol-
using methanogens were undetectable when the level of PCE was
increased to 550 |imol/l, while they were present at populations near
107 cells/ml when the PCE level was low. Inhibition could have also
been caused by ETH, as it had been demonstrated previously by
Schink et cd. (48). Even though the high PCE/ETH concentrations did

15
inhibit methanogenic activity, they did not affect dechlorination and
the culture could be transferred indefinitely under these conditions.
This result strongly pointed towards an identity for the dechlorinating
organism/s different from that of methanogenic bacteria, therefore
invalidating the initial hypothesis.
The levels of methanol amended as an e" donor to the culture
were low relative to the amount of PCE when compared with the
experiments by Freedman and Gossett (28). They represented about
twice the amount needed to effect complete dechlorination of the PCE
added to ETH (2:1 methanohPCE ratio, on an e" equivalent basis).
Because methanol is a direct precursor of methane, the absence of
methanogenesis produced a more efficient use of the methanol
equivalents by both the reductive dechlorination and the acetogenic
processes, the activities of which increased considerably after
methanogenesis ceased. Still, though, the dominant pathway
occurring in the methanol/PCE enrichment culture was acetogenesis
(in an e" balance, acetate production accounted for 69% of the
methanol supplied). The microorganism(s) responsible for the
reduction of chloroethenes in the culture could be an acetogen, using
methanol as e" donor, or an independent, different organism, which
could be using the hydrogen generated during acetogenesis (17).
In further studies, methanol-fed and H2-fed cultures were tested
for PCE dechlorination in the presence of vancomycin, a eubacterial
cell wall synthesis inhibitor (16). Vancomycin (100 mg/1) inhibited
PCE dechlorination from methanol and acetogenesis from methanol
and H2, but PCE dechlorination from H2 was not affected. This

/. 16
suggested that the PCE dechlorinator was resistant to vancomycin
and could not use methanol directly, but rather, required methanol
metabolism, most likely from acetogenic bacteria to provide H2 (or
formate) as the true e" donor for reductive dechlorination. In these
same studies, addition of BES to the culture again inhibited
dechlorination beyond TCE in both methanol- and H2-fed systems.
Since BES, apart from being structurally similar to coenzyme M, is
also a halogenated aliphatic like the chloroethenes, inhibition of
dechlorination appeared to be due to this resemblance.
DiStefano et al found that for the methanol/PCE culture, H2
could readily replace methanol for several feedings (16), although
eventually performance faltered. Good performance was restored by
resuspension of the H2/PCE culture in the filter-sterilized
supernatant from the methanol/PCE culture, suggesting that the
latter contained growth factors required by the dechlorinator(s).
More recent time-course studies (56) showed that the
methanol/PCE culture was capable of reductive dechlorination of all
chloroethenes. PCE, TCE, cis-DCE, and 1,1-DCE showed essentially
near zero-order kinetics. PCE was initially degraded quantitatively to
VC. VC dechlorination to ETH did not usually commence until other
chloroethenes (except trans-DCE) were absent, suggesting
chloroethene inhibition of VC dechlorination to ETH. Dechlorination
of VC and trans-DCE showed first-order kinetics. The culture also
made small amounts of methane after PCE depletion, apparently due
to lack of inhibition of methanogenic bacteria at low PCE
concentrations. The culture also rapidly dehalogenated 1,2-dibromo-

17
ethane (DBA) and 1,2-dichloroethane (DCA) to ETH.
1.6 Objectives of this research.
The studies reported so far with the "Cornell Culture" have been
done with mixed enrichment cultures in which the specific organisms
and interactions that reductively dehalogenate chlorinated ethenes
have not been elucidated. The knowledge crucial to understanding and
manipulating the in situ dechlorination of chloroethenes needs to be
complemented by the study of pure cultures; their growth
requirements, their diversity, their degradation pathways.
This study had three main objectives:
(a) The isolation of the microorganism(s) responsible for the
complete reductive dechlorination of PCE in the methanol/PCE
culture. Because the organisms were growing in a poorly defined
medium, an initial characterization of the organisms and specific
conditions that favor the dechlorination process were performed in
the mixed culture. This helped in a direct way in the isolation
process.
(b) The characterization of the isolate(s)s structural properties
(by optical and electron microscopy), growth requirements (growth
rates, e" donors and acceptors, carbon sources, optimal pH and
temperature, etc.), and phylogeny (by analysis of its 16S rDNA).
(c) The quantitative study of the utilization of PCE and its
derived molecules as potential e" acceptors by the isolate.

1
REFERENCES
l.Abelson, P. H. 1990. Inefficient remediation of ground-water pollution. Science. 250(4982):73.
2.Alvarez-Cohen, L., and P. L. McCarthy. 1991. Two-stage dispersed- growth treatment of halogenated aliphatic compounds by cometabolism. Environ. Sei. Technol. 25(8): 1387-1393.
3.Bagley, D. M., and J. M. Gossett. 1990. PCE transformation to TCE and eis- 1,2-dichloroethene by sulfate-reducing enrichment cultures. Appl. Environ. Microbiol. 56:2511-2516.
4.Barrio-Lage, G., F. Z. Parsons, R. S. Nassar, and P. A. Lorenzo. 1986. Sequential dehalogenation of chlorinated ethenes. Environ. Sei. Technol. 20:96-99.
5.Beeman, R. E., J. E. Howell, S. H. Shoemaker, E. A. Salazar, and J. R. Buttram. 1993. A field evaluation of in situ microbial reductive dehalogenation by the biotransformation of chlorinated ethenes, p. 14-27. In R. E. Hinchee, A. Leeson, L. Semprini, and S. K. Ong (ed.), Bioremediation of chlorinated and polycyclic aromatic hydrocarbon compounds. Lewis Publishers.
6.Bouwer, E. J., and P. L. McCarty. 1983. Transformations of halogenated organic compounds under denitrification conditions. Appl. Environ. Microbiol. 45(4): 1295-1299.
7.Bouwer, E. J., B. E. Rittmann, and P. L. McCarty. 1981. Anaerobic degradation of halogenated 1- and 2-carbon organic compounds. Environ. Sei. Technol. 15(5):596-599.
8.Bradley, P. M., and F. H. Chapelle. 1996. Anaerobic mineralization of vinyl chloride in Fe(III)-reducing, aquifer sediments. Environ. Sei. Technol. 30:2084-2086.
9.Chemical Week. 1986. , p. 56, Chemical Week, vol. 138.
lO.Collen, J., A. Ekdahl, K. Abrahamsson, and M. Pedersen. 1994. The involvement of H2O2 in the production of volatile halogenated compounds by MeristieUa gelfd£um.Phytochemistry.36(5): 1197-1202.
11.Crooks, W. H. 1993. Wastewater from dry cleaners is anything but clean. Water Environ, and Technol. 5:30-32.
12.Davis, J. W., and C. Carpenter. 1990. Aerobic Biodegradation of

19
vinyl chloride in groundwater samples. Appl. Environ. Microbiol. 56:3878-3880.
13.de Bruin, W. P., M. J. J. Kotterman, M. A. Posthumus, G. Schraa, and A. J. B. Zehnder. 1992. Complete biological reductive transformation of tetrachloroethylene to ethane. Appl. Environ. Microbiol. 58:1996-2000.
14.Deckard, L. A., G. C. Wills, and D. V. Rivers. 1994. Evidence for aerobic degradation of tetrachloroethylene by a bacterial isolate. Biotechnol. Lett. 16:1221-1224.
15.DeWeerd, K. A., L. Mandelco, R. S. Tanner, C. R. Woese, and J. M. Suflita. 1990. Desulfomonile tiedjei gen. nov. and sp. nov., a novel anaerobic dehalogenating, sulfate-reducing bacterium. Arch. Microbiol. 154:23-30.
16.DiStefano, T. D., J. M. Gossett, and S. H. Zinder. 1992. Hydrogen as an electron donor for the dechlorination of PCE by an anaerobic mixed culture. Appl. Environ. Microbiol. 58:3622-3629.
17.DiStefano, T. D., J. M. Gossett, and S. H. Zinder. 1991. Reductive dechlorination of high concentrations of PCE to ethene by an anaerobic enrichment culture in the absence of methanogenesis. Appl. Environ. Microbiol. 57(8):2287-2292.
18.Ensley, B. D. 1991. Biochemical diversity of trichloroethylene metabolism. Ann. Rev. Microbiol. 45:283-299.
19.Ensley, B. D., and P. R. Kurisko. 1994. A gas lift bioreactor for removal of contaminants from the vapor phase. Appl. Environ. Microbiol. 6O(l):285-290.
20.Fathepure, B. Z., and S. A. Boyd. 1988. Dependence of tetrachloroethylene dechlorination on methanogenic substrate consumption by Methanosarcina sp. Strain DCM. Appl. Environ. Microbiol. 54(12):2976-2980.
21.Fathepure, B. Z., and S. A. Boyd. 1988. Reductive dechlorination of perchloroethylene and the role of methanogens. FEMS Microbiol. Lett. 49:149-156.
22.Fathepure, B. Z., J. P. Nengu, and S. A. Boyd. 1987. Anaerobic bacteria that dechlorinate perchloroethene. Appl. Environ. Microbiol. 53(11):2671-2674.
23.Federal Register. 1985. . 40(141):46885-46904.
24.Federal Register. 1989. National primary and secondary drinking
^ 20
water regulations; proposed rule. . 54(97):22062-22160.
25.Fliermans, C. B., T. J. Phelps, D. Ringleberg, A. T. Mikell, and D. C. White. 1988. Mineralization of trichloroethylene by heterotrophic enrichment cultures. Appl. Environ. Microbiol. 54:1709-1714.
26.Fogel, M. M., A. R. Taddeo, and S. Fogel. 1986. Biodegradation of chlorinated ethenes by a methane-utilizing mixed culture. Appl. Environ. Microbiol. Sl(4):720-724.
27.Folsom, B. R., P. J. Chapman, and P. H. Pritchard. 1990. Phenol and trichloroethylene degradation by Pseudomonas cepacia G4: kinetics and interactions between substrates. Appl. Environ. Microbiol. 56:1279-1285.
28.Freedman, D. L., and J. M. Gossett. 1989. Biological reductive dechlorination of tetrachloroethylene and trichloroethylene to ethylene under methanogenic conditions. Appl. Environ. Microbiol. 55(9):2144-2151.
29Gantzer, C. J., and L. P. Wackett. 1991. Reductive dechlorination catalyzed by bacterial transition-metal coenzymes. Environ. Sei. Technol. 25(4):715-722.
30.Gerritse, J., V. Renard, T. M. Pedro-Gomes, P. A. Lawson, M. D. Collins, and J. C. Gottschal. 1996. Desulfitobacterium sp. strain PCE1, an anaerobic bacterium that can grow by reductive dechlorination of tetrachloroethene or ortho-chlorinated phenols. Arch. Microbiol. 165:132-140.
31.Gibson, S. A., and G. W. Sewell. 1992. Stimulation of reductive dechlorination of tetrachloroethene in anaerobic aquifer microcosms by addition of short-chain organic acids or alcohols. Appl. Environ. Microbiol. 58(4): 1392-1393.
32.Hartmans, S., J. de Bont, J. Tramper, and K. Luyben. 1985. Bacterial degradation of vinyl chloride. Biotechnol. Lett. 7(6):383- 388.
33.Holliger, C, G. Schraa, A. J. M. Stams, and A. J. B. Zehnder. 1993. A highly purified enrichment culture couples the reductive dechlorination of tetrachloroethene to growth. Appl. Environ. Microbiol. 59:2991-2997.
34.Hopkins, G. D., L. Semprini, and P. L. McCarty. 1993. Micro- cosm and in situ field studies of enhanced biotransformation of trichloroethylene by phenol-utilizing organisms. Appl. Environ.

21 '
Microbiol. 59:2277-2285.
35.Krumholz, L. R., R. Sharp, and S. S. Fishbain. 1996. A freshwater anaerobe coupling acetate oxidation to PCE dehalogenation. Appl. Environ. Microbiol. 62:4108-4113.
36.Leahy, J. G., A. M. Byrne, and R. H. Olsen. 1996. Comparison of factors influencing trichloroethylene degradation by toluene- oxidizing bacteria. Appl. Environ. Microbiol. 62(3):825-833.
37.Little, C. D., A. V. Palumbo, S. E. Herbes, M. E. Lidstrom, R. L. Tyndall, and P. J. Gilmer. 1988. Trichloroethylene biodegradation by a methane-oxidizing bacterium. Appl. Environ. Microbiol. 54(4):951-956.
38.Major, D. W., E. W. Hodgins, and B. J. Butler. 1991. Field and laboratory evidence of in situ biotransformation of tetrachloroethene to ethene and ethane at a chemical transfer facility in north Toronto, p. 113-133. In R. E. Hinchee and R. F. Olfenbuttel (ed.).On-Site Bioreclamation—Processes for Xenobiotic and Hydrocarbon Treatment. Butterworth-Heinemann, Boston.
39.Malachowsky, K. J., T. J. Phelps, A. B. Teboli, D. E. Minnikin, and D. C. White. 1994. Aerobic mineralization of trichloroethylene, vinyl chloride, and aromatic compounds by Rhodococcus species. Appl. Environ. Microbiol. 60(2):542-548.
40.McFarland, M. J., C. M. Vogel, and J. C. Spain. 1992. Methanotrophic cometabolism of TCE in a two stage bioreactor system. Wat. Res. 26(2):259-265.
41.Mohn, W. W., and J. M. Tiedje. 1992. Microbial reductive dehalogenation. Microbiol. Rev. 56:482-507.
42.Neidleman, S. L., and J. Geigert. 1986. Biohalogenation: principles, basic roles and applications. Ellis Horwood Ltd., Chichester, U. K.
43.Nelson, M. K., S. O. Montgomery, and P. H. Pritchard. 1988. Trichloroethylene metabolism by microorganisms that degrade aromatic compounds. Appl. Environ. Microbiol. 54(2):604-606.
44.Nelson, Y. M., and W. J. Jewell. 1993. Methanotrophic biodegradation of vinyl chloride. ASCE J. Environ. Eng. 119(5):890-907.
45.01denhuis, R., R. L. J. M. Vink, D. B. Janssen, and B. Witholt. 1989. Degradation of chlorinated aliphatic hydrocarbons by Methylosinus trvchosporium OB3b expressing soluble methane
22
monooxygenase. Appl. Environ. Microbiol. 55(ll):2819-2826.
46.Parsons, F., G. B. Lage, and R. Rice. 1985. Biotransformation of chlorinated organic solvents in static microcosms. Environ. Toxicol. Chem. 4:739-742.
47.Parsons, F., P. R. Wood, and J. DeMarco. 1984. Transformations of tetrachloroethene and trichloroethene in microcosms and groundwater. J. Am. Waterworks Assoc. 76 (2)(2):56-59.
48.Schink, B. 1985. Inhibition of methanogenesis by ethylene and other unsaturated hydrocarbons. FEMS Microbiol. Ecol. 31:63-68.
49.Scholz-Muramatsu, H., A. Neumann, M. Messmer, E. Moore, and G. Diekert. 1995. Isolation and characterization of Dehalospirillurn. multivorans gen nov, sp nov, a tetrachloroethene- utilizing, strictly anaerobic bacterium. Arch. Microbiol. 163(1):48- 56.
50.Scholz-Muramatsu, H.t R. Szewzyk, U. Szewzyk, and S. Gaiser. 1990. Tetrachloroethene as electron acceptor for the anaerobic degradation of benzoate. FEMS Microbiol. Lett. 66:81-86.
51.Semprini, L., P. V. Roberts, G. D. Hopkins, and D. M. Mackay. 1987. A field evaluation of in-situ biodegradation methodologies for the restoration of aquifers contaminated with chlorinated aliphatic compounds: results of a preliminary demonstration. Technical Report 302. Stanford University, Department of Civil Engineering, Stanford, CA 94305.
52.Semprini, L., P. V. Roberts, G. D. Hopkins, and P. L. McCarty. 1990. A field evaluation of in-situ biodegradation of chlorinated ethenes: Part 2, results of biostimulation and biotransformation experiments. Ground Water. 28:715-727.
53Sharma, P. K., and P. L. McCarty. 1996. Isolation and characterization of a facultatively aerobic bacterium that reductively dehalogenates tetrachloroethene to eis-1,2- dichloroethene. Appl. Environ. Microbiol. 62(3):761-765.
54.Skeen, R. S., J. Gao, and B. S. Hooker. 1995. Kinetics of chlorinated ethylene dehalogenation under methanogenic conditions. Biotechnol. Bioengineering. 48:659-666.
55.Strandberg, G. W.f T. L. Donaldson, and L. L. Farr. 1989. Degradation of trichloroethylene and trans- 1,2-dichloroethylene by a methanotrophic consortium in a fixed film, packed-bed bioreactor. Environ. Sei. Technol. 23(11): 1422-1425.
/■

/ 23
56.Tandoi, V., T. D. DiStefano, P. A. Bowser, J. M. Gossett, and S. H. Zinder. 1994. Reductive dehalogenation of chlorinated ethenes and halogenated ethanes by a high-rate anaerobic enrichment culture. Environ. Sei. Technol. 28:973-979.
57.Tsien, H., G. A. Brusseau, R. S. Hanson, and L. P. Wackett. 1989. Biodegradation of trichloroethylene by Methylosinus trichosporwm OB3b. Appl. Environ. Microbiol. 55(12):3155-3161.
58.U.S. International Trade Commission. 1986. Synthetic Organic Chemicals, U. S. Production and Sales, 1957-85. U. S. International Trade Commission, Washington, D. C.
59.Vogel, T. M., C. S. Criddle, and P. L. McCarty. 1987. Transformations of halogenated aliphatic compounds. Environ. Sei. Technol. 21(8):722-736.
60.Vogel, T. M., and P. L. McCarty. 1985. Biotransformation of tetrachloroethylene to trichloroethylene, dichloroethylene, vinyl chloride, and carbon dioxide under methanogenic conditions. Appl. Environ. Microbiol. 49(5): 1080-1083.
61.Wackett, L. P., G. A. Brusseau, S. R. Householder, and R. S. Hanson. 1989. Survey of microbial oxygenases: trichloroethylene degradation by propane-oxidizing bacteria. Appl. Environ. Microbiol. S5(ll):2960-2964.
62.Wackett, L. P., and D. T. Gibson. 1988. Degradation of trichloroethylene by toluene dioxygenase in whole-cell studies with Pseudomonas putida Fl. Appl. Environ. Microbiol. 54:1703-1708.
63.Westrick, J. J., J. W. Mello, and R. F. Thomas. 1984. The groundwater supply survey .J. Am. Waterworks Assoc. 76(5):52-59.
64.Wever, R. 1991. Formation of halogenated gases by natural sources, p. 277-285. In J. E. Rogers and W. B. Whitman (ed.), Microbial production and consumption of greenhouse gases: methane, nitrogen oxides, and halomethanes. American Society for Microbiology, Washington, D. C.
65.Wilson, J. T., and B. H. Wilson. 1985. Biotransformation of trichloroethylene in soil. Appl. Environ. Microbiol. 49(l):242-243.
66.Zinder, S. H. Unpublished results.
67.Zylstra, G. J., L. P. Wackett, and D. T. Gibson. 1989. Trichloroethylene degradation by Escherichia coli containing the cloned Pseudomonas putida Fl toluene dioxygenase genes. Appl. Environ. Microbiol. 55(12):3162-3166.
/
CHAPTER TWO
CHARACTERIZATION OF AN H2-UTILIZING ENRICHMENT CULTURE THAT REDUCTIVELY
DECHLORINATES PCE TO ETH IN THE ABSENCE OF METHANOGENESIS AND ACETOGENESIS
"When one is drunk with a vision, he deems his faint expression of it the very wine"
Kahlil Gibran, Sand and Foam, 1970, p. 13 Alfred-A'Knofl, ed., New York
2.1 ABSTRACT.
Previous results indicated that H2 was the direct electron donor
for reductive dechlorination of PCE to ETH by an anaerobic
enrichment culture which used methanol as a general e- donor. Most
probable number counts performed on this culture indicated high
numbers (>106/ml) of sulfidogens, methanol-utilizing acetogens,
fermentative heterotrophs, and PCE dechlorinators using H2. A
H2/PCE enrichment culture was derived from a 10-6 dilution of the
methanol/PCE culture. This H2/PCE culture used PCE at increasing
rates over time and could be transferred indefinitely with H2 as the e-
donor for PCE dechlorination, indicating that H2/PCE can serve as
an e" donor/acceptor pair for energy conservation and growth.
Sustained PCE dechlorination by this culture was supported by
supplementation with 0.05 mg/1 vitamin B12, 25% v/v anaerobic
digestor sludge supernatant (SS), and 2 mM acetate, which
24

25 /■
presumably served as a carbon source. Neither methanol nor acetate
could serve as an e- donor for dechlorination by the H2/PCE culture,
and it did not produce CH4 or acetate from H2/CO2 or methanol,
indicating the absence of methanogenic and acetogenic bacteria.
Microscopic observations of the purified H2/PCE culture showed only
two major morphotypes: irregular cocci and small rods.
2.2 INTRODUCTION.
Several studies have been performed on an anaerobic
enrichment culture which uses methanol as the electron (e") donor for
reductive dechlorination of PCE to ETH. In initial studies (9), PCE
was fed every two days at a dose of 3.5 |imol/l of culture medium. VC
was the primary product, and most of the 0.32 mmol/1 of methanol
that was added as an e" donor was used for methanogenesis. In a
subsequent study (6), PCE and methanol doses were gradually
increased until they reached 0.55 mmol/1 PCE and 1.6 mmol/1
methanol. This increase drastically improved the performance of the
culture, with nearly complete conversion of PCE to ETH occurring
within four days. The culture also had essentially ceased producing
methane from methanol and, instead, the reducing equivalents from
methanol not used for PCE reduction were used for acetogenesis.
More recent time-course studies (23) have shown that the
methanol/PCE culture was capable of reductive dechlorination of all
chloroethenes. PCE was initially degraded quantitatively to VC. VC
dechlorination to ETH did not usually commence until other
26
chloroethenes were absent and VC dechlorination showed first-order
kinetics. The culture also made small amounts of methane, usually-
after PCE depletion.
While methanol could serve as e" donor for the culture, and
appeared to be especially well-suited for sustained dechlorination, it
was found in early studies that glucose, formate, and H2 could also
serve as e- donors (9). Studies with other cultures have shown that
H2 (14), fatty acids (12) and even toluene (21) could stimulate PCE
dechlorination. It was possible that some of these e" donors were
serving as sources of a more universal e" donor, H2. For the
methanol/PCE culture, H2 could readily replace methanol for several
feedings (5), although eventually performance faltered. Good
performance was restored by resuspension of the H2/PCE culture in
the supernatant from the methanol/PCE culture, suggesting that the
latter contained growth factors required for dechlorination. The
eubacterial cell wall synthesis inhibitor vancomycin inhibited PCE
dechlorination and acetogenesis from methanol, but PCE
dechlorination from H2 was not affected. This suggested that the PCE
dechlorinator was resistant to vancomycin, and that it could not use
methanol directly, but rather, required methanol metabolism, most
likely to provide H2 or formate as the e" donor for reductive
dechlorination.
Fig. 2.1 shows a model of the metabolism of methanol and PCE
by the dechlorinating culture which includes the hypotheses that H2
is the actual e- donor for dechlorination, and that there is a
nutritional contribution made to PCE-dechlorinators by methanol-me-

/ 27
CH3OH Methanogens
->f^-CH4
- -Nutrients? \
CH3COOI-
High PCE
Dechlorinating organisms
3to- PCE
High PCEi
Methanogens
ETH
4HCI
FIGURE 2.1. Model, based on DiStefano et cd. (5) for carbon and e" flow in a methanol/PCE anaerobic mixed culture.

28
tabolizing organisms (4, 5). This model suggests that a better-defined
culture on H2 and PCE could be obtained if its nutritional needs are
met. In this chapter, we examine the microbial populations in the
methanol/PCE culture, and describe the characterization of a highly
purified H2/PCE culture derived from a 10"6 dilution of the
methanol/PCE culture.
2.3 MATERIALS AND METHODS.
2.3.a Chemicals.
High performance liquid chromatography (HPLC) -grade PCE
(Aldrich Chemical Co., Inc., Milwaukee, Wis.) and methanol (Fisher
Scientific, Springfield, N.J.) were used as culture substrates. H2 was
purchased from Empire Airgas, Inc., Elmira, N.Y. VC was obtained as
a gas from Matheson Gas Products, Inc., Secaucus, N.J. Other
chloroethenes were obtained from Aldrich Chemical Co. Ethane,
ethene, and methane were purchased from Supelco, Bellefonte, Penn.
All other chemicals used were reagent grade or better.
2.3.b Analyses.
For qualitative analysis of ethenes in most probable number
tubes, a Model 1400 flame ionization detector-gas Chromatograph
(GC) (Varian, Walnut Grove, Calif.) was used with a 2 m x 3 mm
stainless steel column packed with 60/80 mesh Carbopak B/1% SP-
1000 (Supelco, Bellefonte, Penn.) and operated isothermally at 200° C

29
as described previously (23).
For quantitative analysis of chloroethenes and ETH, gas
(headspace) samples of 100-|il were analyzed using a Model 8610 GC
(SRI Instruments, Las Vegas, Nev.) equipped with flame ionization
detector and using the same column and operating conditions as
described above. Peak areas were calculated using the Peaksimple 2
software supplied with the GC, and were compared to standard curves
for chloroethenes (13). Partition coeficients for the different
compounds, as obtained by Gossett (13) and Freedman (8) at 35°C in
serum bottles with an aqueous volume of 100 ml and a headspace
volume of 60 ml were (in parenthesis, the compound partitioning in
the aqueous phase in %): PCE=1.18 (58.5); TCE=0.63 (72.6); cis-
DCE=0.235 (87.6); trans-DCE=0.575 (74.3); 1,1-DCE=1.52 (52.3);
VC=1.38 (54.7); and ETH=9.06 (15.5). When we added 5 |imol PCE to a
27 ml crimp-top tube containing 10 ml of growth medium, the
nominal concentration was 0.5 mmoles/liter, while the estimated
aqueous concentration (13) was 0.16 mmol/liter.
When methane and ETH were produced together, they were
measured with a Varian 1400 GC using a Porapak R column as
described previously (18). The detection limit for methane was ca. 0.1
Pa, or 1 nmol/tube. H2 was analyzed by gas chromatography with a
AGC 110 thermal conductivity GC (Hach Carle, Lehigh Valley, Perm.)
using N2 as the carrier gas as described previously (28). Headspace
samples were 100-(il in all cases. Acetate concentrations were
quantified using HPLC with a fast acid analysis column (Bio Rad,
Richmond, Calif.) and a solvent of 6.5 mM H2SO4 as previously

30
described (30). Total organic carbon was measured using a Model 5010
organic carbon analyzer (UIC Inc., Joliet, 111.).
2.3.c Growth medium and culture conditions.
Methanol/ PCE cultures were incubated in the growth medium
and under conditions described previously (23). Unless stated
otherwise, the basal medium contained (in g/1 final concentration):
NH4C1, 0.5; K2HPO4, 0.4; MgCl2-6H20, 0.1; CaCl2-2H20, 0.05;
resazurin, 0.001, and trace metal solution (27), modified by addition
of 0.01 g/1 NiCl3-6H20), 10 ml/1. The medium was purged with N2 and
dispensed inside an anaerobic chamber into 27 ml crimp-top tubes
(Bellco, Vineland, N.J.). The tubes were then sealed with aluminum-
crimp Teflon-coated butyl rubber stoppers (Wheaton, MilMlle, N.J.)
and autoclaved at 121°C for 55 min. The tube headspaces were
flushed with sterile 70%N2-30%CO2 (Matheson Gas Products, Inc.,
Secaucus, N.J.), and received the following sterile and anaerobic
additions before inoculation (final volume « 10 ml/tube): Na2S-9H20,
2 mM; NaHCOß, 12 mM; anaerobic digester sludge supernatant (SS),
25% v/v; yeast extract (YE), 0.2 g/1 or sodium acetate, 2 mM; and
vitamin solution (1) concentrated 10-fold, 0.5% v/v.
The anaerobic sewage digestor sludge for preparation of SS was
obtained from the Ithaca Area Wastewater Treatment Facility. Several
liters were collected at one time, to assure uniformity. The sludge was
initially clarified by centrifugation for 30 min. at 8,000 RPM (10,400 x
g) using a Sorvall RC-2B centrifuge (DuPont-Sorvall, Wilmington,
Del.). Samples were stored frozen at -20° C until use. Thawed samples
31
were centrifuged for 30 min. at 18,000 RPM (39,000 x g). The resulting
supernatant was neutralized to pH 7.0 using 1 M HC1, and then
prefiltered through a 0.8 urn Supor-800 membrane filter (Gelman
Sciences, Ann Arbor, Mich.). The SS was then purged with N2 and
filter-sterilized in an anaerobic chamber through a double 0.8/0.2 urn
Acrodisc PF filter (Gelman) into sterile vials. In some instances, the
SS was lyophilized in a Labconco LYPH-LOCK 4.5 liter Freeze Dry sys-
tem, model 77510 (Labconco Corporation, Kansas City, Mo.).
Unless otherwise stated, inoculum sizes were 2% v/v, all
incubations were done in duplicate, and each experiment presented
was performed at least twice with similar results. Duplicate tubes
performed very similarly in the experiments presented (less than 5%
difference in results for tubes under same conditions), so some results
are presented for individual tubes. Cultures that used H2 as e" donor
were incubated upside down in the dark in a R76 incubator-shaker
(New Brunswick Scientific, Edison, N.J.) operated at 35°C and 150
rpm. H2 was added to the headspace as over-pressure (0.67 atm, 67
kPa, or ca. 47.5 mmol/1) immediately after inoculation. NaHCC-3 was
added to neutralize the HC1 produced by the dechlorination process
(23). The quantity of PCE added to a culture was estimated directly
from the delivered syringe volume (6).
2.3.d Most probable number (MPN) determinations of the
methanol/PCE culture.
Three-tube MPN determinations were performed for a variety of
microbial groups present in the methanol/PCE culture. All tubes
32
contained the basal medium described above. A master set of
dilutions was made in 160 ml serum vials containing 45 ml of basal
medium, which was used for all subsequent dilutions. H2/C02-
utilizing methanogens and acetogens were enumerated using medium
to which H2 was added at 130 kPa (ca. 90 mmol/1) after inoculation.
Methanol-utilizing methanogens and acetogens were enumerated
using medium to which 24 mM methanol was added, while 40 mM Na
acetate was used for culturing acetate-utilizing methanogens.
Sulfidogens (e.g. sulfate reducers) were enumerated using medium
which received 5 mM Na acetate, 130 kPa H2, and 10 mM Na2S203,
which is used by more sulfidogens than sulfate (26). Fermentative
heterotrophs were enumerated in medium to which an additional 1
g/1 YE and 0.25 g/1 each of glucose, cellobiose, xylose, and sucrose
were added. Tubes were considered positive when greater turbidity was
observed than in control dilutions lacking these additions and when
the appropriate products (methane or acetate) were detected.
Methanol-utilizing PCE dechlorinators were enumerated in medium to
which 12 mM methanol was added together with the equivalent of 0.2
mmol/1 of PCE. Cultures were considered positive if they produced
greater than trace quantities of reduction products (generally, VC and
ETH were the only products detected). H2-utilizing PCE
dechlorinators were enumerated and assayed in a similar manner,
except that 130 kPa H2 replaced methanol as the e- donor.
2.3.e Microscopy.
A Zeiss Standard 18 microscope was used for phase-contrast ob

33
servation of cells and for epifluorescence microscopy to detect
organisms with characteristic cofactor F420 autofluorescence typical
of most methanogens as described previously (29). For
photomicroscopy, cells were spread out on an agar-coated slide and
were stained with 0.01% acridine orange. The cells were observed
using a Zeiss laser scanning microscope (model LSM-10) using either
phase-contrast or epifluorescent (488 run) imaging.
2.4. RESULTS.
2.4.a Viable counts of microbial populations in the
methanol/PCE culture (these studies were conducted by V. Tandoi).
The most probable number (MPN) technique was used to
estimate the numbers of members of various microbial groups in the
methanol/PCE culture (Table 2.1). Neither methanol- nor acetate-
utilizing methanogens were detected in the culture. A relatively low
number of H2/C02-utilizing methanogens were detected, and
microscopic examination of the highest positive dilution tubes
showed spirals with the distinctive morphology of Methanospirillum, a
methanogen capable of using either H2/CO2 or formate (1). High
numbers of methanol-utilizing acetogens were found. A preliminary
characterization of these chain-forming cocci indicated that they
stained Gram-positive, required SS for growth, could not use H2/CO2
for growth, and did not dechlorinate PCE using either methanol or H2
as the e- donor (24). The numbers of H2/C02-utilizing acetogens were

34
TABLE 2.1 Most probable number (MPN) determinations for various microbial populations in a methanol/PCE culture (these studies were conducted by V. Tandoi). The abbreviation "util." stands for "utilizing".
Organism type MPN (ml-l)
Time (wks) until highest
dilution was positive
Predominant morphology
in highest positive dilution
H2/C02-util. methanogens
2.3 x 10⁴ 5 Long spirals
Methanol-util. methanogens
<2.3 - -
Acetate-util. methanogens
<2.3 - -
H2/C02-util. acetogens
<2.3 x 10⁴ - -
Methanol-util. acetogens
9.3 x 10⁶ 2 Cocci in chains and doublets
H2-util. thiosulfate reducers
9.3 x 10⁵ 2 Small spirals
Fermentative heterotrophs
2.3 x 10⁷ 2 Various rods
Methanol-util. PCE dechlorinators
2.3 x 10³ 5
H2-UÜI. PCE dechlorinators
2.3 x 10⁶ 5 Small and large rods, irregular cocci and some small spirals

35
lower than those for methanogens. There were relatively high counts
of sulfidogens and the predominant morphotype in the highest
positive dilution tubes resembled desulfovibrios. The highest MPN
counts were for fermentative heterotrophs capable of growing in
medium containing YE and sugars.
In MPN dilution tubes receiving methanol and PCE, the highest
dilution which showed products of reductive dechlorination was 10-3,
in which VC was detected within 3 weeks. There was growth in the
methanol/PCE tubes out to 10"7 dilutions, and chain-forming cocci
similar to those seen in tubes receiving methanol without PCE were
found in these tubes.
In MPN dilution tubes receiving H2 and PCE, serial dilutions
became positive for VC production sequentially until, after 5 weeks of
incubation, two of three 10"6 tubes were positive for VC production,
with the third tube becoming positive approximately 1 week later.
Although analysis of PCE and its products was qualitative, VC was
the only daughter product initially detected in positive tubes until
PCE was depleted, at which time ETH was detected. Microscopic
examination of these cultures revealed small and large rods,
individual irregular cocci, and Desu(/bu£brio-like spirals. These 10-6
dilution tubes consumed several subsequent doses of PCE, and
transfers from these cultures were the source of the purified H2/PCE
cultures described in the rest of this communication.
2.4.b PCE utilization by the purified H2/PCE culture.
Fig. 2.2 shows that after the H2/PCE culture was transferred

36
3.0 i
0 25 50 75 100 125 150 175
Time (hour)
FIGURE 2.2 PCE dechlorination and product formation by the purified H2/PCE culture to which consecutively increasing PCE doses were added. The basal medium was amended with 25% (v/v) SS, a vitamin solution and 2 mM Na acetate {inoculum size was 2% (v/v)}.
37
into fresh medium, the rate of PCE utilization increased over time,
indicating growth of the PCE-dechlorinating organisms. The major
dechlorination products detected were VC and ETH, which were
produced nearly stoichiometrically from PCE. There was always some
loss of chloroethenes into or through the stoppers. Fig. 2.3 shows the
results of a set of controls performed for PCE, VC and ETH to
ascertain the extent of ethene loss into and/or through the stopper. It
was observed that the more chlorinated an ethene was, the greater the
proportion lost (results for cis-DCE and TCE are not shown).
As shown in Fig. 2.2, by day 6 the culture was able to consume
the equivalent of 1 mmol PCE added per liter of culture medium in 15
hours. Table 2.2 shows that cultures not provided with H2 did not
dechlorinate PCE and that methanol did not serve as an e" donor for
PCE dechlorination. In cultures provided with PCE, there was a
greater disappearance of H2 than in cultures lacking PCE or an
inoculum, and the net amount consumed, 4.7 mmol/1, was
approximately equal to the amount required to reduce 1.66 mmol of
PCE per liter to VC (4.9 mmol/1). Moreover, cultures provided with H2
or methanol in the presence or absence of PCE produced neither
methane (data not shown) nor acetate (Table 2.2), indicating the
complete absence of methanogens and acetogens, while in
dechlorinating cultures the initial acetate concentration decreased as
PCE was being consumed.
2.4.c Nutritional characterization of the H2/PCE culture.
The H2/PCE culture could be transferred indefinitely in medium

38
FIGURE 2.3 Loss of PCE, VC and ETH into and/or though the stopper. Results for PCE were averaged from three sets of duplicate tubes under the next conditions: i). Not inoculated tubes with all other amendments; ii). not inoculated tubes with all other amendments but the vitamin solution; iii). tubes inoculated and autoclaved (standard deviations were very small and have not been plotted for simplicity).

39
TABLE 2.2 Effect of e- donors on PCE dechlorination (mainly to VC and ETH) and acetogenesis by the purified H2/PCE culture.
Additions Products (mmol/l)a
on Day 14
H2 decrease (%)fa
on Day 14
Acetate (mM)c
Day 1 Day 14
H2 + PCE 1.66 10.1 1.97 1.60d
MeOH + PCE 0 NA* 1.94 2.03
No e- donor + PCE 0 NA 2.04 2.06
No e- donor (no PCE) NA NA 1.97 1.98
H2 (no PCE) NA 3.3 2.06 1.94
MeOH (no PCE) NA NA 1.97 1.97
H2 (no PCE; no inoc.) NA 3.2 2.07 2.06
a Values obtained from PCE dechlorination to almost completely ETH andVC. b Percentage obtained from the mean of duplicate tubes (sampling headspace). Standard deviations are 1.5 for the H2/PCE cultures; and 1.0 for the H2 (no PCE) and H2 (no PCE; no inoc.) cultures. c Mean concentration of duplicate tubes (sampling liquid phase). Standard deviations were 0.3 for the H2/PCE cultures and 0 to 0.1 for the rest of the cultures. d Value measured after 6 days, when 0.23 mmol/1 of products had been produced. e na = Not applicable.

40
containing 0.2 g/1 YE, 25% v/v SS, and a vitamin solution as
nutritional supplements. It was desirable to replace YE with nutrients
which would support less growth of contaminants while still
supporting PCE dechlorination.
Our initial studies showed that deleting YE from the growth
medium did not allow sustained PCE dechlorination (data not
shown). Since it was possible that YE or some product derived from it
was serving as a carbon source, we tested whether YE could be
replaced with acetate, a common carbon source used by many
anaerobes, but which is not utilizable as an energy source by most
anaerobes. Fig. 2.4 shows that acetate greatly stimulated
dechlorination by the H2/PCE culture when YE was not present.
Formation of dechlorination products (almost completely VC and
ETH) essentially stopped after day 5 in cultures grown without
acetate, while they continued to increase rapidly when 2 mM Na
acetate was present. Acetate concentrations of 10 mM were somewhat
inhibitory to PCE dechlorination (data not shown). Cultures could be
transferred indefinitely with 2 mM sodium acetate (replacing YE), 25%
v/v SS, and vitamins. The MPN of YE-utilizing fermentative
heterotrophs in this medium was 2.3 x 10⁶, a tenfold reduction
compared to cultures receiving YE, such as the methanol/PCE culture
(Table 2.1).
In testing dechlorinating activity under different combinations
of YE, SS and acetate, in the presence of vitamins adding acetate
alone essentially allowed no PCE dechlorination, while PCE
dechlorination occurred in the presence of both, acetate and SS,

41
3.0 I
2.5"
> 2.0- o 6
0.5 H
0.0
Acetate not added Acetate added
0 -D-
1 4 5 6
Time (day)
FIGURE 2.4 Product formation (predominantly VC and ETH) from PCE dechlorination by the purified H2/PCE culture in the presence or absence of 2 mM Na acetate. The basal medium was amended with 25% (v/v) SS and vitamins and the inoculum was 1% (v/v).

42
implying the requirement by the culture for the latter amendment
(data not shown). Even though cultures grown on YE+SS generated
more PCE products than cultures grown on acetate+SS, the latter
conditions gave a "cleaner" degradation process, in which less
intermediate products (TCE and DCEs) and more ETH were formed
(data not shown). Cultures grown on SS or YE only started
dechlorinating normally but, after the second dose of PCE, they
slowed down and accumulated intermediates, indicating limitation
(data not shown). This experiment reinforced the importance of both
acetate and SS in the nutrition of the culture. Uninoculated controls
with SS and/or vitamins did not dechlorinate PCE.
The potential requirements for vitamins and SS were also
examined for the H2/PCE culture. The experiment shown in Fig. 2.5
revealed that there was limitation of dechlorination in the cultures
not receiving vitamins when compared to cultures that received the
vitamin solution. After vitamins were added at day 16 (Fig. 2.5 b), the
culture dechlorinated PCE essentially as the positive control (Fig. 2.5
a). To identify which vitamins were required, an experiment was
performed in which one of the ten vitamins present in the standard
solution was deleted from each set of duplicate tubes (Fig. 2.6). It was
found that cultures with vitamin B12 deleted showed as poor
dechlorination as cultures receiving no vitamins, while deleting the
other vitamins had negligible effects in products formation (with the
exception of riboflavin, which showed an intermediate response). The
total rates of product formation were calculated over 18 to 26 days,
depending on the speed of the culture.
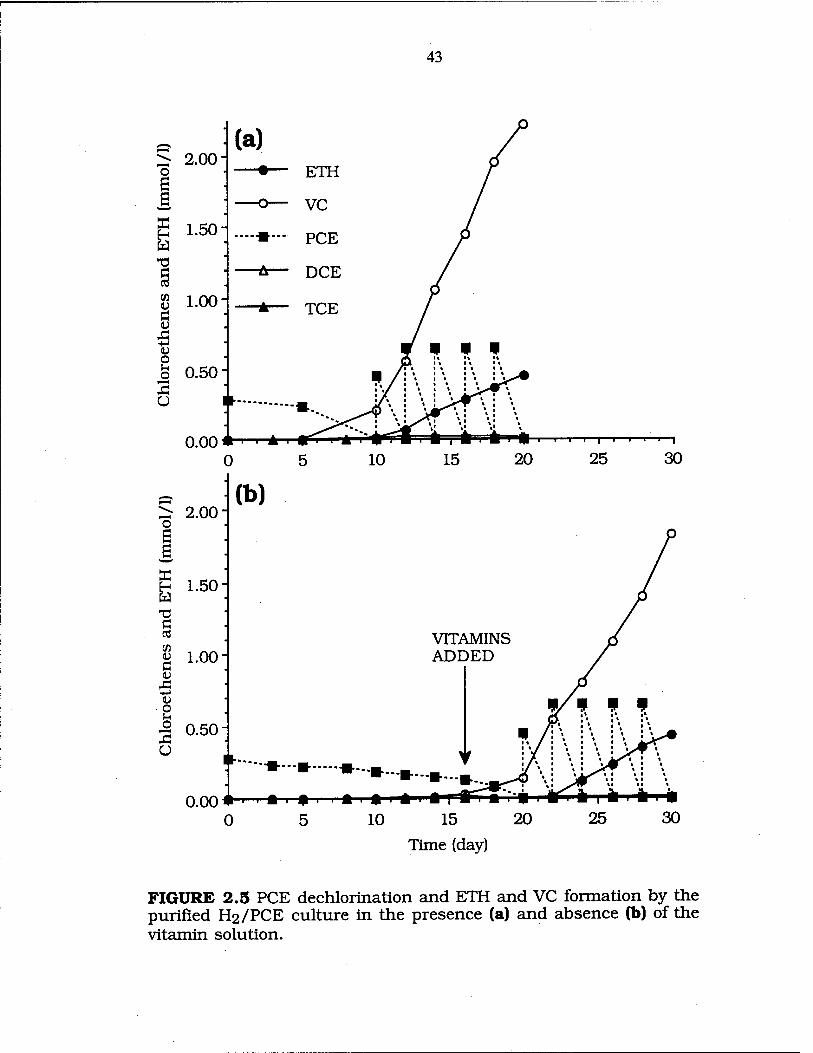
43
15
Time (day)
FIGURE 2.5 PCE dechlorination and ETH and VC formation by the purified H2/PCE culture in the presence (a) and absence (b) of the vitamin solution.

44
0.10
0.08-
•a 0.06"
+-> Ü 3
0.04-
0.02-
0.00 1 2 3 4 5 6 7 8 9 10 11 12 13 14
FIGURE 2.6 Product formation (TCE, DCEs, VC and ETH) by cultures incubated under different vitamin treatments: column 1(VIT)= vitamin solution present (positive control); 2 (-VTT)=vitamin solution absent (negative control); 3 (Bi2-SS)=cyanocobalamin present but without SS; 4 (Bi2 only)=only cyanocobalamin present; 5 (Bi2+VIT)=all vitamins present with a double amount of B12; 6 (-Bi2)=all vitamins present except B12; 7 (-BIO)=all vitamins present except biotin; 8 (- FOA)=all vitamins present except folic acid; 9 (-PYR)=all vitamins present except pyridoxine hydrochloride; 10 (-THI)=all vitamins present except thiamine hydrochloride; 11 (-RIB)=all vitamins present except riboflavin; 12 (-NIC)=all vitamins present except nicotinic acid; 13 (-PAN)=all vitamins present except calcium pantothenate; 14 (- AMI)=all vitamins present except p-aminobenzoic acid; and 15 (- LIP)=all vitamins present except lipoic acid.

45
The requirement for vitamin B12 was then examined more
closely. Fig. 2.7 shows the effect of adding various amounts of vitamin
B12 on product formation (mainly VC and ETH) by the culture after
11 days of incubation (no other vitamins were present). Increasing
amounts of vitamin B12 led to increasing product formation, although
the response was not linear. Saturation occurred near 0.05 mg/1
vitamin B12, at which concentration the cultures performed as well as
ones receiving all ten vitamins. In uninoculated cultures, vitamin B12
added to concentrations up to 5 mg/1 did not catalyze measurable
reductive dechlorination of PCE (data not shown).
Studies were also performed on the SS, which contained 75
mg/1 organic carbon and < 0.05 mM acetate or other volatile fatty
acids. As seen in Fig. 2.8, when SS was not added to the growth
medium, the culture did not consume the first dose of PCE within 14
days, suggesting nutrient limitation. Adding the lyophilized equivalent
of 5% v/v SS allowed the consumption of four increasing doses of
PCE, with little accumulation of ETH and meaningful accumulation
of DCEs and TCE between feedings (preliminary tests showed that
lyophilized SS performed as well as SS; data not shown). Adding the
equivalent of 25% v/v SS, the standard dose used in other
experiments, allowed the consumption of multiple and increasing
doses of PCE, although there were signs of limitation (residual TCE
and PCE) after the last dose. Addition of 50% v/v SS allowed the best
consumption of PCE, with the greatest ETH accumulation, while
cultures amended with 100% v/v SS did not perform as well, showing
a decrease in the rate of PCE degradation at the end of incubation.
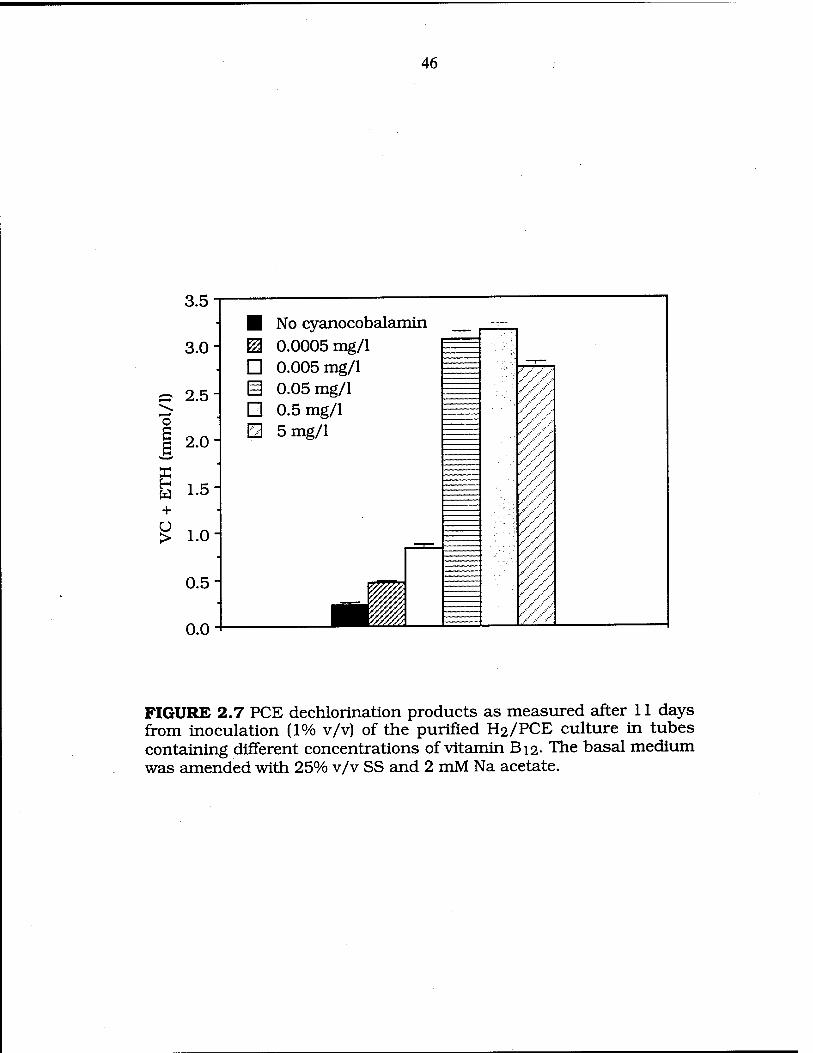
46
3.5
3.0-
« 2.5" —
I 2"0i
U 1-51
£ 1.0
0.5 H
0.0
■ No cyanocobalamin ffl 0.0005 mg/1 D 0.005 mg/1 B 0.05 mg/1 □ 0.5 mg/1 0 5 mg/1
FIGURE 2.7 PCE dechlorination products as measured after 11 days from inoculation (1% v/v) of the purified H2/PCE culture in tubes containing different concentrations of vitamin B12. The basal medium was amended with 25% v/v SS and 2 mM Na acetate.

47
» 6
i s in (U C <u
<u
u -1-1 cd Ö
"C o
Ü
5-
4"
3-
2"
1-
0
■ ETH
^ VC
□ DCE
EU TCE
0 25
SS added (%)
1 I 1 ■L 50
MJ 100
FIGURE 2.8 PCE dechlorination products as measured after 14 days from inoculation (2% v/v) of the purified H2/PCE culture. Tubes were amended with different percentages of lyophilized SS and were given new PCE doses as soon as PCE was consumed. The basal medium was amended with vitamins and 2 mM Na acetate.

48
2.4.d Microscopic observations of the methanol/PCE
culture and the purified H2/PCE culture.
In the purified H2/PCE culture grown in medium with acetate,
SS, and vitamins, the two major morphotypes were irregular cocci and
small rods (Fig. 2.9). Larger rods were also readily observed, but were
far less numerous than the previously mentioned morphotypes. The
irregular cocci were absent from cultures which did not show PCE
dechlorination (data not shown), suggesting their involvement in that
process, although more conclusive evidence is needed before ascribing
the process to any one organism.
2.5 DISCUSSION.
The results presented here are consistent with the primary
prediction of the model of DiStefano et oi. (5) that H2 (or possibly
formate) is the primary e- donor for reductive dechlorination in the
methanol/PCE culture (Fig. 2.1). Specifically, the prediction was
borne out that there should be relatively high numbers of methanol-
utilizing acetogens and H2 -utilizing PCE dechlorinators in the
culture. Indeed, when tested after several transfers, the H2/PCE
culture derived from a 10"6 dilution of the methanol/PCE culture was
no longer capable of using methanol as an e- donor for dechlorination
or for acetogenesis (Table 2.2). Presumably, the methanol-utilizing
acetogens were initially present in the 10'6 H2/PCE dilutions, since
they were present in the original methanol/PCE culture at numbers
exceeding 107/ml, but were lost after several transfers in medium
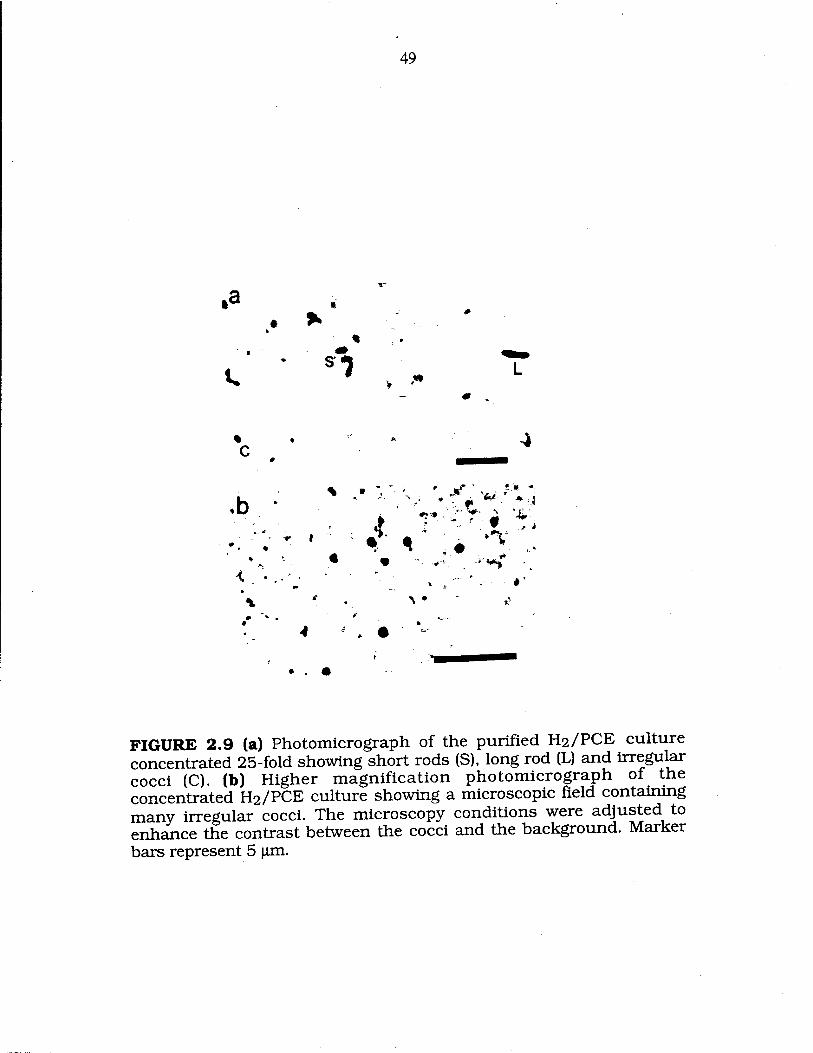
49
*a %
• • 4 c , w
♦b * • ■■'■ V •;: r '*** *^
* •
<. •. f» »--""'-' *
n. *r A • »v
4
FIGURE 2.9 (a) Photomicrograph of the purified H2/PCE culture concentrated 25-fold showing short rods (S), long rod (L) and irregular cocci (C). (b) Higher magnification photomicrograph of the concentrated H2/PCE culture showing a microscopic field containing many irregular cocci. The microscopy conditions were adjusted to enhance the contrast between the cocci and the background. Marker bars represent 5 |im.

50
lacking a substrate for their growth. Acetate, present at 2 mM, also
could not serve as an e" donor for dechlorination (Table 2.2).
The model also predicts low numbers of methanogens in the
methanol/PCE culture, and only a low number of H2/CO2 utilizing
methanogens were detected (Table 2.1). This is in contrast to earlier
studies on the methanol/PCE culture when the PCE dose was much
lower and the culture was actively methanogenic (9), in which we
found over 107/ml of a methanol-utilizing methanogen resembling
Methanosarcina (29). The absence of methanogens and acetogens in
the purified H2/PCE culture indicates that these organisms were not
primarily responsible for the high-rate PCE dechlorination in the
original methanol/PCE culture.
H2 was able to serve indefinitely as the e" donor for reductive
dechlorination of PCE to VC and ETH in cultures provided with
proper nutritional supplements, in agreement with previous results
(5). The degradation of PCE by the H2/PCE culture at an increasing
rate as well as our ability to transfer it indefinitely is indicative of
growth of the culture concurrent with the dechlorination process. H2
and PCE have been shown to serve as an e" donor/acceptor pair for
the growth of several cultures (11, 14, 16, 20, 22), but in those cases,
reductive dechlorination stopped at cis-DCE. No evidence was
obtained for DCE accumulation in this culture and neither of the two
dominant morphotypes in the purified H2/PCE culture, when
examined microscopically, resembled any of the species isolated so
far. It is then likely that a different organism is responsible for PCE
dechlorination in this culture.

51
That a 10"6 dilution of the methanol/PCE culture on H2/PCE
required thirty-five days (Table 2.1) to accomplish approximately 20
doublings (220 « 106) suggests a doubling time less than 2 days for the
H2/PCE culture, a doubling time consistent with the increasing rate
of metabolism in Fig. 2.2.
The purified H2/PCE culture was able to convert PCE to ETH,
although the ratio of ETH/VC produced from PCE was much lower
than that described for the methanol/PCE culture (6). This is at least
partially due to the feeding regime used for the H2/PCE culture in
these experiments, in which we provided a dose of PCE as soon as its
depletion was detected. Since PCE can inhibit VC dechlorination (23),
the cultures had little opportunity to accumulate ETH.
The purified H2/PCE culture could be transferred indefinitely in
growth medium supplemented with acetate, SS, and vitamins. The
acetate most likely serves as a carbon source for the culture, and as
such, supports considerably less growth of potential contaminants
than does YE. The optimal amount of SS required was 25-50% v/v. It
is not clear whether the SS directly provides nutrients required by
PCE dechlorinators, or whether products of metabolism of SS
components by other organisms are required. The SS contributed less
than 20 mg/1 of carbon to the culture when added at 25% v/v, and
since some portion of it is not readily catabolizable, it should support
only a low number of contaminants. The amount of acetate provided
by 25% v/v SS, < 0.05 mM, was too low to support growth of the
dechlorinators.

52
The vitamin requirement for PCE dechlorination could be met
by adding vitamin B12 alone, but since we also needed to add SS in
these experiments, it is possible that the SS was providing sufficient
quantities of other required vitamins. The vitamin B12 requirement is
intriguing because it, and other corrinoid compounds, have been
shown to carry out reductive dechlorination in vitro of chloro-organics,
including chloroethenes (10, 15, 19). We verified that no reductive
dechlorination of PCE occurred in uninoculated media supplemented
with vitamin B12. Still, the requirement for vitamin B12 suggests a
role in dechlorination in this organism, perhaps as a prosthetic group
of a dechlorinating enzyme. The amount required, between 0.005
mg/L and 0.05 mg/L, is considerably greater than the amount (0.001
mg/L) typically supplied to organisms which use vitamin B12 for
anabolic reactions (2). The vitamin B12 requirement may explain why
methanol was the e" donor which led to the best sustained
dechlorination in the early studies on this culture (6, 9). Those
cultures were amended with YE, which lacks vitamin B12 (2).
However, methylotrophic methanogens (3) and acetogens (17) growing
on methanol are rich in cobamides, which could be cross-fed to the
dechlorinating organisms by lysis and possibly excretion. For
example, a Methanosarcina culture, grown on acetate, supported
growth of a vitamin Bi2-requiring contaminant (25).
These results show that like many other anaerobes, the PCE
dechlorinator/s in this culture are dependent on other organisms for
several of their nutritional requirements. Knowledge of some of these
requirements has allowed us to simplify the culture medium we use

53
for them, and it is hoped that further knowledge of these
requirements will lead to the isolation of PCE-dechlorinator/s.
Knowledge of the nutrition of PCE-dechlorinator/s can also have
practical significance. Fennell and Gossett (7) have found in
bioreactor studies that the methanol/PCE culture could be switched
to butyrate as an e- donor, but only when vitamins, including vitamin
B12, were added. Thus, addition of a simple vitamin solution has
allowed a greater flexibility in e" donor use by a PCE-dechlorinating
mixed culture.

54
REFERENCES
1. Balch, W. E., G. E. Fox, L. J. Magrum, C. R. Woese, and R. S. Wolfe. 1979. Methanogens: Reevaluation of a unique biological group. Microbiol. Rev. 43: 260-296.
2. Cote, R. J., and R. L. Gherna. 1994. Nutrition and media., p. 155- 178. In Gerhardt, P. (ed.), Methods for general and molecular bacteriology. American Society for Microbiology, Washington DC.
3. DiMarco, A. A., T. A. Bobik, and R. S. Wolfe. 1990. Unusual coenzymes of methanogenesis. Ann. Rev. Biochem. 59: 355-394.
4. DiStefano, T. D. 1992. Biological dechlorination of tetrachloroethene under anaerobic conditions. Ph.D. Thesis, Cornell University, Ithaca, NY.
5. DiStefano, T. D., J. M. Gossett, and S. H. Zinder. 1992. Hydrogen as an electron donor for the dechlorination of tetrachloroethene by an anaerobic mixed culture. Appl. Environ. Microbiol. 58: 3622-3629.
6. DiStefano, T. D., J. M. Gossett, and S. H. Zinder. 1991. Reductive dechlorination of high concentrations of tetrachloroethene to ethene by an anaerobic enrichment culture in the absence of methanogenesis. Appl. Environ. Microbiol. 57: 2287-2292.
7. Fennell, D., and J. M. Gossett. Unpublished results.
8. Freedman, D. L. Biodegradation of dichloromethane, trichloroethylene, and tetrachloroethylene under methanogenic conditions. 1990.
9. Freedman, D. L., and J. M. Gossett. 1989. Biological reductive dechlorination of tetrachloroethylene and trichloroethylene to ethylene under methanogenic conditions. Appl. Environ. Microbiol. 55: 2144-2151.
lO.Gantzer, C. J., and L. P. Wackett. 1991. Reductive dechlorination catalyzed by bacterial transition-metal coenzymes. Environ. Sei. Technol. 25: 715-722.
ll.Gerritse, J., V. Renard, T. M. Pedro-Gomes, P. A. Lawson, M. D. Collins, and J. C. Gottschal. 1996. Desulfitobacterium sp. strain PCE1, an anaerobic bacterium that can grow by reductive

55
dechlorination of tetrachloroethene or ortho-chlorinated phenols. Arch. Microbiol. 165: 132-140.
12.Gibson, S. A., and G. W. Sewell. 1992. Stimulation of reductive dechlorination of tetrachloroethene in anaerobic aquifer microcosms by addition of short-chain organic acids or alcohols. Appl. Environ. Microbiol. 58: 1392-1393.
13.Gossett, J. M. 1987. Measurement of Henry's Law constants for Cj and C2 chlorinated hydrocarbons. Environ. Sei. Technol. 21: 202-208.
14.Holliger. C, G. Schraa, A. J. M. Stams, and A. J. B. Zehnder 1993. A highly purified enrichment culture couples the reductive dechlorination of tetrachloroethene to growth. Appl. Environ. Microbiol. 59: 2991-2997.
15.Jablonski, P. E., and J. G. Ferry. 1992. Reductive dechlorination of trichloroethylene by CO-reduced CO dehydrogenase enzyme complex from Methanosarcina thermophila. FEMS Microbiol. Lett. 96: 55-60.
16.Krumholz, L. R., R. Sharp, and S. S. Fishbain. 1996. A freshwater anaerobe coupling acetate oxidation to tetrachloroethylene dehalogenation. Appl. Environ. Microbiol. 62: 4108-4113.
17Ljungdahl, L. G. 1986. The autotrophic pathway of acetate synthesis in acetogenic bacteria. Ann. Rev. Microbiol. 40: 415-450.
lS.Lobo, A. L., and S. H. Zinder. 1988. Diazotrophy and nitrogenase activity in the archaebacterium Methanosarcina barkeri 227. Appl. Environ. Microbiol. 54: 1656-1661.
19.Neumann, A., H. Scholz-Muramatsu, and G. Diekert. 1994. Tetrachloroethene metabolism of Dehalospirtilum multivorans. Arch Microbiol. 162: 295-301.
20.Scholz-Muramatsu, H., A. Neumann, M. Messmer, E. Moore, and G. Diekert. 1995. Isolation and characterization of Dehalospirillum multivorans gen nov, sp nov, a tetrachloroethene- utilizing, strictly anaerobic bacterium. Arch. Microbiol. 163: 48- 56.
21.Sewell, G. W., and S. A. Gibson. 1991. Stimulation of the reductive dechlorination of tetrachloroethene in anaerobic aquifer microcosms by the addition of toluene. Envir. Sei. Technol. 25: 982-984.
56
22.Sharma, P. K., and P. L. McCarty. 1996. Isolation and characterization of a facultatively aerobic bacterium that reductively dehalogenates tetrachloroethene to eis-1,2- dichloroethene. Appl. Environ. Microbiol. 62: 761-765.
23Tandoi, V., T. D. DiStefano, P. A. Bowser, J. M. Gossett, and S. H. Zinder. 1994. Reductive dehalogenation of chlorinated ethenes and halogenated ethanes by a high-rate anaerobic enrichment culture. Environ. Sei. Technol. 28: 973-979.
24.Tandoi, V., and S. H. Zinder. Unpublished results.
25.Ward, D. M., R. A. Mah, and I. R. Kaplan. 1978. Methanogenesis from acetate: a nonmethanogenic bacterium from an anaerobic acetate enrichment. Appl. Environ. Microbiol. 35: 1185-1192.
26.Widdel, F. 1988. Microbiology and ecology of sulfate- and sulfur- reducing bacteria, p. 469-586. In Zehnder, A. J. B. (ed.), Biology of anaerobic microorganisms. Wiley Interscience, New York.
27.Zeikus, J. G. 1977. The biology of methanogenic bacteria. Bacteriological Reviews. 41: 514-541.
28.Zinder, S. H., and T. Anguish. 1992. Carbon monoxide, hydrogen, and formate metabolism during methanogenesis from acetate by thermophilic cultures of Methanosarcina and Methanothrix. Appl. Environ. Microbiol. 58: 3323-3329.
29.Zinder, S. H., T. DiStefano, J. Gossett, Y.-L. Juang, R. Vazoller, and T. Anguish. 1991. Preliminary microbiological characterization of an anaerobic enrichment culture which converts tetrachloroethylene to ethylene. abstr. Q-114, p. 295, Abst. 91st Annu. Meet. Am. Soc. Microbiol. 1991.
30.Zinder, S. H., and M. Koch. 1984. Non-aceticlastic methanogenesis from acetate: acetate oxidation by a thermophilic syntrophic coculture. Arch. Microbiol. 138: 263-272.

CHAPTER THREE
ISOLATION AND CHARACTERIZATION OF A NOVEL EUBACTERIUM CAPABLE OF
REDUCTIVELY DECHLORINATING PCE TO ETH
"It has long been an axiom of mine that the little things are infinitely the most important'
Sir Arthur Conan Doyle, 1859-1930 Adventures of Sherlock Holmes (1892) 'Case of identity'"
3.1 ABSTRACT.
The isolation of a pure culture which dechlorinates PCE
completely to the non-toxic product ETH, called Strain 195, is
described in this chapter. Isolation entailed using the antibiotic
ampicillin, to which the dechlorinator was resistant, and
supplementing the growth medium with extracts from mixed cultures.
Growth was demonstrated in medium with H2 and PCE as an electron
donor/ acceptor pair. Other electron donors tested were not utilized
nor were electron acceptors other than chloroethenes and two
dihaloethanes. Strain 195 is an irregular coccus. Its cell wall did not
react with a peptidoglycan-staining fluorescent lectin and resembles
protein S-layers of Archaea. Phylogenetic analysis of Strain 195's 16S
rDNA sequence indicates that it is a eubacterium which shows no
close affinity to known eubacterial groups. These findings
significantly increase our knowledge of the diversity of organisms
capable of reductive dechlorination, knowledge crucial to
57

58
understanding and manipulating the in situ dechlorination of
chloroethenes.
3.2 INTRODUCTION.
As it has been shown in Chapter Two, under anaerobic
conditions, both PCE and TCE can be reductively dechlorinated by
mixed microbial populations (1, 10, 13, 33) and pure cultures (14, 19,
22, 26, 27) according to the reaction sequence shown in Figure 1.1.
Even though the isolation of these pure cultures is relevant, up to
this point there has not been any report of a microorganism that, by
itself, is able to completely dechlorinate PCE to ETH (or to VC, the
last intermediate in the reduction pathway). All axenic cultures
known to date which use PCE as a respiratory electron (e") acceptor
do so by effecting its partial reduction to cis-DCE without further
dechlorination.
Even though the potential for complete anaerobic detoxification
of chloroethenes exists, there needs to be a greater understanding of
the organisms and factors involved in this reductive process. An
isolate that was capable of completely dechlorinating a PCE molecule
would be of great interest, not only because of its potential direct
application to the bioremediation of contaminated sites (in situ or in
above-ground facilities), but also because it could be utilized as a
model for the study in depth of the dechlorination pathway, both at
the biochemical and molecular levels.
We have studied a set of enrichment cultures which, using
59
methanol, H2, or butyrate as an e" donor, can dechlorinate doses of
PCE of up to 550 nmol added per liter to ETH within 4 days (8, 9, 12,
30). As detailed in Chapter Two of this dissertation, a culture was
derived from a 10"6 dilution of a methanol/PCE culture inoculated
into medium with H2/PCE (24). This partially-purified culture
contained no methanogens or acetogens, and could be transferred
indefinitely into H2/PCE medium supplemented with a mixture
(called ABSS) of 2 mM acetate, 0.05 mg/1 vitamin B12, and 25% v/v
anaerobic digestor sludge supernatant (SS). These cultures could not
be transferred if either H2 or PCE was omitted, and the amounts of
H2 consumed were stoichiometric to PCE reductive dechlorination.
This culture contained two main morphotypes: a pleomorphically
shaped cell and a short rod. In this chapter, the isolation and initial
characterization of Strain 195, a novel bacterium able to completely
dechlorinate PCE to ETH, is described.
3.3 MATERIALS AND METHODS.
3.3.a Chemicals and analyses of chloroethenes.
PCE and its chlorinated derivatives, ETH, H2, and all other
chemicals were purchased and utilized as described in point 2.3.a of
the previous chapter.
For quantitative analysis of chloroethenes and ETH, gas
samples were analyzed using a Model 8610 GC (SRI Instruments. Las
Vegas, Nev.) equipped with flame ionization detector. The GC
60
contained a 2 m x 3 mm stainless steel column packed with 60/80
mesh Carbopak B/1% SP-1000 (Supelco, Bellefonte, Penn.) and it was
operated isothermally at 200° C. Peak areas were calculated using the
Peaksimple 2 software supplied with the GC, and were compared to
standard curves for chloroethenes (16).
Gas samples utilized for the growth experiments were analyzed
using a temperature programmed Perkin Elmer GC 8500 equipped
with an FID detector. The GC contained a 60m x 0.53 mm RTX-502.2
capillary column operated in splitless injection mode (3 (J.m film
thickness) (Restek Corp., Bellefonte, PA). The carrier gas utilized was
helium at a flow of 80 cm/s. Peak areas were calculated using the
software supplied with the GC, and were compared to standard curves
for chloroethenes (16). Headspace samples were 100-JJ.I in all cases.
3.3.b Analysis of 16S rDNA.
The phylogenetic tree generated for the 16S rDNA sequence from
Strain 195 was done by using the SUGGEST TREE maximum
likelihood program provided by the Ribosome Database Project (RDP)
(23) which places the organism on a customized phylogenetic tree.
DNA was extracted from cells of Strain 195 using a microwave oven-
detergent method (15). The sequence was amplified as a polymerase
chain reaction product using the primers 27f and 1522r under
standard conditions (20) followed by cloning using the Invitrogen (San
Diego, CA) TA cloning kit, and sequencing using an ABI 373 analyzer
operated by the Cornell Biotechnology Institute. Eight sequencing
primers were used (20), including two against the vector, resulting in

61
only a single ambiguous base in the entire sequence. Other analyses
of these sequences were performed by manually aligning Strain 195's
sequence to other pre-aligned sequences from the RDP, followed by
using the PHYLIP 3.5c package (11), including DNAML (maximum
likelihood analysis), and DNADIST (Kimura model) coupled to either
FITCH or NEIGHBOR.
3.3.c Growth medium, and culture conditions.
The protocol followed to produce the basal medium, previous to
the addition of the amendments, was followed as described in Chapter
Two, and was utilized for both the partially-purified H2/PCE culture
and Strain 195. The basal medium received the following sterile and
anaerobic additions before inoculation (final medium volume «10
ml/tube): Na2S-9H20, 2 mM (added last); NaHC03, 12 mM (added
first); and the ABSS amendments {SS (prepared as described in
Chapter Two), 25% v/v; sodium acetate, 2 mM; and vitamin solution
(2) concentrated 10-fold, 0.5% v/v}.
The antibiotics ampicillin, vancomycin and tetracycline were
prepared by dissolving them in Milli-Q water and purging the
solutions with N2 for 10 min. The small vials were then sealed with
aluminum-crimp Teflon-coated butyl rubber stoppers (Wheaton,
Millville, N.J.) and filter-sterilized in an anaerobic chamber through a
double 0.8/0.2 |im Acrodisc PF filter (Gelman) into sterile vials. After
being at 4°C for about 4 weeks, new solutions were made to replace
the old ones.
In the growth experiment, protein was quantified utilizing the
62
NanoOrange Protein Quantitation Kit (N-6666) (Molecular Probes
Inc., Eugene, OR). The reagent is highly sensitive and has a range of
protein detection from 10 ng/ml to 10 ng/ml. Samples were added to
the diluted NanoOrange reagent and heated at 95°C for 10 min. After
cooling the mixtures to room temperature, their fluorescence
emissions were measured directly in a fluorometer at an excitation of
485 ran and an emission of 590 ran.
Inoculum sizes were 2% v/v, all incubations were done in
duplicate, and each experiment presented was performed at least twice
with similar results. Duplicate tubes performed very similarly in the
experiments presented (less than 5% difference in results for tubes
under same conditions), so the results for some of the experiments
are presented for individual tubes. Cultures were incubated and H2
and NaHC03 were added as described in Chapter Two.
To prepare the mixed culture (H2/PCE culture) pellet extract,
grown mixed cultures were centrifuged for 20 min. at 17000 rpm.
Pellets were resuspended with distilled water (lOx concentration) and
sonicated for 10 min. with a Branson Sonifier Cell Disruptor 200
(Branson Power Corp., IN) (output microtip at level 5, pulsed at 50%
duty cycle). Sonicated cells were purged with N2 for 10 min. and filter
sterilized, in the anaerobic glove box, with an Acrodisc 0.8-0.2 |im
diameter filter into an autoclaved vial with a N2/CO2 atmosphere.
HCO3- and Na2S were then added to buffer the medium and keep it
anaerobic before placing it at 4°C. All steps previous to the purging
with N2 were performed aerobically.
To prepare the butyrate/PCE culture extract, cultures (12) were

/■ 63
centrifuged for 20 min. at 11000 rpm. Pellets were resuspended with
distilled water (50x concentration) and frozen at -20°C until further
use. After thawing at room temperature, solutions were passed
through a French pressure cell at 20,000 lb/in2 and centrifuged at
17,000 rpm (34,800g) for 20 min. The pellet was discarded and the
supernatant was then purged with N2 for 10 min. and filter sterilized
inside the anaerobic globe box with an Acrodisc 0.8-0.2 pm diameter
filter into an autoclaved vial with a N2/CO2 atmosphere. HCO3- and
Na2S were then added to buffer the medium and keep it anaerobic
before being frozen at -20°C until further use. After thawing, the
extract was kept at 4°C. All steps previous to the purging with N2 were
performed aerobically.
3.3.d Microscopy.
A Zeiss Standard 18 microscope was used for phase-contrast
observation of cells. Cells were counted in a Petroff Hausser counting
chamber using an epifluorescence Zeiss Universal microscope after
staining with a final acridine orange concentration of 4 mg/1.
Analysis of peptidoglycan in cell wall structures and whole cells
was performed by lysing the cells in boiling 4% SDS in 25 mM
phosphate buffer pH (29), followed by heat fixation to a microscope
slide and washing with 25 mM phosphate buffer pH 7.0 to remove
SDS and other chemicals before staining. Preparations were then
stained with 100 mg/1 fluorescein-labeled wheat germ agglutinin
(Molecular Probes Inc., Eugene, OR) (28). The stained cell
preparations were observed using a Zeiss laser scanning microscope

/ 64
(model LSM-10) using either phase-contrast or epifluorescent (488
nm) imaging.
Transmission electron microscopic (TEM) studies of Strain 195
were performed on a Phillips EM-201 transmission electron
microscope operating at an accelerating potential of 80 kV. The
protocol followed is detailed below and it was compiled from (4, 34)
and modified according to the characteristics of Strain 195: The
culture was sampled at the end of its exponential phase and
centrifuged at 9000 rpm x 15 min. The pellet was resuspended in a
cold freshly made solution containing: 5 ml basal salts medium; 5 ml
0.1 M Na cacodylate (0.05 M final concentration); and 2.5 ml 10%
glutaraldehyde (2% final concentration). The mixture was fixed for 2
hours at room temperature and centrifuged (9000 rpm x 10 min). The
fixed pellet was washed (30 min., 3 times) by resuspension in 1.5 ml
Na cacodylate buffer and centrifuged again (9000 rpm x 10 min). The
pellet was resuspended in 1% osmium tetroxide (OSO4, in Na
cacodylate buffer) for 1 h. at room temperature, centrifuged (9000 rpm
x 10 min) and washed (20 min., 2 times) in Na cacodylate buffer. After
a wash in basal salts medium, it was centrifuged again (9000 rpm x
10 min). One drop of 2% Noble agar (made with basal salts medium)
was added to the pellet and mixed quickly. Once solidified, the agar
block was cut into 1 mm cubes, which were suspended in 0.5%
filtered aqueous uranyl acetate (0.01 g/2 ml) for 20 min. at 4°C. The
agar blocks were then placed in 10% ethanol for 15 min. The fluid was
replaced with 25% ethanol, then with 50% ethanol, 75% ethanol,
90% ethanol, twice, 100% ethanol, and finally with 1 ml fresh 100%
65 /■
ethanol, twice, all for 15 min. One ml of Araldite-Embed 812 medium
(without accelerator) was added and the solution mixed gently for 30
min. Another ml was added and the process repeated. Then the
mixture was replaced with 2 ml of Araldite-Embed 812 medium
(without accelerator) and mixed gently for 2 h. The mixture was
replaced with 2 ml of Araldite-Embed 812 medium (with accelerator,
2% DMP 30) and again mixed gently for 4 h. Agar cubes were placed
into the embedding molds with complete Araldite-Embed 812 medium
and incubated at 70°C for 16 h. and at room temperature.
3.4 RESULTS.
3.4.a Isolation of Strain 195.
Several attempts performed to isolate the PCE-dechlorinator by
dilution into liquid medium or using agar roll tubes were not
successful. A promising finding was the production of PCE
degradation products in initial lower dilutions in roll tubes (Fig. 3.1).
Later on, 10"5 dilutions produced small amounts of VC. Production of
chlorinated derivates eventually faded away, at a time when there
were still numerous microcolonies of contaminating heterotrophs
which could be seen by a dissecting microscope. Colonies of the
dechlorinating organism were too small to be identified, and there
was no success in obtaining PCE dehlorination in a dilution high
enough to prevent the growth of heterotrophic contaminants.
To isolate the PCE-dechlorinator, a previous observation that

66
P 0.8-
g
in <u C <U
2 o 2 o
15 20
Time (days)
FIGURE 3.1 Conversion of PCE to less chlorinated ethenes by a purified H2/PCE culture incubated in an agar roll tube. The tube received the equivalent of 10 \i\ inoculum.

/ 67
PCE dechlorination using H2 as the e- donor was resistant to 100
mg/1 vancomycin (8) (an inhibitor of eubacterial peptidoglycan cell-
wall synthesis) was examined more thoroughly. It was found that the
partially-purified H2/PCE culture could be successfully transferred
(2% v/v inoculum) to medium containing 100 mg/1 vancomycin, up to
3 g/1 ampicillin or penicillin (also peptidoglycan synthesis inhibitors)
(data not shown). No PCE dechlorination was detected in cultures
transferred to medium containing 20 mg/1 tetracycline (a eubacterial
protein synthesis inhibitor). Fig. 3.2 shows the product formation
from PCE by cultures in medium containing ampicillin, vancomycin
or tetracycline. In cultures that grew, only the coccoid morphotype
was present at day 9 under the phase contrast microscope.
Ampicillin- or vancomycin-treated cultures could not be
transferred a second time into antibiotic-containing medium. Based
on previous results (8), it was suspected that other organisms in the
culture were providing a nutrient(s) required by the PCE-dechlorinator
and not present in ABSS. Reasoning that either the growth medium
(supernatant fraction after centrifugation) or the cells (pellet fraction)
in a mixed culture uninhibited by ampicillin would contain the
needed factors, the ABSS medium of second-generation ampicillin-
treated cultures was amended with either the filter-sterilized
supernatant fraction of mixed cultures or with filter sterilized
extracts formed by sonicating the pellet fraction (Table 3.1). Cultures
amended with the supernatant fraction showed stimulation of
dechlorination and the pellet fraction extract was even more
stimulatory. A further transfer of the supernatant-amended culture

68
2.5 1
360 mg/ml ampicillin 1,500 mg/1 ampicillin 100 mg/1 vancomycin
20 mg/1 tetracycline
8 10 12 14
Time (day)
T ■—i—
16 18 —r-
20 —i
22
FIGURE 3.2 Product formation (accounted by VC and ETH) from PCE by cultures exposed for the first time to the antibiotics ampicillin, vancomycin and tetracycline.
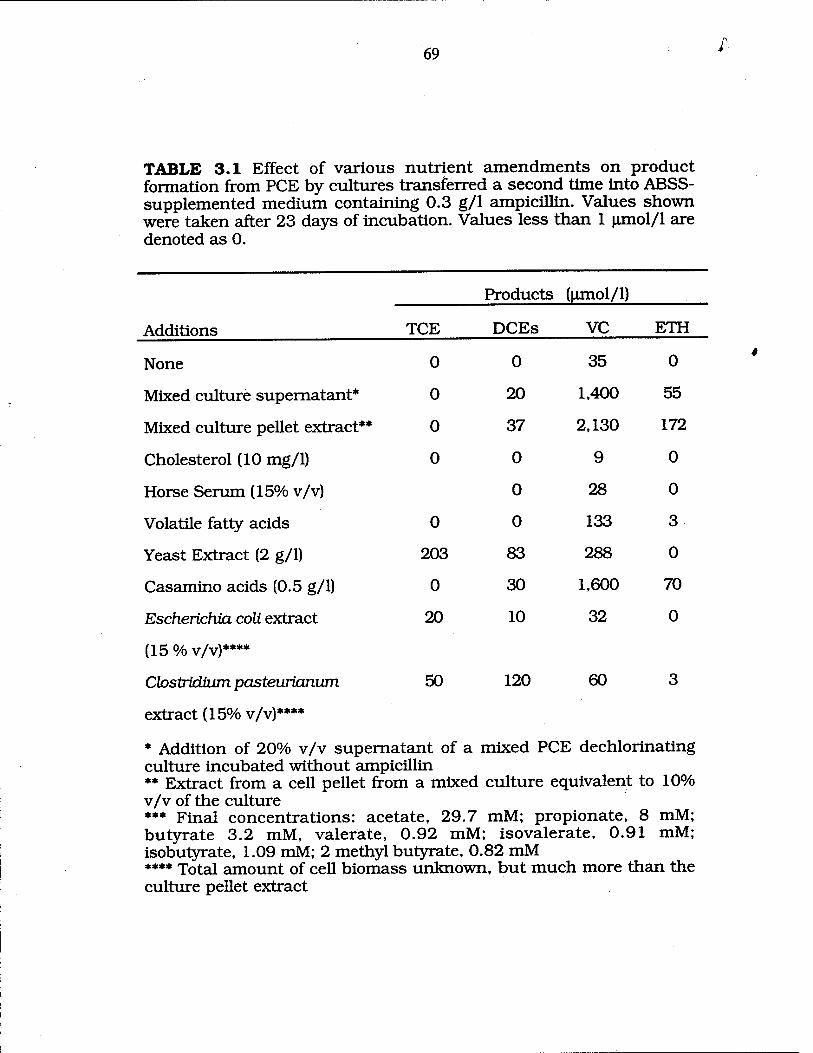
69 '
TABLE 3.1 Effect of various nutrient amendments on product formation from PCE by cultures transferred a second time into ABSS- supplemented medium containing 0.3 g/1 ampicillin. Values shown were taken after 23 days of incubation. Values less than 1 |jmol/l are denoted as 0.
Products (p.mol/1)
Additions TCE DCEs VC ETH
None 0 0 35 0
Mixed culture supernatant* 0 20 1,400 55
Mixed culture pellet extract** 0 37 2,130 172
Cholesterol (10 mg/1) 0 0 9 0
Horse Serum (15% v/v) 0 28 0
Volatile fatty acids 0 0 133 3
Yeast Extract (2 g/1) 203 83 288 0
Casamino acids (0.5 g/1) 0 30 1,600 70
Escherichia coli extract 20 10 32 0
(15% v/v)****
Clostridvurn pasteurianum 50 120 60 3
extract (15% v/v)****
* Addition of 20% v/v supernatant of a mixed PCE dechlorinating culture incubated without ampicillin ** Extract from a cell pellet from a mixed culture equivalent to 10% v/v of the culture *** Final concentrations: acetate, 29.7 mM; propionate, 8 mM; butyrate 3.2 mM, valerate, 0.92 mM; isovalerate, 0.91 mM; isoburyrate, 1.09 mM; 2 methyl butyrate, 0.82 mM **** Total amount of cell biomass unknown, but much more than the culture pellet extract

70
into similar medium did not dechlorinate PCE, while the cultures
amended with the pellet extract could be transferred indefinitely.
These results indicate that one or more cell components of
contaminating organisms were responsible for the stimulation.
Other potential nutrient amendments were also examined
(Table 3.1). No stimulation of dechlorination occurred from addition
of cholesterol and horse serum, two nutrients known to stimulate
mycoplasmas, a group of eubacteria lacking cell walls. A mixture of
volatile fatty acids (VTA) often used to stimulate the growth of certain
anaerobes gave only slight stimulation of dechlorination, as did yeast
extract. Casamino acids (Difco Laboratories, Detroit, MI) produced a
notable stimulation, similar to that produced by the supernatant
fraction of mixed cultures. Nevertheless, subsequent transfers of
cultures amended with VFA, yeast extract or Casamino acids were not
successful (data not presented). Significant stimulation was not
detected from cell extracts of the Gram-negative aerobic eubacterium
Escherichia coli or the Gram-positive anaerobic eubacterium
Clostridium pasteurianum strain W5, indicating that the growth
factor(s) is not ubiquitous in bacteria. Other amendments tested that
are not shown in Table 3.1 and which did not sustain dechlorination
were: Calf serum (6.85 mg/ml, CS); phosphatidyl choline (0.5 mg/ml,
PC); Tween 80 (with albumin;, 0.1 mg/ml); LPS (0.25 mg/ml
lipopolysaccharide) from E. coll Also, the following next combinations
of amendments did not sustain dechlorination: Tween 80 (with
albumin)+PC; Tween 80 (with albumin)+VFA; cholesterol+LPS;
YE+horse serum; YE+horse serum+Casamino acids+VFA.

/ 71
Using a growth medium supplemented with filter-sterilized
extract from mixed H2/PCE cultures and ABSS(24), the PCE-
dechlorinating organism (called Strain 195) was isolated by 107-fold
dilution to liquid H2/PCE medium containing 0.3 g/1 ampicillin.
These cultures, when transferred several times in the absence of
ampicillin, showed no morphotypes other than irregular cocci
detectable by phase-contrast and electron microscopy. No visible
growth was detected in tests for contamination (sensitivity near 10
organisms/ml) using our basal growth medium amended with lactate,
sulfate, and thiosulfate to detect sulfate reducers, amended with 0.2
g/1 yeast extract to detect fermentative heterotrophs, or using
Brewer's thioglycollate medium (Difco) to detect fermentative
heterotrophs.
3.4.b Examination of requirements of Strain 195 for
nutrients from mixed cultures.
Shortly after isolation, the extract from mixed H2/PCE cultures
was substituted by a more powerful extract derived from a culture
which grew on butyrate as the e- donor. This butyrate/PCE culture
was derived from the original methanol/PCE culture (12) and was
more diverse and had a higher cell density than the extract from the
H2/PCE culture (data not shown). As it can be seen in Fig. 3.3, both
extracts (50x, 2.5% v/v) produced from enrichments grown on
methanol or butyrate were able to sustain PCE dechlorination and
could substitute for the extract from H2/PCE cultures. In both cases,
intermediate products (TCE and DCEs) were produced during each

72 /
2.5"
2.0"
"o
S i.5 i
1 -a 1.01
2 0.5-
0.0
Butyrate/PCE culture extract ■•— Methanol/PCE culture extract -*— No extract added
0
FIGURE 3.3 VC and ETH formation by cultures grown in the presence of ampicillin, amended with ABSS and either extract from a buryrate/PCE or a methanol/PCE culture, or not amended with any cell extract.

73
PCE feeding, which were dechlorinated to VC and ETH as PCE
diminished (data not shown). Because of the availability of the
butyrate/PCE culture, its extract Was utilized as an amendment
instead of the one from the methanol/PCE culture.
To test the optimal amount of butyrate/PCE culture extract
required by Strain 195, several percentages (v/v) of 50x concentrated
extract were amended to the culture (Fig. 3.4). The addition of 10%
v/v butyrate/PCE culture extract produced the best PCE
dechlorination by Strain 195. Cultures amended with less than 2.5%
v/v dechlorinated PCE very slowly. Due to the difficulty of producing
large amounts of the extract, it was decided to amend the cultures
with 5% v/v butyrate/PCE culture extract from this point on. Six
months after butyrate/PCE culture extract was used by the cultures
for the first time, Strain 195's ability to dechlorinate had PCE
increased considerably under the same conditions (Fig. 3.5). It should
be noticed that the high amount of VC produced (up to 5.1 mmol/1
VC) did not seem to affect the ability of the culture to dechlorinate
PCE. The amount of stimulation of PCE dechlorination present in the
fraction of the butyrate/PCE culture utilized so far (supernatant
fraction of the extract; see Materials and Methods) was compared to
the particulate fraction (pellet obtained after last centifugation) (Fig.
3.6). Over time, clearly the major part of the activity was present in
the supernatant extract of the butyrate/PCE culture. Because French
pressing the cells seemed to keep more of the activity in the
supernatant fraction rather than in the particulate fraction, this
method was chosen over sonication.

/■■ 74
10 11 12 13
Time (day)
FIGURE 3.4 VC and ETH produced by Strain 195 in the presence of ampicillin and with different amounts of extract from the butyrate/PCE culture added.

75 /■
«=? 5.0" " ETH
■ VC OU
Il ■ DCE £ 4.0- a " TCE
1 ' ..—H...... PCE
T3 3.0"
§ tn <u g 2.0- ä -M <u o o 1.0- Ä 1 O
1 n.fH
» ■ -H i Q—H 0 4 5 6 7
Time (day)
FIGURE 3.5 PCE degradation to VC and ETH by Strain 195 grown on ampicillin, ABSS, and 5% v/v, 50x Butyrate/PCE culture extract.
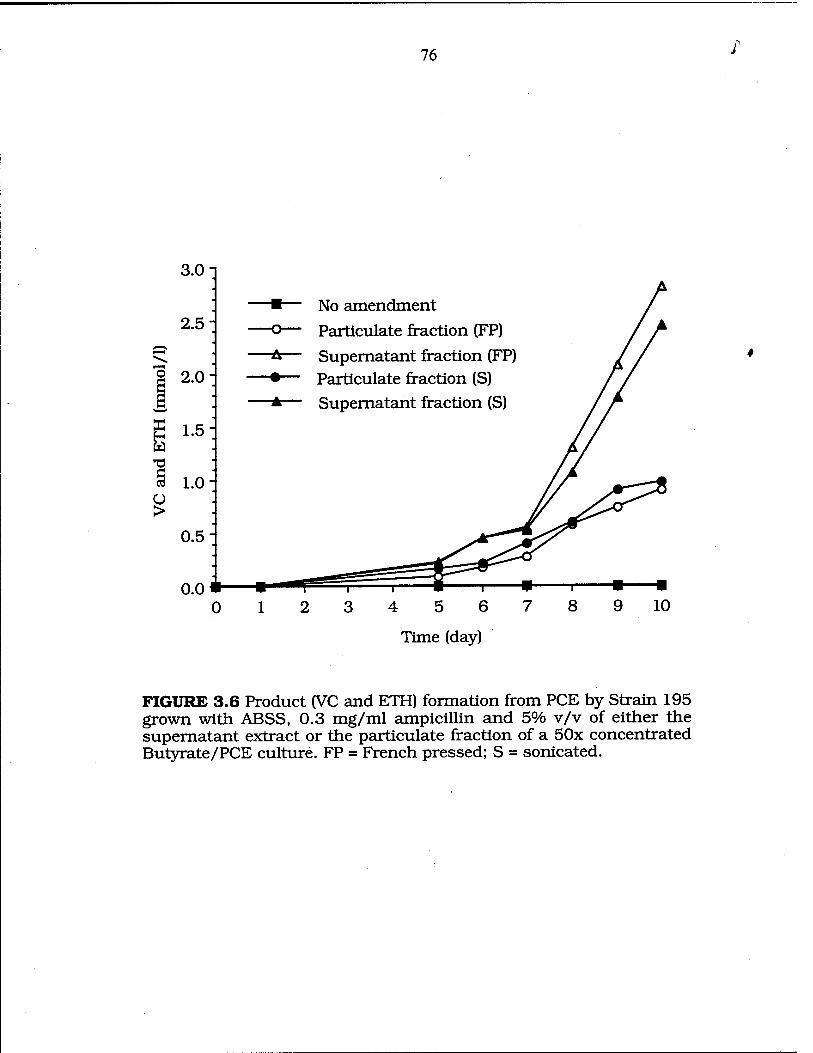
76 /■
3.0:
2.5:
I 2.o: & K i.5:
l.o:
0.5 : $
No amendment
Particulate fraction (FP)
■A— Supernatant fraction (FP) "•— Particulate fraction (S) "*— Supernatant fraction (S)
0.0* 0
FIGURE 3.6 Product (VC and ETH) formation from PCE by Strain 195 grown with ABSS, 0.3 mg/ml ampicillin and 5% v/v of either the supernatant extract or the particulate fraction of a 50x concentrated Butyrate/PCE culture. FP = French pressed; S = sonicated.

77
To estimate the size of the molecule/s responsible for the
activity of the butyrate/PCE culture extract (supernatant fraction),
this extract was passed through 10,000 and 50,000 dalton Centricon
filters and the filtrates and retentates were tested for their ability to
support dechlorination in Strain 195. Results in Fig. 3.7 showed that
the molecule/s responsible for the activity of the extract was greater
than 50,000 dalton (the retentate kept most of the extract activity).
The butyrate/PCE culture extract was always kept frozen until
utilized, and then it was stored at 4°C for about four weeks, when it
was discarded and replaced by a fresh extract. During its time of use,
the pH of the extract was 6.9.
3.4.c Growth and substrate utilization by Strain 195.
Fig. 3.8 shows growth of the culture on H2 and PCE, as
measured by increases in cell protein and direct microscopic cell
counts, during metabolism of PCE to VC and ETH. Protein was
quantified using the NanoOrange kit and cells were stained with
acridine orange before being counted microscopically. There was
growth of cultures until Day 5, and the estimated doubling time was
0.8 days. After Day 5, growth ceased while PCE dechlorination
continued, suggesting uncoupling of growth from dechlorination.
Cultures receiving H2 but not PCE showed only slight initial growth
(about 1 doubling), and PCE dechlorination products were not
detected in uninoculated cultures. The amount of VC and ETH
produced represented over 90% of the PCE added in inoculated
cultures. The protein yield for Days 1-5 was 4.8 ± 0.3 g protein per
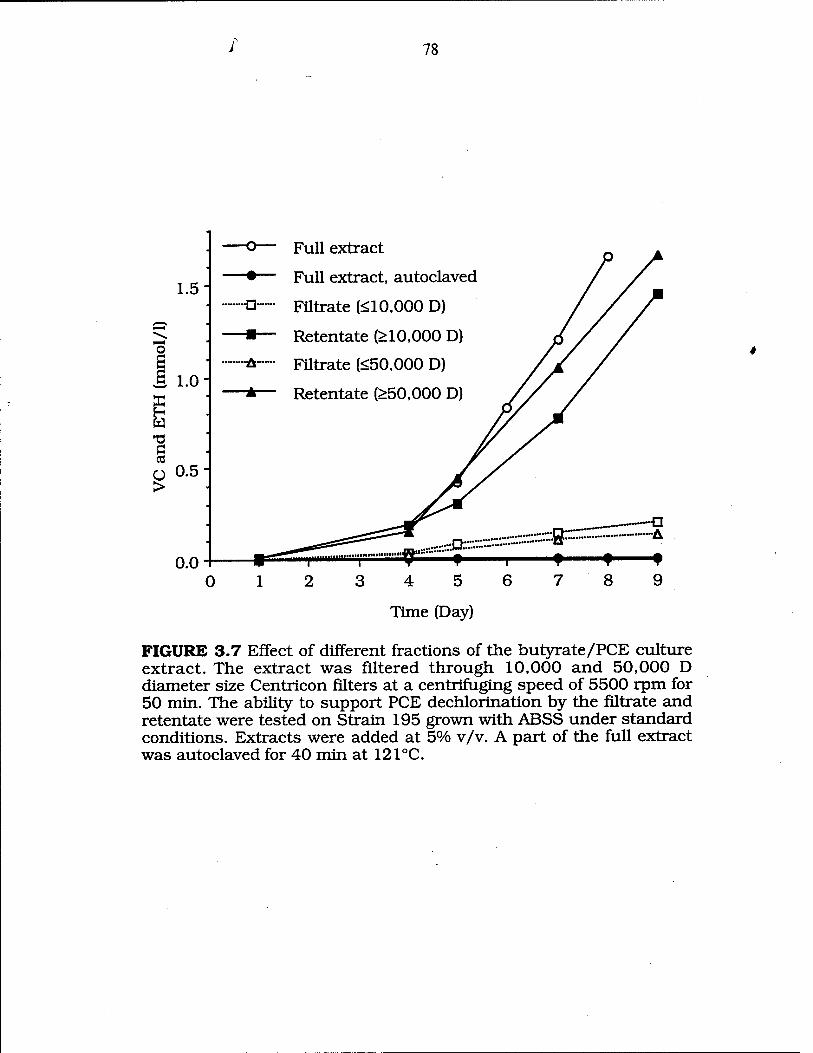
/ 78
1.5-
1 1.0
ü 0.5- >
0.0
Full extract
Full extract, autoclaved
Filtrate (< 10,000 D)
Retentate (> 10,000 D)
Filtrate (<50,000 D)
Retentate (>50,000 D)
0
Time (Day)
FIGURE 3.7 Effect of different fractions of the butyrate/PCE culture extract. The extract was filtered through 10,000 and 50,000 D diameter size Centricon filters at a centrifuging speed of 5500 rpm for 50 min. The ability to support PCE dechlorination by the filtrate and retentate were tested on Strain 195 grown with ABSS under standard conditions. Extracts were added at 5% v/v. A part of the full extract was autoclaved for 40 min at 121°C.

79 /■
3 -
o 2 -
0
VC+ETH (Inoc)
PCE (Inoc)
VC+ETH (Uninoc)
PCE (Uninoc)
3 4
Time (Day)
FIGURE 3.8 (a) Protein (ng/ml) growth curve and cell counts (number of cells/ml) for a pure culture of Strain 195 grown in medium with ABSS and 5% v/v butyrate/PCE culture extract, (b) Product formation from PCE dechlorination by the same culture, during the same experiment. Graphs show the means from triplicate tubes.

80 ' '
mol chloride released (determined from the dechlorination products
formed), and a specific activity of 69.0 ± 10.5 nmol chloride released
per minute per mg protein was determined. For comparison, D.
multivorans has a growth yield of 1.6 g cell dry weight per mol chloride
released, and a specific activity for whole cells of 150 nmol chloride
released per minute per mg protein when dechlorinating PCE to cis-
DCE (26).
Fig. 3.9 shows a time course for PCE conversion to ETH by
Strain 195 by a culture which had received five previous doses of PCE
amounting to 2.1 mmol/1. PCE was metabolized to VC at a nearly
constant rate of 40 [imol per hour per liter of culture medium with
little buildup of intermediates. VC dechlorination to ETH commenced
after PCE depletion and could be well fit by first-order kinetics with a
half-life near 80 hours before 300 hours had elapsed and one near 150
hours afterwards (regressions not presented), indicating a possible
decay in the culture's ability to metabolize VC with time.
3.4.d Electron donor and acceptor utilization by Strain 195
We have performed a physiological characterization of the
Strain 195, including examination of its ability to use e" donors and
acceptors commonly used by microorganisms carrying out anaerobic
respiration (Table 3.2 presents a summary of nutritional
experiments). H2 was required for PCE reduction, and growth of the
pure culture only occurred when both H2 and PCE were present (Figs.
3.5 and 3.8). Among the potential e" donors examined which did not
support PCE dechlorination were methanol, pyruvate, lactate,

/■ 81
200
4 0 200 400
Hours
800
FIGURE 3.9 Conversion of ca. 130 u.mol/1 PCE to ETH by a pure culture of Strain 195. The culture was given several doses of PCE followed by flushing with N2/CO2, which removed all ethenes except for ca. 50 u.mol/1 VC. PCE was underestimated in early data points due to its slow dissolution into the aqueous phase (30).

/ 82
TABLE 3.2 Substrates required, utilized and not utilized by Strain 195 (refer to the List of Abbreviations, in p. xv, for abbreviated names). §=experiment performed on Strain 195 when in the purified H2/PCE culture; f=see Chapter 4.
Requires Uses Does not use
Carbon sources Acetate YE -
e" donors H2 Formate Acetate§ Methanol Ethanol Pyruvate Glucose
YE Lactate
e" acceptors PCE DBA trons-DCE TCE VC
cis-DCE Oxygent 1,1-DCE Sulfate
DCA Sulfite Thiosulfate
Nitrate Nitrite
Fumarate
Others Vitamin B12 CA Biotin§ SS YE Folic acid§
Cell extract Riboflavine(?] Pyridoxine HC1§ VFA(?) Thiamine HC1§
Nicotinic acid§ Ca Pantothenate§ p-aminobenzoate§
Lipoic acid§ Hemin§
Nicotinamide§ 1,4-Naphthoquinone§
E. coli extract C. pasteurianum extrac
Calf serum Horse serum
LPS from E. coli Cholesterol
Phosphatydyl choline Tween 80

83 /
ethanol, glucose, and yeast extract. None of these substrates
supported growth when present alone in the absence of PCE.
Surprisingly, formate was also not utilized by Strain 195 to support
dechlorinationin the presence of 0.3 ^ig/ml ampicillin (Fig. 3.10). The
combined results suggest that formate is not directly utilizable by
Strain 195. In the mixed culture, a different microorganism was most
probably responsible for the use of formate, which may have produced
H2 in the process, to be used by Strain 195 as the direct e" donor for
dechlorination.
Potential e" acceptors which did not support growth when H2
was provided as the e~ donor included sulfate, sulfite, thiosulfate,
nitrate, nitrite, fumarate, and oxygen (see Fig. 4.3). The culture could
reductively dechlorinate 1,2-dichloroethane and 1,2-dibromoethane to
ethene, as did the original enrichment culture (30) (data not
presented).
3.4.d Microscopic studies of Strain 195.
Electron microscopic examination of Strain 195 (Fig. 3.11)
revealed non flagellated, pleomorphically shaped coccoid cells with
sizes ranging from 0.3 to 0.9 fim in diameter. These cells had an
unusual cell wall ultrastructure resembling neither typical Gram-
positive nor Gram-negative peptidoglycan layers in eubacteria, but
rather the S-layer protein subunit type cell walls found in many
Archaea (21). To test for the presence of a peptidoglycan cell wall that
could be located in the electrondense zone seen in between the cell
membrane and the S-layer, we used fluorescently-labeled wheat germ

84
2.0-
-o 1.5-
S J £ LO- TS c cd
> 0.5 i
No electron donor
Hydrogen
Formate Formate + ampicillin Hydrogen + ampicillin
T—v—r 7 8 9 10 11 12 13 14 15 16
Time (day)
FIGURE 3.10 Formation of VC and ETH from PCE by Strain 195 with formate or hydrogen as electron donors and without any electron donor. Formate and hydrogen were also tested with and without 0.3 |xg/ml ampicillin amended to the culture.

/ 85
FIGURE 3.11 Thin-section uranyl acetate-stained electron micrographs of coccoid (b, and c) and flattened (a and d) cells of Strain 195 showing their characteristic S-layer type cell envelope signaled by arrows in (a), (c) and (d). Marker bars represent 0.2 |j.m. (e) General field of vision showing a central coocoid cell {seen in (b)}, several flatenned cells and an empty cell envelope. Marker bar represents 0.5 |im.

/ 86
FIGURE 3.11 (Continued)

87 ^
agglutinin, which specifically binds to N-acetylglucosamine and N-
acetyl-neuraminic acid (28). This stain bound to whole cells of the
Gram-positive eubacterium Clostridium pasteurianum WF (data not
shown) and to cell-wall preparations of the Gram-negative
eubacterium Escherichia coli DH5a (Fig. 3.12 c and d) {the outer
membrane can protect the peptidoglycan from lectin binding in intact
cells (28). No binding was detected for whole cells (not presented) or
cell wall preparations (Fig. 3.12 a and b) of Strain 195.
3.4.e 16S rDNA analysis of Strain 195. (This experiment was
performed by Y. T. Chien and analyzed by S. H. Zinder).
Because of its unusual antibiotic sensitivities and cell wall
structure, it was of interest to determine the phylogenetic position of
the Strain 195 based on its 16S ribosomal DNA sequence (Fig. 3.13).
In this and all other phylogenetic analyses we performed, the PCE
dechlorinator clearly grouped within the eubacteria, but did not
cluster closely with any of the known phylogenetic lines. The analysis
in Fig. 3.13 indicates that the PCE-dechlorinator is most closely
related to a branch including cyanobacteria and planctomycetes, but
no close affinity with either of these groups was found in more
extensive analysis. DNA distance analyses placed the PCE-
dechlorinator close to Clostridium butyricum and relatives (6), but
there was little affinity for other members of the Gram-positive line. It
has been found that the eubacterial branches are themselves robust,
but they readily shift in branching order depending on the methods
and representative species used in the phylogenetic analyses (32),

/ 88
rwIJS? 3*12 EPiflu°rescence micrographs of whole cells of DH5a^raS^fan^(a): CeU WaU fr~ts of Eschertchtocall DH5a tb), and cell wall fragments of Strain 195 (c) stained with 100 mg/1 fluorescein-labeled wheat germ agglutinin (28)

89
Eubacteria Archaea
Sulfolobus acidocaldarius
Plancto- mycetes
Gram-positive bacteria
Aquifex Thermus pyrophilus aquaticus
Methanosarcina •barken
Clostridium butyricum
Frankia alnii
Desulfotomaculum nigrificans
Bacillus subtilis Acholeplasma laidlawii
s Chlamydia trachomatis
Planctomyces limnophilus Verrucomicrobiurri sm~ 7 "„„.„ + ._;_„,,_ / muscorum\ spmosum s \
Gloeobäbter \Bacteroides fragilis .vlolaceus . 1 . | I Strain 195
Cyanobacteria
Desulfovibrio desulfuricans
Agrobacterium tumefaciens
•Escherichia coll
. Spirochaeta litoralis Fibrobacter succinogenes
'Chlorobium limicola
Proteo- bacteria
FIGURE 3.13. Unrooted phylogenetic tree generated for the 16S rDNA sequence from Strain 195 using the SUGGEST TREE maximum likelihood program provided by the Ribosome Database Project (RDP) (23). Some organisms included in the original analysis were deleted from the figure for simplicity. Other analyses of these sequences were performed by manually aligning Strain 195's sequence to other pre- aligned sequences from the RDP, followed by using the PHYLIP 3.5c package (11), including DNAML (maximum likelihood analysis), and DNADIST (Kimura model) coupled to either FITCH or NEIGHBOR. None of these analyses showed any clustering of Strain 195 within any known eubacterial group.

90 /■
making the behavior of Strain 195 typical of a separate eubacterial
branch. At this point, the most prudent taxonomic decision is to
place the PCE-dechlorinator in a separate branch of the eubacteria.
Because it does not apparently belong to any presently known genus
or species, we have tentatively named Strain 195 "Dehalococcoid.es
ethenogenes" but a formal taxonomic description must be made.
3.5 DISCUSSION.
A novel organism capable of reductive dechlorination of PCE to
ETH, tentatively named "Dehalococcoides ethenogenes" strain 195, has
been isolated. This is the first report of a pure culture that is able to
completely dechlorinate PCE; all other organisms isolated so far
replace the first two chlorines, leaving the other two untouched.
Isolation by dilution, although tried repeatedly, was not
successful. PCE dehlorination in a dilution high enough to prevent
the growth of heterotrophic contaminants was not attained. In roll
tubes, the main factor was the smallness of the dechlorinating
colonies. Production of chlorinated derivatives stopped before colonies
responsible for the dechlorination process could be seen. This could
be due to a requirement by "D. ethenogenes" strain 195 for nutrient(s)
from a syntrophic organism. These nutrient(s) could easily be
obtained by the dechlorinator in liquid medium, but in agar, diffusion
would be impaired at higher dilutions due to the semisolid nature of
agar and to the distance between cells separated by the dilution
process. Also, the fact that PCE dechlorination leads to HC1
91
production may explain the smallness of the colonies. In solid
medium, the pH in and around the colony could become so acidified
that, after certain growth of the colony, it would prevent further
growth. The higher TCE production seen in these cultures is similar
to results in liquid culture, and it is probably an effect of the high
solubility of TCE in HDC.
"D. ethenogenes" strain 195 seems to have a very limited number
of substrates that it is able to process. Its dependence on factors from
other organisms underscores the importance of nutritional
interactions between the PCE-dechlorinator and other organisms in
the culture. Such dependence is typical of anaerobes which tend to
exist in interacting communities (35). The little use that this
organism has for very rich substrates like horse or calf serum and its
dependence on halogenated compounds generates questions about
how specific the role of this organism in nature is. The results in
Figure 3.9 resemble those for the mixed methanol/PCE culture from
which it was derived (30) except for the relative rates of PCE and VC
dechlorination. In the methanol/PCE culture, PCE was dechlorinated
to VC at a rate of 12.5 \imol per hour per liter and VC was
dechlorinated to ETH with a half-life near 17 hours. Had this pure
culture performed similarity, the expected half life for VC should have
been near six hours, more than tenfold shorter than was found. If
"Dehalococcoid.es ethenogenes" strain 195 is responsible for VC
dechlorination in mixed cultures, then some factor, perhaps
nutritional, limits the rate of VC dechlorination in the pure culture.
It is also possible that another organism or strain present in the

/ 92
mixed culture is capable of more rapid VC metabolism.
The potential presence of an S-layer in an organism that lacks
a peptidoglycan cell wall is interesting. As observed in Fig. 3.11, the
cell envelope seems to contain an electron-dense periplasmic space in
between the cell membrane and the S-layer. This could be a zone of
important enzymatic activity for the cell, that may or may not be
related to dechlorination activity. Fig. 3.11 (b) and (c) show what
could be a membrane vesicle that extrudes from the cell envelope.
These are sometimes formed when highly electropositive compounds
come in contact with cells, displacing Ca2+ and Mg2+ from the
membrane (3).
Our knowledge of the diversity of organisms capable of
respiratory reductive dechlorination is increasing (25). Once there is
greater understanding of the diversity and properties of these
organisms, questions can be addressed concerning their evolution and
population biology. An interesting question regards the origin of
organisms capable of attacking halogenated organic compounds, most
of which have only been extensively released into the environment for
less than 100 years, although some haloorganics are produced
biogenically and abiogenically (17). Clues about the origin of these
organisms may be obtained by examining their phylogenetic positions.
Dehalobacter restrictus and Desulfitobacterium sp. strain PCE1 cluster
with Gram-positive sulfate-reducing bacteria (represented in Fig. 5 by
Desulfotomacutum nigrificans) while ItehalospiriUwn multivorans clusters
with Gram-negative sulfate-reducing bacteria and campylobacters
(represented by Desulfovibrio desulfuricans). Both of these groups tend

93
to be versatile at using respiratory electron acceptors including other
chlorinated organic compounds such as chlorinated benzoates and
phenols (5, 7, 31). The PCE-dechlorinating organism described here,
however is divergent from these groups.
Another interesting question is whether these dechlorinating
organisms evolved independently in different contaminated sites, or
whether only a limited number of organisms have evolved this ability
and need to be transported from other sites. These types of questions
are not strictly academic. For example, at some contaminated sites,
PCE is hardly dechlorinated at all, while at others it is only
dechlorinated as far as cis-DCE, reminiscent of reactions carried out
by Dehalobacter restrictus and DehcdospirülummuLtivorans, while at still
other sites dechlorination proceeds to VC, ethene, or occasionally
ethane (18). It is not clear whether incomplete dechlorination at a
given site is due to suboptimal physiochemical conditions, or to
deficiencies in electron donors or nutrients present, or to the lack of
appropriate organisms. Such knowledge will be useful in predicting
fates of chloroethene contaminants, as well as possibly providing
strategies for hastening their degradation.
94
REFERENCES
/
l.Bagley, D. M., and J. M. Gossett. 1990. Tetrachloroethene transformation to trichloroethene and cis-l,2-dichloroethene by sulfate-reducing enrichment cultures. Appl. Environ. Microbiol. 56:2511-2516.
2Balch, W. E., G. E. Fox, L. J. Magrum, C. R. Woese, and R. S. Wolfe. 1979. Methanogens: Reevaluation of a unique biological group. Microbiol. Rev. 43:260-296.
3.Beveridge, T. J.f and L. L. Graham. 1991. Surface layers of bacteria. Microbiol. Rev. 55(4):684-705.
4.Bozzola, J. J., and L. D. Russell. 1992. Electron microscopy. Principles and techniques for biologists. Jones and Barely Publishers, Boston.
5.Cole, J. R., A. L. Cascarelli, W. W. Mohn, and J. M. Tiedje. 1994. Isolation and characterization of a novel bacterium growing via reductive dehalogenation of 2-chlorophenol. Appl. Environ. Microbiol. 60:3536-3542.
6.Collins, M. D., P. A. Lawson, A. Willems, J. J. Cordoba, J. Femandezgarayzabal. P. Garcia, J. Cai, H. Hippe, and J. A. E. Farrow. 1994. The phylogeny of the genus Clostridiunu proposal of five new genera and eleven new species combinations. Int. J. Syst. Bacteriol. 44(4):812-826.
7.DeWeerd, K. A., L. Mandelco, R. S. Tanner, C. R. Woese, and J. M. Suflita. 1990. Desulfomonile tiedjei gen. nov. and sp. nov., a novel anaerobic dehalogenating, sulfate-reducing bacterium. Arch. Microbiol. 154:23-30.
8.DiStefano, T. D., J. M. Gossett, and S. H. Zinder. 1992. Hydrogen as an electron donor for the dechlorination of tetrachloroethene by an anaerobic mixed culture. Appl. Environ. Microbiol. 58:3622- 3629.
9.DiStefano, T. D., J. M. Gossett, and S. H. Zinder. 1991. Reductive dechlorination of high concentrations of tetrachloroethene to ethene by an anaerobic enrichment culture in the absence of methanogenesis. Appl. Environ. Microbiol. 57(8):2287-2292.

95
lO.Fathepure, B. Z., J. P. Nengu, and S. A. Boyd. 1987. Anaerobic bacteria that dechlorinate perchloroethene. Appl. Environ. Microbiol. 53(11):2671-2674.
11. Felsenstein, J. 1993. Phylogenetic inference program (PHYLIP) manual version 3.5c. University of Washington, Seattle.
12Fennell, D. E., M. A. Stover, S. H. Zinder, and J. M. Gossett. 1995. Comparison of alternative electron donors to sustain PCE anaerobic reductive dechlorination., p. 9-16. InR. E. Hinchee, A. Leeson, and L. Semprini (ed.), Bioremediation of chlorinated solvents. Battelle Press, Columbus, OH.
13.Freedman, D. L., and J. M. Gossett. 1989. Biological reductive dechlorination of tetrachloroethylene and trichloroethylene to ethylene under methanogenic conditions. Appl. Environ. Microbiol. 55(9):2144-2151.
14.Gerritse, J., V. Renard, T. M. Pedro-Gomes, P. A. Lawson, M. D. Collins, and J. C. Gottschal. 1996. Desulfttobacterium sp. strain PCE1, an anaerobic bacterium that can grow by reductive dechlorination of tetrachloroethene or ortho-chlorinated phenols. Arch. Microbiol. 165:132-140.
15.Goodwin, D. C, and S. B. Lee. 1993. Microwave miniprep of total genomic DNA from fungi, plants, protists, and animals for PCR. Biotechniques. 15:438-444.
16.Gossett, J. M. 1987. Measurement of Henry's Law constants for Cj and C2 chlorinated hydrocarbons. Environ. Sei. Technol. 21(12):202-208.
17.Gribble, G. W. 1994. The natural production of chlorinated compounds. Environ. Sei. Technol. 28:310A-319A.
18.Hinchee, R. E., A. Leeson, and L. Semprini (ed.). 1995. Bioremediation of Chlorinated Solvents. Battelle Press, Columbus, OH.
19.Holliger, C, G. Schraa, A. J. M. Starns, and A. J. B. Zehnder. 1993. A highly purified enrichment culture couples the reductive dechlorination of tetrachloroethene to growth. Appl. Environ. Microbiol. 59:2991-2997.
20.Johnson, J. L. 1994. Similarity analysis of rRNAs., p. 683-700. In P. Gerhardt (ed.), Methods for general and molecular bacteriology. American Society for Microbiology, Washington, DC.
/ 96
21.Kandier, O. 1994. Cell wall biochemistry and Three-Domain concept of life. Syst. Appl. Microbiol. 16(4):501-509.
22.Krumholz, L. R., R. Sharp, and S. S. Fishbain. 1996. A freshwater anaerobe coupling acetate oxidation to tetrachloroethylene dehalogenation. Appl. Environ. Microbiol. 62:4108-4113.
23.Maidak, B. L., N. Larsen, M. J. McCaughey, R. Overbeek, G. J. Olsen, K. Fogel, J. Blandy, and C. R. Woese. 1994. The ribosomal database project. Nuc. Ac. Res. 22:3485-3487.
24.Maymo-Gatell, X., V. Tandoi, J. M. Gossett, and S. H. Zinder. 1995. Characterization of an H2 -utilizing anaerobic enrichment culture that reductively dechlorinates tetrachloroethene to vinyl chloride and ethene in the complete absence of methanogenesis and acetogenesis. Appl. Environ. Microbiol. 61:3928-3933.
2 5.Mohn, W. W., and J. M. Tiedje. 1992. Microbial reductive dehalogenation. Microbiol. Rev. 56:482-507.
26.Scholz-Muramatsu, H., A. Neumann, M. Messmer, E. Moore, and G. Diekert. 1995. Isolation and characterization of Deholospirillum multivorans gen nov, sp nov, a tetrachloroethene- utilizing, strictly anaerobic bacterium. Arch. Microbiol. 163(1):48- 56.
27 Sharma, P. K., and P. L. McCarty. 1996. Isolation and characterization of a facultatively aerobic bacterium that reductively dehalogenates tetrachloroethene to cis-1,2- dichloroethene. Appl. Environ. Microbiol. 62(3):761-765.
28Sizemore, R. K., J. J. Caldwell, and A. S. Kendrick. 1990. Aternate gram staining technique using a fluoreascent lectin. Appl. Environ. Microbiol. 56:2245-2247.
29.Sprott, G. D., S. F. Koval, and C. A. Schnaitman. 1994. Cell fractionation, p. 72-103. In P. Gerhardt (ed.), Methods for General and Molecular Microbiology. American Society for Microbiology, Washington, DC.
30.Tandoi, V., T. D. DiStefano, P. A. Bowser, J. M. Gossett, and S. H. Zinder. 1994. Reductive dehalogenation of chlorinated ethenes and halogenated ethanes by a high-rate anaerobic enrichment culture. Environ. Sei. Technol. 28:973-979.
31.Utkin, I. B., C. Woese, and J. Wiegel. 1994. Isolation and characterization of Desuljitobacterium dehalogans, gen. nov., sp.

97 J
nov., an anaerobic bacterium which reductively dechlorinates chlorophenolic compounds. Int. J. Syst. Bacteriol. 44:612-619.
32.Van de Peer, Y., J. M. Neefs, P. Derijk, P. Devos, and R. Dewachter. 1994. About the order of divergence of the major bacterial taxa during evolution. Syst. Appl. Microbiol. 17(l):32-38.
33.Vogel, T. M., and P. L. McCarty. 1985. Biotransformation of tetrachloroethylene to trichloroethylene, dichloroethylene, vinyl chloride, and carbon dioxide under methanogenic conditions. Appl. Environ. Microbiol. 49(5): 1080-1083.
34Wischnitzer, S. 1989. Introduction to electron microscopy, 3rd ed. ed. Pergamon Press, New York.
35Zinder, S. H. 1993. Physiological ecology of methanogens, p. 128- 206. In J. G. Ferry (ed.), Methanogenesis. Chapman Hall Routledge, NY.

/
CHAPTER FOUR
FURTHER CHARACTERIZATION OF "Dehalococcoides ethenogenes" strain 195
The microbe is so very small You cannot make him out at all"
Hilaire BeUoc, 1870-1953 More beasts for worse children (1897), 'The microbe'
4.1 ABSTRACT.
"D. ethenogenes" strain 195 was further characterized. This
organism had an optimum dechlorinating temperature of 35°C. It
could reductively dechlorinate PCE at about 15°C, but with much
slower dechlorination rates, and it did not dechlorinate PCE when
incubated at 10°C. Its optimal pH was from 6.8 to 7.5, although good
dechlorinating activity was obtained at pH 7.9. No PCE
dechlorination was observed at pH 5.8. "D. ethenogenes" was unable to
dechlorinate in the presence of oxygen and, after oxygen was removed,
the culture seemed to be permanently inhibited by this compound.
The culture dechlorinated faster at osmolalitites two to three times
higher (200 to 300 mOsm) than that in the standard medium (80 to
110 mOsm). Platinum-replica studies of the cell envelope indicated
that "D. ethenogenes" strain 195 possessed a highly structured S-layer
with hexagonal symmetry and a separation of 15 run between the
center of any two of its contiguous globular subunits.
98

99
4.2 INTRODUCTION.
Because of the uniqueness of "D. ethenogenes" strain 195, due
to its capabilities as a PCE dechlorinator and to its unusual 16S
rDNA derived phylogeny and antibiotic sensitivities (9, 10), it was of
interest to characterize this organism further.
From an environmental point of view, there are many
parameters to consider that will influence a general degradation
process if in situ or on site bioremediation is to be achieved eventually
with a specific microorganism (1). Some of the studies performed on
"D. ethenogenes" strain 195 in the last chapter have solely dealt with
the nutritional requirements which allow this organism to grow with
the fastest rates of dechlorination possible under the present
circumstances. Nevertheless, the necessity to know as much as
possible not only about the dechlorination process itself but also
about the organisms that carry it out, make imperative further
characterization of "D. ethenogenes" strain 195. Factors like optimal
temperature, pH, reducing conditions and osmolality of the medium
are important to improve the dechlorination process in the
laboratory, but, most importantly, ultimately this information may be
valuable to the detoxification of a particular contaminated
environment.
Some of these studies have been performed on the isolates that
are capable of reducing PCE to cfs-DCE (3, 7, 8, 11, 14). Optimal
temperatures vary from 21 to 38°C (from 21 to 31°C for Strain TT4B;
from 34 to 38°C for Desulfitobacterium sp. strain PCE1; 37°C for
Enterobacter sp. strain MS-1; from 25 to 37°C for Dehalospirillum
/ 100
multworans; and from 25 to 35°C for Dehalobacter restrictus). Optimal
pHs vary from 6.8 to 7.8 (7.4 for Strain TT4B; 7.8 for
Desulfltobacteriumsp. strain PCE1; 7.0 for Enterobacter sp. strain MS-
1; from 7.0 and 7.5 for D. multivorans; and from 6.8 and 7.6 forD.
restrictus).
A deeper characterization of "D. eth.enogen.es" strain 195's S-
layer ultrastructure is of interest because it has not been recognized
so far in any of the other PCE dechlorinating isolates (7, 8, 13, 14).
4.3 MATERIALS AND METHODS.
4.3.a Chemicals and analyses of chloroethenes.
PCE and its chlorinated derivatives, ETH, H2, and all other
chemicals were purchased and utilized as described in Chapter Two.
Quantitative analysis of chloroethenes and ETH was performed
as described in Chapter Three. Peak areas were calculated using the
software supplied with the GC, and were compared to standard curves
for chloroethenes (4). Headspace samples were 100-p.l in all cases.
4.3.b Growth medium and culture conditions.
The ingredients utilized to produce the basal medium and the
protocol followed to produce it, previous to the addition of the
amendments, was followed as described in Chapter Two of this
dissertation. The basal medium received the same sterile and
anaerobic additions described in Chapter Three, including ampicillin.

101 i
The protocol for the preparation of the cell extract from the
butyrate/PCE culture was also as described in Chapter Three.
Inoculum sizes were 2% v/v, all incubations were done in duplicate,
and each experiment presented was performed at least twice with
similar results. Duplicate tubes performed similarly in the
experiments presented (less than 5% difference in results for tubes
under same conditions), so the results for some of these experiments
are presented for individual tubes. Cultures were incubated as
described in Chapter Three. H2 and NaHCC>3 were added during the
experiments as described in Chapter Two.
Temperature and pH optimum were obtained by following the
increase in product formation (VC and ETH) by cultures incubated at
different temperatures and pHs. Doubling times were obtained from
semilogarithmic plots of product formation (r2 valües> 0.90), obtained
during the exponential phase of growth of the culture. Values of
M-max(vc+ETH) were obtained from the doubling times. The pH was
adjusted to the different values with 0.5 M HC1 or 0.5 M NaOH before
autoclaving and the experiment was performed at 35°C. For the pH
experiment, product formation was measured only during the first 4
days and the pH of each tube was measured after the conclusion of
the experiment to confirm the initial pH value (VARIANCE for
duplicate tubes were not higher than 0.2 units of pH).
For the study of oxygen tolerance, oxygen was added at 21% by
flushing the tubes with 30%N2/70%CO2 to purge the Na2S. A mild
vacuum was then produced in the tubes and air was let in through a
venting needle. After tubes became pink (aerobiosis as indicated by

102
0.05 g/1 resazurin present in the medium), H2 and all amendments for
growth, as well as the buffer system, were replenished. To re-reduce
the medium, tubes were purged with 30%N2/70%CC>2 and further
reduced with Na2S, as described in Chapter Two of this dissertation.
For the osmolality studies, five sets of duplicate tubes were
prepared. The osmolarity of the medium was changed with a IM
solution of sucrose. The first set of tubes had no sucrose addition; the
second had a final sucrose concentration of 0.05 M; the third of 0.1
M; the fourth of 0.2 M; and the fifth of 0.35 M. The osmolality of the
solutions was measured with a Micro-osmometer, Model 3MO plus
(Advanced Instruments, Inc., Norwood, MA).
4.3.C Microscopy.
A Zeiss Standard 18 microscope was used for phase-contrast
observation of cells. For replica studies of "D. ethenogenes" strain 195,
cultures were sampled at the end of their growth phases. A high
vacuum freeze-etching unit BAF 400 K (Baltec, now Technotrade
International, Manchester, NH) was used to produce the replicas. Two
types of runs were performed. For the room temperature run, four
freshly cleaved pieces of mica were placed on the specimen table. A
drop of "D. ethenogenes" strain 195 cells in normal culture medium
was placed on each of two of the pieces of mica and a drop of 40X
concentrated culture was placed on each of the other two pieces. The
specimen table with the samples was inserted into the chamber were
the samples were coated with 4 to 5 nm of platinum. Samples where
then stabilized with a carbon evaporation and removed from the

103
chamber. Replicas were separated from the mica onto the surface of
distilled water, inside a glass well. Concentrated sodium hypochlorite
(bleach) was gradually added and water gradually removed until the
replicas were floating in full strength bleach. After 4 hours in bleach,
the replicas were picked up in formvar-coated grids and viewed on a
Philips EM201 electron microscope.
For the cold temperature run, the procedure followed was the
same as for the room temperature run, but before coating, the
samples were cooled to -130°C for 30 min. After coating the samples
with platinum and carbon, they were removed from the chamber and
allowed to warm to room temperature.
4.4 RESULTS.
4.4.a Optimal temperature and pH analyses.
Fig. 4.1 depicts |i(vc+ETH) at different temperatures. Variances
for all points are plotted (the ones not shown are smaller than the
symbols). The temperature that allowed the fastest PCE
dechlorination was around 35°C. The culture did not tolerate
temperatures above 40°C. Below the optimal temperature, as the
temperatures lowered, so did the speed of dechlorination and the
doubling times, being very low at around 15°C (doubling time of 16
days), although above zero.
Because "D. ethenogenes" strain 195 had been growing at 35°C
for many years, it was possible that the culture needed one or two

104
0.04-
Temperature (°C)
FIGURE 4.1 Determination of optimal temperature for PCE dechlorination by "D. ethenogenes" strain 195. \i values were obtained from doubling times, which were calculated from semilogarithmic plots of ETH and VC formation by cultures incubated under different temperatures.

105
more transfers to become accustomed to lower temperatures. To
determine this, at Day 38 in the experiment of Fig. 4.1, one of the
cultures incubated at 15.5°C was transferred into fresh medium with
all the requirements for growth. Two of the newly transferred tubes
were incubated again at 15.5°C while two others were incubated at
10°C (data not shown). After 31 days, the cultures incubated at
15.5°C had a maximum H(vc+ETH) of 0.0031 h'1 (equivalent to a
doubling time of 9.3 days), almost twice as fast as the first generation
cultures. After 76 days, the cultures incubated at 10°C had not
produced any VC or ETH. At Day 31, one of the 2nd generation
cultures incubated at 15.5°C was transferred into fresh medium with
all the requirements for growth, and incubated again at 15.5°C (data
not shown). After 25 days, the cultures had a maximum ^(vc+ETH) of
0.00295 h"1 (equivalent to a doubling time of 9.7 days), very similar to
the one detected for the second generation cultures.
Fig. 4.2 depicts H(vc+ETH) at different pHs. The optimal pH for
PCE dechlorination by "D. ethenogenes" strain 195 incubated at 35°C
comprised an interval between 6.8 and 7.5. Lower dechlorinating
activity was obtained at pH 6.3 and 7.9. Cultures incubated at pH 7.9
started dechlorinating later (two days) than the rest (except the ones
at pH 5.8), and the doubling times for these cultures were obtained
between days 3 and 5 (for the other cultures they were obtained
between days 2 and 4). No PCE dechlorination was observed at pH
5.8. For both the pH and the temperature analyses, PCE was never
allowed to reach zero.

106
0.04-1
pH
FIGURE 4.2 Determination of optimal pH for PCE dechlorination by "D. ethenogenes" strain 195. \i values were obtained from doubling times, which were calculated from semilogarithmic plots of ETH and VC formation by cultures incubated under different pHs.

107
4.4.b Effects of oxygen on PCE dechlorination.
To determine the ability of "D. ethenogenes" strain 195 cells to
resist oxygenie conditions, a culture was transferred into fresh
medium and given three consecutive doses of PCE. The culture was
oxygenated at Day 7 at normal air concentrations (about 21%) (Fig.
4.3). Oxygen inhibited reductive dechlorination of PCE by the culture
for the next six days. At Day 13, the cultures were reduced again.
After this re-reduction, "D. ethenogenes" strain 195 did not
dechlorinate PCE for 15 days, when the experiment was terminated. A
similar experiment performed with a concentration of oxygen of 2%
showed similar results (data not shown).
4.4.C Osmolality studies.
A study was pursued to determine how "D. ethenogenes" strain
195 coped with water activity (osmolality) in the medium and how did
it compare to other organisms which also lack a peptidoglycan cell
wall, like the mycoplasmas (18).
The osmolality of our basic salts medium was 27 mOsm
(variance=0) and that of the sludge supernatant (SS), which is added
at a 25% v/v, was of 129.5 mOsm (variance=3). When the complete
medium in which cultures are transferred was measured, its
osmolality was 82.6 mOsm (variance=3.5). The osmolality of a grown
culture was around 110 mOsm (variance=6), higher than that of the
same medium when just inoculated.
Fig. 4.4 shows the product formation from PCE dechlorination
by several cultures incubated under different osmolalities. The inocu-

108
1.2l *— VC and ETH
PCE
- i ■ ■■
25 Time (day)
FIGURE 4.3 Product formation from PCE. The new transfers were fed three consecutive doses of PCE (note separate Y axis for PCE) and at Day 7, oxygen (21%) was added. The cultures were re-reduced on Day 13.

109
Jt
2.5
2.0"
•a 1.0-1
>
llOmOsm
160 mOsm
-*— 200 mOsm
-A— 300 mOsm
-•— 430 mOsm
Time (day)
FIGURE 4.4 VC and ETH formation from PCE in cultures that grew and dechlorinated in media of different osmolalities.

110
lum utilized for all cultures came from a culture grown at the usual
osmolality (80 to 110 mOsm). "D. ethenogenes" strain 195 growing in
medium at 110 mOsm showed the best dechlorination rates. It is
clear that the closer the osmolality of the medium to the normally
utilized one, the better the dechlorination of PCE. Medium at 430
mOsm also sustained dechlorination but much poorly than the rest
of the cultures.
The cultures growing at 110, 160, 200, and 300 mOsm were
transferred again under the same conditions. The results in product
formation from PCE are shown in Fig. 4.5. In this experiment, the
order in which cultures at different osmolalities dechlorinated PCE,
from best to worse, inverted itself with respect to the results of Fig.
4.4 (cultures at 430 mOsm were not tested in Fig. 4.5). Cultures at
200 and 300 mOsm performed better than those at 110 mOsm.
4.4.d S-layer studies.
To determine if the envelope structure seen in the micrographs
of Figs. 3.11 contained indeed an S-layer, platinum and carbon
coated replicas of "D. ethenogenes" strain 195 were produced and
observed under electron microscopy. Fig. 4.6 shows six of the
photomicrographs obtained from a pure culture of "D. ethenogenes"
strain 195. The coccoid cells observed did not seem to have a rigid cell
envelope. They were quite pleomorphic and many cells were folded
onto themselves. The two-dimensional, crystalline S-layer lattice
symmetry seemed hexagonal (15, 17) and it had a separation of 15 nm
between the center of any two of its contiguous globular subunits. As

Ill
4.0-
•S 3.0-
g 2
110 mOsm
160 mOsm
-*— 200 mOsm
-A— 300 mOsm
2.0-
1.0-
0.0*
Time (day)
FIGURE 4.5 Product formation (VC and ETH) in cultures growing arid dechlorinating in media of different osmolalities. The inoculum for each of the osmolalities represented in this graph was obtained from each of the cultures shown in Fig. 4.4 that had the same osmolality.
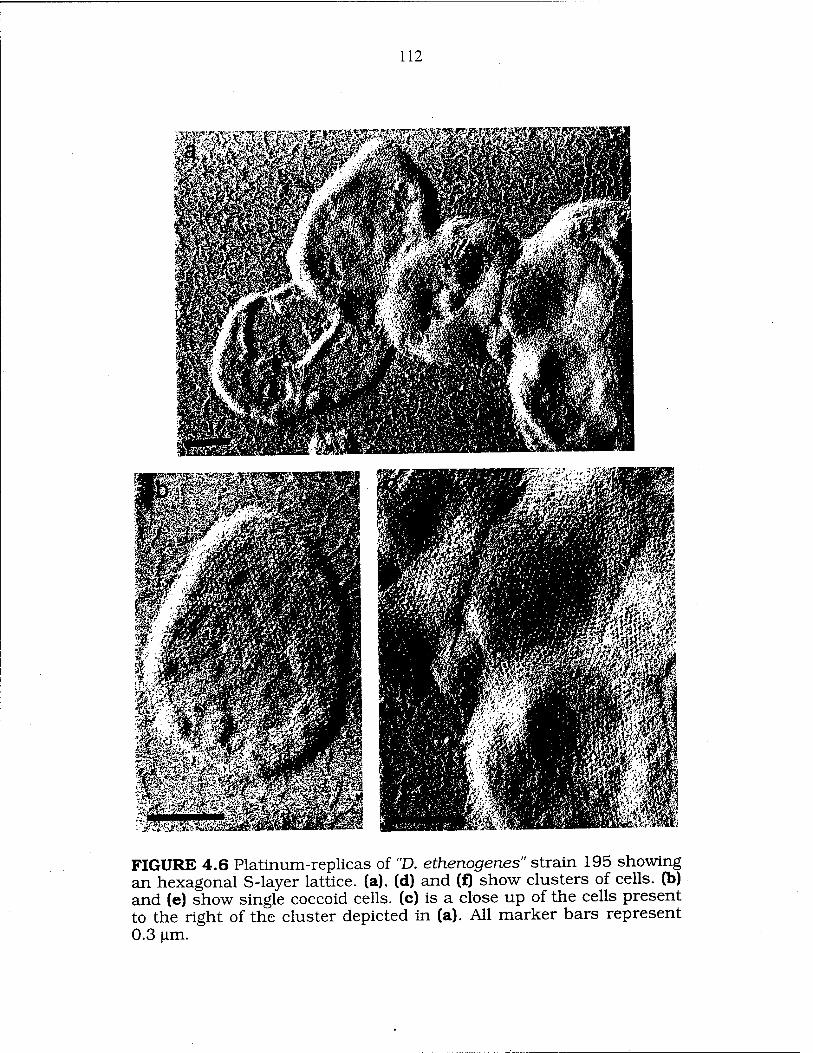
112
FIGURE 4.6 Platinum-replicas of "D. ethenogenes" strain 195 showing an hexagonal S-layer lattice, (a), (d) and (f) show clusters of cells, (b) and (e) show single coccoid cells, (c) is a close up of the cells present to the right of the cluster depicted in (a). All marker bars represent 0.3 (im.

FIGURE 4.6 (Continued)
113
114
observed in Fig. 3.11, the S-layer was located at the outermost part of
the cell envelope.
4.5 DISCUSSION.
"D. ethenogen.es" strain 195 was further characterized. The
determination of an optimal dechlorinating temperature and pH is of
environmental relevance. Most of the temperatures in which reductive
dechlorination should occur in the environment are not above 15°C
and pH values are often near neutrality in contaminated sites (5, 6).
The optimal dechlorinating temperature for "D. ethenogenes" strain
195 ranges from 32 to 35°C, which falls in the interval of
temperatures found for other PCE dechlorinating isolates, though
this is a more restricted interval than, for example, the one for Strain
TT4B (8) or D. multivorans (11), which can optimally dechlorinate PCE
at lower temperatures. The fact that rates of dechlorination at 15°C
doubled in a few weeks is indicative of the need for "D. ethenogenes"
strain 195 to acclimate to temperatures different than 35°C, the one
at which it has been growing for years. It is possible, then, that the
range of optimal dechlorinating temperatures could widen to
encompass a region closer to 25°C.
Even though there seems to be a tendency for the optimal pH
intervals to be narrower than those for temperatures in the PCE
dechlorinating isolates, this is not the case for "D. ethenogenes" strain
195. This organism has an optimal pH interval from 6.8 to 7.5,
although rapid rates of dechlorination can still be obtained at pHs
115
from 6.3 to 7.9. The fact that the culture showed a short lag phase
before starting to dechlorinate when growing at pH 7.9 may indicate
again that "D. ethenogenes" strain 195 is an organism with ability to
acclimate to new environmental conditions, given sufficient time.
When cultures of "D. ethenogenes" strain 195 were exposed to
oxygen and then were re-reduced to the original optimal growth
conditions, no PCE dechlorination occurred. The fact that no
reductive dechlorination occurred in the presence of oxygen was
expected because this type of reaction occurs only under anaerobic
conditions (19). The lack of dechlorination after re-reduction
indicates the requirement by "D. ethenogenes" strain 195 for anaerobic
conditions. On the other hand, the enzymatic apparatus necessary to
dechlorinate could have been irreversibly repressed or inactivated by
oxygen. If this were true, no dechlorination could be possible even if
"D. ethenogenes" strain 195 was not a strictly anaerobic organism.
The studies regarding the osmolality of the growth medium
utilized by "D. ethenogenes" strain 195 are of importance for two main
reasons: (a) so far, cells of "D. ethenogenes" strain 195 have been
growing in a medium of low osmolality (from 80 to 110 mOsm) when
compared to that of animal cells (350 mOsm) or bacterial cells lacking
a peptidoglycan cell wall, like acholeplasmas and other mycoplasmas
(from 290 to 350 mOsm) (12). (b) Also, when PCE and the other
chloroethenes are reduced by hydrogen, one proton and one chloride
ion are produced for each chloride substituted. The protons acidify
the medium (this is why a buffer system is so important) and the
chloride ions, together with the excess of sodium ions present,

116
augment the tonicity of the medium to high levels after many PCE
doses (HCl+NaHC03=C02+H20+NaCl).
To find an optimal osmolality for the growth of "D. ethenogenes"
strain 195 could mean better rates of PCE dechlorination and, in fact,
this is what it is seen in the sequence of Figs. 4.4 and 4.5 where, after
a short acclimation period, osmolalities closer to 300 mOsm allow
faster PCE dechlorination than the usual around 100 mOsm. The fact
that osmolalities of 430 mOsm allowed much poorer dechlorination
rates than the rest means that lower osmolalities are supported much
better by the culture than higher ones and, as with the temperature
curve, there is a sharp decrease in activity once the optimal
osmolality is exceeded.
Electron microscopy studies clearly showed the presence of a
two-dimensional, crystalline bacterial S-layer present in the cell
envelope of "D. ethenogenes" strain 195, which can be unequivocally
identified only by electron microscopy (2). Not much is known about
the significance of S-layers' function in cells (17). Some
archaeobacteria possess S-layers as an exclusive wall component
which determines cell shape (16, 17). This does not seem to be the
case in "D. ethenogenes" strain 195. This organism lacks peptidoglycan
but it does not have a definite, constant coccoid shape. The lack of
rigidity of this organism can be seen in common folding of cell
portions onto themselves when observed in microscopical
preparations (see Chapters Three and Four, and Appendix A); and in
flattening of cells that acquire a disc shape when laid onto an agar-
coated slide, ncreasing their diameter by about 0.2 urn (Fig. 2.9).

117
REFERENCES CITED
1. Alexander, M. 1994. Biodegradation and bioremediation. Academic Press. San Diego.
2. Beveridge, T. J., and L. L. Graham. 1991. Surface layers of bacteria. Microbiol. Rev. 55: 684-705.
3. Gerritse, J., V. Renard, T. M. Pedro-Gomes, P. A. Lawson, M. D. Collins, and J. C. Gottschal. 1996. Desulfitobacterium sp. strain PCE1, an anaerobic bacterium that can grow by reductive dechlorination of tetrachloroethene or ortho-chlorinated phenols. Arch. Microbiol. 165: 132-140.
4. Gossett, J. M. 1987. Measurement of Henry's Law constants for Ci and C2 chlorinated hydrocarbons. Environ. Sei. Technol. 21: 202-208.
5. Hinchee, R. E., A. Leeson, and L. Semprini, (ed.). 1995. Bioremediation of Chlorinated Solvents. Battelle Press, Columbus, OH.
6. Hinchee, R. E., and R. F. Olfenbuttel, (ed.). 1991. On-Site Bioreclamation — Processes for Xenobiotic and Hydrocarbon Treatment. Butterworth-Heinemann, Boston.
7. Holliger, C, G. Schraa, A. J. M. Stams, and A. J. B. Zehnder. 1993. A highly purified enrichment culture couples the reductive dechlorination of tetrachloroethene to growth. Appl. Environ. Microbiol. 59: 2991-2997.
8. Krumholz, L. R., R. Sharp, and S. S. Fishbain. 1996. A freshwater anaerobe coupling acetate oxidation to tetrachloroethylene dehalogenation. Appl. Environ. Microbiol. 62: 4108-4113.
9. Maymo-Gatell, X., Y.-t. Chien, J. M. Gossett, and S. H. Zinder. 1997. Isolation of a novel bacterium capable of reductively dechlorinating tetrachloroethene to ethene. Science 276:1468-1471
lO.Maymo-Gatell, X., V. Tandoi, J. M. Gossett, and S. H. Zinder. 1995. Characterization of an H2-utilizing anaerobic enrichment culture that reductively dechlorinates tetrachloroethene to vinyl chloride and ethene in the complete absence of methanogenesis and acetogenesis. Appl. Environ. Microbiol. 61: 3928-3933.
118
11.Neumann, A., H. Scholz-Muramatsu, and G. Diekert. 1994. Tetrachloroethene metabolism of DehalospiriRum midtivorans. Arch Microbiol. 162: 295-301.
12.Razin, S., and E. A. Freundt. 1984. The mycoplasmas, p. 740- 781. In Krieg, N. R. , and J. G. Holt (ed.), Bergey's manual of systematic bacteriology. Williams & Wilkins, Baltimore.
13.Scholz-Muramatsu, H., A. Neumann, M. Messmer, E. Moore, and G. Diekert. 1995. Isolation and characterization of Dehalospirillum multivorans gen nov, sp nov, a tetrachloroethene- utilizing, strictly anaerobic bacterium. Arch. Microbiol. 163: 48- 56.
14.Sharma, P. K., and P. L. McCarty. 1996. Isolation and characterization of a facultatively aerobic bacterium that reductively dehalogenates tetrachloroethene to eis-1,2- dichloroethene. Appl. Environ. Microbiol. 62: 761-765.
15.Sleytr, U. B., and P. Messner. 1992. Crystalline bacterial cell surface layers (S-layers), p. 608. In Encyclopedia of microbiology. Academic Press, Inc.,
16.Sleytr, U. B„ and P. Messner. 1983. Crystalline surface layers on bacteria. Ann. Rev. Microbiol. 37: 311-339.
17.Sleytr, U. B., P. Messner, D. Pum, and M. Sara. 1993. Crystalline bacterial cell surface layers. Molecular Microbiol. 10: 911-916.
18.Tully, J. G. 1992. Mollicutes (Mycoplasmas), p. 181-192. In Lederberg, J. (ed.), Encyclopedia of microbiology. Academic Press, Inc., San Diego.
19.Vogel, T. M., C. S. Criddle, and P. L. McCarty. 1987. Transformations of halogenated aliphatic compounds. Environ. Sei. Technol. 21: 722-736.

CHAPTER FIVE
SUBSTRATE UTILIZATION BY "Dehalococcoides ethenogenes" strain 195
"Just when you though it was safe to go back in the watef
Advertisement for the 1978 ßm Jaws 2.
5.1 ABSTRACT.
A study of the utilization of chlorinated ethenes and 1,2-
dichloroethane (DCA) by "Dehalococcoides ethenogenes" strain 195 is
presented. PCE grown "D. ethenogenes" strain 195 could be readily
transferred into media amended with TCE, cis-DCE, 1,1 -DCE or DCA
as sole electron acceptor. The culture consumed these chlorinated
ethenes and DCA faster with time, indicative of growth on these
compounds. "D. ethenogenes" strain 195 dechlorinated 1,1-DCE faster
than any other compound tested, followed by TCE, PCE, and DCA,
and showed limitation of dechlorination when grown on cis-DCE.
This organism could not be transferred on VC or trans-DCE when
these substances were used as sole electron acceptors, but the culture
could dechlorinate either if given several previous doses of PCE (most
probably through a cometabolic process). Cultures grown on PCE,
TCE, 1,1-DCE or DCA could immediately dechlorinate another of
these chloroethenes, although some combinations proved to be
dechlorinated faster than others.
119

120
5.2 INTRODUCTION.
The isolation and characterization of "Dehalococcoides
ethenogenes" strain 195, a novel eubacterium capable of completely
dechlorinating PCE to ETH, was described in Chapters Three and
Four of this dissertation. This microorganism has a very limited range
of utilizable substrates, is a small pleomorphic coccus with an
optimal growth temperature of 35°C and optimal pH of 6.8 to 7.5 and
lacks a peptidoglycan cell wall, having instead an S-layer type cell
envelope (11 and Chapter Four of this dissertation). "D. ethenogenes"
strain 195 could be transferred indefinitely into H2/PCE medium
supplemented with a mixture (called ABSS) of 2 mM acetate, 0.05
mg/1 vitamin B12, and 25% v/v anaerobic digester sludge supernatant
and 5% v/v 50x concentrated cell extract from a butyrate/PCE
culture (11, 12).
Up to this point, all studies performed on "D. ethenogenes"
strain 195, both in the mixed H2/PCE culture (12) and in the pure
culture (11, Chapter Four of this dissertation), have been
accomplished by amending the medium with only one chloroethene,
PCE, as the primary cell electron (e") acceptor for growth. Countless
transfers of "D. ethenogenes" strain 195 on PCE and past studies (11,
12) have already ascertained the importance and the patterns of
utilization of this molecule by this microorganism. Nevertheless, it is
of environmental significance to compare the utilization of PCE
relative to the utilization of the other chloroethenes by the same
axenic culture. Similar studies were performed on the mixed
methanol/PCE enrichment culture by Tandoi et al (18). In their

121
studies, PCE, TCE, cis-DCE and 1,1-DCE were metabolized to VC
with zero-order kinetics in the high concentration ranges measured,
while trans-DCE and VC were dechlorinated with first-order kinetics.
In addition, it was reported that the culture was also capable of
rapidly dechlorinating 1,2-dichloroethane (DCA) and 1,2-
dibromoethane (DBA).
As described in Chapter One of this dissertation, several other
cultures that reductively dechlorinate PCE have been isolated very
recently, but all these organisms dechlorinate PCE and TCE mainly to
cis-DCE (6, 7, 9, 13, 16, 17). Therefore, there is an inherent lack of
information about how the other DCE isomers and VC are utilized by
pure cultures. In addition, very little is known about the versatility of
these isolates in dechlorinating other chloroaliphatics and to switch
from one chloroethene to another.
In this chapter, a study of the utilization of various chlorinated
ethenes as substrates for dechlorination to ETH by "D. ethenogenes"
strain 195 is presented. Studies on the reductive dechlorination of
DCA by this culture and its relation to chloroethene degradation are
also presented. Dechlorination of cis-DCE and VC will be dealt with
separately in the next two chapters.
5.3 MATERIALS AND METHODS.
5.3.a Chemicals and analyses of chloroethenes.
PCE and other chlorinated ethenes, ETH, H2, and other
chemicals were purchased and utilized as described in Section 2.3.a of

122
this dissertation. DCA was purchased from Aldrich Chemical Co.
(Milwaukee, WI). For quantitative analysis of chloroethenes, DCA and
ETH, gas samples were analyzed using a Perkin Elmer Gas
Chromatograph 8500, as described in Section 3.3.b of this
dissertation.Headspace samples were 100-(il in all cases.
5.3.b Growth medium and culture conditions.
The basal salts medium utilized for "D. ethenogen.es" strain 195
contained the same ingredients and was produced as described in
Chapter Two of this dissertation. This medium received the
amendments described in Chapter Three of this dissertation, with the
addition of 5% v/v extract from the butyrate/PCE culture (prepared as
described in Chapter Three). The antibiotic ampicillin, added at 0.3
(ig/ml to the cultures, was prepared as described in Chapter Three.
Unless otherwise stated, inoculum sizes were 2% v/v, all
incubations were done in duplicate, and each experiment presented
was performed at least twice with similar results. Duplicate tubes
performed very similarly in most of the experiments presented (less
than 5% difference in results for tubes under same conditions), so the
results for some of the experiments are presented for individual tubes.
Cultures were incubated as described in Chapter Two.

123
5.4 RESULTS.
5.4.a Use of PCE, TCE, DCE isomers, VC and DCA as
primary electron acceptors.
Fig. 5.1 shows the results of an experiment in which a culture
of "D. ethenogenes" strain 195 grown on PCE was transferred into sets
of tubes containing, separately, each of the chlorinated ethenes and
DCA as sole e" acceptor sources. 1,1-DCE was dechlorinated faster
than the other substrates (1.3±0.12 mmol VC+ETH produced l"1 day" 1; days 5-6.5). TCE and PCE were dechlorinated at similar rates
(0.93±0.08 mmol VC+ETH l"1 day"1 for TCE; days 6-7.5; and
0.89±0.055 mmol VC+ETH l'1 day'1 for PCE; days 6.5-8), which were
a little higher than the one for DCA dechlorination (0.64+0.05 mmol
ETH l1 day-1; days 5-6.5), a process which produced very little VC
(about 0.019 mmol/1 in 6.5 days; data not shown). cis-DCE was
dechlorinated more slowly than the above mentioned substrates
(0.056±0.03 mmol VC l'1 day1; days 6.5-8). As seen also in Fig. 5.2,
VC and trans-DCE were dechlorinated to a very small extent with no
rate increase. trans-DCE produced 0.019 mmol/1 of VC in 14 days
from an initial dose of 0.32 mmol/1 of trans-DCE. No ETH was
produced from trans-DCE. VC produced 0.0085 mmol/1 of ETH in 14
days from an initial dose of 0.35 mmol/1 of VC.
In Fig. 5.1, cultures grown with PCE, TCE, and 1,1-DCE were
not fed for two days after their second chloroethene dose had been
consumed, to observe ETH production (data not shown), hence the
lack of net VC production during that time. Cultures that didn't have

124
3-i
•S 2- o £ 6
•a g
g
ETH+VC from PCE ETH+VC from TCE VC from cis-DCE VC from trans-DCE
ETH+VC from 1,1 -DCE
ETH from VC ETH from DCA
Time (Day)
FIGURE 5.1 Product (ETH and/or VC) formation by "D. ethenogenes" strain 195 grown with PCE and inoculated into medium containing the next substrates, tested separately (in parenthesis are shown the total amounts of substrate consumed by the cultures, in mmol/1): PCE (2.5); TCE (2.5); cis-DCE (0.67); trans-DCE (0.07); 1,1-DCE (2.85); VC (0.17); and DCA (1.8).

125
0.02 -i
j-. 0.015-
'S
I
ETH from VC
VC from trans-DCE
6 8
Time (Day)
r 12 14
FIGURE 5.2. Amounts ETH and VC produced from VC and trans-DCE (respectively) in the experiment depicted in Fig. 5.1.
126
substrate withheld for two days were the ones amended with: DCA,
which produced almost exclusively ETH; cis-DCE, which did not
finish their second chloroethene dose; and trcms-DCE and VC, which
did not finish their first chloroethene dose.
5.4.b PCE metabolism to ETH. Intermediate formation.
Fig. 5.3 (a) shows the results of an experiment in which a high
initial dose of PCE (0.7 mmol/1) was administered to tubes that had
been inoculated with a culture that was very actively dechlorinating
PCE to VC and ETH. As it has been shown previously, PCE was
converted mainly to VC, and VC conversion to ETH occurred after
PCE depletion. Fig. 5.3 (b) shows, with greater sensitivity, the
sequence and magnitude in which these intermediates were
accumulated. TCE was present within 2 hours of inoculation and was
produced before any DCE isomer. Then, cis-DCE, 1,1 -DCE and trcms-
DCE appeared in that order before 15 hours had elapsed. Once PCE
had been consumed at about 72 hours, the intermediates rapidly
disappeared, except trcms-DCE, which persisted for the duration of
the experiment.
5.4.C TCE metabolism to ETH-intermediate formation.
"D. ethenogenes" strain 195 was able to grow with TCE as sole e-
acceptor (Fig. 5.1) and could be transferred on the same substrate
without showing any acclimation phase, as it can be seen in Fig. 5.4.
The sequence and magnitude of the intermediates formed from an
initial dose of TCE (0.35 mmol/1) added to a culture of "D.

127
0.8-,
40 60 -fir 1 1 T r
80 100 120 140 160 180 200
cis-DCE
trans-DCE
1,1 -DCE
A— TCE
0 20 40 -i—■—i
60 80 100 120 140 160 180 200
Time (hour)
FIGURE 5.3 (a) Product formation by "D. ethenogenes" strain 195 in medium to which one high dose of PCE (0.7 mmol/1) was added, (b) Sequence and magnitude in which the intermediate products of PCE metabolism were produced and depleted by the same culture.

128
o s s
£
CO <u e
+-> <u
Ö •c o 2 ü
0 2 3 4
Time (Day)
FIGURE 5.4 Product formation by "D. ethenogenes" strain 195 after being transferred on TCE as sole electron acceptor for a second time. The graph shows the first three TCE feedings to the culture.
129
ethenogenes" strain 195 is shown in Fig. 5.5. cis-DCE was also
produced before the other two DCE isomers. While trans-DCE and
1,1 -DCE accumulated to similar levels than in Fig. 5.3, cis-DCE
accumulated to much higher levels (about 7 times higher than that
produced in Fig. 5.3). trans-DCE, once produced, persisted again for
the duration of the experiment. As in Fig. 5.3, the decrease in the
amount of trans-DCE over time was consistent with the amount of
any DCE isomer that was normally lost by absorption/diffusion
in/through the stopper (data not shown).
An experiment was performed to test the ability of "D.
ethenogenes" strain 195 to dechlorinate PCE after having consumed
several doses of TCE as sole e~ acceptor. TCE is an intermediate in
the PCE dechlorination pathway to ETH, but PCE is not an
intermediate in TCE dechlorination, and it was possible that TCE-
grown cells could not have the ability to use PCE. At day 8, the
culture grown on TCE from Fig. 5.1 was transferred and fed again
with TCE, three consecutive doses (0.3, 0.5 and 0.7 mmol/1 TCE). Fig.
5.6 shows the results of the fourth dose, which was of TCE in (a) and
PCE in (b). After a total of 14 days and seven TCE doses administered,
the culture was able to use PCE without any acclimation phase.
During the fourth dose, the rates of product formation were 1.08±0.10
mmol l"1 day1 for PCE and 0.81±0.06 mmol l"1 day1 for TCE.
5.4.d 1,1-DCE utilization.
"D. ethenogenes" strain 195 was able to dechlorinate 1,1-DCE as
sole e" acceptor at a high rate (Fig. 5.1) and could be transferred on
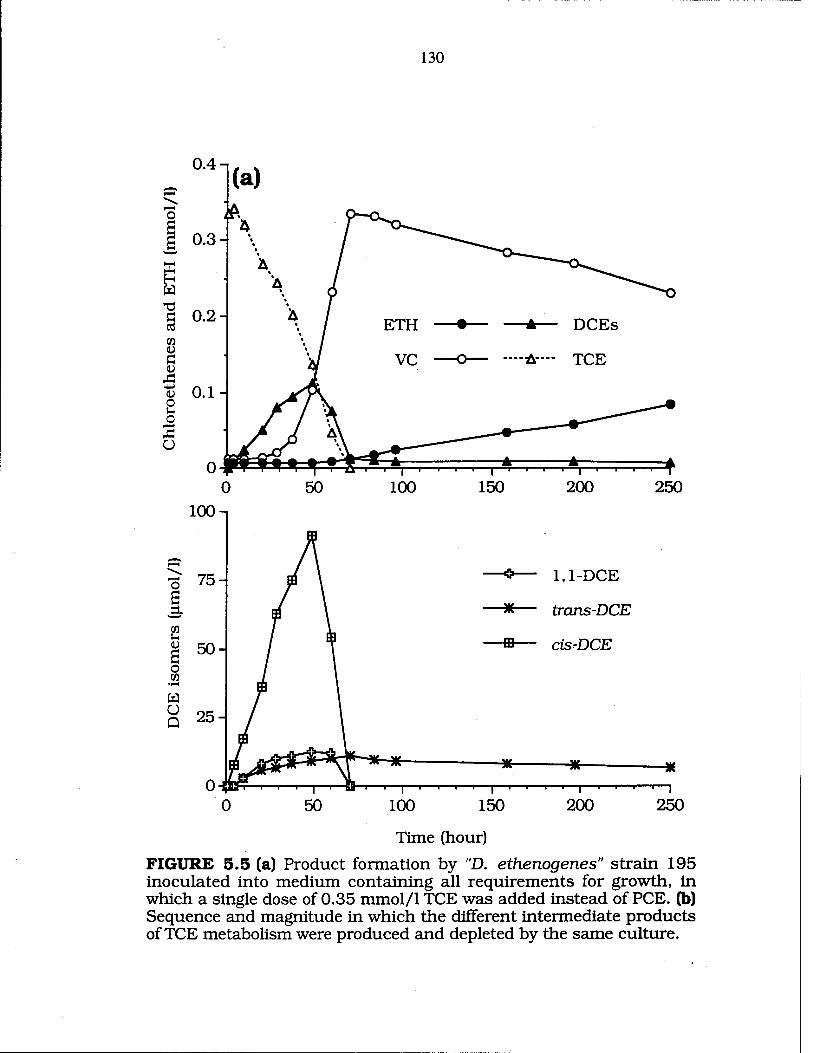
130
0.4 -i
250
1,1 -DCE
trans-DCE
ffl— cisrDCE
250
Time (hour)
FIGURE 5.5 (a) Product formation by "D. ethenogenes" strain 195 inoculated into medium containing all requirements for growth, in which a single dose of 0.35 mmol/1 TCE was added instead of PCE. (b) Sequence and magnitude in which the different intermediate products of TCE metabolism were produced and depleted by the same culture.

131
6.5 Time (Day)
7 6 6.5
Time (Day)
FIGURE 5.6 TCE (a) and PCE (b) disappearance and product formation by "D. eth.enogen.es" strain 195. Cultures were grown and transferred with TCE as sole electron donor. After being transferred, in both experiments {(a) and (b)} TCE was fed three consecutive times (0.3, 0.5 and 0.7 mmol/1). The fourth feedings {TCE in (a) and PCE in (b)} are the ones shown in this figure.

132
the same substrate without showing any acclimation phase (Fig. 5.7).
An experiment was performed to test the ability of 1,1-DCE-
grown "D. ethenogenes" strain 195 to dechlorinate chlorinated ethenes
with the same or higher number of chlorines (except trans-DCE). At
day 6, the culture grown on 1,1-DCE from Fig. 5.1 was transferred
and fed again with 1,1-DCE, three consecutive doses (0.3, 0.5 and 0.7
mmol/1). Fig. 5.8 shows the results of the fourth dose, which was of
1,1-DCE in (a), PCE in (b), TCE in (c) and cis-DCE in (d). After 11
days and seven 1,1-DCE doses administered, the culture was able to
switch to the other chlorinated ethenes tested without any
acclimation phase. During days 5 to 5.5, PCE was dechlorinated at
0.63±0.07 mmol l'1 day"1 and TCE at 0.71±0.06 mmol H day"1. The
rates for 1,1-DCE (0.80±0.085 mmol l"1 day'1) and cis-DCE
(0.84±0.04 mmol l"1 day-1) were very similar.
5.4.e trans-DCE utilization.
The results shown in Fig. 5.9 corroborate the findings of Figs.
5.3 and 5.4, in which trans-DCE, once produced by the culture, was
not dechlorinated to any significant extent. The culture utilized for
this experiment was a unusually slow growing culture, a factor that
helped to see more clearly this effect (the reason for the slow down in
the activity of this culture will be hypothesized in Appendix A of this
dissertation). During the time that PCE was absent from the medium
(days 12 to 13 and from day 15 onwards), the culture was able to
dechlorinate all the accumulated intermediates, except trans-DCE, to
VC and ETH (data not shown for VC and ETH), reaffirming the

133
Time (Day)
FIGURE 5.7 Product formation by "D. eth.enogen.es" strain 195 after being transferred on 1,1 -DCE a second time as sole e" acceptor. The graph shows the first three 1,1 -DCE feedings to the culture.

134
2.3 0.7
5.5 Time (Day) Time (Day)
FIGURE 5.8 1,1 -DCE (a), PCE (b), TCE (c) and cis-DCE (d) disappearance and product formation in cultures of "D. ethenogenes" strain 195 transferred with 1,1-DCE as sole electron acceptor. In all experiments, 1,1-DCE was fed in three consecutive doses (0.3, 0.5 and 0.7 mmol/1). The fourth doses {0.5 mmol/1 of 1,1-DCE in (a), PCE in (b), TCE in (c) and cis-DCE in (d)} are the ones shown.

135
0.03 CO
Q 0.02-
0 6 8 10 12
Time (day)
18 20
FIGURE 5.9 DCE isomers and TCE produced and consumed by a slow- growing culture of "D. ethenogenes" strain 195. PCE was absent at days 12 to 13 and from day 15 onwards. PCE, VC and ETH have not been plotted for clarity.

136
inability of "D. ethenogen.es" strain 195 to effectively dechlorinate
trans-DCE, even though this compound was produced by the culture.
The recalcitrance of trans-DCE could be due to the inability of
the culture to reductively dechlorinate this molecule or to the
impossibility of "D. ethenogenes" strain 195 to obtain energy for
growth from trans-DCE. The results of Fig. 5.10 (a) show that, when a
culture was fed three consecutive PCE doses, a fourth high dose of
trans-DCE (0.35 mmol/1) was dechlorinated to 0.015 mmol/1 in 5.5
days. The dechlorination rate (measured as ETH production) for the
first 1.5 days was of 0.092 mmol H day-1, which decreased to 0.027
mmol H day-1 in the next 2.5 days, and to 0.010 mmol 1_1 day-1 in
the final 1.5 days. Fig. 5.11 depicts a semilogarithmic plot of trans-
DCE disappearance produced from the values obtained in Fig. 5.10
(a). The plot yielded a straight line (r2 = 0.996), indicating first-order
kinetics and an estimated half-life of 28.8 hours. When the culture
was autoclaved at day 5, no trans-DCE dechlorination was effected
{Fig. 5.10(b)}.
An interesting aspect derived from the results shown in Fig.
5.10 (a) is that trans-DCE did not inhibit ETH production from VC,
as the other chlorinated ethenes did (data shown in Chapter Seven).
Also, the rates of ETH formation from VC seemed to be similar to the
rates of VC formation from trans-DCE. This produced the effect that
trans-DCE seemed to be transformed directly to ETH when, most
probably, trans-DCE was dechlorinated to VC, and then to ETH.

137
o
I U
V C
2 o
O
o
I U
m <u Ö u
o O
O
10 11
Time (Day) Figure 5.10 (a) Effect on product formation after adding a dose (0.35 mmol/1) of trans-DCE after feeding the culture with three consecutive doses of PCE (0.3, 0.5 and 0.7 mmol/1). (b) Same conditions as in (a), but here the cultures were autoclaved at day 5.
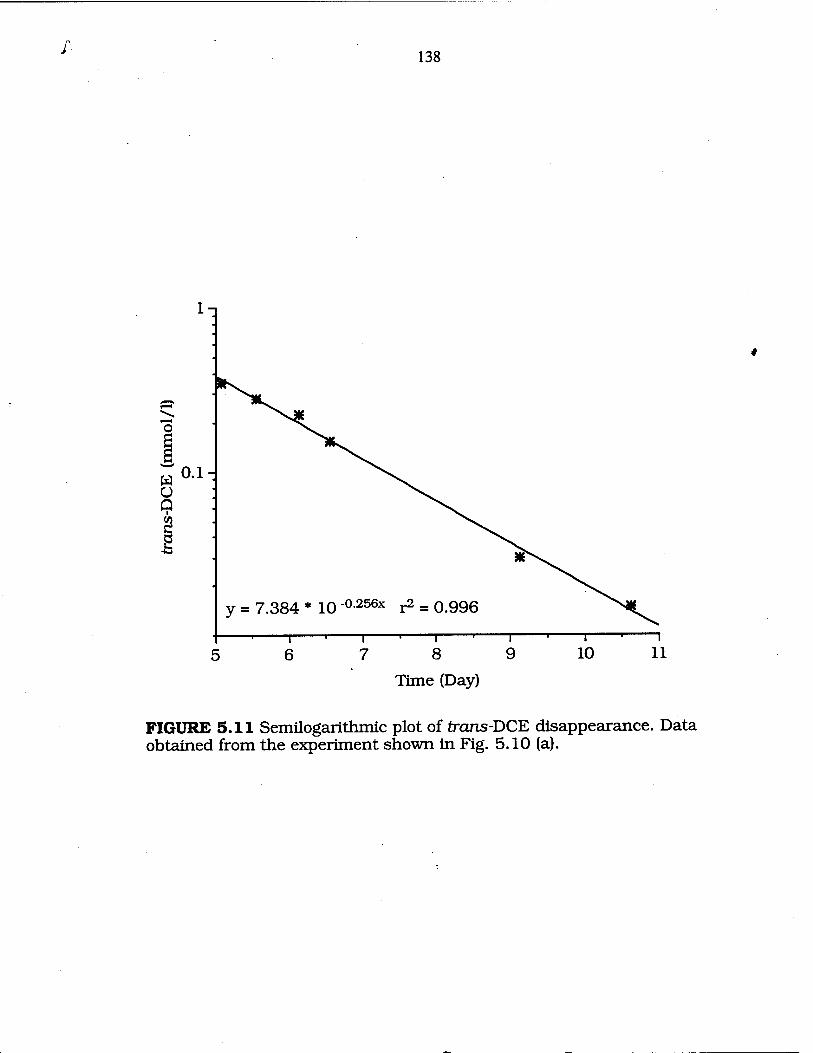
/ 138
l-i
o s £ o Q
0.1-
y = 7.384 * 10 "°-256x r2 = 0.996
T" 6
T 7
_, , r-
8
Time (Day)
T 9
—r- 10
-1 11
FIGURE 5.11 Semilogarithmic plot of trans-DCE disappearance. Data obtained from the experiment shown in Fig. 5.10 (a).

139
5.4.f DCA utilization.
"D. ethenogenes" strain 195 was able to dechlorinate DCA as
sole e- acceptor (Fig. 5.1) and could be transferred on the same
substrate without showing any acclimation phase. Fig. 5.12 shows
the almost complete dechlorination of DCA to ETH by a culture of "D.
ethenogenes" strain 195 that had been growing on DCA as the sole e"
acceptor for 16 days. This culture had consumed eight DCA doses and
it had been successfully transferred twice before this experiment was
initiated. DCA was used at an increasing rate. VC production from
DCA was about 1.3% of the ETH production, with the relative
amounts remaining constant throughout the incubation.
An experiment was performed to test the ability of this
organism to dechlorinate the chloroethenes (except VC and trans-
DCE) after having consumed several doses of DCA as sole e- acceptor.
At day 7, the culture grown on DCA from Fig. 5.1 was transferred and
fed with three consecutive doses (0.3, 0.5 and 0.7 mmol/1) of DCA.
Fig. 5.13 shows the results of the fourth doses, which were of DCA in
(a), PCE in (b), TCE in (c), cis-DCE in (d) and 1,1-DCE in (e). After a
total of 14 days and seven DCA doses administered, the culture was
able to switch to the other chlorinated ethenes tested without any
acclimation phase. During the first 12 hours of the fourth doses, the
rate of product formation (in mmol 1_1 day-1) were: from DCA
0.78±0.06; from PCE 0.61+0.08; from TCE 0.84±0.05; from cis-DCE
0.48±0.03; and from 1,1-DCE 0.48±0.05.
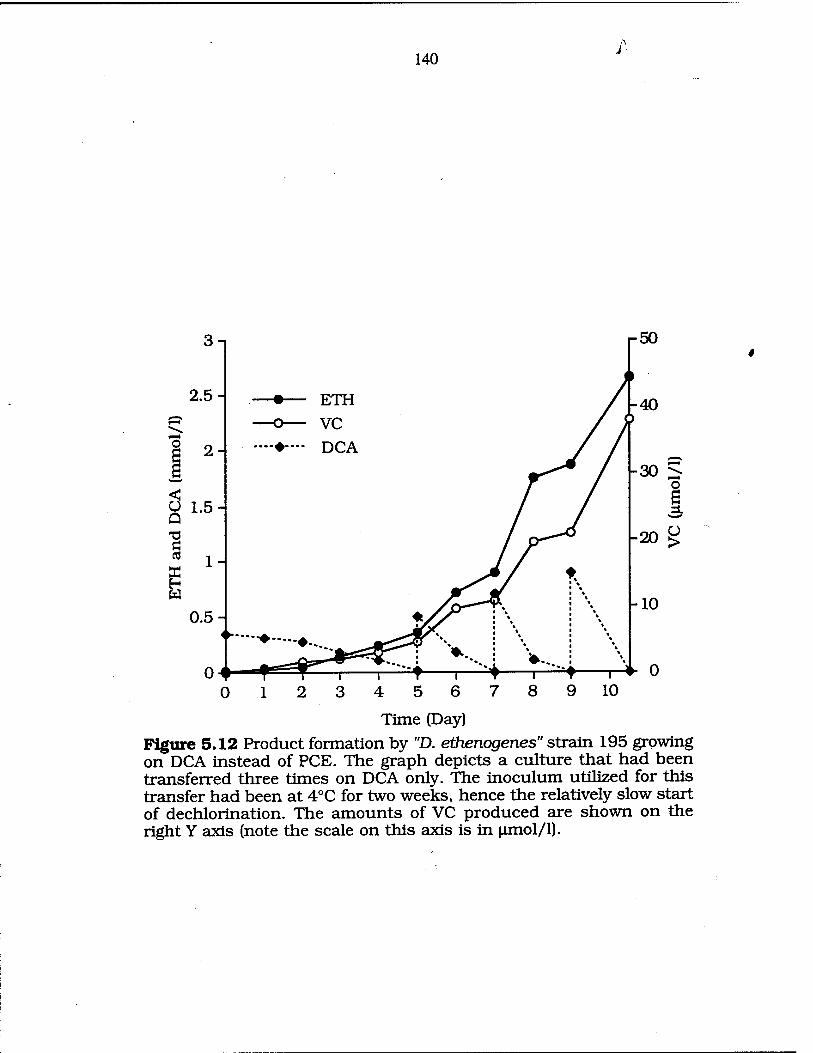
140 /■
Time (Day) Figure 5.12 Product formation by "D. ethenogenes" strain 195 growing on DCA instead of PCE. The graph depicts a culture that had been transferred three times on DCA only. The inoculum utilized for this transfer had been at 4°C for two weeks, hence the relatively slow start of dechlorination. The amounts of VC produced are shown on the right Y axis (note the scale on this axis is in nmol/1).

141
Iß 00 lOlß 00 1T51T5
Time (Day) °° ^ Time (Day) Time (Day) 1.4
ü 00
in oo in in co iß IN oö i^ ™. « > ®
Time (Day) Time (Day)
FIGURE 5.13 DCA (a), PCE (b), TCE (c), cis-DCE (d), and 1,1-DCE (e) disappearance and product formation in cultures transferred with DCA as sole e~ acceptor. In all experiments DCA was fed 3 times (0.3, 0.5 and 0.7 mmol/1). The fourth feedings {0.5 mmol/1 DCA in (a); PCE in (b); TCE in (c); cis-DCE in (d); 1,1-DCE in (e)} are the ones shown.

142
5.5 DISCUSSION.
The comparison between the utilization patterns and rates of
degradation of chloroethenes by "D. ethenogenes" strain 195 and the
ability of this organism to switch from dechlorinating one
chloroethene to another is of environmental relevance. This is so,
both because of the inherent importance of an organism that is
capable of complete PCE reduction, but also because more knowledge
has to be accrued regarding how an ongoing biodegradation process
will behave in answer to unpredicted changes in chloroethene type
predominance and/or accumulation.
The PCE dechlorination pattern of Fig. 5.3 is congruent with
PCE dechlorination to TCE with conversion of TCE primarily to cis-
DCE, which was the first product to appear after TCE appearance.
However, 1,1-DCE appeared soon afterwards and accumulated to
amounts one-half to two-thirds of the amount of cis-DCE. Thus, we
cannot rule out 1,1-DCE being a significant intermediate in TCE
conversion to VC. trans -DCE accumulated slowly and was reduced
even more slowly, if at all, suggesting that it represents only a small
portion of substrate flow.
In earlier studies (18), it was shown that the mixed culture
containing "D. ethenogenes" strain 195 could use all of the chlorinated
ethenes as well as dichloroethane. However, that experiment simply
asked whether pre-grown cultures were able to metabolize a dose of
these compounds. It was of interest to examine whether "D.
ethenogenes" strain 195 could grow on these compounds, and, if so, if
the culture was still able to metabolize PCE, since it is possible that

143
cultures grown on less chlorinated ethenes, such as DCEs, might not
be able to use a more chlorinated one.
"D. ethenogenes" strain 195 was capable of readily utilizing PCE,
TCE, 1,1 -DCE and DCA as sole e" acceptors for growth,
dechlorinating them to VC and ETH. cis-DCE could also serve as
growth substrate, although it was utilized at a much lower rate than
the other chlorinated ethenes and DCA. According to Fig. 5.1, the
sequence in which the different chlorinated molecules were degraded
as e" acceptors, from faster to slower, was: 1,1-
DCE>TCE>PCE>DCA»cis-DCE»trans-DCE=VC=0. However, if these
same dechlorination processes are calculated per e" basis (number of
e~ pairs reduced in each molecule), the order in which these
substrates were dechlorinated, starting with the best, is changed:
PCE>TCE>l,l-DCE>DCA»cis-DCE>»trans-DCE=VC«0. DCE dechlo
rination to VC only involves a single e" pair while PCE and TCE
conversion to VC requires three and two e" pairs respectively (and,
theoretically, provides three and two times as much energy per VC
produced). The fact that the rates of dechlorination of cis-DCE to VC
and ETH drastically increased when a culture utilized this substrate
as sole e" acceptor after growing on 1,1-DCE or TCE implied a need
for more studies on the distinctive behavior of cis-DCE. The
particulars of cis-DCE dechlorination are described in Chapter Six of
this dissertation.
"D. ethenogenes" strain 195 could not utilize VC or trcms-DCE
as growth substrates. Nevertheless, very slow, first-order trans-DCE
dechlorination to VC and VC dechlorination to ETH occurred. In

144
other similar experiments the persistence of trans-DCE was repeatedly
detected in the culture, which may explain the early result of
Freedman and Gossett (5) on the methanol/PCE mixed culture in
which trans-DCE was detected. The results in Fig. 5.10 indicated the
ability of "D. ethenogenes" strain 195 to dechlorinate high
concentrations of trans-DCE if a suitable substrate like PCE was
previously administered as an e" acceptor to built up biomass (which
was also observed for VC; see Fig. 3.9 and Chapter Seven). This
pattern of utilization of trans-DCE by "D. ethenogenes" strain 195
seems to be typical of a cometabolic process, in which no energy is
obtained from the compound, but the molecule in question is
dechlorinated when a suitable growth substrate is utilized. The facts
that the rates of trans-DCE disappearance diminished with time
(first-order kinetics) when PCE was not present (Fig. 5.10) and that
there was no increase in the rates of product formation from trans-
DCE (Fig. 5.1) reinforce the view that trans-DCE dechlorination is,
most probably, cometabolic.
An interesting observation from the experiment in Fig. 5.10 (a)
is that, contrary to the effect of PCE (11, 12), trans-DCE
dechlorination did not inhibit ETH formation from VC, which is in
accordance with the results found for the mixed enrichment culture
byTandoietaL (18).
The reason why VC and trans-DCE are not utilized as energy
sources is not known. A characteristic shared by both molecules is
that they lack adjacent chlorines. This factor could be of importance
/■
^ 145
in regard to the active sites of dehalogenating enzymes, but very little
is presently known about these dehalogenases (4, 8, 14, 15).
VC and trans-DCE are both dechlorinated similarly by "D.
ethenogenes" strain 195, but because trans-DCE is not an
intermediate that accumulates to high levels, its role into the overall
pathway is of limited importance. Instead, VC plays a fundamental
role in the dechlorination of PCE to ETH, where it is the main
intermediate accumulated by "D. ethenogenes" strain 195. The last
step of dechlorination, VC to ETH, is still the limiting reaction to the
full reduction of PCE, in accordance with previous results (11, 12).
This is in contrast to what it is found in all other studies reported (2,
3, 6, 7, 9, 10, 16, 17). In depth studies regarding VC dechlorination to
ETH by "D. ethenogenes" strain 195 are described in Chapter Seven.
Experience accrued from more than one hundred transfers of
"D. ethenogenes" strain 195 with PCE as sole e- acceptor signaled to
the fact that a high first dose of PCE limited the ability of a new
transfer to dechlorinate PCE. The gradual inhibition by PCE of the
culture's dechlorinating activity at increasingly high concentrations,
or the saturation of the dehalogenating enzyme/s responsible for the
overall pathway are potential explanations for this phenomenon. The
accumulation of much more cis-DCE in cultures utilizing TCE as the
direct e" acceptor instead of PCE (Fig. 5.5) could be explained by TCE
being present in far higher concentration in Fig. 5.5 than in Fig. 5.3,
combined with the fact that TCE is the immediate precursor of cis-
DCE.

^146
"D. ethenogenes" strain 195 transferred to TCE, 1,1 -DCE or DCA
as sole e- acceptors could be successfully transferred again on these
substrates, indicating growth on these compounds. After the culture
had consumed several doses of PCE, TCE, 1,1-DCE or DCA, "D.
ethenogenes" strain 195 was able to immediately switch to a different
chloroaliphatic with an equal or greater number of chlorines,
dechlorinating them all to VC and ETH. The relative rates of
chloroethene degradation were different for the same compound
depending on the combination of chloroethenes used (Table 5.1;
results for eis -DCE will be analized in the next chapter). If the new
chloroethene had the same number of chlorines than the one the
culture had been utilizing for some time, the initial rates of
dechlorination of both compounds were similar (i.e. Fig. 5.8). At the
same time, newly added substrates with one or two chlorines more
than the chloroethene the culture had been utilizing for some time
were initially dechlorinated more slowly, with the exception of TCE to
PCE. The rate values obtained in the studies performed on DCA (Fig.
5.13) show the same patterns of relative dechlorination rates among
chloroethenes as have been described above. A difference with past
studies (18) is that a very small but significant amount of VC was
accumulated by "D. ethenogenes" strain 195.

'
TABLE 5.1 Relative rates of chloroaliphatic degradation, in percentages (%). After the culture had consumed several doses of a particular chloroaliphatic (shown as "growth substrate"), a different substrate was added to determine the potential for dechlorination of the new compound by the culture (values come from the relative rates obtained in this chapter, except the ones for cis-DCE when ustilized as "growth substrate", which come from Chapter Six).
Relative rates of substrate utilization
Growth Substrate PCE TCE cis-DCE 1,1 -DCE DCA
TCE 133 100
cis-DCE 0 39.1 100 117.4
1,1-DCE 78.7 88.7 105 100
DCA 78.2 107.7 61.5 61.5 100

148
REFERENCES
l.Balch, W. E., G. E. Fox, L. J. Magrum, C. R. Woese, and R. S. Wolfe. 1979. Methanogens: Reevaluation of a unique biological group. Microbiol. Rev. 43:260-296.
2.Beeman, R. E., J. E. Howell, S. H. Shoemaker, E. A. Salazar, and J. R. Buttram. 1993. A field evaluation of in situ microbial reductive dehalogenation by the biotransformation of chlorinated ethenes, p. 14-27. In R. E. Hinchee, A. Leeson, L. Semprini, and S. K. Ong (ed.), Bioremediation of chlorinated and polycyclic aromatic hydrocarbon compounds. Lewis Publishers.
3.de Bruin, W. P., M. J. J. Kotterman, M. A. Posthumus, G. Schraa, and A. J. B. Zehnder. 1992. Complete biological reductive transformation of tetrachloroethylene to ethane. Appl. Environ. Microbiol. 58:1996-2000.
4Fetzner, S., and F. Lingens. 1994. Bacterial dehalogenases: biochemistry, genetics and biotechnological applications. Microbiol. Rev. 58(4):641-685.
5.Freedman, D. L., and J. M. Gossett. 1989. Biological reductive dechlorination of PCE and TCE to ethylene under methanogenic conditions. Appl. Environ. Microbiol. 55(9):2144-2151.
6.Gerritse, J., V. Renard, T. M. Pedro-Gomes, P. A Lawson, M. D. Collins, and J. C. Gottschal. 1996. DesüLßtobacterium sp. strain PCE1, an anaerobic bacterium that can grow by reductive dechlorination of tetrachloroethene or ortho-chlorinated phenols. Arch. Microbiol. 165:132-140.
7.Holliger, C, G. Schraa, A. J. M. Stams, and A. J. B. Zehnder. 1993. A highly purified enrichment culture couples the reductive dechlorination of tetrachloroethene to growth. Appl. Environ. Microbiol. 59:2991-2997.
8Janssen, D. B., F. Pries, and J. R. van der Ploeg. 1994. Genetics and biochemistry of dehalogenating en2ymes. Annu. Rev. Microbiol. 48:163-191.
9.Krumholz, L. R., R. Sharp, and S. S. Fishbain. 1996. A freshwater anaerobe coupling acetate oxidation to PCE dehalogenation. Appl. Environ. Microbiol. 62:4108-4113.

149
lO.Major, D. W., E. W. Hodgins, and B. J. Butler. 1991. Field and laboratory evidence of in situ biotransformation of PCE to ethene and ethane at a chemical transfer facility in north Toronto, p. 113- 133. In R. E. Hinchee and R. F. Olfenbuttel (ed.), On-Site Bioreclamation. Butterworth-Heinemann, Boston.
ll.Maymo-Gatell, X., Y.-t. Chien, J. M. Gossett, and S. H. Zinder. 1997. Isolation of a novel bacterium capable of reductively dechlorinating tetrachloroethene to ethene. Science 276:1468- 1471.
12.Maymo-Gatell, X., V. Tandoi, J. M. Gossett, and S. H. Zinder. 1995. Characterization of an H2-utilizing anaerobic enrichment culture that reductively dechlorinates tetrachloroethene to vinyl chloride and ethene in the complete absence of methanogenesis and acetogenesis. Appl. Environ. Microbiol. 61:3928-3933.
13.Neumann, A.. H. Scholz-Muramatsu, and G. Diekert. 1994. Tetrachloroethene metabolism of Dehalospirillwn multivorans. Arch Microbiol. 162(4) :295-301.
14.Neumann, A., G. Wohlfarth, and G. Diekert. 1996. Purification and characterization of PCE reductive dehalogenase from DehaktspiMummuliworons. J. Biol. Chem. 271(28): 16515-16519.
15.Ni, S., J. K. Fredrickson, and L. Xun. 1995. Purification and characterization of a novel 3-chlorobenzoate-reductive dehalogenase from the cytoplasmic membrane of Desulfomonile tiedjei DCB-1. J. Bacteriol. 177(17):5135-5139.
16.Scholz-Muramatsu, H., A. Neumann, M. Messmer, E. Moore, and G. Diekert. 1995. Isolation and characterization of Dehalospirillum multivorans gen nov, sp nov, a tetrachloroethene- utilizing, strictly anaerobic bacterium. Arch. Microbiol. 163(1) :48- 56.
17.Sharma, P. K., and P. L. McCarty. 1996. Isolation and characterization of a facultatively aerobic bacterium that reductively dehalogenates tetrachloroethene to eis-1,2- dichloroethene. Appl. Environ. Microbiol. 62(3):761-765.
18.Tandoi, V., T. D. DiStefano, P. A. Bowser, J. M. Gossett, and S. H. Zinder. 1994. Reductive dehalogenation of chlorinated ethenes and halogenated ethanes by a high-rate anaerobic enrichment culture. Environ. Sei. Technol. 28:973-979.

/
CHAPTER SIX
REDUCTIVE DECHLORINATION OF cis-DCE BY "Dehalococcoides ethenogenes" strain 195
"Tm not young enough to know everything"
SirJ.M. Barrie 1860-1937 The admirable Crichton (performed 1902, pubd. 1914) act 1
6.1 ABSTRACT.
cis-DCE is a substrate of environmental significance because it
often accumulates in contaminated aquifers in which PCE or TCE
undergo reductive dechlorination. "Dehalococcoides ethenogenes" strain
195 consumed increasing doses of cis-DCE at increasing rates over
time, indicative of growth on this compound. Doses of cis-DCE above
0.2 mmol/1 at the time of inoculation (2% v/v inoculum) were toxic to
the culture. After growing with cis-DCE, "D. ethenogenes" strain 195
could utilize TCE, 1,1 -DCE or DCA, and these substrates, together
with cis-DCE, could be freely interchanged as sole electron acceptors,
although some combinations were dechlorinated faster than others.
After cells had grown with cis-DCE, PCE could only be dechlorinated if
an alternate substrate, such as 1,1-DCE, was dechlorinated before
adding any PCE and after cis-DCE had been consumed; or if PCE and
cis-DCE were fed together at the time of inoculation. Though not
completely understood, utilizing cis-DCE as the sole electron acceptor
effects an inhibitory and/or repressive action on PCE dechlorination.
150

151
6.2 INTRODUCTION.
cis-DCE is an environmentally significant product of PCE
dechlorination. This is a compound frequently found (accumulated) in
contaminated sites (2, 7) and very little is known not only about the
dynamics of cis-DCE degradation in the environment, and also in the
laboratory. As introduced in Chapter Five of this dissertation, several
pure cultures have been described that reductively dechlorinate PCE
and TCE to mainly cis-DCE (3-5, 8-10). There is, then, little known
information about how cis-DCE is utilized by pure cultures. This
knowledge is fundamental to complement an understanding of the
processes that lead to cis-DCE accumulation in contaminated sites.
In Chapter Five of this dissertation it was determined that cis-
DCE, although used as growth substrate, was utilized at a slower rate
than the other electron (e") acceptors. This instigated a deeper look
into the dynamics of cis-DCE reductive dechlorination by "D.
ethenogenes" strain 195 when utilized as sole e~ acceptor. This chapter
presents the results obtained.
6.3 MATERIALS AND METHODS.
6.3.a Chemicals and analyses of chloroethenes.
PCE, cis-DCE, H2, and other chemicals were purchased and
utilized as described in point 2.3.a of Chapter Two.
For quantitative analysis of chloroethenes and ETH, 100-JJ.I,
headspace samples were analyzed using a Perkin Elmer Gas
Chromatograph 8500, as described in point 3.3.b in Chapter Three of

^ 152
this dissertation.
6.3.b Growth medium and culture conditions.
The basal salts medium utilized for "D. ethenogenes" strain 195
contained the same ingredients as described in Chapter Two of this
dissertation. The protocol followed to produce this basal salts
medium, previous to the addition of the amendments, was also
followed as described in Chapter Two. This medium received the
following sterile and anaerobic additions before inoculation (final
medium volume « 10 ml/tube): Na2S-9H20, 2 mM (added last);
NaHCC-3, 12 mM (added first); the ABSS amendments {filter-sterilized
anaerobic digestor sludge supernatant (SS; prepared as described in
Chapter Two)), 25% v/v; sodium acetate, 2 mM; and vitamin solution
(1) concentrated 10-fold, 0.5% v/v}; and 5% v/v extract from the
Butyrate/PCE culture (prepared as described in Chapter Three). The
antibiotic ampicillin, added at 0.3 fig/ml to the cultures, was prepared
as described in Chapter Three.
Unless otherwise stated, inoculum sizes were 2% v/v, all
incubations were done in duplicate, and each experiment presented
was performed at least twice with similar results. Duplicate tubes
performed similarly in most of the experiments presented (less than
5% difference in results for tubes under same conditions). Cultures
were incubated upside down in the dark as described in Chapter Two.

153
6.4 RESULTS.
6.4.a Effect of cis-DCE concentration on dechlorination.
Fig. 6.1 (a) and (b) show the formation of products from cis-DCE
when utilized as sole e- acceptor by a culture of "D. ethenogenes" strain
195. As shown in Fig. 6.1, (a) the organism was able to dechlorinate
cis-DCE added at standard amounts for PCE dechlorination (0.3, 0.5
and 0.7 mmol/1 cis-DCE) almost exclusively to VC. Nevertheless,
dechlorination rates, in accordance with similar results obtained in
Fig. 5.1, were slower than the ones obtained previously from PCE, TCE
or 1,1-DCE (Chapter Five). The culture dechlorinated the 0.5 mmol/1
dose of cis-DCE faster than the first, but a third dose of 0.7 mmol/1
cis-DCE was not completely dechlorinated even after 8.5 days. It was
observed in subsequent experiments (data not shown) that cis-DCE
concentrations above 0.5-0.6 mmol/1 were inhibitory to the culture.
When the initial amount of cis-DCE added as sole e" acceptor to
the same culture was reduced by 50% to ca. 0.15 mmol/1 {Fig. 6.1 (b)},
this initial dose was dechlorinated 15% faster, as measured by VC
accumulation, than the data in Fig. 6.1 (a) predicted. The overall
performance of the culture was also better; after 8.5 days from the
start of the experiments, the culture in Fig. 6.1 (b) produced a total of
0.92 mmol/1 VC against the 0.52 mmol/1 VC produced by the culture
in Fig. 6.1 (a). In both experiments, cis-DCE was dechlorinated faster
with time, indicative of growth of the culture on this compound. The
maximum rate of dechlorination of cis-DCE, while being utilized as a
growth substrate, was 0.25±0.05 mmol/l.day {corresponding to data
from Fig. 6.1 (b)}. ETH was not produced from VC in the presence of

154
1.25 -i
o
I S 0.75 -
u Ö D
+J
2 s
0.5-
0.25-
T—T—r—T—r 0 1 2 3 4 5 6 7 8 9 10 11 12 13 14 15 16 17
125>)
0 f » f f f |lf 12 3 4 5 6 7
T 1 1 1 T I-
8 9 10 11 12 13 14 15 16 17
Time (Day) FIGURE 6.1 Effects of different amounts of cis-DCE added as sole electron acceptor to cultures transferred into medium with all requirements for growth present. The doses of cis-DCE added to the culture were: (a) 0.3, 0.5 and 0.7 mmol/1 and (b) 0.15, 0.25, 0.35 and 0.50 mmol/1.

/■ 155
cis-DCE and, as seen in Fig. 6.1 (b) it was only produced to limited
amounts once cis-DCE had been depleted. Cultures grown on cis-DCE
could be successfully transferred on the same substrate indefinitely.
Fig. 6.2 shows the result of feeding cis-DCE to a culture that
had been allowed to reach maximum cell density (see Fig. 3.8 for
reference) while growing on PCE. The amounts of the three cis-DCE
doses administered to the culture were the same as those fed to the
culture in Fig. 6.1 (a) (0.3, 0.5 and 0.7 mmol/1). In this experiment,
the three cis-DCE doses were dechlorinated in only 2 days, about 10-
fold faster than the ones fed to the culture of Fig. 6.1 (a).
6.4.b Substrate interchangeability in cultures grown on cis-
DCE.
An experiment was designed to test the ability of "D.
ethenogenes" strain 195 to dechlorinate other chloroethenes of equal
or higher number of chlorines after having consumed several doses of
cis-DCE as sole e- acceptor. A culture grown on cis-DCE was
transferred and fed with three consecutive doses of cis-DCE (0.15, 0.25
and 0.35 mmol/1), followed by an alternative substrate. Figure 6.3 (a),
(b) and (c) show the results of the fourth dose, which was of 0.35
mmol/1 of cis-DCE, 1,1-DCE or TCE respectively. Fig. 6.3 (d) depicts
the complete sequence of feedings from Day 0, showing a fourth
feeding of 0.35 mmol/1 PCE. "D. ethenogenes" strain 195 was able to
dechlorinate cis-DCE, 1,1-DCE and TCE without any lag phase. cis-
DCE and 1,1-DCE were both dechlorinated to VC with very similar
rates: 0.23±0.03 mmol l"1 day"1 for cis-DCE and 0.27+0.02 mmol H
day1 for 1,1-DCE. A little ETH started to be formed from VC as the

r 156
2.5-,
0 4 5
Time (Day)
FIGURE 6.2 Effect of adding high amounts of cfs-DCE (0.3, 0.5 and 0.7 mmol/1) after feeding the culture with three consecutive standard doses of PCE (0.3, 0.5 and 0.7 mmol/1).
157 f-
FIGURE 6.3 eis-DCE (a), 1,1 -DCE (b), TCE (c) and PCE (d) disappearance and product formation in cultures transferred (2% v/v inoculum) with cis-DCE as sole electron acceptor. In all experiments, cis-DCE was fed three consecutive times (0.15, 0.25 and 0.35 mmol/1). Graphs (a), (b) and (c) show the fourth feeding, which was of 0.35 mmol/1 of cis-DCE, 1,1-DCE and TCE respectively. Graph (d) shows the complete sequence of feedings from Day 0, being the fourth feeding 0.35 mmol/1 PCE, which was added to the culture at Day 8.

/ 158
ETH VC
ETH VC
-X-
-ffl-
cis-DCE-"*"" 1,1-DCE —-A-
1,1 -DCE trans-DCE cis-DCE TCE
t^yajiMi o 9 10 119 10 119 10 11 12
Time (Day) Time (Day) Time (Day)
ETH
VC ffl— cis-DCE
5 10 15 20 25 30 35 40
Time (Day)

/ 159
concentrations of both chloroethenes diminished to almost zero. TCE
dechlorination was much slower than that of the DCEs (rate of
0.09+0.02 mmol H day-1). TCE was initially dechlorinated to cis-DCE
(no VC was produced in the first 1/2 day). After 1.5 days of cis-DCE
accumulation, this chloroethene was gradually dechlorinated together
with the remaining TCE, while VC accumulated as the dechlorination
product of both. PCE, contrary to the other chloroethenes tested, was
not dechlorinated at all for 32 days after it was added to the culture
{Fig. 6.3 (d)}. The PCE concentration diminished with time due to its
absorption to and transfer through the highly punctured stopper (Fig.
2.3). Moreover, contrary to past observations, ETH was produced from
VC in the presence of PCE.
6.4.c PCE utilization by cultures grown on cis-DCE.
To investigate further whether this loss of ability to use PCE
after growing on cis-DCE was irreversible, the same culture utilized as
inoculum in the experiment of Fig. 6.3 was inoculated into fresh
medium and fed three times with cis-DCE (see Fig. 6.4). In this
experiment, though, two doses (0.4 ad 0.55 mmol/1) of 1,1-DCE were
fed to the culture as an alternative substrate before adding PCE. As
shown in Fig. 6.4, the culture was then able to dechlorinate PCE. The
dechlorination of the first PCE dose was 4 to 5 days slower than that
for a culture accustomed to grow on PCE, TCE or 1,1-DCE. Still, the
rate of PCE degradation increased with time with very little buildup of
intermediates (data not shown).
The same approach as above was followed when transferring the
culture. Fig. 6.5 (a) shows the results of a culture that had been

160 /
0 10 15
Time (Day)
FIGURE 6.4 PCE disappearance and product formation by D. ethenogenes strain 195 grown with all the necessary requirements. Two doses of 1,1 -DCE (0.4 and 0.55 mmol/1) were added right after the three initial doses of cis-DCE (0.15, 0.25 and 0.35 mmol/1) were consumed.

161
0.3 1(a)
•3 0.25 H
I X 0.2 H
0.15- Cß <U C
o
■§ 0.05 H u
-•— ETH
■ 0-- VC
-»- PCE
0^...t..T..y...^...........^...^^^^
0 8 10 12
Time (Dav)
—J— 14 16 18
-r-
20
Time (Day) FIGURE 6.5 The culture was grown with cis-DCE (0.15, 0.25, 0.35 and 0.45 mmol/1) and then transferred with PCE (a) or with 1,1-DCE (not shown). This later culture was transferred a second time with PCE (b).

^ 162
growing on eis-DCE (1.21 mmol/1 VC and ETH produced in 17 days)
and was transferred into fresh medium containing PCE as sole e~
acceptor. "D. ethenogenes" strain 195 did not dechlorinate PCE under
these conditions, since no products were detected. The amount of PCE
diminished with time due to its absorption into the stopper. In a
parallel experiment, the same culture growing on cis-DCE was
transferred and grown with 1,1-DCE as sole e" acceptor (1.35 mmol/1
VC and ETH produced in 11 days), and then this culture was
transferred again into fresh medium containing PCE as sole e"
acceptor. Figure 6.5 (b) shows that PCE was dechlorinated by this
culture. Again, the dechlorination of the first PCE dose was 4 to 5
days slower than the regular time a culture accustomed to grow on
PCE, TCE or 1,1-DCE would have taken. The rate of PCE degradation
increased with time, reaching high rates of degradation by the fourth
PCE dose, which indicates normal growth of the organism on this
compound.
Fig. 6.6 shows the dechlorination patterns of cis-DCE and PCE
when added together to a culture that had been growing to high cell
density with PCE as sole e- acceptor. About 0.35 mmol/1 of PCE and
cis-DCE were added to the culture on Day 7. Both compounds were
degraded at the same time and at very similar rates.
Figs. 6.7 and 6.8 show the dechlorination patterns of cultures
to which both PCE and cis-DCE were added at the time of inoculation.
The inoculum utilized for the experiment of Fig. 6.7 was grown with
PCE as sole e- acceptor. Both PCE and cis-DCE were dechlorinated to
VC and ETH. cis-DCE was dechlorinated before PCE, and PCE
dechlorination was delayed but started before cis-DCE had been

&3
VC 1,1 -DCE trans-DCE cis-DCE TCE-
o 6 6
4 5 6 Time (Day)
FIGURE 6.6 Reductive dechlorination of PCE and cis-DCE when fed together to a culture after three successive doses of PCE. Note that the scale for VC is separate from the rest and it is located on the left Y axis.
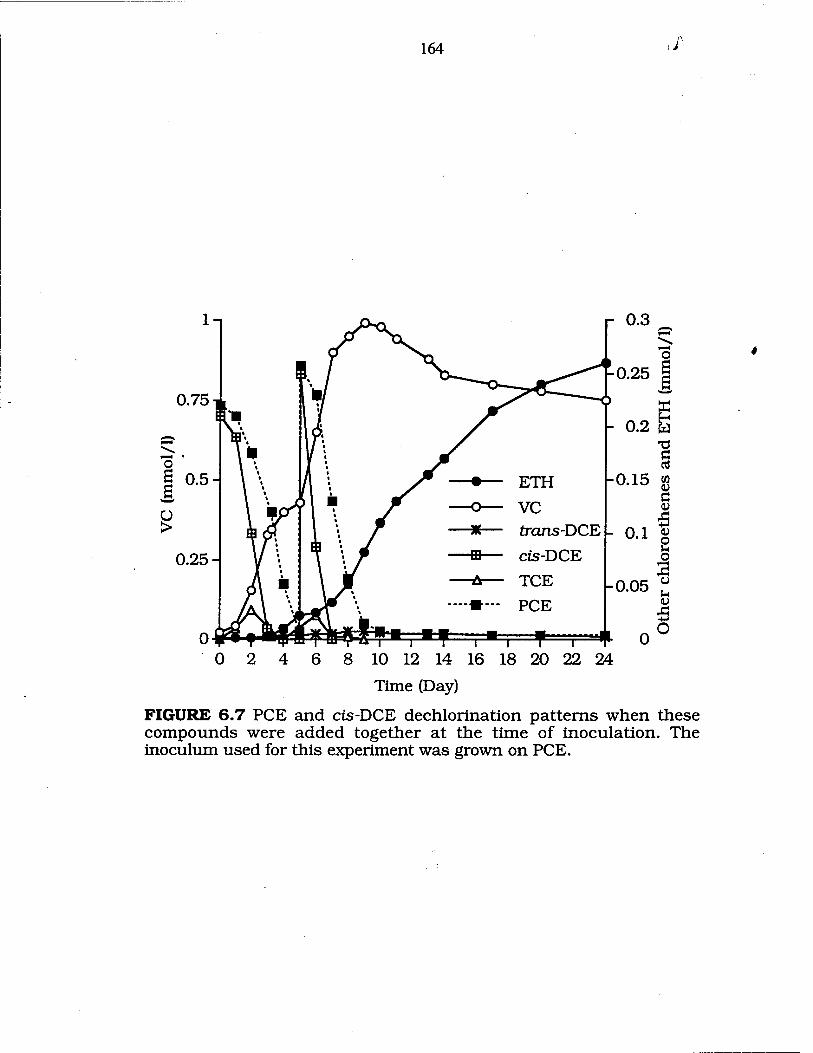
164 ■ /■
0.75
o s s 0.5-
0.25-
r 0.3
-0.25
- 0.2
-0.15
0.1
-0.05
0 10 12 14 16
Time (Day)
FIGURE 6.7 PCE and cis-DCE dechlorination patterns when these compounds were added together at the time of inoculation. The inoculum used for this experiment was grown on PCE.

/ 165
1.5-
0.5-
Tinie (day)
FIGURE 6.8 PCE and cis-DCE dechlorination patterns when these compounds were added together at the time of inoculation. The inoculum used for this experiment was grown on cis-DCE.

/ 166
consumed. A small amount of PCE remained for at least 14 days after
the second dose of PCE had been mostly consumed, with ETH being
formed during that period. TCE and a little trans-DCE accumulated
during both PCE feedings for the first two and one days respectively
and were dechlorinated in both cases before PCE had been consumed
(about the time cis-DCE levels reached zero). ETH was produced in the
presence of PCE, as in Fig. 6.3 (d).
The inoculum utilized for the experiment shown in Fig. 6.8 was
grown with cis-DCE (about 1 mmol/1 consumed) as sole e" acceptor
instead of PCE. As seen in Fig. 6.7, both PCE and cis-DCE were
degraded to VC and ETH. cis-DCE was dechlorinated before PCE
started being degraded in contrast with the experiment presented in
Fig. 6.7. PCE was dechlorinated to a low extent during the first 17
days with very little VC and ETH production. After the second cis-DCE
dose had been consumed, PCE was dechlorinated faster with time,
indicative of growth on this compound. Two subsequent doses of PCE
were dechlorinated in the absence of added cis-DCE. Small amounts of
trans-DCE accumulated constantly during the time the experiment
was allowed to run. As shown in Fig. 6.7, ETH accumulated during
PCE dechlorination.
6.5 DISCUSSION.
The study of cell growth and dechlorination on cis-DCE by this
bacterial culture is specially important due to the frequently found
accumulation of this compound in sites contaminated with PCE and
TCE (2, 7), where cis-DCE is often the prevalent chloroethene. The
167 ^
results obtained here increase our knowledge regarding the reductive
dechlorination of cis-DCE, since all organisms isolated so far (3-5, 9,
10), with the exception of "D. ethenogenes" strain 195, are not capable
of degrading cis-DCE. A better understanding of the organisms and
pathways responsible for its degradation has direct implications in the
in situ bioremediation of contaminated sites.
cis-DCE was used relatively slowly as sole e" acceptor by "D.
ethenogenes" strain 195 {Fig. 6.1 (a)} compared to PCE, TCE and 1,1-
DCE by the same bacterium at the same concentrations (Chapter
Five). This finding, though different from, are not comparable to
results previously obtained (11) using pre-grown mixed cultures
containing "D. ethenogenes" strain 195. In these cultures the
dechlorination of cis-DCE was more easily performed by an excess of
cell population than when a culture had to grow with cis-DCE as the
sole e" acceptor source from the time of inoculation. Results
consistent with the ones obtained by Tandoi et cd. were also obtained
in Figs. 6.2, 5.7 and 5.11 of this dissertation, in which the
experiments were also performed with pre-grown cultures.
The slow metabolism of high concentrations of cis-DCE by "D.
ethenogenes" strain 195 {Figs. 6.1 (a) and 5.1} in cultures inoculated
into medium with cis-DCE as sole e~ acceptor, when compared with
the much faster dechlorination rates obtained at lower concentrations
{Fig. 6.1 (b)}, points towards a toxic effect of cis-DCE on cells. This
effect on the culture at the time of inoculation is very similar to that
found for PCE (Chapter Three), in which if too much compound is
added, the ability of the culture to dechlorinate it diminishes with
increasing amounts amended. A difference from cultures fed with PCE

168
is that a lower amount of cis-DCE is needed to produce a similar toxic
effect as a first dose on a culture that has been just transferred (2%
v/v inoculum): more than 0.23 mmol/1 of aqueous PCE concentration
(0.4 mmol/1 PCE added) in comparison to more than 0.17 mmol/1 of
aqueous cis-DCE concentration (0.2 mmol/1 cis-DCE added). Also, as
Fig 6.1 shows, ETH was not produced from VC in the presence of cis-
DCE, indicating an inhibitory effect of cis-DCE over VC dechlorination
to ETH very similar to that produced by PCE and other chloroethenes
(see Chapters Three, Five and Seven).
The reversible inability of "D. ethenogenes" strain 195 to
dechlorinate PCE (and to grow with this compound) after having been
grown with cis-DCE as sole e" acceptor is surprising (Figs. 6.3 and
6.5). After growing with cis-DCE, "D. ethenogenes" strain 195 was able
to utilize PCE as sole e" acceptor in only two cases: (I) when an
alternative substrate (such as 1,1 -DCE) was dechlorinated before
adding PCE (after cis-DCE had been consumed); and (II) when both
compounds were fed together at the time of inoculation (Fig. 6.8).
Studies on the dehalogenases of mixed cultures containing "D.
ethenogenes" strain 195, currently being performed (6), show the
presence of two enzymes, one active in the reductive dechlorination of
PCE to TCE, and another one responsible for the rest of the pathway.
If this is true, growth with cis-DCE alone could (reversibly) repress the
transcription of the gene responsible for the production of the PCE
dehalogenase (Fig. 6.8).
Fig. 6.6 shows that there is no inhibition of the PCE
dehalogensae by cis-DCE, even though some TCE and DCE isomers
were produced from PCE by the culture. Fig. 6.7 shows that, when
/■

/ 169
PCE and cis-DCE were added together at the time of inoculation in
cultures grown with PCE, PCE dechlorination is delayed and mainly
occurs after cis-DCE has been consumed (also seen in Fig. 6.8), which
could be produced by competition for electrons.
Addition of an alternate substrate (1,1-DCE; Fig. 5.8) after cis-
DCE consumption and before adding PCE to the culture allowed cells
to use PCE as a growth substrate again. Under these conditions, the
first PCE dose was always consumed more slowly than usual {Figs. 6.4
and 6.5 (b)}, indicating initial partial recovery of the ability to
dechlorinate PCE by "D. ethenogenes" strain 195. After a few doses had
been consumed, the rates of PCE dechlorination became as fast as
usual and the recovery seemed complete. There is no definite
explanation for this phenomenon at this point. The results presented
in this chapter have been used to develop a possible explanation:
After growing with cis-DCE only, no PCE dehalogenase would be
present in the cells and not enough energy would be generated to
produce any. Under these conditions "D. ethenogenes" strain 195 could
not dechlorinate or grow with PCE when added alone {seen in Figs. 6.3
and 6.5 (a)}. But, if under the same conditions PCE was added
together with a suitable growth substrate, the dechlorination of the
additional growth substrate would create enough energy to produce
the PCE dehalogenase, which would then be able to start
dechlorinating PCE (Fig. 6.8). PCE dechlorination would be slow at
the beginning and faster with time until there is enough enzyme that
the energy produced from PCE dechlorination is sufficient to
synthesize more PCE dehalogenase, making the presence of the other
substrate unnecessary {see Fig. 6.8; also seen in Figs. 6.4 and 6.5 (b)}.

/ 170
Cultures growing on PCE instead of cis-DCE would have both PCE
and TCE dehalogenases present in the cells and, therefore, would have
no trouble dechlorinating PCE and cis-DCE when added together, also
because these compounds would be reduced by different enzymes (see
Fig. 6.6) (6).
It is interesting that in Fig. 6.3 (d), contrary to all past
observations, ETH was produced from VC in the presence of PCE. It is
therefore not just the presence of PCE that inhibits ETH formation.
These results indicate that PCE has to be utilized by the cells to
produce the inhibitory effect on ETH formation. At the same time, and
in apparent contradiction, ETH was produced while PCE is being
dechlorinated in Figs. 6.7 and 6.8. This could indicate competition for
electrons or the inability for "D. ethenogenes" strain 195 to utilize PCE
as sole e" acceptor after these cells have grown on cis-DCE. In these
experiments, PCE could have been dechlorinated cometabolically.

171
REFERENCES
/
l.Balch, W. E., G. E. Fox, L. J. Magrum, C. R. Woese, and R. S. Wolfe. 1979. Methanogens: Reevaluation of a unique biological group. Microbiol. Rev. 43:260-296.
2.Beeman, R. E., J. E. Howell, S. H. Shoemaker, E. A. Salazar, and J. R. Buttram. 1993. A field evaluation of in situ microbial reductive dehalogenation by the biotransformation of chlorinated ethenes, p. 14-27. In R. E. Hinchee, A. Leeson, L. Semprini, and S. K. Ong (ed.), Bioremediation of chlorinated and polycyclic aromatic hydrocarbon compounds. Lewis Publishers.
3.Gerritse, J., V. Renard, T. M. Pedro-Gomes, P. A. Lawson, M. D. Collins, and J. C. Gottschal. 1996. Desulfitobacterium sp. strain PCE1, an anaerobic bacterium that can grow by reductive dechlorination of tetrachloroethene or ortho-chlorinated phenols. Arch. Microbiol. 165:132-140.
4.Holliger, C, G. Schraa, A. J. M. Starns, and A. J. B. Zehnder. 1993. A highly purified enrichment culture couples the reductive dechlorination of tetrachloroethene to growth. Appl. Environ. Microbiol. 59:2991-2997.
5.Krumholz, L. R., R. Sharp, and S. S. Fishbain. 1996. A freshwater anaerobe coupling acetate oxidation to tetrachloroethylene dehalogenation. Appl. Environ. Microbiol. 62:4108-4113.
ß.Magnuson, J., etaL Unpublished results.
7.Major, D. W., E. W. Hodgins, and B. J. Butler. 1991. Field and laboratory evidence of in situ biotransformation of tetrachloroethene to ethene and ethane at a chemical transfer facility in north Toronto, p. 113-133. In R. E. Hinchee and R. F. Olfenbuttel (ed.), On-Site Bioreclamation — Processes for Xenobiotic and Hydrocarbon Treatment. Butterworth-Heinemann, Boston.
8.Neumann, A., H. Scholz-Muramatsu, and G. Diekert. 1994. Tetrachloroethene metabolism of Dehalospirillum multivorans. Arch Microbiol. 162(4) :295-301.
9.Scholz-Muramatsu, H., A. Neumann, M. Messmer, E. Moore, and G. Diekert. 1995. Isolation and characterization of Dehcdospirülum. multivorans gen nov, sp nov, a tetrachloroethene-utilizing, strictly anaerobic bacterium. Arch. Microbiol. 163(l):48-56.
172
lO.Sharma, P. K., and P. L. McCarty. 1996. Isolation and characterization of a facultatively aerobic bacterium that reductively dehalogenates tetrachloroethene to cis-1,2- dichloroethene. Appl. Environ. Microbiol. 62(3):761-765.
ll.Tandoi, V., T. D. DiStefano, P. A. Bowser, J. M. Gossett, and S. H. Zinder. 1994. Reductive dehalogenation of chlorinated ethenes and halogenated ethanes by a high-rate anaerobic enrichment culture. Environ. Sei. Technol. 28:973-979.

/■
CHAPTER SEVEN
VC DECHLORINATION TO ETH BY "Dehalococcoides ethenogenes" strain 195
"If the problem has a solution, why are you worried? If it doesn't, why are you worried?'
Popular phrase (oriental)
7.1 ABSTRACT.
The last step of dechlorination, VC to ETH, is the rate-limiting
step for the complete dechlorination of PCE by "Dehalococcoides
ethenogenes" strain 195, and the patterns of utilization of VC were
typical of a cometabolic process. VC was not utilized as a growth
substrate by "D. ethenogenes" strain 195. When added as sole electron
acceptor, VC was metabolized very slowly to ETH at a constant rate.
The rates of VC dechlorination were much greater if a suitable growth
substrate like PCE was added, although significant reduction of VC to
ETH only occurred after the PCE dose had been consumed. TCE, cis-
DCE and 1,1 -DCE also partially inhibited ETH formation when
present in the medium. The rates of ETH production from VC
decreased with time in the absence of PCE. When PCE was added to
the medium with hexadecane (HDC), a low (0.3 mmol/1), constant
amount of PCE in the sample allowed for continuous and increasing
ETH production from VC as the culture grew on PCE. Therefore, PCE
dechlorination and ETH production can coexist.
173
174
7.2 INTRODUCTION.
Although vinyl chloride (VC) has powerful carcinogenic effects
on animals (including humans), it is also one of the largest
commodity chemicals on which we depend today, used mainly in the
production of plastics like PVC. The world-wide production of VC
estimated for 1982 was of 17 million tons (17). Drastic reductions of
VC production have been effected in many countries since then,
although it is still a contaminant commonly found in the
environment. Since VC is a relatively reduced molecule, its further
reduction to ETH is slow under reducing conditions (7, 9, 12) and,
even though it is a very thermodynamically favorable as sole electron
(e~) acceptor (27), VC is often observed to accumulate in anaerobic
environments contaminated with PCE or TCE (4, 5, 28).
There is little information available about dechlorination of VC
by mixed or pure anaerobic cultures in the laboratory or in situ.
Anaerobic VC dechlorination has been described in mixed enrichment
cultures (7, 9, 21, 24, 25) and in microcosms and in situ studies (3-5,
19). Aerobic oxidation of VC is more common (6, 14, 26). In part this
is due to the reduced nature of the molecule, which makes its
dechlorination with oxygen as terminal e~ acceptor very favorable.
In this chapter, a detailed study of the utilization of VC and the
production of ETH by "D. ethenogenes" strain 195, in the presence and
absence of other chloroethenes, is presented.
175 /■
7.3 MATERIALS AND METHODS.
7.3.a Chemicals and analyses of chloroethenes.
PCE, VC, H2, and other chemicals were purchased and utilized
as described in point 2.3.a in Chapter Two of this dissertation.
For quantitative analysis of chloroethenes and ETH, samples
were analyzed using a Perkin Elmer Gas Chromatograph 8500, as
described in Chapter Three of this dissertation.
7.3.D Growth medium and culture conditions.
The basal salts medium utilized for "D. ethenogenes" strata 195
contained the same ingredients as described in Chapter Two of this
dissertation. The protocol followed to produce this basal salts
medium, previous to the addition of the amendments, was also
followed as described in Chapter Two. This medium received the
following sterile and anaerobic additions before inoculation (final
medium volume=10 ml/tube): Na2S-9H20, 2 mM (added last);
NaHCC-3, 12 mM (added first); the ABSS amendments {SS (prepared as
described in Chapter Two)), 25% v/v; sodium acetate, 2 mM; and
vitamin solution (2) concentrated 10-fold, 0.5% v/v}; and 5% v/v
extract from the Butyrate/PCE culture (prepared as described in
Chapter Three). Ampicillin, added at 0.3 M-g/ml to the cultures, was
prepared as described in Chapter Three.
Solutions of PCE in hexadecane (HDC) were prepared as
follows: HDC was purged with a mixture of 70% N2/30% CO2 for 15
min. The tubes were then sealed with aluminum-crimp Teflon-coated

176
butyl rubber stoppers (Wheaton, Millville, N.J.) and were autoclaved
at 121°C for 30 min. PCE was then added with sterile Swinnex
(Millipore Inc., Woburn, MA) filters, after it had been purged with 70%
N2/30% CO2 for 5 min. HCO3", H2 and acetate amended to cultures
that contained PCE to HDC were added in amounts according to the
amount of PCE consumed by these cultures.
Inoculum sizes were 2% v/v, all incubations were done in
duplicate, and each experiment presented was performed at least twice
with similar results. Duplicate tubes performed very similarly in most
of the experiments presented (less than 5% difference in results for
tubes under same conditions). Cultures were incubated as described
in Chapter Two of this dissertation.
/
7.4 RESULTS.
7.4.a VC as growth substrate
The ability of "D. ethenogenes" strain 195 to grow on VC was
examined. A culture grown with PCE was amended with 0.4 mmol/1
VC just after inoculation, in the absence of PCE or any other e"
acceptor, as presented in Fig. 7.1 (a). After 30 days of incubation with
VC alone, there was only a slow constant conversion of VC to ETH.
The slow rate of VC disappearance was attributed to absorption and
transfer into and through the stopper as indicated by uninoculated
controls (see Fig. 2.3 for reference). A dose of 0.3 mmol/1 PCE added
at Day 30 was depleted in 14 days with only a slight accumulation of

/■ 177
1.6 n
Time (Day)
FIGURE 7.1 VC dechlorination to ETH by "D. ethenogenes" strain 195 in the absence (a) and presence (b) of PCE at the time of inoculation. Three consecutively increasing doses of PCE (0.3, 0.5 and 0.7 mmol/1) were added to the culture in (a) on days 30, 44 and 46. (c) Differences on ETH production by a culture in which PCE was not present for the first 28 days after inoculation {data from (a)} and by a culture in which a single dose of PCE (0.4 mmol/1) was added at the time of inoculation {data from (b)}.

178
FIGURE 7.1 Continuation.
0.8i
0.2-,
0.15-
i ' i ' 12 14 16 18 20 22 24 26
Time (Day)
u
o £
X H
0.05-
8 10 12 14 16 18 20 22 24 26 28
Time (Day)

179
dechlorination products detected, with the decrease in PCE
concentration attributed mainly to its absorption into the stopper.
Two subsequent PCE doses were consumed at increasing rates, with a
near stoichiometric conversion to VC and ETH. ETH production
ceased in the presence of PCE, from Day 30 to 42, and continued
increasing afterwards, mainly in the absence of PCE after the third
dose had been consumed and during short periods of low PCE
concentration (data not shown).
As shown in Fig. 7.1 (b), when a dose of PCE was added along
with VC at Day 0, PCE had been metabolized to VC by Day 4 and,
once the PCE was depleted, there was a much more rapid
accumulation of ETH than when VC was added in the absence of PCE
(at Day 28, the culture that had consumed an initial dose of PCE had
produced 0.18 mmol/1 ETH against the 0.024 mmol/1 produced during
the same time by the culture transferred on VC only). Fig. 7.1 (c)
shows a close-up comparison of ETH production for the first 28 days
of both experiments depicted in Fig. 7.1 (a) and (b). The amount of
ETH produced during the first 3 days was the same for both
experiments, regardless of PCE being present or absent from the
medium. The rates of ETH production from VC by the culture
corresponding to Fig. 7.1 (b) decreased with time {see also Fig. 7.1 (b)},
with very little ETH production from Day 28 on (data not shown).
7.4.b ETH production from VC
To demonstrate that ETH production from VC in the absence of
PCE was due to bacterial activity, two cultures were transferred into
180
fresh medium and were amended three consecutive PCE doses (0.2,
0.4 and 0.6 mmol/1), which were consumed during the first six days.
At Day 7, one of the cultures was autoclaved (30 min at 121°C). As it
can be seen in Fig. 7.2, ETH production completely ceased after
autoclaving, while ETH accumulated as expected in cultures that had
not been perturbed after the PCE was consumed.
The inhibitory effect of PCE on ETH formation from VC seen in
Fig. 7.1 (b) and (c) is examined more closely in Fig. 7.3. ETH
formation was measured in relation to the presence or absence of PCE
during growth (only PCE and ETH values have been plotted for
clarity). Four PCE doses (0.3, 0.5, 0.7 and 0.9 mmol/1) were added to
3 sets of cultures. One of the sets always had PCE present in the
medium {Fig. 7.3 (a)}, another did not receive a new PCE dose until 2
days after the previous PCE dose had been consumed {Fig. 7.3 (b)},
and a third one went 4 days without a new PCE dose until the
previous PCE dose had been consumed (data not shown). ETH was
almost exclusively produced during the periods when PCE was absent
from the medium. Fig. 7.3 (c) shows the total amount of ETH
produced by the cultures after the four doses of PCE had been
consumed by each. Cultures in which PCE was always present
produced little ETH (0.014 mmol/1) in contrast to the amount
produced by cultures that had had a total of 6 days (0.193 mmol/1
ETH) and 12 days (0.25 mmol/1 ETH) without PCE.
The remaining chloroethenes that "D. ethenogenes" strain 195 is
capable of using as e" acceptors were also tested to determine whether
they had a similar inhibitory effect on ETH formation from VC. Fig.
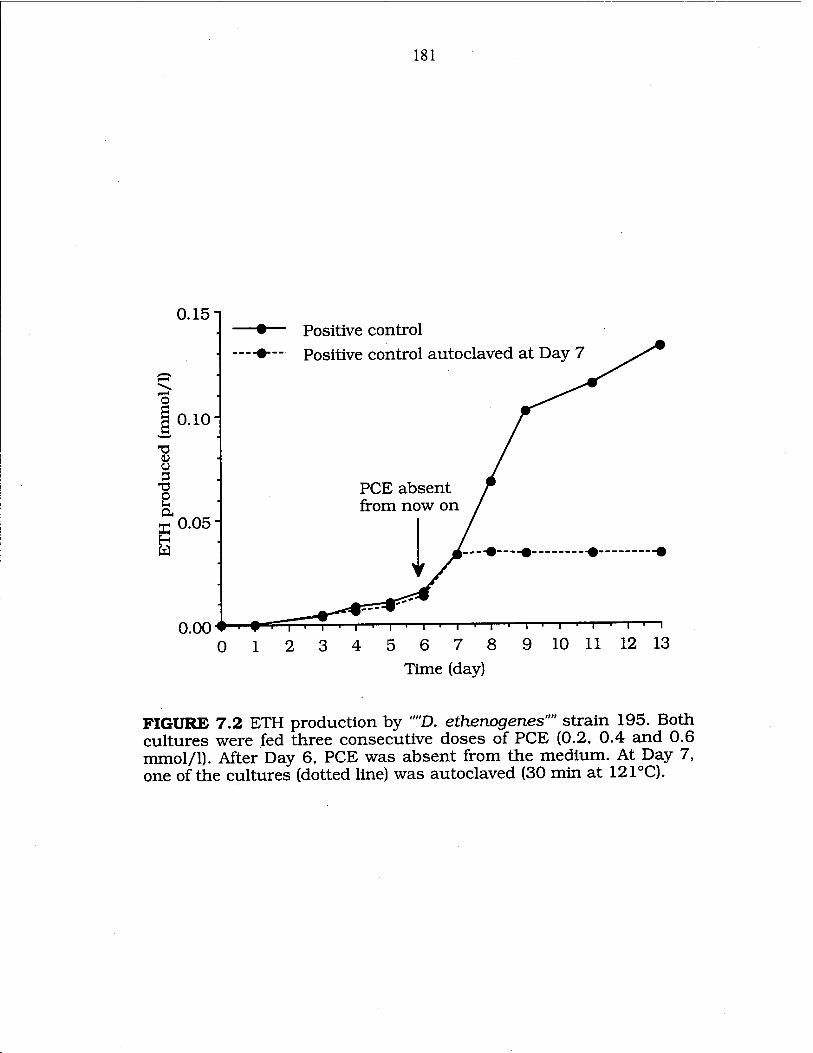
181
0.15n
o g 0.10
T3 <u o 3
T3 O U a
ä 0.05
0.00 ♦
■•— Positive control -•— Positive control autoclaved at Day 7
PCE absent from now on
Time (day)
FIGURE 7.2 ETH production by ""D. ethenogenes"" strain 195. Both cultures were fed three consecutive doses of PCE (0.2, 0.4 and 0.6 mmol/1). After Day 6, PCE was absent from the medium. At Day 7, one of the cultures (dotted line) was autoclaved (30 min at 121°C).

182
FIGURE 7.3 ETH formation in relation to the presence or absence of PCE during growth. Cultures were either continuously fed with PCE (a) or rested for 2 days after each PCE dose had been consumed (b). (c) shows the total amount of ETH produced after 1.44 to 1.5 mmol/1 PCE had been consumed in each cultures. A=PCE always present; B=2 days and C=4 days without e" acceptor between PCE feedings.

183
rl.2
l—T—T—r 10 11 12 13 14 15
Time (Day)

184
7.4 shows the results of this experiment. After each culture had
consumed two equivalent doses of a particular chloroethene (PCE was
consumed in 4 days, TCE in 3.5 days, 1,1-DCE in 3 days and cis-DCE
in 11 days), the amount of ETH produced in the next two days was
measured and compared to that produced in the days before. In all
cases, the amounts of ETH produced increased at least 10-fold when
the chloroethenes used as growth substrates were absent.
7.4.c Hexadecane (HDC) studies.
The production of ETH was further studied in cultures in which
PCE was added, as sole e" acceptor, in a HDC solution. The HDC
created a separate organic phase with high affinity for PCE into which
this compound could be concentrated and slowly released into the
medium as it was being consumed by the culture. HDC allowed,
therefore, the addition of high amounts of PCE while keeping the
aqueous concentration of this compound low (15). Fig. 7.5 (a) and (b)
shows a comparison for the total amounts of VC and ETH produced
by three cultures to which the following amounts of PCE had been
added, separately: a total of 14.7 mmol PCE/1 added with HDC (about
0.3 mmol/1 PCE in aqueous concentration; "low" PCE); 36.7 mmol
PCE/1 also added with HDC (about 0.6 mmol/1 PCE in aqueous
concentration; "high" PCE); and 2.4 mmol PCE/1 (added in four
doses, without HDC; each new dose added before the previous dose
had been totally consumed). The HDC solution was added in amounts
of 0.75 ml to 9.25 ml of medium, and it did not show any signs of
toxicity. Essentially no ETH was dissolved in the HDC phase. As the

185
Chloroethene present Chloroethene absent
FIGURE 7.4 ETH production from VC during the presence and absence of PCE, TCE, cis-DC and 1,1 -DCE from the growth medium. Five sets of duplicate tubes consumed, each, two doses of a different chloroethene (0.3 and 0.5 mmol/1). After the respective chloroethenes had been consumed, the amount of ETH produced in the next two days was measured and compared to that produced in the days before.

186
2.5-,
15 Time (Day)
FIGURE 7.5 Total ETH (a) and VC (b) produced and aqueous levels of PCE (a) by 3 transfers of "D. ethenogenes" strain 195. PCE was added differently to each transfer: in a HDC phase at "low" (total of 14.7 mmol/1 PCE from 0.75 ml of a 2% PCE/HDC solution) and high (total of 36.7 mmol/1 PCE from 0.75 ml of a 5% PCE/HDC solution) amounts, and without HDC (4 doses; total of 2.4 mmol/1 PCE).

187
degree of chlorination of ethenes increased, there was also an
increase in the amount of compound dissolved into the HDC phase
(data not shown).
As shown in Fig. 7.5, cultures receiving the "low" PCE/HDC
solution produced the same amount of VC as controls without HDC
(during the first 7 days) and significantly more VC than cultures
amended with the "high" PCE/HDC solution (12.3 against 10 mmol/1
at Day 29, respectively). The rates of VC production from PCE by "D.
ethenogenes" strain 195 slowed down considerably after Day 20.
Cultures receiving the "low" PCE/HDC solution produced about 4 fold
more ETH than the cultures containing the "high" PCE/HDC
solution, which produced the same small amount of ETH during the
first 8 days. The rates of ETH production diminished to almost zero
after Day 17, a little earlier than the rates for VC production. The
amounts of ETH produced by cultures containing the "low" and the
"high" PCE/HDC solutions were 2.14 and 0.52 mmol/1, respectively.
Both cultures grown with the PCE/HDC solution accumulated TCE
and DCE isomers to low levels. The culture amended with the "high"
PCE/HDC solution accumulated higher concentrations of
intermediates than did cultures amended with the "low" PCE/HDC
solution, in which the accumulation of TCE and DCE isomers was
small and, at times, negligible (data not shown). DCE isomers
normally accumulated to higher amounts than TCE in both cultures
(i.e., at Day 13 there were 0.22 mmol/1 DCEs and 0.09 mmol/1 TCE).
Cells viewed by phase-contrast microscopy appeared phase-dark,
indicating a healthy state of the cultures (data not shown).
188
Fig. 7.6 (a) and (b) depicts close ups of Fig. 7.5 (a) and (b),
respectively, showing ETH and VC production from PCE during the
first 11 days of the experiment (the amounts are shown in aqueous
concentrations). In both graphs, ETH production seems to increase
about the time when the VC aqueous concentration nearly equal to
the constant PCE aqueous concentration present {at about 4.5 days
for graph (a) and 7.5 days for graph (b)}.
7.5 DISCUSSION.
Due to the toxicity and cancer producing capabilities of VC
(11), combined with the fact that this is a compound that is
accumulated by "D. ethenogenes" strain 195 as a product of the
dechlorination of PCE, it is important to understand the dynamics of
its dechlorination.
Results from Fig 7.1 clearly show that, under the present
growth conditions, VC cannot be utilized by "D. ethenogenes" strain
195 as a growth substrate. VC was metabolized to very little ETH at a
constant rate, typical of a cometabolic process. It is interesting that,
even though VC is a thermodynamically very favorable e- acceptor
(27), it is not utilized as such by "D. ethenogenes" strain 195. The
results in Fig. 7.1 (b) indicated the ability of "D. ethenogenes" strain
195 to dechlorinate VC faster, once a suitable substrate like PCE was
added as e" acceptor for the culture. These results are similar to those
found for trans-DCE in Fig. 5.9. PCE serves as an e" acceptor for
energy conservation coupled to growth, thereby building up sufficient

189
0.6 n
4 5 6 Time (Day)
FIGURE 7.6 (a) Close up of Fig. 7.5 (a) and (b) close up of Fig. 7.5 (b) which shows ETH and VC production from PCE during the first 11 days of the experiment. TCE and DCE isomers have been omitted for clarity. The amounts of PCE, VC and ETH are shown as aqueous concentrations.

190
biomass to dechlorinate VC more rapidly as the density of the culture
increases. This pattern of utilization of VC seems to be also typical of
a cometabolic process, in which no energy is obtained from the
compound, but the molecule in question is dechlorinated when a
suitable growth substrate is utilized. Similar results were obtained
previously by DiStefano et al (8) in studies of the methanol/PCE
culture while still in the methanogenic stage. The fact that the rates
of ETH production diminished with time in experiments performed
when PCE was not present {Fig. 7.1 (b) and 7.6 (a)}, reinforce the view
that VC is cometabolically dechlorinated to ETH. Also, as found for
trans-DCE in Chapter Five, the initial rates for ETH production
obtained from a culture that had grown on PCE were much higher
(0.043 mmol H day-1) than the ones calculated when VC was utilized
as sole e" acceptor (0.0015 mmol l"1 day-1).
Fig. 7.1 shows that, in the culture transferred with VC only, the
amount of ETH produced is 0.024 mmol/1. When examining at the
culture that consumed a PCE dose right after transfer, the amount of
VC present increased to 0.73 mmol/1, about two (1.9 to be exact)
times higher than in VC-alone samples. From first-order kinetics, the
rate of ETH formation should be 2-fold higher, so that 0.05 mmol/1
ETH might be expected to accumulate over a similar time period in
Fig. 7.1 (b). Instead, 0.18 mmol/1 ETH accumulated. Simple
dechlorination kinetics do not explain the VC degradation patterns.
To understand it, we have to look at growth kinetics. "D. ethenogenes"
strain 195 could be growing twice as fast at the higher VC
concentration (due to growth on PCE), so that after several doublings

191
there would be a big difference. By comparison with results obtained
in Fig. 5.8, the culture of Fig. 7.1 (b) could have doubled 3 to 4 times.
Increases in biomass are therefore important in the dechlorination of
VC by ""D. ethenogenes"" strain 195, a compound that usually
accumulates in anaerobic aquifer systems due to its generally slow
degradation (4, 5). The availability of required or appropriate
nutrients is then of great importance to the degradation of this and
other recalcitrant compounds.
As discussed in Chapter Five of this dissertation, VC and trans-
DCE are both dechlorinated very similarly by "D. ethenogenes" strain
195 but, contrary to trans-DCE, VC plays a fundamental role in the
dechlorination of PCE to ETH, where it is the main intermediate
accumulated. The last step of dechlorination, VC to ETH, is the rate-
limiting step to the complete dechlorination of PCE, in accordance
with previous results (20, 21). This is in contrast to what it is found
in all other pure cultures, in which TCE and cis-DCE (the latter as
the final product) are accumulated (13, 15, 18, 22, 23); in mixed
cultures which dechlorinate PCE to ethane, in which cis-DCE is
accumulated to greater extent than VC (7); and in in situ studies, were
DCEs are again accumulated to very significant extent (4, 19).
Because of the decrease of rates of VC dechlorination with time,
the majority of ETH is produced during the first few days when all
other chloroethenes (except trans-DCE) are absent. As seen in Fig 7.3
(c), there is not much difference in ETH production between 2 days
and 4 days without PCE. The best conversion of VC to ETH occurs in
a dense culture that has been growing on a suitable chloroethene as

192
sole e' acceptor, in the absence of this or any other chloroethene
utilized as growth substrate (Fig. 3.9).
The use of hexadecane (HDC) as a solvent for delivering PCE to
the culture was investigated. This technique was devised by Holliger et
al (16) and it has been utilized with HDC and silicone as solvents in
other studies (1, 10). HDC is a good solvent because it is essentially
non metabolizable under anaerobic conditions, and it is considered
non-toxic to many microorganisms. This solvent forms a separate
phase, and, because of the high solubility of PCE in HDC, allows the
addition of high amounts of PCE while keeping its aqueous
concentration low. This ability to add a large amount of PCE at once
means that frequent PCE additions are not necessary, and that the
culture does not go long periods in the absence of PCE. It is
important to add enough buffering capacity so that conversion of
large amounts of PCE added does not acidify the culture via HC1
production.
Several experiments described previously in this dissertation
showed the ability of the culture to produce ETH in the presence of
small quantities of PCE in the medium. Fig. 7.5 clearly shows that
maintaining a relatively low (about 0.3 mmol/1), constant amount of
PCE in the sample indeed allows for continual ETH production as the
culture grows. PCE dechlorination and ETH production may therefore
coexist at "low" PCE concentrations. Higher amounts of PCE (0.6
mmol/1), although they don't completely inhibit ETH production,
limit this ability considerably. The diminishing production of VC and
ETH after days 24 and 17, respectively, indicates the presence of a

193
limitation in the culture's ability to dechlorinate. Byproduct toxicity
(salinization by production of NaCl and/or acidification by
production of HC1) or nutrient limitation/s are good candidates for
this loss of dechlorinating activity. It is interesting to note that
cultures amended with a lower constant PCE concentration (0.3
mmol/1), dechlorinated more of this substrate than cultures with a
higher constant level of PCE (0.6 mmol/1).

194
REFERENCES
1 Ascon-Cabrera, M., and J.-M. Lebeault. 1993. Selection of xenobiotic-degrading microorganisms in a biphasic aqueous- organic system. Appl. Environ. Microbiol. 59(6): 1717-1724.
2 Balch, W. E., G. E. Fox, L. J. Magrum, C. R. Woese, and R. S. Wolfe. 1979. Methanogens: Reevaluation of a unique biological group. Microbiol. Rev. 43:260-296.
3 Barrio-Lage, G. A., F. Z. Parsons, R. M. Narbaitz, and P. A. Larenzo. 1990. Enhanced anaerobic biodegradation of vinyl chloride in ground water. Environ. Tox. Chem. 9:403-415.
4 Beeman, R. E., J. E. Howell, S. H. Shoemaker, E. A. Salazar, and J. R. Buttram. 1993. A field evaluation of in situ microbial reductive dehalogenation by the biotransformation of chlorinated ethenes p. 14-27. In R. E. Hinchee, A. Leeson, L. Semprini, and S. K. Ong (ed.), Bioremediation of chlorinated and polycyclic aromatic hydrocarbon compounds. Lewis Publishers.
5 Bradley, P. M., and F. H. Chapelle. 1996. Anaerobic mineralization of vinyl chloride in Fe(III)-reducing, aquifer sediments. Environ. Sei. Technol. 30:2084-2086.
6 Davis, J. W., and C. Carpenter. 1990. Aerobic Biodegradation of vinyl chloride in groundwater samples. Appl. Environ. Microbiol. 56:3878-3880.
7 de Bruin, W. P., M. J. J. Kotterman, M. A. Posthumus, G. ' Schraa, and A. J. B. Zehnder. 1992. Complete biological
reductive transformation of tetrachloroethylene to ethane. Appl. Environ. Microbiol. 58:1996-2000.
8.DiStefano, T. D. 1992. Biological dechlorination of tetrachloroethene under anaerobic conditions. Ph.D. Thesis, Cornell University, Ithaca, NY. .
9 DiStefano, T. D., J. M. Gossett, and S. H. Zinder. 1991. Reductive dechlorination of high concentrations of tetrachloroethene to ethene by an anaerobic enrichment culture in the absence oi methanogenesis. Appl. Environ. Microbiol. 57(8):2287-2292.

195
10 Efroymson, R. A., and M. Alexander. 1991. Biodegradation of an Arthrobacter species of hydrocarbons partitioned into an organic solvent. Appl. Environ. Microbiol. 57(5): 1441-1447.
11.Federal Register. 1985. . 40(141):46885-46904.
12 Freedman, D. L., and J. M. Gossett. 1989. Biological reductive dechlorination of tetrachloroethylene and trichloroethylene to ethylene under methanogenic conditions. Appl. Environ. Microbiol. 55(9) :2144-2151.
13 Gerritse, J., V. Renard, T. M. Pedro-Gomes, P. A. Lawson, M. D. Collins, and J. C. Gottschal. 1996. Desulfitobacteriwn sp strain PCE1 an anaerobic bacterium that can grow by reductive dechlorination of tetrachloroethene or ortho-chlorinated phenols. Arch. Microbiol. 165:132-140.
14Hartmans, S., J. de Bont, J Tramper and K Luyben. 1985. Bacterial degradation of vinyl chloride. Biotechnol. Lett. 7(6}.38c5- 388.
15Holliger, C, G. Schraa, A. J. M. Stams, and A. J. B. Zehnder. 1993 A highly purified enrichment culture couples the reductive dechlorination of tetrachloroethene to growth. Appl. Environ. Microbiol. 59:2991-2997.
16 Holliger, C, G. Schras, A. J. M. Stams, and A. J. B. Zehnder. 1992. Enrichment and properties of an anaerobic mixed culture reductively dechlorinating l-2>3-^f^™*?!g™%*0 lf3" dichlorobenzene. Appl. Environ. Microbiol. 58(5): 163b-1 b44.
17.Kirk-Othmer. 1983. Encyclopedia of chemical technology, 3rd. ed, vol. 23. John Wiley and Sons, New York.
18 Krumholz, L. R., R. Sharp, and S. S. Fishbain. 1996. A freshwater anaerobe coupling acetate oxidation to tetrachloroethylene dehalogenation. Appl. Environ. Microbiol. 62:4108-4113.
19Major, D. W., E. W. Hodgins, and B. J .Butler. 1991. Field and laboratory evidence of in situ biotransformation of tetrachloroethene to ethene and ethane at a chemical transfer facility in north Toronto, p. 113-133. In R E. Hmchee and R. F Olfenbuttel (ed.), On-Site Bioreclamation — Processes tor Xenobiotic and Hydrocarbon Treatment. Butterworth-Heinemann, Boston.

196
20.Maymo-Gatell, X., Y.-t. Chien, J. M. Gossett, and S. H. Zinder. 1997. Isolation of a novel bacterium capable of reductively dechlorinating tetrachloroethene to ethene. Science 276:1468-1471.
21.Maymo-Gatell, X., V. Tandoi, J. M. Gossett, and S. H. Zinder. 1995. Characterization of an H2-utilizing anaerobic enrichment culture that reductively dechlorinates tetrachloroethene to vinyl chloride and ethene in the complete absence of methanogenesis and acetogenesis. Appl. Environ. Microbiol. 61:3928-3933.
22.Scholz-Muramatsu, H., A. Neumann, M. Messmer, E. Moore, and G. Diekert. 1995. Isolation and characterization of Dehalospirillum multivorans gen nov, sp nov, a tetrachloroethene- utilizing, strictly anaerobic bacterium. Arch. Microbiol. 163(1) :48- 56.
23.Sharma, P. K., and P. L. McCarty. 1996. Isolation and characterization of a facultatively aerobic bacterium that reductively dehalogenates tetrachloroethene to cis-1,2- dichloroethene. Appl. Environ. Microbiol. 62(3):761-765.
24.Skeen, R. S., J. Gao, and B. S. Hooker. 1995. Kinetics of chlorinated ethylene dehalogenation under methanogenic conditions. Biotechnol. Bioengineering. 48:659-666.
25.Tandoi, V., T. D. DiStefano, P. A. Bowser, J. M. Gossett, and S. H. Zinder. 1994. Reductive dehalogenation of chlorinated ethenes and halogenated ethanes by a high-rate anaerobic enrichment culture. Environ. Sei. Technol. 28:973-979.
26.Tsien, H., G. A. Brusseau, R. S. Hanson, and L. P. Wackett. 1989. Biodegradation of trichloroethylene by Methylosinus trichosportum OB3b. Appl. Environ. Microbiol. 55(12):3155-3161.
27.Vogel, T. M., C. S. Criddle, and P. L. McCarty. 1987. Transformations of halogenated aliphatic compounds. Environ. Sei. Technol. 21(8):722-736.
28.Weaver, J. W., J. T. Wilson, and D. H. Kampbell. 1995. EPA project summary; EPA/600/SV-95/001. U. S. EPA, Washington D. C.

APPENDIX A
VIRUS-LIKE PARTICLES ASSOCIATED WITH "Dehalococcoides ethenogenes" strain 195
"Abbott: Now, on the St. Louis team we have Who's on first, What's on second, I Don't Know is on third. CosteUo: Thats what I want to find out" Bud Abbott 1895-1974 & Lou CosteUo (Louis Francis CristQlo) 1906-1959, in the 1945 film Naughty Nineties.
As was described in Chapter Three of this dissertation, "D.
ethenogenes" strain 195 was able to grow and be isolated in the
presence of ampicillin thanks to the required nutrients present in the
cell extract from the mixed butyrate/PCE culture. After isolation, "D.
ethenogenes" strain 195 grew and dechlorinated PCE to VC and ETH at
high rates for the first two transfers (data not shown). During the
second transfer, the culture had been fed more PCE doses than ever
before, to determine the dechlorination limits of this organism under
the present conditions. The doses of PCE consumed consecutively
were: 0.4, 0.6, 0.8, 1.0, 1.2, 1.4, 1.6, 1.8 mmol/1 PCE (total of 8.8
mmol/1 PCE in nominal concentration, in 12 days). "D. ethenogenes"
strain 195 showed no limitation of dechlorination. All PCE doses,
including the last one (which is just below the limit of solubility in
water for PCE), were transformed almost stoichiometrically to VC and
ETH, without signs of substrate or product inhibition.
This rapidly dechlorinating culture was then transferred a third
197

198
time into fresh medium ("Transfer #3"). Contrary to the first two
transfers and against all expectations, the newly transferred culture
was unusually slow in dechlorinating PCE (Fig. A.1). It took 10 days
to dechlorinate the first dose of PCE (0.3 mmol/1), about twice the
time expected, and there was substantial accumulation of
intermediates (TCE and DCEs), a sign that the culture was limited in
some way. There was no apparent explanation for the sudden slow
down of the culture's ability to dechlorinate. All the conditions in
which the culture had been transferred were identical to the ones in
the past two transfers, and "D. ethenogenes" strain 195 should have
grown and dechlorinated in no different manner. Several initial
hypothesis were presented:
1). An error in the preparation of the media or the buffering
system (HCO3-/CO2) utilized could have caused the pH to be off the
neutral zone. The pH in the culture was found to be at 6.9.
2). The cell extract obtained from the mixed butyrate/PCE
culture (the key ingredient in growing "D. ethenogenes" strain 195
axenically) has a limited time span of activity. After 4 to 7 weeks at
4°C, the extract gradually loses its ability to sustain dechlorination in
the axenic culture, probably due to degradation or inactivation of the
active ingredient(s) that it contains. Because the extract utilized for
the third transfer had been at 4°C for about 3.5 weeks, it seemed
plausible that the slow down in the culture's ability to dechlorinate
PCE could be due to an "aging" cell extract.
To determine the potency of the cell extract amendment, a
different culture (a culture grown for the first time in ampicillin) was
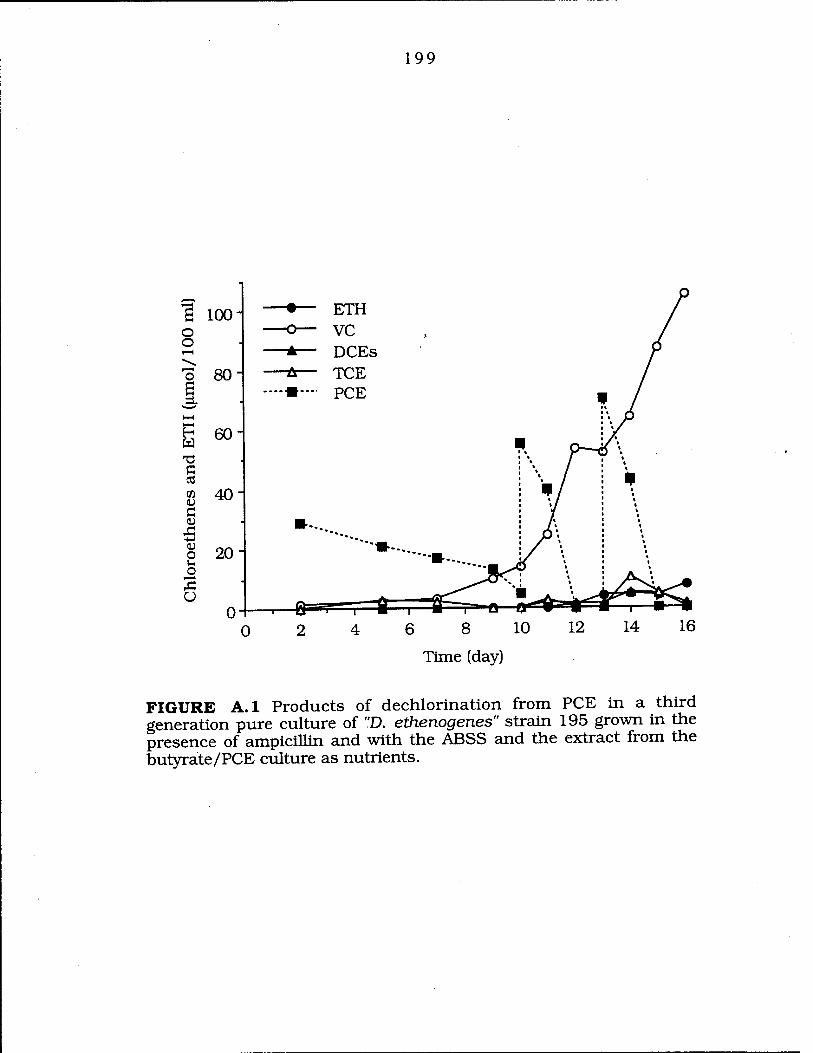
199
S 100- o o
o s
i T3
fi
6 <u 2 O
f—4
U
Time (day)
FIGURE A.l Products of dechlorination from PCE in a third generation pure culture of "D. ethenogenes" strain 195 grown in the presence of ampicillin and with the ABSS and the extract from the butyrate/PCE culture as nutrients.
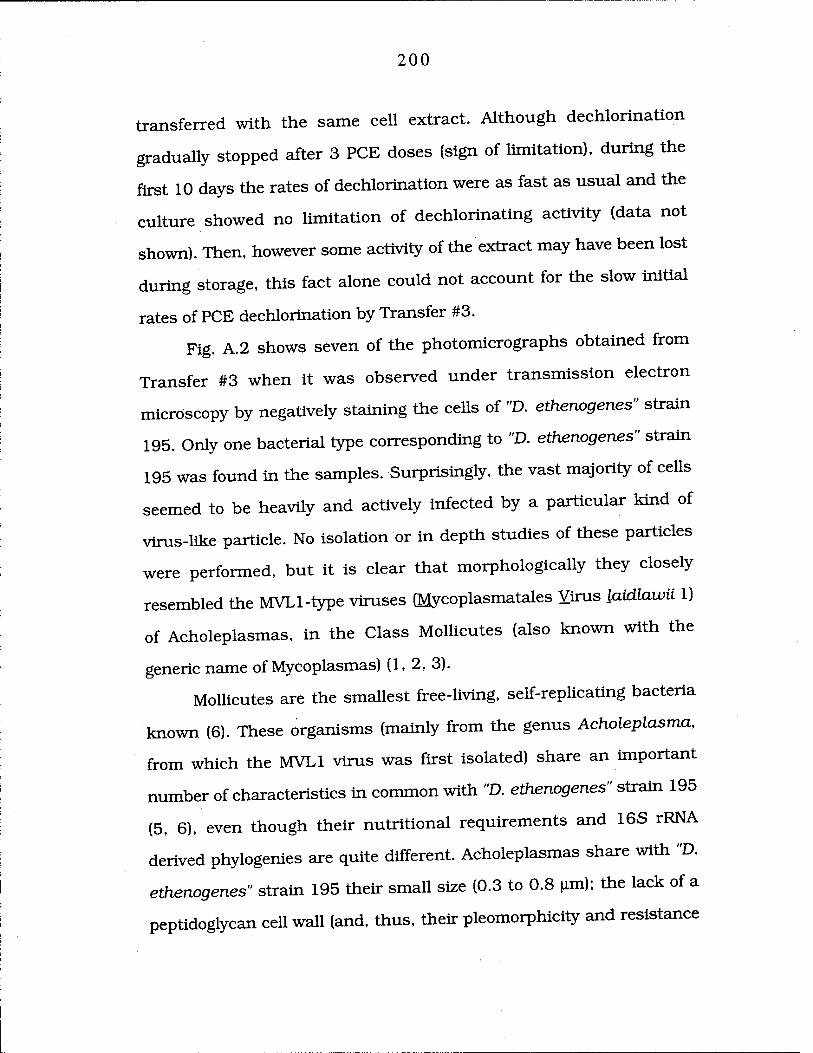
200
transferred with the same cell extract. Although dechlorination
gradually stopped after 3 PCE doses (sign of limitation), during the
first 10 days the rates of dechlorination were as fast as usual and the
culture showed no limitation of dechlorinating activity (data not
shown). Then, however some activity of the extract may have been lost
during storage, this fact alone could not account for the slow initial
rates of PCE dechlorination by Transfer #3.
Fig. A.2 shows seven of the photomicrographs obtained from
Transfer #3 when it was observed under transmission electron
microscopy by negatively staining the cells of "D. ethenogenes" strain
195. Only one bacterial type corresponding to "D. ethenogenes" strain
195 was found in the samples. Surprisingly, the vast majority of cells
seemed to be heavily and actively infected by a particular kind of
virus-like particle. No isolation or in depth studies of these particles
were performed, but it is clear that morphologically they closely
resembled the MVLl-type viruses (Mycoplasmatales Virus laidlawii 1)
of Acholeplasmas, in the Class Mollicutes (also known with the
generic name of Mycoplasmas) (1, 2, 3).
Mollicutes are the smallest free-living, self-replicating bacteria
known (6). These organisms (mainly from the genus Acholeplasma,
from which the MVL1 virus was first isolated) share an important
number of characteristics in common with "D. ethenogenes" strain 195
(5, 6), even though their nutritional requirements and 16S rRNA
derived phylogenies are quite different. Acholeplasmas share with "D.
ethenogenes" strain 195 their small size (0.3 to 0.8 ^im); the lack of a
peptidoglycan cell wall (and, thus, their pleomorphicity and resistance

201
FIGURE A.2 Negatively stained (2% UA) preparations of D. ethenogenes" strain 195. (a) and (b) show, respectively, two and one potentially non-infected cells surrounded by bullet-shaped viral particles, (c) Shows an infected, lysed cell, (d) Shows a non-lysed, infected cell, (e) Shows three very infected cells, one of which Has lvsed ff) Shows a verv infected cell with numerous viral structures extruding from the cell, (g) Shows a cluster of bullet-shaped viral particles attached to a membrane. Marker bars represent: 0.5 ^im laj- (e); 0.2 urn (f); and 0.1 um (g).
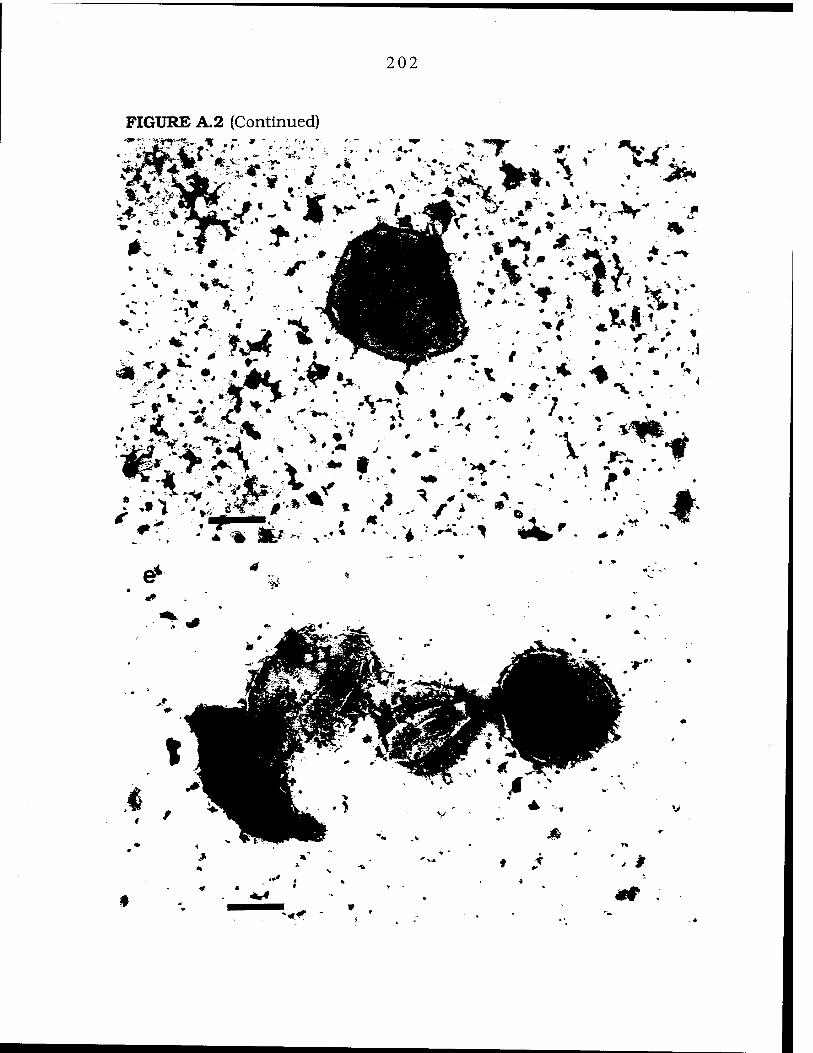
202
FIGURE A.2 (Continued)
«f <*. *
■».'
**
■* *
1 ^ ' •
5> •
a •9
* >>Oi -\y. ■■*■ t *. ^
* *. *
\ w *
*?*
4
.« * . V''-*^--'^ *■%- ^ *
*.v

203
FIGURE A.2 (Continued)

204
to peptidoglycan targeted antibiotics); non motility; multiplication by
binary fission; fastidious growth; and, as "D. ethenogenes" strain 195,
they were first isolated from sewage.
MVL1 viruses are naked rod- or bullet-shaped particles that are
assembled at and protrude from the surface of the infected cell (1).
The mechanisms of viral DNA penetration into the host are unknown.
The infection is non-lytic, which leads to persistently infected cells,
and virus maturation and release are coupled and involve interactions
with the cell membrane which do not seem to affect viability,
although infected cells grow more slowly than do uninfected control
cells (4). Evidence indicates that some whole viral genomes are
integrated into the host chromosome (6). Normal infectious particles
measure 13-16 by 80-90 run, and they have been observed to be twice
as long occasionally. This virus contains single-stranded, covalently
closed circular DNA with a molecular weight of 1.5-2xl06 (2, 3).
The photomicrographs taken from the slow-growing, Transfer #3
of "D. ethenogenes" strain 195 of Fig. A.2 showed the typical
pleomorphic coccoid shape with size ranges from 0.6 to 1 |im in
diameter. No contaminating bacteria were present in the samples. Fig.
A.2 (a) and (b) show, respectively, two and one apparently non-
infected cells surrounded by bullet-shaped viral-like particles. Non-
infected cells were very rare and constituted a very small proportion of
the total number of cells in the samples. The sizes of the viral-like
particles ranged from 35 to 60 nm in width and 100 to 200 nm in
length. This is also seen in better detail in Fig. A.2 (g), which shows,
at higher magnification, a cluster of bullet-shaped viral-like particles

205
attached to a fragment of membrane {this is also seen at the right and
left lower part of Fig. A.2 (d)}. Fig. A.2 (c), (e) and (f) show cells that
had been heavily infected. Two of the cells shown had lysed and still
showed viral particles attached to their membranes, as did all other
infected cells. Most of the cells encountered in the study, although
heavily infected, were not lysed. This fact opens the possibility for
these cells to be metabolically active, though with low levels of
activity, which would account for the low levels of dechlorination
measured in Fig. A.l. Two types of viral-like particles could be seen in
the micrographs from Fig. A.2: bullet-shaped particles of regular
structure that were found free in the medium or attached to the cell
envelope; and elongated irregular rod-like particles that were only
found protruding from cell envelopes {see Fig. A.2 (f)}.
To determine that this overall heavily infected culture was a
finding unique to the slow-growing, Transfer #3 of "D. ethenogenes"
strain 195, several other cultures that dechlorinated at normal fast
rates were negatively stained and observed under electron microscopy
(data not shown). A sample from a mixed culture that grew on
H2/PCE and had been at 4°C for 14 months showed non-infected cells
in all observations. A very low number of bullet-shaped viral particles
were found, and none of them attached to any cell. Another sample
from a mixed culture that also grew on H2/PCE and had been at 4°C
for over 2 years also showed all cells to be free of viruses. In this case,
no bullet-shaped particles were found. No elongated rod-shaped viral
particles were found in either culture. Both cultures contained rod-
shaped cells (the other main morphology in the mixed culture; see

206
Chapter Two) as well as "D. ethenogenes" strain 195 cells. In both
samples as well, several other types of viruses were found, as it can be
seen in Fig. A.3.
A sample of the culture that had been utilized as inoculum for
the heavily infected culture (Transfer #3) was also negatively stained
and observed under the electron microscope (data not shown). Only
cells of "D. ethenogenes" strain 195 were found, at a very high cell
density (when compared to any of the other samples). There were no
lysed cells nor heavily infected cells and the culture appeared perfectly
"healthy", except for the fact that almost each and every cell had a
bullet-shaped particle attached to the cell envelope. Only a few of the
cells showed more than one virus attached. There were no elongated
rod-shaped morphologies on cells, seen so profusely in the actively
infected culture.
The actively infected, slow dechlorinating culture (Transfer #3)
was transferred into fresh medium only after the third dose of PCE
had been consumed (at Day 16). Fig. A.4 shows the pattern of
dechlorination exhibited by this overall fourth transfer of the pure
culture. Surprisingly, the pattern and rates of PCE dechlorination
were as fast as they had ever been up to that point. PCE was
dechlorinated to VC and ETH faster with time and with very little
accumulation of intermediates. If a viral infection had been the cause
of the slow down in the culture's ability to dechlorinate PCE in the
previous transfer, at this point the phase of infection had to have
past. If true, we should not find actively infected cells. Negative stains

207
FIGURE A.3 Negatively stained (2% UA) viral particles obtained from preparations from purified mixed H2/PCE cultures. Bars are: (a) 0.2 jim; (b) 0.1 |im: and (c) 0.2 |im.

208
FIGURE A.4 PCE dechlorination and product formation by "D. ethenogenes" strain 195 transferred from the heavily infected, slow- dechlorinating culture (transfer #3).
209
of this culture showed coccoid cells only, reaffirming the purity of the
culture, which appeared very healthy with only a few bullet-shaped
viruses present, none of them attached to any cell (data not shown),
confirming the prediction. This culture was transferred again with
identical good growth and PCE dechlorination patterns. No further
phase of aggressive viral infection like the one described above has
been found again and cultures have grown and dechlorinated PCE at
fast rates since.
These viral particles could have been present in the culture
since its initial enrichment some years before I started working in this
project. Nevertheless, they could also have been brought in by a
complex amendment like the sludge supernatant (SS), which was
added to the culture as a required nutrient. When a sample of SS was
negatively stained and observed under electron microscopy, no bullet-
shaped viruses were found (although polyhedral and round viruses
were observed; data not shown)). The cell extract from the mixed
butyrate/PCE culture, also added as a required amendment, was then
examined. A sample from the first extract produced and another
sample from the newer batch of extract yielded no bullet-shaped virus
particles under electron microscopy (data not shown).
Even though there may be many explanations for the
potentially heavily infected culture showing slow dechlorination rates,
and there is no assurance that the viral infection had a direct
relationship with the slowdown of the culture, an explanation
relating the cause of the slowdown to viral infection appears
plausible. Although the origin of these viral particles is unknown, it is
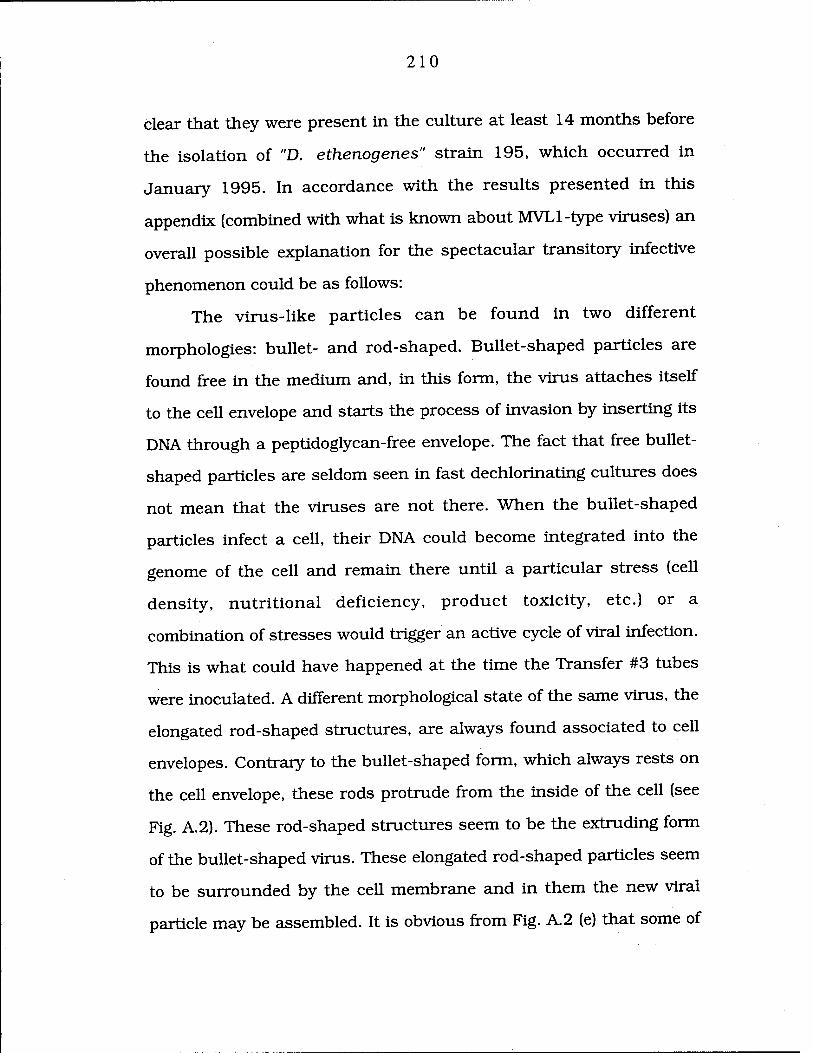
210
clear that they were present in the culture at least 14 months before
the isolation of "D. eth.enogen.es" strain 195, which occurred in
January 1995. In accordance with the results presented in this
appendix (combined with what is known about MVLl-type viruses) an
overall possible explanation for the spectacular transitory infective
phenomenon could be as follows:
The virus-like particles can be found in two different
morphologies: bullet- and rod-shaped. Bullet-shaped particles are
found free in the medium and, in this form, the virus attaches itself
to the cell envelope and starts the process of invasion by inserting its
DNA through a peptidoglycan-free envelope. The fact that free bullet-
shaped particles are seldom seen in fast dechlorinating cultures does
not mean that the viruses are not there. When the bullet-shaped
particles infect a cell, their DNA could become integrated into the
genome of the cell and remain there until a particular stress (cell
density, nutritional deficiency, product toxicity, etc.) or a
combination of stresses would trigger an active cycle of viral infection.
This is what could have happened at the time the Transfer #3 tubes
were inoculated. A different morphological state of the same virus, the
elongated rod-shaped structures, are always found associated to cell
envelopes. Contrary to the bullet-shaped form, which always rests on
the cell envelope, these rods protrude from the inside of the cell (see
Fig. A.2). These rod-shaped structures seem to be the extruding form
of the bullet-shaped virus. These elongated rod-shaped particles seem
to be surrounded by the cell membrane and in them the new viral
particle may be assembled. It is obvious from Fig. A.2 (e) that some of

211
these rod filaments contain a bullet-shaped virus at their outermost
tip, which is still connected to the cell by a thinner bridge, probably-
formed by the cell envelope itself. At a particular point in time, the
bullet-shaped virus detaches itself from the cell, becoming free moving
in the medium. If the cycle is non-lytic, this would account for the
slow growth and dechlorination observed in the infected culture
(Transfer #3). The faster growth rates of non-infected cells with
respect to infected ones could, by itself, diminish a generalized
infective process and turn the balance towards an overall non-
infected, fast growing and dechlorinating culture (this could be a
reason why a transfer of Transfer #3 behaved and looked normally).
If this hypothesis is true, some kind of stress triggered the
infectious wave in the culture that had just then been utilized as
inoculum for the transfer that proved to be heavily infected. The
possibility that the triggering of this infectivity could be cell-
concentration dependent is not negligible. The culture used as
inoculum for the heavily infected transfer was unusually dense. A
10% v/v extract from the buryrate/PCE culture was used for the first
time (usually a 5% v/v was used) and the response of the culture to it
was extraordinary. "D. ethenogenes" strain 195 consumed more PCE
doses faster than ever before, with the consequence that the cell
density was the highest we had ever gotten (considering that this was
a pure culture).

212
REFERENCES
1. Cole, R. M. 1979. Mycoplasma and Spiroplasma viruses: ultrastructure, p. 385-410. In Barile, M. F. , and S. Razin (ed.), The Mycoplasmas. Academic Press, New York.
2. Cole, R. M. 1983. Virus detection by electron microscopy, p. 407- 412. In Tully, J. G. , and S. Razin (ed.), Methods in mycoplasmology. Academic Press, Inc., New York.
3. Maniloff, J. 1988. Mycoplasma viruses. CRC critical reviews in microbiology. 15: 339-389.
4. Maniloff, J. 1992. Mycoplasma viruses, p. 41-59. In Maniloff, J. (ed.), Mycoplasmas. Molecular biology and pathogenesis. American Society for Microbiology, Washington, D. C.
5. Razin, S., and E. A. Freundt. 1984. The mycoplasmas, p. 740- 781. In Krieg, N. R. , and J. G. Holt (ed.), Bergey's manual of systematic bacteriology. Williams & Wilkins, Baltimore.
6. Tully, J. G. 1992. Mollicutes (Mycoplasmas), p. 181-192. In Lederberg, J. (ed.), Encyclopedia of microbiology. Academic Press, Inc., San Diego.

APPENDIX B
NUTRIENT STUDIES: SLUDGE SUPERNATANT (SS)
"Shame mishtake, shurely?'
Catch-phrase in Private Eye magazine, 1980s.
Preliminary studies on the SS have been described in Chapter
Two of this dissertation, before the isolation of "D. ethenogenes" strain
195 had been accomplished. In the pure culture, experiments to try to
substitute the SS with a better defined amendment were performed,
with mixed results. Cultures growing with acetate, SS and cell extract
from the mixed butyrate/PCE culture were transferred into fresh
medium in the presence or absence of SS, in the presence or absence
of the cell extract, and into medium in which the SS had been
substituted by the following mixture of volatile fatty acids (VFA; in
parenthesis are their final concentrations in mM): Propionate (8);
butyrate (3.2); valerate (0.92); acetate (29.7); isovalerate (0.91);
isobutyrate (1.09); and 2-methyl-butyrate (0.82). As seen in Fig. B.l,
the presence or absence of these particular VFA solution did not
influence the dechlorination patterns of the culture. In a different
experiment, the same mixture of VFA did not sustain dechlorination
nor growth of the culture in the absence of SS after 32 days (data not
shown). As Fig. B.l shows, cultures containing SS and lacking cell
extract did not sustain dechorination. On the contrary, though, cul-
213

214
3001
•g 250 o o S 200 o
I ü 150 >
U 100-
-o-
+ SS, - cell extract + SS. + cell extract - SS, + cell extract + SS, + cell extract, + VFA - SS, + cell extract, + VFA
/ P
FIGURE B.l Cultures that had been growing with acetate, SS and cell extract from the mixed butyrate/PCE culture were transferred into fresh medium in the presence or absence of SS, in the presence or absence of the cell extract, and into medium in which the SS had been substituted by the next mixture of volatile fatty acids (VFA; in parenthesis are the final concentrations in mM): Propionate (8); butyrate (3.2); valerate (0..92); acetate (29.7); isovalerate (0.91); Isobutyrate (1.09); and 2-methyl-butyrate (0.82). The graph shows VC and ETH formation from PCE by these transfers.

215
tures containing cell extract and no SS dechlorinated PCE to VC and
ETH with no accumulation of intermediates, although the rates were
slower than in controls containing both amendments. This culture
lacking SS (containing cell extract) was transferred four more times
under the same conditions (data not shown). Although dechlorination
was sustained in all transfers, each time the culture was transferred,
the accumulation of intermediates (TCE and DCEs) increased. In the
last transfer, almost no ETH was produced and both TCE and DCE
isomers accumulated to elevated amounts when compared with the
control cultures containing SS.
On one hand, from results obtained in Chapter Three of this
dissertation, it is clear that the cell extract contains one or more
nutrients, not present in the SS, that are required by the culture in
order to grow and dechlorinate PCE axenically. On the other hand,
from the results of Fig. B.l, the cell extract is able to partially
substitute for the SS, which means that at least one of the required
nutrients present in the SS is also present in the cell extract.
To determine the possibility that the required nutrient(s) in the
SS that was not present in the cell extract was an amino acid, a
sterile, vitamin free Bacto Casamino acids (CA; Difco, Detroit, MI)
solution was prepared anaerobically to be added in substitution of the
SS. The CA solution contains all the amino acids except for
asparagine, glutamine, cysteine and tryptophan. Fig. B.2 shows the
results of an experiment in which "D. ethenogenes" strain 195 was
transferred into eight sets of tubes under different conditions. All
tubes contained cell extract, and all were tested with and without the

216
3001
_ 250:
o 2 200
*o
1 150
g • c loo i
50-
+SS -ss +SS, +CA (1) -SS, +CA (1) +SS, +CA, +YE (1) -SS, +CA, +YE (1)
+SS, +CA (10) -SS, +CA (10)
3 4 5
Time (Day)
FIGURE B.2 Product formation (ETH and VC) from PCE by "D. eth.enogen.es" strain 195 transferred into eight sets of media under different conditions: All tubes contained cell extract from the mixed butyrate/PCE culture, and all were tested with and without the Casamino acids solution (plus or minus yeast extract), in the absence or presence of SS. Numbers in parenthesis represent amounts of amendments, in mg/ml.

217
CA solution (plus or minus yeast extract), in the absence or presence
of SS. Three main responses can be observed in Fig. B.2. Cultures
without SS dechlorinated PCE at low rates, as seen also in Fig. B.l.
Cultures with and without SS dechlorinated PCE with similar rates
during the first 3 days in the presence of casaminoacids
(independently of the amount added). After that, cultures lacking SS
showed lower rates of PCE dechlorination than cultures where SS was
present. These cultures were all observed using phase-contrast
microscopy and no contamination was found. At Day 4, cultures
grown with SS had no PCE left, and a new dose was not administered
until Day 5, hence the delay in product formation in these cultures
from Day 4 to Day 5. This fact accounts for a greater difference in VC
and ETH formation between cultures having and lacking SS than that
showed in Fig. B.2. The results show that one or more amino acids
are required by the culture. Nevertheless, because the rates of PCE
dechlorination are still better in the presence of SS than with the CA
solution, a different nutrient present only in SS must account for this
difference. This nutrient, specific to the SS, is not a common nutrient
that would be found, for example, in yeast extract, because in the
presence of Casamino acids, yeast extract had no effect in the ability
of the culture to dechlorinate.
One of the cultures grown with no SS and with the CA solution
was transferred under the same and opposite (with SS and no CA)
conditions. The results (data not shown) were very similar to the ones
obtained in Fig. B.2. The cultures with SS instead of the CA solution
had higher rates of dechlorination than did the ones having the CA
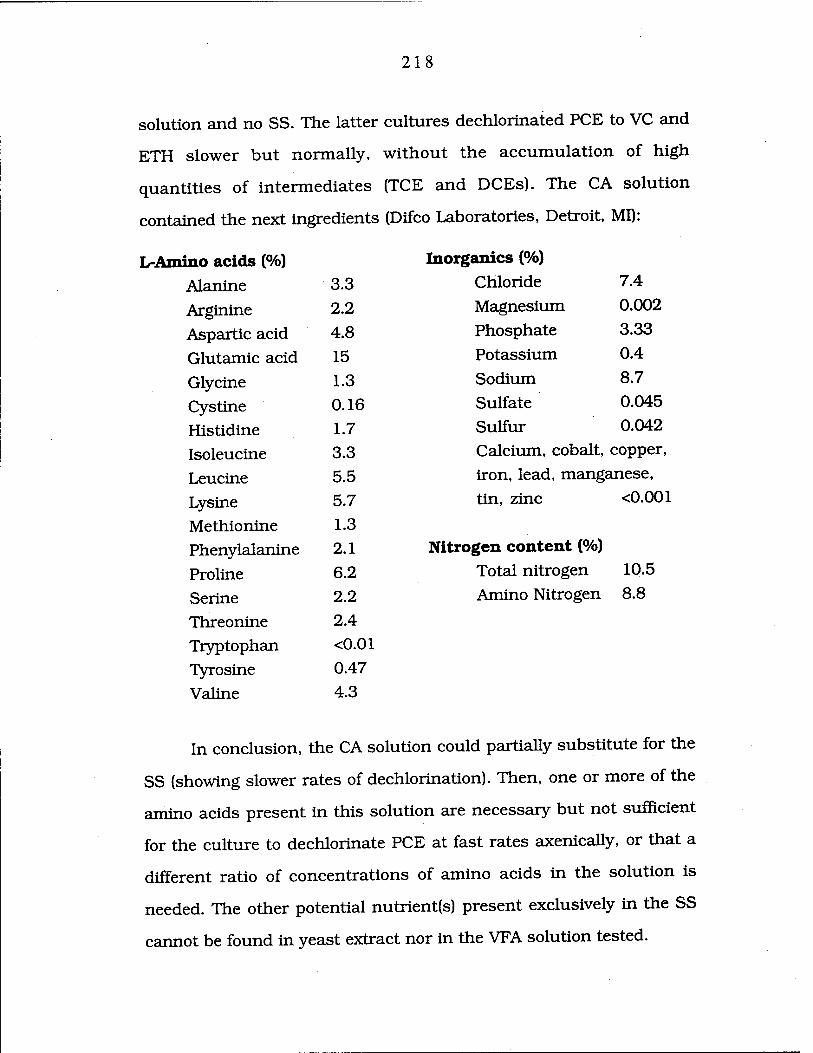
218
solution and no SS. The latter cultures dechlorinated PCE to VC and
ETH slower but normally, without the accumulation of high
quantities of intermediates (TCE and DCEs). The CA solution
contained the next ingredients (Difco Laboratories, Detroit, MI):
L-Amino acids (%) Inorganics (%)
Alanine 3.3 Chloride 7.4
Arginine 2.2 Magnesium 0.002
Aspartic acid 4.8 Phosphate 3.33
Glutamic acid 15 Potassium 0.4
Glycine 1.3 Sodium 8.7
Cystine 0.16 Sulfate 0.045
Histidine 1.7 Sulfur 0.042
Isoleucine 3.3 Calcium, cobalt, copper,
Leucine 5.5 iron, lead, manganese,
Lysine 5.7 tin, zinc <0.001
Methionine 1.3 Phenylalanine 2.1 Nitrogen content (%)
Proline 6.2 Total nitrogen 10.5
Serine 2.2 Amino Nitrogen 8.8
Threonine 2.4
Tryptophan <0.01
Tyrosine 0.47
Valine 4.3
In conclusion, the CA solution could partially substitute for the
SS (showing slower rates of dechlorination). Then, one or more of the
amino acids present in this solution are necessary but not sufficient
for the culture to dechlorinate PCE at fast rates axenically, or that a
different ratio of concentrations of amino acids in the solution is
needed. The other potential nutrient(s) present exclusively in the SS
cannot be found in yeast extract nor in the VFA solution tested.

APPENDIX C
NUTRIENT STUDIES: SUBSTITUTION OF THE CELL EXTRACT FROM
THE MIXED BUTYRATE/PCE CULTURE
"To ask the hard question is simple"
W.H. Auden 1907-73, Poems (1933) no. 27
Before the isolation of "D. ethenogenes" strain 195, the mixed
H2/PCE culture showed, apart from the dechlorinator, one other
major morphotype in high numbers (a short rod) and a third less
numerous morphology (a long rod) (see Fig. 2.9). Because "D.
ethenogenes" strain 195 was originally isolated (see Chapter Three)
with the cell extract from this mixed H2/PCE culture, it was of
interest to isolate the short rod to see if an extract from this
organism would contain the nutrient(s) required to grow the
dechlorinator axenically. The cell extract obtained from the mixed
butyrate/PCE culture, which has been utilized to grow "D.
ethenogenes" strain 195 since shortly after its isolation, has a limited
time span of affectiveness (see Appendix A). Then, its substitution for
a more defined, maybe more stable extract was of interest.
To isolate the short rod (named Strain DSR, for Dechlorinator
Syntrophic Rod; work performed by Timothy Anguish), a mixed
H2/PCE culture was serially diluted. The lower dilution (lO-6) was
219
220
inoculated into agar roll tubes containing yeast extract (YE, 1 mg/ml)
and SS and, once colonies were visible, a clean colony was picked and
serially diluted again, down to 10"6.
To obtain the best possible growth of Strain DSR, so that cell
extracts would increase in their activity, an initial characterization of
this organism was performed. Strain DSR is a Gram-positive short
rod in stationary phase, but is longer and more motile during the
growth phase. This organism was grown under different conditions
and the O.D. was measured at 600 run after 54 h (Table C. 1).
Strain DSR did not grow on glucose, but grew, as expected, on
YE. Increasing concentrations of YE favored more growth of this
organism, and YE seemed to partially substitute for the SS
requirement that this organism also had. Growth was stimulated by
addition of Casamino acids (CA). The best growth was obtained when
both YE and CA were present at high concentrations, as observed also
under phase contrast microscopy.
The ability of YE to make the requirement for SS unnecessary
was investigated further (data not shown). Strain DSR growing with 2
g/1 YE and no SS was transferred into medium containing YE and
CA, both at 5 g/1. After 43 h, cultures containing SS were as dense as
cultures without it (O.D. at 600 nm of 0.545 and 0.552 respectively)
and both showed no contamination when observed under phase
contrast microscopy. These cultures were transferred several times
without SS. Thus, strain DSR can grow with or without SS.
Now that a good nutrient supplement had been found for Strain
DSR, this organism could grow to high density in a short time.

221
TABLE C. 1 Effects of adding different nutrient amendments on the growth of Strain DSR, as measured by optical density (600 nm after 54 hours of incubation).
Amendment O. D. (600 nm)
YE (2 g/1) 0.186
YE (2 g/l)-SS 0.113
YE (5 g/1) 0.360
CA (2 g/1) 0.086
Glucose (20 Mm) 0.008
YE (2 g/l)+CA (2 g/1) 0.345
YE (5 g/l)+CA (5 g/1) 0.653
222
Therefore, a cell extract from Strain DSR was tested for its ability to
substitute for the extract from the butyrate/PCE culture. The extract
from Strain DSR was prepared by the same procedure as the one used
for the butyrate/PCE culture described in Chapter Three (by rupture
with a French pressure cell and collection of the supernatant after
centrifugation at 17,000 rpm (39,000 x g) for 30 min.). Fig. C.l shows
that an extract from Strain DSR grown on YE and CA allowed poor
growth and dechlorination when compared to the cell extract from the
butyrate/PCE culture, the standard required amendment. Also, the
culture provided with the Strain DSR extract did not produce any
ETH by Day 11. To investigate this phenomenon further, we examined
both the particulate and the supernatant fractions of the extract from
Strain DSR after centrifugation (Fig. C.2). Both fractions had better
activity than no addition, and poorer activity than the butyrate-
culture extract, but substantially more PCE dechlorination occurred
in cultures amended with the particulate fraction of the culture —
almost as good activity as the butyrate-culture extract. This suggests
that the factor(s) in the rod culture are less soluble than they are in
the butyrate culture, in which we have found little activity in the
particulate fraction. There is some congruence between these findings
and our previously reported finding that the factor(s) are retained by a
50,000 MW filter (see Chapter Three of this dissertation).
According to the protocol followed to make both extracts
(described in Chapter Three), the last centrifugation was done at
17,000 rpm. To determine if a slower spin would maintain better
activity in the supernatant fraction of the extract from Strain DSR, a

223
120i
80
o o
o S
i £
60-
Extract 1 Extract 2
;t 11.4ETH 106 VC
OETH 27.7 VC
0 8 10 12 14 16 18 20 22 24
Time (day)
FIGURE C.l VC and ETH production by "D. ethenogenes" strain 195 when grown axenically with different cell extracts. Extract 1 = from butyrate/PCE culture; extract 2 = from Strain DSR.

224
120 i
Strain DSR-p -0
Strain DSR-sn
■D ° No extract
-i—i—W 6 7 8 9 10 11 12 13 14 15 16
Time (day)
FIGURE C.2 VC and ETH production by "D. ethenogenes" strain 195 when grown axenically with different cell extracts. Extract 1 = from butyrate/PCE culture; Strain DSR-p = pellet fraction of an extract from Strain DSR; Strain DSR-sn = supernatant fraction of an extract from Strain DSR.
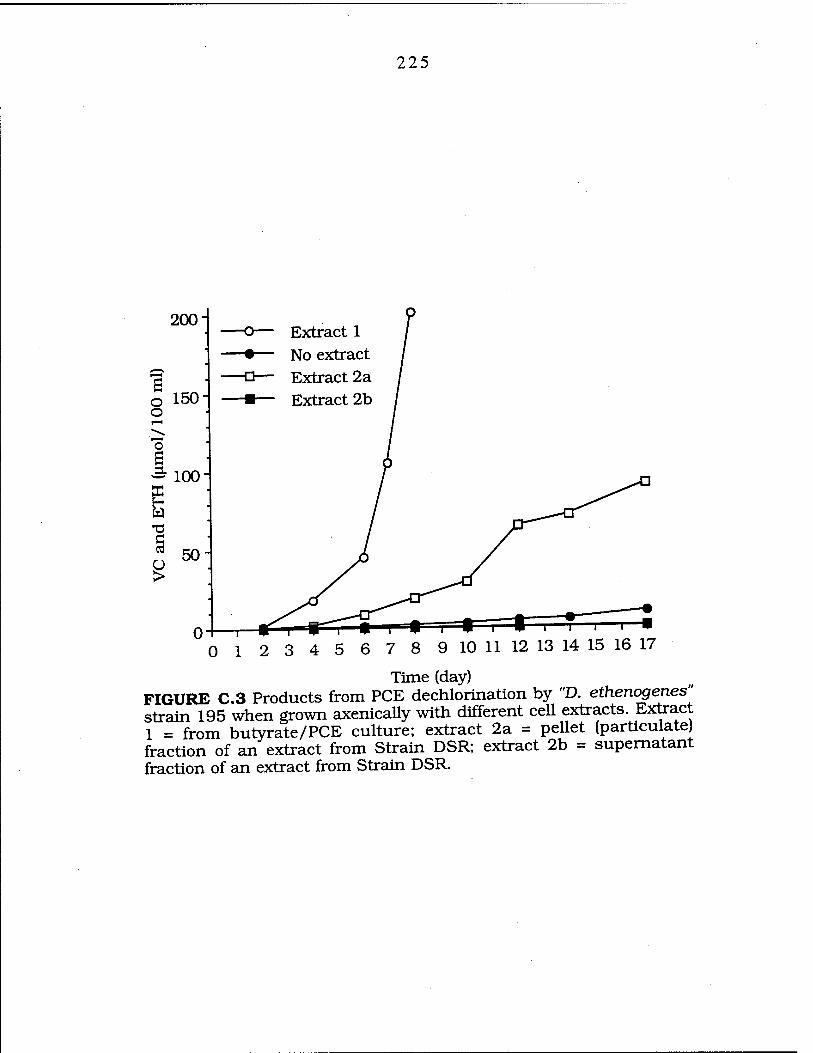
225
o o
200-
150
Extract 1 No extract Extract 2a Extract 2b
o
I ~ 100"
g
10 11 12 13 14 15 16 17
Time (day) FIGURE C.3 Products from PCE dechlorination by "D. ethenogenes" strain 195 when grown axenically with different cell extracts. Extract 1 = from butyrate/PCE culture; extract 2a = pellet (particulate) fraction of an extract from Strain DSR; extract 2b = supernatant fraction of an extract from Strain DSR.

226
similar experiment to that of Fig. C.2 was performed, but this time
the last centrifugation for the extract coming from Strain DSR was
done at 9,000 rpm. The results, depicted in Fig. C.3, were very similar
to the ones in Fig. C.2, therefore reaffirming that the presence of
activity was in the particulate fraction of the extract. Cultures grown
with the soluble fraction (supernatant after centrifugation) did not
dechlorinate PCE. The particulate fraction of the extract is, therefore,
necessary in the absence of extract from butyrate/PCE cultures but
not sufficient to equal its activity.
To determine if the partial-response obtained with extract from
Strain DSR was due to low levels of extract activity, a more
concentrated extract was produced. This new extract was
concentrated to lOOx (the extract used in the experiments described
above was 50x). The possible differences produced by the nutrients
(YE and/or CA) with which Strain DSR was grown were also
examined. As shown in Fig. C.4, the best response was obtained with
cultures of Strain DSR grown with YE only, even though the cultures
with YE and CA had higher cell density (data not shown). The poor
response obtained with particulate fractions of extracts from cultures
grown with both YE and CA has no explanation at this point. The
sole presence of extract from Strain DSR, although it sustained
dechlorination, was not completely satisfactory and it still indicated a
limitation in the ability of the culture to dechlorinate and grow
axenically without the extract from the butyrate/PCE culture. "D.
ethenogenes" strain 195, grown in the presence of extract from Strain
DSR only, was transferred twice under the same conditions (data not

227
3001
250 i
o 200
I 150'
^ 1001
Extract 1 No extract Extract 2a Extract 2b Extract 3a Extract 3b
0 1 4 5 6 7
Time (day)
10 11
FIGURE C.4 Products from PCE dechlorination by "D. ethenogenes" strain 195 when grown axenically with different cell extracts. Extract 1 = from butyrate/PCE culture; extract 2a = particulate fraction of Strain DSR grown with YE (5 g/1); extract 2b = supernatant fraction of Strain DSR grown with YE (5 g/1); extract 3a = particulate fraction of Strain DSR grown with YE and CA (5 g/1 each); extract 3b = supernatant fraction of Strain DSR grown with YE and CA (5 g/1 each).
228
shown). Both consecutive transfers grew and dechlorinated PCE to VC
and ETH, in manner similar to the culture used as inoculum, shown
in Fig. C.4.
"D. ethenogenes" was grown in co-culture with Strain DSR, to
corroborate their synthropism and to determine their dechlorinating
performance together. As shown in Fig. C. 5, a first-generation culture
transferred from an inoculum grown in medium containing extract
from the butyrate/PCE culture showed good dechlorination if
supplemented with the same extract, or with a small amount of yeast
extract (0.2 g/1) and a pure culture of Strain DSR (2% v/v inoculum).
The performance with Strain DSR was as good as that of the culture
containing the extract. Cultures receiving neither extract nor Strain
DSR cells produced minimal amounts of dechlorination products
(data not shown).
"D. ethenogenes" strain 195 often requires two transfers into new
medium before nutrient deficiencies become apparent, and therefore
we transferred the co-culture a second time (data not shown).
Cultures receiving no YE, so that no growth of the rod could occur,
did not dechlorinate PCE to any significant extent. Control cultures
receiving extract from the butyrate/PCE culture and ampicillin to
inhibit growth of the rod showed, as usual, good dechlorination.
Cultures amended with YE to allow growth of Strain DSR
dechlorinated PCE at a lower rate than the cultures receiving extract
from the butyrate/PCE culture, and eventually showed limitation, as
evidenced by accumulation of TCE and DCEs. These results are in
accordance with the ones found in Fig. C.5.

229
300n
<■»> 250 s o o r-H 200 ,_? o s i 150 X s T3 100
O > 50
0
—o- D. ethenogenes strain 195
D. ethenogenes strain 195 + Strain DSR
0
FIGURE C.5 PCE dechlorination products from "D. ethenogenes" strain 195 cultures to which additions of either extract from the butyrate/PCE culture or a culture of Strain DSR (plus 0.2 g/1 YE) were made. All cultures were amended with 2 mM acetate, vitamins, and 25% v/v SS. The inoculum was a pure culture amended with butyrate pellet.

230
A further transfer of the co-culture to a third generation showed
little dechlorination twelve days after inoculation (Fig. C.6), while
control cultures receiving extract from the butyrate/PCE culture
showed significant dechlorination (demonstrating that the culture
was active under the right nutritional conditions). At Day 12, an
addition of CA was made to the co-culture, which greatly increased
growth of Strain DSR by Day 14, as observed by phase contrast
microscopy. Several days later, the culture began rapid and extensive
PCE dechlorination.
These results show that YE is required by Strain DSR in order
to grow, because after adding CA to cultures of Strain DSR, only
cultures containing YE showed increased turbidity and very
significant rod growth. In cultures lacking YE, Strain DSR did not
grow even after CA had been added, as observed by phase contrast
microscopy. After CA was added to the co-culture, good PCE
dechlorination was not observed until 11 days after the CA
amendment. This probably means that only after Strain DSR entered
advanced stationary (or death) phase did dechlorination by "D.
ethenogenes" strain 195 start (the growth of a Strain DSR culture
normally stops after about 60 hours). Either a product of CA
metabolism or/and a molecule/s from the rod is/are probably
required by the dechlorinator.

231
tmmtTttrr^ i ■ i ■ i ■—i ■ i • i • ■
10 12 14 16 18 20 22 24 26 28 30
Time (day)
FIGURE C.6 PCE dechlorination products in third generation co- cultures. On Day 12, 0.2 g/1 Casamino acids (CA), a substrate for the Strain DSR, was added to further stimulate its growth. 1 = "D. ethenogenes" strain 195 (in pure culture), with extract from the butyrate/PCE culture; 2 = "D. ethenogenes" strain 195 (in pure culture), with no cell extract; 3 = co-culture with 0.4 g/1 YE; 4 = co- culture with no YE.
232
'Yes, there is a Nirvana;
it is in leading your sheep to a green pasture,
and in putting your child to sleep,
and in writing the last line of your poem"
Kahlil Gibran, Sand and Foam, 1970, p. 69
AlfredA-Knqft, ed., New York