taminco corporation second quarter 2014...
TRANSCRIPT

Taminco Corporation Second Quarter 2014 Earnings
Conference Call, August 7, 2014

Disclaimer
FORWARD-LOOKING STATEMENTS
Any statements made in this presentation that are not statements of historical fact, including statements about our beliefs and expectations, are forward-looking statements within the meaning of the federal securities laws, and should be evaluated as such. Forward-looking statements include information concerning possible or assumed future results of operations, including descriptions of our business plan and strategies. These statements often include words such as “anticipate,” “expect,” “suggests,” “plan,” “believe,” “intend,” “estimates,” “targets,” “projects,” “should,” “could,” “would,” “may,” “will,” “forecast,” and other similar expressions. We base these forward-looking statements or projections on our current expectations, plans and assumptions that we have made in light of our experience in the industry, as well as our perceptions of historical trends, current conditions, expected future developments and other factors we believe are appropriate under the circumstances and at such time. As you read and consider this presentation, you should understand that these statements are not guarantees of performance or results. The forward-looking statements and projections are subject to and involve risks, uncertainties and assumptions and you should not place undue reliance on these forward-looking statements or projections. Although we believe that these forward-looking statements and projections are based on reasonable assumptions at the time they are made, you should be aware that many factors could affect our actual financial results or results of operations and could cause actual results to differ materially from those expressed in the forward-looking statements and projections. We undertake no obligation to update or revise any forward-looking statements, whether as a result of new information, future events or otherwise. If we do update one or more forward-looking statements, there should be no inference that we will make additional updates with respect to those or other forward-looking statements.
FURTHER INFORMATION
This presentation should be read together with our SEC filings, including with the “Management’s Discussion and Analysis of Financial Condition and Results of Operations” and the consolidated financial statements and the related notes thereto included in such filings. You may get these documents for free by visiting EDGAR on the SEC website at www.sec.gov. Alternatively, Taminco will arrange to send you our SEC filings if you request it by calling toll-free 1-800-831-9146.
For more information concerning factors that could cause actual results to differ materially from those contained in the forward-looking statements please refer to the “Risk Factors” section of our Annual Report on Form 10-K and subsequent reports filed by the Company with the Securities and Exchange Commission.
NON-GAAP FINANCIAL MEASURES
In this presentation, Taminco presents Adjusted EBITDA, Adjusted EBITDA margin, and Recurring Free Cash Flow because it believes these measures are useful as supplemental measures in evaluating the performance of its operating businesses and provide greater transparency into our results of operations. Adjusted EBITDA, Adjusted EBITDA margin, and Recurring Free Cash Flow should not be considered in isolation or as a substitute for net income, cash flow from operations or other statement of operations data prepared in accordance with U.S. GAAP. See Appendix for the definitions and reconciliations of these non-GAAP measures.
MARKET, RANKING AND OTHER INDUSTRY DATA
In this presentation we rely on and refer to information and statistics regarding our industry, the size of certain markets and our position within the sectors in which we compete. Our estimates have also been based on information obtained from our customers, suppliers and other contacts in the markets in which we operate. While we are not aware of any misstatements regarding any industry data presented herein, our estimates, in particular as they relate to market share and our general expectations, involve risks and uncertainties and are subject to change based on various factors, including those discussed under “Risk Factors,” “Cautionary Statement Regarding Forward-Looking Statements” and “Management’s Discussion and Analysis of Financial Condition and Results of Operations” in our SEC filings.
2
Second Quarter FY ‘14 Overview
3
Q21 FY’14
Q2 FY’13
YoY %
Volume (kT) 182 146 25%
Net Sales $370 $305 21%
Adjusted EBITDA $77 $66 17%
Adjusted EBITDA Margin
21% 22% (1%)
($ in millions)
Q2 FY ‘14 Performance Historical Adjusted EBITDA Trend
$203 $229 $240 $255 $270
15%
20%
25%
100
150
200
250
300
FY'10 FY'11 FY'12 FY'13 Q2'14 LTM
$M
M
Adjusted EBITDA Adjusted EBITDA Margin
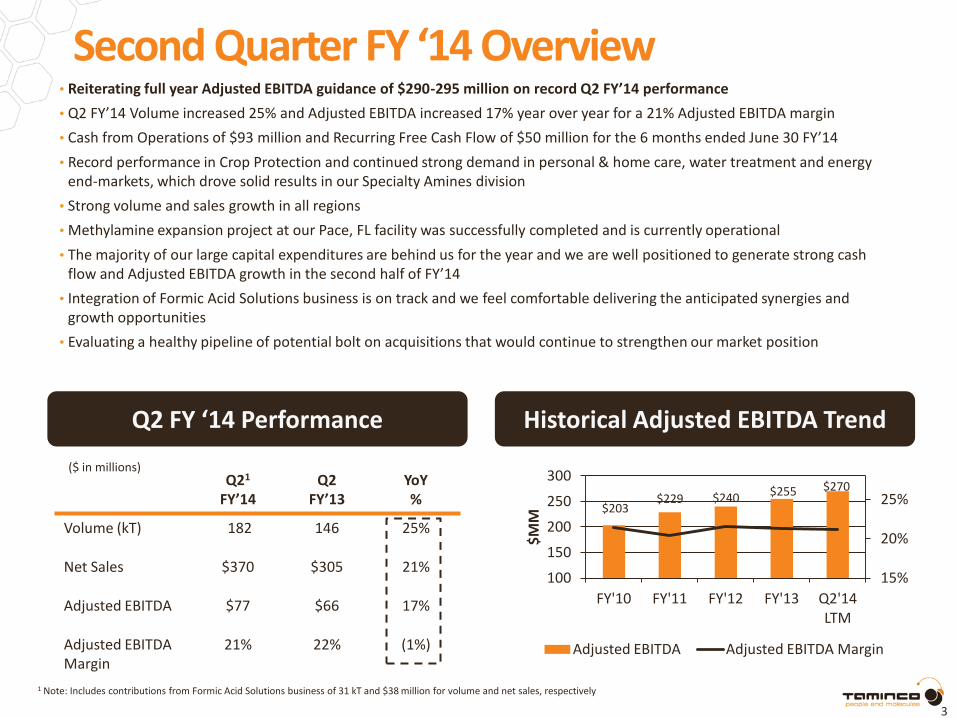
• Reiterating full year Adjusted EBITDA guidance of $290-295 million on record Q2 FY’14 performance
• Q2 FY’14 Volume increased 25% and Adjusted EBITDA increased 17% year over year for a 21% Adjusted EBITDA margin
• Cash from Operations of $93 million and Recurring Free Cash Flow of $50 million for the 6 months ended June 30 FY’14
• Record performance in Crop Protection and continued strong demand in personal & home care, water treatment and energy end-markets, which drove solid results in our Specialty Amines division
• Strong volume and sales growth in all regions
• Methylamine expansion project at our Pace, FL facility was successfully completed and is currently operational
• The majority of our large capital expenditures are behind us for the year and we are well positioned to generate strong cash flow and Adjusted EBITDA growth in the second half of FY’14
• Integration of Formic Acid Solutions business is on track and we feel comfortable delivering the anticipated synergies and growth opportunities
• Evaluating a healthy pipeline of potential bolt on acquisitions that would continue to strengthen our market position
1 Note: Includes contributions from Formic Acid Solutions business of 31 kT and $38 million for volume and net sales, respectively

Q2 FY ’14 Net Sales Mix
Q2 FY ’14 Net Sales by End Markets Q2 FY ’14 Net Sales by Region Q2 FY '14 Net Sales by Division
•Our top 5 end markets account for 82% of our Q2 FY ’14 net sales and continue to be driven by favorable mega-trends
•North America was up 10% year over year primarily due to higher volume in Specialty Amines
•Our European business was up 42% year over year due to strong sales across all divisions and the contribution of the Formic Acid Solutions business
• Emerging markets increased 10% from the prior period due to strong sales in Latin America of Specialty Amines and Crop Protection
4
Emerging Markets: 16% Americas:
50%
Top 5 Account for 82% of Q2 FY’14
Net Sales
Other 18%
Agriculture 30%
Personal & Home Care
20%
Water Treatment
12%
Animal Nutrition
14%
Energy 6%
North America
42%
Europe 42%
Asia 8%
Latin America
8%
Functional Amines
38%
Specialty Amines
51%
Crop Protection
11%

Divisional Highlights – Functional Amines
5
Q2 FY ‘14 Performance
• Volume – Flat year over year, driven by stronger demand in solvents and higher amines, offset by declines in methylamines and salts. Volumes grew 7% from Q1 FY ‘14
• Adjusted EBITDA - Decreased $2 million year over year to $30 million, which was primarily driven by lower margins due to a negative mix effect. The agriculture market improved from the first quarter and we saw good performance across home & personal care and oil & gas
Year-over-Year Comparison
Q2 FY’14
Q2 FY’13
Volume (kT) 75 75
Net Sales $140 $137
Adjusted EBITDA $ 30 $32
Adjusted EBITDA Margin 21% 23%
($ in millions)
Q2 FY’14
Volume 0%
Net Sales 2%
Adjusted EBITDA (6%)
Adjusted EBITDA Margin (2%)
Highlights Historical Adjusted EBITDA Trend
$106 $110
$122 $122 $117
15%
20%
25%
30%
90
100
110
120
130
FY'10 FY'11 FY'12 FY'13 Q2'14 LTM
$M
M
Adjusted EBITDA Adjusted EBITDA Margin

Divisional Highlights – Specialty Amines
6
Q2 FY ’14 Performance
• Volume - Increased 59% year over year for Q2 FY’14 primarily due to the contribution of the Formic Acid Solutions business and strong demand in personal & home care, energy and water treatment, both in the US and Europe. Animal nutrition was slightly weaker year over year
• Adjusted EBITDA - Increased 48% year over year to $34 million due to a full quarter’s contribution from the formic acid solutions business, increases in volume, higher pricing and product mix effects
Year-over-Year Comparison
Q21 FY’14
Q2 FY’13
Volume (kT) 92 58
Net Sales $188 $131
Adjusted EBITDA $34 $23
Adjusted EBITDA Margin 18% 18%
($ in millions)
Q2 FY’14
Volume 59%
Net Sales 44%
Adjusted EBITDA 48%
Adjusted EBITDA Margin
0%
Highlights Historical Adjusted EBITDA Trend
$57 $78 $80
$91
$104
5%
10%
15%
20%
25%
10
30
50
70
90
110
FY'10 FY'11 FY'12 FY'13 Q2'14 LTM
$M
M
Adjusted EBITDA Adjusted EBITDA Margin
1 Note: Includes contributions from Formic Acid Solutions business of 31 kT and $38 million for volume and net sales, respectively

Divisional Highlights – Crop Protection
7
Q2 FY ‘14 Performance
• Volume - Increased 15% year over year primarily due to strong European and Latin American performance. This was partially offset by lower volumes in soil fumigants in North America, which we expect to recapture in the second half of FY’14
• Adjusted EBITDA - Increased 18% year over year to $13 million, primarily due to higher pricing and positive mix effects, confirming the strong growth already achieved in Q1 FY’14
Year-over-Year Comparison
Q2 FY’14
Q2 FY’13
Volume (kT) 15 13
Net Sales $42 $37
Adjusted EBITDA $13 $11
Adjusted EBITDA Margin 31% 30%
($ in millions)
Q2 FY’14
Volume 15%
Net Sales 14%
Adjusted EBITDA 18%
Adjusted EBITDA Margin 1%
Highlights Historical Adjusted EBITDA Trend
$40 $41 $38
$42 $49
15%
20%
25%
30%
35%
40%
0
10
20
30
40
50
FY'10 FY'11 FY'12 FY'13 Q2'14 LTM
$M
M
Adjusted EBITDA Adjusted EBITDA Margin

Cash Flow and Balance Sheet Update
Recurring Free Cash Flow
8
Balance Sheet & Cash Flow
• Recurring Free Cash Flow of $50 million for the 6 months ended June 30, 2014:
$54 million of capital expenditures, including a significant part of the methylamine expansion project
• Free cash flow generation is expected to be robust in the second half of the year as well, following the completion of the methylamine capacity expansion at the Pace facility. Total capital expenditures for FY’14 is expected to be $85 million5
• Q2 FY ‘14 Adjusted EBITDA less Capex: $50 million2
• Cash & Cash Equivalents: $67 million
• Net Debt: $978 million
• Net Debt / LTM 6/30/14 Adjusted EBITDA: 3.4x4
• Trade working capital: $121 million which includes the impact of the Formic Acid Acquisition
Six months ended
June 30, 2014
Net Income (reported) 24
Plus: Depreciation and Amortization 66
Less: Change in Trade Working Capital 6
Less: Other1 (3)
Net Cash from Operations $93
Less: Capital Expenditures2 (54)
Free Cash Flow $39
Plus: Non-Recurring Cash Items3 11
Recurring Free Cash Flow $50
($ in millions)
1 Note: Primarily due to deferred taxes and amortization of debt costs
2 Note: Excludes intangibles.
3 Note: Includes non-recurring items such as transaction costs related to the Formic Acid Solutions acquisition and one-time expenses related to the Methylamines capacity expansion at the Pace facility 4 Note: Pro-forma for Formic Acid Solutions acquisition 5 Note: Tangible capital expenditures, which includes all capital expenditures required for Formic Acid Solutions
Financial Highlights

Appendix – Additional Information

Reconciliation of Net Income to Adjusted EBITDA
Reconciliation of Net Income to Adjusted EBITDA: Three and Six Months Ended June 30, 2014 and 2013
($ in millions)
10
2014 2013 2014 2013
Net Income (Loss) 14$ (13)$ 24$ (5)$
GAAP Income Taxes 6 (22) 10 (16)
Net Interest Expense & Def Fin. Fees 17 24 35 48
Operating Depreciation & Amortization 13 8 24 16
Acquisition Related Depreciation & Amortization 21 20 42 40
EBITDA 71$ 17$ 135$ 83$
Transaction and Integration Costs 3 - 9 -
Foreign Currency Exchange Gains/Losses (1) (1) (2) (3)
Joint-Venture Investment - - 1 1
Stock Option Compensation 1 - 1 -
Loss on Early Extinguishment of Debt - 12 - 12
Shutdown Costs Associated With Plant Expansion 3 - 3 -
Apollo Termination Fee - 35 - 35
Apollo Management Fee - 3 - 4
Adjusted EBITDA 77$ 66$ 147$ 132$
June 30, June 30,
Three Months Ended Six Months Ended

Reconciliation of Cash from Operations to Recurring Cash Flow
Reconciliation of Net Cash from Ops to Recurring Free Cash Flow: Six Months Ended June 30, 2014
($ in millions)
11
Actual
Six Months
Ended June 30, 2014
Net Cash Flows Provided by Operating Activities 93$
Capital Expenditures (54)
Free Cash flow 39
Non-recurring cash items 11
Recurring Free Cash Flow 50$

Use of Non-GAAP Financial Measures
We present Adjusted EBITDA, Adjusted EBITDA margin, and Recurring Free Cash Flow to enhance an investor’s understanding of our results of operations, financial condition, and cash generating ability of the operating business. EBITDA consists of profit for the period before interest, taxes, depreciation and amortization. Adjusted EBITDA consists of EBITDA and eliminates transaction costs, (ii) restructuring charges, (iii) foreign currency exchange gains/losses, (iv) non-cash equity in earnings/losses of unconsolidated affiliates net of cash dividends received (as we receive cash only when these unconsolidated affiliates pay us a dividend, regardless of equity-based earnings), (v) stock option compensation (vi) shutdown costs associated with plant expansion and (vii) Apollo management and director fees and expenses. Adjusted EBITDA margin reflects Adjusted EBITDA as a percentage of Net Sales. Recurring Free Cash Flow consists of net cash flow provided by operating activities and eliminates tangible capital expenditures and adds back cash paid for transaction costs related to the Formic Acid acquisition. We believe that making such adjustments provides investors meaningful information to understand our operating results and ability to analyze financial and business trends on a period-to-period basis. You should not consider Adjusted EBITDA, Adjusted EBITDA margin, or Recurring Free Cash Flow as an alternative to (a) operating profit or profit for the period, as reported in accordance with U.S. GAAP, as a measure of our operating performance, (b) cash flows from operating, investing and financing activities as a measure to meet our cash needs or (c) any other measures of performance under generally accepted accounting principles. You should exercise caution in comparing Adjusted EBITDA, Adjusted EBITDA margin, and Recurring Free Cash Flow as reported by us to similar measures of other companies. In evaluating Adjusted EBITDA and Recurring Free Cash Flow, you should be aware that we are likely to incur expenses similar to the adjustments in this presentation in the future and that certain of these items could be considered recurring in nature. Our presentation of Adjusted EBITDA and Recurring Free Cash Flow should not be construed as an inference that our future results will be unaffected by non-recurring items. We present Adjusted EBITDA, Adjusted EBITDA margin, and Recurring Free Cash Flow because we believe these are useful as supplemental measures in evaluating the performance of our operating businesses and provide greater transparency into our results of operations and cash flows. Adjusted EBITDA should not be considered in isolation or as a substitute for net income or other statement of operations data prepared in accordance with U.S. GAAP. Recurring Free Cash Flow should not be considered in isolation or as a substitute for net cash flows provided by operating activities or other statement of cash flows data prepared in accordance with U.S. GAAP. Our management, including our chief operating decision makers, uses Adjusted EBITDA and Recurring Free Cash Flow as factors in evaluating the performance of our business. These measures are not recognized in accordance with U.S. GAAP and should not be viewed as an alternative to U.S. GAAP measures of performance. The most directly comparable financial measure presented in accordance with U.S. GAAP in our consolidated financial statements for Adjusted EBITDA is net income and for Recurring Free Cash Flow is net cash flow provided by operating activities. Adjusted EBITDA and Recurring Free Cash Flow have limitations as analytical tools, and you should not consider these measures either in isolation or as a substitute for analyzing our results as reported under U.S. GAAP. Some of these limitations include: (i) Adjusted EBITDA does not reflect our cash expenditures or future requirements for capital expenditures or contractual commitments; (ii) although depreciation and amortization are non-cash charges, the assets being depreciated and amortized will often need to be replaced in the future and Adjusted EBITDA and Recurring Free Cash Flow do not reflect any cash requirements that would be required for such replacements; (iii) Adjusted EBITDA does not reflect the interest expense, or the cash requirements necessary, to service interest or principal payments on our debt; (iv) Adjusted EBITDA does not reflect stock option expense or its potentially dilutive impact; (v) some of the exceptional items that we eliminate in calculating Adjusted EBITDA and Recurring Free Cash Flow reflect cash payments that were made, or will be made in the future; and (vi) other companies in our industry may calculate Adjusted EBITDA and Recurring Free Cash Flow differently than we do, which limits its usefulness as a comparative measure.
12