tally ho creek planning project - coastalrcd.org ho - tech memo - final... · drainage area (da)...
TRANSCRIPT

prepared for
Coastal San Luis Resource Conservation District
prepared by
June 2010
Tally Ho CreekPlanning Project
TECHNICAL MEMORANDUM

Ecological Restoration Design ~ Civil Engineering ~ Natural Resource Management
403B Swift St, Santa Cruz, CA 95060, Ph: 831‐421‐9291 // 522 SW 5th Ave, Ste 1022 Portland, OR 97204, Ph: 503‐227‐5979
TECHNICAL MEMORANDUM
To: Julie Thomas, Coastal San Luis Resource Conservation District
From: Waterways Consulting
Date: May 5, 2010
Re: Tally Ho Creek Planning Project
Introduction Waterways Consulting, Inc. (Waterways) has been retained by the Coastal San Luis Resource Conservation District (CSLRCD) to assess channel and habitat conditions within the mainstem of Tally Ho Creek and evaluate opportunities to enhance stream function and improve flood protection for streamside residents. Tally Ho Creek has been significantly impacted by past channel modifications, development within the floodplain, hydromodification of the watershed, and an increase in sediment supply to the channel. These impacts have directly affected streamside landowners and reduced the functional value of aquatic and riparian habitat. The purpose of this technical memorandum is to summarize work conducted by Waterways to identify opportunities to reduce localized flood risks on Tally Ho Creek and enhance environmental conditions. The memorandum also identifies the regulatory constraints associated with the recommended project actions and identifies the steps that should be taken to implement a preferred project alternative.
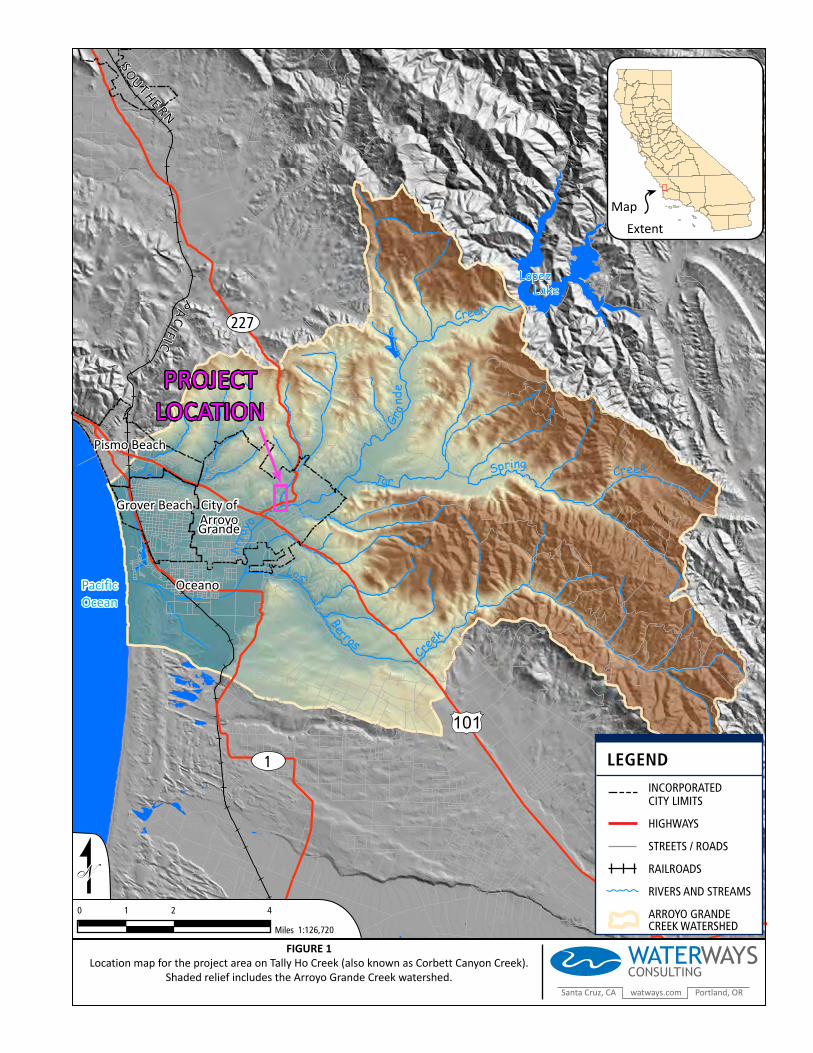
Problem Statement / Objectives Tally Ho Creek is a key tributary to the lower portion of Arroyo Grande Creek (Figure 1). Land use within the 4.7 square mile watershed is predominately open space and residential development consisting of low and low‐medium density single family residences. Private homes lie adjacent to the creek for nearly the entire length of the study area. The morphology of the watershed is characterized by a broad, low gradient valley along the mainstem of Tally Ho Creek and steep, short, tributary valleys. Geologically, much of the watershed is underlain by recently uplifted marine and coastal dune deposits, resulting in sandy soils that are highly prone to erosion when disturbed. The project study area encompasses an approximately 1 mile segment of Tally Ho Creek, extending from the Clark property just upstream of Corbett Canyon Road (State Route 227) to East Branch Street near the Tally Ho Creek‐Arroyo Grande Creek confluence (Figure 2). The study area is entirely within the City of Arroyo Grande, which is located in the southern portion of San Luis Obispo County, California. The portion of Tally Ho Creek that occurs in the study area is a low to moderate gradient (~1 % slope) intermittent stream with isolated perennial pools. Historically, the project area consisted of a broad, relatively flat valley that was dominated by a dense understory of willows with a mixed overstory of common riparian species such as willow, sycamore, cottonwood, and potentially alder. Riparian vegetation occupied a corridor that was a few hundred feet wide in some places and consisted of a mosaic of primary and secondary channels and off‐channel

Tally Ho Creek Planning Project
Technical Memorandum 2
wetlands. The footprint of the FEMA 100‐year floodplain is probably a good indicator of the extent of the historic valley bottom and riparian corridor (Figure 3). This broad floodplain was historically supported by a combination of the low valley gradient, high sediment load dominated by sand, and dense riparian vegetation. Channel and riparian conditions in the project area look much different today than they did several hundred years ago. Pressure to utilize flat valley bottoms for agriculture and, later, suburban development, resulted in removal of much of the riparian vegetation, filling of wetlands, road building, and straightening and deepening of Tally Ho Creek. Cleared portions of the valley bottom now consist of single family homes and Tally Ho Road, and Tally Ho Creek has been confined to the eastern edge of the valley floor. To maintain Tally Ho Creek in its altered condition, vegetation and sediment were periodically removed. This type of management has been more difficult to obtain approval for due to increased concerns from regulatory agencies regarding the impact of such actions and the need to protect species listed under the Endangered Species Act (ESA). Because the low gradient valley condition has not changed and sediment inputs to the valley floor have likely increased, the increased density of vegetation has resulted in sediment accumulation on the valley floor that has increased the risk of flooding to homes adjacent to the creek. In fact, for some landowners, the risk of flooding has increased to the point where it is an annual occurrence. In response to the increased risk, the City of Arroyo Grande has contracted with Waterways, the CSLRCD, and Central Coast Salmon Enhancement (CCSE) to identify, via topographic data collection, hydrologic and hydraulic modeling, and an exploration of potential engineering opportunities, a solution that will reduce flooding risks to landowners within a framework that emphasizes enhancements to the ecological value of Tally Ho Creek.
Site Evaluation and Existing Conditions
Reconnaissance Assessment A reconnaissance‐level assessment of the project area was conducted in the summer of 2009 to evaluate channel and floodplain conditions, delineate geomorphic reaches, map features in the immediate channel or floodplain such as fences or structures, and identify opportunities and constraints associated with ecological enhancement or flood protection. The reconnaissance‐level assessment identified six distinct reaches in the project area (Figure 2). Reaches were based on channel and floodplain morphology, degree of channel entrenchment, and locations of existing infrastructure, such as bridges. A brief description of each reach is as follows:
Reach 1: This reach extends from the confluence of Arroyo Grande Creek to the East Branch Street culverts. This reach is not within our study area.
Reach 2: This reach extends from the East Branch Street culverts to a bedrock control. This is an incised portion of Tally Ho Creek. Incision was most likely a result of incision along the mainstem of Arroyo Grande Creek that propagated up Tally Ho Creek. Further incision is controlled by the East Branch Street culverts and the presence of bedrock at depth. Risks to adjacent landowners are low due to the incised nature of the channel.
Tally Ho Creek Planning Project
Technical Memorandum 3
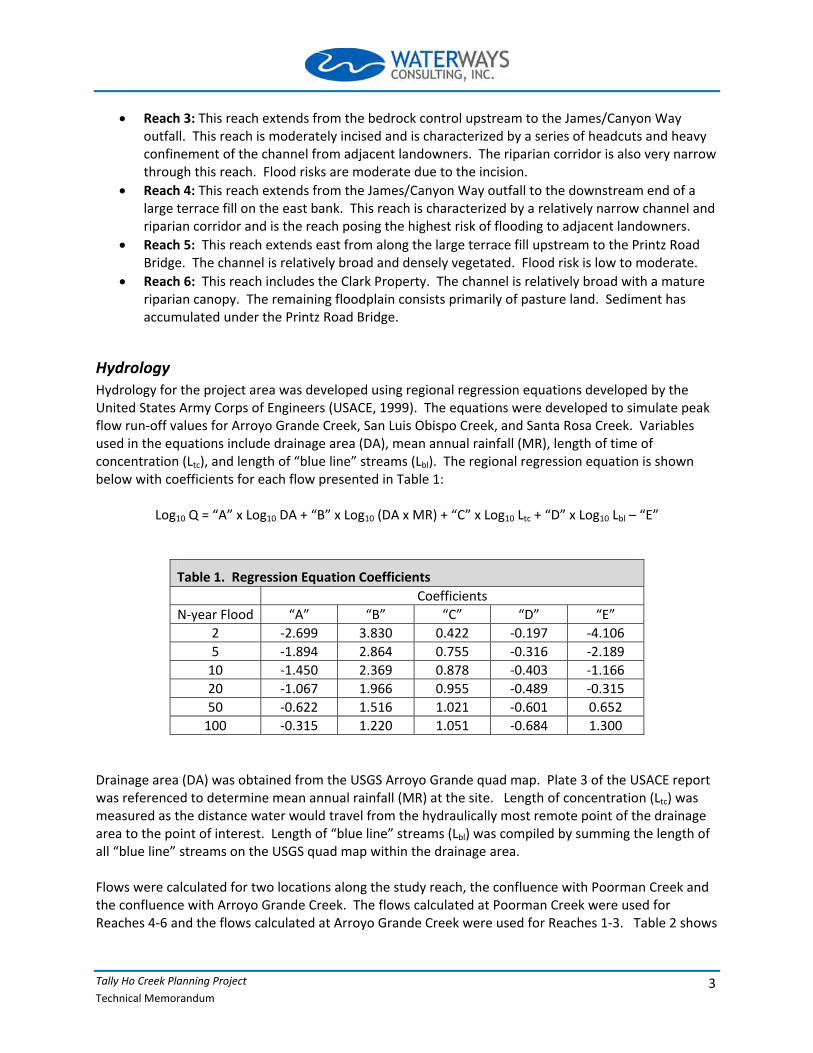
Reach 3: This reach extends from the bedrock control upstream to the James/Canyon Way outfall. This reach is moderately incised and is characterized by a series of headcuts and heavy confinement of the channel from adjacent landowners. The riparian corridor is also very narrow through this reach. Flood risks are moderate due to the incision.
Reach 4: This reach extends from the James/Canyon Way outfall to the downstream end of a large terrace fill on the east bank. This reach is characterized by a relatively narrow channel and riparian corridor and is the reach posing the highest risk of flooding to adjacent landowners.
Reach 5: This reach extends east from along the large terrace fill upstream to the Printz Road Bridge. The channel is relatively broad and densely vegetated. Flood risk is low to moderate.
Reach 6: This reach includes the Clark Property. The channel is relatively broad with a mature riparian canopy. The remaining floodplain consists primarily of pasture land. Sediment has accumulated under the Printz Road Bridge.
Hydrology Hydrology for the project area was developed using regional regression equations developed by the United States Army Corps of Engineers (USACE, 1999). The equations were developed to simulate peak flow run‐off values for Arroyo Grande Creek, San Luis Obispo Creek, and Santa Rosa Creek. Variables used in the equations include drainage area (DA), mean annual rainfall (MR), length of time of concentration (Ltc), and length of “blue line” streams (Lbl). The regional regression equation is shown below with coefficients for each flow presented in Table 1:
Log10 Q = “A” x Log10 DA + “B” x Log10 (DA x MR) + “C” x Log10 Ltc + “D” x Log10 Lbl – “E”
Table 1. Regression Equation Coefficients
Coefficients
N‐year Flood “A” “B” “C” “D” “E”
2 ‐2.699 3.830 0.422 ‐0.197 ‐4.106
5 ‐1.894 2.864 0.755 ‐0.316 ‐2.189
10 ‐1.450 2.369 0.878 ‐0.403 ‐1.166
20 ‐1.067 1.966 0.955 ‐0.489 ‐0.315
50 ‐0.622 1.516 1.021 ‐0.601 0.652
100 ‐0.315 1.220 1.051 ‐0.684 1.300
Drainage area (DA) was obtained from the USGS Arroyo Grande quad map. Plate 3 of the USACE report was referenced to determine mean annual rainfall (MR) at the site. Length of concentration (Ltc) was measured as the distance water would travel from the hydraulically most remote point of the drainage area to the point of interest. Length of “blue line” streams (Lbl) was compiled by summing the length of all “blue line” streams on the USGS quad map within the drainage area. Flows were calculated for two locations along the study reach, the confluence with Poorman Creek and the confluence with Arroyo Grande Creek. The flows calculated at Poorman Creek were used for Reaches 4‐6 and the flows calculated at Arroyo Grande Creek were used for Reaches 1‐3. Table 2 shows
Tally Ho Creek Planning Project
Technical Memorandum 4
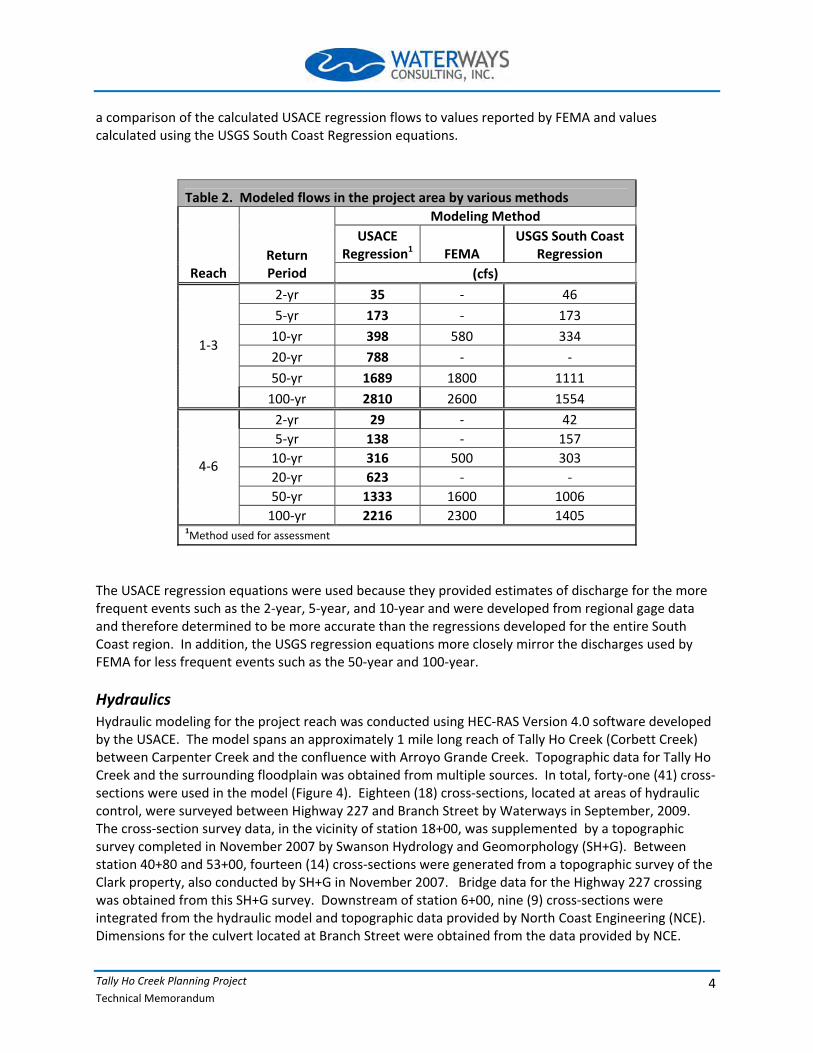
a comparison of the calculated USACE regression flows to values reported by FEMA and values calculated using the USGS South Coast Regression equations.
Table 2. Modeled flows in the project area by various methods
Modeling Method
USACE Regression1 FEMA
USGS South Coast Regression
Reach Return Period (cfs)
2‐yr 35 ‐ 46
5‐yr 173 ‐ 173
10‐yr 398 580 334
20‐yr 788 ‐ ‐
50‐yr 1689 1800 1111
1‐3
100‐yr 2810 2600 1554
2‐yr 29 ‐ 42
5‐yr 138 ‐ 157
10‐yr 316 500 303
20‐yr 623 ‐ ‐
50‐yr 1333 1600 1006
4‐6
100‐yr 2216 2300 1405 1Method used for assessment
The USACE regression equations were used because they provided estimates of discharge for the more frequent events such as the 2‐year, 5‐year, and 10‐year and were developed from regional gage data and therefore determined to be more accurate than the regressions developed for the entire South Coast region. In addition, the USGS regression equations more closely mirror the discharges used by FEMA for less frequent events such as the 50‐year and 100‐year.
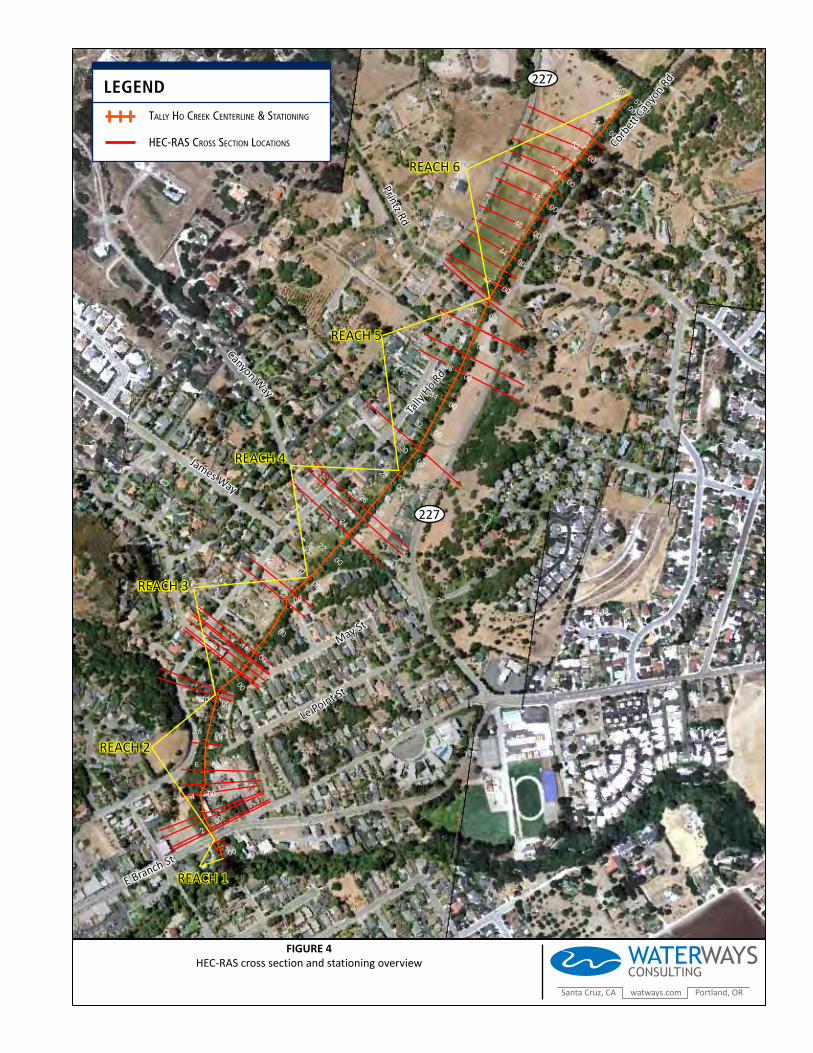
Hydraulics Hydraulic modeling for the project reach was conducted using HEC‐RAS Version 4.0 software developed by the USACE. The model spans an approximately 1 mile long reach of Tally Ho Creek (Corbett Creek) between Carpenter Creek and the confluence with Arroyo Grande Creek. Topographic data for Tally Ho Creek and the surrounding floodplain was obtained from multiple sources. In total, forty‐one (41) cross‐sections were used in the model (Figure 4). Eighteen (18) cross‐sections, located at areas of hydraulic control, were surveyed between Highway 227 and Branch Street by Waterways in September, 2009. The cross‐section survey data, in the vicinity of station 18+00, was supplemented by a topographic survey completed in November 2007 by Swanson Hydrology and Geomorphology (SH+G). Between station 40+80 and 53+00, fourteen (14) cross‐sections were generated from a topographic survey of the Clark property, also conducted by SH+G in November 2007. Bridge data for the Highway 227 crossing was obtained from this SH+G survey. Downstream of station 6+00, nine (9) cross‐sections were integrated from the hydraulic model and topographic data provided by North Coast Engineering (NCE). Dimensions for the culvert located at Branch Street were obtained from the data provided by NCE.

Tally Ho Creek Planning Project
Technical Memorandum 5
Manning’s “n” values for the project site were chosen based on field‐based observations and aerial photographs of the channel and adjacent floodplains. Roughness values were set between 0.03‐0.06 for the channel and between 0.03‐0.2 for the stream banks and floodplains (McCuen, 2004). Existing structures located on the floodplains were modeled as blocked obstructions. Fences were modeled as permanent ineffective flow areas to an elevation equal to the top of the fence. Expansion/Contraction coefficients for most cross sections were set to 0.1/0.3. To account for energy losses due to geometric variations in the channel, the coefficients were increased to 0.3/0.5 adjacent to bridges and culverts. The downstream boundary condition was set using the normal depth method. A value of 0.01 was used for the boundary condition, corresponding to the energy grade line at the downstream limit of the model. The HEC‐RAS model used a subcritical flow regime to calculate water surface profiles for the project site. Subcritical analysis calculated conservative water surface elevations when there is the potential for supercritical flow. Results for the existing conditions HEC‐RAS model are presented in Figures 5, 6, 7, and 8, for Reaches 2, 3, 4, and 5, respectively. In addition, we have provided the complete output from HEC‐RAS in Appendix A. The results suggest that Reach 4 is the area where flood risks are highest with nuisance flooding and threats to infrastructure occurring at around the 5‐year event and homes directly affected at around the 10‐year event. Flood risks are also substantial in Reach 3 with nuisance flooding occurring between the 5‐year and 10‐year event and homes and infrastructure being affected just above the 10‐year event. Flooding in Reach 2 is limited to flows above the 20‐year event and flooding in Reach 5 occurs somewhere between the 50‐year and 100‐year event.1
Biotic Conditions A general field survey of the study area was conducted on September 5, 2009 by ecologist Kevin Fisher, M.S. of Blue Line Consulting; no species‐specific surveys were conducted. The purposes of the survey were to characterize existing biotic habitats, assess the site for the potential to support special status plant and wildlife species, identify potential jurisdictional waters of the U.S, and identify opportunities for habitat enhancement. The survey area encompassed the bed and banks of Tally Ho Creek, extending approximately 100 feet in all directions from the channel. The dominant vegetation communities in the study area include Marsh (freshwater), Willow Riparian Woodland, Oak Woodland and Non‐native Grassland (Table 3). Figure 9 provides a map of the distribution of these communities in the study area.
1 Flooding in this reach may be more frequent than modeled due to sedimentation under the Printz Road Bridge and a low point in the right bank levee just downstream of the Printz Road Bridge.

Tally Ho Creek Planning Project
Technical Memorandum 6
Table 3. Major Vegetation Communities Types within Study Area
Vegetation Alliance1
CNDDB Code Plant Association / Community
General Location in Study Area
Freshwater Marsh 52.102.01; 52.105.00
Bulrush– Cattail Wetland; Duckweed Wetland
Channel
Willow Riparian Woodland
61.201.02 Red Willow/Arroyo Willow Streambanks
Oak Woodland 71.060.00; Coast Live Oak Woodland High floodplain/terrace
Non‐native Grassland (includes ruderal/disturbed areas)
42.000.00 Wild radish, field mustard, Italian ryegrass
High floodplain/terrace
1California Department of Fish and Game Vegetation Classification System (CDFG, 2003)
FRESHWATER MARSH
Much of the creek bed is densely vegetated with emergent wetland vegetation. In the upstream portion of the study area (Reach 5) small‐fruited bulrush (Scirpus microcarpus) forms a dense cover over the streambed. Portions of the streambed that are perennially ponded support duckweed (Lemma sp.). Water smartweed (Polygonum amphibium), cattail (Typha latifolia), California bulrush (Schoenoplectus [=Scirpus] californicus) and umbrella sedge (Cyperus eragrostis) are common in and around the margins of the perennial pools.
WILLOW RIPARIAN WOODLAND
There is a narrow corridor of willow riparian woodland along the banks of Tally Ho Creek. This vegetation community is dominated by arroyo willow (Salix lasiolepis) and red willow (S. laevigata); coast live oak (Quercus agrifolia) saplings are scattered in the understory. In the upstream portion of the study area (Reach 5) the willows have been managed for flood protection; there are few willows along the left bank and those on the right bank are relatively young trees. In the downstream reaches (Reaches 1 to 4), mature willow trees form a dense canopy over the creek. In places with an open canopy, kikuyu grass (Pennisetum clandestinum) is the dominant herbaceous species in the understory. In areas with a dense willow canopy, blackberry (Rubus spp.) and poison oak (Toxicodendron diversilobum) dominate the understory. Invasive vines such as English ivy (Hedera helix), Cape ivy (Delairea odorata) and vinca (Vinca major) are widespread in the Reaches 1 to 3.
OAK WOODLAND
Oak woodland occurs in Reaches 1 through 4 of the study area on the high floodplain and terraces. Coast live oak is the dominant species. The understory is dominated by non‐native annual grasses and ruderal vegetation. In the area around the Reach 3/4 transition, some native species have been planted as part of a mitigation project; most of these plants appeared stressed at the time of the survey.

Tally Ho Creek Planning Project
Technical Memorandum 7
NON‐NATIVE GRASSLAND/DISTURBED
The largest area of non‐native grassland in the study area is on the left floodplain/terrace in Reach 5. This area is disturbed and regularly mowed, and consequently provides limited habitat value. No burrows or burrowing animals were observed. Mature Monterey pines (Pinus radiata) line the left bank of the creek in Reach 5. There are a few scattered blue gum eucalyptus (Eucalyptus globulus) within the non‐native grassland near the upstream end of the study reach. The oak wood and non‐native grassland areas are bounded by residential development with ornamental landscaping.
WILDLIFE
The riparian habitat in the study area provides roosting, foraging and nesting habitat for various passerine bird species. Raptors, including several species of hawks, may also forage along the riparian corridor and adjacent grasslands. Some wading and waterbirds such as herons and ducks may forage in and around the creek; a black‐crowned night heron (Nycticorax nycticorax) was flushed from an undercut bank during the field survey. Amphibians and reptiles that are likely to occur in the study area include California red‐legged frog (Rana draytonii), tree frog (Hyella regilla), bullfrog (Rana catesbeiana), western fence lizard (Sceloporus occidentalis) and western aquatic garter snake (Thamnophis couchii). The Tally Ho Creek corridor likely provides habitat for various small to medium sized mammals such rodents and raccoon (Procyon lotor); two blacktailed deer (Odocoileus hemionus) were observed bedding in the creek channel in Reach 5.
SPECIAL STATUS SPECIES
For the purposes of this document, special status species are those that are listed as species of concern, rare, candidate, threatened or endangered by federal, state and non‐governmental agencies (i.e., CNPS). Listed species with potential to occur in the study vicinity were identified from the following sources:
The California Natural Diversity Database (CNDDB) records within a five mile radius of the study area (CNDDB, 2009).
The U.S. Fish and Wildlife Service (USFWS) species list for San Luis Obispo County
Special Status Plant Species
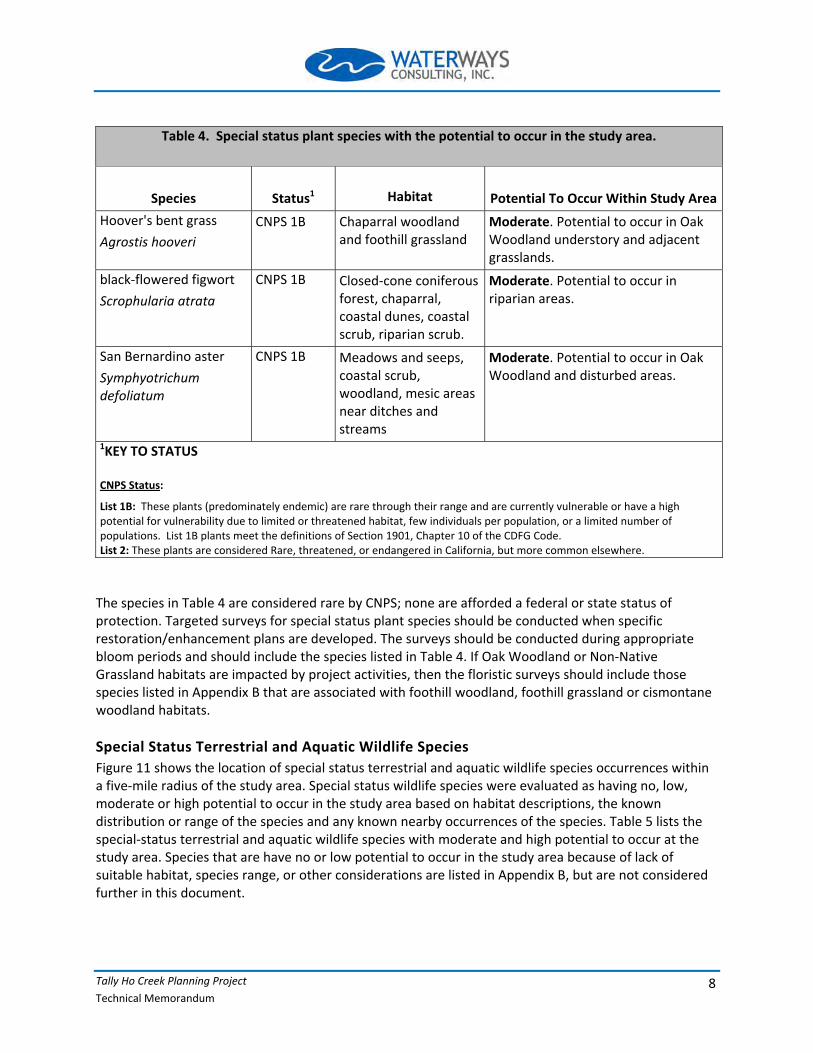
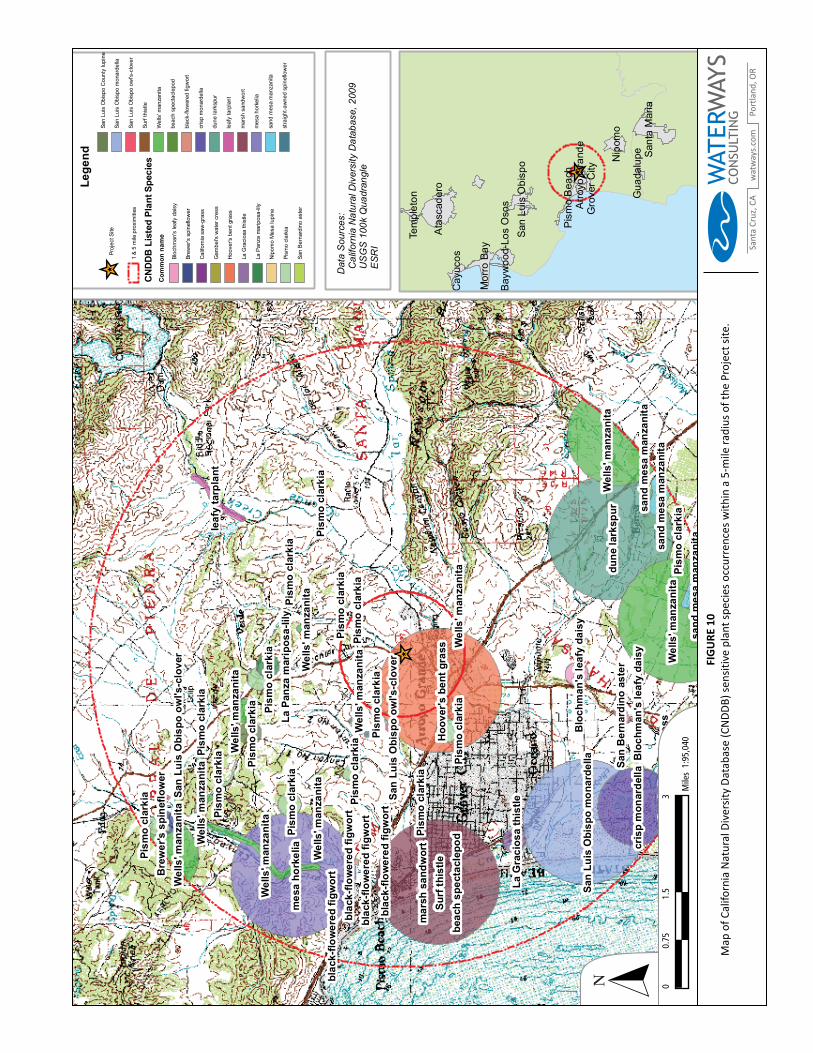
Figure 10 shows the location of special status plant occurrences within a five‐mile radius of the study area. Special status plant species were evaluated as having: no, low, moderate or high potential to occur in the study area based on habitat descriptions, and the known distribution or range of the species. Plant species that have no or low potential to occur in the study area because suitable habitat is not present or the plants distribution is extremely limited are listed in Appendix B. Most of the plants listed in Appendix B are associated with chaparral habitat, which does not exist in the study area. Most species listed in Appendix B that are associated with woodland and grassland habitats are not likely to occur in study area given the relatively high level of disturbance to existing habitats. Special status plant species that have the moderate or high potential to occur in the study area are listed in Table 4.
Tally Ho Creek Planning Project
Technical Memorandum 8
Table 4. Special status plant species with the potential to occur in the study area.
Species
Status1
Habitat
Potential To Occur Within Study Area
Hoover's bent grass
Agrostis hooveri
CNPS 1B Chaparral woodland and foothill grassland
Moderate. Potential to occur in Oak Woodland understory and adjacent grasslands.
black‐flowered figwort
Scrophularia atrata
CNPS 1B Closed‐cone coniferous forest, chaparral, coastal dunes, coastal scrub, riparian scrub.
Moderate. Potential to occur in riparian areas.
San Bernardino aster
Symphyotrichum defoliatum
CNPS 1B Meadows and seeps, coastal scrub, woodland, mesic areas near ditches and streams
Moderate. Potential to occur in Oak Woodland and disturbed areas.
1KEY TO STATUS CNPS Status:
List 1B: These plants (predominately endemic) are rare through their range and are currently vulnerable or have a high potential for vulnerability due to limited or threatened habitat, few individuals per population, or a limited number of populations. List 1B plants meet the definitions of Section 1901, Chapter 10 of the CDFG Code. List 2: These plants are considered Rare, threatened, or endangered in California, but more common elsewhere. The species in Table 4 are considered rare by CNPS; none are afforded a federal or state status of protection. Targeted surveys for special status plant species should be conducted when specific restoration/enhancement plans are developed. The surveys should be conducted during appropriate bloom periods and should include the species listed in Table 4. If Oak Woodland or Non‐Native Grassland habitats are impacted by project activities, then the floristic surveys should include those species listed in Appendix B that are associated with foothill woodland, foothill grassland or cismontane woodland habitats.
Special Status Terrestrial and Aquatic Wildlife Species
Figure 11 shows the location of special status terrestrial and aquatic wildlife species occurrences within a five‐mile radius of the study area. Special status wildlife species were evaluated as having no, low, moderate or high potential to occur in the study area based on habitat descriptions, the known distribution or range of the species and any known nearby occurrences of the species. Table 5 lists the special‐status terrestrial and aquatic wildlife species with moderate and high potential to occur at the study area. Species that are have no or low potential to occur in the study area because of lack of suitable habitat, species range, or other considerations are listed in Appendix B, but are not considered further in this document.

Tally Ho Creek Planning Project
Technical Memorandum 9
Table 5. Special status wildlife species with the potential to occur in the study area.
Species Status1 Habitat Potential Occurrence On Site
Amphibians
California red‐legged frog Rana aurora draytonii
FT, CSC Creeks, rivers, marshes, estuaries and ponds for foraging and dispersal; still water at least into June for breeding.
High. Suitable breeding
habitat likely present.
Reptiles
Southwestern pond turtle Emys(=Clemmys) marmorata pallid
CSC Creeks and ponds with water of sufficient depth for escape cover, and structure for basking; grasslands or bare areas for nesting.
Moderate. Suitable aquatic habitat is present, but basking and nesting habitats are marginal.
Birds
Yellow warbler1 Dendroica petechia brewsteri
CSC Riparian forests with dense understory vegetation
Moderate. Study area provides suitable habitat.
1 Key to status: FC = Candidate for federal listing FE = Federally listed as endangered species FT = Federally listed as threatened species
SE = State listed as endangered species ST = State listed as threatened species CSC = California species of special concern
1No CNDDB occurrences of the species within a 5 mile radius of the project site; suitable habitat may exist.
California Red‐legged Frog
California red‐legged frog (CRLF) was federally listed as threatened throughout its California range in 1996 and the USFWS published a final designation of critical habitat for the CRLF in 2006 (USFWS, 1996; USFWS, 2006). There is no designated critical habitat in the study area. The primary constituent elements identified in the critical habitat designation for the CRLF are presence of suitable aquatic breeding habitat; suitable non‐breeding aquatic habitat that provides food, cover, and space; suitable upland habitats that provide food and shelter; and suitable habitat between aquatic sites to allow dispersal (USFWS, 2006). CRLF are closely tied to aquatic habitats, requiring still or slow moving water during the winter breeding period for egg laying and development of larvae. They are known to travel relatively great distances (up to 2 miles) over land to disperse between winter and summer habitats (Bulger, 2003; Fellers and Kleeman, 2007). In general, CRLF adults congregate at breeding ponds in the winter, and then after egg‐laying, disperse more widely to foraging areas for the remainder of the year. Some adults may be year round residents at breeding ponds where conditions are favorable; some juveniles and sub‐adults may disperse from their natal pond to other nearby creeks and wetlands where competition for food is less during the few years until they reach reproductive age. The most favorable habitat elements that have been identified for CRLF include emergent or overhanging vegetation in breeding ponds for egg attachment, sites with adequate shallow water habitat with algae for tadpole rearing, deep water and/or adjacent vegetation for adult escape cover, upland habitats for shelter during drought and upland and aquatic corridors free of barriers for both adult and juvenile dispersal (USFWS, 2002).

Tally Ho Creek Planning Project
Technical Memorandum 10
There are two documented occurrences of CRLF in the study area (Figure 12). In 2000, biologists from the Morro Group observed 1 adult in the pool under the Highway 227 Bridge (CNDDB Occurrence 418). Surveys conducted by LFR, Inc. documented occurrences of CRLF in 1999 through 2002, including juveniles in 2002 (CNDDB Occurrence 459). The observation of juveniles suggests that Tally Ho Creek in the study area provides suitable breeding habitat for CRLF. No CRLF were observed during the field survey conducted for this study, or during compliance monitoring for 2009 vegetation maintenance activities (Rincon Consultants, 2009). It is important to note that the lack of detection of CRLF in 2009 does not verify the absence of the species or indicate that CRLF have been extirpated from the study area. More rigorous, USFWS protocol‐level surveys for CRLF would be required prior to implementing management activities or restoration plans that have the potential to impact CRLF or their habitat.
Western Pond Turtle
Western pond turtles (Actinemys marmorata), including both the northwestern (ssp. marmorata) and southwestern (ssp. pallida) subspecies, are a California species of concern. Western pond turtles occur in a variety of permanent and intermittent aquatic habitats, such as ponds, marshes, rivers, streams, and ephemeral pools. Pond turtles require suitable basking and haul‐out sites, such as emergent rocks or floating logs, which they use to regulate their temperature throughout the day (Holland, 1994). In addition to appropriate aquatic habitat, these turtles require an upland oviposition site in the vicinity of the aquatic habitat, often within 200 m (656 ft). Nests are typically dug in grassy, open fields with soils that are high in clay or silt fraction. Egg laying usually takes place between March and August (Zeiner et al., 1988). The study area may provide suitable aquatic habitat for western pond turtles, but basking and nesting habitats would be considered marginal because basking sites are limited (i.e., the creek is mostly shaded) and grassy areas that provide potential nesting habitat are regularly disturbed by human activity. For these reasons, Tally Ho Creek in the study area is not likely to support western pond turtle, but they do have the potential to occur. In the unlikely event that western pond turtle are present, then implementation of channel improvement have the potential to result in impacts to this species. Protection and minimization measures will be developed concurrent with project planning to reduce the potential for the project to adversely affect western pond turtle.
Yellow Warbler
The yellow warbler (Dendroica petechia brewsteri) breeds and forages in riparian woodlands, montane chaparral, open ponderosa pine, and mixed conifer habitats with substantial brush, from coastal and desert lowlands up to 8,000 feet in the Sierra Nevada. The species is usually found in riparian deciduous habitats in summer in cottonwoods, willows, alders, and other small trees and shrubs typical of low, open‐canopy riparian woodland. Breeding occurs from mid‐April into early August with peak activity in June. There are no documented occurrences of this species within a 5 mile radius of the study area, but suitable foraging habitat and marginal nesting habitat occurs within the riparian woodland of the study area. Pre‐construction surveys for nesting yellow warblers should be conducted if project activities will disturb existing riparian habitat. In the long‐term, implementation of riparian enhancements such as expanding the riparian corridor would likely benefit this species.
Potential Jurisdictional Waters of the U.S. Tally Ho Creek is largely an intermittent stream with perennial pools; select reaches have perennial flow. Tally Ho Creek is tributary to “traditional navigable waters of the U.S.” and streamflow is “relatively
Tally Ho Creek Planning Project
Technical Memorandum 11
permanent” (i.e., continuous seasonal flow), thus the creek is likely to be subject to CWA Section 404 regulations. The stream in the study reach is not navigable or tidal and is therefore not subject to Section 10 jurisdiction. Ordinary High Water (OHW) in Tally Ho Creek can be delineated based on changes in vegetation communities (i.e., marsh to willow riparian) and scour lines (i.e., bankfull indicators). In general, the area of the channel below the elevation of OHW is designated non‐wetland waters of the U.S., but in Tally Ho Creek much of this area is vegetated and would be considered jurisdictional wetlands. Above OHW the creek supports a narrow corridor of hydrophytic vegetation (e.g., willow, blackberry) along the channel banks. Because the streambanks are steep and the streamflow is “flashy”, the distribution of jurisdiction wetlands above OHW is limited. A formal jurisdictional delineation should be conducted in the specific areas that restoration/enhancement measures are proposed. No isolated or off‐channel wetlands were observed during the field survey.
Enhancement Opportunities and Constraints Clarification of site opportunities and constraints establishes limits on what is possible at the proposed project site by considering the human context, current and historical land use, hydrologic and hydraulic conditions and the potential to restore biological functions. An opportunities and constraints analysis, when conducted early on in the project planning and design phase, provides an envelope or range of possibilities with which to define what is desired for the site. It also clearly lays out potentially competing desires for the site, allowing managers to openly discuss and define project priorities. To identify potential opportunities to reduce flood hazards while improving aquatic, riparian, and floodplain quality and function, Waterways staff conducted a field reconnaissance of the entire project area, evaluated the results of the existing conditions hydraulic model, and consulted with local landowners. Specific opportunities and constraints were identified by reach, and are summarized in Table 6 and Figures 13, 14, and 15. Opportunities to reduce flood risk and enhance aquatic and riparian conditions generally fell into the following categories:
Riparian corridor enhancement/management: Although a continuous riparian corridor exists throughout the project area, most of the corridor is narrow, lacks diversity, and is infested with non‐native invasive species (e.g. ivy, periwinkle) that limit the diversity and complexity of the canopy. Efforts to enhance the quality of the riparian corridor could be included in a vegetation management strategy that increases flood conveyance. Such a strategy would need to be described in a comprehensive management plan for the project area that identifies the specific management strategies that will be used and how enhancement will proceed.
Floodplain/wetland enhancement: Floodplain and wetland enhancement consists of converting off‐channel areas to floodplain to create additional channel capacity, provide flood detention areas, lower water surfaces, create off‐channel wetlands, and improve the values and functions of a broader riparian corridor. Although much of the project area is currently constrained by adjacent land uses, there are several locations where floodplain enhancement could be valuable and cost effective. Those areas include a large portion of the Clark Property, upstream of Printz Road, and two areas along the left bank, downstream of Printz Road, that have not been developed. Constraints to enhancing the floodplain include the cost associated with purchasing

wat
way
s.co
mSa
nta
Cru
z, C
aPo
rtla
nd
, or
TABL
E 6
enh
ance
men
t o
pp
ort
un
itie
s an
d c
on
stra
ints
mat
rix.
Reach
Enhan
cement Opportunity
Issue Addressed
Constraints
Rem
ove non‐native vegetation along
riparian corridor
Degraded
riparian hab
itat
Private ownership; A
ccess to chan
nel
Rep
lace culvert at East Branch Stree
tRed
uce flood risk associated
with backw
atering at crossing
High cost; Loss of potential grade control structure
Floodplain and riparian width enhan
cemen
tLocal erosion; C
onfinem
ent of chan
nel
Contrained
by existing infrastructure; P
rivate ownership
Floodplain and riparian width enhan
cemen
tLocal erosion; C
onfinem
ent of chan
nel
Contrained
by existing infrastructure; P
rivate ownership
Rem
ove non‐native vegetation along
riparian corridor
Degraded
riparian hab
itat
Private ownership; A
ccess to chan
nel
Floodplain and riparian enhan
cemen
t along
left ban
k
Red
uce flood risks by increa
sing chan
nel cap
acity; Enhan
ce riparian
hab
itat and floodplain function
Moderate cost; Short‐term construction im
pacts;
Private ownership
Rem
ove non‐native vegetation along
riparian corridor
Degraded
riparian hab
itat
Private ownership
Increa
se chan
nel cap
acity
Red
uce flood risk associated
with sed
imen
t dep
osition
Access to chan
nel; C
RLF rea
ring hab
itat; R
egulatory
concerns; Nee
d for long‐term
maintenan
ce strategy
Man
age riparian vegetation
Red
uce flood risk
Access to chan
nel; C
RLF rea
ring hab
itat; R
egulatory
concerns; Nee
d for long‐term
maintenan
ce strategy
Man
age sedim
ent under Printz Road
Bridge
Red
uce flood risk
CRLF rea
ring hab
itat; R
egulatory concerns; Nee
d for long
term
maintenan
ce strategy
Floodplain and riparian enhan
cemen
t along
left ban
k
Red
uce flood risks by increa
sing chan
nel cap
acity; Enhan
ce riparian
hab
itat and floodplain function
Moderate cost; Short‐term construction im
pacts;
Private ownership
Close gap
in levee nea
r Printz Road
Bridge
Red
uce flood risk
Local d
rainage; Secondary effects
Wetland enhan
cemen
t
Create an
d/or en
han
ce wetland and CRLF hab
itat; P
ossibly
enhan
cemen
t of pond turtle hab
itat
High cost; P
rivate ownership
Pea
k flow m
anagem
ent an
d sed
imen
t
retention
Red
uce flood risks downstream
High cost; P
rivate ownership; B
enefits lim
ited
to
moderate discharge events
Floodplain and riparian enhan
cemen
t along
left ban
k
Red
uce flood risks by increa
sing chan
nel cap
acity; Enhan
ce riparian
hab
itat and floodplain function
Moderate cost; Short‐term construction im
pacts;
Private ownership
62 3 4 5

Tally Ho Creek Planning Project
Technical Memorandum 13
the property, the potentially high cost of fill removal, and, in some cases, the limited benefit of reducing water surface elevations if the area is already frequently flooded. In those cases, the focus of floodplain enhancement is primarily to restore riparian habitat to areas that were historically cleared and converted to another land use.
Increased channel capacity: A preliminary geomorphic analysis suggests that the current Tally Ho Creek channel through the project area consists of a ditch that was dug to accommodate the lot split and construction of homes within the historic valley floor. This ditch has been maintained over time in response to regrowth of riparian vegetation and aggradation of the channel associated with the large amount of sediment that is delivered to this portion of the channel. Improving protection for adjacent landowners from frequent flooding will require lowering the current bed elevation and periodic maintenance of the channel to remove built up sediment deposits. This is especially true throughout Reach 4. In many locations, informal levees have been constructed but have proven to be ineffective because the sediment primarily consists of sand which maintains a groundwater connection between the channel and the opposite side of any levee. A levee might be effective if it were engineered and composed of a clay core, but that approach is most likely cost prohibitive.
Although site opportunities and constraints vary by reach, the overall strategy would consist of increasing channel capacity through Reach 4, managing riparian vegetation to improve flood capacity, removing non‐native vegetation, increasing species diversity of native riparian species, and enhancing floodplain and off‐channel habitats. The primary constraint to achieving the flood control objectives in Reach 4 is associated with the impacts that sediment removal would have on rearing habitat for CLRF. The best potential approach to mitigate those impacts would be to enhance floodplain and create off‐channel wetland habitat for CLRF on the Clark Property, if plans for developing a floodplain restoration/sediment detention project on this property are successfully pursued in the future. It is likely that creation of off‐channel wetland habitat2 on the Clark Property would enhance both breeding and rearing habitat for CLRF, thereby creating a situation where the habitat is not just being replaced, but enhanced.
Proposed Project Alternatives
Overview Following identification of site opportunities and constraints and two public meetings, Waterways developed a set of proposed project alternatives with the goal of reducing the frequency of flooding while enhancing aquatic, riparian, and floodplain habitat. Each of the proposed projects was evaluated using the HEC‐RAS model to evaluate the extent to which water surface elevations are lowered. In addition, cost estimates were developed for each proposed project. Although the proposed projects were evaluated independently, project elements could be combined to further lower water surfaces.
2 Typical CRLF breeding/rearing habitat consists of seasonal ponds that maintain inundation through CLRF metamorphosis in the summer months, but dry in the late summer/fall to avoid bullfrog invasion. Consultation from a CLRF biologist should be employed for a specific inundation period and depth.

Tally Ho Creek Planning Project
Technical Memorandum 14
The proposed projects, described below, include the following:
Reach 4 Sediment Removal – Low Flow Channel Option
Reach 4 Sediment Removal – Grade from Headcut Option
Floodplain Bench Option
Each of the proposed project alternatives incorporates vegetation management activities which determine the roughness values used in the HEC‐RAS model. For the model, vegetation maintenance activities were assumed to reduce Manning’s roughness coefficients for the channel from 0.05 to 0.04 and bank roughness values from 0.1 to 0.07. Potential future enhancements to the Clark Property were also evaluated within the context of each of the proposed project alternatives. The Clark property scenario involves the creation of off‐channel wetland areas with the potential to attenuate flows along Tally Ho Creek, downstream of the Printz Road Bridge. An unsteady model of Reach 6 was used to determine peak flow reductions for the various modeled discharges. Off‐channel storage at the Clark Property was estimated to reduce the 5‐year peak flow by 13 cfs and the 10‐year peak flow by 36 cfs.
Project Alternatives
REACH 4 SEDIMENT REMOVAL – LOW FLOW CHANNEL OPTION
Under this alternative a low flow channel would be excavated through sediment that has built up over the years along Reach 4. Specifically, a low flow channel would be cut between stations 18+60 and 23+65 (Figure 4). The thalweg was lowered approximately 3 feet at station 18+60 and slightly less elsewhere. The results of excavating a low flow channel is presented in Figures 16 and 17 and summarized in Table 7. The project has more benefit at lower flows with less benefit at higher flows. If implemented, the Low Flow Channel Option is expected to reduce 5‐year water surfaces by 1.7 feet at Cross Section 18+60 and 10‐year water surfaces by 1.1 feet. The benefit falls off significantly in the upstream direction with no effect on water surfaces occurring at Cross Section 25+53. Implementation of the project would involve direct removal of sediment from the channel using an excavator. Access to the channel in the area where the work would be performed would still need to be identified but it is likely that riparian vegetation would need to be removed to access the channel and conduct the channel grading. Dewatering may not be necessary if work is conducted when the channel is dry. The cost to implement this project, not including permitting, administrative costs, construction inspection, and any required mitigation, was estimated to be $90,000 (Table 8). The estimated cost includes planning and design, construction, and a 15% contingency.
REACH 4 SEDIMENT REMOVAL – GRADE FROM HEADCUT OPTION
This option is similar to the Low Flow Channel Option but involves excavation of a larger and deeper channel over a longer channel length. The Headcut Option takes advantage of an existing discontinuity in the existing profile grade near the transition between Reach 3 and Reach 4. The discontinuity consists of a large headcut (or nickpoint) that is likely a result of downcutting associated with historic incision along the mainstem of Arroyo Grande Creek. In response to this incision on Arroyo Grande Creek, incision was initiated on Tally Ho Creek, resulting in migration of a series of headcuts on Tally Ho Creek

wat
way
s.co
mSa
nta
Cru
z, C
aPo
rtla
nd
, or
TABL
E 7
Wat
er s
urf
ace
elev
atio
ns
for
exis
tin
g co
nd
itio
ns
and
pro
po
sed
en
han
cem
ent
op
tio
ns.
Reach 4 – Cross Section 18+6
0
Reach 4 – Cross Section 25+5
3
Return Period
Return Period
5‐yr
10‐yr
20‐yr
50‐yr
5‐yr
10‐yr
20‐yr
50‐yr
Model
Geometry
Water Su
rface Elevation (ft)
Water Su
rface Elevation (ft)
Existing
Conditions
119.7
120.5
120.7
121.7
125.7
126.7
127.9
129.4
Sedim
ent
Rem
oval – Grade
from Hea
dcut
116.5
(‐3.2)
118.4
(‐2.1)
112.0
(‐0.7)
121.5
(‐0.2)
123.5
(‐2.2)
124.8
(‐1.9)
126.2
(‐1.7)
128.5
(‐0.9)
Sedim
ent
Rem
oval – Low
Flow Chan
nel
118.0
(‐1.7)
119.4
(‐1.1)
120.6
(‐0.1)
121.6
(‐0.1)
125.7
126.7
127.9
129.4
Floodplain Ben
ch
119.7
120.5
120.7
121.7
125.3
(‐0.4)
126.1
(‐0.6)
127.0
(‐0.9)
128.3
(‐1.1)
Vegetation
Man
agem
ent
119.7
120.4
(‐0.1)
120.7
121.5
(‐0.2)
125.5
(‐0.2)
126.4
(‐0.3)
127.6
(‐0.3)
129.2
(‐0.2)

Tally Ho Creek Planning Project
Technical Memorandum 16
that have lowered portions of the channel over time (e.g. – Reaches 1, 2 and 3). Because we expect the headcut to continue to migrate in the upstream direction over time, resulting in a lowered bed through the project reach, this proposed Option takes advantage of that process to improve flood capacity through Reach 4 where the risk is the highest. The benefit of this approach is that the sediment that would have been eroded over time from Tally Ho Creek, due to headcut migration, will be excavated and removed from the system permanently, thereby minimizing impacts downstream on the mainstem of Arroyo Grande Creek. The project approach consists of replacing the large headcuts located between station 17+79 and 30+61 with a smooth channel profile (Figures 18 and 19). In this scenario, the existing conditions channel geometry was not altered at stations 17+79 and 23+65, which correspond to locations immediately downstream of a headcut. At the remaining sections the channel base was lowered between 2‐5 feet in order to create a smooth profile between stations 30+61 and 17+79. Not only would this approach improve flood capacity, but would also likely limit continued upstream migration of any headcutting. If implemented, the Headcut Option is expected to reduce 5‐year water surfaces by 3.2 feet at Cross Section 18+60, 10‐year water surfaces by 2.1 feet, 20‐year water surfaces by 0.7 feet and 50‐year water surfaces by 0.2 feet (Table 7). At Cross Section 25+53, the Headcut Option is expected to reduce 5‐year water surfaces by 2.2 feet, reduce 10‐year water surfaces by 1.9 feet, 20‐year water surfaces by 1.7 feet and 50‐year water surfaces by 0.9 feet. Implementation of the project would involve direct removal of sediment from the channel using an excavator. Access to the channel in the area where the work would be performed would still need to be identified but it is likely that riparian vegetation would need to be removed to access the channel and conduct the channel grading. Dewatering may not be necessary if work is conducted when the channel is dry. The cost to implement this project, not including permitting, administrative costs, construction inspection, and any required mitigation, is estimated to be $185,000 (Table 8). The estimated cost includes planning and design, construction, and a 15% contingency. Because the grading work is more extensive for this Option, it is likely that impacts will include temporary loss of riparian vegetation and permanent loss of CRLF rearing habitat. Consequently, mitigation costs could be high, although those costs could be addressed through floodplain enhancement within Reach 4 or on the Clark Property.
FLOODPLAIN BENCH OPTION
During our reconnaissance level survey, a site was identified along the left bank of Reach 4 that may provide an opportunity to enhance floodplain and riparian conditions while moderately lowering local water surface elevations. The site is currently privately owned, but is mostly vacant except for what appears to be an abandoned out‐building along the margins of the existing riparian area. This project could be combined with the Low Flow Channel Option or the Headcut Option to reduce local water surface elevations and provide an area of on‐site mitigation for any impacts associated with those projects. The Floodplain Bench Option would consist of lowering the existing bank and terrace from Cross Section 22+50 through 27+50 so that the surface is inundated at flows equal to or exceeding the 2‐year discharge (Figures 20 and 21). At its widest, the terrace would be cut back approximately 40 feet, adding approximately .35 acres of functional floodplain. Off‐channel wetlands could be developed within the excavated terrace and the site would be revegetated with native riparian species to improve riparian corridor width and function. If implemented, the Floodplain Bench Option is expected to reduce

Tally Ho Creek Planning Project
Technical Memorandum 17
5‐year water surfaces by 0.4 feet at Cross Section 25+53, 10‐year water surfaces by 0.6 feet, 20‐year water surfaces by 0.9 feet and 50‐year water surfaces by 1.1 feet (Table 7). No benefits are expected at Cross Section 18+60. Implementation of the project would involve direct removal of sediment from off‐channel area. Consequently, we do not expect any impacts to existing channel, riparian, or wetland habitat from this project. The cost to implement this project, not including permitting, administrative costs, construction inspection, or land acquisition, was estimated to be $100,000 (Table 8). The estimated cost includes planning and design, construction, and a 15% contingency.
Table 8. Estimated cost to implement proposed project alternatives
Alternative Planning/Design Construction1 Total Estimated
Cost
Reach 4 Sediment Removal – Low Flow Channel Option
$15,000 $75,000 $90,000
Reach 4 Sediment Removal – Grade from Headcut Option
$35,000 $150,000 $185,000
Floodplain Bench Option $25,000 $75,000 $100,000
1Includes a 15% Contingency
Conclusions This study has identified Reach 4 as an area of highest flood risk where project actions should be focused to reduce flooding impacts that, in some locations, occur on an annual basis. Opportunities exist to address the more persistent flooding problems locally. Unfortunately, riparian enhancements and/or flood control improvements on Tally Ho Creek have the potential to affect existing vegetation communities, aquatic habitats and the species that utilize these habitats. The most significant concern with respect to biological resources is potential impacts to CRLF or their habitat, specifically habitat conditions that support rearing and oversummering habitat for CLRF. Perennial pools in the study area that provide potential breeding habitat for CRLF are located in the vicinity of active headcuts within the channel, although breeding has not been documented. It is not clear if these perennial pools will persist in the streambed given the existing erosion/sedimentation regime. Monitoring of these features may be prudent to determine their stability in relationship to channel adjustments. If it is determined that ongoing channel adjustments through sedimentation/erosion are likely to impact existing CRLF habitat, then stream restoration/flood control improvements that can provide more permanent CRLF habitat may be viewed favorably by resources agencies (e.g. – floodplain enhancement and/or wetland enhancement on the Clark Property). The alternative that would most likely result in a long‐term benefit to landowners, and the largest reduction in water surface elevations at discharges up to the 50‐year event, is the Reach 4 – Grade from

Tally Ho Creek Planning Project
Technical Memorandum 18
Headcut Option (Table 8). This Option would need to be combined with the Floodplain Bench Option or enhancement measures proposed for the Clark Property to offset short and long‐term impacts to riparian and aquatic habitat. In addition, a long‐term strategy to manage riparian vegetation and sediment accumulation in the channel would be necessary.
Tally Ho Creek Planning Project
Technical Memorandum 19
References Bulger, J. B., N. J. Scott Jr., and R. B. Seymour. 2003. Terrestrial activity and conservation of adult California red‐legged frogs, Rana aurora draytonii, in coastal forests and grasslands. Biological Conservation 110:85‐95.
California Natural Diversity Database (CNDDB). 2009. Biogeographic data branch. RareFind (2009). Sacramento, CA: California Department of Fish and Game. Fellers, G.M., Kleeman, P.M. 2007. California Red‐legged Frog (Rana draytonii) Movement and Habitat Use: Implications for Conservation. Journal of Herpetology 41:276‐286.
Holland, Dan C. 1994. The Western Pond Turtle: Habitat and History. Final Report. Portland, OR: U.S. Department of Energy, Bonneville Power Administration.
McCuen, R. H., Hydrologic Analysis and Design, 3rd ed., Prentice Hall, Upper Saddle River, New Jersey, 07458, 2004.
Rincon Consultants. 2009. Compliance Report for Stream Alteration Agreement No. 2006‐0859‐R3 Meadow, Tally Ho, and Arroyo Grande Creeks Stream Channel Vegetation Removal, Summer 2009, Arroyo Grande, San Luis Obispo County. October.
U. S. Army Corps of Engineers, Los Angeles District. 1999. Report on Hydrologic Analysis of San Luis Obispo, Santa Rosa, and Arroyo Grande Creeks. Discharge‐Frequency Analysis. San Luis Obispo County, California. pp 48 +
U.S. Fish and Wildlife Service (USFWS). 1996. Endangered and Threatened Wildlife and Plants; Determination of Threatened Status for the California Red‐Legged Frog. 61 FR 25813.
USFWS. 2002. Recovery Plan for the California Red‐legged Frog (Rana aurora draytonii). U.S. Fish and Wildlife Service, Portland, Oregon. Viii+ 173 pp.
USFWS. 2006. Endangered and threatened wildlife and plants; designation of critical habitat for the California red‐legged frog, and special rule exemption associated with final listing for existing routine ranching activities; final rule. Fed. Register Vol. 71, No. 71:19244‐19346.
Zeiner, D. C., W. F. Laudenslayer, Jr., and K. E. Meyer. 1988. California’s Wildlife. Volume I: Amphibians and Reptiles. May 2, 1988. California Department of Fish and Game. Sacramento, CA.

Ecological Restoration Design Civil Engineering Natural Resource Management
Tally Ho CreekPlanning ProjeCT
FigUreS
So
UTH
ern
watways.comSanta Cruz, Ca Portland, or
FIGURE 1location map for the project area on Tally Ho Creek (also known as Corbett Canyon Creek).
Shaded relief includes the arroyo grande Creek watershed.
0 1 2 4
Miles 1:126,720
Map
extent
LEGEND
INCORPORATED CITY LIMITS
HIGHWAYS
STREETS / ROADS
RAILROADS
RIVERS AND STREAMS
ARROYO GRANDE CREEK WATERSHED
ProjeCT loCaTion
1
227
101P a
CiF
iC
A rro
yo
Gra
nde
Creek
Los
Berros
Cr
eek
TarSpring Creek
Lopez Lake
City of arroyo grande
oceano
Pismo Beach
grover Beach
Pacific ocean

watways.comSanta Cruz, Ca Portland, or
FIGURE 2Project area map and reach overview
0 300 600 1,200
Miles 1:7,200
LEGEND
Tally Ho Creek Centerline
reach Breaks
Headcuts
e Branch St
Tally
Ho
rd
May St
227
227
le Point St
james Way
Canyon Way
227
rea
CH
2
Printz rd
reaC
H 3
reaCH 4
rea
CH 5
reaC
H 6
rea
CH
1 Arroyo Grande Creek
e Branch St bridge
Printz rd bridge
Bedrock control
Corbe
tt C
anyo
n rd

wat
way
s.co
mSa
nta
Cru
z, C
aPo
rtla
nd
, or
FIG
URE
3Fe
Ma
pla
n v
iew
an
d p
roif
ile v
iew
flo
od
map
s
Pag
e:10
1of
186
Sca
le:
%36
Page
1of
1In
trane
tix V
iew
er [0
6079
CV
000A
]
9/22
/200
9ht
tp://
map
1.m
sc.fe
ma.
gov/
idm
s/In
traV
iew
.cgi
?RO
T=0&
O_X
=170
0&O
_Y=1
100&
O_Z
M...
FeM
a F
loo
DM
aP
Pla
n V
ieW
FeM
a P
ro
File
Vie
W
0 00
200
4 00
6 00
8 00
10 00
1200
1400
1600
18 00
2000
2200
2400
2600
2800
3000
3200
3400
3600
3800
4000
4200
4400
4600
4800
5000
5200
5400
5600
5657.70
watways.comSanta Cruz, Ca Portland, or
FIGURE 4HeC-raS cross section and stationing overview
LEGEND
Tally Ho Creek CenTerline & STaTioning
HeC-raS CroSS SeCTion loCaTionS
e Branch St
Tally
Ho
rd
May St
227
227
le Point St
james Way
Canyon Way
Corbe
tt C
anyo
n rd
reaCH 2
Printz rd
reaCH 3
reaCH 4
reaCH 5
reaCH 6
reaCH 1

355
95.37
CC
356
95.89
CC
000
200
400
600
800
100012
00
00
1:1
to sc
ale
20-y
r (7
88 c
fs)
10-y
r (3
98 c
fs)
10
’ H
10’ V
Ta
lly
Ho
Rd
.
Cro
ss-s
ect
ion
at
RS 1
0+
35
Reach
2
50
-ye
ar
flo
od
ele
va
tio
n (
16
89
cfs
)
Arr
oyo
Gra
nde
Cree
k co
nflu
ence
E BRANCH ST BRIDGE
PRINTZ ST BRIDGE
10
+0
02
0+
00
30
+0
04
0+
00
50
+0
00
10
20
30
40
50
60
70
Riv
er
Sta
tio
n (
ft)
Relative Elevation (ft)
LE
GE
ND
10
-YE
AR F
LO
OD
EL
EV
AT
ION
20
-YE
AR F
LO
OD
EL
EV
AT
ION
TO
P O
F R
IGH
T B
AN
K
TH
AL
WE
G
RE
AC
H 2
RE
AC
H 3
RE
AC
H 4
RE
AC
H 5
RE
AC
H 6
REACH 1
E BRANCH ST BRIDGE
PRINTZ ST BRIDGE
10+0
020
+00
30+0
040
+00
50+0
0010203040506070
Rive
r Sta
tion
(ft)
Relative Elevation (ft)
LEGE
ND 10-YE
AR FL
OO
D ELE
VATI
ON
20-YE
AR FL
OO
D EL
EVAT
ION
TOP O
F RIG
HT B
ANK
THAL
WEG
REAC
H 2
REAC
H 3
REAC
H 4
REAC
H 5
REAC
H 6
REACH 1
REA
CH 2
TYP
ICA
L PH
OTO
wat
way
s.co
mSa
nta
Cru
z, C
APo
rtla
nd
, OR
FIG
URE
5Ex
isti
ng
con
dit
ion
s fo
r R
each
es 1
&2
REACH 2
REACH 1
E BRANCH ST BRIDGE
RELATIVE ELEVATION (FT)
RIV
ER S
TATI
ON
LON
GIT
UD
INA
L PR
OFI
LE
EXIS
TIN
G
CON
DIT
ION
SRE
ACH
1+2
XS @
RS
36+1
1

800
100012
00140016
00
180020
00
220024
00
2000
21
00
2200
2300
2400
Tally
Ho
Rd
10’ H
10’ V
1:1
to sc
ale
20
-ye
ar
flo
od
ele
va
tio
n (
78
8 c
fs)
Cro
ss-s
ect
ion
at
RS 1
4+
06
Reach
3
5-y
r (1
73
cfs
)
10
-yr
(39
8 c
fs)
E BRANCH ST BRIDGE
PRINTZ ST BRIDGE
10
+0
02
0+
00
30
+0
04
0+
00
50
+0
00
10
20
30
40
50
60
70
Riv
er
Sta
tio
n (
ft)
Relative Elevation (ft)
LE
GE
ND
10
-YE
AR F
LO
OD
EL
EV
AT
ION
20
-YE
AR F
LO
OD
EL
EV
AT
ION
TO
P O
F R
IGH
T B
AN
K
TH
AL
WE
G
RE
AC
H 2
RE
AC
H 3
RE
AC
H 4
RE
AC
H 5
RE
AC
H 6
REACH 1
E BRANCH ST BRIDGE
PRINTZ ST BRIDGE
10+0
020
+00
30+0
040
+00
50+0
0010203040506070
Rive
r Sta
tion
(ft)
Relative Elevation (ft)
LEGE
ND 10-YE
AR FL
OO
D ELE
VATI
ON
20-YE
AR FL
OO
D EL
EVAT
ION
TOP O
F RIG
HT B
ANK
THAL
WEG
REAC
H 2
REAC
H 3
REAC
H 4
REAC
H 5
REAC
H 6
REACH 1
E BRANCH ST BRIDGE
PRINTZ ST BRIDGE
10
+0
02
0+
00
30
+0
04
0+
00
50
+0
00
10
20
30
40
50
60
70
Riv
er
Sta
tio
n (
ft)
Relative Elevation (ft)
LE
GE
ND
10
-YE
AR F
LO
OD
EL
EV
AT
ION
20
-YE
AR F
LO
OD
EL
EV
AT
ION
TO
P O
F R
IGH
T B
AN
K
TH
AL
WE
G
RE
AC
H 2
RE
AC
H 3
RE
AC
H 4
RE
AC
H 5
RE
AC
H 6
REACH 1
REA
CH 3
TYP
ICA
L PH
OTO
wat
way
s.co
mSa
nta
Cru
z, C
APo
rtla
nd
, OR
FIG
URE
6Ex
isti
ng
con
dit
ion
s fo
r R
each
3
REACH 3
RELATIVE ELEVATION (FT)
RIV
ER S
TATI
ON
LON
GIT
UD
INA
L PR
OFI
LE
EXIS
TIN
G
CON
DIT
ION
SRE
ACH
3
XS @
RS
14+0
6

180020
00
220024
00260028
00300032
003400
2000
2100
2200
2300
24
00
2500
2600
2700
2800
2900
3000
TALLY
HOCREEK
-- A
-- B
-- C
Ta
lly
Ho
Rd
10’ H
10’ V
3:1
vert
ical
exa
gger
atio
n
20-y
ear
flo
od
ele
vati
on
(623 c
fs)
Cro
ss-s
ect
ion
at
RS 2
3+
65
Reach
4
5-y
r (1
38 c
fs)
10-y
r (3
16 c
fs)
E BRANCH ST BRIDGE
PRINTZ ST BRIDGE1
0+
00
20
+0
03
0+
00
40
+0
05
0+
00
0
10
20
30
40
50
60
70
Riv
er
Sta
tio
n (
ft)
Relative Elevation (ft)
LE
GE
ND
10
-YE
AR F
LO
OD
EL
EV
AT
ION
20
-YE
AR F
LO
OD
EL
EV
AT
ION
TO
P O
F R
IGH
T B
AN
K
TH
AL
WE
G
RE
AC
H 2
RE
AC
H 3
RE
AC
H 4
RE
AC
H 5
RE
AC
H 6
REACH 1
E BRANCH ST BRIDGE
PRINTZ ST BRIDGE
10+0
020
+00
30+0
040
+00
50+0
0010203040506070
Rive
r Sta
tion
(ft)
Relative Elevation (ft)
LEGE
ND 10-YE
AR FL
OO
D ELE
VATI
ON
20-YE
AR FL
OO
D EL
EVAT
ION
TOP O
F RIG
HT B
ANK
THAL
WEG
REAC
H 2
REAC
H 3
REAC
H 4
REAC
H 5
REAC
H 6
REACH 1
E BRANCH ST BRIDGE
PRINTZ ST BRIDGE
10
+0
02
0+
00
30
+0
04
0+
00
50
+0
00
10
20
30
40
50
60
70
Riv
er
Sta
tio
n (
ft)
Relative Elevation (ft)
LE
GE
ND
10
-YE
AR F
LO
OD
EL
EV
AT
ION
20
-YE
AR F
LO
OD
EL
EV
AT
ION
TO
P O
F R
IGH
T B
AN
K
TH
AL
WE
G
RE
AC
H 2
RE
AC
H 3
RE
AC
H 4
RE
AC
H 5
RE
AC
H 6
REACH 1
REA
CH 4
- TY
PICA
L PH
OTO
wat
way
s.co
mSa
nta
Cru
z, C
APo
rtla
nd
, OR
FIG
URE
7Ex
isti
ng
con
dit
ion
s fo
r R
each
4
REACH 4
RELATIVE ELEVATION (FT)
RIV
ER S
TATI
ON
LON
GIT
UD
INA
L PR
OFI
LE
EXIS
TIN
G
CON
DIT
ION
SRE
ACH
4
XS @
RS
23+65

5 142.13
CK181
280030
00320034
003600
3800
4000
4200
2700
2800
2900
3000
SR 2
27Ta
lly H
o R
d
10’ H
10’ V
2:1
vert
ical
exa
gger
atio
n
10
0-y
ea
r fl
oo
de
leva
tio
n (
22
16
cfs
)
Cro
ss-s
ecti
on
at
RS 3
6+
11
Re
ach
5
50
-yr
(13
33
cfs
)
E BRANCH ST BRIDGE
PRINTZ ST BRIDGE
10
+0
02
0+
00
30
+0
04
0+
00
50
+0
00
10
20
30
40
50
60
70
Riv
er
Sta
tio
n (
ft)
Relative Elevation (ft)
LE
GE
ND
10
-YE
AR F
LO
OD
EL
EV
AT
ION
20
-YE
AR F
LO
OD
EL
EV
AT
ION
TO
P O
F R
IGH
T B
AN
K
TH
AL
WE
G
RE
AC
H 2
RE
AC
H 3
RE
AC
H 4
RE
AC
H 5
RE
AC
H 6
REACH 1
E BRANCH ST BRIDGE
PRINTZ ST BRIDGE
10+0
020
+00
30+0
040
+00
50+0
0010203040506070
Rive
r Sta
tion
(ft)
Relative Elevation (ft)
LEGE
ND 10-YE
AR FL
OO
D ELE
VATI
ON
20-YE
AR FL
OO
D EL
EVAT
ION
TOP O
F RIG
HT B
ANK
THAL
WEG
REAC
H 2
REAC
H 3
REAC
H 4
REAC
H 5
REAC
H 6
REACH 1
E BRANCH ST BRIDGE
PRINTZ ST BRIDGE
10
+0
02
0+
00
30
+0
04
0+
00
50
+0
00
10
20
30
40
50
60
70
Riv
er
Sta
tio
n (
ft)
Relative Elevation (ft)
LE
GE
ND
10
-YE
AR F
LO
OD
EL
EV
AT
ION
20
-YE
AR F
LO
OD
EL
EV
AT
ION
TO
P O
F R
IGH
T B
AN
K
TH
AL
WE
G
RE
AC
H 2
RE
AC
H 3
RE
AC
H 4
RE
AC
H 5
RE
AC
H 6
REACH 1
REA
CH 5
- TY
PICA
L PH
OTO
wat
way
s.co
mSa
nta
Cru
z, C
APo
rtla
nd
, OR
FIG
URE
8Ex
isti
ng
con
dit
ion
s fo
r R
each
5
REACH 5
RELATIVE ELEVATION (FT)
RIV
ER S
TATI
ON
LON
GIT
UD
INA
L PR
OFI
LE
EXIS
TIN
G
CON
DIT
ION
SRE
ACH
5
XS @
RS
36+1
1

watways.comSanta Cruz, Ca Portland, or
LEGEND
VegeTaTion CoMMUniTy
MarSH (freSHwaTer)
willow riparian woodland (inClUdeS MarSH UnderSTory)
oak woodland
non-naTiVe graSSland (inClUdeS rUderal / diSTUrbed areaS)
deVeloped / landSCaped
Tally
Ho
rd
May St
227
le Point St
james Way
Canyon Way
227
Corbe
tt C
anyo
n rd
Printz rd
e Branch St
227
FIGURE 9Vegetation communities in the project area.
0 300 600 1,200
Miles 1:7,200
wat
way
s.co
mSa
nta
Cru
z, C
aPo
rtla
nd
, or
FIG
URE
10
Map
of
Cal
ifo
rnia
nat
ura
l Div
ersi
ty D
atab
ase
(Cn
DD
B)
sen
siti
ve p
lan
t sp
ecie
s o
ccu
rren
ces
wit
hin
a 5
-mile
rad
ius
of
the
Pro
ject
sit
e.
Blue
Lin
e Con
sulti
ngSt
ream
& W
etlan
d Pl
anni
ng ◊
Des
ign ◊
Mon
itorin
g
FIG
URE
4b:
Map
of
Cal
iforn
ia N
atur
al D
iver
sity
Dat
abas
e (C
ND
DB)
sen
sitiv
e pl
ant
occu
rren
ces
with
in a
5-m
ile r
adiu
s of
the
Pro
ject
si
te.
Lege
nd
^̀Pr
ojec
tSite
1&
5m
ilepr
oxim
ities
CNDDBListed
PlantS
pecies
Com
mon
name
Bloc
hman
'sle
afy
dais
y
Brew
er's
spin
eflo
wer
Cal
iforn
iasa
w-g
rass
Gam
bel's
wat
ercr
ess
Hoo
ver's
bent
gras
s
LaG
raci
osa
this
tle
LaP
anza
mar
ipos
a-lily
Nip
omo
Mes
alu
pine
Pism
ocl
arki
a
San
Ber
nard
ino
aste
r
San
Luis
Obi
spo
Cou
nty
lupi
ne
San
Luis
Obi
spo
mon
arde
lla
San
Luis
Obi
spo
owl's
-clo
ver
Surf
this
tle
Wel
ls'm
anza
nita
beac
hsp
ecta
clep
od
blac
k-flo
wer
edfig
wor
t
cris
pm
onar
della
dune
lark
spur
leaf
yta
rpla
nt
mar
shsa
ndw
ort
mes
aho
rkel
ia
sand
mes
am
anza
nita
stra
ight
-aw
ned
spin
eflo
wer
^̀Su
rfthistle
dune
larksp
ur
mesaho
rkelia
marsh
sand
wort
Hoo
ver's
bent
grass
beachsp
ectaclepod
Wells'm
anzanita
SanLu
isObisp
omon
arde
lla
crispmon
arde
lla
Wells'm
anzanita
Wells'm
anzanita
Wells'm
anzanita
leafytarplant
Pism
oclarkia
Pism
oclarkia
Pism
oclarkia
Pism
oclarkia
sand
mesaman
zanita
marsh
sand
wort
Wells'm
anzanita
LaGracios
athistle
Brewer'ssp
ineflower
Pism
oclarkia
Gam
bel's
water
cress
Pism
oclarkia
LaPa
nzamaripos
a-lily
Bloch
man
'sleafyda
isy
sand
mesaman
zanita
Pism
oclarkia
Pism
oclarkia
Wells'm
anzanita Sa
nBerna
rdinoaster
Pism
oclarkia
Bloch
man
'sleafyda
isy
Pism
oclarkia
SanLu
isObisp
oow
l's-clover
black-flo
wered
figwort
Wells'm
anzanita
Wells'm
anzanita
Pism
oclarkia
Pism
oclarkia
Pism
oclarkia
Wells'm
anzanita
Wells'm
anzanita
SanLu
isObisp
oow
l's-clover
Pism
oclarkia
black-flo
wered
figwort
Pism
oclarkia
black-flo
wered
figwort
sand
mesaman
zanita
black-flo
wered
figwort
DataSources:
CaliforniaNaturalDiversityDatabase,2009
USGS100k
Quadrangle
ESR
I
^̀̂
Ata
scad
ero
San
taM
aria
Mor
roB
ay
Nip
omo
San
Luis
Obi
spo
Cay
ucos
Bay
woo
d-Lo
sO
sos Arr
oyo
Gra
nde
Tem
plet
on
Pis
mo
Bea
ch
Gro
verC
ity
Gua
dalu
pe
0
0.75
1.
5
3
Mile
s1:
95,0
40
N

wat
way
s.co
mSa
nta
Cru
z, C
aPo
rtla
nd
, or
FIG
URE
11
Map
of
Cal
ifo
rnia
nat
ura
l Div
ersi
ty D
atab
ase
(Cn
DD
B)
sen
siti
ve w
ildlif
e sp
ecie
s o
ccu
rren
ces
wit
hin
a 5
-mile
rad
ius
of
the
Pro
ject
sit
e.
Blue
Lin
e Con
sulti
ngSt
ream
& W
etlan
d Pl
anni
ng ◊
Des
ign ◊
Mon
itorin
g
FIG
URE
4a:
Map
of
Cal
iforn
ia N
atur
al D
iver
sity
Dat
abas
e (C
ND
DB)
sen
sitiv
e w
ildlif
e sp
ecie
s oc
curr
ence
s w
ithin
a 5
-mile
rad
ius
of
the
Proj
ect
site
.
Lege
nd
^̀Pr
ojec
tSite
1&
5m
ilepr
oxim
ities
CNDDBListed
WildlifeSp
ecies
Com
mon
Nam
e
Amer
ican
badg
er
Cal
iforn
iare
d-le
gged
frog
coas
t(C
alifo
rnia
)hor
ned
lizar
d
stee
lhea
d-s
outh
/cen
tralC
alifo
rnia
coas
tES
U
tidew
ater
goby
wes
tern
snow
ypl
over
^̀A
mer
ican
badg
er
Am
eric
anba
dger
Am
eric
anba
dger
Cal
iforn
iare
d-le
gged
frog
Cal
iforn
iare
d-le
gged
frogC
alifo
rnia
red-
legg
edfro
g
Cal
iforn
iare
d-le
gged
frog
Cal
iforn
iare
d-le
gged
frog
Cal
iforn
iare
d-le
gged
frog
Cal
iforn
iare
d-le
gged
frog
Cal
iforn
iare
d-le
gged
frog
Cal
iforn
iare
d-le
gged
frog
Cal
iforn
iare
d-le
gged
frog
Cal
iforn
iare
d-le
gged
frog
Cal
iforn
iare
d-le
gged
frog
Cal
iforn
iare
d-le
gged
frog
coas
t(C
alifo
rnia
)hor
ned
lizar
d
stee
lhea
d-s
outh
/cen
tralC
alifo
rnia
coas
tES
U
stee
lhea
d-s
outh
/cen
tralC
alifo
rnia
coas
tES
U
tidew
ater
goby
tidew
ater
goby
wes
tern
snow
ypl
over
wes
tern
snow
ypl
over
DataSources:
CaliforniaNaturalDiversityDatabase,2009
USGS100k
Quadrangle
ESR
I
^̀̂
Ata
scad
ero
San
taM
aria
Mor
roB
ay
Nip
omo
San
Luis
Obi
spo
Cay
ucos
Bay
woo
d-Lo
sO
sos Arr
oyo
Gra
nde
Tem
plet
on
Pis
mo
Bea
ch
Gro
verC
ity
Gua
dalu
pe
0
0.75
1.
5
3
Mile
s1:
95,0
40
N