taking farm and forest to the glass: the economic
TRANSCRIPT

Taking Farm and Forest to the Glass: The Economic Contribution of
Missouri’s Distilling Industry
April 2021Exceed | Division of Applied Social Sciences | College of Agriculture, Food and Natural Resources
University of Missouri Extension

Taking Farm and Forest to the Glass: The Economic Contribution of Missouri’s Distilling Industry
April 2021 University of Missouri Extension | Page 2
This report was authored by the University of Missouri Extension Exceed - Regional Economic and Entrepreneurial Development program: Mallory Rahe, Alan Spell, Sarah Low and Hannah McClure. The MU Extension Exceed program would like to thank the following organizations and individuals:
• The Missouri Department of Agriculture - Missouri Agricultural and Small Business Development Authority for funding this important study.
• The Value Chain Steering Committee - David Weglarz and Lynn DeLean-Weber (Missouri Craft Distillers Guild), Brian Brookshire (Missouri Forest Products Association), Jason Fulvi (VisitKC), Jeff LaHue (Independent Stave Company), and Bradley Schad (Missouri Corn Growers Association).
• The University of Missouri reviewers include Joe Horner, extension specialist and Mark White, PhD, associate extension professor.
• We especially want to thank the Missouri distilling businesses and value-chain firms that volunteered their time to respond to the survey and give us feedback.

Taking Farm and Forest to the Glass: The Economic Contribution of Missouri’s Distilling Industry
April 2021 University of Missouri Extension | Page 3
Table of Contents Executive Summary ....................................................................................................................................... 4
Introduction .................................................................................................................................................... 5
Distilling Industry Overview ............................................................................................................................ 5
Craft Distillers Emerge ............................................................................................................................... 6
Missouri Distilling Advantages ................................................................................................................... 8
Distillery Growth Barriers ......................................................................................................................... 10
Start-Up Risks ......................................................................................................................................... 13
Measuring the Distilling Industry .................................................................................................................. 14
Missouri Distillers Survey Brief ................................................................................................................ 15
Economic Contribution of Missouri’s Distilling Industry ................................................................................ 24
Regional Spending Effects ...................................................................................................................... 24
The Economic Contribution of Missouri’s Distillers Brief .......................................................................... 26
Missouri’s Distiller Value-Chain ................................................................................................................... 30
Why Study Value Chains? ....................................................................................................................... 30
Measuring Value Chains to Identify Industry Linkages ............................................................................ 31
Missouri’s Distilling Industry Value Chain Map ........................................................................................ 32
Supplier Relationships ............................................................................................................................. 33
The Value Chain Connections of Missouri’s Distillers Brief ..................................................................... 37
Growth Opportunities and Challenges for the Missouri Distilling Industry ................................................ 41
Resources and the Path Ahead ............................................................................................................... 42
Conclusion ................................................................................................................................................... 44
Rapid Growth and Expanding Impact ...................................................................................................... 44
Connected Partnerships .......................................................................................................................... 44
Regulatory Reform ................................................................................................................................... 45
APPENDIX A: Economic Analysis Methodology .......................................................................................... 46
Economic Analysis Terms ....................................................................................................................... 46
Economic Model Limitations .................................................................................................................... 46
Economic Model Adjustments for this Study ............................................................................................ 47
APPENDIX B: Missouri Active Liquor Manufacturer Licenses, March 2021 ................................................ 48
APPENDIX C: Missouri Distiller Survey Questions ...................................................................................... 50

Taking Farm and Forest to the Glass: The Economic Contribution of Missouri’s Distilling Industry
April 2021 University of Missouri Extension | Page 4
Executive Summary This research was funded to provide greater awareness of the Missouri distilling industry’s contribution and connection to the broader economy; to understand and support efforts to increase its impact and benefit to other industries and workers; and to serve as a baseline to measure this industry in years to come.
Distilling is Experiencing Rapid Growth A survey of craft distillers in February 2020 revealed plans to double the previous year’s output by the end of 2021. Missouri’s distillers are experiencing rapid growth, 50 businesses had 2019 sales and an additional 20 businesses held active permits. Nationally, the number of craft distilleries grew 43 percent, while Missouri outpaced that average with an 87 percent increase from 2017 to 2020. Missouri had the ninth highest share of statewide distillery employment in 2019.
Distilleries Contributed Jobs and Sales in 2019 • Missouri distillers employed 601 people and generated gross sales of $367 million in 2019. • In total, the distillery industry contributed $0.56 billion in gross sales to Missouri’s economy. The
total value-added contribution, or gross domestic product, was over $357 million. • Every 1 job in distilling supports 1.9 jobs elsewhere in the Missouri economy.
Distilleries are Part of a Strong Value Chain in the State The state’s distilleries are part of a value chain that includes grains, specialty crops, white oak, cooperages, bottle manufacturing, marketing, restaurants, retailers and tourism.
• Missouri is home to international stave and cooperage companies and has 1.9 million acres of white oak. • Missouri has a higher share of jobs in both glass and plastic bottle manufacturing, as well as an in-
state distilling equipment manufacturer. • The Missouri Spirits Expedition spotlights Missouri’s craft distilleries by encouraging tourism and
meeting increasing consumer demand for handcrafted spirits and authentic experiences.
Being co-located with key suppliers can provide transportation savings and lower distilleries’ costs of working with these suppliers. In addition, craft spirits can open up markets for Missouri specialty crop production. The state is well poised to benefit from continued national growth in the beverage industry.
Regulatory Reform That Attains Parity Remains an Industry Priority The state’s distilled spirits regulatory environment compared to that of wine and beer creates inequities that impact distiller revenue and market share.
• The lack of direct-to-consumer (DTC) shipping authorization currently prohibits Missouri’s distilleries from selling and shipping directly to consumers, thereby limiting distilleries’ ability to retain a higher profit margin per bottle and restricting consumer choice.
• Craft distilleries pay higher state and local license fees than wineries and breweries within the state.
Addressing these regulatory inequities may better position distillers to compete in the market and increase economic contributions to Missouri’s economy. Precedents exist, both in and outside of the state, that offer models for regulatory reform.

Taking Farm and Forest to the Glass: The Economic Contribution of Missouri’s Distilling Industry
April 2021 University of Missouri Extension | Page 5
Introduction The Taking Farm and Forest to the Glass study was funded by the Missouri Department of Agriculture - Missouri Agricultural and Small Business Development Authority to understand the economic contribution of the state’s distillery industry and opportunities for expanding economic impacts in Missouri. Opportunities such as the use of more Missouri agricultural products or value-added inputs in the distilling process, for example, can increase the total value distillers bring to the state’s economy.
Organizations in other states, notably Kentucky and Virginia, have conducted economic impact studies of their distillers in recent years as the industry grows with consumer tastes changing towards craft cocktail and locally-sourced spirit products. Missouri agribusiness leaders and distillers wanted to understand the economic impacts to look at how the industry is connected to other local producers and what growth challenges/opportunities exist in the near future.
The study brought together the University of Missouri Extension Exceed - Regional Economic and Entrepreneurial Development program, Value Chain Steering Committee and Missouri Craft Distillers Guild (MCDG) to collect, analyze and report the findings of this research. The University Exceed team, part of the College of Agriculture, Food, and Natural Resources, conducted distiller surveys, gathered related national and state data, and held interviews with industry or subject matter experts to produce this study. Shortly before the release of the economic contribution analysis, COVID-19 began disrupting the Missouri economy. We have included some information about how distillers are reacting to these unfolding events, and note that the industry today is different than the 2019 baseline measures we captured.
This research was funded to provide greater awareness of how distillers benefit the Missouri economy, support efforts to increase their impact and benefit to other industries and workers, and serve as a baseline to measure this industry in years to come.
Distilling Industry Overview The distilling industry is defined by the production of spirits from on-site liquor distillation and from blending of liquors produced by other firms. Spirits can be distilled from a variety of fermented material such as grains, fruits, vegetables, and other plants to produce many classes of consumable alcoholic beverages.1 If the spirit is distilled solely from fruit juices, it is classified under wineries.
Distillers, along with breweries and wineries, produce alcoholic beverages for on-site consumption, for distribution to other sellers, or both. While the primary activity is distilling, these businesses can have on-site tasting rooms, restaurants, event spaces, and retail sales that can be important parts of overall revenue. This is especially common with smaller distillers and businesses located in tourist destinations like Branson or Hermann.
In 2019 the distilling industry had a presence in every state, according to the Bureau of Labor Statistics Quarterly Census of Employment and Wages. By the second quarter of 2019, there were 1,097 payroll distilling establishments, employing just over 17,500 people in the U.S. This figure is a low estimate, as it only captures distilleries that have employees and report to state unemployment insurance offices, but it
1 U.S. Department of the Treasury, Alcohol and Tobacco Tax and Trade Bureau. (2007). The Beverage Alcohol Manual, Chapter Four. Retrieved from https://www.ttb.gov/images/pdfs/spirits_bam/chapter4.pdf

Taking Farm and Forest to the Glass: The Economic Contribution of Missouri’s Distilling Industry
April 2021 University of Missouri Extension | Page 6
serves as a useful benchmark across states. The national employment in distilleries has almost doubled since 2013, when there were 8,870 jobs in this industry. The number of distilleries also increased by over two and a half times from 306 in 2013 to 1,097 establishments by the middle of 2019.
In 2019 Kentucky had the largest distillery payroll employment at just over 5,200 workers, followed by Tennessee at 1,700. Because Missouri payroll distillery employment is concentrated in a few companies, confidentiality laws forbid the Bureau of Labor Statistics (BLS) from disclosing employment estimates. In 2013, the last time the BLS was able to publish employment figures, Missouri had an annual average of 324 employees. A proprietary source for job figures, EMSI, estimates distillers in Missouri had a payroll employment of 419 in 2019.2
Along with a substantial national increase in distillery operations and employment, revenue has also grown in the past decade. According to IBISWorld, an industry research firm, U.S. distillery industry revenue was $14.3 billion in 2019, having grown from $8.6 billion in 2010.3 The average annual revenue growth rate over that time period was 4.7 percent.
Several very large U.S. distillers, Suntory Inc., Brown-Forman Corp., and Diageo, together represent about 70 percent of spirit sales in the United States. The concentration has increased since 2014, according to IBISWorld, but is being challenged by an increasing number of smaller, locally-owned distillers that are opening at increasing rates.
Craft Distillers Emerge Smaller distilleries are often called “craft distillers”, a term usually denoting a locally-owned and operated company with much lower production levels than larger national brands. The American Craft Spirits Association (ACSA), founded in 2013, defines craft distillers as operators that produce no more than 750,000 gallons annually. But that is still a very large business in many parts of the country, so state distillery associations will often define craft spirit producers at a lower level of production.
The Missouri Craft Distillers Guild defines a ‘craft distiller’ as a person or entity holding a federally-granted Distilled Spirits Plant (“DSP”) license for a plant located in Missouri whose annual production of distilled spirits from all sources does not exceed 100,000 proof gallons removed from bond annually. A proof gallon is one gallon of spirits at 50 proof, while the term “remove from bond” refers to when spirits leave the distillery for sale or consumption triggering excise taxes.
In the U.S., craft distillers have grown substantially in numbers and output in the past few years. The ACSA, analyzing DSP permits and other sources, estimates there were 2,265 active U.S. craft distilleries in August 2020, with nearly 400 more in the planning stage.4 Those active distillers represent a one-year increase of over 9 percent from 2,046 in August 2019 and a 43 percent increase since August 2017. Craft distillers were found in every state, with the association estimating 62 were located in Missouri and ranking the state 12th among U.S. states for the total number of craft distillers (see Exhibit 1). This represents a 13 percent increase for Missouri over the August 2019 estimate of 55 craft distillers and an 87 percent
2 EMSI. EMSI Developer (2020). Retrieved from https://www.economicmodeling.com/ 3 Lombardo, Christopher. (2019). Distilleries in the US, IBISWorld Industry Report 31214. IBISWorld. https://www.ibisworld.com/ 4 American Craft Spirits Association, Park Street, and IWSR. (2020). Annual Craft Spirits Economic Briefing. American Craft Spirits Association. Retrieved from https://americancraftspirits.org/wp-content/uploads/2017/02/Preliminary-Draft-2020_Craft-Spirits-Data-Project-compressed.pdf

Taking Farm and Forest to the Glass: The Economic Contribution of Missouri’s Distilling Industry
April 2021 University of Missouri Extension | Page 7
increase since 2017. From 2014 to 2019 ACSA shows that nationally craft distillers have grown at a compound annual growth rate of nearly 20 percent.
EXHIBIT 1: ACTIVE CRAFT DISTILLERS BY STATE AND REGION – AUGUST 2020
Source: American Craft Spirits Association, 2020 Craft Spirits Data Project
Just as the total spirits market is highly concentrated in 3-4 large firms that account for over 70 percent of sales, craft distiller sales are also concentrated nationally. Nearly 2 percent of craft distillers, or 36 firms which remove from bond between 100,000 and 750,000 proof gallons annually, account for 57 percent of case sales (see Exhibit 2). These larger distillers are exporting spirits outside of the home state and as such focus on national and international markets. Smaller distillers, by contrast, are focused on local markets and tourism with over 90 percent of sales occurring in the home state.5
EXHIBIT 2: 2019 U.S. CRAFT DISTILLERS BY SIZE AND CASE PRODUCTION
Craft Distillery Size Annual Volume Size Producers %
Producers
In U.S. Case Sales
% U.S. Case Sales
Small Less than 10,000 gallons 1,983 90% 1,309 12% Medium 10,000 to 99,000 gallons 178 8% 3,480 31% Larger 100,000 to 750,000 gallons 36 2% 6,400 57% Totals 2,197 100% 11,189 100%
Source: American Craft Spirits Association, Park Street, and IWSR – Craft Spirits Data Project 2020
Growing interest in the craft spirits industry has led states to form industry associations, feature distilleries in tourism efforts, and conduct studies like this to understand and expand the economic contribution of the industry. Kentucky has the largest concentration of distilling jobs of any state and the industry contributed an estimated 20,000 jobs a $1 billion annual payroll and $8.6 billion in total economic output in 2019. Growth in the national craft distilling industry has increased the number of distilleries, somewhat reducing 5 Annual Craft Spirits Economic Briefing, pg. 27

Taking Farm and Forest to the Glass: The Economic Contribution of Missouri’s Distilling Industry
April 2021 University of Missouri Extension | Page 8
Kentucky’s dominance within the industry, although the state still holds a large percentage of U.S. jobs and wages. Virginia launched its first study of the economic and regulatory environment surrounding the distilling industry. The study profiled craft spirit regulations in seven states and D.C. and noted substantial variation in excise taxes, retail access, tasting limits, and on-site sales restrictions.6 The Virginia Distillers Association has used this study to focus industry efforts within the state.
Missouri Distilling Advantages The distilling industry has had a long history in Missouri. Holladay Distillery in Weston, MO is one of the oldest distilleries west of the Mississippi and originally opened in 1856.7 In 1942 it became the McCormick Distilling Company and, with the expanded operations over the years, is the largest state distiller by gallons sold in Missouri.8 J. Rieger & Company, located in Kansas City, claimed to be the largest mail-order whiskey house in the U.S. prior to prohibition in 1920 when it closed.9 In 2014 the distillery opened again and is a top producer of spirits in the state. Luxco, headquartered in St. Louis, is also a large spirits producer that distills liquor in other states with blending, bottling and distribution operations in Missouri.10
These larger companies provide many jobs for distillery industry workers in Missouri. Recent national and state growth trends for locally-based drinks fueled by the changing tastes of younger consumers has created opportunities for premium whiskeys and craft cocktails.11 Craft distilleries have opened in response to this market demand while established firms are launching new lines. Distilleries are increasingly an attraction for tourists.
Missouri distiller branding and tourism
In recent years Missouri distillers have made organized efforts to promote this industry, furthering benefits to the state by branding and marketing locally-made products. A non-profit organization of over 30 distillers called the Missouri Craft Distillers Guild has been working since 2018 to educate and advocate for the distilling industry. The Guild was key in the creation of a “Missouri Bourbon” law and successfully launched the “Missouri Spirits Expedition” a statewide distillery trail promoting Missouri tourism.
The “Missouri Bourbon” law was signed by Missouri Governor Parson in 2019 creating the most restrictive definition of bourbon in the world. “Missouri Bourbon” must be mashed, fermented, distilled, aged and bottled in the state. Additionally, distilleries must use white oak barrels that are manufactured in the state, and the corn used in the mash must be Missouri-grown. This law highlights the state’s ability to draw upon internal businesses for all of the major components of bourbon and seeks to create a distinct market for a Missouri grown, value-added product.
6 MBA Corporate Field Consultancy Program. (2018) The Economic and Regulatory Analysis of Virginia’s Distilled Spirits Industry. Raymond A. Mason School of Business William & Mary College. 7 Holladay Distillery About Us. (February 2020). Holladay Distillery. Retrieved February 25, 2020 from https://holladaydistillery.com/about/ 8 MO Department of Public Safety - Division of Alcohol and Tobacco Control. (February 2020). Licensee Excise Tax Report for July 2019 – December 2019. Retrieved from https://data.mo.gov/Regulatory/Licensee-Excise-Tax-Reported/mjc8-gkkx 9 J. Rieger & Company About Us (February 2020). J. Rieger & Company. Retrieved February 25, 2020 from https://www.jriegerco.com/ourstory 10 Luxco Contact Us (February 2020). Luxco, Inc. Retrieved February 25, 2020 from https://www.luxco.com/contact-us/overview/ 11 Lombardo, Christopher. (2019). Pages 7-9

Taking Farm and Forest to the Glass: The Economic Contribution of Missouri’s Distilling Industry
April 2021 University of Missouri Extension | Page 9
Tourism is a growing part of the craft distilling market. Kentucky pioneered distillery tourism, opening the Kentucky Bourbon Trail in 1999 and the Kentucky Craft Trail in 2012. These two routes were enjoying a steady growth in tourism with a 1.7 million visitors in 2019. Total visits dropped 66 percent in 2020 due to COVID-19.12 In 2017, neighboring Tennessee, the state with the second highest total employment in distilling launched the Tennessee Whiskey Trail. The Virginia distilling industry study recommended the state formalize a spirits trail as a way to better leverage state tourism.
The Missouri Craft Distillers Guild launched the Missouri Spirits Expedition in May 2019. The Expedition gives visitors a road map to tour spirit producers across the state, and the opportunity to participate in other promotional events. This program highlights how engaged local distillers are in building their businesses. In addition to selling spirits, distillers often enrich the tourism experience by offering food, retail goods, and event venues at their locations.
The potential to drive tourism expansion by highlighting the distinctiveness of Missouri bourbon creates an opportunity for multiple producer groups to increase broader awareness and communication among the value chain and to potentially engage in joint marketing efforts.
Key inputs produced in Missouri
A lesser known strength for Missouri’s distilling industry is that many of the key inputs needed to create spirits are abundantly found in the state. For example, wood barrels and corn are important inputs to the whiskey-making process, and Missouri is a key producer.
Among the largest cooperages in the country, Independent Stave and McGinnis Wood Products are located along Interstate 44 in Missouri and provide barrels to U.S. and international customers. White oak trees are the cornerstone of wood barrel making, accounting for over 95 percent of the wood in barrels used for spirit and wine aging and are in large supply across the southern half of Missouri. Missouri produces approximately 2.5 million barrels annually.13
Corn is a key ingredient in many spirits and especially so for bourbon. Missouri farmers planted over 3.3 million acres of corn according to the 2017 Census of Agriculture. Distillers benefit from having this important ingredient nearby and the ability to work with local farmers when specialized corn varieties are desired for craft spirits.
The Missouri distiller value chain contains producers and businesses from across Missouri, including many rural areas. Although overall food and beverage spending is stagnant, consumer spending has shifted to support smaller and specialty-good manufacturers that create products such as place-based beverages (e.g., Missouri bourbon). Food and beverage manufacturing is the largest rural manufacturing industry, and beverage manufacturing (including distilling) is its only growing sub-industry, according to USDA Economic Research Service.14 Today’s beverage manufacturers must reset and reposition themselves to address
12 Kentucky Bourbon Trail Attendance Plummets Under COVID-19. February 16, 2021. Retrieved from https://kybourbontrail.com/kentucky-bourbon-trail-attendance-plummets-under-covid-19/ 13 Denter, Holly. (December 1, 2017) Our Forests at Work. Missouri Conservationist Magazine, Missouri Department of Conservation. Retrieved from https://mdc.mo.gov/conmag/2017-12/our-forests-work 14 Low, Sarah, Rural Manufacturing at a Glance, 2017 Edition. USDA Economic Research Service. Retrieved from https://www.ers.usda.gov/publications/pub-details/?pubid=84757

Taking Farm and Forest to the Glass: The Economic Contribution of Missouri’s Distilling Industry
April 2021 University of Missouri Extension | Page 10
changing consumer needs.15 Craft spirits are growing, in part, because consumers, and especially millennial consumers, favor specialty, niche and craft production and are willing to pay more for unique products.16 By supporting growth of the distilling industry, more value may be built for Missouri’s agricultural commodities and in turn Missouri’s producers.
Distillery Growth Barriers Missouri already boasts a good business climate with generally lower cost of living and the twelfth lowest tax environment among U.S. states.17 While the foundations of Missouri’s distilling industry are strong, most distillers in Missouri are small family-owned businesses with few paid employees. In addition, many Missouri laws governing the industry have not been modified since Prohibition ended in 1933. Antiquated state laws inhibit growth in this value-added industry by enforcing higher excise taxes, license fees and regulations than beer and wine counterparts face, but also create inequities that disadvantage Missouri small-batch distilleries involved in intra- and interstate commerce.
Like many states, Missouri’s rules and regulations governing alcohol differ across beer, wine and spirits. Each type of alcohol is subjected to different manufacturing and wholesale distribution permits as well as different tax rates. Alcohol is both taxed and permitted at three different levels, by the federal government, the state government and the local government. The spirits industry has only recently begun to develop a craft component, lagging behind beer, in response to shifting consumer demand. Legislative efforts to support small business development and a strong craft industry have become a focus of distiller groups in several states. In Missouri, craft breweries have obtained regulation and tax exemptions that recognize that a craft production process is inherently more labor intensive and often uses specialty inputs raising costs and other production practices that lower overall efficiency. Within a more heavily taxed industry and without special exemptions, craft distillers nationwide still struggle to enter a regulated industry with high startup costs.
Regulations Among states, Missouri is more open to spirit sales than the seventeen states that control the sale of alcohol through government agencies and boast the third lowest spirit excise tax of any state.18 Yet, regulation disparities including direct-to-consumer (DTC) distribution restrictions and business licenses remain across alcohol types within the state that disadvantage spirits production, especially among small producers.
Sales and Distribution Restrictions Direct to consumer sales are an important way for small producers to capture value and grow a business. Distillers in urban areas or tourist destinations may have more success developing robust on-site sales and the ability to sell online expands market access. As alcoholic beverages are heavy and expensive to ship, 15 Deloitte (2015). Consumer product trends: Navigating 2020. Retrieved from https://www2.deloitte.com/content/dam/Deloitte/uk/Documents/consumer-business/deloitte-uk-cpg-trends-2016.pdf. 16 Distilled Spirits Council of the United States. (2020). Distilled Spirits Council Economic Report: Tariffs Cause Rough Seas on Both Sides of the Atlantic, Strong U.S. Spirits Market in Jeopardy. February 12, 2020. Retrieved April 1, 2020 from https://www.distilledspirits.org/news/distilled-spirits-council-economic-report-tariffs-cause-rough-seas-on-both-sides-of-the-atlantic-strong-u-s-spirits-market-in-jeopardy/ 17 2021 State Business Tax Climate Index, Tax Foundation, https://taxfoundation.org/2021-state-business-tax-climate-index/ 18 Cammenga, Janelle (2020). Tax Foundation. How High are Distilled Spirits Taxes in Your State? Retrieved Dec 17, 2020 from https://taxfoundation.org/state-distilled-spirits-excise-tax-rates-2020/

Taking Farm and Forest to the Glass: The Economic Contribution of Missouri’s Distilling Industry
April 2021 University of Missouri Extension | Page 11
DTC shipping is a more viable marketing strategy for wine and higher valued spirits than beer. Based on information from July of 2020, with the exception of Alabama, U.S. states and the District of Columbia allow for DTC shipping of wine; these sales face stricter requirements in five states. By comparison, only eight states allow beer and wine shipments, while six states and the District of Columbia allow distillers to use direct shipping.19
Missouri’s alcohol regulations allow wineries to ship up to two cases a month per customer in Missouri for their personal consumption beginning in August 2007.20 Wineries must apply for this license which has no additional fee, and follow strict guidelines. Expanding direct shipping alcohol laws to include spirits is a priority for the craft spirits industry.
Business licenses Distilleries pay higher taxes and annual license fees than breweries or wineries. Exhibit 3 illustrates the different Missouri licenses and their costs to reach a consumer for all three alcohol categories. A distillery of any size spends $1,250 per year on state licenses to manufacture and sell spirits to wholesalers and onsite consumers, compared to $400 for a large brewery or $450 for a winery. Furthermore, lower state fees exist for both microbreweries, $200 annually, and domestic wineries, $300 annually, to lower the relative tax burden for these smaller producers.21 The license costs cover state government requirements, but individual county governments can collect their own fee as can city governments. No comprehensive guide to all alcohol license fees could be found within Missouri.
EXHIBIT 3: COMPARISON OF MISSOURI STATE ALCOHOL LICENSE FEES
Manufacturing
license Wholesale
sales license Retail sales
license
Annual State cost to reach a consumer*
Beer $250 $100 $50 $400 Wine $200 $200 $50 $450 Spirits $450 $500 $300 $1,250
Data Source: Missouri Department of Public Safety Alcohol & Tobacco Control https://atc.dps.mo.gov/fees/ *These fees are collected by the state government, county governments can set their own fee up to the state maximum.
Alcohol Excise Taxes Alcohol is one of the goods subjected to an excise or consumption tax along with gasoline and diesel fuel, plane travel and tobacco, among other products. Distillers pay both a federal and state excise tax on the spirits sold for consumption.
Federal Excise Taxes Up until 2018, a distiller had to pay a Federal Excise Tax (FET) of $13.50 per proof gallon (PG) for every PG produced when it was sold; this was a substantial barrier for small firms. From 2018-2020 the rate was 19 Direct Shipment of Alcohol State Statutes. National Conference of State Legislatures, Retrieved January 15, 2021 from https://www.ncsl.org/research/financial-services-and-commerce/direct-shipment-of-alcohol-state-statutes.aspx 20 Wine Direct Shipper, Missouri Department of Public Safety Alcohol & Tobacco Control. Available at https://atc.dps.mo.gov/licensing/wine_direct_shipper.php 21 Fees. Missouri Department of Public Safety Alcohol & Tobacco Control. Available at https://atc.dps.mo.gov/fees/

Taking Farm and Forest to the Glass: The Economic Contribution of Missouri’s Distilling Industry
April 2021 University of Missouri Extension | Page 12
temporarily reduced to $2.70/PG for the first 100,000 proof gallons sold or imported per year. The tax rate then increased to $13.34/PG for every 100,001 through 22.13 million proof gallons a producer sells. Producer selling more than 22.13 million PG pay $13.50/PG for every proof gallon produced above this threshold. The temporary reduction in FET aided distillers by reducing their taxes but the legislation also created tremendous uncertainty for smaller businesses. Distillers were hesitant to invest in growth not knowing if the FET exemption would expire or be continued.
This legislation, labeled the “Craft Beverage Modernization and Tax Reform Act,” created preferential tax cuts for initial volumes of alcohol produced regardless of a producer’s total output. The estimated effect was a cost savings of $4.2 billion of alcohol taxes, or roughly 20 percent of the total alcohol excise tax collected. Making this incremental tax structure permanent was something all producers within the alcohol industry had reason to support. 22 The lower rate of $2.70 for smaller distillers has helped encourage the business start-ups and has become a central advocacy focus for the Association of Craft Spirits Association and other distilling industry groups.23 As this study was being finalized, the FY 2021 Omnibus Appropriations Bill signed by the President on Dec, 27, 2020 included the Craft Beverage Modernization and Tax Reform Act legislation creating permanent FET reductions.24 This decrease in FET allows craft distillers to reinvest more into their distillery operations, including equipment, labor, and expansion.
Missouri excise taxes Missouri’s spirit excise tax is $2.00 per proof gallon. While the state’s excise tax on spirits is the lowest of all state that collect such tax, 25 distillers point to the even lower tax rates paid by wine and beer producers as shown in Exhibit 4 below. Notably, of the $0.42 excise tax on wine, $0.12 is sent back to fund the Missouri Wine and Grape Board which invests in marketing, education and research. Achieving or improving parity, would provide the state’s distillers more dollars to invest in their businesses. Allowing a portion of the excise tax to be directed towards supporting growth of the distilling industry is another strategy which has precedent in the state.
EXHIBIT 4: 2020 MISSOURI EXCISE TAXES PER GALLON
Alcoholic Bev. Excise Tax Liquor $2.00 Wine $0.42 Beer $0.06
Source: Missouri Department of Public Safety, Alcohol and Tobacco Control
Tariffs In July 2018, tariffs from the European Union, China, Canada, Mexico and other countries targeted distinctive American products including bourbon and whiskey. Additional tariffs were levied on the 22 Looney, Adam. (2018). Who benefits from the “craft beverage” tax cuts” Mostly foreign and international producers. Brookings Institute. January 3, 2018. Retrieved April 2, 2020 from https://www.brookings.edu/research/who-benefits-from-the-craft-beverage-tax-cuts-mostly-foreign-and-industrial-producers/ 23 Continued FET Reform Needed to Prevent Massive Job Loss in Craft Distilleries Through the U.S. American Craft Spirits Association, November 16, 2020. Retrieved from https://americancraftspirits.org/category/advocacy-news/legislative/federal/ 24 National Conference of State Legislatures (2021). FY 2021 Omnibus Appropriations Bill. Retrieved Jan 5, 2021 from https://www.ncsl.org/ncsl-in-dc/publications-and-resources/fy-2021-omnibus-appropriations-bill.aspx 25 Cammenga, Janelle. (2020). How High are Distilled Spirits Taxes in Your State? Tax Foundation, Retrieved Dec 17, 2020 https://taxfoundation.org/state-distilled-spirits-excise-tax-rates-2020/

Taking Farm and Forest to the Glass: The Economic Contribution of Missouri’s Distilling Industry
April 2021 University of Missouri Extension | Page 13
international trade of spirits by the United States and other major trading partners throughout 2019 and 2020. These tariffs have reversed recent growth in craft spirit exports. The ACSA estimates that craft spirit exports declined at a compound annual growth rate of 26 percent from 2017 to 2019.26 A deeper analysis of the impact of these tariffs on Missouri distillers is outside the scope of this project.
Start-Up Risks Distillers assume substantial risk starting a business and often do not realize sales for years after making their initial investment. Surveyed Missouri firms invested an average of $300,000 in the machinery, equipment, and construction during their initial launch years as they applied for licenses and permits to local, state and federal agencies. Waiting for permits and aging spirits can mean substantial sales are three or more years out from the time a business obtains an initial license as illustrated in Exhibit 5. Many new distilleries will release spirits that do not need to be aged, blend spirits produced elsewhere, and use smaller 15-gallon barrels to improve flavor profiles in less time as ways to reach the market more quickly and fund the cost of aging spirits. In a Forbes interview Kellie Shevlin, a craft distiller industry expert, outlines the capital intense nature of the business noting that a distiller should expect that it might take five to seven years for the business to cover its own expenses and at least 10 years to be profitable. Shevlin notes that craft distillers can pursue a range of business models and each assumes different paths and costs to bring a product to the market.27 This benchmark rang true with individual distillers we interviewed but we did not survey the state’s businesses on this point.
EXHIBIT 5: DISTILLERS OFTEN INCUR MULTIPLE YEARS OF COSTS TO BRING AN AGED SPIRIT TO MARKET
Source: MU Exceed visualization of costs and revenues for new distilleries
26 Annual Craft Spirits Economic Briefing 2020, page 18. 27 Minnick, Fred. (2018).Want To Start A Distillery? Read This. Forbes. Retrieved from https://www.forbes.com/sites/fredminnick/2018/10/26/want-to-start-a-distillery-read-this/#38d375455e46

Taking Farm and Forest to the Glass: The Economic Contribution of Missouri’s Distilling Industry
April 2021 University of Missouri Extension | Page 14
Measuring the Distilling Industry Defining distillers, and measuring the size, location, employment, etc., is more complicated than for other industries. Several U.S. employment data agencies, like the Bureau of Labor Statistics and the Bureau of Economic Analysis, track businesses by industry code but distillers present some measurement challenges which include:
• Many distillers are smaller, family operations that do not report regular administrative records to government employment agencies. Employers with a regular payroll send job and wage records to state unemployment insurance offices but a very small distiller, without employees, would not report.
• Small distillery operations can be part of a larger business, such as a winery, brewery, or restaurant, that are classified separately from distilling so industry codes will miss them. With the rapid growth in demand for local-sourced spirits, this is a trend that is likely to continue as wine and beer sales have slowed in recent years.
• Larger distillers, which report employment figures, can operate distinct business activities, such as separate headquarter, distilling plant, retail, and distribution centers, that can hide employment in other industry data.
Several government sources provide figures for businesses that operate distillery plants. The federal Alcohol and Tobacco Tax and Trade Bureau issues Distilled Spirits Plant (DSP) permits for an entity to operate a distillery. However, information is limited to the name and location of the distiller in each state so other information must be gathered to understand business operations.
The state source for identifying distillers that are actively producing spirits in Missouri is the Missouri Department of Public Safety’s list of active liquor manufacturer licenses.28 This shows businesses that currently have a license to manufacturer liquor in Missouri and also has information on gallons produced for sale in the state. This Missouri active liquor license information, combined with the Missouri Craft Distiller’s Guild membership lists and other national business databases, were used to develop a survey list and for gathering additional information from Missouri’s distilleries.
In 2019 there were 70 business in the state with a Missouri liquor manufacturing license. Of those 70, 50 had spirit sales and paid excise taxes in 2019. The remaining 20 were either in the planning and early production phase or have recently exited production but are still holding a license. This list of license holders changes often, from February 2020 to March 2021, five businesses did not renew a license, seven businesses secured a license, and one business changed their name but not the business address. The list from February 2020 was used to distribute the survey, the list from March 2021 can be found in Appendix B.
Missouri Distillers Survey In order to accurately model the size and economic contributions of Missouri’s distillers, a survey was developed and sent to all 70 known distillers in the state. Appendix C includes the survey and cover letter used to collect data from distillers. The survey results were summarized in the following brief.
28 Missouri Department of Public Safety, Alcohol and Tobacco Control. (February 2020, updated March 2021). Active Primary License Reports. Retrieved from https://data.mo.gov/Regulatory/Missouri-Primary-Alcohol-Licenses/d9fr-pncw

Missouri’s Distilling Industry: A 2019 Perspective
EXECUTIVE SUMMARY A February 2020 survey of Missouri distillers collected information used to analyze the industry’s economics and serve as a benchmark for measuring future growth. Twenty-two distillers responded to the survey—a high 35% response rate—and provided responses about spirit production, sales, and input costs. Multiple steps were taken to ensure survey respondent confidentiality, and no results that can identify a particular distiller are displayed.
Although Missouri has a long history with distilled spirits, much of the state’s growth in distilleries occurred in the past few years; just less than half (45%) of respondents were in a startup stage when they responded to the survey. The total number of proof gallons sold by smaller distillers grew at an average rate of 33% between 2015 and 2018 as new firms started production. Before COVID-19, most firms planned to expand production in 2020; smaller distillers had prepared to more than double their spirit production by 2021. The pandemic has changed those plans and prioritized distillers’ need for pursuing direct-to-consumer online sales.
Distillers sell more than spirits and alcoholic beverages, which contributed 61% of total revenue in 2019. They offer food, venue rentals, tours, and other services to visitors. Respondents hosted 257,000 visitors in 2019, and the survey findings suggest that a distiller’s tourism market reach grows as the business increases in size. Before the COVID-19 pandemic, distillers optimistically projected that visitor counts would grow by more than 50% between 2019 and 2021.
Survey respondents indicated that typical startup costs for two years total just more than $300,000 for machinery, equipment, and construction. In 2019, smaller distillers employed a median of four people, including full- and part-time jobs. Full-time pay averaged $42,500 a year. For every $1 of spirit sales, respondents said they spent between 30% and 40%, depending on distiller size, on inputs. Smaller distillers made 57% of all input purchases from Missouri farms or companies; such purchases support jobs and income in the Show-Me State.
September 2020
This survey brief was produced by Exceed, Division of Applied Social Sciences, College of Agriculture, Food and Natural Resources and University of Missouri Extension. This brief was made possible by a grant from the
Missouri Department of Agriculture, Missouri Agricultural and Small Business Development Authority and the contributions of the Missouri Craft Distillers Guild, Value-Chain Steering Committee, and
Missouri distillers who gave their time to respond to the anonymous survey.

September 2020 University of Missouri Extension | Page 16
Missouri’s Distilling Industry: A 2019 Perspective
INTRODUCTION
A February 2020 survey collected information to analyze the Missouri distilling industry’s economic contribution. The survey gathered information, especially on Missouri’s startup distilleries, that would have been missed by using only data from government organizations or private business data vendors. The survey was necessary to provide accurate information for the economic analysisi and ensure Missouri distillers have a better benchmark for measuring industry growth in the years ahead.
SURVEY METHODOLOGY AND NOTES
The Missouri distiller survey asked about spirit production, sales, and input costs; find the full list of survey questions in Appendix A. University of Missouri faculty contacted 62 distillers that were producing product or planning their operations, and they received 22 completed online surveys. The 35% response rate is relatively high for a business survey. Several steps were taken to reach this response rate: • The Missouri Craft Distillers Guild held meetings and sent emails to prepare distillers for the upcoming
survey. Survey questions were provided to distillers as a paper-based worksheet, so they could prepare responses in advance.
• Missouri Craft Distillers Guild leaders and the project steering committee assisted with outreach and provided contact information for initial and follow-up contact efforts.
• The online survey was administered anonymously through Qualtrics web-based survey software. No names, IP addresses, or location information were collected in order to protect identities and encourage responses.
• Respondents were informed that only aggregated survey results would be used for reporting to further protect their identities.
Not all survey questions are summarized in this report to protect respondent confidentiality. Survey results were aggregated and, when possible, shown by distiller size. Responses from smaller distillers outnumbered larger distillers, so this report contains more information from smaller distillers.
Describing the typical characteristics of a distiller helped develop an economic contribution analysis, and spirit producers can use the findings to understand how they compare with others in their industry. The report uses three statistical measures to describe a “typical” characteristic: • An average, or mean, is valuable in larger surveys but can be misleading in this survey as outlying
data points create averages that are far from typical for any respondent. • A median, the middle point of all entries, is the value with an equal number of responses above it and
below it. This summary measure is useful when data contain outliers that can pull an average too far in one direction and make it less representative of the whole sample.
• The trimmed average, an alternative measure used to create an average and here uses the middle 80% of data points. This measure can be a better fit when a small number of survey responses are outliers from the mean.ii
This report mainly uses median values and trimmed averages to describe typical distiller characteristics, due to the small number and range of responses. Both measures are shown if the values reasonably represent a typical distiller characteristic.

September 2020 University of Missouri Extension | Page 17
Missouri’s Distilling Industry: A 2019 Perspective
SURVEY RESPONSES
Distillers by Business Stage, Permit Year, and Production
Although Missouri has a long history with distilled spirits, much of Missouri distilleries’ growth occurred in the past few years. Just less than half of respondents (45%) said that in 2019 they were in the startup stage, defined as having some initial sales but no profit yet (see Chart 1). Forty-one percent were in a growth stage, defined as increasing sales, capturing low profit, and being investment-focused. Fourteen percent described themselves as mature with stable sales and profit and a focus on new products and markets. No respondents described themselves as in the development stage or indicated their business had declined or exited from the industry.
CHART 1: SURVEY RESPONDENTS BY BUSINESS STAGE
Survey respondents received their Distilled Spirits Production permits (DSPs), which are required to sell spirits, across a range of years as shown in Chart 2. Not all distillers begin selling right away. Navigating the licensing and permitting process at the local, state and federal levels, as well as the desire to sell an aged product like bourbon, can affect the length of time between making an investment and making a sale.
CHART 2: RESPONDENTS BY DISTILLED SPIRITS PRODUCTION (DSP) PERMIT YEAR
In 2013, five respondents produced spirits. (See Chart 3.) The number of operations with production grew steadily since then as other distillers began production. To protect respondent confidentiality, production totals and growth over time are not shown.

September 2020 University of Missouri Extension | Page 18
Missouri’s Distilling Industry: A 2019 Perspective
CHART 3: CUMULATIVE RESPONDENTS BY YEAR PRODUCTION STARTED
By 2019, most responding distillers produced less than 10,000 proof gallons1 (PG) a year, as shown in Table 1, and were considered smaller operations in this report. For this report’s purposes, a larger operation would produce 10,000 PG or more. More precise figures on production size are not disclosed to protect survey respondent identities.
TABLE 1: SURVEYED MISSOURI DISTILLERIES BY SIZE (2019)
Total Production in Proof Gallons Count Percent Smaller: Less than 10,000 PG 16 78% Larger: 10,000 PG or more 5 22% Total 21 100%
Distiller Growth Projections for 2020-2021 before COVID-19
All 22 respondents in February 2020—the month before Missouri’s COVID-19 stay-at-home order was implemented—planned to produce spirits in 2020. Most firms (86%) also had plans to expand production in 2020. Smaller distillers—those producing less than 10,000 PG—had planned to more than double spirit production by 2021. Because this survey was conducted prior to the COVID-19 pandemic, which caused major disruptions in the U.S., these encouraging growth projections have likely been severely impacted.
Spirits Sold and Markets
Nineteen of the survey respondents (86%) sold spirits in 2019; most respondents making sales were smaller distillers that produced less than 10,000 PG a year. Two additional startup distillers produced spirits in 2019 but had no sales. As with total production volumes, more exact figures on proof gallons sold are not disclosed to protect survey respondent identities.
Missouri distillers produce a range of spirits, and those that offer aged products carefully must balance expansion with sales. In any given year, total production and sales will differ depending on how many gallons of spirits are put into or removed from aging. From example, in 2019, smaller distillers produced 1 A proof gallon (PG) is a common unit used by the U.S. Alcohol and Tobacco Tax and Trade Bureau. Its definition reads, “A proof gallon is one liquid gallon of spirits that is 50% alcohol at 60 degrees F. Distilled spirits bottled at 80 proof (40% alcohol) would be 0.8 proof gallons per gallon of liquid. At 125 proof, a gallon of liquid would be 1.25 proof gallons.”

September 2020 University of Missouri Extension | Page 19
Missouri’s Distilling Industry: A 2019 Perspective
more than twice as many spirit proof gallons by volume than they sold. This is common for startup distillers that must produce more spirits in their early years than they can sell in order to age specific products.
A new distiller will often purchase spirits from other producers in the early years for blending and repackaging while it ages spirits that are produced on-site. In 2019, smaller distillers purchased 7% of spirits from businesses outside of Missouri. These sales reflect startup or specialized spirit needs. These smaller distillers generally produce most spirits on-site as consumers enjoy the craft drink experience. Larger distillers, however, may need to purchase spirits from outside of the state to deliver higher volume products. In total, Missouri distillers purchased 21% of spirits from out-of-state sources to cover their production during 2019.
Total number of proof gallons sold by smaller distillers increased each year from 2012 to 2019, and production grew at an average rate of 33% between 2015 and 2018 as new firms started operations. Seven new spirit producers began making sales in 2019 and nearly tripled total proof gallons sold in one year by smaller operations.
Distillers use multiple channels to reach consumers and sell their spirits. On-site sales and off-site sales within Missouri contributed nearly equally to 2019 total revenue for smaller distillers. For larger distillers, out-of-state sales accounted for the majority of proof gallons sold (89%) compared with 15% for smaller producers (see Chart 4).
CHART 4. DESTINATION FOR MISSOURI SPIRITS, 2019
As a distillery increases in size, its markets naturally expand outside of the state. This is a positive trend that brings new money to Missouri’s economy. Missouri distillers face obstacles, however, to selling spirits into broader markets. Unlike the state’s wineries, Missouri distillers cannot sell spirits directly to consumers online nor ship out of state. Direct-to-consumer sales are an increasingly important channel to reach consumers; the COVID-19 pandemic has demonstrated this. Distillers want to modernize laws to sell online, so they can keep pace with other states (AZ, FL, HI, KY, NE, NH, VA), which allow online sales.
September 2020 University of Missouri Extension | Page 20
Missouri’s Distilling Industry: A 2019 Perspective
Respondents’ 2019 sales included revenue from spirits, restaurants, retail, and other services. Using a combination of survey responses and 2019 excise tax collections from the Missouri Department of Public Safety, Alcohol and Tobacco Control Division, the project team estimates that the state’s 50 active distillers—those with known 2019 sales—had total sales of $367 million in 2019.
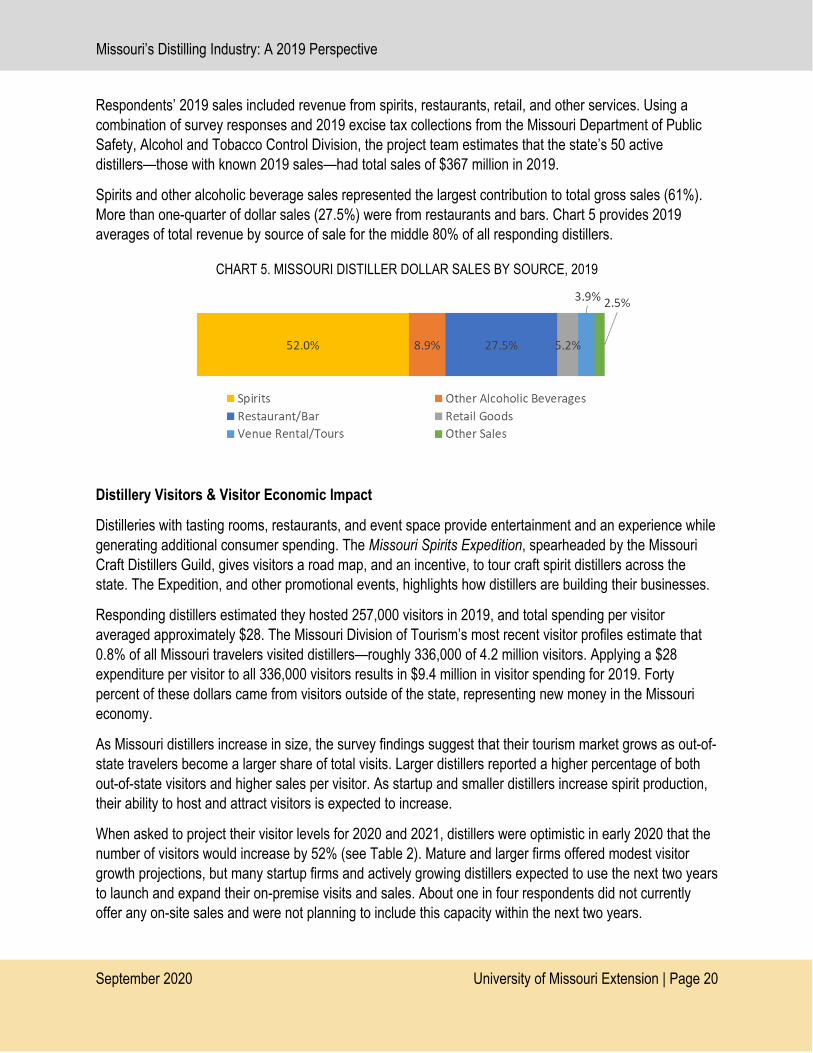
Spirits and other alcoholic beverage sales represented the largest contribution to total gross sales (61%). More than one-quarter of dollar sales (27.5%) were from restaurants and bars. Chart 5 provides 2019 averages of total revenue by source of sale for the middle 80% of all responding distillers.
CHART 5. MISSOURI DISTILLER DOLLAR SALES BY SOURCE, 2019
Distillery Visitors & Visitor Economic Impact
Distilleries with tasting rooms, restaurants, and event space provide entertainment and an experience while generating additional consumer spending. The Missouri Spirits Expedition, spearheaded by the Missouri Craft Distillers Guild, gives visitors a road map, and an incentive, to tour craft spirit distillers across the state. The Expedition, and other promotional events, highlights how distillers are building their businesses.
Responding distillers estimated they hosted 257,000 visitors in 2019, and total spending per visitor averaged approximately $28. The Missouri Division of Tourism’s most recent visitor profiles estimate that 0.8% of all Missouri travelers visited distillers—roughly 336,000 of 4.2 million visitors. Applying a $28 expenditure per visitor to all 336,000 visitors results in $9.4 million in visitor spending for 2019. Forty percent of these dollars came from visitors outside of the state, representing new money in the Missouri economy.
As Missouri distillers increase in size, the survey findings suggest that their tourism market grows as out-of-state travelers become a larger share of total visits. Larger distillers reported a higher percentage of both out-of-state visitors and higher sales per visitor. As startup and smaller distillers increase spirit production, their ability to host and attract visitors is expected to increase.
When asked to project their visitor levels for 2020 and 2021, distillers were optimistic in early 2020 that the number of visitors would increase by 52% (see Table 2). Mature and larger firms offered modest visitor growth projections, but many startup firms and actively growing distillers expected to use the next two years to launch and expand their on-premise visits and sales. About one in four respondents did not currently offer any on-site sales and were not planning to include this capacity within the next two years.

September 2020 University of Missouri Extension | Page 21
Missouri’s Distilling Industry: A 2019 Perspective
TABLE 2. SURVEY RESPONDENTS’ ON-SITE VISITORS
Distiller Size 2019 Total 2020 Expected 2021 Expected Larger: 10,000 PG or more 132,500 173,800 222,000 Smaller: Less than 10,000 PG 124,456 143,415 167,722 Total 256,956 317,215 389,722
Business Investments
The survey asked distillers about business investments in machinery, equipment, and construction to understand typical startup costs and continuing capital investments for operational businesses. Investments from 2015 to 2019 were analyzed for spending trends to ensure the data reflected timely costs figures.
Initial investments The investments distillers made in the year they received their DSP licenses and the year after were used to understand machinery, equipment, and construction startup costs. Due to the small number of responding firms and wide range of reported investment figures (from a low of $10,000 to more than $2 million), two measures of central tendency were used to analyze the data. Table 3 shows the two-year median and trimmed average investments for Missouri distillers. Based on the trimmed average, two-year startup costs have totaled just more than $300,000 for typical distillers.
TABLE 3. DISTILLER STARTUP INVESTMENTS
Startup Investments 2-Year Median
Cost 2-Year Trim.
Avg Cost Machinery and Equipment $152,500 $168,000 Construction $46,000 $135,200 Total $198,500 $303,200
Annual capital investments Distillers reported continuing capital investments in machinery, equipment, and construction that spanned from a few thousand to a few million dollars, depending on distillery size, business stage, and other factors. Given the small number of firms and wide investment range, the median and trimmed average analyses were used to describe distillers’ typical annual capital spending outside of startup years. Table 4 shows the investments per $100,000 in gross sales for Missouri distillers between 2015 and 2019. These figures indicate that annual capital investments, apart from startup years, represented 3% to 7% of gross sales.
TABLE 4. DISTILLER ANNUAL CAPITAL INVESTMENTS PER $100,000 IN GROSS SALES, 2015-2019
Annual Capital Investments
Median Cost Per $100,000 in
Gross Sales
Trim. Avg Cost Per $100,000 in
Gross Sales Machinery and Equipment $1,400 $4,300 Construction $1,300 $2,400 Total $2,700 $6,700

September 2020 University of Missouri Extension | Page 22
Missouri’s Distilling Industry: A 2019 Perspective
Labor, Wages, and Benefits
The survey asked distillers about the number of jobs at their businesses from 2017 to 2019 and their 2019 average annual pay. To protect the confidentiality of larger firms, only data for smaller spirit producers can be shown. Smaller distillers in 2019 employed a median of four people, including full- and part-time jobs (see Table 5). These distillers, prior to COVID-19, were planning to double their median employment level to 8.5 by 2021 to match increased spirit production and sales.
TABLE 5. MEDIAN NUMBER OF SMALLER DISTILLER JOBS, 2017-2019
Distiller Description 2017 2018 2019 Smaller: Less than 10,000 PG 3.3 3.5 4.0
Pay for full-time employees at smaller distillers averaged $42,500 in 2019. By comparison, Missouri’s median earnings for full-time, year-round workers in 2018 was $43,200, based on the latest available data. About half (47%) of all distillers with employees in 2019 offered health insurance.
Insurance, Licenses, and Taxes
Distillers reported a wide range of insurance, license, and tax costs from 2017 to 2019; these costs varied by firm size and business stage. Given this diversity, this report communicates figures as a proportion of annual gross sales from 2017 to 2019 to better understand typical distiller costs. Two measures of central tendency were used: the median and the trimmed average.
Total insurance, license, and tax costs represented 9% to 16% of a distiller’s annual gross sales, depending on the measure (See Table 6). The federal excise tax (FET) was the highest expense for larger distillers, and smaller firms incurred higher costs for commercial insurance and sales taxes. The FET temporarily dropped from $13.50 per proof gallon to $2.70 for the first 100,000 proof gallons produced in 2018; this change improved taxing parity with wine and beer makers. The lower FET will end on Dec. 31, 2020. A higher tax rate will substantially impact smaller distilleries’ cost of doing business.
TABLE 6. INSURANCE, LICENSES, AND TAXES PER $100,000 IN GROSS SALES (2017-2019)
Insurance, Licenses, and Taxes
Annual Median Cost Per $100,000
in Gross Sales
Annual Trim. Avg Cost Per $100,000
in Gross Sales Commercial insurance $2,326 $5,311 State, local, or other license fees $1,558 $3,881 State and local sales taxes $3,276 $3,730 Local property taxes $513 $919 Federal excise taxes $1,607 $2,536 Total $9,280 $16,377
Adding Value to Agricultural Inputs
Distillers add value to Missouri’s economy by offering products made from Missouri ingredients and supporting other Missouri businesses. Smaller distillers have the highest input costs, as a percent of spirit

September 2020 University of Missouri Extension | Page 23
Missouri’s Distilling Industry: A 2019 Perspective
sales, as they source niche ingredients and operate at lower production levels. Of every $1 they earn in spirit sales, smaller distillers spend 40% on inputs. Larger distillers spend closer to 30% per $1 of spirit sales. Smaller distillers pay more for inputs such as corn and other grains. This premium can reflect non-GMO production, special varietals, and special services including delivery, grinding and bagging inputs off-site. Larger distillers can also negotiate lower costs based on volume. Use of corn, fruit, and wood barrels differ by the distillery and its spirit specialties. This survey did not collect inputs data by spirit specialization.
TABLE 7: COMPARING INPUTS BY DISTILLER PRODUCTION SIZE, 2019
Input Larger: More than
10,000 PG Smaller: Less
than 10,000 PG Corn 0.8% 8.4% Other Grain 0.8% 14.6% Fruits/Vegetables 0.0% 2.1% Sugar/Molasses 0.7% 5.0% Yeast/Yeast Nutrients 0.2% 2.0% Other Distilled Liquors 36.6% 2.8% Glass Containers 14.2% 17.4% Wood Barrels 1.4% 15.5% Packaging 24.3% 6.5% Distribution 2.8% 3.3% Marketing 17.1% 17.5% All Other Inputs 1.2% 5.0% Total Inputs 100% 100%
Many of these inputs are purchased from other Missouri businesses. Smaller distillers were more likely to purchase inputs from within the state; they made 57% of all purchases from Missouri farms or companies in 2019. Larger distillers purchased 21% of inputs from within the state. As a whole, larger distillers purchase substantially more, and their choice to buy goods and services from Missouri suppliers can support a significant number of jobs and amount of labor income in other industries.

Taking Farm and Forest to the Glass: The Economic Contribution of Missouri’s Distilling Industry
April 2021 University of Missouri Extension | Page 24
Economic Contribution of Missouri’s Distilling Industry The distiller survey was a key input in the effort to customize an input-output economic model in order to provide estimates of the economic contribution of the distilling industry. An economic model uses the typical inputs, outputs, and trade flows of an industry, along with consumer purchasing patterns, to describe larger spending flows in a region. Given the challenges in measuring Missouri’s distilling industry as described above, gathering first hand data from the state’s firms was essential to customize the model’s default data built from national averages. The basics of this model are described below, followed by our estimates of the industry using 2019 data.
Economic models track the flow of spending that moves around an economy through the primary relationships between businesses and consumers. Models consider the typical purchases made by companies to produce goods or services (intermediate spending), where those companies are, and how workers spend the income that is made on consumer products and services (induced spending). The models follow these spending patterns to understand the larger impacts that circulate within a region and what income leaks out due to imports.
The IMPLAN software, provided by the IMPLAN Group, LLC, is a common input/output model platform used to estimate the larger economic impact of a given business or industry. IMPLAN data is updated annually from three main sources: the U.S. Bureau of Labor Statistics, Bureau of Economic Analysis, and the Census Bureau. The IMPLAN model is often used by universities, consultants, and economic development agencies to analyze new business projects or the contribution of an existing industry to a region.
Regional Spending Effects Models are a conceptual framework of an economy that tracks the initial flows of spending that exist between companies, their suppliers, and how their workers spend money. Spending effects describe how the final sale of a business or industry product (direct effect) causes money to flow to regional supply chain and consumer firms (indirect effects).
• Direct Effects include the sales, wages, and jobs that come from selling a product or service for consumption. For distillers this includes the sales of spirits, retail goods, event services, etc., investments in building and equipment, and employment of full and part-time workers. The direct effects drive the other indirect effects in a region’s economy.
• Indirect Effects are the ripple impacts of spending in a region that occur when a business purchases goods and services for operation. The ripple effect has two parts:
o Intermediate Effects are impacts from the purchase of supplies needed to produce a final good or service. A distiller buys corn from a mill, which purchases grain from a farmer, who buys fertilizer from a wholesaler, and so on. At each step in the supply chain there are purchases made outside the region, state, or country for specialized inputs or price considerations. That spending leaks out of the region during each cycle of purchasing.
o Induced Effects capture the household spending of owners and workers, either from the distiller or the suppliers, when items such as groceries, clothing, etc. are purchased in the local economy. Just like suppliers, workers also spend some of their income outside the region for things like travel, online purchases, specialized goods, etc.

Taking Farm and Forest to the Glass: The Economic Contribution of Missouri’s Distilling Industry
April 2021 University of Missouri Extension | Page 25
• Total Effects combine the direct effect of jobs and income from a business or industry with the indirect effects of supplier and household spending within the region that support additional employment and wealth. A multiplier for each economic value, such as jobs or income, can be derived by dividing the Total Effect by the Direct Effect.
Exhibit 6 diagrams spending flows to further illustrate the regional spending ripple effect that input/output models describe:
EXHIBIT 6: ECONOMIC INPUT/OUTPUT MODEL OF SPENDING FLOWS – DISTILLER EXAMPLE
Source: MU Exceed, University of Missouri
The Economic Contribution of Missouri’s Distillers These flows and the dollars that they represent are summarized in the economic contribution report that appears in the next four pages, this piece was designed to be shared with policy makers and the general public. Refer to Appendix A for a more detailed explanation of the economic terms and methodology used to produce this economic contribution study. The survey used to collect information from distillers can be found in Appendix C.

The Economic Contribution of
Missouri’s
Distillers
Size Description
Proof Gallon (PG)
Sales
Business
Percent
Business
Count
Medium-Large 10,000 PG or More 10% 7
Small 1,000 to 9,999 PG 12 17%
Very Small Less than 1,000 PG 31 44%
Planning/Early Stage N/A 29% 20
Total 100% 70
50 Missouri Distillers
601 Distiller Jobs
Missouri Distillers have a long history, starting with Weston’s
Holladay Distillery, which was the first spirits maker west of the
Mississippi. Today, Missouri distillers are proudly producing award-
winning craft spirits. Missouri’s distillers range from small start-ups
developing their first batch over several years to larger firms exporting
spirits around the country. The industry is growing fast as new distillers
open at the same time as existing wineries and brewers expand
operations to include spirit production.
50 with 2019 sales; 20 additional distillers in planning/early development stage.
2019 Economic Contribution of the Missouri Distillery Industry
Jobs Labor Income Value Add Gross Sales
Direct Effects
Distilleries 601 $90,940,000 $249,997,000 $366,800,000
Indirect Effects
Supplier Inputs 405 $28,896,000 $45,438,000 $89,325,000
Household Spending 747 $35,310,000 $61,756,000 $110,592,000
Total Effects 1,753 $155,147,000 $357,191,000 $566,718,000
University of Missouri Extension | Page 26 April 2020
Where Can
Missouri Go?
Missouri Distillers by Size
Missouri distillers employed 601 people and had gross sales of $367
million in 2019. Indirect purchases generated by these sales supported
an additional 405 jobs in the state’s economy and nearly $90 million in
gross sales. Distillery and supplier workers spent $111 million for
household goods and services supporting an additional 747 jobs. In
total, the distillery industry contributed $567 million in gross sales to
Missouri’s economy. The total value-added contribution, or gross
domestic product, was over $357 million. Every 1 job in distilling
supports 1.9 jobs elsewhere in the Missouri economy.
Distilled spirits are gaining market share
as consumer preferences shift toward craft
spirits and cocktails. The Distilled Spirits
Council estimates that in 2019 spirits ac-
counted for 36% of the alcohol market by
volume, up from 31% in 2010. Missouri is
well positioned to benefit from this shift,
ranking 16th in the nation for the number
of craft distillers, according to the Ameri-
can Craft Spirits Association.
Nationally the number of craft distillers
grew by 15% from 2017 to 2018, while
Missouri outpaced that average with an
18% increase.
While many Missouri craft distillers are just
starting out, they have big goals for the
future. In an early 2020 survey, small Mis-
souri distillers had plans to double their
output by 2021.
Small Distillers Plan to Double Output by 2021
2019 2021

Exports outside Missouri...
89% of medium/large distillers and 15%
of small distillers sell outside the state.
As business size increases, out-of-
state travelers become a larger share
of total visits.
University of Missouri Extension | Page 27 April 2020
Global Leader in Oak Barrels
Missouri is home to some of the country’s largest wood barrel
makers. These companies use high-quality white oaks—
abundant in Missouri—and promote sustainable harvest.
Spirits Add Value to Corn
On average, Missouri’s craft bourbon distillers increase the value of corn eight-fold as it travels from the farm to the consumer.
The Missouri Distillers Advantage
Missouri Bourbon must use Missouri-grown corn, be distilled in the state, and be aged
in Missouri-made wood barrels. This definition gives consumers confidence that whiskey
carrying the “Missouri Bourbon” label is truly home grown.
Missouri
spirits win U.S. and
International Awards: • American Distilling Institute
• American Craft Spirits Association
• Berlin International Spirits
• San Francisco World Spirits
• Denver International
Spirits
Tourism to Missouri...
An estimated 336,000 travelers spent
over $9.4 million at Missouri
distillers in 2019. 52% of visitor
spending at medium/large distillers
and 26% of small distillers visitor
spending came from out-of-state.
Exports and Spirits Trail Bring Money to Missouri

Barriers to Growth
Federal Excise
Tax Increase
University of Missouri Extension | Page 28 April 2020
A craft distiller will spend an
estimated $300,000 in start-up
costs for machinery, equipment
and construction.
Current Taxes & License Fees in
Missouri Disadvantage Distillers
Distilleries pay higher taxes and annual license
fees than breweries or wineries. A distillery of any
size spends $1,350 per year on permits to
manufacture and sell spirits to wholesalers and
onsite consumers, compared to $200 for craft
breweries or $300 for a domestic winery.
Direct shipping ban limits growth...
Missouri distilleries are unable to sell spirits directly to
consumers online and ship out of state, unlike wineries.
Direct sales are an increasingly important way to reach
consumers. Distillers want to modernize
laws to sell online to keep pace with other
states (AZ, FL, HI, KY, NE, NH, VA).
Missouri Alcohol Excise Taxes per Gallon
Beer
$0.06
Wine
$0.42
Spirits
$2.00
High Start-Up Costs and Lengthy Time to Market Distillers take big risks starting a business, as it may be years before
their first sale, and it can take five to seven years to recoup their initial
investment and break even.* Surveyed Missouri distillers invested an
average of $300,000 in the machinery, equipment, and construction
while they applied for their licenses and permits.
In order to reduce time to market, many new distilleries release spirits
that do not need aging, blend spirits produced elsewhere, and use
smaller 15-gallon barrels to improve flavor profiles. These products help
fund the cost of aging spirits.
A pending federal excise tax (FET) increase from
$2.70 to $13.50 per Proof Gallon, would substantially
increase costs and financial strain
on start-up firms. Due to expire in
2020, the lower FET rate in 2018
sought to improve parity with wine
and beer makers.

Notes
• University of Missouri Extension surveyed Missouri distillers in February 2020, and received 22 responses. The survey responses, and 2019 liquor license and excise tax collections from the Missouri Department of Public Safety, Alcohol and Tobacco Control Division, informed estimates of the number and size of distillers.
• The economic contribution estimates for Missouri distillers were developed in IMPLAN, an economic input-output model, that was modified to fit state purchasing patterns based on survey responses.
• Economic analysis terms include:
• Jobs: annual average full- or part-time jobs. A person may hold more than one job and may be counted in other industries.
• Labor Income: wages, benefits, and sole proprietor income.
• Value Added: gross sales minus the cost of goods and services. It is equal to Gross Domestic Product (GDP) and
represents new money to the economy to pay wages, profits, rents, interest, and taxes.
• Gross Sales: total value of all sales, including both the input cost of making a good or service along with the money received when that product is sold for final use.
• The 8-fold average value added to a bushel of corn assumes a retail price of $35/750mL bottle of 80 proof straight bourbon whiskey. Further, 19 bottles of this aged spirit can be made from 1 bushel of ground yellow #2 corn sold to a distiller at a premium over market price average of $8.74/bushel.
• Surveyed distillers estimate that visitors spent an average of $28. The Missouri Division of Tourism’s visitor profiles estimates that 0.8 percent of travelers visited distillers, or roughly 336,000 out of 4.2 million visitors.
• * Minnick, Fred. "Want To Start A Distillery? Read This" Forbes. Accessed from https://www.forbes.com/sites/fredminnick/2018/10/26/want-to-start-a-distillery-read-this/#38d375455e46.
This research brief was made possible by a grant from the:
Missouri Department of Agriculture, Missouri Agricultural and Small Business Development Authority
Contributors to information in this brief include Missouri distillers responding to the anonymous survey & individuals from Missouri Craft Distillers Guild, VisitKC, Independent Stave, Missouri Corn Growers Association, the Missouri Forest
Products Association, and the University of Missouri.
University of Missouri Extension | Page 29 April 2020
Exceed | Division of Applied Social Sciences | College of Agriculture, Food and Natural Resources
University of Missouri Extension
Missouri Craft Distillers Guild—a nonprofit organization of over 30
distillers—educates and advocates for the Missouri distilling industry.
Formed in 2018, the Guild also provides legislative support and marketing
opportunities to its members. The Guild sponsored the “Missouri Bourbon”
bill that established a unique category designation for this MO-made spirit.
The Guild also launched the Missouri Spirits Expedition to highlight craft
distillery tasting rooms and promote tourism opportunities across the state.
Missouri
distillers also
produce a wide
range of other
award-
winning spirits
such as:
Whiskey
Brandy
Vodka
Rum
Gin

Taking Farm and Forest to the Glass: The Economic Contribution of Missouri’s Distilling Industry
April 2021 University of Missouri Extension | Page 30
Missouri’s Distiller Value-Chain Missouri’s distilling industry has experienced rapid growth as has the national distilling industry. Distillers in the state buy local agricultural products and many produce a Missouri Grown, value-added product. Consumer preferences will be key to maintaining the growth of the broader spirits industry. However, recently passed national legislative which extended lower Federal Excise Tax (FET) rates reduced policy uncertainties and may benefit small firms. Missouri has several industries with buyer-supplier linkages that may also be poised to grow with the distilling industry. Within the state, efforts to allow direct-to-consumer shipping, and broader value chain dynamics, may impact the trajectory of the industry.
Why Study Value Chains? Examining an industry within its existing buyer-supplier business relationships provides a deeper understanding of that industry and its development potential. First, by identifying primary buyers and suppliers and categorizing the relationships between these industries, a firm can gain a new understanding of its market power and can begin to identify larger possible threats or opportunities to growth. This type of analysis can also be called a supply chain analysis. Economic developers and policy makers may also use this information to understand how to support growth in a core industry or how investments in one industry leverage broader growth through other parts of the economy. This analysis can help people understand where growth may likely occur, within the region or outside the region, as a core industry grows.
After gaining an understanding of buyer and supplier relationships, a core industry could also choose to focus on developing stronger relationships with key buyers or suppliers. This effort could take minimal effort or lead to much larger regional and national coordination.
With capacity and focus, the coordination efforts with potential or existing buyer-supplier relationships can maximize value for the businesses. Here value can go beyond competing on cost and be a deliberate path to profit. Businesses can be intentional about the type of values they grow and leverage with their business partners. These values often reflect the values consumers prefer in the market. Examples of value laden products include indicators of how a product was made and packaged (sustainable production, fair trade, organic) or where a specific product was made (locally or a specific geographical origin). A business may be more interested in collaborating with partners or at least learning more about a partner’s values when they see a market opportunity to increase their profits. Other businesses have embedded values in their company that drive their decisions; in these cases, the company’s value proposition to the consumer is dependent on the types of companies it chooses as business partners.
COVID-19 illustrates another need to understand an industry’s supply chains (those that are seeking to maximize value between partners or not). COVID-19 has disrupted workforces around the world creating scarcity, raising prices, and lengthening delivery times. Businesses benefit when they understand their broader supply chains and have multiple supplier relationships, can afford to carry the costs of holding surplus inputs, and use process or product innovations to reduce inputs and or minimize their reliance on riskier suppliers.29 Smaller and start-up businesses may have the least ability to adapt to supply chain disruptions as they tend to place smaller orders and have less cash on hand.
29 Shih, Willy C. (2020). Global Supply Chains in a Post-Pandemic World. Harvard Business Review Magazine Sept-Oct 2020. Retrieved from https://hbr.org/2020/09/global-supply-chains-in-a-post-pandemic-world

Taking Farm and Forest to the Glass: The Economic Contribution of Missouri’s Distilling Industry
April 2021 University of Missouri Extension | Page 31
This report provides an understanding of the broader industry-to-industry linkages focusing on the distilling industry and relies on multiple sources of data as described below. Missouri has a significant industry presence among several industries which also buy and sell to and from distillers. It was beyond the scope of this project due to COVID-19 travel and gathering constraints in 2020 to begin to surface some of the shared values among Missouri distillers as well as their common constraints and possible opportunities. Surfacing this information could help the Missouri Craft Distiller Guild target its own internal efforts to support industry growth.
Measuring Value Chains to Identify Industry Linkages Measuring an industry to determine its value chain in some ways extends the analysis that was done during the economic contribution study. The economic contribution study measured the total sales, taxes, wages, and jobs that the distilling industry supports through its backward linkages, purchases distillers make with input suppliers. These effects are measured and reported as indirect effects. The economic impact model by design does not capture forward linkages, the economic activity that occurs when distillers sell spirits to distributors, wholesaler, or retailers. A value chain analysis examines related industries for both input suppliers and purchasers of the distilling industry. It does not however quantify the strength of these relationships in total sales, jobs, wages, or taxes.
The following analysis uses a few different methods to surface industry linkages. One source is the set of national buying and selling patterns between all U.S. industries.30 This information was used to develop a value chain map which provides a visualization of forward and backward business linkages to the distiller industry.
This information is then paired with EMSI data about industries within Missouri to reveal relative specialization.31 Specialization is measured with a location quotient which compares the percentage of jobs in a targeted industry within Missouri to the percentage of jobs in the same industry nationally. The larger a location quotient the higher the share of industry jobs in Missouri compared to the U.S. Large specializations can occur in industries with small total employment.
Nationally, wage and salary jobs in the distillery industry are heavily concentrated in Kentucky; which has the largest number of jobs (over 5,300). Exhibit 7 below provides wage and salary employment for the state with the largest concentrations of distilling jobs. Missouri ranked ninth among peers, with a location quotient of 1.3 indicating the state has a slightly higher share of jobs in the distilling industry. Wage and salary employment have grown significantly among several of these leading states, and 59 percent in Missouri from 2015 to early 2020.
30 The model was developed by Dr. Edward Feser while a professor of urban and regional planning at the University of Illinois Urbana-Champaign. It is based upon the U.S. Census Bureau’s Economic Census and Benchmark Input-Output data developed by the U.S. Bureau of Economic Analysis. Access and analysis of data facilitated by Dr. Mark White, University of Missouri. 31 EMSI Developer (2020). Retrieved from https://www.economicmodeling.com/

Taking Farm and Forest to the Glass: The Economic Contribution of Missouri’s Distilling Industry
April 2021 University of Missouri Extension | Page 32
EXHIBIT 7: U.S. STATES SPECIALIZED IN THE DISTILLERY INDUSTRY
State
2020 Payroll
Business Locations
2015 Jobs
2020 Jobs
2015-20 Change
2015-20 % Change
2020 Location Quotient
Kentucky 60 4,144 5,309 1,165 28% 22.1 Tennessee 45 1,076 1,788 712 66% 4.7 Vermont 14 58 168 110 190% 4.2 Maine 14 110 262 152 138% 3.3 Montana 19 106 183 77 73% 2.9 Colorado 69 260 714 454 175% 2.0 Indiana 17 234 635 401 171% 1.7 Arkansas 3 191 221 30 16% 1.4 Missouri 15 282 447 165 59% 1.3 Oregon 34 192 303 111 58% 1.2 Minnesota 22 309 434 125 40% 1.2
Data Source: EMSI, 2015 – 20 wage and salary employment by industry. Retrieved from https://www.economicmodeling.com/
The aggregate level industry data of buyer and supplier relationships in the value chain diagram was then personalized by a group of Missouri distillers who took the time to compile a list of their buyers and suppliers within Missouri. This list is not complete but it identifies specific companies within industries. This information was used to develop a statewide map presented in the value chain brief below.
Missouri’s Distilling Industry Value Chain Map The distillery industry is the core industry for analysis in the value chain map (see Exhibit 8). The list of industries on the left represent suppliers to distillers (backward linkages), while the list of industries on the right represent sales channels used by the distiller industry (forward linkages). This diagram does not contain all industry-to-industry relationships but focuses on those that are the largest and most direct.
The boxes below provide information on the relative growth rates of each linked industry compared to the U.S. average. Green arrows indicate industries which have added a larger percentage of jobs from 2015 to 2020 than the U.S. average. These fast-growing industries, based on wage and salary employment, include plastic bottle manufacturing, bars and grocery stores. Red arrows are shown for industries that have lost a higher percentage of wage and salary jobs within the state than the U.S. average. A full description of industry growth is shown in Exhibit 8.
The value chain diagram is not an exhaustive depiction of industry-to-industry transactions, but it is meant to identify industries with the largest sized interactions and to understand the relative health and growth of these interconnected businesses within the state of Missouri. The distilling industry’s forward linkages reflect the paths taken to reach final consumers by distillers in the state. Distillers largely produce a finished value-added product, and they are able to retain high profits when they can reach a customer directly. Most but not all of the forward linkages reflect distribution channels for spirits. As noted earlier in this report, many distillers will sell spirits to other alcoholic beverage companies who blend product under their label. Distillers also will sell used barrels to other alcohol producers and spent grains to pet food manufacturers.

Taking Farm and Forest to the Glass: The Economic Contribution of Missouri’s Distilling Industry
April 2021 University of Missouri Extension | Page 33
EXHIBIT 8: VALUE CHAIN MAP OF DISTILLING INDUSTRY LINKAGES
Data Source: EMSI, 2015 – 20 wage and salary employment by industry. Retrieved from https://www.economicmodeling.com/
Supplier Relationships The Missouri distilling industry sources inputs from several industries. Some of the largest and most directly procured inputs include glass containers, plastic containers, wood barrels, and grains. Key industries in the distilleries value chain are located within the state of Missouri. Supply chains within the U.S. and across the world have been, and continue to be, heavily impacted by COVID-19 disruptions. With many related industries co-located in Missouri, the state’s craft distilleries have greater opportunity to navigate these challenges and minimize the impact to their small businesses and thereby keeping their dollars inside the state. Distillers in the state may benefit from geographically proximate suppliers by incurring lower transportation costs and developing stronger or more diversified business relationships with suppliers. Having direct access to suppliers can result in better customer service during periods of supply chain disruption. One-on-one interviews and web research of supplier companies in Missouri provides short vignettes of some of these industries in the state below.
Missouri is home to stave and cooperage companies that source Missouri white oak to produce barrels that support the international spirits, wine and beer industries. These businesses include large, world-recognized barrel companies like Independent Stave and McGinnis Wood Products as well as a number of smaller companies including Barrel 53, Tracey Cooperage and The Oak Cooperage. The state also contains additional stave companies which sell to cooperages.

Taking Farm and Forest to the Glass: The Economic Contribution of Missouri’s Distilling Industry
April 2021 University of Missouri Extension | Page 34
Independent Stave was founded in 1912 as a stave producer and expanded into barrel production in 1950. The business has expanded operations to include facilities in other states and countries in order to source high quality white oak and meet worldwide demand.32
The McGinnis Wood Products Company began as a stave mill in 1968 and entered barrel production in 1987 in response to growing demand for barrels. The company has grown relationships with producers across the globe including Scotland, Europe, South America and Japan.33 The white oak’s inner red wood is the preferred wood for barrels, while the bark, dust, and sapwood byproducts become charcoal, mulch and paper. The growth in craft spirits has created new market opportunities for smaller 15-gallon barrels that allow producers to experiment with new recipes and age the results faster as they refine their process.
Grains form the basis for most spirits, and represent an important input of flavor profiles. In Missouri distillers source a variety of grains including corn, wheat, rye, barley and more. Some producers use no grains but rely on fruit and vegetables. Some smaller distillers work directly with growers to procure grains or other inputs that meet their specifications and offer a premium over other commodity markets. At least one distiller in the state has started growing corn and is focusing on selective breeding of heirloom blue, red and white corn varieties. For example, Wood Hat Spirits features these unique grains in their range of whiskeys. Its Montgomery County Bourbon sources all of the agricultural inputs from within its county’s boundaries as it brings Missouri Grown products to market.34
Similar to brewers, distillers also use malt, yeast enzymes and sugars in the fermentation process. A single malt whiskey could come from a corn-based sour mash or a malted cereal grain. Suppliers include large companies such as the international firm AB Mauri headquartered St. Louis, as well as smaller companies such as Bono Burns, a family-owned company also based in St. Louis. Another example, Gateway Custom Malt in Montgomery City, Missouri was started by its founder to re-establish a malting company within the state. Prior to Prohibition, the state had several malting companies in business. Gateway Custom works with local growers to source grains and partners with breweries and some distilleries who are searching for unique flavors and prioritize locally sourced products.35
Affordable Distilling Equipment started in 2012 in Doniphan, Missouri and has grown to become a national brand. The business quickly scaled up in the first three years through careful reinvestment and by honing a unique position within the market – offering smaller stills with quality design and fabrication while controlling costs to reach smaller to medium-sized distilleries. Today the company estimates that it has equipment in 20 percent of the U.S. distilleries and also exports.36
Missouri is specialized in both glass container and plastic bottle manufacturing, employing more than twice the share of workers in these industries as the national average. Craft distillers in the state have sourced bottles from a range of producers including Piramal Glass, an international company which is specialized in specialty bottle production for liquor, beauty, pharmaceuticals and food items. The company has a production facility located in Park Hills, Missouri.37 TricorBraun, headquartered in St. Louis has now 32 Independent Stave company website https://www.independentstavecompany.com 33 Personal communication with Don McGinnis on October 26, 2020. 34 Personal communication with Gary Hinegardner on March 12. 2020. 35 Personal communication with Mike Adams on October 13, 2020. 36 Personal communication with Affordable Distilling Equipment owner Paul Hall on October 13, 2020. 37 Piramal Glass website https://www.piramalglass.com/

Taking Farm and Forest to the Glass: The Economic Contribution of Missouri’s Distilling Industry
April 2021 University of Missouri Extension | Page 35
expanded to over 40 locations worldwide and also works with distillers in the state. The company provides a range of rigid containers and offers a range of design and engineering services.38
Specialization by related industries Used together, total employment, change in employment and a measure of specialization, location quotients, can provide a quick overview of how well an industry is performing in the state relative to a benchmark. Exhibit 9 provides these measures for the Missouri distilling industry and its key input suppliers and buyers. Job measures show change over the 2015-20 five-year time period. A location quotient compares the concentration of jobs in an industry to the national average. The larger the number, the more specialized Missouri is in that industry. Larger location quotients are often a rough indication that a particular industry is likely exporting outside of the state and serving larger markets. Balancing specialization with the size of the industry (total employment) and industry decline or growth can provide insights into economic opportunities within a value chain.
As noted, Missouri has a higher concentration of wage and salary jobs in the distilling industry than the national average. In addition, this industry has grown 64 percent in the U.S. and 59 percent in Missouri between the 2015 and 2020. The overall industry is still small in Missouri, numbering 447 wage and salary jobs, but this is expected to increase as more distilleries mature by exiting the start-up phase and expanding into larger markets.
Missouri also has a higher concentration of jobs in several industries that buy from or sell to distillers. Among input suppliers, the state is specialized in both glass bottle manufacturing and plastic bottle manufacturing, as well as wood container and pallet manufacturing which includes the production of wooden barrels. Each of these industries has a location quotient of between 2.3 and 2.5 indicating the employment in these industries is 2.3 to 2.5 times more concentrated in Missouri than the nation. Among these specialized input suppliers, two industries are growing, plastic bottle manufacturing and wood container and pallet manufacturing.
Missouri is a crop exporter but total wage and salary employment in the industry is similar to U.S. averages, producing a location quotient of 1.0. This is a large industry with over 15,000 wage and salary jobs within the state, but the industry has seen similar job losses in MO and the U.S. over the previous five years.
Distillers are using many different distribution channels to reach consumers, Missouri has a similar share of jobs in restaurants, wine and distilled alcoholic beverage wholesalers, and bars as the U.S. average. The state has lower share of total employment in wineries than the U.S. average and a far lower share of jobs in convenience stores, which might reflect difference in how businesses are classified across states. Distillers send some spent grain byproducts to dog, cat, and other animal food manufacturers which use these as protein rich products as inputs. Missouri is specialized in these two industries – and both are growing.
38 TricorBraun website https://www.tricorbraun.com/

Taking Farm and Forest to the Glass: The Economic Contribution of Missouri’s Distilling Industry
April 2021 University of Missouri Extension | Page 36
EXHIBIT 9: DISTILLING VALUE CHAIN INDUSTRY EMPLOYMENT AND GROWTH
NAICS Industry U.S. 2020
Jobs
2015 - 2020 % Change
U.S. MO
2020 Jobs
2015 - 2020 % Change
MO
2020 Location Quotient
MO 327213 Glass Container Manufacturing 12,938 (11%) 609 (3%) 2.5 326160 Plastics Bottle Manufacturing 34,222 12% 1,467 20% 2.3 321920 Wood Container and Pallet
Manufacturing 66,813 6% 2,843 3% 2.2
111000 Crop Production 805,462 (4%) 15,174 (3%) 1.0 312140 Distilleries 18,662 64% 447 59% 1.3 311111 Dog and Cat Food Manufacturing 29,055 23% 3,548 17% 6.4 311119 Other Animal Food Manufacturing 35,997 8% 1,599 21% 2.3 722511 Full-Service Restaurants 5,482,069 5% 103,156 3% 1.0 424820 Wine and Distilled Alcoholic Beverage
Wholesalers 92,097 11% 1,646 (2%) 0.9
722410 Drinking Places (Alcoholic Beverages) 411,813 8% 6,843 15% 0.9 445110 Supermarkets and Grocery Stores 2,545,539 (0%) 40,549 (7%) 0.8 445310 Beer, Wine, and Liquor Stores 170,090 6% 2,225 7% 0.7 312130 Wineries 73,396 26% 903 9% 0.7 445120 Convenience Stores 163,428 (1%) 1,289 (16%) 0.4
Data Source: EMSI Developer (2020). Retrieved from https://www.economicmodeling.com/
The value chain analysis data was synthesized into the following brief which also contains a statewide map of all known distillery locations, see names and counties in Appendix B, and a partial listing of known supplier locations.

Value chains trace the businesses and processes that bring raw inputs to final users. Missouri distillers add value to Missouri grown agricultural products and the industry is part of a broader value chain that buys from other large industries in the state. This brief explores the business linkages within the state as the industry expands.
Missouri has a competitive advantage nationally• The state is ranked 9th among states in terms of the total share of jobs in
distilling. • Total wage and salary jobs in the industry have grown 59% in the past 5
years, as of the first quarter of 2020.
Missouri’s distillers are seeking to more strategically partner with businesses in order to support value-added agriculture and enhance tourism as they compete in the growing market for craft spirits.
On Site Sales
Distributors
Missouri SpiritsWhiskey
BrandyVodka
RumGin
Other Ingredients
Grains & Fruit
Wood barrels
Equipment
Label & Packaging
Marketing
Distilling Inputs
Support System& Partners
Distilling AssociationsState and Federal Agencies
Research, Education, & Training Marketing & AdvertisingBanks & Financing
Agricultural Associations
Reaching Customers
MissouriConsumers
Non-Missouri
Consumers
Missouri Distillers
Distributors & Supply Companies
Stores
Restaurants
University of Missouri Extension | Page 37November 2020
The Value Chain Connections of
Missouri’s Distillers

Timber stands
GrainsCorn WheatBarley Other
Fruit & produce
Malt, yeast, enzymes
Missouri’s Distilling Value Chain Inputs
Wood barrels
Support System & Partners
Agricultural Associations Research, Education, & Training Banks & Financing
Missouri is specialized in stave and cooperage companies. This growing industry employs twice as many people as a share of all jobs than the US average. These firms source Missouri timber to produce barrels that support the international spirits, wine and beer industries.
Missouri’s white oak cover 1.9 million acres, 26.8 million cubic feet were harvested in 2017.
Malt, yeast and enzymesLarge and small firms support the fermentation process. Craft spirits creates new markets for specialty varietals and local production, the focus for Gateway Custom Malt.
Missouri Distillers
Craft distillers pay a premium for agricultural products; and are creating markets for organic production and other specialties.
Still manufacturersOther machinery &
equipment Glass and plastic bottles
Labels & packaging
Other alcohol & spirits
Marketing
Affordable Distilling Equipment, in Missouri, has become a national brand in <10 years. Owner Paul Hall was motivated to open his business by the rapid growth in the craft spirits industry and now has equipment in 20% of US distilleries.
Missouri has a higher share of jobs in both glass and plastic bottle manufacturing.
Growth in the MO plastic bottle industry has outpaced the US for the past 5 years.
Several Missouri based companies have grown with the expansion of the craft spirits industry. Smaller distillers made 57% of all purchases from Missouri farms or companies in 2019. Larger distillers purchased 21% of inputs from within the state. As a whole, larger distillers purchase substantially more, and their choice to buy goods and services from Missouri suppliers can support a significant number of jobs and labor income in other industries.
University of Missouri Extension | Page 38November 2020

Missouri’s Distilling Value Chain – Reaching Customers
On Site Sales
DistributorsMissouri Distillers
Tasting Rooms
Missouri SpiritsFoodMerchandiseEvent Planning
Non-Missouri
Consumers
Venues
U.S. & Foreign Sales
Grocery &Liquor Stores
MissouriConsumers
Top Sources of All Tourism to Missouri
Missouri Grown
Support System & Partners
Missouri Craft Distillers GuildMissouri Department of ATC & Federal TTB
of small distillers’sales occurred on-site
in 2019. Distillers rely on creating customer experiences to build their brand.
42%
University of Missouri Extension | Page 39November 2020
Restaurants & Bars
875,700
336,000
Wineries Spirits
Total Missouri Tourists in 2019
Craft spirits are growing increasingly popular among consumers. In Missouri, distillers aim to match the growth and success of the state’s wine industry.
Tourism Orgs. (MO Div. of Tourism, VisitKC, ExploreSTL, etc.)
TourismRegulatory

Missouri’s Distilleries and Business Partners Support Jobs Across the State
This research brief was made possible by a grant from the:Missouri Department of Agriculture, Missouri Agricultural and Small Business Development Authority
The value chain linkages in this report were derived from secondary data of industry to industry purchase patterns as well asa list of business names provided by some of the state’s distillers.
Information is drawn from Missouri distillers who responded to a early 2020 survey and or provided business partner lists, interviews with Missouri based companies, the US Forest Service Forests of Missouri, 2019 & 2017, the Missouri Division of
Tourism, and from the Missouri Wine and Grape Board. Economic Modeling Specialists, Intl, 2020 wage and salary job estimates were used to calculate location quotients which
compare the concentration of jobs in an industry to the national average and growth from Q1 2015 to Q1 2020. Wood container and pallet manufacturing, glass container and plastic bottle manufacturing all have more than twice as many jobs
as a share of total employment than the US average.
University of Missouri Extension | Page 40November 2020
Exceed | Division of Applied Social Sciences | College of Agriculture, Food and Natural ResourcesUniversity of Missouri Extension

Taking Farm and Forest to the Glass: The Economic Contribution of Missouri’s Distilling Industry
April 2021 University of Missouri Extension | Page 41
Growth Opportunities and Challenges for the Missouri Distilling Industry Missouri’s distilling industry’s future growth will likely be dependent on trends in consumer alcoholic preferences, disposable income, and the recovery of the state’s hospitality and tourism industries. The recent permanent reduction in FET provides policy and cost stability which will allow distillers to plan strategically for the long term. Further regulatory changes, and specifically expansion of direct-to-consumer shipping to include spirits will expand distiller’s access to markets with a higher profit margin. Adequate management of the state’s white oak stands is essential to the long-term viability of the stave and cooperage, winery and distillery industries.
COVID-19 disruptions COVID-19 caused considerable disruptions to the state’s distilleries, most consequentially by reducing or eliminating access to customers as on-site visits and significant declines to restaurant purchases. For small firms trying to build their brand these restrictions have been severe, and can be overlooked in news of increased alcohol purchases. While alcohol purchases have increased during the pandemic and resulting recession, consumers are more cost conscious and are likely to support companies they already trust and know – and these tend to be national brand products. The craft distillery industry segment’s future growth may be dependent on disposable income and consumer’s recreation choices as pandemic travel and gathering restrictions subside.
Distillers use a range of equipment in their production process; some but not all equipment could be modified to produce liquid hand sanitizer. Twelve distillers across Missouri pivoted their production process to liquid hand sanitizer in response to overwhelming demand by emergency services. Missouri distillers, like their national colleagues, donated products or sold products at cost.
Consumer preferences and recovery of the hospitality and tourism industries Consumer awareness and preferences have shaped the growth of alcoholic industries. Craft spirits have grown increasingly popular perhaps following the earlier trajectories of wine and craft beer consumption. Some existing Missouri wineries and breweries have added spirits as a way to expand their customer reach. The recent growth of the hard seltzer industry poses both competition and opportunities for spirit producers.39
Missouri has a large number of known craft distillers in the start-up phase, the success and growth of these businesses may be partially driven by their ability to access customers, build their brand, and refine their products. On-site sales and tourism are important for this industry and with the creation of the Missouri Spirits Expedition, the distilling industry is poised to grow with the broader hospitality and tourism industry in the state and overall economic conditions. The success of this nascent coordinated tourism campaign will require adequate resources and support of distillers and tourism partners.
In response to COVID-19 indoor dining restrictions, over 30 U.S. states, including Missouri, have allowed bars and restaurants to sell takeout or delivery cocktails and mixed alcoholic beverages. Most of these laws have allowed the temporary practice. Missouri’s allowance expired on March 31, 2021. Iowa’s legislature
39 IWSR Drinks Market Analysis. (2020). Hard Seltzers Drive a Resilient US Beverage Alcohol Market in 2020, According to New IWSR Forecasts. November 2020. Retrieved from https://www.theiwsr.com/wp-content/uploads/IWSR-Hard-Seltzers-Drive-a-Resilient-US-Beverage-Alcohol-Market-in-2020.pdf

Taking Farm and Forest to the Glass: The Economic Contribution of Missouri’s Distilling Industry
April 2021 University of Missouri Extension | Page 42
became the first in June followed by Ohio in October to allow this practice permanently.40 Takeout experiences do not create the same brand experience and relationship building that many craft distillers depend on as they seek customers. As COVID-19 restrictions relax, distillers who are able to more safely and quickly recapture on-site tasting and sales will be able to again build their customer bases. The reopening of bars and restaurants will also revitalize another market channel for some distillers.
Tiered regulations among alcoholic beverages As the distillery industry has grown nationally, distillers have led efforts in multiple states to update regulations established after Prohibition. Many states, including Missouri, maintains different regulations for beer, wine, and spirits. Among these, spirits face the strictest restrictions. After successfully advocating for Federal Excise Tax parity at the end of 2020, industry efforts at both the state and national level are now focused on increasing parity among regulations with an emphasis on direct-to-consumer shipping.
Adequate white oak supply A longer-term threat is the health and volume of white oaks in Missouri and beyond. This is an issue which also has the potential to disrupt the state’s stave and cooperage industries and wineries. White oak is used for a range of products, including high value uses such as hardwood lumber and barrels, along with the wood and sawdust remnant from these processes that are used for paper, mulch and charcoal production. In the U.S. the growing region for white oaks extends across the state and covers most of the eastern U.S.
White oak is estimated to be the second most numerous tree in the state, behind eastern red cedar, and offers the most above-ground biomass of any major species. White oak mortality rates have been outpacing removal rates which strands potential value in the forest. In 2017, mortality rates were estimated to be 39.2 million cubic feet compared to a harvest level of 28.6 million cubic feet. Mortality rates vary across the state and are higher in the Ozark region. From 2012 to 2017, average white oak removal declined 17 percent.41
Adequate timber management is a critical to white oak health and regeneration as seedlings cannot thrive under heavy shaded canopies. Within the state, nearly 82 percent of all forest land is under private ownership.42 Small parcel size and landowner awareness can complicate efficient forest management and timber removal. The White Oak Initiative is a group of organizations working to raise awareness now and change behaviors to avoid a shortage of mature white oaks in fifty years.43 Forest management and coordination is a resource intensive process which can require 70-100 years to harvest the results of improved management and new plantings.
Resources and the Path Ahead As demand for craft spirits grows, distillers in the state seek to expand and grow their businesses and contribution to the economy. An example of possible growth, is for distilleries to emulate the progress of the
40 Akin, Katie. (2020). Slushies? Flasks? Bars look to creative ideas after to-go cocktail bill passes. Des Moines Register. June 18, 2020. Retrieved from https://www.desmoinesregister.com/story/entertainment/dining/2020/06/18/to-go-alcohol-drinks-in-iowa-legislation-bellhop-hello-marjorie/3206452001/ 41 Goff, Thomas C. (2018) Forests of Missouri, 2017. Resource Update FS-146. Newtown Square, PA: U.S. Department of Agriculture, Forest Service, Northern Research Station. 4 p. Available at https://doi.org/10.2737/FS-RU-146 42 USDA Forest Service. (2020). Forests of Missouri, 2019. Resource Update FS-229. Madison, WI: U.S. Department of Agriculture, Forest Service. 2p. Available at https://doi.org/10.2737/FS-RU-229 43 White Oak Initiative, The Challenge, Available at https://www.whiteoakinitiative.org/the-challenge

Taking Farm and Forest to the Glass: The Economic Contribution of Missouri’s Distilling Industry
April 2021 University of Missouri Extension | Page 43
state’s wine industry. The Missouri Wine and Grape board estimates that wines contributed a total of $3.2 billion in economic activity, supported 28,000 jobs and brought in $247 million in tourist expenditures in 2018.44 Notably, the state’s wine industry has benefited from state support and strong organization among wineries. Missouri has supported the re-expansion of the wine industry in several ways such as amending legislation to allow DTC shipping, passing an excise tax that was reinvested in growing the industry while still maintaining a lower tax rate, and lower license fees.
In 1984, a tax was passed on every gallon of wine sold within the state. The tax rate was successfully doubled in 2000, with strong support from the state’s wineries, and is now levied at $0.12 per gallon. These funds support research and marketing for the industry and have helped to build a stronger awareness of wines within the Midwest. The Missouri Grape and Wine board is appointed by the Governor and approved by the Senate to spend these funds, and the office resides within the Missouri Department of Agriculture.
The wine industry’s strong growth in the state started in 2000, growing from 31 to 50 wineries in 5 years - the industry has 129 wineries today.45This growth was propelled by an earlier shift in consumer preferences to wine. Missouri wineries have also benefited from the ability to sell directly to consumers. New and expanding wineries also benefit from overall lower taxes and license fees, compared to those assessed for distilleries, as described earlier.
Wineries, like craft distilleries, rely on creating meaningful connections with consumers in order to expand awareness and build a brand. The state’s wineries have also expanded with the growth in the broader agritourism and tourism industries by adding restaurants and wedding venues. Some have now entered spirits production as a way to again capture changing customer preferences.
Comparatively, the distilling industry has fewer resources and a younger industry association. The Missouri Craft Distillers Guild is still in a formative stage as an organization but has shown early benefits of collaboration through the passage of the Missouri Bourbon bill and the creation of the Missouri Spirits Expedition. Increasingly, the Guild is representing its 30+ members in coordinated national efforts to improve conditions for the craft distilling industry. While considered relatively new at the state and national level, the Guild is organized to advocate on behalf of its growing membership. In addition, the Guild coordinates educational opportunities with its members to encourage improvement and innovation. Additionally, the Guild offers Industry Allies memberships to foster strong relationships and the sharing of opportunities and new ideas. These memberships have grown over time as the Guild expands its activities. This is particularly relevant in a landscape heavily impacted by the COVID-19 pandemic. Lastly, the Guild also offers Enthusiast memberships to the general public as a means to capture the avid spirits sector that follows, supports, and promotes craft spirits. Both memberships are relatively untapped and represent opportunity for the state’s craft distilleries to expand their reach and develop a budget for paid leadership, marketing and educational events, and research. Beyond Missouri, state guilds across the nation are finding their footing and their collective voices under the advocacy efforts of the American Craft Distillers Association (ACSA). ACSA’s national platform is
44 Missouri Wine Industry Economic Impact, 2018. Missouri Wines. Retrieved from https://missouriwine.org/missouri-wine-industry-economic-impact 45 Missouri Wine and Grape Board economic impact analysis and personal communication with Executive Director Jim Anderson on October 29, 2020.

Taking Farm and Forest to the Glass: The Economic Contribution of Missouri’s Distilling Industry
April 2021 University of Missouri Extension | Page 44
challenging longstanding regulatory barriers for the spirits industry, including direct-to-consumer (DTC) shipping, tariffs, ready-to-drink/to-go cocktails, and most notably and successfully, the passage of the Craft Beverage Modernization and Tax Reform Act (CBMTA) that made the Federal Excise Tax (FET) reduction permanent. National successes will continue to offer templates of effective actions for state guilds to follow.
Conclusion This research was funded to provide greater awareness of the Missouri distilling industry’s contribution and connection to the broader economy; to understand and support efforts to increase its impact and benefit to other industries and workers; and to serve as a baseline to measure this industry in years to come. The study outlines the challenges as well as potential opportunities for the industry, using data from within the state and from the more mature distilling industries found in other states.
Rapid Growth and Expanding Impact A survey of craft distillers in February 2020 revealed plans to double the previous year’s output by the end of 2021. Missouri’s distillers are experiencing rapid growth, as evidenced by 50 businesses with sales in 2019 and an additional 20 businesses in the planning, start-up stage. Nationally, the number of craft distillers grew 43 percent from 2017 to 2020. Missouri outpaced that average with an 87 percent increase during the same time period. Furthermore, Missouri is specialized in this industry with the ninth highest share of total distillery employment among all states.
Missouri distillers employed 601 people and generated gross sales of $367 million in 2019. Indirect purchases generated by these sales supported an additional 405 jobs in the state’s economy and nearly $90 million in gross sales. Distillery and supplier workers spent $111 million for household goods and services supporting an additional 747 jobs. In total, the distillery industry contributed $0.56 billion in gross sales to Missouri’s economy. The total value-added contribution, or gross domestic product, was over $357 million. Every 1 job in distilling supports 1.9 jobs elsewhere in the Missouri economy.
Despite the deep disruption caused by COVID-19 across all industries, the state’s craft distillers are emerging ready to meet changing and increasing consumer demand. As the broader restaurant and tourism industry recovers, craft distillers are beginning to reconnect with consumers and expand their production.
Connected Partnerships The state’s distillers are part of a broader value chain with industries that range from agricultural and other natural resources to hospitality and tourism. Distillers in Missouri have numerous local and regional sources for barrels, grain and other agricultural inputs, bottles, as well as an in-state distilling equipment manufacturer. Being co-located with these key suppliers can provide transportation savings and lower the transaction costs of working with these suppliers to customize a product to meet their needs. In addition, craft spirit production adds value to Missouri’s agricultural products and can open up more markets for specialty crop production.
The Missouri Spirits Expedition spotlights Missouri’s craft distilleries and encourages in- and out-of-state tourism, meeting increasing consumer demand for handcrafted spirits and authentic experiences. Together, these partnerships, collaborations, and connections attract dollars from within and outside the state and are driving opportunities not only for craft distillers but for related industries within Missouri as well.

Taking Farm and Forest to the Glass: The Economic Contribution of Missouri’s Distilling Industry
April 2021 University of Missouri Extension | Page 45
Regulatory Reform On the national front, craft distilleries and their industry allies have successfully advocated for a number of legislative updates, most notably with the passage of a permanently lower Federal Excise Tax (FET). Within the state, the Missouri Craft Distillers Guild championed the passage of the Missouri Bourbon bill and created the Missouri Spirits Expedition, two important first steps to creating a distinctive identity and branding to elevate the value of Missouri distilled spirits.
However, the state’s regulatory environment for distilled spirits, in comparison to wine and beer, creates inequities that impact distiller revenue and market share. The lack of direct-to-consumer (DTC) shipping authorization currently prohibits Missouri’s distilleries from selling and shipping directly to consumers, thereby limiting distilleries’ ability to retain a higher profit margin per bottle and restricting consumer choice. Higher state and local license fees are another example of differing regulation that impacts craft distilleries far more than wineries and breweries within the state. The ability of the Guild to successfully coordinate and represent a collective voice for the state’s many new and growing craft distilleries may influence how quickly additional legislative changes may occur in Missouri. Addressing these regulatory inequities may better position distillers to compete in the market and increase economic contributions to the state’s economy. Precedents exist, both in and outside of the state, that offer models for effective regulatory reform.

Taking Farm and Forest to the Glass: The Economic Contribution of Missouri’s Distilling Industry
April 2021 University of Missouri Extension | Page 46
APPENDIX A: Economic Analysis Methodology Economic Analysis Terms The IMPLAN input-output economic model shows how direct spending can have monetary and employment ripple effects that benefit many businesses and workers in a community. Some key spending effect figures produced by this analysis include:
• Gross Output (or Total Sales) estimates the total value of all sales, including both the input cost of making a good or service along with the money received when that product is sold for final use. For example, if a new distillery facility costs $1,000,000 to build then the buyer pays money to the contractor who will spend it purchasing metal structures, concrete, electrical equipment, labor, etc. The cascading chain of spending may generate an extra $800,000 in sales and therefore total $1,800,000 in spending.
• Value Added part of total sales (or Final Sales) is comparable to Gross Domestic Product. Value Add deducts the cost of goods and services from total sales to show what new money is left to pay wages, profits, rents, interests, and taxes. The $1,000,000 distillery construction project pays income to the workers and business owners in the construction firm, its suppliers, and the retailers, restaurants, and other stores where workers spend their money. Some sales, in this example, are made to businesses outside the region so the value added part of total sales is $950,000.
• Labor Income (or wages, benefits, and owner pay) is a part of the value added information. This figure represents all of the money available to workers, to include health, retirement, and other benefits, along with the income to sole proprietors. Labor income includes the direct pay to workers building a distillery facility, wages to local parts and service providers, and income for jobs in retail, restaurants, and other businesses that serve these workers’ consumer needs. Since some value added money goes to taxes and workers outside the region, the total labor income is $725,000 for the $1,000,000 distiller facility in this example.
• Jobs estimates the annual average full- or part-time jobs needed for a project. The jobs typically employ local residents and can attract temporary labor (for example specialized construction). Some higher-paying or specialized jobs will attract new workers from outside the region who will move to the area for employment. The $1,000,000 distillery construction may support 8 direct jobs in a year to build the structure but create an additional 5 jobs at suppliers and stores within the region for a total of 13 jobs.
• Multipliers represent the total effect of sales, value added, labor income, or jobs divided by the direct effect for that activity. For the distillery construction example, 13 total jobs divided by 8 direct jobs equals a jobs multiplier of 1.6. This means that for every 1 direct job constructing the distillery, 0.6 additional jobs are supported in the regional economy during that year.
Economic Model Limitations The IMPLAN input-output economic model provides the estimated indirect effects of a given economic activity as defined by the researcher’s inputs. Some direct effects may be estimated by IMPLAN when

Taking Farm and Forest to the Glass: The Economic Contribution of Missouri’s Distilling Industry
April 2021 University of Missouri Extension | Page 47
detailed, local information is not available. While IMPLAN is an excellent tool, inputs have to be appropriately defined and the underlying limitations of input-output models should be understood to include:
• No supply constraints: the model assumes no supply constraints of products, services, or labor will alter inputs needed by an industry. While this can be adjusted if specific changes are known, it is rare that detailed industry information is available as it requires substantial individual company financial data and can change rapidly based on market conditions.
• Static input structure: the model is based on national survey information and assumes that the type and ratio of inputs needed by an industry are fixed. The model also assumes a constant return to scale and technology use to produce industry averages needed for calculating impacts. However, U.S. industry averages can differ from a local industry input structure for a variety of reasons such as scale or available resources. If better local information is known, some of these ratios can be modified which will be noted in the model adjustments section.
• Backward-linked structure: the model does not account for forward linkages in estimating impacts, but rather looks at the industry supply chain and its forward sales if it creates an intermediate product that goes on for further processing. Nor does the model offset forward-linkage effects such as sales cannibalization from other existing businesses. Offsetting effects can be estimated if market data or research exists but the degree to which this occurs is often difficult to assess.
Economic Model Adjustments for this Study Several steps were taken to adjust the model for this study based on surveys, interviews, consultation with subject-matter experts, and company-specific knowledge. Adjustments to the model included: • IMPLAN distillery job and sales information was modified based on survey and Missouri Department of
Public Safety excise tax information. Using direct job and sales figures from Missouri-specific industry data results in a more accurate estimate of statewide economic contribution.
• Supply-chain inputs and labor income impacts were modeled separately so that information could be customized from Missouri distiller survey information. This was necessary for more accurate modeling, as information such as Missouri distiller’s labor income and input costs, as a share of gross sales, differed from U.S. averages found in the IMPLAN model. For example, Missouri distillery production was more labor income intensive (25% of sales) compared to the U.S. average (7%) due to smaller craft distiller operations.
• National distillery supply-chain input coefficients in IMPLAN were modified to more closely match the input spending patterns of Missouri distillers. For example, the national data indicated that glass bottles represented 5% of distiller supply-chain inputs but survey information showed that 13% was more appropriate for Missouri distillers.
• An adjustment was made to avoid double-counting distilled liquor sales in IMPLAN when Missouri distillers purchase spirits from each other. The regional purchasing coefficient for distilled liquor sales was adjusted so that direct spirit sales of Missouri distillers matched total spirit output, as that figure was directly entered into the economic model.

Taking Farm and Forest to the Glass: The Economic Contribution of Missouri’s Distilling Industry
April 2021 University of Missouri Extension | Page 48
APPENDIX B: Missouri Active Liquor Manufacturer Licenses, March 2021 List of Missouri based businesses who held an active liquor manufacturer license as of March 2021, information taken from the public website: https://data.mo.gov/Regulatory/Missouri-Primary-Alcohol-Licenses/d9fr-pncw
Name City County White Mule Distillery Purdy Barry Ishams Ordinary Columbia Boone Les Bourgeois Vineyards Rocheport Boone Dogmaster Distillery Columbia Boone Ozark Distillery Osage Beach Camden Rockin'a Distillery Creighton Cass Little Platte Distillery Smithville Clay Restless Spirits Distilling Company North Kansas City Clay Brewkery, The North Kansas City Clay Blacksmith Distillery Lohman Cole Rotten Reggie Distillery Willow Springs Douglas Samuel Berton Distilling Labadie Franklin Old Ozarkian Distillery Union Franklin Farm And Spirit Washington Franklin Pinckney Bend Distilling New Haven Franklin Nobletons Distilling House Beaufort Franklin Weiss Holdings Hermann Gasconade Krooked Moon Distillery Owensville Gasconade Copper Mule Distillery Hermann Gasconade Hermann Farm Distillery Hermann Gasconade Bub's Distillery Rogersville Greene Springfield Brewing Company Springfield Greene Advanced Innovative Bottling Clinton Henry R/Farm Distilling Co. Mound City Holt Mmad Spirits Distillery West Plains Howell Redbird Farm Distillery Independence Jackson Veritasi Lee's Summit Jackson Lifted Spirits Kansas City Jackson Evansfield Distillery Independence Jackson Jacob Rieger & Company Kansas City Jackson Tom's Town Distilling Company Kansas City Jackson Mean Mule Distilling Co Kansas City Jackson Boulevard Brewing Company Kansas City Jackson Bone Hill View Distillery Buckner Jackson West Bottoms Whiskeys Kansas City Jackson Phantom V Distilling Company Warrensburg Johnson

Taking Farm and Forest to the Glass: The Economic Contribution of Missouri’s Distilling Industry
April 2021 University of Missouri Extension | Page 49
Name City County T's Redneck Steakhouse Lebanon Laclede 1832 Distilling Concordia Lafayette Vance Vineyard & Winery Fredericktown Madison Tall Pines Distillery Noel McDonald Shawnee Bluff Distilleries Eldon Miller Wood Hat Spirits New Florence Montgomery Myrtle's Distilled Spirits Neosho Newton Meramec Vineyards Winery St. James Phelps McCormick Distilling Co Weston Platte Sd Strong Distilling Parkville Platte McCracken Ancestral Spirits Distillery Fair Play Polk Sweetwater Distillery Monroe City Ralls Woodsmen Higbee Randolph Cooper's Oak Winery Higbee Randolph Of The Earth Farm Distillery Richmond Ray Sugarmill Distillery Sikeston Scott Distillery Of Defiance Defiance St. Charles Busch Family Brewing and Distilling Defiance St. Charles St. Louis Distillery St. Charles St. Charles Twin Oaks Vineyard & Winery Farmington St. Francois Brew Hub Taproom St. Louis St. Louis City Luxco St Louis St. Louis City Soulard Island St. Louis St. Louis City Square One St. Louis St. Louis City Still 630 St. Louis St. Louis City 4 Hands Brewing Company St. Louis St. Louis City O'Fallon Brewery Maryland Heights St. Louis Co. Naked Spirits St. Louis St. Louis Co. Switchgrass Spirits St. Louis St. Louis Co. Cave Vineyard Ste. Genevieve Ste. Genevieve Crown Valley Winery Ste. Genevieve Ste. Genevieve Smith Creek Distillery Branson Taney Copper Run Distillery Walnut Shade Taney Missouri Ridge Distillery Branson Taney Smith Creek Moonshine Branson Taney Edelbrand Pure Distilling Marthasville Warren Missouri State University-Mountain Grove Mountain Grove Wright

Taking Farm and Forest to the Glass: The Economic Contribution of Missouri’s Distilling Industry
April 2021 University of Missouri Extension | Page 50
APPENDIX C: Missouri Distiller Survey Questions Missouri Distilleries Business Production, Sales, and Costs Survey Dear Distillery Owners/Operators:
Craft distilling is a rapidly expanding industry across the U.S. and here in Missouri. A modernized regulatory system and continued investment in Missouri’s distilling value chain could, we believe, propel sizeable growth of the industry. To get there we need better data and analysis to inform our efforts.
The Missouri Craft Distillers Guild (MCDG) and the University of Missouri are partnering to conduct a study of Missouri’s distillery industry to understand the economic contribution to the state, the industry’s connections to other Missouri commodities and businesses, as well as challenges and opportunities for future growth.
This survey of business production, sales, and cost information, conducted by the University of Missouri, will guide researchers in developing an accurate understanding of the economic contribution of distillers. The online survey link will be emailed to you on Tuesday, February 4th by Alan Spell, the University of Missouri economic impact researcher for this project. Some key points include:
• The survey will anonymously collect data (no names or identifying IP computer information will be gathered). All data will be treated confidentially, with only aggregate information reported.
• The survey itself should take approximately 30 minutes to complete, assuming you have data on sales and input costs at hand. It will likely take an hour to compile your data on sales and input costs needed before starting the survey.
• We encourage you to use this paper copy as a worksheet to identify data before entering information in the survey. Once you begin the online survey, you will not be able to exit the survey and return where you left off.
• All responses are due by February 17, 2020 to provide timely, preliminary results to the MCDG legislative committee.
Your responses are critical to the overall goal of 100% survey participation to understand our industry’s economic contribution to Missouri and the issues we face. The completed study will be provided to you and give you valuable information to share with customers, policymakers, and the media.
If you have any questions as you prepare information for the survey please call Alan Spell at (573) 882-8167 or email at [email protected].
We believe our industry is important and has the potential to add more value to Missouri’s agricultural products and in turn, provide more jobs and generate tax revenue. To that end, we need to document our current contributions and track our economic activity over time.
We sincerely appreciate your participation in this important project.
Don Gosen, President Dave Weglarz and Lynn DeLean-Weber Missouri Craft Distillers Guild Project Steering Committee Alan Spell, Assistant Ext. Professor, University of Missouri

Taking Farm and Forest to the Glass: The Economic Contribution of Missouri’s Distilling Industry
April 2021 University of Missouri Extension | Page 51
BUSINESS PRODUCTION, SALES, AND COST SURVEY QUESTIONS: All responses will be used to develop statewide estimates of recent sales trends and expectations along with industry averages for economic impact analysis. Please enter zero if there are years the business was not in operation or had no sales or costs.
Business Production 1. What year did the business receive a Distilled Spirits Plant (DSP) permit or is planning to receive a
DSP permit?
2. What was the total production size in proof gallons and origin of spirits for the years below? Percent from (should total 100%):
Total Proof Gallons Produced On-Site Distillation
Repackaged Other Missouri
Spirits
Repackaged Non-Missouri
Spirits 2019 % % % 2018 % % % 2017 % % % 2016 % % % 2015 % % % 2014 % % % 2013 % % % 2012 % % %
3. What is the expected total production size in proof gallons and origin of spirits in the following years (best estimate)?
Percent from (should total 100%):
Total Proof Gallons Produced On-Site Distillation
Repackaged Other Missouri
Spirits
Repackaged Non-Missouri
Spirits 2020 % % % 2021 % % %
Business Investments 4. How much money did the business spend on machinery and equipment or construction/renovations of
buildings in the previous years? Machinery/Equipment Construction/Renovations 2019 $ $ 2018 $ $ 2017 $ $ 2016 $ $ 2015 $ $ 2014 $ $

Taking Farm and Forest to the Glass: The Economic Contribution of Missouri’s Distilling Industry
April 2021 University of Missouri Extension | Page 52
2013 $ $ 2012 $ $
5. How much money does the business plan to spend on additional machinery and equipment or
construction/renovations of buildings in the coming years (best estimate)? Machinery/Equipment Construction/Renovations 2020 $ $ 2021 $ $
Business Sales 6. Which business stage best describes this company based on the definitions below?
• Development (planning only, no sales) • Start Up (initial sales, no profit yet) • Growth (sales increasing, low profit, investing focus) • Mature (stable sales/profit, new products/markets focus) • Decline/Exited (profits low and declining, unstable cash flow)
7. What were the total gross sales or receipts for this business in the years below?
2019 $ 2018 $ 2017 $ 2016 $ 2015 $ 2014 $ 2013 $ 2012 $
8. What is the expected total gross sales or receipts for this business in the following years (best estimate)?
2020 $ 2021 $
9. What percent of total gross sales or receipts for this business in 2019 was (answers should total 100%):
On-Site Sales % Off-Site but in Missouri Sales % Other State Sales % Foreign Country Sales % 100%

Taking Farm and Forest to the Glass: The Economic Contribution of Missouri’s Distilling Industry
April 2021 University of Missouri Extension | Page 53
10. What percent of total gross sales or receipts for this business in 2019 was from (answers should total 100%):
Spirits % Other Alcoholic Beverages % Restaurant/Bar % Retail Goods % Venue Rental/Tours % Other Sales (Please Describe) % Other Sales (Please Describe) % 100%
11. What percent of spirit sales in 2019 were sold to other Missouri or Non-Missouri brands?
Other Missouri Brands % Non-Missouri Brands %
12. How many proof gallons were sold in the years below? 2019 2018 2017 2016 2015 2014 2013 2012
13. How many proof gallons are expected to be sold in the following years (best estimate)? 2020 2021
If the business has on-site sales at any location, please answer these next questions. If no on-site sales, then skip to question 18.
14. How many total visitors did the business have in 2019 (best estimate)?
15. How many visitors are expected in the following years (best estimate)? 2020 2021
16. What percent of visitors came from outside Missouri (to include foreign visitors) in 2019 (best estimate)?
17. What was the average per visitor purchase amount in 2019 (best estimate of total visitor purchases divided by number of visitors)?

Taking Farm and Forest to the Glass: The Economic Contribution of Missouri’s Distilling Industry
April 2021 University of Missouri Extension | Page 54
Business Labor Cost and Purchasing Patterns
18. How many full-time jobs (35- to 40-hour week) did the business average per month, including regular and seasonal employees, in the previous years?
2019 2018 2017
19. How many full-time jobs (35- to 40-hour week) does the business plan on average per month, including
regular and seasonal employees, in the coming years (best estimate)? 2020 2021
20. How many part-time jobs (20-hour week) did the business average per month, including regular and
seasonal employees, in the previous years? 2019 2018 2017
21. How many part-time jobs (20-hour week) does the business plan on average per month, including
regular and seasonal employees, in the coming years (best estimate)? 2020 2021
22. Describe the business’s full-time average annual pay in 2019 (add the annual wage of each employee
and divide by total employees, e.g. for two employees: $30,000 + $40,000 / 2 = $35,000):
23. Describe the business’s part-time average hourly pay in 2019 (add the hourly wage of each employee and divide by total employees, e.g. for two employees: $15 + $21 / 2 = $18):
24. Did the business pay full-time employee health insurance or other benefits in 2019? (check all that apply) ☐ Health Insurance ☐ Retirement Contribution ☐ Other benefits If other benefits, please explain:
25. How much did the business pay in commercial insurance (across all policies) in the previous years? 2019 $ 2018 $ 2017 $
26. How much did the business pay in license fees (local, state, other) in the previous years?

Taking Farm and Forest to the Glass: The Economic Contribution of Missouri’s Distilling Industry
April 2021 University of Missouri Extension | Page 55
2019 $ 2018 $ 2017 $
27. How much did the business pay in state/local sales taxes in the previous years?
2019 $ 2018 $ 2017 $
28. How much did the business pay in local property taxes in the previous years?
2019 $ 2018 $ 2017 $
29. How much did the business pay in Federal Excise Taxes (FET) in the previous years? 2019 $ 2018 $ 2017 $
30. How much did the business pay for the following inputs in 2019?
Corn $ Other Grain $ Fruits/Vegetables $ Sugar/Molasses $ Yeast and Yeast Nutrients $ Other Distilled Liquors $ Glass Containers $ Wood Barrels $ Packaging $ Distribution $ Marketing (all promotion and advertising) $ All Other Inputs $
31. What percentage of these products or services were bought from in-state producers during 2019 (best
estimate)? Percent from in-state
producers?

Taking Farm and Forest to the Glass: The Economic Contribution of Missouri’s Distilling Industry
April 2021 University of Missouri Extension | Page 56
Corn % Other Grain % Fruits/Vegetables % Sugar/Molasses % Yeast and Yeast Nutrients % Other Distilled Liquors % Glass Containers % Wood Barrels % Packaging % Distribution % Marketing (all promotion and advertising) %
Thank you for responding to this important survey!