taking an integrated approach for plant germplasm characterization and utilization ming li wang...
TRANSCRIPT

Taking an Integrated Approach for Plant Germplasm Characterization and Utilization
Ming Li WangMolecular and Biochemical Genetics Laboratory
PGRCU
Curators Workshop at Atlanta, February 3, 2010

Our Mission for Plant Germplasm Research
Utilization
Preservation
Characteriza-tion
Evaluation
Distribution
Curation
Utilization

An Integrated Approachfor Plant Germplasm Research
Biochemical analysis
Genotypical analysis
Morphological analysis
► Genetic analysis of sweet sorghum germplasm
► Genetic and biochemical analysis of peanut germplasm
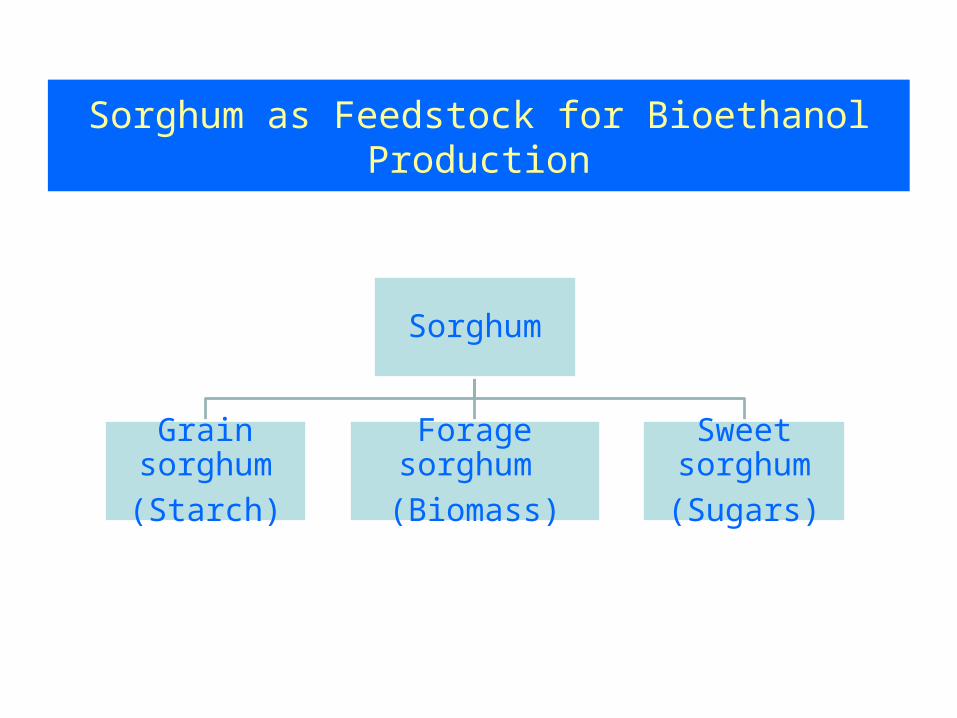
Sorghum
Grain sorghum
(Starch)
Forage sorghum
(Biomass)
Sweet sorghum
(Sugars)
Sorghum as Feedstock for Bioethanol Production

Pretreatment Fermentation Products Feedstock
Grain sorghum(Starch)
Sweet sorghum(Sugars)
Hydrolysis
Squeeze
GlucoseFructoseSucrose
C5 sugars
Animal feedEthanol
Chemicals
EthanolChemicals
Stalk residue
Forage orenergy sorghum
(Biomass)
DelignificationHydrolysis
There are about 3,000 sweet sorghum accessions in the U.S. germplasm collection

Selected 96 Sweet Sorghum Accessions for Genotyping
Country Line Number Country Line Number
Australia 1 Sudan 15
China 5 Swaziland 2
Ethiopia 5 Syria 2
Hungary 1 Tanzania 4
India 7 Turkey 3
Kenya 4 Uganda 4
Malawi 5 USA 23
Mexico 1 Zaire 4
Nigeria 1 Zambia 1
Pakistan 1 Others 2
South Africa 5 Total (22) 96

Sweet Sorghum Growing in the Field

Selected SSR Markers for Genotyping
Chromosome (LG) Number of markers Cover region (Mb)
Linkage Group 1 15 3.08-70.43
Linkage Group 2 12 1.02-77.62
Linkage Group 3 11 1.99-72.46
Linkage Group 4 6 48.57-67.96
Linkage Group 5 6 0.21-57.86
Linkage Group 6 6 3.17-58.26
Linkage Group 7 13 0.32-62.51
Linkage Group 8 11 0.16-54.56
Linkage Group 9 7 0.02-59.16
Linkage Group 10 8 10.89-60.57
Total 95 572 Mb (76.3%)

Genotyping Sweet Sorghum Accessions with SSRs
SSR marker Xcup1

Statistics Results
Statistics Overall G1 G2 G3 G4
Sample size 96 30 11 30 25
Total number of alleles 705 400 302 566 414
Number of alleles per locus 7.61 4.17 3.15 5.89 4.31
Major allele frequency 0.55 0.66 0.64 0.52 0.62
Genetic diversity 0.58 0.46 0.46 0.61 0.49
PIC* 0.54 0.42 0.41 0.57 0.46
* Polymorphism information content.

Determination of the Number of Subpopulations
1. Likelihood plot of the models,2. Stability of grouping patterns across ten runs,3. Germplasm information.

Analysis of Molecular Variation (AMOVA)
Source of variation
Degree of freedom
Sum of squares
Mean squares
Percentage of variation
Among population
3 643.66 214.56 13.99
Within population
188 4727.34 25.15 86.01
Total 191 5371.01

US historic syrup type
Race durra from Asia
Mainly from Africa
(26/29)
(16/20)
(10/14)
(24/33)

Genetic Distances between Sweet Sorghum Groups
Group G1 G2 G3 G4
G1 0 0.2399 0.1108 0.1643
G2 0.3156 0 0.1254 0.2191
G3 0.1246 0.1434 0 0.0781
G4 0.1965 0.2804 0.0848 0
Note: The top diagonal is Nei’s minimum distance and the bottom diagonal is pairwise Fst.

Genotyped Sweet Sorghum Accessions on the World Map

Principal Component Analysis (PCA)

Geographical and Genetic Distributions of Genotyped Sweet Sorghum Accessions
Wang et al., 2009 TAG

Summary of Sweet Sorghum Research Results
• Four subpopulations (G1, G2, G3, and G4) have been identified.• Four branching groups (B1, B2, B3, and B4) have been classified.• Results from genetic diversity and population structure analysis
were correlated well with the geographical locations where these accessions were curated.
• Geographical origin of accessions had significant influence on genetic similarity of sweet sorghum germplasm.
• Germplasm accessions curated from different geographical regions should be used for developing sweet sorghum cultivars.

Income
Fatty AcidComposition
(12 fatty acids)
Seed Oil Content(40-60%)
Grain Yield of Oilseed Crop(bushel/acre)
$
Biochemical and Genetic Analysis of Peanut Germplasm

Peanut as Nutritional and Bioenergy Crop
Peanut
Nutritional
Crop
High Protein
(25%)High Oil
(60%)
High Oleic Acid
(80%)
Bioenergy
Crop
First Used
Biodiesel
High Yield
Biodiesel
50 gallon oil /acre for soybean123 gallon oil /acre for peanut

Peanut oil extractionby ether solvent
Ankom XT15Fat Extractor

Measure Oil Content by Nuclear Magnetic Resonance (NMR)
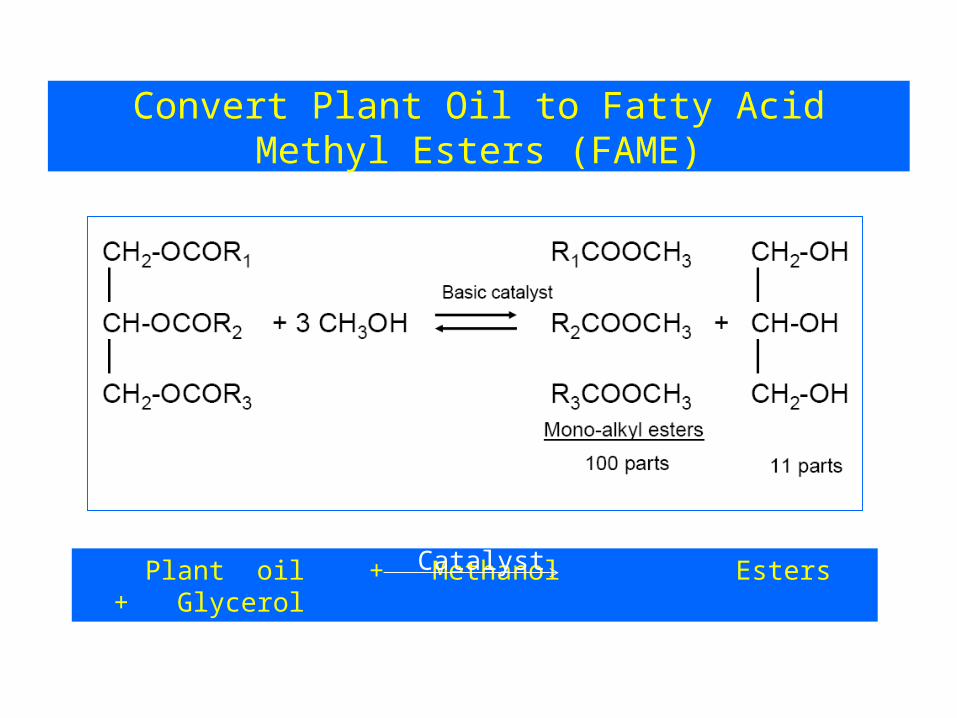
Plant oil + Methanol Esters + GlycerolCatalyst
Convert Plant Oil to Fatty Acid Methyl Esters (FAME)

Linoleic acid
32.0%
Oleic acid
48.0%
Stearic acid
3.5%
Palmitic acid
11.0%
C18:1 C18:2 C16:0
C18:0
3.2%
Behenic acid
C22:0
1.6%
Arachidic acid
C20:0
80%(high oleic acid)
Peanut Fatty Acid Composition

GC Analysis of Peanut Fatty Acid Composition

0 2 4 6 8 10 12
F.A.M.E. Standard1 = C14:02 = C16:03 = C16:14 = C18:05 = C18:16 = C18:27 = C18:38 = C20:09 = C20:110 = C22:011 = C24:0
Time (min.)
1
2
3
4
5
6
7 8 9
10
11

Oil% C16:0 C18:0 C18:1 C18:2 C20:0 C20:1 C22:0 C24:00
10
20
30
40
50
60
FA = subspecies fastigiata
HY = subspecies hypogaea
FA
HY
AB
AB
A B
B
B
A
A
B BA AA A
A A
Oil Content and Fatty Acid Composition among Different Subspecies

Oil% C16:0 C18:0 C18:1 C18:2 C20:0 C20:1 C22:0 C24:00
10
20
30
40
50
60
Hi = botanical variety hirsuta
Hy = botanical variety hypogaea
Hi
Hy
A
B
A
A
A
A
A AA
A
B
B
B
B
B BB
B
Oil and FAC among Different Botanical Varieties

Stearic acidC18:0
COOH Oleic acid
COOH
C18:1
COOH Linoleic acidC18:2
COOH Linolenic acidC18:3
Fatty Acid Desaturase (FAD) with Fatty Acid Composition
Δ12 FAD2
ω-3 FAD3
Δ9 FAD1
x
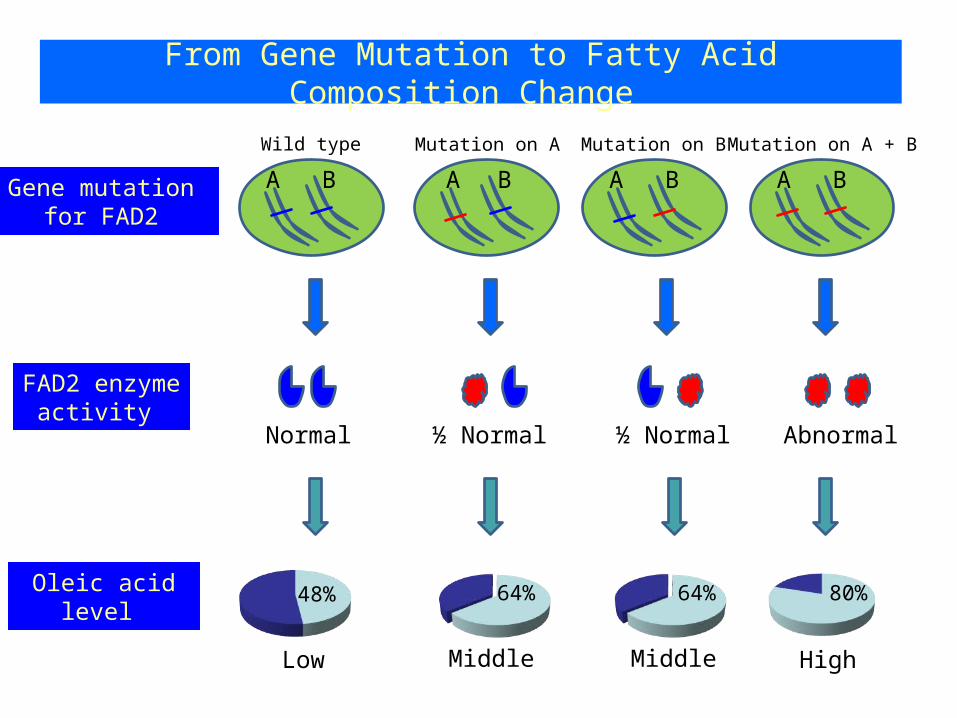
From Gene Mutation to Fatty Acid Composition Change
A B A B A B A BGene mutation for FAD2
Wild type Mutation on A Mutation on B Mutation on A + B
FAD2 enzymeactivity
Normal ½ Normal ½ Normal Abnormal
Oleic acid level
48% 64% 64% 80%
Low Middle Middle High

Detection of FAD2 Mutation on B Genome by Real-time PCR
Barkley et al., 2009 Molecular Breeding
Ol2Ol2 ol2ol2
Ol2ol2
Ol2ol2
ol2ol2
Ol2Ol2
Wild type Mutant
Heterozygous

a. FAD2 mutation
b. Allele-specific PCR amplification prediction
Wild type Substitution Insertion SUB + INS

Detection of Mutation in FAD2 by Allele-Specific PCR
Wild typeLow oleate
Common bandWild type band
Common bandSubstitution band
Common bandInsertion band
Common bandSubstitution band
Common bandInsertion band
+
+
+ +
+
+ +
- -
- -
-
SubstitutionMid oleate
InsertionMid oleate
Sub + InsHigh oleate
Chen et al., 2010 Plant Molecular Biology Reporter
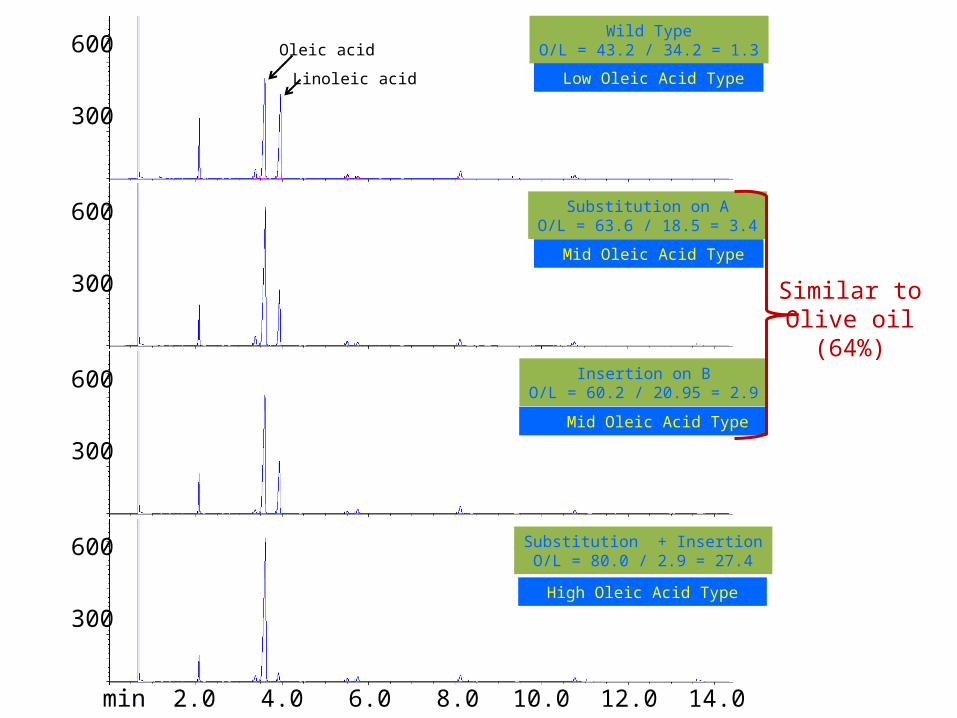
Wild TypeO/L = 43.2 / 34.2 = 1.3
Insertion on BO/L = 60.2 / 20.95 = 2.9
Substitution on AO/L = 63.6 / 18.5 = 3.4
Substitution + InsertionO/L = 80.0 / 2.9 = 27.4
2.0 4.0 6.0 8.0 10.0 12.0 14.0min
600
300
600
300
600
300
600
300
Oleic acid
Linoleic acid Low Oleic Acid Type
Mid Oleic Acid Type
Mid Oleic Acid Type
High Oleic Acid Type
Similar toOlive oil
(64%)

Summary of Peanut Germplasm Research Results
• Significant difference identified on oil content and fatty acid composition among botanical varieties and subspecies.
• Real-time PCR assay was developed for detection FAD2 mutation on B genome.• Allele-specific PCR assay was developed for detection FAD2 mutations on both A
and B genomes including: Wild type (no mutation), Substitution type (G→A) on A genome, Insertion type (→A) on B genome, Double mutation type (Substitution + Insertion).
• Real-time PCR and allele-specific PCR markers developed in our lab can be used for MAS and germplasm screening.
• GC analysis identified accessions with different levels (L, M, H) of oleic acid.• The results from Genetic analysis and GC analysis were consistent.• Genetic analysis in combination with biochemical analysis is a powerful approach
for germplasm research.

PGRCU CollaboratorsMr. Brandon Tonnis Dr. John Erpelding USDA-ARS, Puerto Rico Dr. Noelle Barkley Dr. Charles Chen USDA-ARS, DawsonMr. Dave Pinnow Dr. Paul Raymer UGA, GriffinMs. Sarah Moon Dr. Manjee Chinnan UGA, Food Science Dept.Ms. Jessica Norris Dr. Zhenbang Chen UGA, Crop & Soil Dept.
Dr. Corley Holbrook USDA-ARS, TiftonMr. Ken Manley Dr. Dick Auld Texas-Tech UniversityMs. Lee-Ann Chalkley Dr. Baozhu Guo USDA-ARS, TiftonMs. Tiffany Fields Mr. Jerry Davis UGA, Statistics Dept.Ms. Merrelyn Spinks Dr. Tom Stalker NCSU, Crop & Soil Dept.
Dr. Gorge Mosjidis Auburn University,All Supporting Staff Dr. Zhanguo Xin USDA-ARS, LubbockAll Curators Dr. Anna Resurrreccion UGA, Food Science Dept.Dr. Gary Pederson Dr. Jianming Yu Kansas State University
Acknowledgements