takeovers and private equity investors
TRANSCRIPT

TECHNISCHE UNIVERSITÄT MÜNCHEN
KfW Stiftungslehrstuhl für Entrepreneurial Finance
Univ.-Prof. Dr. Dr. Ann-Kristin Achleitner
Takeovers and Private Equity Investors
Bastian Hinterramskogler
Vollständiger Abdruck der von der Fakultät für Wirtschaftswissenschaften
der Technischen Universität München zur Erlangung des akademischen Grades eines
Doktors der Wirtschaftswissenschaften (Dr. rer. pol.)
genehmigten Dissertation.
Vorsitzender: Univ.-Prof. Dr. C. Kaserer
Prüfer der Dissertation: 1. Univ.-Prof. Dr. Dr. A.-K. Achleitner
2. Prof. Dr. T. Jenkinson (University of Oxford / UK)
Die Dissertation wurde am 09.05.2011 bei der Technischen Universität München
eingereicht und durch die Fakultät für Wirtschaftswissenschaften am 20.07.2011
angenommen.

II
III
TABLE OF CONTENTS
1 INTRODUCTION ........................................................................................................ 1
1.1 Relevance and objectives ............................................................................... 1
1.2 Structure of analysis ...................................................................................... 6
2 BACKGROUND ........................................................................................................ 10
2.1 Agency theory and corporate governance ................................................. 10
2.1.1 Principal agent relationships and costs ........................................... 10
2.1.2 Corporate governance ...................................................................... 15
2.1.2.1 Definition .......................................................................... 15
2.1.2.2 Corporate governance mechanisms .................................. 16 2.1.2.3 Corporate governance systems ......................................... 20
2.2 Takeovers...................................................................................................... 23
2.2.1 Economic function and efficiency ..................................................... 23
2.2.2 Takeovers and target ownership structure ....................................... 27
2.3 Private equity and buyouts ......................................................................... 29
2.3.1 Definitions and basics ...................................................................... 30
2.3.2 Buyouts and returns .......................................................................... 33
2.4 Summary ...................................................................................................... 38
3 INVESTMENT CRITERIA OF PRIVATE EQUITY INVESTORS IN
CONTINENTAL EUROPE ......................................................................................... 39
3.1 Introduction ................................................................................................. 39
3.2 Literature review and hypotheses .............................................................. 43
3.2.1 Motives applying to blockholder-dominated corporate governance systems .......................................................................... 43
3.2.1.1 Monitoring incentives ....................................................... 43 3.2.1.2 Private benefits of control ................................................ 44 3.2.1.3 Types of large shareholders .............................................. 45
3.2.2 Traditional motives ........................................................................... 46
3.2.2.1 Managerial incentives ....................................................... 46 3.2.2.2 Leverage ........................................................................... 48
3.2.2.3 Risk ................................................................................... 49
3.2.2.4 Stock liquidity .................................................................. 50
3.3 Methodology and data ................................................................................. 54
IV
3.3.1 Sample selection process .................................................................. 54
3.3.2 Control sample ................................................................................. 56
3.3.3 Data sources and definitions of variables ........................................ 57
3.3.3.1 Data sources ...................................................................... 57
3.3.3.2 Definitions of variables .................................................... 57
3.4 Empirical results .......................................................................................... 61
3.4.1 Descriptive statistics ......................................................................... 61
3.4.2 Multivariate results .......................................................................... 70
3.4.2.1 Monitoring incentives and private benefits of control ..... 71 3.4.2.2 Secondary variables .......................................................... 81
3.5 Summary ...................................................................................................... 81
4 HOW MUCH DO PRIVATE EQUITY INVESTORS PAY FOR CONTINENTAL
EUROPEAN FIRMS? ................................................................................................ 84
4.1 Introduction ................................................................................................. 84
4.2 Literature review and hypotheses .............................................................. 89
4.2.1 Governance hypotheses in the continental European context ......... 89
4.2.2 Capital structure hypotheses ............................................................ 92
4.2.3 Valuation hypotheses ........................................................................ 94
4.2.4 Private equity hypotheses ................................................................. 95
4.3 Sample, data and methodology................................................................. 101
4.3.1 Sample ............................................................................................ 101
4.3.2 Data and variable definitions ......................................................... 105
4.3.3 Methodology ................................................................................... 106
4.4 Empirical results ........................................................................................ 107
4.4.1 Summary statistics .......................................................................... 107
4.4.1.1 Firm fundamentals .......................................................... 107
4.4.1.2 Announcement returns and premiums ............................ 110
4.4.2 Regression results ........................................................................... 118
4.4.2.1 Governance related results in the continental European context ............................................................ 122
4.4.2.2 Capital structure related results ...................................... 128 4.4.2.3 Valuation related results ................................................. 128 4.4.2.4 Private equity related results .......................................... 129 4.4.2.5 Further variables ............................................................. 129
V
4.5 Summary .................................................................................................... 130
5 WHY DO STRATEGIC INVESTORS PAY SO MUCH MORE COMPARED TO
PRIVATE EQUITY INVESTORS? THE ROLE OF OPERATIONAL SYNERGIES ...... 133
5.1 Introduction ............................................................................................... 133
5.2 Sample, methodology and variable definitions ....................................... 141
5.2.1 Sample data .................................................................................... 141
5.2.2 Methodology for grasping synergies of strategic takeovers .......... 144
5.2.2.1 Synergy measure based on IBES data ............................ 147 5.2.2.2 Synergy measure based on Value Line data ................... 148
5.2.3 Methodology of calculating the takeover premium ........................ 151
5.2.4 Variable definitions ........................................................................ 152
5.3 Results ......................................................................................................... 154
5.3.1 Sample characteristics .................................................................... 154
5.3.2 The value of synergies .................................................................... 157
5.3.3 Regression analysis of takeover premium ...................................... 162
5.4 Summary .................................................................................................... 173
6 CONCLUSION ........................................................................................................ 175
6.1 Summary of results and contributions .................................................... 175
6.2 Outlook ....................................................................................................... 181
A. APPENDIX ......................................................................................................... 184
Appendix Chapter 3 ............................................................................................ 184
B. APPENDIX ......................................................................................................... 185
Appendix Chapter 5 ............................................................................................ 185
REFERENCES .......................................................................................................... 188

VI
L IST OF FIGURES
Figure 2-1: Agency cost functions for different levels of outside financing ............ 14
Figure 2-2: Overview of corporate governance mechanisms ................................... 17
Figure 2-3: Classification of private equity .............................................................. 31
Figure 2-4: Role of private equity investors over the lifecycle of a fund................. 33
Figure 4-1: Mean cumulative abnormal returns ..................................................... 114

VII
L IST OF TABLES
Table 3-1: Hypotheses, variables, definitions and expected signs .......................... 51
Table 3-2: Number of PE transactions across continental Europe for 1997 to 2007 ....................................................................................................... 61
Table 3-3: Number and enterprise values of private equity targets across time ..... 62
Table 3-4: Control and type of ultimate controlling shareholder ............................ 63
Table 3-5: Monitoring incentives and private benefits of control across types of ultimate controlling shareholders ...................................................... 66
Table 3-6: Secondary variables - private equity transactions versus control group ...................................................................................................... 69
Table 3-7: Logistic regression results I - monitoring incentives............................. 72
Table 3-8: Logistic regression results II - private benefits of control ..................... 75
Table 3-9: Logistic regression results III - monitoring and private benefits of control .................................................................................................... 79
Table 4-1: Summary of hypotheses, variables, definitions and expected signs ...... 97
Table 4-2: Private equity sample by announcement year and country ................. 103
Table 4-3: Univariate sample characteristics ........................................................ 108
Table 4-4: Cumulative abnormal returns .............................................................. 111
Table 4-5: Premiums over different anticipation windows ................................... 115
Table 4-6: Spearman correlations ......................................................................... 119
Table 4-7: Cumulative abnormal return and premium regressions ....................... 125
Table 5-1: Size of target companies split according to bidder groups .................. 143
Table 5-2: Definition of variables ......................................................................... 152
Table 5-3: Premiums by type of winning bidder .................................................. 156
Table 5-4: Synergies (IBES) and premiums ......................................................... 158
Table 5-5: Synergies (VL) and premiums ............................................................. 161
Table 5-6: Regression analysis of premiums with IBES synergy measure .......... 163
Table 5-7: Regression analysis of premiums with VL synergy measure .............. 168
Table B-1: Control variables across bidder types .................................................. 185

VIII
L IST OF ABBREVIATIONS
AB Agency costs of debt
AD Announcement date
ADV Adjusted compressed present value
AIFM Alternative Investment Fund Manager
AS Agency cost of outside equity
AT Total agency costs
BHAR Buy and hold abnormal return
BIMBO Buyin management buyout
BVDA Bureau Van Dijk Amadeus
C Combined entity
CAPEX Capital expenditure
CAPM Capital asset pricing model
CAR Cumulative abnormal returns
CEFS Center for Entrepreneurial and Financial Studies
CF Cash flow
CFR Cash flow rights
CG Corporate governance
CPI Consumer price index
CRSP Center for Research in Security Prices
DEBT Long-term debt
DEP Depreciation
DJ Dow Jones
EBIT Earnings before interest and tax
EBITDA
Earnings before interest, taxes, depreciation and
amortization
EBO Employee buyout
EPS Earnings per share
EV Enterprise value
FCF Free cash flow

IX
FY Fiscal year
GP General partner
H Hypothesis
IBES Institutional Brokers' Estimate System
IBO Institutional buyout
INS Insignificant
IRR Internal rate of return
IT Information technology
K Cost of capital
K0 Low outside financing
K1 High outside financing
LBO Leveraged buyout
LIBOR London Interbank Offered Rate
LP Limited partner
LR Chi2 Likelihood ratio chi-square test
Max. Maximum
MBI Management buyin
MBO Management buyout
Med. Median
Min. Minimum
No. Number
OBO Owner buyout
OLS Ordinary least square
OM Operating margin
P Offer price
PE Private equity
PME Public market equivalent
PV Present value
PwC PricewaterhouseCoopers
REIT Real estate investment trust
S Sales

X
SB Stand-alone bidder
SDC Securities Data Company
SEC Securities and Exchange Commission
SPAC Special purpose acquisition company
ST Stand-alone target
St.Dev. Standard deviation
T Income tax rate
TV Terminal value
UK United Kingdom
US United States (of America)
V* Firm value
VIF Variance inflation factor
VL Value Line
VR Voting rights
WC Working capital
X Post-takeover value of the firm
* Statistical significance at the 10% level
** Statistical significance at the 5% level
*** Statistical significance at the 1% level
1
1 Introduction
1.1 Relevance and objectives
Takeovers1 are economic phenomena which represent one of the most incisive events
during the life cycle of any firm.2 Their execution bears enormous chances and risks,
not only to directly involved owners and capital providers but also to the firm’s
remaining constituencies such as workers, customers, suppliers and competitors.3 This
high relevance of takeovers is further underlined by the sheer size of the market for
corporate control. Estimates from the last takeover wave suggest that the global
aggregated transaction value ranges from a sizeable $1.2 trillion in calm years (2002)
to a staggering $4.2 trillion in highly active years (2007).4 These values represent
remarkable 3.7% and 11.5% in terms of worldwide gross domestic product (GDP).5
Consequently, the takeover market represents one, if not the largest corporate market.
A central driver behind the last takeover wave was the resurgence of private equity
investors6 alongside traditional strategic investors. Private equity investors’ market
presence in terms of competing bids rose to a staggering 36% at the peak of their
activity in 2006 compared to 14% at the bottom of their activity in 2001.7 Similarly, in
terms of completed deals, private equity investors captured 21% of the tremendous
aggregate takeover volume at the wave’s peak compared to 5% of the relatively
1 In line with Betton/Eckbo/Thorburn (2008), p. 1, this dissertation uses the term “takeover” for any
transaction irrespective of whether the transaction is conducted as a merger when the prospective buyer negotiates with target management or as a tender offer when the bid is made directly towards the shareholders.
2 Cf. Betton/Eckbo/Thorburn (2008), p. 1. 3 Cf. Sudarsanam (2010), p. 1. 4 Cf. ThomsonReuters/JPMorgan (2009), p. 8, values are inferred from graphs. Thus far, history has
seen the takeover tide rising and falling six times: in the 1900s, the 1920s, the 1960s, the 1980s, the 1990s and the 2000s. Cf. Davidoff (2009) for a detailed description of each of these waves.
5 Cf. ThomsonReuters/JPMorgan (2009), p. 8, values are inferred from graphs. 6 PE investors are specialized investment firms who finance transactions with small equity portions
and large debt fractions borrowed against the targets’ assets and cash flows prospects. Consequently, these transactions are referred to as leveraged buyouts (LBOs). For more comprehensive definitions and a discussion of the private equity business model, see section 2.3.
7 Cf. Dittmar/Li/Nain (2010), p. 34.
2
modest volume at the wave’s bottom.8 The high significance of these statistics and
thus of the private equity industry itself becomes more tangible when looking at
absolute values. It is estimated that over the last buyout wave cycle (January 2001 to
July 2007) 13,482 leveraged buyouts (LBOs) resulted in an aggregate deal volume of
$2.7 trillion.9 These numbers amount to 63% and 68%, respectively, of the total
private equity activity recorded since 1970.10 The last wave was also characterized by
the extension of the buyout market in terms of geographical scope. Private equity
activity in the United States (US) was even slightly overtaken by Europe, a result
which originates mainly from the sharp rise of these activities in continental Europe.11
In particular, the US accounted for 45.2% of aggregate deal volume compared to
46.1% for Europe.12 Continental Europe contributed two thirds to the European share,
that is, 30.6%13 of the aggregate volume which is particularly remarkable when
compared to its mere 3%14 equivalent during the first buyout wave.
Although LBOs took a swift downturn with the systemic financial crises, it seems
rather likely that private equity is here to stay. Indeed, since the first quarter of 2009
LBO activity has shown signs of recovery: both aggregate deal values and numbers
have steadily, albeit slowly, increased.15 This upturn is expected to persist if not
accelerate since the industry has a breath taking $500 billion in capital committed by
investors ready to be invested in LBOs.16 As debt markets show clear signs of
8 Cf. ThomsonReuters/JPMorgan (2009), p. 11, values are inferred from graphs. 9 Cf. Strömberg (2007), p. 30. 10 Cf. Strömberg (2007), p. 30. 11 Cf. World Economic Forum (2008), p. 7 of executive summary. 12 Cf. Strömberg (2007), p. 31. The figures refer to the period 2001 to 2007. 13 Cf. Strömberg (2007), p. 31. The figures refer to the period 2001 to 2007. 14 Cf. Kaplan/Strömberg (2009), p. 127. The figure refers to the period 1985 to 1989. 15 Cf. Preqin research report January 2011, p. 1, see
http://www.preqin.com/docs/reports/2010dealstats.pdf, last accessed on March 29 2011. 16 Cf. Bain report March 2011, p. 2, see
http://www.bain.com/bainweb/PDFs/Bain_and_Company_Global_PE_Report_2011.pdf, last accessed on April 15 2011.
3
improved liquidity,17 a conservative estimate based on a 2/1 debt/equity ratio and
discarding new funds suggests a deal activity of $1.5 trillion in the next few years.
Given the dramatic surge and increased relevance of private equity in the last boom
period and its likely persistent economic significance, the industry has naturally
attracted increased public attention. The respective debates comprehend a wide range
of topics18 but have one thing in common: they clearly illustrate the strong need for
rigorous, unbiased research on the workings of private equity upon which well-
grounded decisions can be made.
Although recent academic work has advanced our understanding of the private equity
asset class in general and LBOs in particular,19 high quality research is still rather in its
infancy and much more needs to be learned. Partly, this situation originates from the
notorious secrecy of the private equity industry. The respective dearth of
comprehensive and reliable data has impeded the ability to draw clear pictures of even
basic issues such as the risk return profile of the asset class. Recent initiatives by
private equity associations themselves,20 regulators,21 commercial data providers22 and
academics23 alike are promising steps towards mitigating this dearth of essential data
for private equity research.
Nonetheless, there are slices of data available which can help to advance our
knowledge of PE. At the transaction level, LBOs of publicly listed companies provide
17 Cf. Bain report March 2011, p. 2, see
http://www.bain.com/bainweb/PDFs/Bain_and_Company_Global_PE_Report_2011.pdf, last accessed on April 15 2011.
18 For instance, in terms of recent regulatory developments and discussions concerning the private equity industry see the Alternative Investment Fund Manager’s Directive (AIFMD), the Dodd Frank Act and the Securities and Exchange Commission (SEC) registration rules and the change of the United Kingdom (UK) Takeover Code, amongst others.
19 Cf. Kaplan/Strömberg (2009) for a recent literature review on the research about private equity and LBOs.
20 Cf. for instance the Walker report. 21 Cf. for instance the Alternative Investment Fund Manager’s (AIFM) Directive. 22 Cf. for instance Preqin. 23 Cf. for instance initiatives at the Oxford Private Equity Institute and the Center for Entrepreneurial
and Financial Studies (CEFS) at Technische Unversität München.
4
access to rich data due to the comprehensive disclosure requirements of stock
exchanges.24 Such transactions of large targets are mainly encountered during boom
periods when they typically contribute the lion’s share to aggregate deal volumes as
evidenced during the first (second) buyout wave with 49% (34%).25 This thesis draws
on these transactions to address three largely unanswered research questions at the
investment stage of the LBO process, i.e. the selection of targets and their pricing.
These questions are derived from two key motivations as will become clear in the
following.
The first key motivation originates from the previously mentioned fact that private
equity has become an international phenomenon during the last buyout wave. Indeed,
the European private equity market has grown slightly larger than its US counterpart in
terms of transaction volume and number due to the strong growth of continental
Europe.26 Anecdotal evidence suggests that continental Europe is likely to play a
continued strong role in the development of the private equity market. For instance, in
a recent survey among international private equity fund managers by
PricewaterhouseCoopers (PwC), the majority of the managers explicitly stated that
their funds “view Western Europe as most attractive for future investment”.27
Yet, the majority of research so far has focused on the US markets.28 And there are
plentiful essential reasons to assume that the results from the US markets may not be
transferable to regions such as continental Europe.29 In particular, the law and finance
literature has stressed the significance of corporate governance (CG) differences across
financial systems and their impact upon the financing and control of corporations. For
24 Clearly, the advantage of comprehensive and sharp market data stands vis-à-vis the drawback that
such transactions represent a specific buyout type. Hence, the motives behind them may not be fully congruent with the ones of alternative buyout types.
25 Cf. Kaplan/Strömberg (2009), p. 127. The large size of the public targets implies that such buyouts occur less frequently than buyouts of private companies.
26 Cf. World Economic Forum (2008), p. 7 of executive summary. 27 Cf. Scholich/Burton (2010), p. 9. 28 Cf. for instance Renneboog/Simons/Wright (2007) who state “Hardly anything is known about the
continental European private equity market” (Renneboog/Simons/Wright (2007), p. 620). 29 Cf. section 3.1 and 4.1 for a discussion of these reasons.

5
this reason, a detailed examination of LBO acquisitions in the distinctive continental
European context is both required and compelling. Consequently, this thesis responds
to the increased relevance of LBOs in continental Europe and the respective lack of
rigorous scientific evidence by addressing the following two questions:
1. What are the investment motives of private equity investors in the distinctive
continental European context?
2. How much do private equity investors pay for continental European firms?
These questions will be answered with a self-collected dataset of all LBOs of public
continental European companies completed between 1997 and 2007 for which the
required data points are available. Notably, the research object of publicly listed
continental European target companies unifies two characteristics which are usually
encountered only separately: market prices and concentrated ownership. This
combination confers a neat advantage for addressing the second question. Sharp
pricing measures can be constructed for the public targets in contrast to private targets
but the former still resemble the latter closely in terms of ownership. In a nutshell:
public targets represent an interesting research object towards understanding LBO
pricing in the continental European context.
The second key motivation arises from the previously stressed fact that private equity
investors re-emerged in the last buyout wave as a vigorous competitor against
traditional strategic investors on the market for corporate control. Private equity
investors launched 36% of all competing bids30 and closed 21% of the aggregate
industry deal volume.31 Despite this highly interesting competition pattern between the
two investor types across market cycles, there is actually very little systematic research
which directly opposes and compares these two basic protagonists who act upon the
same market. One exception is Bargeron et al. (2008) who provide evidence that
public (and thus predominantly operational) investors pay significantly higher
takeover premiums than private equity investors. This gap amounts up to a remarkable
63% under standard calculus assumptions. However, they face difficulties in 30 Cf. Dittmar/Li/Nain (2010), p. 34. 31 Cf. ThomsonReuters/JPMorgan (2009), p. 11, the value is inferred from graph 4.6.
6
empirically unfolding the sources and stress that more research is needed to resolve
this crucial issue.32 Not surprisingly, the aforementioned result has reinforced critical
voices towards private equity investors by the public. An often raised argument
concerns potential collusion with target managers to the detriment of the company
vendors.33 There is, however, an alternative argument which should be of central
importance: that of expected operational synergies on behalf of strategic investors.
This is an intuitive and important argument but its estimation is notoriously difficult, a
task which this thesis tackles.
Consequently, given the controversy about the underlying sources of the pricing
differential between strategic and financial takeovers and the lack of respective
research, this thesis addresses the following question:
3. Why do strategic investors pay so much more compared to private equity
investors?
This question will be answered based on a dataset of all takeovers involving US public
companies as targets and US public companies or private equity investors as bidders,
completed between 1987 and 2009.
1.2 Structure of analysis
This dissertation is comprised of six chapters. Chapter 1 introduces the motivation,
research questions and structure of the thesis.
32 They argue that agency costs on behalf of public acquirers may play an important role since the
premium differential declines with increasing managerial ownership. However, they also find that the premium differential does not vary with institutional ownership, a result which casts doubt on the agency argument since institutional investors are commonly assumed to act as monitors who curtail managerial misbehaviour.
33 More precisely: managers of buyout targets are potentially facing severe conflict of interests when negotiating with the bidder. On the one hand, they have the obligation to bargain fiercely with the private equity bidder in order to obtain the optimal price for their shareholders. On the other hand, they may be offered high-powered incentive contracts by the private equity investor which are tied to their firm’s value. Hence, they may have a personal incentive to agree to suboptimal takeover prices to the detriment of their shareholders in order to maximize their own personal benefit. For recent anecdotal evidence see for instance the buyout of J. Crew as described in the New York Times article “What’s Next for J. Crew”, http://dealbook.nytimes.com/2011/03/02/whats-next-for-j-crew/, last accessed on April 18 2011.
7
Chapter 2 constructs the framework which the three subsequent empirical chapters will
be built upon. Section 2.1 introduces agency theory and corporate governance as the
central tenets of this thesis. With respect to the latter tenet, its definition is followed by
a systematic overview of the governance mechanisms available to mitigate the
classical manager-financier agency conflict. Further, it is presented how these
individual governance mechanisms interact in the two dominant corporate governance
systems, the continental European and Anglo-Saxon model. This is of interest since
the first and second research questions will examine LBOs in the continental European
environment while the third research question will focus on LBOs in the US setting.
Section 2.2 discusses takeovers as the governance mechanism which is in the focus of
this thesis. The literature is reviewed on whether takeovers confer efficiency gains.
Further, it is assessed how the ownership structure affects takeovers. Thereby, the
framework for the empirical analyses is sharpened which will focus on LBOs in
continental Europe where targets are closely held (chapter 3 and 4) and the US where
targets are widely held (chapter 5). Section 2.3 outlays the private equity model and
related academic evidence with an emphasis on the investment phase. Thereby, the
focus is narrowed down to the very research object of this study, takeovers through
private equity investors, i.e. LBOs.
Chapter 3 presents the first empirical study of this thesis. It focuses on the selection
stage of the takeover process and addresses the first research question raised in the
previous section: what are the investment motives of private equity investors in the
distinctive continental European context? As ownership in continental Europe tends to
be highly concentrated, it is argued that the incentives of the incumbent large
shareholder to monitor the management and the private benefits of control he/she may
derive from the firm are important investment considerations for the private equity
investor. When measuring the likelihood of a private equity acquisition, there is strong
and consistent evidence that both rationales have a significant negative impact. This
pattern is predominantly driven by firms whose ultimate controlling shareholder is a
family.

8
Chapter 4 is comprised of the second empirical study of this thesis. It concentrates on
the bidding stage of the takeover process and analyses the second research question
raised in the previous section: how much do private equity investors pay for
continental European firms? The evidence shows that private equity investors pay a
final mean premium of 28.3% and that shareholders gain abnormal returns of 13.0%
around the announcement (event day -1 to +1 ([-1,+1])) . These values are 3.0 and 7.7
percentage points, respectively, lower than for comparable US transactions. In line
with the previous chapter, it is argued that the distinctive ownership pattern of
continental European firms plays a crucial role in explaining the effects. Indeed, the
regression results lend strong support towards the following view: that both sharp
monitoring incentives of blockholders for curtailing managerial misbehaviour and the
restriction of their own private benefits consumption due to peer cross-monitoring
confers lower premiums and abnormal returns.
Chapter 5 contains the third empirical study of this thesis. It focuses equally on the
bidding stage of the takeover process and examines the third research question raised
in the previous section: why do strategic investors pay so much more compared to
private equity investors? This chapter first revisits the pricing differential. In addition
to traditional equity premium measures, the chapter tests novel enterprise premium
measures as suggested by Jenkinson/Stucke (2010). The enterprise premium estimates
are of similar or even larger magnitude (depending on the calculation approach) than
the equity premium estimates. Hence, the pricing differential is not grounded in the
premium calculation approach. With respect to the sources, it is argued that a central
reason behind the premium differential is expected operational synergies on behalf of
strategic takeovers, a factor that has been traditionally very hard to grasp empirically.
Exploiting analyst revisions around the takeover, the chapter calculates a conservative
operational synergy estimate largely free of standalone restructuring potential to be
approximately three times the size of the premium’s dollar value. Further, controlling
for operational synergies in a cross-sectional setting renders the premium differential
insignificant. These results underline the decisive role of expected operational
synergies in explaining the premium differential.

9
Chapter 6 concludes the thesis. It summarizes the results and contributions and
provides avenues for future research.
10
2 Background
This chapter provides the basis on which the three empirical chapters will be built
upon. Section 2.1 introduces agency theory and corporate governance as central tenets
underlying the private equity model. Section 2.2 discusses takeovers as an important
governance mechanism. Section 2.3 presents the private equity model with a special
focus on the investment phase, i.e. takeovers through private equity investors which
are commonly referred to as leveraged buyouts (LBOs).
2.1 Agency theory and corporate governance
This section introduces agency theory and corporate governance following Becht et al.
(2005), Gillan (2006), Tirole (2006) and Moldenhauer (2007). These concepts
represent the central theoretical tenets underlying the private equity model. Section
2.1.1 defines the concept of agency costs and shows how it is related to the ownership
and capital structure of the firm. Section 2.1.2 defines corporate governance, outlines
the mechanisms available to mitigate the agency conflict between investors and
managers and presents how these interact in the two dominant corporate governance
systems, the Anglo-Saxon and the continental European model.
2.1.1 Principal agent relationships and costs
“The directors of such [joint-stock] companies, however, being the
managers rather of other people’s money than of their own, it cannot
well be expected, that they should watch over it with the same anxious
vigilance with which the partners in a private copartnery frequently
watch over their own. Like the stewards of a rich man, they are apt to
consider attention to small matters as not for their master’s honour, and
very easily give themselves a dispensation from having it. Negligence
and profusion, therefore, must always prevail, more or less, in the
management of the affairs of such a company.” Adam Smith34
34 Cf. Smith ([1994]1937), p. 700 according to Jensen/Meckling (1976), p. 305.
11
In his seminal work “An inquiry into the nature and causes of the wealth of nations” of
1776, Adam Smith already pointed towards the special problems arising in an agency,
the delegation of work from one party (the principal) to another one (the agent). It was
not before 200 years when this important notion was formally integrated into rigorous
economic analysis by Ross (1973) and Jensen/Meckling (1976).35 It became known as
principal agent theory and established itself as one of the dominant tenets of the
financial economics literature.
In contrast to the neoclassical view of firms as (simple) production functions, agency
theory as a representative of the institutional perspective considers firms as an
aggregate of economic agents with individual interests.36 Firms are interpreted as
“legal fictions” that serve as nexuses for contractual relationships between individual
economic agents.37 In this context, an agency relationship (or principal agent
relationship) is defined as a contract under which one party, designated as the
principal, engages another party, designated as the agent, to execute some task on their
behalf and therefore assigns decision making authority.38
These relationships entail costs if the following two key assumptions are met. First,
both the principal and agent behave as homo oeconomicus, i.e. they maximize their
own personal utility which entails a conflict of interest.39 Second, information
asymmetries between the principal and agent: adverse selection relates to asymmetric
information before the contract is closed, i.e. the party with more information is
induced to behave opportunistically before an agreement is reached.40 Moral hazard
refers to information asymmetries after the contract is closed which motivates the
party with more information to behave opportunistically after contract conclusion.41
35 It builds on property rights elements from Coase (1937). 36 Cf. Rudolph (2006), p. 119. 37 Cf. Jensen/Meckling (1976), pp. 310-311. 38 Cf. Jensen/Meckling (1976), pp. 308. 39 Cf. Jensen/Meckling (1976), pp. 308. 40 Cf. Leland/Pyle (1977). 41 Cf. Akerlof (1970). Moral hazard can be further systematized into hidden information and hidden
action. Cf. Furubotn/Pejovich (1972), p. 196.
12
Jensen/Meckling (1976) analyse agency relationships between owner managers
(agents) and outside financiers (principals), thereby delivering a formal analysis of the
problems arising from the separation of ownership and control as first noted by Smith,
Adam ([1994]1937) and substantiated by Berle/Means (1932). Under the outlined key
assumptions, the firm incurs agency costs which can be systematized into three
components:
• Monitoring and incentivation costs: The expenses incurred by the principal for
monitoring and incentivizing the agent not to take opportunistic actions. 42
• Bonding costs: The costs incurred by the agent in order to signal the principal
the quality of her/his actions.
• Residual loss: The loss due to remaining divergence of interest between the
principal and agent after the optimal amount of monitoring and bonding has
been incurred.
Based on these agency costs, the authors develop a theory of the ownership and capital
structure of the firm. As a starting point of their analysis, they use the case of an
entrepreneurial firm which is held completely by the owner manager. Agency costs
arise when the owner manager sells residual claims to outside financiers, i.e. to outside
equity and debt providers:43
• Agency cost of outside equity: The owner manager maximizes her/his utility by
consuming both pecuniary returns and non-pecuniary returns.44 At the starting
point of 100% ownership by the owner manager, the consumption of non-
pecuniary returns by the manager is mirrored in an equal decrease of firm value.
As soon as the firm raises outside equity, parts of the respective decrease in
firm value are transferred to the outside equity holders. The owner manager
42 Jensen/Meckling (1976) denote these costs solely “monitoring costs” but mention in footnote 9 on
page 308 that it includes the costs arising from incentivation. 43 Cf. Junker (2005), p. 37. 44 Jensen/Meckling (1976) mention as examples for non-pecuniary benefits “[…]the physical
appointments of the office, the attractiveness of the secretarial staff, the level of employee discipline, the kind and amount of charitable contributions, personal relations (“love”, “respect”, etc.) with employees, a larger than optimal computer to play with, purchase of production inputs from friends, etc.” (Jensen/Meckling (1976), p. 312).

13
does not bear the full costs anymore and thus over-consumes non-pecuniary
returns resulting in agency costs. Consequently, the more outside equity is
raised, the higher are the agency costs of equity.
• Agency costs of debt: In principle, the agency costs of outside equity could be
avoided if one substitutes the outside equity for debt. However, debt incurs
agency costs as well. In case debt is taken on, the manager owner is likely to
engage in asset substitution, i.e. in actions to increase their payoff at the cost of
debt holders.45 Black/Scholes (1973) show that owning equity in the firm can be
interpreted as a European call option on the value of the firm with an exercise
price equal to the face value of debt. Put differently, the equity holders have the
right to buy the firm back at the expiration date for the face value of debt. Since
the value of the option rises with the variance of the underlying, the manager is
induced to engage in higher risk investments leading to agency costs of debt.
The more debt is raised, the higher are the agency costs of debt.
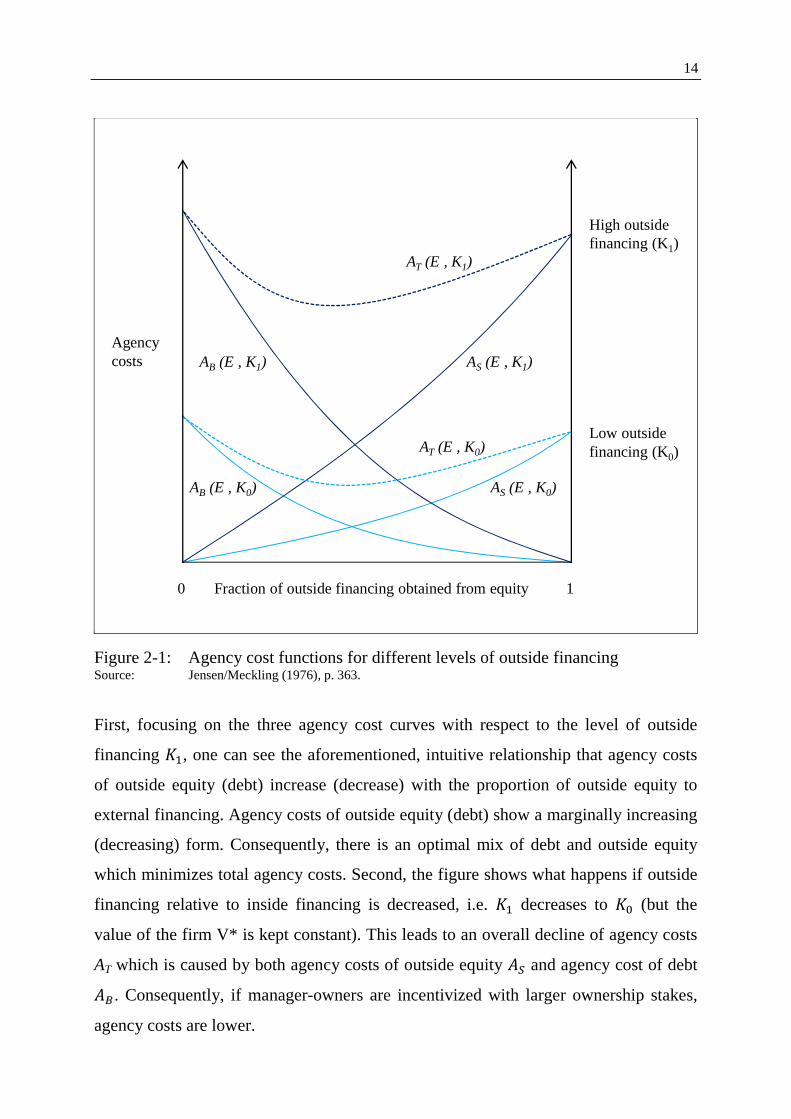
These mechanisms are exemplified in Figure 2-1. Function �� shows agency costs of
debt, �� agency cost of outside equity and �� total agency costs. All three functions
are drawn for two different amounts of outside financing �� and �� (�� > ��) while
the value of the firm V* is held constant.
45 Cf. Jensen/Meckling (1976), p. 345-350. Further problems may be underinvestment as described by
Myers (1977) and claim dilution as described by Smith/Warner (1979).
14
Figure 2-1: Agency cost functions for different levels of outside financing Source: Jensen/Meckling (1976), p. 363.
First, focusing on the three agency cost curves with respect to the level of outside
financing ��, one can see the aforementioned, intuitive relationship that agency costs
of outside equity (debt) increase (decrease) with the proportion of outside equity to
external financing. Agency costs of outside equity (debt) show a marginally increasing
(decreasing) form. Consequently, there is an optimal mix of debt and outside equity
which minimizes total agency costs. Second, the figure shows what happens if outside
financing relative to inside financing is decreased, i.e. �� decreases to �� (but the
value of the firm V* is kept constant). This leads to an overall decline of agency costs
AT which is caused by both agency costs of outside equity �� and agency cost of debt
��. Consequently, if manager-owners are incentivized with larger ownership stakes,
agency costs are lower.
Fraction of outside financing obtained from equity0 1
Low outsidefinancing (K0)
High outsidefinancing (K1)
Agencycosts AB (E , K1)
AT (E , K1)
AS (E , K1)
AT (E , K0)
AS (E , K0)AB (E , K0)
15
Both points lie at the heart of the private equity model (Jensen (1986), Jensen (1989))
as will become evident in the remainder of this chapter.
2.1.2 Corporate governance
Section 2.1.2.1 defines the term corporate governance and thereby establishes the ties
to the previous chapter. Section 2.1.2.2 gives a systematic overview of the governance
mechanism available to mitigate the classical principal agent conflict between
investors and managers. Finally, section 2.1.2.3 presents how these mechanisms
interact in the two dominant corporate governance systems, the Anglo-Saxon and the
continental European model.
2.1.2.1 Definition
Corporate governance is a widely used term in almost any discipline of the social
sciences. Consequently, there exists no unified definition; corporate governance is
subject to a wide range of understandings. From an economist’s perspective, a rather
broad view of corporate governance is provided by the OECD (2004):
“Corporate governance is one key element in improving economic
efficiency and growth as well as enhancing investor confidence.
Corporate governance involves a set of relationships between a
company’s management, its board, its shareholders and other
stakeholders. Corporate governance also provides the structure through
which the objectives of the company are set, and the means of attaining
those objectives and monitoring performance are determined. […] The
presence of an effective corporate governance system, within an
individual company and across an economy as a whole, helps to provide
a degree of confidence that is necessary for the proper functioning of a
market economy. As a result, the cost of capital is lower and firms are
encouraged to use resources more efficiently, thereby underpinning
growth.”46
46 Cf. OECD (2004), p. 11.

16
Hence, this definition stresses the systemic character of corporate governance in
promoting the development of a strong market economy. A narrower definition of
corporate governance has been articulated by Shleifer/Vishny (1997).
“Corporate Governance deals with the ways in which suppliers of
finance to corporations assure themselves of getting a return on their
investment.”47
This definition departs from the agency problems encountered in modern corporations
as outlined in section 2.1.1 (Smith ([1994]1937), Berle/Means (1932),
Jensen/Meckling (1976)). It focuses on the costs imposed by the separation of
ownership and control, that is, the costs arising from conflict of interests between
corporate managers and financiers. Consequently, this definition embeds the term
corporate governance into a corporate finance framework and therefore represents the
primary reference point for this dissertation unless otherwise specified.
2.1.2.2 Corporate governance mechanisms
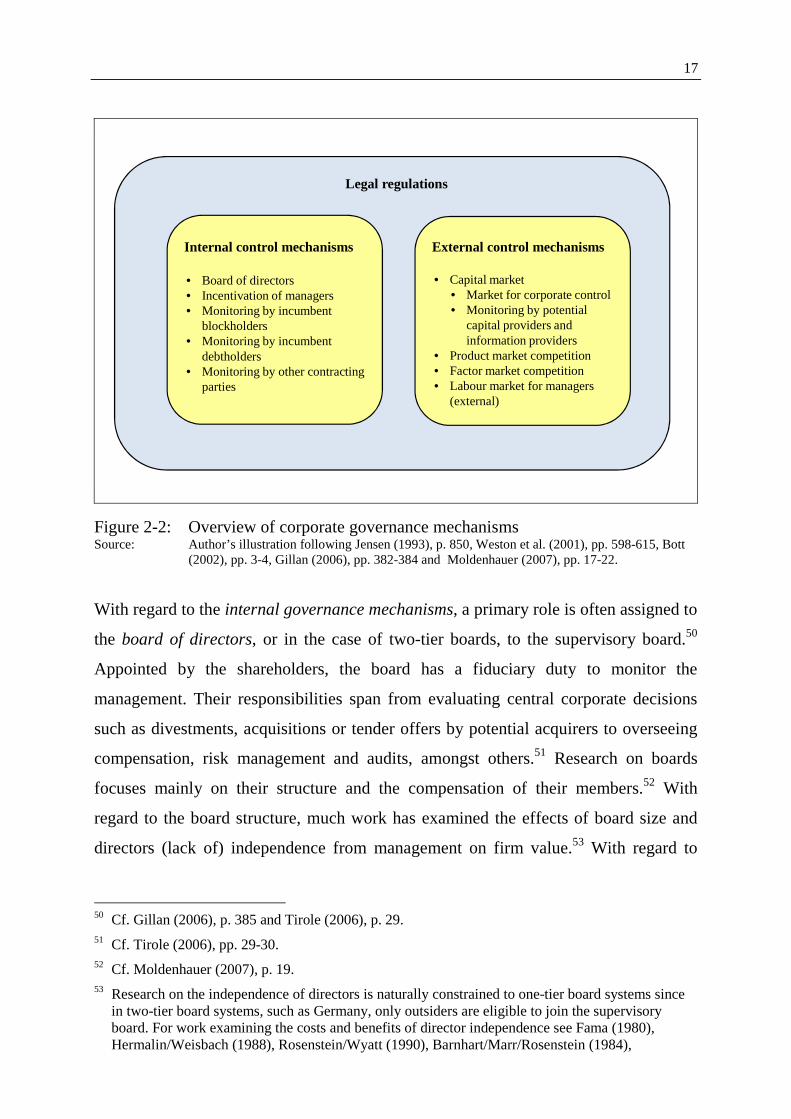
How do investors get managers to give them their money back? The literature usually
categorizes the respective measures into internal and external governance mechanisms
as outlined in Figure 2-2.48 These measures are framed by the underlying legal system:
it shapes the specific design and effectiveness of the individual mechanisms and, in
turn, their interdependencies.49 This section systematically introduces the individual
governance mechanisms. The next section presents how they interact in the two
dominant corporate governance systems, the Anglo-Saxon and the continental
European model.
47 Shleifer/Vishny (1997), p. 737. 48 Cf. Jensen (1993), p. 850, Weston/Siu/Johnson (2001), pp. 598-615, Gillan (2006), pp. 382-384 and
Moldenhauer (2007), pp. 17-22. 49 Cf. Shleifer/Vishny (1997), p. 739; Gillan (2006), p. 383.
17
Figure 2-2: Overview of corporate governance mechanisms Source: Author’s illustration following Jensen (1993), p. 850, Weston et al. (2001), pp. 598-615, Bott
(2002), pp. 3-4, Gillan (2006), pp. 382-384 and Moldenhauer (2007), pp. 17-22.
With regard to the internal governance mechanisms, a primary role is often assigned to
the board of directors, or in the case of two-tier boards, to the supervisory board.50
Appointed by the shareholders, the board has a fiduciary duty to monitor the
management. Their responsibilities span from evaluating central corporate decisions
such as divestments, acquisitions or tender offers by potential acquirers to overseeing
compensation, risk management and audits, amongst others.51 Research on boards
focuses mainly on their structure and the compensation of their members.52 With
regard to the board structure, much work has examined the effects of board size and
directors (lack of) independence from management on firm value.53 With regard to
50 Cf. Gillan (2006), p. 385 and Tirole (2006), p. 29. 51 Cf. Tirole (2006), pp. 29-30. 52 Cf. Moldenhauer (2007), p. 19. 53 Research on the independence of directors is naturally constrained to one-tier board systems since
in two-tier board systems, such as Germany, only outsiders are eligible to join the supervisory board. For work examining the costs and benefits of director independence see Fama (1980), Hermalin/Weisbach (1988), Rosenstein/Wyatt (1990), Barnhart/Marr/Rosenstein (1984),
• Board of directors• Incentivation of managers• Monitoring by incumbent
blockholders• Monitoring by incumbent
debtholders• Monitoring by other contracting
parties
Internal control mechanisms
Legal regulations
• Capital market• Market for corporate control• Monitoring by potential
capital providers and information providers
• Product market competition • Factor market competition • Labour market for managers
(external)
External control mechanisms
18
compensation, structuring an efficient compensation system including performance-
based components has been in the focus of interest.54 While from a theoretical point of
view, one would expect the board of directors to represent a rather effective
governance mechanism due to its legal obligation towards shareholders, the more
common perception is that boards are rather “[…] ineffective rubber-stampers
controlled by, rather than controlling, management.” 55
Incentivation of the management board represents a complementary, more direct
governance lever. Its objective is to discourage managerial malpractice ex-ante. While
this idea sounds straightforward, structuring adequate compensation is not. The typical
compensation package constitutes a fixed salary, a bonus based on short term
accounting performance and a stock-based participation plan in the form of straight
stocks and options. The latter two components are supposed to induce managers to
internalize shareholder’s interests. This notion has received academic evidence, in
particular in the early 1990s,56 and there has been a trend towards higher compensation
levels with more emphasis on the variable compensation components.57 However,
there is also widespread concern about the efficacy of this trend by both practitioners
and academics alike. In particular, concerns about too beneficial pay for performance
relationships and drawbacks of options such as the danger of substantial risk taking by
managers have received increased attention.58
Borokhovich/Parrino/Trapani (1996), Yermack (1996), Holderness/Kroszner/Sheehan (1999), Peasnell/Pope/Young (2003) and Hermalin/Weisbach (2003).
54 For work examining the link between board compensation and firm value see Mehran (1995) and Core/Guay/Larcker (2003), amongst others.
55 Cf. Tirole (2006), p. 30. 56 For work on ownership see according to Gillan (2006), p. 387, for example Demsetz/Lehn (1985),
Morck/Shleifer/Vishny (1988) and McConnell/Servaes (1990). For work on compensation see for example Murphy (1999), Bebchuk/Fried (2003), Core/Guay/Larcker (2003) and Core/Guay/Thomas (2005).
57 Cf. Tirole (2006), p. 24. 58 For work on the executive compensation controversy see for example Jensen/Murphy (1990),
Haubrich (1994), Core/Guay (1999) and Guay (1999). For work on the drawbacks of stock options such as increased risk taking see for example Acharya/John/Sundaram (2000), Brenner/Sundaram/Yermack (2000), Chance/Kumar/Todd (2000), Carter/Lynch (2001), Chidambaran/Prabhala (2003), Coles/Hoi (2003) and Rogers (2005).

19
The incentives to closely follow the actions of the management and to stop value-
decreasing policies increase with the stake of ownership in the company. With the
exception of the US and the United Kingdom (UK), a certain degree of equity
ownership concentration is encountered in most companies around the world.59
Monitoring of the firm by incumbent (i.e. internal) blockholders has been associated
with increased shareholder value.60 However, this observation has to be treated with
care. First, the relationship between concentrated ownership and firm value is blurred
by endogeneity issues.61 Second, while increased ownership is likely to result in more
stringent oversight of managers, it may also incur costs, such as the potential for self-
dealing on private information at the cost of remaining shareholders.62
Similarly, monitoring by incumbent debt holders represents an important governance
mechanism. When large amounts of debt financing are provided, creditors such as
banks typically include rigorous covenants in the respective debt contracts.63
Consequently, creditors have the right to enforce a change of control when interest and
or principal payments are not met. Therefore, monitoring by incumbent creditors to
ensure proper interest and principal payment shall discipline manager’s incentives to
divert free cash flows.64
In addition to these four central internal governance mechanisms, all institutions or
persons with which the company has a contractual relationship can be interpreted as
internal governance mechanisms. For example, employees may be disappointed by
self-dealing managers and consequently might whistle-blow such insider information
to the press.65
59 Cf. for instance Becht/Bolton/Röell (2005), p. 47 and Tirole (2006), pp. 39-40. 60 Cf. Shleifer/Vishny (1986), Dlugosz et al. (2006), Cronqvist/Fahlenbrach (2009) and further
sources in Gillan (2006) and Bebchuk/Weisbach (2010). 61 Cf. Demsetz (1983), Demsetz/Lehn (1985) and Demsetz/Villalonga (2001). 62 Cf. Tirole (2006), pp. 41-42. 63 Cf. Harvey/Lins/Roper (2004). 64 Cf. Jensen (1986) and Jensen (1993). 65 Cf. Moldenhauer (2007), p. 20.
20
Whereas internal control mechanisms stem from a firm’s contractual relationships,
firm governance is also determined by external mechanisms which evolve from its
competitive environment. In particular, prior work has stressed the controlling forces
of product and factor markets, the labour market (for managers) and the capital
market including (i) monitoring by potential capital providers and information
providers (such as stock analysts) and (ii) the market for corporate control.
In all cases, the underlying argument is that competition would not allow managers to
divert substantial corporate resources; otherwise these companies would be driven out
of the market. Hence, the author refrains from presenting each of these external
governance mechanisms in detail. Section 2.2 will provide a detailed picture of the
market for corporate control since takeovers are in the focus of this dissertation.
2.1.2.3 Corporate governance systems
The interaction of the internal and external governance mechanisms described in the
previous section is shaped by the policy environment, that is, laws that govern
contracts and their enforcement as well as more macroeconomic oriented policy levers
such as tax and labour regulations.66 Consequently, each jurisdiction can be
understood as a particular governance regime or system. While globalization has led to
some convergence of governance systems in most advanced economies, there still
exist marked differences. Departing from the two broad legal traditions of common
and civil law, the literature exemplifies these differences by contrasting two stylized,
polar systems: the Anglo-Saxon, capital market-oriented system and the continental
European, corporate law-oriented system.
The Anglo-Saxon capital market-oriented system is based on strong protection of
investor’s property rights. Shareholders enjoy strong minority protection, can transfer
their stakes at little cost, rely on shareholder-oriented fair value accounting standards
and have powerful rights to sue managers for breaching their fiduciary duty to act in
66 Cf. Tirole (2006), pp. 53-54.

21
the best interest of shareholders, such as class-action lawsuits.67 This strong protection
affects the development of equity capital markets.68 In common-law-oriented countries
such as the US and the United Kingdom (UK), relatively more companies go public
and the ratio of equity capital market capitalization to gross domestic product is larger
than in civil law countries such as Germany.69 In the same vein, countries with strong
investor protection are less likely to require a concentrated ownership with large
blockholders who have the incentive and power to curb managerial misbehaviour.
There is widespread evidence for this notion: Anglo-Saxon companies are
predominantly owned by a set of widely dispersed shareholders.70 These shareholders,
however, can rely on a highly active takeover market as disciplinary mechanism.71
The remaining stakeholders of the corporation are endowed with comparably few
rights in the Anglo-Saxon system. Creditors such as banks have historically enjoyed
relatively little protection in the US. The bankruptcy process allocates substantial
rights to the judge which severely limits bank influence in the restructuring and
liquidation process.72 Further, until 1999 the Glass-Steagall act prevented banks from
directly owning significant stakes in industrial corporations and thus from
strengthening their influence, for instance by sending representatives to the board.73
Similarly, employees have less voice in the Anglo-Saxon model, for instance they
have no say in appointing board members. Consequently, that is why the Anglo-Saxon
corporate governance system is often referred to as shareholder-oriented.
In comparison to the Anglo-Saxon system, outside and minority shareholders are
generally less protected in the continental European jurisdictions with the 67 Cf. Shleifer/Vishny (1997), pp. 769-770, Dietl (1998), pp. 147-155 and Scott (1999), p.6 according
to Moldenhauer (2007), p. 23. 68 Cf. Porta et al. (1997), pp. 1131-1150. 69 Cf. Tirole (2006), pp. 54-55. 70 Cf. Shleifer/Vishny (1997), p. 754 and Becht/Bolton/Röell (2005), p. 73, amongst others. 71 Cf. Shleifer/Vishny (1997), pp. 769-770 and Martynova/Renneboog (2008), p. 2148, amongst
others. 72 Cf. Hotchkiss et al. (2008), p. 13. 73 Cf. Becht/Bolton/Röell (2005), p. 51 and Moldenhauer (2007), p. 24. In the United Kingdom (UK),
creditors enjoy better rights due to the receivership approach. However, banks do not own significant stakes in corporations such as in Germany. Cf. for instance Davydenko/Franks (2008).
22
Scandinavian civil law system offering the most, the German intermediate and the
French the lowest protection.74 This pattern is in line with the observation that equity
capital markets in continental Europe are relatively small when set in relation to gross
domestic production.75 Further, the relatively poor shareholder protection may explain
why ownership in these jurisdictions is generally concentrated in the hand of large,
long-term oriented blockholders.76 These large shareholders have the ability to
interfere with management and therefore to limit the higher risk stemming from the
lower shareholder protection. An alternative, more pessimistic view is that it enables
them to consume private benefits at the cost of minority shareholders.
Creditors which consist predominantly of banks play an important role in the
continental European system. Corporations usually engage in long-term relationships
with their banks. Thereby banks can accumulate valuable information about their
clients. Due to their crucial function as debt provider (for future rounds), they have a
voice in the government of the firm, even if they do not hold substantial equity
stakes.77 Furthermore, banks usually fulfil a dual role in the continental European
system in the sense that they act as (shadow) equity holders. On the one hand, banks
sometimes own direct equity stakes in firms, on the other hand they can exert control
through proxy voting for absent shareholders.78
Employees as further stakeholders are typically granted more beneficial rights in the
continental European context, though there are obvious variations among jurisdictions.
Most notably, employees’ interests in Germany have historically been considered by
74 Cf. Porta et al. (1997), p. 1132. 75 Cf. Tirole (2006), pp. 54-55. 76 Cf. Gugler/Mueller/Yurtoglu (2004), p. 137. A complementary view is that in Anglo-Saxon
jurisdictions there are regulations which hamper financial institutions and large investors in their monitoring efforts. See Becht/Bolton/Röell (2005), p. 34 and sources therein.
77 Cf. Becht/Bolton/Röell (2005), p. 52. 78 Cf. Baums/Fraune (1995) according to Becht/Bolton/Röell (2005), p. 51.

23
the act of codetermination, i.e. the right to appoint half of the supervisory board
members which oversee management.79
The market of corporate control as the primary external governance mechanism has
historically been less vital than in the Anglo-Saxon markets. However, this stylized
fact has changed with the fifth takeover wave of the 1990s when continental European
firms matched their US and UK counterparts for the first time in pursuing takeovers.80
Further, when focusing on LBOs, the transaction volume in continental Europe has
surpassed the UK in the second buyout wave of the 2000s.81
2.2 Takeovers
This chapter introduces takeovers as a central external governance mechanism
following Burkart/Panunzi (2008). Section 2.2.1 outlines the economic functions of
takeovers and the related evidence on efficiency gains. Section 2.2.2 analyses the
effect of ownership structures on takeovers. Thereby takeovers are embedded into the
two stylized corporate governance systems described in the previous section and the
theoretical foundation for the empirical chapters 3 and 4 is set which focus on LBOs in
continental Europe.
2.2.1 Economic function and efficiency
There are two broad economic rationales for takeovers: first and in line with a pure
agency cost perspective, improved management of the firm’s existing resources which
is also often referred to as managerial skill or, respectively, as rectification of
managerial failure argument. Second, generation of synergies, i.e. additional value
stemming from the combination of two firms which would have not been available to
79 With the introduction of the Societas Europaea (SE), companies have nowadays theoretically the
option to diminish employees’ say in boards. In practice, however, this has not happened as evidenced by the cases of Allianz, Fresenius und BASF. With respect to traditional legal corporate forms, Moldenhauer (2007) notes that “similar but less stringent forms of codetermination exist in Hungary, Slovenia, Slovakia, Poland, Austria, Luxembourg and the Netherlands. […] France and Italy have provided companies since 1996 and 2003, respectively, with a choice to implement one tier Anglo-Saxon or two-tier German board models” (Moldenhauer (2007), p. 25).
80 Cf. Martynova/Renneboog (2008), p. 2148. 81 Cf. Kaplan/Strömberg (2009), p. 127.

24
these companies operating independently.82 Outsiders, who expect to be more
competent in running the firm’s existing resources and/or generating synergies, will try
to gain control in the market for corporate control since they expect to realize a
profit.83 Hence, takeovers shall lead towards a value-maximizing policy
complementing other external and internal governance mechanisms.84 More precisely,
the market for corporate control can promote value generation in two ways: in the
explicit form of an actual takeover and in the implicit form of a general takeover
threat. In the following, the empirical evidence on value creation stemming from the
former is first reviewed before the respective evidence on the latter is discussed which
is more difficult to grasp.
The economic consequences of takeovers are often approximated using stock price
reactions to bid announcements. The evidence from this stream of the literature can be
summarized as follows:
• target shareholders gain significantly with abnormal returns ranging from 15%
to 30% in the Anglo-Saxon context85 to 10% in the continental European
context,86
• acquiring shareholders seem to neither gain nor loose substantially with the
evidence being far more variable; some studies reporting slightly positive,87
negative88or statistically insignificant89 abnormal returns,
• the combined effect being slightly positive in the range from 1% to 3%.90
82 Cf. Damodaran (2005), p. 3 and Burkart/Panunzi (2008), p. 2. 83 A takeover can be either conducted as a merger when the prospective buyer negotiates with target
management or as a tender offer when the bid is made directly towards the shareholders and hence, target management is bypassed.
84 This positive view dates back to Manne (1965). 85 Cf. Andrade/Mitchell/Stafford (2001), Bruner (2002) and McCahery et al. (2004) for literature
reviews. 86 Cf. Campa/Hernando (2004) and Goergen/Renneboog (2004). 87 Cf. for instance Goergen/Renneboog (2004) and Schwert (1996). 88 Cf. for instance Andrade/Mitchell/Stafford (2001). 89 Cf. for instance Stulz/Walkling/Moon (1990). 90 Cf. for instance Andrade/Mitchell/Stafford (2001) and Campa/Hernando (2004).

25
Hence, on average takeovers create gains for shareholders with the majority, if not all,
being consummated by target shareholders. Since shareholders are the residual
claimants of the corporation after all other contractual obligations have been met, these
gains are often interpreted in the sense that takeovers do create value. This conclusion,
however, is based on strong assumptions such as the absence of redistribution and
externalities as well as efficient stock markets. Hence, shareholder wealth gains are
only indicative of efficiency improvements.
If takeovers lead indeed to efficiency improvements, they should be reflected in
improved operating performance. The evidence on operating performance following
takeovers, however, is not clear-cut. While some studies find a significant
improvement relative to peers in the post-takeover period,91 others find a statistically
insignificant92 or even negative93 performance development. It has to be stressed,
however, that operating performance studies have to be interpreted with care. They are
plagued by methodological difficulties such as the lack of adequate benchmarks and
the low degree of comparability due to different performance measures and assessment
periods, amongst others.94
The lack of unambiguous evidence for value creation (stemming from the operative
performance literature) and the high takeover premiums for target shareholders gives
rise to the conjecture of wealth transfers. On the one hand, there is the potential for the
redistribution of wealth from the acquirer (shareholders) to the target (shareholders).
Explanations for such transfers include over-optimism95 or simply self-serving actions
(diversification of human capital risk96 and/or empire building97) on behalf of
acquiring managers. The empirical literature has lent evidence to the redistributive role
91 Cf. for instance Lichtenberg et al. (1987), Lichtenberg/Siegel (1989) and Healy et al. (1992). 92 Cf. for instance McGuckin/Nguyen (1995) and Schoar (2002). 93 Cf. for instance Ravenscraft/Scherer (1987). 94 The evidence on improved operating performance following a takeover is rather clear for leveraged
buyouts. The majority of the private equity literature finds that LBO targets improve their performance following the buyout. Cf. section 2.3.2 for details.
95 Cf. Roll (1986). 96 Cf. Amihud/Lev (1981). 97 Cf. Marris (1963) and Marris (1964).
26
of both rationales.98 However, target shareholders cannot solely gain at the cost of the
acquirer shareholders since the combined shareholder returns are (slightly) positive.
Alternatively, target shareholders can also benefit from a redistribution of wealth from
target stakeholders, i.e. employees, creditors, consumers and the government as the tax
authority. There is empirical evidence which supports these concerns.99 However, the
stakeholder wealth losses are relatively small when compared to the target shareholder
gains. Consequently, from an overall perspective it appears that takeovers lead to
efficiency improvements even if they are limited in their size.
In addition to actual takeovers, the general threat of a takeover is also contended to
induce managers to maximize the value of the firm. An often mentioned example
underlying this claim is the 1980s when high takeover activity driven by private equity
funds coincided with ample restructuring by internal managers.100 However, the threat
of a takeover can also confer distorted managerial behaviour not necessarily in line
with value maximization. Often cited examples for such behaviour include the
adoption of takeover defences (such as poison pills, staggered boards, litigation and
the likes101), entrenchment (e.g. in the form of changing the firm’s direction more
towards their own managerial skill set102) or underinvestment (e.g. in firm-specific
human capital103 or research and development, i.e. sacrificing long-term for short-term
profitability104) due to the risk of getting fired.
98 With respect to evidence on the overoptimism argument see for instance Malmendier/Tate (2008).
With respect to evidence on the self-serving rationale, see for instance Lewellen/Loderer/Rosenfeld (1985) who show that acquirers with high managerial ownership engage in takeovers with higher bidder returns.
99 Cf. Shleifer/Summers (1988). For work focusing on employees see for instance Rosett (1990), for work on creditors see for instance Marais/Schipper/Smith (1989), for work on consumers, i.e. market power see for instance Eckbo (1983) and for work on the government, i.e. tax savings see for instance Auerbach/Reishus (1988).
100 Cf. Holmstrom/Kaplan (2001), p. 121. 101 Cf. Tirole (2006), pp. 45-46. 102 Cf. Shleifer/Vishny (1989). 103 Cf. Shleifer/Summers (1988). 104 Cf. Stein (1988).

27
Empirical evidence on whether takeover threats are ultimately rather beneficial or
detrimental to shareholders is inconclusive. Most of the work examines the effect of
takeover defences on share returns and firm performance.105 The evidence tends
towards the view that anti-takeover devices slightly increase shareholder value106
without preventing many takeovers but the evidence is weak at best.107
Consequently, there is more research needed in order to evaluate whether the mere
threat of a takeover leads to additional value generation besides the modest efficiency
gains arising from actually completed transactions.
2.2.2 Takeovers and target ownership structure
Motivated by the observation from section 2.1.2.3 that companies are held differently
in the Anglo-Saxon and continental European corporate governance systems, in the
following, the effect of the ownership structure on takeovers is assessed.
The seminal work of Grossman/Hart (1980) represents the reference base for this
analysis. They analyse the bid process for a value-increasing takeover of a target
which is owned by a large number of shareholders, each of them holding only an
atomistically small proportion of the shares. In this setting, each individual shareholder
assumes that s/he is not pivotal for the success of the transaction and opposes the costs
and benefits under the two outcome scenarios: success and failure of the takeover. In
case the takeover fails, i.e. less than 50% of the shares are tendered, her/his individual
decision will be irrelevant since the value of her/his share will remain unchanged
either way. In case the takeover succeeds, s/he would receive offer price p when
tendering but post-takeover value x when holding. Hence, it follows that the individual
shareholder will not consider tendering before p equals at least x. However, at this
point, the bidder would not make any profit anymore but incur a loss if cost c for
launching a bid is assumed. Consequently, even though the takeover would be value
increasing, it will not proceed due to the free-riding behaviour of the small individual
105 For surveys, see Coates (2000) and Weston/Mitchell/Mulherin (2003 ). 106 In particular, most studies find insignificant share reactions but higher takeover premiums. 107 Cf. Burkart/Panunzi (2008), pp. 9-12.

28
shareholders to hold out for the maximal gain. Certainly, this theoretical result is
extreme but offers a plausible explanation why most of the takeovers gains - as noted
in the previous section - accrue to target shareholders.
In practice, there are several ways of how to mitigate the free-rider problem in
takeovers, i.e. to increase the share of gains consummated by the bidder:
1. Post-takeover dilution of minority shareholders, for instance, in the form of a
two-tier offer where the second offer to remaining (minority) shareholders is
below the initial offer or, in the form, of self-serving asset transfers below fair
market values (Grossman/Hart (1980)).
2. Pre-takeover acquisition of a toehold (Shleifer/Vishny (1986) and
Chowdhry/Jegadeesh (1994)), i.e. the purchase of a company stake in the
market at pre-bid prices.
3. Financing the takeover with debt backed by the target’s assets and future cash
flows (Müller/Panunzi (2004)), the increase in debt lowers the post-takeover
share value (since debt is senior to equity) and thereby the shareholder’s
incentive to hold out.
4. Squeeze-out rights, i.e. the right to force remaining shareholders to sell their
shares (Yarrow (1985) and Amihud (2004)).
These mechanisms underline that takeovers of firms with a dispersed ownership
structure can be profitable for bidders. However, the empirical evidence presented in
the previous section illustrates that the upside is limited.
Most companies around the world do not have a widely dispersed but rather a
concentrated ownership structure. How does such an alternative ownership pattern
influence takeovers? This is a complex issue being driven by several factors which
may be categorized into bargaining and agency cost reasons.108 From a bargaining
view, the presence of a blockholder may help to mitigate the free-rider problem.
Bidders may start a takeover by directly approaching and negotiating with the
blockholder. In such bilateral private negotiations to gain an irrevocable commitment,
108 A comprehensive, meta-analysis of this topic is missing in the finance literature.
29
the bidder may be able to purchase a stake below the post-takeover value making the
takeover profitable and consequently more likely.109 Certainly, the ultimate price will
depend on how pivotal the blockholder stake is for the successful completion of the
transaction. However, since the free-rider problem has been shown to be of rather
minor importance in practice (Eckbo (2009)), the empirical chapters 3 and 4 of this
dissertation will rather not examine the blockholder structure from a bargaining view
but from an agency cost view. According to this view, there are three important
considerations. First, incumbent blockholders may already have actively engaged in
monitoring thereby making the target less attractive given their lower potential for
reducing agency costs, i.e. creating value. Second, blockholders may appropriate
substantial private benefits thereby making a takeover less likely since the target will
only be sold if the blockholder receives a premium which compensates her/him for the
foregone private benefits of control.110 Third, the monitoring and private benefit
incentives are likely to be determined not only by the size of the blockholder but also
by her/his identity.111 Overall, given these three rationales, it will be interesting to test
empirically how they affect the takeover decision by the private equity investor.
2.3 Private equity and buyouts
The following sections describe the private equity (PE) model with an emphasis on the
investment phase, i.e. buyouts. Section 2.3.1 introduces the reader to the private equity
terminology and briefly outlines the stylized roles of private equity investors over the
lifecycle of a fund. Section 2.3.2 focuses on the investment phase, i.e. buyouts. The
business model of private equity investors in terms of governance, operational and
109 Further, if the ownership block is sufficiently large, the raider may bypass the free-rider problem
altogether gaining instantaneous control. Cf. Wright/Weir/Burrows (2007) and Burkart/Panunzi (2008), pp. 17-18.
110 In many firms there is a violation of the one-share one-vote principle (Grossman/Hart (1988)) as the large shareholder holds more voting rights than cash flows rights. Hence, the potential for minority shareholder expropriation is substantial as the large shareholder has sufficient control to dominate the firm combined with relatively low ownership which reduces her/his direct cost from stealing the firm’s assets. Bebchuk (1999) predicts a positive relationship between control exercised by the large shareholder and the size of her/his private benefits. Barclay/Holderness (1989), Zingales (1994) and Dyck/Zingales (2004) provide empirical evidence in favour of such a relationship.
111 For a more detailed discussion, cf. section 3.2.1 and 4.2.1.
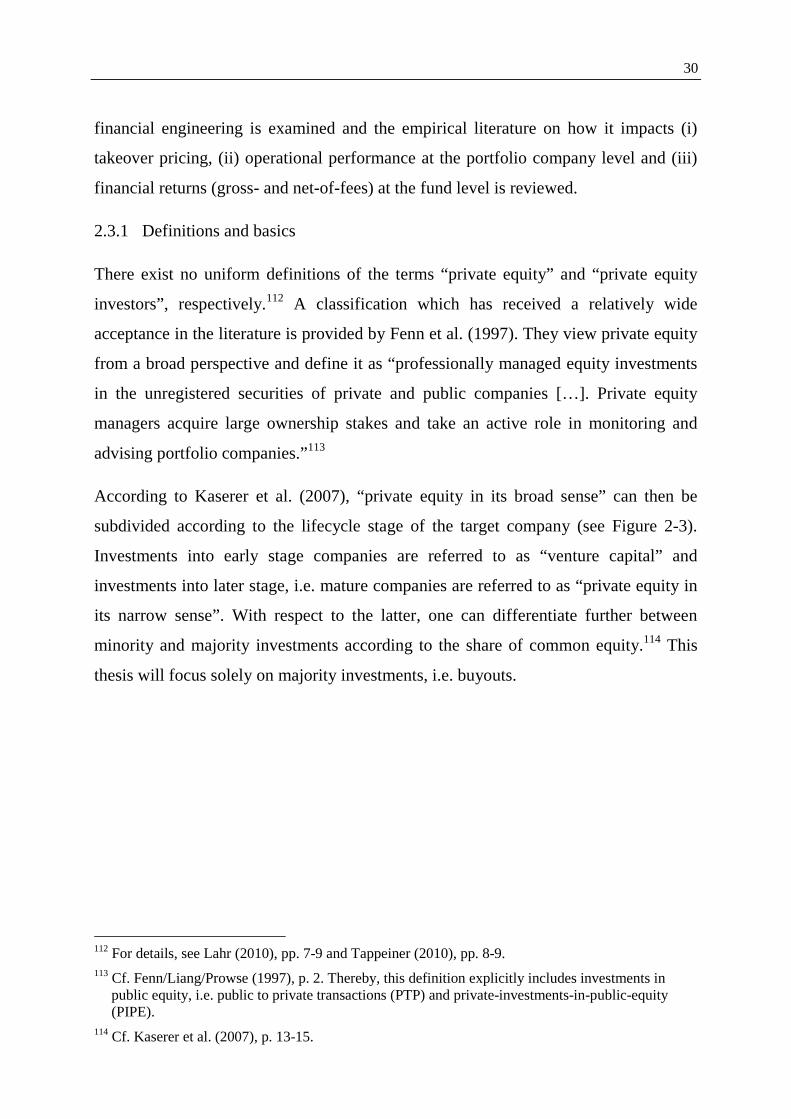
30
financial engineering is examined and the empirical literature on how it impacts (i)
takeover pricing, (ii) operational performance at the portfolio company level and (iii)
financial returns (gross- and net-of-fees) at the fund level is reviewed.
2.3.1 Definitions and basics
There exist no uniform definitions of the terms “private equity” and “private equity
investors”, respectively.112 A classification which has received a relatively wide
acceptance in the literature is provided by Fenn et al. (1997). They view private equity
from a broad perspective and define it as “professionally managed equity investments
in the unregistered securities of private and public companies […]. Private equity
managers acquire large ownership stakes and take an active role in monitoring and
advising portfolio companies.”113
According to Kaserer et al. (2007), “private equity in its broad sense” can then be
subdivided according to the lifecycle stage of the target company (see Figure 2-3).
Investments into early stage companies are referred to as “venture capital” and
investments into later stage, i.e. mature companies are referred to as “private equity in
its narrow sense”. With respect to the latter, one can differentiate further between
minority and majority investments according to the share of common equity.114 This
thesis will focus solely on majority investments, i.e. buyouts.
112 For details, see Lahr (2010), pp. 7-9 and Tappeiner (2010), pp. 8-9. 113 Cf. Fenn/Liang/Prowse (1997), p. 2. Thereby, this definition explicitly includes investments in
public equity, i.e. public to private transactions (PTP) and private-investments-in-public-equity (PIPE).
114 Cf. Kaserer et al. (2007), p. 13-15.
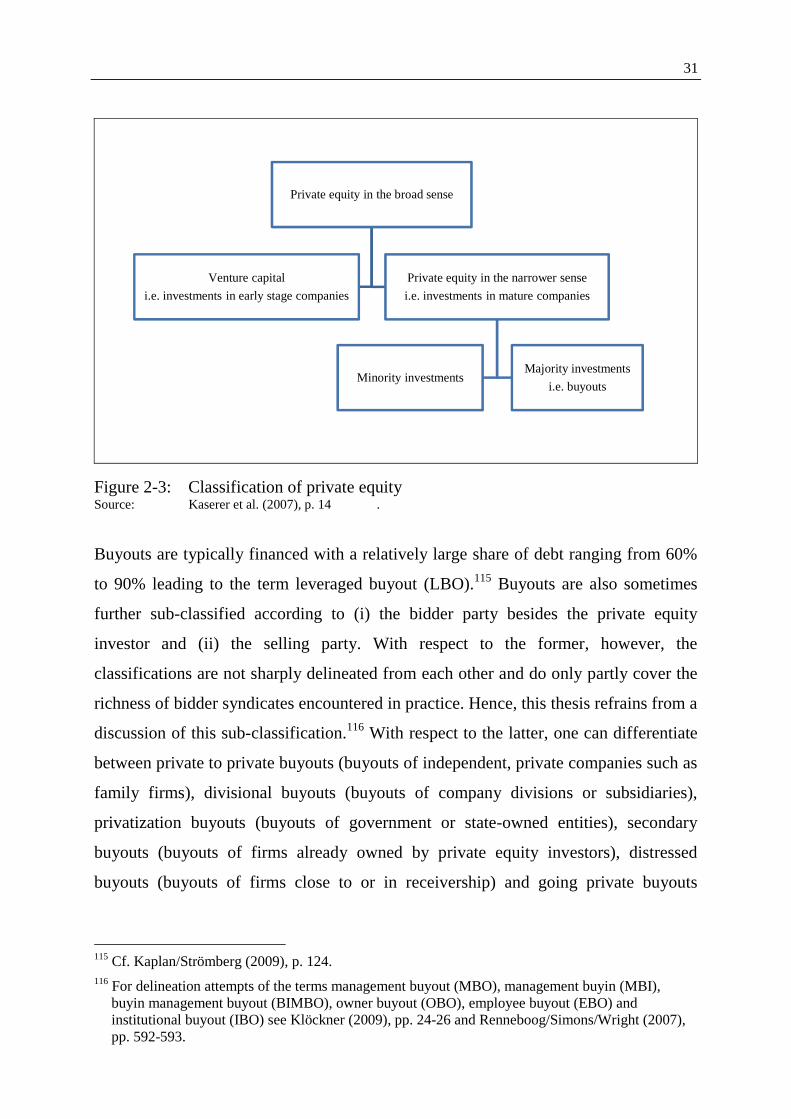
31
Figure 2-3: Classification of private equity Source: Kaserer et al. (2007), p. 14 .
Buyouts are typically financed with a relatively large share of debt ranging from 60%
to 90% leading to the term leveraged buyout (LBO).115 Buyouts are also sometimes
further sub-classified according to (i) the bidder party besides the private equity
investor and (ii) the selling party. With respect to the former, however, the
classifications are not sharply delineated from each other and do only partly cover the
richness of bidder syndicates encountered in practice. Hence, this thesis refrains from a
discussion of this sub-classification.116 With respect to the latter, one can differentiate
between private to private buyouts (buyouts of independent, private companies such as
family firms), divisional buyouts (buyouts of company divisions or subsidiaries),
privatization buyouts (buyouts of government or state-owned entities), secondary
buyouts (buyouts of firms already owned by private equity investors), distressed
buyouts (buyouts of firms close to or in receivership) and going private buyouts
115 Cf. Kaplan/Strömberg (2009), p. 124. 116 For delineation attempts of the terms management buyout (MBO), management buyin (MBI),
buyin management buyout (BIMBO), owner buyout (OBO), employee buyout (EBO) and institutional buyout (IBO) see Klöckner (2009), pp. 24-26 and Renneboog/Simons/Wright (2007), pp. 592-593.
Private equity in the broad sense
Venture capital
i.e. investments in early stage companies
Private equity in the narrower sense
i.e. investments in mature companies
Majority investments
i.e. buyoutsMinority investments

32
(buyouts of publicly listed companies).117 The empirical chapters of this dissertation
will focus on going private buyouts since ample and sharp market data is available for
the respective target companies. The drawback is that going private buyouts represent
a specific buyout type and the motives for such transactions may not be fully
congruent with the alternative buyout types.
Buyouts are executed by private equity investors (which are also referred to as private
equity firms). They are financial intermediaries, i.e. they raise capital from third
parties and invest it directly in portfolio companies. Generally, private equity investors
are organized as limited partnerships. The firm partners, who are referred to as general
partners (GPs), set up funds by collecting capital commitments from institutional
investors which thereby become limited partners (LPs) of the fund. Typically, the
funds have a closed-end structure with a finite lifetime of approximately 10 years.118
Figure 2-4 summarizes the stylized roles of private equity investors over the lifecycle
of a fund. In the fundraising stage (stage I), the GPs collect capital commitments from
LPs such as pension funds, endowments or insurance companies. During the
investment stage (stage II), portfolio companies are identified, financing is structured
and when a bid has been successful, value-increasing measures are implemented in the
portfolio company. In the divestment/exit stage (stage II), GPs sell portfolio companies
and distribute proceeds to investors.119 Since this dissertation focuses on the selection
and pricing of portfolio companies, the subsequent discussion will be limited to the
investment phase.
117 Cf. Axelson et al. (2010), p. 13 and Klöckner (2009), p. 25. 118 Cf. Metrick/Yasuda (2010), p. 2. 119 Cf. Achleitner (2002), p. 748 and Gompers/Lerner (2004) according to Tappeiner (2010), pp. 20-
21.
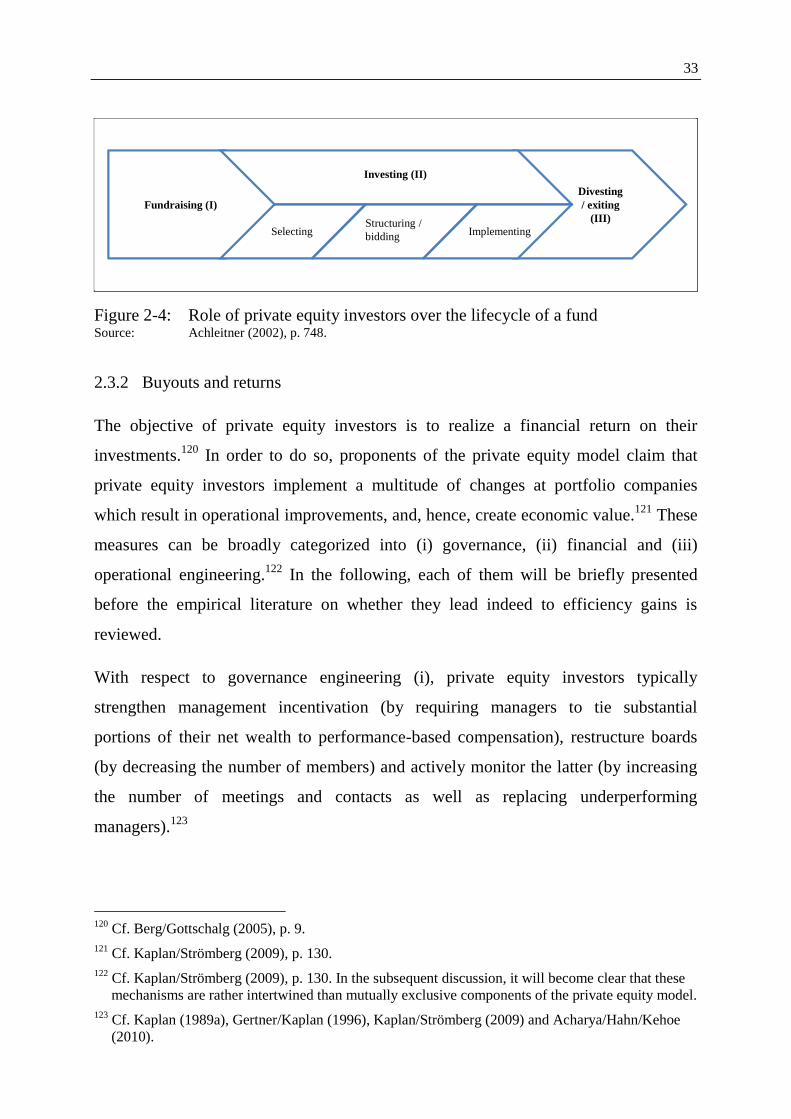
33
Figure 2-4: Role of private equity investors over the lifecycle of a fund Source: Achleitner (2002), p. 748.
2.3.2 Buyouts and returns
The objective of private equity investors is to realize a financial return on their
investments.120 In order to do so, proponents of the private equity model claim that
private equity investors implement a multitude of changes at portfolio companies
which result in operational improvements, and, hence, create economic value.121 These
measures can be broadly categorized into (i) governance, (ii) financial and (iii)
operational engineering.122 In the following, each of them will be briefly presented
before the empirical literature on whether they lead indeed to efficiency gains is
reviewed.
With respect to governance engineering (i), private equity investors typically
strengthen management incentivation (by requiring managers to tie substantial
portions of their net wealth to performance-based compensation), restructure boards
(by decreasing the number of members) and actively monitor the latter (by increasing
the number of meetings and contacts as well as replacing underperforming
managers).123
120 Cf. Berg/Gottschalg (2005), p. 9. 121 Cf. Kaplan/Strömberg (2009), p. 130. 122 Cf. Kaplan/Strömberg (2009), p. 130. In the subsequent discussion, it will become clear that these
mechanisms are rather intertwined than mutually exclusive components of the private equity model. 123 Cf. Kaplan (1989a), Gertner/Kaplan (1996), Kaplan/Strömberg (2009) and Acharya/Hahn/Kehoe
(2010).
Fundraising (I)Divesting/ exiting
(III)
Investing (II)
SelectingStructuring / bidding Implementing

34
With respect to financial engineering (ii), private equity investors finance acquisitions
with large shares of leverage usually ranging from 60% to 90%.124 Leverage is
intended to fulfil two beneficial roles. On the one hand, high interest and principal
payments shall limit managers’ discretion to dissipate free cash flows (Jensen (1986),
Jensen (1989)) and thereby enforce the governance role of private equity investors. On
the other hand, debt interest payments are tax deductible in most countries and,
thereby, can increase firm value up to the point where the marginal benefit of tax
savings equals the marginal cost of expected financial distress.125
With respect to operational engineering (iii), private equity investors draw on industry-
specific expertise to develop and implement operational value creation plans aiming at
increasing productivity (for instance via improving process efficiency or reducing
purchasing and/or overhead costs) and spurring (in-)organic growth (for instance via
new products, distribution channels and/or review of pricing).126
There is academic evidence that private equity investors employ these three
engineering mechanisms and thereby create efficiency gains at the portfolio company
level.
Starting with the motives for LBOs, there is support that private equity investors direct
bids at firms with (i) low managerial ownership,127 large free cash flows and low
growth opportunities128 which indicates the potential for governance and operational
124 For a detailed description of the financial structure of LBOs see Axelson et al. (2010). 125 Cf. Jensen (1986), Jensen (1989), Kaplan (1989b), Kaplan/Stein (1993), Axelson et al. (2010) and
Jenkinson/Stucke (2010). 126 Cf. Acharya/Hahn/Kehoe (2010). 127 Cf. Kaplan (1989a), Halpern/Kieschnick/Rotenberg (1999) and Acharya/Hahn/Kehoe (2010).
Halpern/Kieschnick/Rotenberg (1999) provide further evidence that companies with relatively high managerial share ownership are also more likely to be targeted by private equity investors. They argue that managers, who have invested a large share of their personal wealth in the company, tend to be more risk averse. In turn, increased risk aversion may hamper shareholder wealth and consequently shall increase the likelihood for an LBO.
128 Cf. Lehn/Poulsen (1989) and Opler/Titman (1993). However, Maupin/Bidwell/Ortegren (1984) and Halpern/Kieschnick/Rotenberg (1999) find no support in favor of Jensen’s (1989) free cash flow hypotheses and, hence, the evidence remains heterogeneous.
35
engineering and (ii) low leverage levels and high tax liabilities129 which points towards
the potential for financial engineering.130
Further, the vendors of going private buyout targets generally receive substantial
premiums in the range of 30 % to 55% over the market value of equity.131 Since public
shareholders are the residual claimants of the corporation after all other contractual
obligations have been meet, these gains are often interpreted in the sense that LBOs do
create value. This conclusion, however, is based on strong assumptions such as the
absence of redistribution and externalities as well as efficient stock markets.132 Hence,
shareholder wealth gains are only indicative of efficiency improvements.
If LBOs lead indeed to efficiency improvements, then the latter should be reflected in
improved operating performance following the buyout. There is widespread consensus
that this is the case. Irrespective of whether (i) performance is measured in terms of
operating margins, cash flow margins or total factor productivity, (ii) the buyout
sample under investigation stems from the US or Europe and (iii) took place in the
first or second buyout wave, the clear majority of studies reports performance
improvements in the phase under private equity ownership.133 A sensitive question,
129 Cf. Kieschnick (1998), Halpern/Kieschnick/Rotenberg (1999). 130 Moreover, there is also evidence that firms with low prior stock performance are more likely to
become LBO targets. This aggregate measure is, however, difficult to interpret: it may be that it indicates a low capital market visibility of target companies, superior target picking skills of private equity investors (with an excellent network in the financial industry) or, more generally, simply unobserved value creation potential not controlled for in the analysis. Further, the overall ownership structure has been shown to influence the takeover likelihood. Weir/Laing/Wright (2005) stresses the monitoring role of institutional investors, Achleitner et al. (2011 forthcoming) the deterring impact of private benefits of incumbent owners and Wright/Weir/Burrows (2007) the importance of irrevocable commitments.
131 Most notably DeAngelo/DeAngelo/Rice (1984), Kaplan (1989a), Lehn/Poulsen (1989), Bargeron et al. (2008) and Jenkinson/Stucke (2010). Further studies are Lowenstein (1985), Torabzadeh/Bertin (1987), Amihud (1989), Kaplan (1989a), Kaplan (1989b), Marais/Schipper/Smith (1989), Asquith/Wizman (1990), Frankfurter/Gunay (1992), Lee (1992), Harlow/Howe (1993), Slovin/Sushka (1993), Travlos/Cornett (1993), Easterwood et al. (1994), Betzer (2006), Andres/Betzer/Weir (2007), Renneboog/Simons/Wright (2007), Achleitner/Hinterramskogler (2008), Cao/Lerner (2009), Guo/Hotchkiss/Song (2011 forthcoming), Officer/Ozbas/Sensoy (2010) and Achleitner et al. (2011 forthcoming).
132 Cf. Burkart/Panunzi (2008), p. 8. 133 Cf. Kaplan (1989a), Lichtenberg/Siegel (1990), Smith (1990), Wright/Wilson/Robbie (1996),
Desbrieres/Schatt (2002), Harris/Siegel/Wright (2005), Bergström/Grubb/Jonsson (2007), Weir/Jones/Wright (2008a), Guo/Hotchkiss/Song (2011 forthcoming), Acharya/Hahn/Kehoe (2010)
36
more from a political rather than an economic point of view, is whether these
operational performance improvements may have been achieved by lowering wages
and cutting jobs. Academic evidence on the impact of private equity on employment is
heterogeneous.134 When focused on recent, large sample empirical evidence, it seems
that “buyout target firms become strategically more focused, which lead to existing job
loss where inefficiency existed, and at the same time result in focused expansions and
job creations in areas of their core strengths.”135
The documented efficiency gains coupled with market timing skills of private equity
investors136 lead on average to deal level returns above the large takeover premiums
paid. Based on the hitherto largest database of 7,500 worldwide investments over the
last 40 years, Lopez de Silanes et al. (2011) report a median investment internal rate
of return (IRR) (public market equivalent (PME)) of 21% (1.3). The return variance is,
however, high: every tenth portfolio company becomes insolvent and every fourth
earns an IRR above 50%.137
These positive investment level returns do not necessarily translate into positive
returns for the limited partners (LPs) due to the layer of fees charged by the general
partners (GPs). GP compensation usually includes a fixed component which basically
consists of the so-called management fee and a variable component which largely
and Boucly/Sraer/Thesmar (2011 forthcoming). The studies of Guo/Hotchkiss/Song (2011 forthcoming) and Weir/Jones/Wright (2008a) find only a modest increase in operating performance.
134 Cf. Kaplan (1989a), Lichtenberg/Siegel (1990), Amess/Wright (2007a), Amess/Wright (2007b), Davis et al. (2008) and Bernstein et al. (2010) for empirical work and Achleitner/Lutz (2009) for a comprehensive literature review on this topic.
135 Cf. Metrick/Yasuda (2011 forthcoming), p. 18. Further concerns are that the improved operating performance may have been caused at the cost of future performance, i.e. cutbacks in research and development as well as capital expenditures. Cao/Lerner (2009) report evidence that reverse LBOs consistently outperform other initial public offerings (IPO) and Sorensen/Stromberg/Lerner (2011 forthcoming) show that private equity backed companies do not decrease investments in innovation as measured by patenting. Consequently, the improved operating performance of buyout portfolio companies seems not to be caused by cutbacks in investments which would hurt future performance. However, more research is needed before a final conclusion can be drawn.
136 Both in terms of multiple expansion and arbitrage of capital market mispricing (Axelson et al. (2010)).
137 Cf. Achleitner et al. (2010) for alternative evidence.
37
consists of the so-called carried interest. 138 The annual management fee is intended to
cover the costs of running the fund. It typically amounts to 2% of committed capital
during the investment period and decreases thereafter (either by lowering the fee
percentage itself, switching the fee basis from committed to invested capital, or both).
The carried interest is intended to create sharp incentives for the GPs to maximize their
efforts. It typically amounts to 20% of the profits (carry level) earned on committed
capital (carry basis) compounded with a preferred return to LPs of about 8% (carry
hurdle). From a timing perspective, the most common arrangement is that cash flows
accrue exclusively to LPs until the hurdle is reached, GPs are then entitled to claim all
proceeds until their relative profit share equals 20%, and thereafter, each additional
dollar gain is split 20/80 between both parties.139
This compensation arrangement indicates that gross and net-of-fees fund returns may
substantially deviate from each other. Kaplan/Schoar (2005) and Phalippou/Gottschalg
(2009) examine the Thomson Venture dataset and provide fund level evidence that this
is indeed the case. Phalippou/Gottschalg (2009), who extend Kaplan/Schoar (2005) by
adjusting for sample selection, self-reporting and weighting issues, report that private
equity funds140 outperform public equity markets (S&P 500) by 3% in terms of gross
performance. When fees are netted out, however, the relationship turns and private
equity funds underperform public equity markets by 3%. Moreover, additional risk
adjustments lower performance by a further 3% resulting in an overall net-of-fees
alpha of -6%. Consequently, the evidence indicates that private equity funds do not
earn risk-adjusted returns for their investors. This picture would be even more
pronounced if one would additionally factor in an illiquidity discount of the asset class.
138 Cf. Metrick/Yasuda (2010). Transaction fees represent a further fixed compensation component
whereas monitoring fees is a further variable compensation component. 139 Cf. Axelson/Strömberg/Weisbach (2009), p. 1571. Consequently, the incentivation package
represents an option-like claim on fund returns and may induce GPs to excessive risk taking, particularly in the final stages of a fund’s lifecycle.
140 It is important to note that Phalippou/Gottschalg (2009)’s sample includes both buyout and venture capital funds.

38
2.4 Summary
Chapter 2 provides the framework which the three subsequent empirical chapters will
be built upon. Section 2.2 introduces agency theory and corporate governance as the
central tenets of this thesis. With respect to the latter tenet, a systematic overview of
the governance mechanisms available to mitigate the classical manager-financier
agency conflict is given. Further, it is presented how these individual governance
mechanisms interact in the two dominant corporate governance systems, the
continental European and Anglo-Saxon model. Thereby, the meta-framework for the
empirical studies of the thesis is established since chapter 3 and 4 examine LBOs in
the continental European environment while chapter 5 investigates LBOs in the US
setting. Section 2.2 details the level of analysis by discussing takeovers, a governance
mechanism, as the key object of this thesis. Following a rigorous review of the
literature, it is first shown that takeovers confer modest efficiency gains. Further, it is
assessed how the ownership structure affects takeovers. Thereby, the framework for
the empirical analyses is sharpened which will focus on LBOs in continental Europe
where targets are closely held (chapter 3 and 4) and the US where targets are widely
held (chapter 5). Finally, section 2.3 narrows down the chapter to the very research
object of this study: takeovers through private equity investors, i.e. LBOs. The private
equity model is presented and it is shown the current state of research suggests that
LBOs create value at the portfolio level but returns to the limited partners are, on
average, not positive due to the layer of fees charged by general partners.
39
3 Investment Criteria of Private Equity Investors in Continental Europe141
3.1 Introduction
Private equity investors are believed to create value in the companies they acquire
through financial, governance and operational engineering Kaplan/Strömberg (2009).
More precisely, the former restructure companies suffering from suboptimal capital
structure, managerial incentives that are misaligned with shareholders’ interests, a lack
of monitoring, operational inefficiencies and/or suboptimal strategic positioning. The
definition of a private equity transaction adopted in this chapter is based on Weir et al.
(2008a). Such a transaction consists of the acquisition of a publicly quoted company,
usually by an unlisted company specifically set up for the purpose of the deal (Jensen
(1993)). The bid often takes the form of a leveraged buyout (LBO) involving mainly
debt financing. Contrary to other empirical studies, such as Halpern et al. (1999) who
focus on management buy-outs (MBOs), this chapter studies those transactions that are
sponsored by private equity investors not related to the management and, in particular,
the motives behind these transactions.142
Studies based on Anglo-Saxon capital markets suggest that firms are more likely to be
the target of a going private transaction if (1) managers’ incentives are misaligned with
stockholder interests (Halpern et al. (1999)), (2) they underperform relative to the
141 A previous version of this chapter, which is joint work with Ann-Kristin Achleitner and André
Betzer, circulates under the title “Private Equity Investors as Corporate Governance Mechanism in Continental Europe”. It was awarded the best paper prize at the “7th International Conference on Corporate Governance” (Birmingham). Further, it was also presented at the “European Financial Management Symposium on Corporate Governance and Control” (Cambridge). The current version of the chapter, which is joint work with Ann-Kristin Achleitner, André Betzer and Marc Goergen, is forthcoming in the European Financial Management Journal under the title “Private Equity Acquisitions of Continental European Firms: the Impact of Ownership and Control on the Likelihood of Being Taken Private”. The publisher John Wiley & Sons grants the right to reuse own articles: “AUTHORS - If you wish to reuse your own article (or an amended version of it) in a new publication of which you are the author, editor or co-editor, prior permission is not required (with the usual acknowledgements)”. Cf. http://onlinelibrary.wiley.com/journal/10.1111/%28ISSN% 291468-036X/homepage/Permissions.html, last accessed on 20 April 2011. See also Appendix A.
142 While e.g. Halpern et al. (1999) analyse both pure MBOs (i.e. MBOs that do not involve financing by other parties such as private equity investors) and those which are financed jointly by the management and private equity investors, we include the latter but not the former. In other words, our sample includes only those acquisitions involving private equity funding.
40
stock market (Halpern et al. (1999)), (3) they have unused debt tax shields (Kieschnick
(1998) and Halpern et al. (1999)), (4) they are characterized by high institutional
ownership (Weir et al. (2005)) and (5) acquirers are able to obtain irrevocable
commitments from existing small-block holders (Wright et al. (2007)). There is also
some weak evidence suggesting that firms with large free cash flows and low growth
opportunities are more likely targets of going private transactions (Lehn/Poulsen
(1989) and Opler/Titman (1993)).
While the private equity market in the UK and the US has a long history, private
equity funds have only recently emerged in continental Europe. Recent transactions
include Barclays Private Equity’s €104 million buyout of the German information
technology (IT) wholesaler Computerlinks and Candover’s €1,500 million deal of the
Dutch industrial group Stork NV. Anecdotal evidence suggests that the continental
European private equity market is likely to grow further over the next years as there is
clearly still more appetite for continental European firms. For example, in a recent
survey among international private equity fund managers by PricewaterhouseCoopers
(PwC), the majority of the managers explicitly stated that their funds “view Western
Europe as most attractive for future investment.”143
There are as yet no empirical studies on the motives behind continental European
private equity sponsored going private transactions (Renneboog et al. (2007)). Given
that corporate governance in continental Europe differs markedly from that in the UK
and US (Faccio/Lang (2002) and Drobetz et al. (2004)), the motives for private equity
transactions and the characteristics of targets are also likely to be very different. The
most important difference concerns ownership and control. The stake owned by the
main blockholder in our continental European private equity targets is approximately
twice as large as in Anglo-American targets. Indeed, Renneboog et al. (2007) show
that the dominant shareholder (at the first tier) in the average (median) Anglo-
American firm owns 23.5% (18.7%) whereas in our sample the dominant shareholder
143 Cf. Scholich/Burton (2010), p. 9.
41
(at the first tier) in the average (median) firm owns 43.5% (37.5%) of the votes.144
Given the size of their stake, these large shareholders are likely to have the right
incentives to monitor the management. If the large shareholder monitors the
management, this is likely to make the firm less attractive to private equity investors
given that there is less potential for value creation by the latter. Conversely, a large
shareholder who is not able to monitor the management, maybe because of a lack of
skills, may be more intent on selling her/his firm to private equity investors. Given the
monitoring of management undertaken by the large shareholder, such firms are
unlikely to attract private equity investors’ intent on improving a firm’s corporate
governance. Further, strong control may also generate costs as the large shareholders
may use their control rights to their own benefit and extract private benefits of control.
As a result, private equity investors may avoid companies, whose controlling
shareholders extract private benefits of control and are only willing to sell their stakes
at a premium which is high enough to compensate them for the loss of their benefits.
This chapter contributes to the private equity literature in the following ways. First, it
contributes to the as yet limited literature (see e.g. Andres et al. (2007),
Achleitner/Hinterramskogler (2008), Achleitner et al. (2011 forthcoming) and
Geranio/Zanotti (2011 forthcoming)) on private equity transactions outside Anglo-
Saxon countries. Whereas previous studies mainly focus on the wealth effects of going
private transactions or LBOs145 and their determinants, this chapter investigates the
motivation of private equity investors to acquire target firms.146
Second and more importantly, this chapter analyses the role of private equity investors
in the continental European market which is characterized by very different corporate
governance compared to Anglo-Saxon countries. Given the concentration of control,
144 At the ultimate level, the dominant shareholder in the average (median) firm owns 50.4% (48.0%)
of the votes. 145 Croci (2007) is the first study investigating the corporate governance role of active investors
(“corporate raiders”) in continental Europe. He examines whether corporate raiders are governance champions by looking at their post-acquisition interventions and their impact on the target firms’ stock price performance.
146 Another study by Cumming/Zambelli (2010) examines the effect of a regulatory change in Italy on the deal structure of Italian leverage buyout transactions.

42
the incumbent large shareholder may monitor the firm’s management and/or extract
private benefits of control from the firms. In turn, monitoring and the extraction of
private benefits by the large shareholder are likely to have an impact on the firm’s
attractiveness to private equity investors. In this context, Andres et al. (2007) find that
wealth effects of LBOs are larger in countries with a weaker protection of minority
shareholders’ interests.
Third, this chapter finds further evidence about the types of large shareholders that are
likely to monitor the management and those that are unlikely to oversee the activities
of the latter. The existing literature on the types of shareholders that are active rather
than passive is as yet sparse and does not provide consistent conclusions.
Fourth, unlike previous studies on going private transactions, this chapter clearly
distinguishes between the tax advantage and the disciplinary role of leverage. We find
evidence in favour of both roles of leverage.
Our logistic regressions, which predict the likelihood of a company becoming the
target of a private equity acquisition, provide strong evidence that the monitoring of
the management and the private benefits of control enjoyed by the large shareholder
are important factors determining the investment decision of private equity managers
in continental Europe. We find strong evidence that the likelihood of a firm being
taken over by a private equity investor decreases if it has a large shareholder with
strong monitoring incentives as measured by the latter’s percentage of cash flow
rights. We also find consistent evidence that firms with large shareholders who enjoy
substantial private benefits of control – as measured by the votes they hold and the
difference between the votes and the cash flow rights they own – are less likely to be
acquired by a private equity firm. Hence, there is strong evidence that it is important to
take into account ownership and control when studying the motives of private equity
investors operating in continental Europe. As stated above, we also find support that
the tax benefit from increasing leverage and the bonding role of further leverage
influence the likelihood of a firm being acquired by a private equity investor. In
addition, we also find that firms with illiquid shares are more likely to be the targets of
private equity investors.
43
The chapter proceeds as follows. Section 3.2 reviews the related theoretical and
empirical literature and derives the hypotheses. Section 3.3 discusses the sampling
process, the selection of the control sample of non-acquired firms, the logit
methodology and the definition of the variables. The empirical results and their
interpretations are presented in section 3.4. Finally, the last section 3.5 summarizes
and concludes.
3.2 Literature review and hypotheses
This section reviews the likely motives of a private equity investor for taking private a
public company. It starts with the motives that refer predominantly to the blockholder-
dominated corporate governance system of continental Europe followed by the
traditional motives that have been highlighted in previous work on the Anglo-Saxon
markets. Based on the review of these motives, a series of testable hypotheses is
developed.
3.2.1 Motives applying to blockholder-dominated corporate governance systems
Apart from Maupin et al. (1984) and Weir et al. (2005), studies investigating how
private equity investors choose their targets have typically ignored ownership and
control. In any case, given that these studies are based on Anglo-Saxon private equity
transactions, they are not able to analyse the motives that may be generated by the
existence of a large shareholder in the target firm. This study intends to fill this gap. In
what follows, it is argued that concentrated ownership and control influence private
equity transactions via the monitoring incentives and the private benefits of control of
the large shareholder.
3.2.1.1 Monitoring incentives
A shareholder’s incentive to overcome the traditional free-rider problem and to engage
in active monitoring of the management increases with her/his equity stake in the
company (Jensen/Meckling (1976)). Hence, companies being monitored by a large
shareholder are expected to be run more efficiently by their management and should
therefore be less attractive targets for private equity investors, given their lower
potential for reducing agency costs and thereby creating value.
44
H1 (monitoring): The probability of a firm being taken over by a private equity
investor decreases if there is an active, monitoring shareholder.
As a proxy for the largest blockholder’s monitoring incentives, her/his ownership stake
is taken. In other words, the higher the amount of her/his own wealth the blockholder
has invested in the company, the higher is the likelihood that the company is being
monitored by the latter and the lower is the likelihood that the company will be
targeted by private equity investors who intent to reduce agency costs.
3.2.1.2 Private benefits of control
Many continental European companies have a dominant, large shareholder
(Faccio/Lang (2002)). This pattern is also observed for our sample as roughly 71% of
the firms have a shareholder controlling more than 25% of the voting rights. In
addition, in 39% of the firms there is a violation of the one-share one-vote principle
(Grossman/Hart (1988)) as the large shareholder holds more voting rights than cash
flows rights. Hence, the potential for minority shareholder expropriation is substantial
as the large shareholder has sufficient control to dominate the firm combined with
relatively low ownership which reduces her/his direct cost from stealing the firm’s
assets.
Bebchuk (1999) predicts a positive relationship between control exercised by the large
shareholder and the size of her/his private benefits. Barclay/Holderness (1989),
Zingales (1994) and Dyck/Zingales (2004) provide empirical evidence in favour of
such a relationship. The potential for extracting private benefits of control from the
firm implies that the blockholder will only sell her/his stake to a private equity investor
if he receives a premium which compensates her/him for the foregone private benefits
of control (Bebchuk (1999)). Hence, we argue that private equity investors avoid
companies with large shareholders who enjoy substantial private benefits of control.
H2 (private benefits): Companies with large shareholders who enjoy private benefits
of control are less likely to be the target of private equity investors.

45
3.2.1.3 Types of large shareholders
In the empirical analysis in section 3.4, we also distinguish between various types of
large shareholders such as families and corporations. We find that it is important to
take into account the type of the large shareholder as the monitoring incentives and
private benefits of control only have an impact on the likelihood of a private equity
transaction for some of these types.
Connelly et al. (2010) review the existing empirical research on the impact of different
types of large shareholders. They find that family shareholders, except for founder-
CEOs, typically do not create shareholder value as they tend to look after their own
interests rather than those of the entire body of shareholders. Corporations as large
shareholders are “a mixed blessing” (Connelly et al. (2010), p.7). On one side, they
may provide additional funding to the firm, thereby increasing the growth of the latter.
On the other side, they may expropriate some of the firm’s resources. Further, while
there is still some theoretical uncertainty about the impact of government ownership,
most of the empirical literature finds a negative impact.
As banks are an important type of large shareholder in Germany, most of the existing
empirical literature on the role of banks studies the German economy. However, the
evidence remains inconclusive. Emmons/Schmid (1998), Cable (1985),
Gorton/Schmid (2000b), Gorton/Schmid (2000a), Lehmann/Weigand (2000) and
Köke/Renneboog (2005) find that banks as large shareholders have a positive impact
on firm performance. However, Edwards et al. (2000) find that this effect only holds
for the “3 big banks”. In complete contrast, Agarwal/Elston (2001) and
Chirinko/Elston (1998) do not find any statistically significant differences between the
profitability of bank- and non-bank controlled firms. Further, Januszewski et al. (2002)
report that firms controlled by banks experience lower growth in productivity than
other firms.
Finally, Banerjee et al. (1997) analyse whether French holding companies, which are
the main type of large shareholder in France, create shareholder value. Their results
suggest that holding companies reduce rather than increase financial performance.
46
To summarize, we expect that families are unlikely to monitor their firms, but are
likely to extract private benefits of control. While the monitoring role of corporations
has not yet been confirmed, some of the evidence suggests that this type of large
shareholder may also extract private benefits of control from their firms. Governments
tend to be weak monitors and finally the jury is still out on whether banks are good
monitors or not.
3.2.2 Traditional motives
In addition to monitoring incentives and private benefits of control, there are other
reasons that may determine the likelihood of a firm becoming the target of a private
equity investor. According to the existing literature, these motives are inadequate
incentivisation of the managers, a suboptimal capital structure, risk and illiquid
shares.147
3.2.2.1 Managerial incentives148
Jensen/Meckling’s (1976) seminal paper describes the conflicts of interest between
owners and managers that may occur in large corporations as the result from the
separation of ownership and control. These conflicts are caused by the misalignment
of managers’ interests with those of the owners or shareholders. One way of
realigning managers’ interests with those of the shareholders is via managerial share
ownership. In relation to the latter, Halpern et al. (1999) find empirical evidence that
companies are more likely to be targets of private equity transactions if they have
either relatively low or relatively high managerial share ownership. They justify this
result as follows.
147 The existing literature also frequently considers the firm’s valuation as a motive. In particular,
firms with poor corporate governance or poor visibility may suffer from undervaluation and may hence be more likely targets. This section does not include a hypothesis based on the firm’s valuation for two reasons. First, we already take into account the firm’s corporate governance (via the monitoring incentives and the private benefits of control of the large shareholder) and the firm’s visibility (via the stock liquidity). Second, we also conduct robustness checks which do not suggest that the firm’s valuation has a significant impact on the likelihood of the firm being taken over by a private equity investor.
148 In what follows, we consider managers to be professional managers, i.e. they are not identical to the large shareholder. We shall return to this issue in section 3.3.3.2.

47
Low (or no) managerial ownership causes managerial decisions to be based on
distorted incentives because most of the benefits from acting in the best interest of the
shareholders are not received by the managers but by the latter. Therefore, private
equity firms typically require management teams to invest a substantial amount of
their own wealth in the company through stocks. This results in a much improved
incentive structure as managers now face not only the equity downside, but also the
upside (Kaplan/Strömberg (2009)).149
However, relatively high managerial ownership can also be harmful to outside
shareholders as managers, who have invested a large share of their personal wealth in
the company, tend to be more risk averse than the former. In turn, managers’ attitude
towards risk has a negative impact on shareholder wealth (May (1995) and Halpern et
al. (1999)). Empirical studies on the relationship between managerial stockholdings
and firm performance document a negative effect of the former on the latter when
managerial ownership is high. Among those studies are Morck et al. (1988) and
McConnell/Servaes (1990) for the US and Short and Short/Keasey (1999) and Weir et
al. (2002) for the UK.
We therefore expect a nonlinear relationship between the level of managerial
ownership and the likelihood of the firm being taken over by a private equity firm. In
other words, we expect that private equity investors are particularly keen on firms with
very little managerial ownership as well as those with high managerial ownership as
both types of firms suffer from a misalignment of managers’ interests with those of the
other shareholders.
H3 (management): Private equity firms are more likely to invest in companies with
relatively low or relatively high managerial ownership.
149 There is only one case in our sample where the percentage of votes held by the management is
different from its percentage of cash flow rights. The difference is also very small (5.38% versus 4.88%). Hence, in what follows we do not make a difference between managerial control and managerial ownership and use the latter term to refer to both.
48
3.2.2.2 Leverage
According to the seminal work of Modigliani/Miller (1958), capital structure decisions
are irrelevant for the value of the firm when capital markets are perfect. However, if
the assumptions behind perfect capital markets are relaxed, leverage may have a
positive impact on firm value via the tax shield debt generates. Furthermore, more debt
financing commits more of the cash flows, thus preventing managers from wasting
resources on negative net present value projects.150 Both reasons may explain the high
debt ratios of 60% to 90% observed in private equity deals over the period of 1997 to
2007 (see e.g. Kaplan/Strömberg (2009) and Axelson et al. (2010)). We shall elaborate
on both points below.
Tax benefit from leverage:
As is the case in the UK and the US, in continental Europe interest payments lower the
firm’s tax liability as they are charged to profits before corporate tax. Based on the
assumption that the firm is in a positive tax bracket, Modigliani/Miller (1963) show
that a rise in leverage increases shareholder value. Typically, private equity investors
increase leverage to benefit from higher tax shields. Thus, we expect private equity
targets to have low leverage ratios and large tax liabilities. With regard to the former,
Halpern et al. (1999) and Weir et al. (2008b) provide limited evidence that going
private targets in the UK and US have lower debt ratios before taken over than other
firms. With regard to tax liabilities, the empirical evidence is mixed. On the one hand,
Lehn/Poulsen (1989), Kieschnick (1998) and Weir et al. (2005) find no significant
influence of firm’s tax liabilities on the likelihood of being taken private. On the other
hand, Lowenstein (1985), Kaplan (1989b) and Halpern et al. (1999) identify tax
liabilities as one of the most important reasons for firms being targeted by private
equity investors.
H4 (tax benefit from leverage): The likelihood of being taken over by a private equity
investor is higher for companies with low leverage ratios and high tax liabilities.
150 However, this advantage comes at the cost of increased bankruptcy risk.
49
Bonding benefit from leverage:
Those who view private equity as a superior organizational form, such as Jensen
(1986), argue that the increase in leverage via going private transactions is driven by
the desire to reduce wastage of free cash flows. In other words, debt can be seen as a
corporate governance mechanism that brings greater discipline to the management
(Wright/Robbie (1998)). Thus, we expect private equity targets to have high debt
capacity as evidenced by low leverage and a high potential for wastage by the
management as evidenced by high levels of free cash flows. As stated above, there is
some limited evidence that a low debt ratio increases the likelihood of the firm being
taken over by a private equity investor. With regard to free cash flows, the evidence is
more ambiguous. Lehn/Poulsen (1989), Singh (1990) and Opler/Titman (1993) find
support for the free cash flow hypothesis whereas Servaes (1994), Kieschnick (1998),
Halpern et al. (1999) and Weir et al. (2005) do not find any support.
H5 (bonding advantage of leverage): Private equity investors prefer taking over
companies with low leverage and high free cash flow levels.
3.2.2.3 Risk
As outlined in the aforementioned discussion, private equity acquisitions are typically
financed by a substantial amount of debt. This results in a higher proportion of the
firm’s cash flows being committed to servicing the debt. Hence, private equity
investors prefer companies with high debt capacity, i.e. those with predictable and
stable cash flows. The less volatile a firm’s cash flows, the more likely it will be a
target for private equity investors.
H6 (risk): Private equity investors are more likely to take over companies with stable
cash flows.
50
3.2.2.4 Stock liquidity
We also assume that firms with low visibility, i.e. low stock liquidity are more likely
to accept a takeover offer by a private equity investor.151 The reason is that low
visibility impairs firms from reaping the benefits of a listing, such as raising relatively
cheap capital (Boot et al. (2008)). Taking into account the substantial listing and
compliance costs, such firms may be more inclined towards accepting the opportunity
of going private offered by a private equity investor.
H7 (stock liquidity): The likelihood of a firm being taken over by a private equity
investor is negatively related to the liquidity of its stock.
151 The question arises as to whether stock liquidity is just a proxy for concentrated ownership and
control. However, the correlation between liquidity and the percentage of voting rights (cash flow rights) held by the ultimate controlling shareholder is only -0.27 (-0.28).
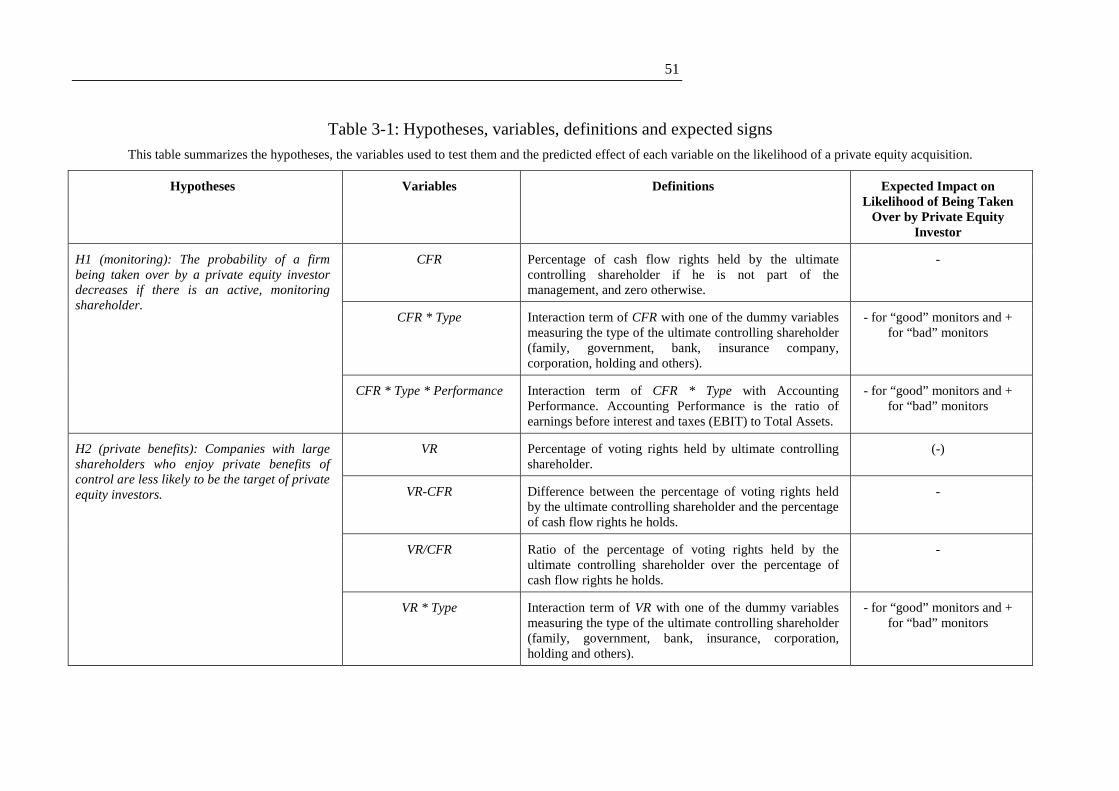
51
Table 3-1: Hypotheses, variables, definitions and expected signs
This table summarizes the hypotheses, the variables used to test them and the predicted effect of each variable on the likelihood of a private equity acquisition.
Hypotheses Variables Definitions Expected Impact on Likelihood of Being Taken
Over by Private Equity Investor
H1 (monitoring): The probability of a firm being taken over by a private equity investor decreases if there is an active, monitoring shareholder.
CFR Percentage of cash flow rights held by the ultimate controlling shareholder if he is not part of the management, and zero otherwise.
-
CFR * Type Interaction term of CFR with one of the dummy variables measuring the type of the ultimate controlling shareholder (family, government, bank, insurance company, corporation, holding and others).
- for “good” monitors and + for “bad” monitors
CFR * Type * Performance Interaction term of CFR * Type with Accounting Performance. Accounting Performance is the ratio of earnings before interest and taxes (EBIT) to Total Assets.
- for “good” monitors and + for “bad” monitors
H2 (private benefits): Companies with large shareholders who enjoy private benefits of control are less likely to be the target of private equity investors.
VR Percentage of voting rights held by ultimate controlling shareholder.
(-)
VR-CFR Difference between the percentage of voting rights held by the ultimate controlling shareholder and the percentage of cash flow rights he holds.
-
VR/CFR Ratio of the percentage of voting rights held by the ultimate controlling shareholder over the percentage of cash flow rights he holds.
-
VR * Type Interaction term of VR with one of the dummy variables measuring the type of the ultimate controlling shareholder (family, government, bank, insurance, corporation, holding and others).
- for “good” monitors and + for “bad” monitors
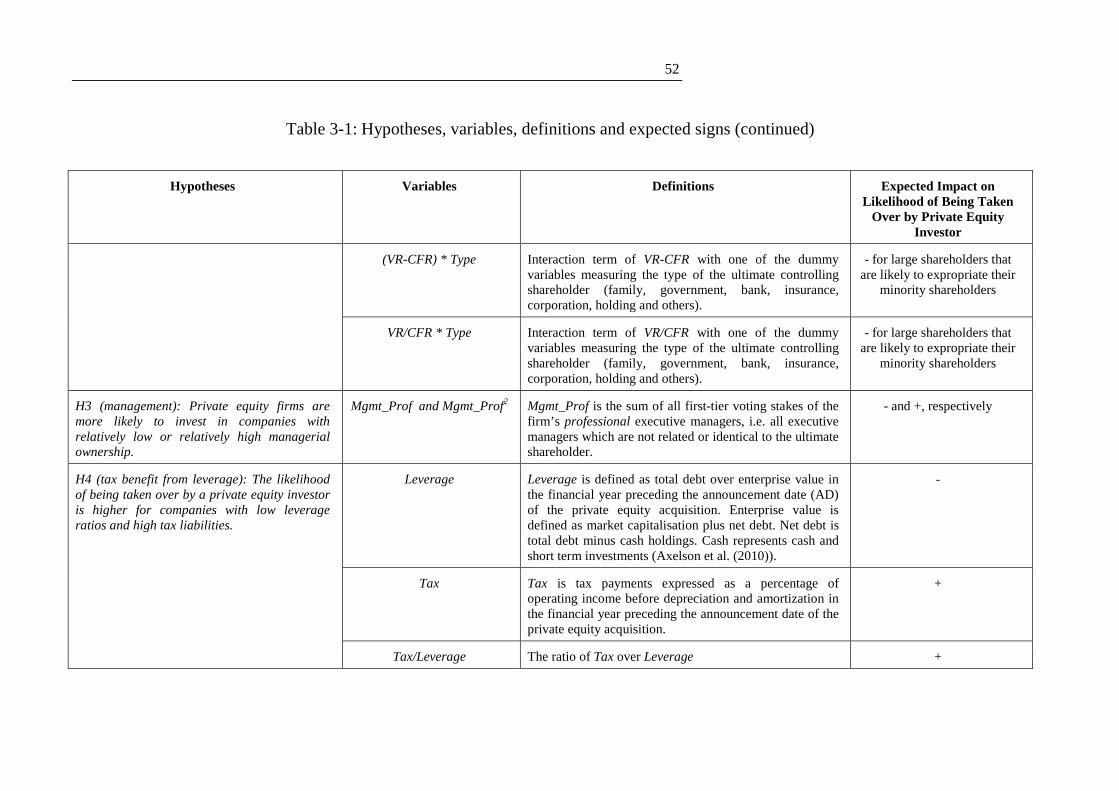
52
Table 3-1: Hypotheses, variables, definitions and expected signs (continued)
Hypotheses Variables Definitions Expected Impact on Likelihood of Being Taken
Over by Private Equity Investor
(VR-CFR) * Type Interaction term of VR-CFR with one of the dummy variables measuring the type of the ultimate controlling shareholder (family, government, bank, insurance, corporation, holding and others).
- for large shareholders that are likely to expropriate their
minority shareholders
VR/CFR * Type Interaction term of VR/CFR with one of the dummy variables measuring the type of the ultimate controlling shareholder (family, government, bank, insurance, corporation, holding and others).
- for large shareholders that are likely to expropriate their
minority shareholders
H3 (management): Private equity firms are more likely to invest in companies with relatively low or relatively high managerial ownership.
Mgmt_Prof and Mgmt_Prof2
Mgmt_Prof is the sum of all first-tier voting stakes of the firm’s professional executive managers, i.e. all executive managers which are not related or identical to the ultimate shareholder.
- and +, respectively
H4 (tax benefit from leverage): The likelihood of being taken over by a private equity investor is higher for companies with low leverage ratios and high tax liabilities.
Leverage Leverage is defined as total debt over enterprise value in the financial year preceding the announcement date (AD) of the private equity acquisition. Enterprise value is defined as market capitalisation plus net debt. Net debt is total debt minus cash holdings. Cash represents cash and short term investments (Axelson et al. (2010)).
-
Tax Tax is tax payments expressed as a percentage of operating income before depreciation and amortization in the financial year preceding the announcement date of the private equity acquisition.
+
Tax/Leverage The ratio of Tax over Leverage +

53
Table 3-1: Hypotheses, variables, definitions and expected signs (continued)
Hypotheses Variables Definitions Expected Impact on Likelihood of Being Taken
Over by Private Equity Investor
Tax Rate The statutory corporate tax rate of the country where the target has its headquarters which applied in the year preceding the announcement date of the private equity acquisition.
H5 (bonding advantage of leverage): Private equity investors prefer taking over companies with both low leverage and high free cash flow levels.
Leverage Leverage is defined as total debt over enterprise value in the financial year preceding the announcement date of the private equity acquisition. Enterprise value is defined as market capitalisation plus net debt. Net debt is total debt minus cash holdings. Cash represents cash and short term investments (Axelson et al. (2010)).
-
FCF FCF is operating income before depreciation and amortization minus tax, interest and dividend payments (Lehn/Poulsen (1989)) a percentage of total assets.
+
FCF/Tobin The ratio of FCF over Tobin's Q (defined as the market value of total assets divided by their book value)
+
H6 (risk): Private equity investors are more likely to take over companies with stable cash flows.
CashFlowVolatility CashFlowVolatility is defined as the standard deviation of the logarithm of EBITDA over the five years preceding the private equity acquisition.
-
H7 (stock liquidity): The likelihood of a firm being taken over by a private equity investor is negatively related to the liquidity of its stock.
Liquidity The daily average number of shares traded over the 250-day window (starting 290 days before the announcement day) divided by the number of shares outstanding.
-
54
3.3 Methodology and data
This section starts with the description of the sample selection process, followed by the
construction of the control sample of non-acquired firms. The section finishes with a
discussion of the definition of the variables. The hypotheses, which were developed in
the previous section, are listed in Table 3-1 alongside the variables used to test them
and the predicted effect of each variable on the likelihood of a private equity
acquisition. The methodology we employ to test the hypotheses consists of the
following binomial logit:
� ln �1 � �� �
(1)
The dependent variable in the logit is set to one if the firm is taken over by a private
equity investor during the period of study and zero otherwise.
3.3.1 Sample selection process
We first identify all private equity acquisitions in continental Europe.152 As stated in
the introduction, we adopt Weir et al.’s (2008a) definition of a private equity
transaction. Such a transaction consists of the acquisition of a publicly quoted
company, usually by a newly incorporated unlisted company specifically set up for the
purpose of the deal (Jensen (1993)). The bid often takes the form of a leveraged
buyout (LBO) involving mainly debt financing. As stated in the introduction, contrary
to other empirical studies, such as Halpern et al. (1999) who focus on management
buy-outs (MBOs), we study those transactions that are sponsored by private equity
investors not related to the management and, in particular, the motives behind these
transactions.153
We obtain a list of private equity deals of continental European firms from Thomson
Securities Data Corporation (SDC) Platinum, Mergermarket and Private Equity
152 Our definition of continental Europe is the European landmass, which excludes the island states
(e.g. the UK, Ireland, Iceland, Malta and Cyprus) and Russia. 153 See also footnote 142.
55
Insight.154 We extract the list of all completed transactions announced between 1
January 1997 and 31 July 2007.155 The number of private equity acquisitions of
continental European firms during this period amounts to approximately 0.29% of the
number of listed companies.156 We then exclude all deals that involve financial firms
as targets given that their balance sheets differ markedly from those of non-financial
firms. This results in a preliminary sample of 193 potential private equity backed
going private transactions. To ensure the accuracy of our sample, we perform the
following two checks.
First, for each transaction, we double-check whether it is carried out by private equity
investors by examining each acquirer’s mission statement and investment track record
as reported on its web pages and in the financial press. Any remaining doubts are
addressed by consulting industry experts. Any acquirer who predominantly buys
majority stakes (as opposed to minority stakes which tend to be bought by hedge
funds) in mature companies (as opposed to venture capitalists who invest in young
companies) and for a limited investment horizon (as opposed to strategic buyers who
invest over the long run) is considered to be a private equity investor. In case a bank is
stated as the acquirer, we check whether the transaction was carried out by the bank’s
private equity arm. If this is not the case, the transaction is excluded. Similarly, we
also verify whether transactions by formerly pure private equity investors such as
Blackstone, which have now evolved into organisations offering a range of financial
services and advice, have been carried out by their private equity divisions. We reject a
total of 25 transactions which do not satisfy these criteria.
Second, we check whether the remaining transactions result in the target firm going
private. We proceed by determining the target’s delisting date via the examination of
the time series of its stock prices and corroborate our findings through press
154 Private Equity Insight is sourced from Incisive Media, a data provider specialising in private equity
deals information. 155 Mergermarket and Private Equity Insight do not cover transactions before 1998. 156 Our calculations are based on all listed companies, including financial firms.
56
searches.157 Overall, we identify 32 transactions which cannot be classified as going
private transactions and thus have to be excluded from our sample.
Of the remaining 136 firms, comprehensive data cannot be obtained for 21 companies
despite our best efforts.158 This leaves us with a final sample of 115 continental
European firms which have been taken private by private equity investors between 1
January 1997 and 31 July 2007.
3.3.2 Control sample
The control sample is selected from the population of listed firms covered by Thomson
One Banker. We apply a similar algorithm as in Weir et al. (2005), North (2001) and
Klein/Zur (2009) to obtain a match for each of our private equity targets. The
algorithm consists of the following steps. First, we identify all the public companies
which have their headquarters in the same country as the private equity target. Second,
we retain those companies which operate in the same two-digit SIC industry. In case
there are fewer than 5 potential matches,159 we base ourselves on the one-digit SIC
code.160 Third, the matching firm is then the firm whose sales figure is closest to that
of the private equity target. Finally, we check whether all of the matched firms stay
public for at least two years after the announcement date (AD) of the private equity
acquisition for the firm for which they serve as a match. All matched firms satisfied
this criterion.
157 This two-step procedure is important as can be seen from the example of MobilCom AG / Freenet
AG. In May 2005, the private equity investor Texas Pacific Group bought a stake in Mobilcom. Subsequently, Mobilcom merged with Freenet and as a result the former’s stock exchange listing ceased. However, the merged company returned to the stock exchange immediately after the merger had become effective. Hence, it is important to remove such transactions from the sample as they are clearly not going private transactions.
158 See section 3.3.1 and in particular footnote 17. 159 North (2001) sets the minimum for his US based study to 10 firms. Due to the smaller size of the
continental European capital markets, we set the minimum to 5 firms. 160 Twenty-three private equity targets out of a total of 115 had to be matched based on the one-digit
SIC code.
57
3.3.3 Data sources and definitions of variables
3.3.3.1 Data sources
The source for stock and accounting data is Thomson Datastream. If required, we
consult Worldscope, CapitalIQ and the firms’ annual reports to fill in any missing
information. Accounting data are collected for the closest available fiscal year
preceding the announcement date of the private equity acquisition. We use
consolidated accounting data. In order to ensure that our results are not driven by
outliers, we winsorize both accounting and stock based variables at the first and 99th
percentile.
Our main data source for control and ownership is Bureau Van Dijk’s Amadeus.161
Both control and ownership are measured at the ultimate level (see section 3.3.3.2).
The data from Amadeus were cross-checked using a wide range of other databases.162
We use the annual reports to determine whether any of the large shareholders reported
by Amadeus are part of the management.
3.3.3.2 Definitions of variables
In what follows, we define control as ownership of voting rights and ownership as
ownership of cash flow rights. A shareholder is considered to be the controlling
shareholder if he holds at least 25% of the voting rights and has the largest stake in the
company. The ultimate controlling shareholder is defined as the largest shareholder,
holding at least 25% of the votes, including via intermediate layers such as
uninterrupted multiple chains of control, and in turn is not controlled by another large
shareholder. In other words, the ultimate shareholder is a family (or individual) or the
161 As our starting point, we use the historical snapshots of control and ownership from Amadeus taken
at the end of January, April, July and October of each year. From 1997 to 2002, we rely on the semi-annual snapshots for April and October. Robustness checks with other data sources, however, confirm that control is relatively stable. Hence, our results should not be affected by this limitation.
162 The other ownership data sources include (1) primary sources such as the companies’ annual reports and websites as well as direct requests addressed to the companies, (2) stock market or regulatory authorities such as the Commissione Nazionale per la Società e la Borsa (Consob) for the Italian firms, (3) other commercial databases and company directories such as Hoppenstedt Aktienführer for the German firms, (4) press searches based on Factiva (5) and web searches based on Google.

58
government as control by definition resides with these. Alternatively, it will be a bank,
an insurance company, an industrial or commercial corporation or a holding company
as long as these are widely held and do not have a large controlling shareholder.
Hypothesis 1, which states that firms with an active, monitoring shareholder are less
likely to be taken over by a private equity investor, is tested using three different
proxies for the presence of a large monitoring shareholder. The incentive for a
shareholder to monitor the management is ownership in the company. The higher the
ownership, the higher is the incentive to monitor. Further, in order to be an effective
and independent monitor, we assume that the large monitoring shareholder is not part
of the management. In other words, we consider that monitoring is unlikely to be
effective if e.g. a firm is owned mainly by a family who also manages the firm.163 This
assumption applies to all three proxies. The first proxy is CFR which is the percentage
of cash flow rights held by the ultimate controlling shareholder. The second proxy is
the interaction term of CFR with one of the dummy variables indicating the type of the
largest shareholder. We distinguish between families, the government, banks,
insurance companies, industrial and commercial corporations, holding companies and
other shareholders. The latter include foundations, charities, voting pacts, pension
funds, employee trusts and cooperatives. Except for the government, we expect that all
other types of large shareholder monitor the management. The third proxy is similar to
the previous one, but also takes into account the past track record of the large
shareholder as measured by the firm’s accounting performance. Accounting
performance is the ratio of earnings before interest and tax (EBIT) over total assets. In
other words, this proxy enables us to distinguish between active monitors with a good
past track record and those who have failed to turn around their company. The latter
are more likely to be favourably inclined towards a takeover offer from a private
equity investor.
163 Our definition of the management is executive directors sitting on the board. In the case of a unitary
board, as is the case in most French firms, these are the directors who do not hold non-executive positions. In the case of a two-tier board, they are the members of the management board (e.g. the Vorstand for German firms) as opposed to the members of the supervisory board (e.g. the Aufsichtsrat for German firms).

59
Hypothesis 2 states that companies with large shareholders enjoying private benefits of
control are less likely to be the targets of private equity investors. The validity of this
hypothesis is tested using three different proxies for private benefits of control. The
three proxies are as follows. The first proxy is VR, the percentage of voting rights held
by the ultimate controlling shareholder. The second proxy, VR-CFR, is the difference
between the percentage of voting rights and the percentage of cash flow rights held by
the ultimate controlling shareholder. The third proxy is VR/CFR, the ratio of the
percentage of votes over the percentage of cash flow rights held by the ultimate
controlling shareholder. In addition, we also interact these proxies with each of the
dummy variables indicating the type of the largest shareholder (as stated above). We
expect that families are more likely to enjoy private benefits of control compared to all
other types of ultimate shareholder.
Our measures for the monitoring incentives and the private benefits of control of the
large shareholder are in line with Claessens et al. (2002). They also measure the
incentives of the large shareholder to monitor the management by the percentage of
cash flow rights s/he owns and her/his private benefits of control (they use the term
“entrenchment”) by her/his percentage of voting rights. They find that the value of
firms from eight East Asian countries increases with the large shareholder’s cash flow
rights, but decreases if the percentage of her/his voting rights exceeds that of her/his
cash flow rights.
According to Hypothesis 3, companies with relatively low or relatively high ownership
by professional managers, i.e. managers not related to the large shareholder, are more
likely to become targets of private equity investors. The validity of this hypothesis is
tested using Mgmt_Prof and Mgmt_Prof2. The former is the sum of all voting rights
held by the management and the latter is the square of the former. Given the non-linear
relationship stated by Hypothesis 3, we expect a negative sign on Mgmt_Prof and a
positive sign on Mgmt_Prof2.
Hypothesis 4 on the tax benefit from leverage is tested using four different proxies.
The first one is Leverage, defined as total debt over enterprise value. Enterprise value
is defined as market capitalisation plus net debt. Net debt is total debt minus cash

60
holdings. Cash represents cash and short term investments. This definition is line with
Axelson et al. (2010). The second proxy is Tax, which is the firm’s tax payments
expressed as a percentage of operating income before depreciation and amortization.
The third proxy, Tax/Leverage, is the ratio of the latter over the former. The final
proxy is Tax Rate, the statutory corporate tax rate which applied to the year preceding
the acquisition announcement in the country of the firm’s headquarters.
Hypothesis 5 on the bonding advantage of debt (i.e. its role of mitigating Jensen’s
(1986) free cash flow problem) is tested using FCF, i.e. operating income before
depreciation and amortization minus tax, interest and dividend payments over total
assets. We expect a positive sign on the variable’s coefficient. As Opler/Titman (1993)
find that, on its own, the level of free cash flow does not seem to have an impact on
the likelihood of a firm being taken over, but that it does in the absence of strong
growth opportunities, we also use the ratio of FCF over the firm’s Tobin’s Q, the latter
being our proxy for the firm’s growth opportunities. Tobin is defined as the ratio of the
firm’s market value of the assets divided by the replacement cost of the assets.164
Firms with a Tobin’s Q of less than one have no growth opportunities. The expected
sign for the variable’s coefficient is positive.
Hypothesis 6 is on cash flow volatility and its negative impact on the likelihood of the
firm becoming the target of a private equity investor. CashFlowVolatility is defined as
the standard deviation of the logarithm of earnings before interest, taxes, depreciation
and amortization (EBITDA) over the five years preceding the year of the
announcement of the private equity acquisition. We expect the coefficient on the
variable to be negative.
Finally, according to Hypothesis 7 there should be a negative impact of stock liquidity
on the likelihood of the firm becoming a target of a private equity acquisition.
Liquidity is measured by the average for the daily number of the firm’s shares traded
over the 250-day window (starting 290 days before the announcement day) divided by
the number of shares outstanding.
164 Similar to other studies (e.g. Malmendier/Tate (2008)), we use the book value of the assets as the
replacement cost for the assets is not normally available.

61
3.4 Empirical results
3.4.1 Descriptive statistics
Table 3-2 shows the geographic distribution of our continental European private equity
acquisitions. France has by far the highest number of transactions followed by
Germany, the Netherlands and Sweden each with at most half that number.
Table 3-2: Number of PE transactions across continental Europe for 1997 to 2007
This table reports the distribution of private equity transactions across the countries, where the targets are headquartered.
Country Number of private equity
transactions Percentage of private equity
transactions
France 35 30.4%
Germany 18 15.7%
Netherlands 14 12.2%
Sweden 13 11.3%
Denmark 8 7.0%
Norway 7 6.1%
Spain 5 4.3%
Italy 4 3.5%
Finland 4 3.5%
Hungary 3 2.6%
Austria 2 1.7%
Belgium 1 0.9%
Luxembourg 1 0.9%
Total 115 100.0%
Table 3-3 reports the number and size (as measured by enterprise value) of continental
European private equity acquisitions over time. The highest number of deals (i.e. 23)
occurred in 1999 while the largest total size of the deals is observed in 2006 which
also has the largest average deal size. More generally, there has been a gradual
increase in the average deal size over the entire period until the first half of 2007 when

62
the average deal size dropped from more than €1bn to less than half that amount.165
This trend mirrors the increasing availability of cheap debt (Axelson et al. (2010)).
Table 3-3: Number and enterprise values of private equity targets across time
This table shows the number private equity transactions which were announced during 1997 and 2007 and successfully delisted by July 2007. The table also reports descriptive statistics for enterprise values (EV). Year denotes the year of the announcement of the private equity acquisition. Enterprise value is defined as market capitalisation plus net debt at the end of the financial year prior to the transaction announcement. Net debt is total debt minus cash holdings. Cash represents cash and short term investments. This definition is line with Axelson et al. (2010).
Year # of Private
equity transactions
Total EVs (in m€)
EV Mean
EV Median
EV Min.
EV Max.
1997 1 20 20 20 20 20
1998 1 6 6 6 6 6
1999 23 4,144 180 152 15 653
2000 14 3,994 285 222 30 1,402
2001 7 1,956 279 106 22 738
2002 12 3,146 262 204 17 708
2003 14 4,336 310 111 7 1,548
2004 16 12,807 800 592 52 2,789
2005 10 10,641 1,064 563 28 4,325
2006 13 14,257 1,097 375 36 6,890
Jan. - Jul. 2007 4 1,893 473 124 33 1,612
Total 115 57,199 497 184 6 6,890
Table 3-4 reports the concentration of control and the importance of the various types
of ultimate shareholders for the sample of private equity acquisitions and the control
group of non-targets. The percentage of closely held firms is about 71% in both
samples. While families are the most important type of ultimate shareholders in both
samples, they are relatively more important in the sample of non-targets where they
control the majority of firms compared to the sample of private equity acquisitions
165 When all of the ten 2007 transactions (i.e. all those completed by October 2008) are taken into
account, the total deal size and average deal size are in line with those from previous years with a value of about €8.3bn and €834m, respectively.
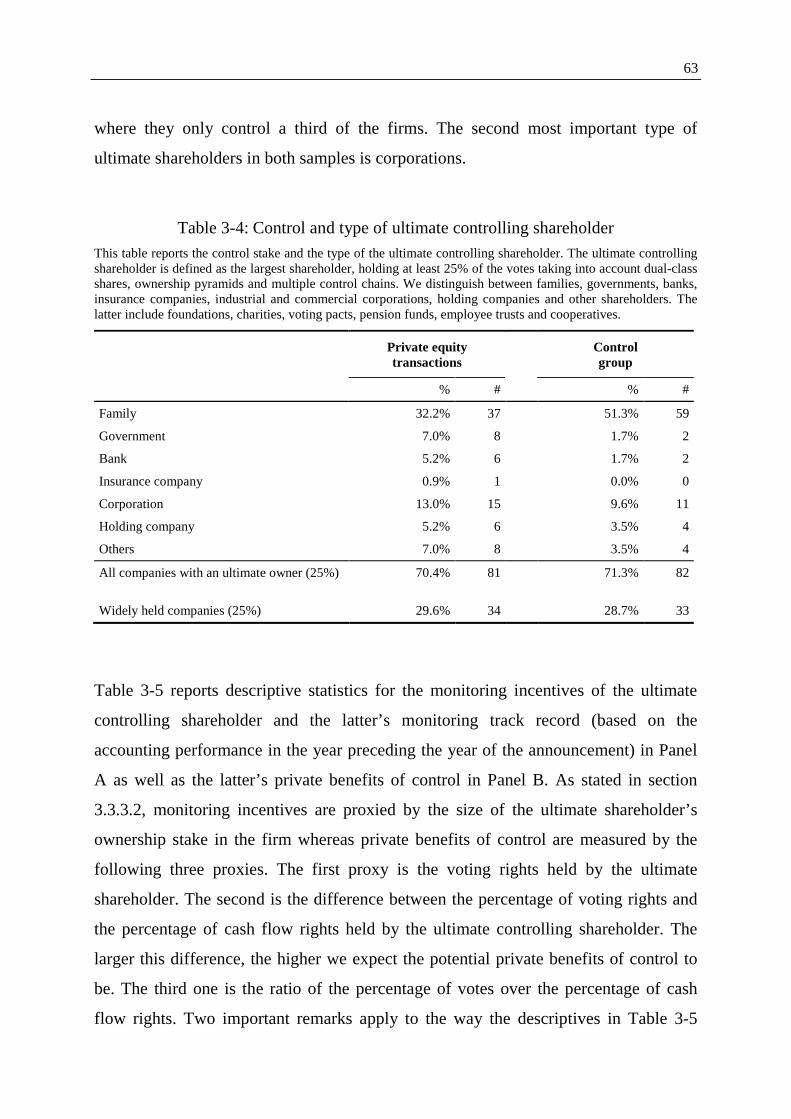
63
where they only control a third of the firms. The second most important type of
ultimate shareholders in both samples is corporations.
Table 3-4: Control and type of ultimate controlling shareholder
This table reports the control stake and the type of the ultimate controlling shareholder. The ultimate controlling shareholder is defined as the largest shareholder, holding at least 25% of the votes taking into account dual-class shares, ownership pyramids and multiple control chains. We distinguish between families, governments, banks, insurance companies, industrial and commercial corporations, holding companies and other shareholders. The latter include foundations, charities, voting pacts, pension funds, employee trusts and cooperatives.
Private equity transactions
Control group
% # % #
Family 32.2% 37 51.3% 59
Government 7.0% 8 1.7% 2
Bank 5.2% 6 1.7% 2
Insurance company 0.9% 1 0.0% 0
Corporation 13.0% 15 9.6% 11
Holding company 5.2% 6 3.5% 4
Others 7.0% 8 3.5% 4
All companies with an ultimate owner (25%) 70.4% 81 71.3% 82
Widely held companies (25%) 29.6% 34
28.7% 33
Table 3-5 reports descriptive statistics for the monitoring incentives of the ultimate
controlling shareholder and the latter’s monitoring track record (based on the
accounting performance in the year preceding the year of the announcement) in Panel
A as well as the latter’s private benefits of control in Panel B. As stated in section
3.3.3.2, monitoring incentives are proxied by the size of the ultimate shareholder’s
ownership stake in the firm whereas private benefits of control are measured by the
following three proxies. The first proxy is the voting rights held by the ultimate
shareholder. The second is the difference between the percentage of voting rights and
the percentage of cash flow rights held by the ultimate controlling shareholder. The
larger this difference, the higher we expect the potential private benefits of control to
be. The third one is the ratio of the percentage of votes over the percentage of cash
flow rights. Two important remarks apply to the way the descriptives in Table 3-5
64
have been computed. First, it may be the case that only those families that are not part
of the firm’s management have monitoring incentives. Consequently, it makes sense to
set the monitoring incentives to zero for all controlling families which are part of the
management. In the private equity sample, only 10 out of the initially 37 family
controlled firms (27%) have monitoring incentives (i.e. the family is not part of the
management) while in the control sample 22 out of the initially 59 controlled firms
(37%) have monitoring incentives. This is in line with Hypothesis 1. We report both
the descriptives based on the family-controlled firms with monitoring incentives, i.e.
the 10 (22) family firms in the private equity (control) sample where the controlling
family is not part of the management, and the descriptives for all the family-controlled
firms, i.e. the 37 (59) family firms in the private equity (control) sample. For the latter,
the monitoring incentives for the 27 (37) controlling families which are part are of the
management are reported as being zero. Second, in Panel B we report the descriptives
for VR-CFR and VR/CFR for only those firms where there is a difference between the
voting rights and the ownership rights held by the ultimate controlling shareholder.
Panel B shows that for firms ultimately controlled by families and those ultimately
controlled by corporations deviations from the one-share one-vote rule are relatively
more common in the control group compared to the sample of private equity targets.
Panel A lends support to Hypothesis 1 which states that the probability of a takeover
by a private equity investor decreases for firms with an active, monitoring shareholder.
When we exclude families, that are also part of the management, from the sample,
then the ultimate controlling shareholder of the average private equity target holds
43.1% of the cash flow rights compared to 49.3% for the control group. However,
when we include all family-controlled firms and set the monitoring incentives of those
families that are part of the management equal to zero then there is virtually no
difference between the sample of private equity targets and the control group.166 Still,
166 The reason why there is no longer a difference between the two samples is that, compared to the
private equity sample, the control sample now includes an additional 37 firms that are ultimately controlled by a family compared to only an additional 27 firms for the private equity firms. As for these firms the family is also part of the management, we set the monitoring incentives of the family equal to zero. Hence, we end up with slightly lower average monitoring incentives in the control sample than in the private equity targets. The question arises as to whether the fact that the family is part of the management is a proxy for private benefits of control. Indeed, so far we have
65
firms that are both family controlled and targets of private equity investors have lower
monitoring incentives than the non-acquired firms forming the control group. This
pattern is in line with Hypothesis 1. Similarly, for firms controlled by holding
companies, the monitoring incentives are also less pronounced in the private equity
sample than in the control group. The average stake of cash flow rights of 38.1% in the
private equity sample compares to 40.4% in the control group. However, for the
remaining types of ultimate controlling shareholders (i.e. the government, banks, and
corporations) the converse pattern is observed. For example for firms controlled by
corporations, the average stake of cash flow rights in the private equity targets is
65.2% compared to only 56.7% in the control group.167 Panel A of Table 3-5 also
reports descriptives for the performance of the ultimate shareholder as a monitor. Our
measure is the monitoring incentives of the ultimate controlling shareholder interacted
with the accounting performance of the firm in the year preceding the year of the
announcement. We expect monitoring performance to be worse for the private equity
targets. However, there is no indication from the descriptives that this is the case.
assumed that being part of the management reduces the family’s incentives to monitor the executives of the firm. However, the family may choose to be part of the management team to extract (further) benefits of control from the firm. In order to test this alternative interpretation, we check the correlations between management team membership on one side and our various measures of private benefits on the other side for firms that are ultimately controlled by families. However, the correlation coefficients are very small.
167 Still, Panel B shows that firms controlled by corporations in the control group have higher private benefits of control than those in the sample of private equity targets.
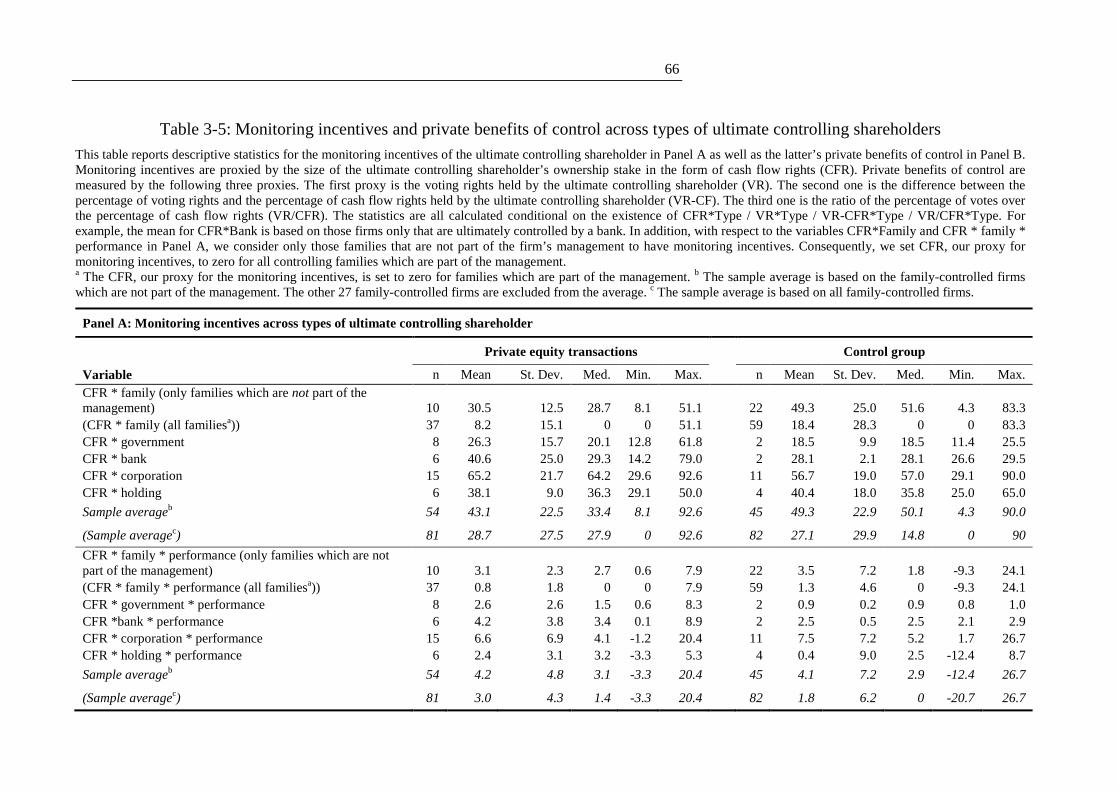
66
Table 3-5: Monitoring incentives and private benefits of control across types of ultimate controlling shareholders
This table reports descriptive statistics for the monitoring incentives of the ultimate controlling shareholder in Panel A as well as the latter’s private benefits of control in Panel B. Monitoring incentives are proxied by the size of the ultimate controlling shareholder’s ownership stake in the form of cash flow rights (CFR). Private benefits of control are measured by the following three proxies. The first proxy is the voting rights held by the ultimate controlling shareholder (VR). The second one is the difference between the percentage of voting rights and the percentage of cash flow rights held by the ultimate controlling shareholder (VR-CF). The third one is the ratio of the percentage of votes over the percentage of cash flow rights (VR/CFR). The statistics are all calculated conditional on the existence of CFR*Type / VR*Type / VR-CFR*Type / VR/CFR*Type. For example, the mean for CFR*Bank is based on those firms only that are ultimately controlled by a bank. In addition, with respect to the variables CFR*Family and CFR * family * performance in Panel A, we consider only those families that are not part of the firm’s management to have monitoring incentives. Consequently, we set CFR, our proxy for monitoring incentives, to zero for all controlling families which are part of the management. a The CFR, our proxy for the monitoring incentives, is set to zero for families which are part of the management. b The sample average is based on the family-controlled firms which are not part of the management. The other 27 family-controlled firms are excluded from the average. c The sample average is based on all family-controlled firms.
Panel A: Monitoring incentives across types of ultimate controlling shareholder
Private equity transactions Control group
Variable n Mean St. Dev. Med. Min. Max. n Mean St. Dev. Med. Min. Max. CFR * family (only families which are not part of the management) 10 30.5 12.5 28.7 8.1 51.1 22 49.3 25.0 51.6 4.3 83.3 (CFR * family (all familiesa)) 37 8.2 15.1 0 0 51.1 59 18.4 28.3 0 0 83.3 CFR * government 8 26.3 15.7 20.1 12.8 61.8 2 18.5 9.9 18.5 11.4 25.5 CFR * bank 6 40.6 25.0 29.3 14.2 79.0 2 28.1 2.1 28.1 26.6 29.5 CFR * corporation 15 65.2 21.7 64.2 29.6 92.6 11 56.7 19.0 57.0 29.1 90.0 CFR * holding 6 38.1 9.0 36.3 29.1 50.0 4 40.4 18.0 35.8 25.0 65.0
Sample averageb 54 43.1 22.5 33.4 8.1 92.6 45 49.3 22.9 50.1 4.3 90.0
(Sample averagec) 81 28.7 27.5 27.9 0 92.6 82 27.1 29.9 14.8 0 90
CFR * family * performance (only families which are not part of the management) 10 3.1 2.3 2.7 0.6 7.9 22 3.5 7.2 1.8 -9.3 24.1 (CFR * family * performance (all familiesa)) 37 0.8 1.8 0 0 7.9 59 1.3 4.6 0 -9.3 24.1 CFR * government * performance 8 2.6 2.6 1.5 0.6 8.3 2 0.9 0.2 0.9 0.8 1.0 CFR *bank * performance 6 4.2 3.8 3.4 0.1 8.9 2 2.5 0.5 2.5 2.1 2.9 CFR * corporation * performance 15 6.6 6.9 4.1 -1.2 20.4 11 7.5 7.2 5.2 1.7 26.7 CFR * holding * performance 6 2.4 3.1 3.2 -3.3 5.3 4 0.4 9.0 2.5 -12.4 8.7
Sample averageb 54 4.2 4.8 3.1 -3.3 20.4 45 4.1 7.2 2.9 -12.4 26.7
(Sample averagec) 81 3.0 4.3 1.4 -3.3 20.4 82 1.8 6.2 0 -20.7 26.7
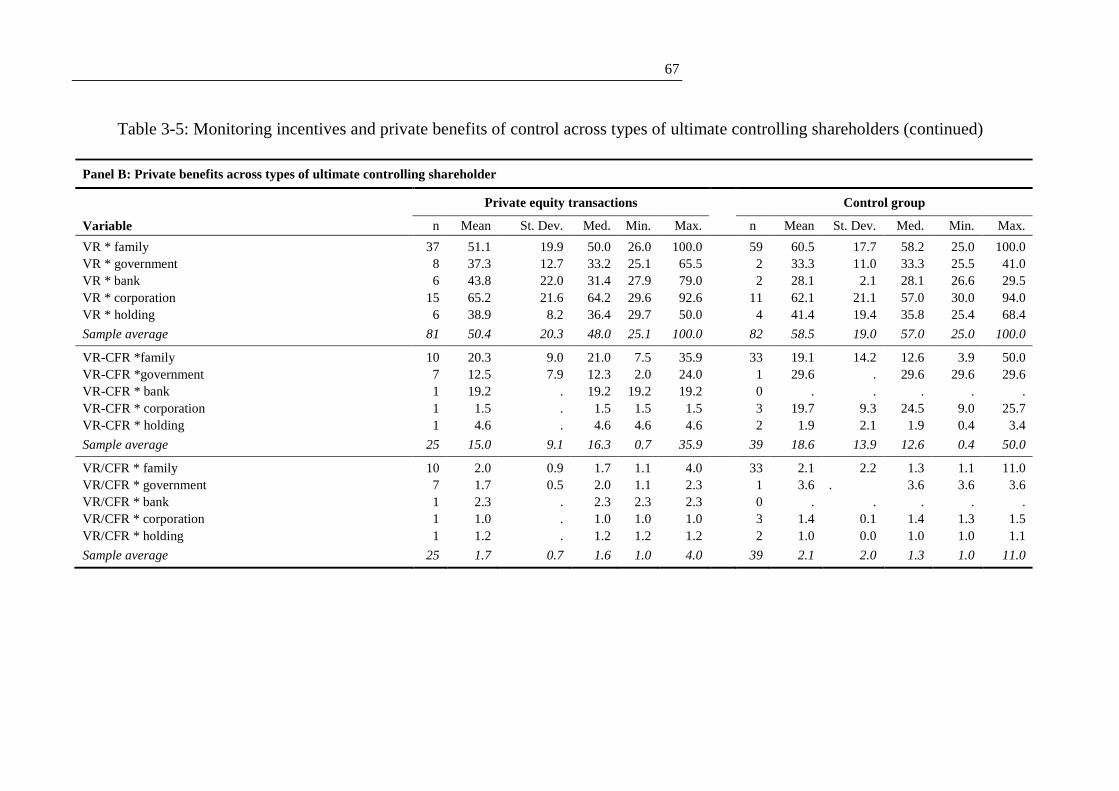
67
Table 3-5: Monitoring incentives and private benefits of control across types of ultimate controlling shareholders (continued)
Panel B: Private benefits across types of ultimate controlling shareholder
Private equity transactions Control group
Variable n Mean St. Dev. Med. Min. Max. n Mean St. Dev. Med. Min. Max.
VR * family 37 51.1 19.9 50.0 26.0 100.0 59 60.5 17.7 58.2 25.0 100.0 VR * government 8 37.3 12.7 33.2 25.1 65.5 2 33.3 11.0 33.3 25.5 41.0 VR * bank 6 43.8 22.0 31.4 27.9 79.0 2 28.1 2.1 28.1 26.6 29.5 VR * corporation 15 65.2 21.6 64.2 29.6 92.6 11 62.1 21.1 57.0 30.0 94.0 VR * holding 6 38.9 8.2 36.4 29.7 50.0 4 41.4 19.4 35.8 25.4 68.4
Sample average 81 50.4 20.3 48.0 25.1 100.0 82 58.5 19.0 57.0 25.0 100.0
VR-CFR *family 10 20.3 9.0 21.0 7.5 35.9 33 19.1 14.2 12.6 3.9 50.0 VR-CFR *government 7 12.5 7.9 12.3 2.0 24.0 1 29.6 . 29.6 29.6 29.6 VR-CFR * bank 1 19.2 . 19.2 19.2 19.2 0 . . . . . VR-CFR * corporation 1 1.5 . 1.5 1.5 1.5 3 19.7 9.3 24.5 9.0 25.7 VR-CFR * holding 1 4.6 . 4.6 4.6 4.6 2 1.9 2.1 1.9 0.4 3.4
Sample average 25 15.0 9.1 16.3 0.7 35.9 39 18.6 13.9 12.6 0.4 50.0
VR/CFR * family 10 2.0 0.9 1.7 1.1 4.0 33 2.1 2.2 1.3 1.1 11.0 VR/CFR * government 7 1.7 0.5 2.0 1.1 2.3 1 3.6 . 3.6 3.6 3.6 VR/CFR * bank 1 2.3 . 2.3 2.3 2.3 0 . . . . . VR/CFR * corporation 1 1.0 . 1.0 1.0 1.0 3 1.4 0.1 1.4 1.3 1.5 VR/CFR * holding 1 1.2 . 1.2 1.2 1.2 2 1.0 0.0 1.0 1.0 1.1
Sample average 25 1.7 0.7 1.6 1.0 4.0 39 2.1 2.0 1.3 1.0 11.0
68
Panel B lends support to Hypothesis 2 which states that companies with large
shareholders who enjoy private benefits of control are less likely to be the target of
private equity investors. The ultimate controlling shareholder of the average private
equity target holds 50.4% of the votes whereas the equivalent figure for the control
group is higher with 58.5%. Furthermore, we document a violation of the one-share
one-vote principle in only 25 private equity targets compared to 39 companies in the
control group. For those firms where there is a violation of the one-share one-vote rule
(as measured by VR-CFR and VR/CFR, respectively), the wedge between the
percentage of votes and the percentages of cash flow rights held by the ultimate
controlling shareholder is higher for the control group (18.6% and 2.1, respectively)
than for the sample of private equity targets (15.0% and 1.7, respectively). This pattern
lends support to Hypothesis 2. When the type of ultimate controlling shareholder is
taken into account, the pattern seems to be primarily driven by families. The ultimate
controlling family in the private equity sample owns on average 51.1% of the votes
whereas it owns on average 60.5% in the control sample. In addition, there is a
violation of the one-share one-vote rule in only 10 of the 37 (27%) family-controlled
private equity targets compared to 33 of the 59 (37%) family-controlled peer firms.
However, for the remaining types of ultimate controlling shareholders (i.e. holdings,
the government, banks, and corporations) the evidence is less in line with Hypothesis
2. For example, the percentage of votes held by ultimate controlling shareholders who
are governments, banks and corporations is lower in the control group than in the
sample of private equity targets.
The results from Table 3-5 can be summarised as follows. While there is generally
support for Hypothesis 1 and Hypothesis 2 it is also important to take into account the
type of ultimate controlling shareholder. The hypotheses seem to hold well for firms
that are ultimately controlled by families, but less well for those firms ultimately
controlled by other types of shareholders.
Table 3-6 reports descriptive statistics for the secondary variables. As was the case for
the previous two tables, we report the descriptive statistics separately for the private
equity targets and the control group of non-acquired firms.
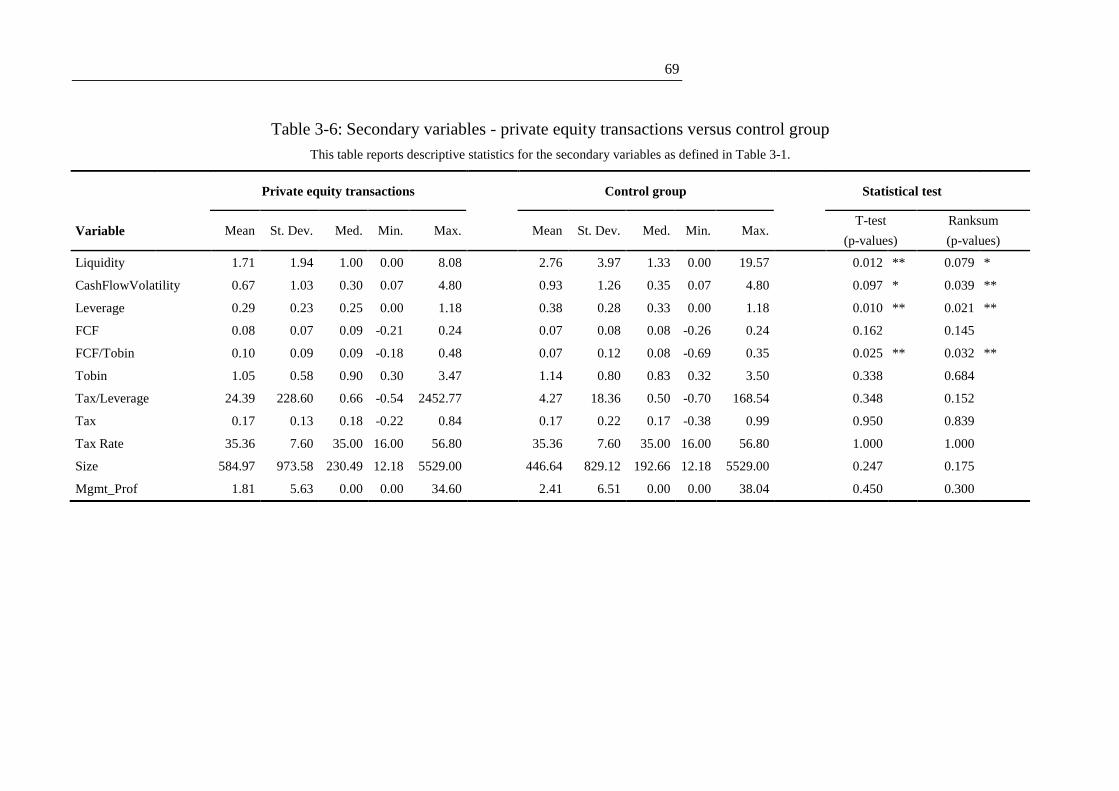
69
Table 3-6: Secondary variables - private equity transactions versus control group
This table reports descriptive statistics for the secondary variables as defined in Table 3-1.
Private equity transactions Control group Statistical test
Variable Mean St. Dev. Med. Min. Max. Mean St. Dev. Med. Min. Max. T-test Ranksum
(p-values) (p-values)
Liquidity 1.71 1.94 1.00 0.00 8.08 2.76 3.97 1.33 0.00 19.57 0.012 ** 0.079 *
CashFlowVolatility 0.67 1.03 0.30 0.07 4.80 0.93 1.26 0.35 0.07 4.80 0.097 * 0.039 **
Leverage 0.29 0.23 0.25 0.00 1.18 0.38 0.28 0.33 0.00 1.18 0.010 ** 0.021 **
FCF 0.08 0.07 0.09 -0.21 0.24 0.07 0.08 0.08 -0.26 0.24 0.162 0.145
FCF/Tobin 0.10 0.09 0.09 -0.18 0.48 0.07 0.12 0.08 -0.69 0.35 0.025 ** 0.032 **
Tobin 1.05 0.58 0.90 0.30 3.47 1.14 0.80 0.83 0.32 3.50 0.338 0.684
Tax/Leverage 24.39 228.60 0.66 -0.54 2452.77 4.27 18.36 0.50 -0.70 168.54 0.348 0.152
Tax 0.17 0.13 0.18 -0.22 0.84 0.17 0.22 0.17 -0.38 0.99 0.950 0.839
Tax Rate 35.36 7.60 35.00 16.00 56.80 35.36 7.60 35.00 16.00 56.80 1.000 1.000
Size 584.97 973.58 230.49 12.18 5529.00 446.64 829.12 192.66 12.18 5529.00 0.247 0.175
Mgmt_Prof 1.81 5.63 0.00 0.00 34.60 2.41 6.51 0.00 0.00 38.04 0.450 0.300
70
The table shows that there is no significant difference in managerial ownership between
the private equity targets and the control group. The range of managerial ownership is also
very similar for both groups of companies with a range of 0% to 34.6% for the private
equity targets and a range of 0% to 38.0% for the control group. While Hypothesis 3 states
that private equity investors are more likely to acquire firms with relatively low or
relatively high managerial ownership, Table 3-6 does not provide any evidence in favour
of this hypothesis. Conversely, the average and the median for leverage are significantly
lower for the private equity targets which supports the tax benefit (Hypothesis 4) and/or
bonding advantage (Hypothesis 5) of leverage. With respect to the former, however, none
of our measures for the tax shield from more debt (i.e. Tax, Tax Rate and Tax/Leverage) is
significantly different from zero across the two samples. With respect to the latter, the ratio
of free cash flow over Tobin’s Q is significantly higher for the private equity targets than
the control firms, i.e. private equity investors seem to prefer companies with high debt
capacity in order to reduce agency costs of free cash flows encountered in mature (low-
growth) firms. Hence, the evidence from Table 3-6 provides more support for the bonding
advantage of leverage (Hypothesis 5) than the tax benefit (Hypothesis 4). There is also
evidence in support of Hypothesis 6 as private equity targets have both significantly lower
average and median cash flow volatility compared to the control group of non-acquired
firms. Finally, there is also support in Table 3-6 for Hypothesis 7 as private equity targets
have significantly lower average and median stock liquidity than the control group. To
summarise the results from Table 3-6, the hypotheses relating to the secondary variables
are in general supported by the data.
3.4.2 Multivariate results
While the aggregate descriptive statistics provided support for Hypothesis 1 and
Hypothesis 2, it also seems important to take into account the type of ultimate controlling
shareholder. Indeed, the support for both hypotheses mainly stems from the firms
ultimately controlled by families and less so for those firms controlled by other types of
shareholders. In order to provide a rigorous test on our monitoring and private benefits
arguments (Hypotheses 1 and 2) we run multivariate logistic regressions which
simultaneously take all of our explanations into account.

71
In what follows, we shall start with the discussion as to the validity of the monitoring and
private benefits arguments. In a second instance, we shall present the regression results
relating to the secondary explanations.
3.4.2.1 Monitoring incentives and private benefits of control
Table 3-7 focuses on the monitoring incentives of the ultimate controlling shareholder
(Hypothesis 1) whereas Table 3-8 focuses on the potential private benefits of control
enjoyed by the latter (Hypothesis 2). Model 1 of Table 3-7 suggests that Hypothesis 1 is
not valid. Indeed, the percentage of cash flow rights held by the ultimate controlling
shareholder does not have a significant impact on the likelihood of the firm being taken
over by a private equity investor. However, when the type of the ultimate controlling
shareholder (families, governments, banks, corporations, and holding firms) is taken into
account (as is the case in Models 2-4), firms controlled by families that have strong
monitoring incentives are less likely private equity targets than firms controlled by any
other type of shareholders. The coefficient on the interaction between the monitoring
incentives and the family dummy is significant at the 1% level in Model 2 and Model 4.
Model 3 and Model 4 further investigate the validity of the monitoring hypothesis by
taking into account the monitoring skills of the ultimate controlling shareholder.
Monitoring skills are measured by the firm’s accounting performance in the year preceding
the announcement of the private equity transaction. In Model 3, the coefficients on the
interaction terms between monitoring incentives and monitoring skills for firms controlled
by the government and those controlled by banks are positive and significant at the 5% and
10% level, respectively. This result is somewhat counterintuitive as it suggests that firms
controlled by governments and banks with good monitoring track records – as evidenced
by good accounting performance – are more likely to be targeted by private equity
investors. One reason for this result may be that rather than monitoring the firms they
invest in governments and banks may just time the sale of their firms to coincide with a
period of good performance. This would be in line with the previous empirical research
which has found governments to be weak or bad monitors and shown mixed results for
banks. However, this result disappears in Model 4 which contains both the interaction
terms between the monitoring incentives and shareholder categories and those between
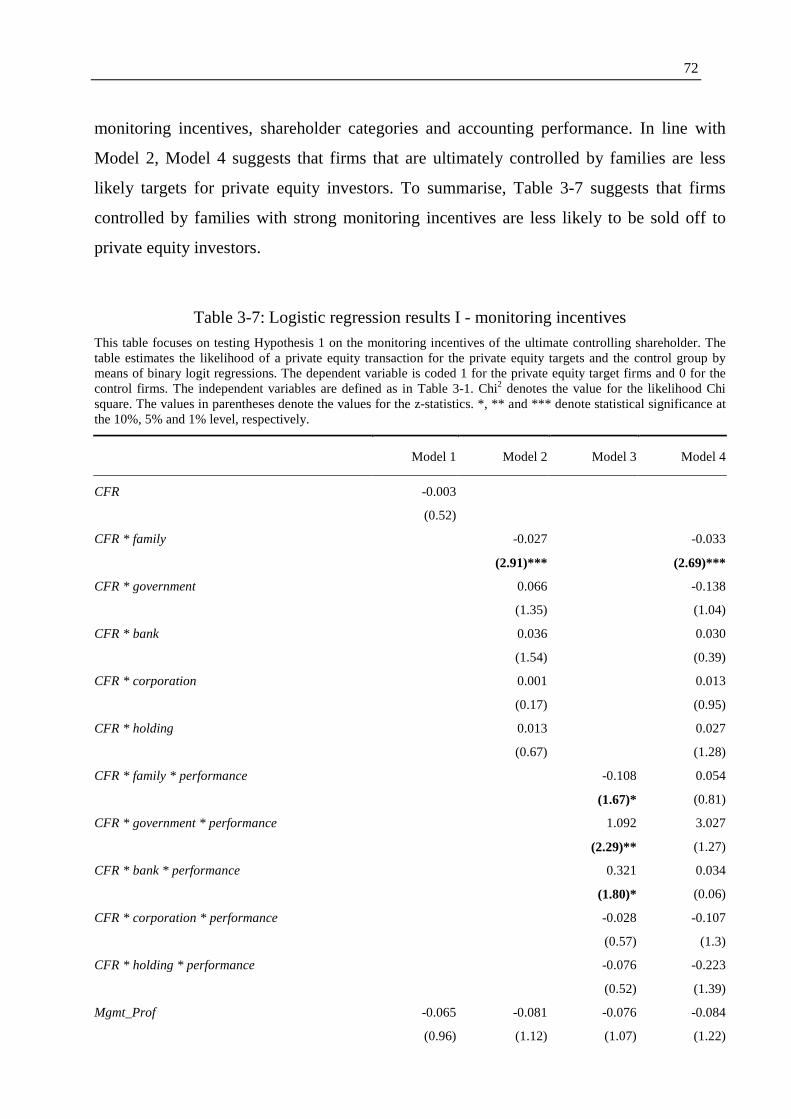
72
monitoring incentives, shareholder categories and accounting performance. In line with
Model 2, Model 4 suggests that firms that are ultimately controlled by families are less
likely targets for private equity investors. To summarise, Table 3-7 suggests that firms
controlled by families with strong monitoring incentives are less likely to be sold off to
private equity investors.
Table 3-7: Logistic regression results I - monitoring incentives
This table focuses on testing Hypothesis 1 on the monitoring incentives of the ultimate controlling shareholder. The table estimates the likelihood of a private equity transaction for the private equity targets and the control group by means of binary logit regressions. The dependent variable is coded 1 for the private equity target firms and 0 for the control firms. The independent variables are defined as in Table 3-1. Chi2 denotes the value for the likelihood Chi square. The values in parentheses denote the values for the z-statistics. *, ** and *** denote statistical significance at the 10%, 5% and 1% level, respectively.
Model 1 Model 2 Model 3 Model 4
CFR -0.003
(0.52)
CFR * family -0.027 -0.033
(2.91)*** (2.69)***
CFR * government 0.066 -0.138
(1.35) (1.04)
CFR * bank 0.036 0.030
(1.54) (0.39)
CFR * corporation 0.001 0.013
(0.17) (0.95)
CFR * holding 0.013 0.027
(0.67) (1.28)
CFR * family * performance -0.108 0.054
(1.67)* (0.81)
CFR * government * performance 1.092 3.027
(2.29)** (1.27)
CFR * bank * performance 0.321 0.034
(1.80)* (0.06)
CFR * corporation * performance -0.028 -0.107
(0.57) (1.3)
CFR * holding * performance -0.076 -0.223
(0.52) (1.39)
Mgmt_Prof -0.065 -0.081 -0.076 -0.084
(0.96) (1.12) (1.07) (1.22)
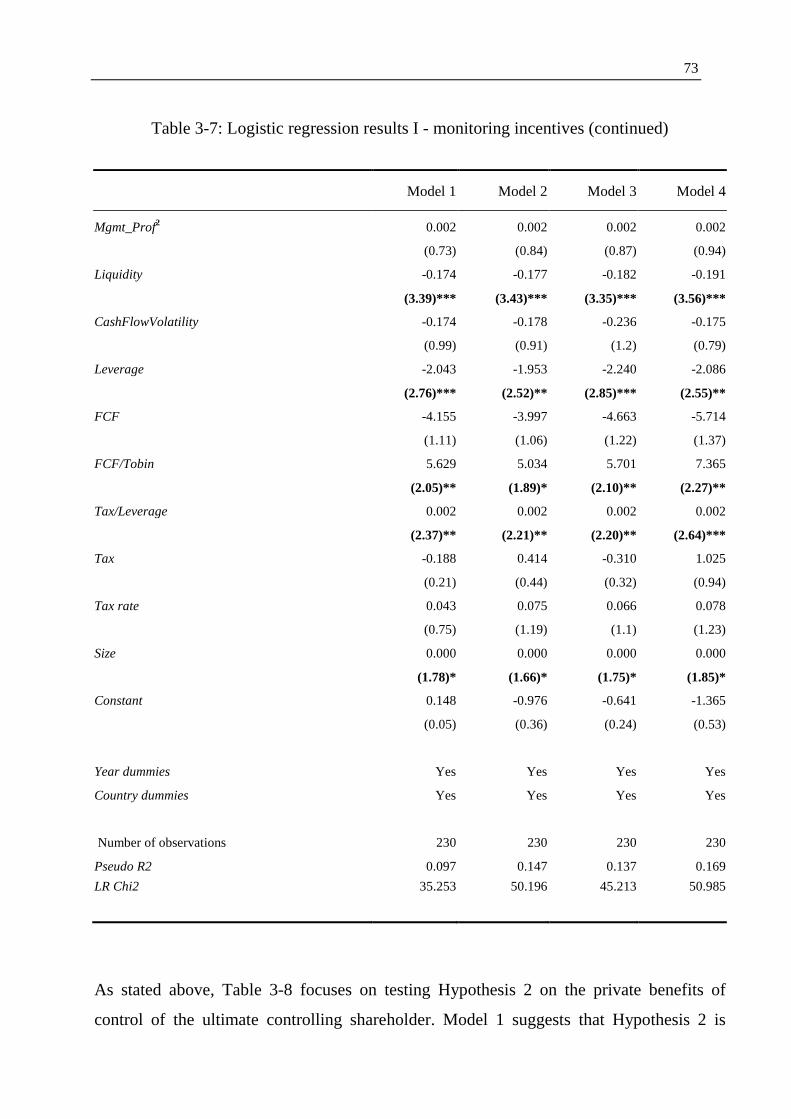
73
Table 3-7: Logistic regression results I - monitoring incentives (continued)
Model 1 Model 2 Model 3 Model 4
Mgmt_Prof2 0.002 0.002 0.002 0.002
(0.73) (0.84) (0.87) (0.94)
Liquidity -0.174 -0.177 -0.182 -0.191
(3.39)*** (3.43)*** (3.35)*** (3.56)***
CashFlowVolatility -0.174 -0.178 -0.236 -0.175
(0.99) (0.91) (1.2) (0.79)
Leverage -2.043 -1.953 -2.240 -2.086
(2.76)*** (2.52)** (2.85)*** (2.55)**
FCF -4.155 -3.997 -4.663 -5.714
(1.11) (1.06) (1.22) (1.37)
FCF/Tobin 5.629 5.034 5.701 7.365
(2.05)** (1.89)* (2.10)** (2.27)**
Tax/Leverage 0.002 0.002 0.002 0.002
(2.37)** (2.21)** (2.20)** (2.64)***
Tax -0.188 0.414 -0.310 1.025
(0.21) (0.44) (0.32) (0.94)
Tax rate 0.043 0.075 0.066 0.078
(0.75) (1.19) (1.1) (1.23)
Size 0.000 0.000 0.000 0.000
(1.78)* (1.66)* (1.75)* (1.85)*
Constant 0.148 -0.976 -0.641 -1.365
(0.05) (0.36) (0.24) (0.53)
Year dummies Yes Yes Yes Yes
Country dummies Yes Yes Yes Yes
Number of observations 230 230 230 230
Pseudo R2 0.097 0.147 0.137 0.169
LR Chi2 35.253 50.196 45.213 50.985
As stated above, Table 3-8 focuses on testing Hypothesis 2 on the private benefits of
control of the ultimate controlling shareholder. Model 1 suggests that Hypothesis 2 is

74
valid: the coefficient on the percentage of voting rights held by the ultimate controlling
shareholder is negative and significant at the 1% level. Models 2 and 3 confirm this result.
In detail, the former model uses the difference between the percentage of voting rights and
the percentage of cash flow rights held by the ultimate controlling shareholder (VR-CFR)
to proxy for the private benefits of control. The coefficient on the difference is negative
and significant at the 1% level, providing further support for Hypothesis 2. In Model 3
private benefits of control are measured by the ratio of the percentage of voting rights over
the percentage of cash flow rights held by the ultimate shareholder (VR/CFR). As in
Models 1 and 2, the coefficient on the proxy for private benefits of control is negative and
significant (at the 5% level) suggesting that firms whose controlling shareholders have
substantial private benefits of control are less likely to be sold off to private equity firms.
Models 4-6 in Table 3-8 take into account the type of the ultimate controlling shareholder
by interacting the measure for private benefits of control with the dummy variable for each
of the five types of ultimate shareholders. In all three models, the likelihood of being
taking over by private equity investors for firms, that are ultimately controlled by a family
which also has substantial benefits of control, is significantly lower compared to firms
controlled by any of the other types of shareholders. Model 5 also suggests that the same
pattern applies to firms which are ultimately controlled by other corporations. However,
this result is not confirmed by Models 4 and 6. Finally, we also test whether the effect
observed for families is a differential effect compared to the other categories of controlling
shareholders or whether this effect is indeed only valid for firms controlled by
shareholders. In other words, what happens if in Models 4-6 of Table 3-8 we also include
the percentage of voting rights held by the ultimate shareholder irrespective of its type?
The results, which are not tabulated, suggest that the private benefits of control only
reduce the likelihood of being taken over by a private equity investor for firms that are
controlled by families, but not for the firms controlled by any of the other types of
shareholders.168
168 In detail, when the percentage of voting rights held by the ultimate controlling shareholder is
included in Model 4 of Table 3-8 neither the latter nor the interaction of the latter with the family dummy variable is significantly different from zero. The reason why the interaction term is no longer significant may be the high correlation of the percentage of votes held by the ultimate shareholder (irrespective of type) with the equivalent percentage for families that are the ultimate shareholder.

75
To summarize the results from Table 3-8, there is clear evidence that firms whose ultimate
controlling shareholder has substantial private benefits of control are less likely to end up
being the targets of private equity investors. This is in line with Hypothesis 2. We also find
that private benefits of control reduce the likelihood of a private equity acquisition for the
case of firms that are ultimately controlled by families and corporations. This confirms the
results from the existing literature which also finds that private benefits of control are an
issue in firms controlled by families and corporations. However, we do not find support
that private benefits of control are an issue in firms controlled by holding companies.
Table 3-8: Logistic regression results II - private benefits of control
This table focuses on testing Hypothesis 2 on the private benefits of control of the ultimate controlling shareholder. The table estimates the likelihood of a private equity transaction for the private equity targets and the control group by means of binary logit regressions. The dependent variable is coded 1 for the private equity target firms and 0 for the control firms. The independent variables are defined as in Table 3-1. Chi2 denotes the value for the likelihood Chi square. The values in parentheses denote the values for the z-statistics. *, ** and *** denote statistical significance at the 10%, 5% and 1% level, respectively.
Model 1 Model 2 Model 3 Model 4 Model 5 Model 6
VR -0.019
(2.90)***
VR-CFR -0.045
(2.87)***
VR/CFR -0.317
(2.19)**
VR * family -0.023
(3.55)***
VR * government 0.024
(0.89)
The correlation coefficient is equal to 0.617. When the equivalent augmented Model 5 is run, the coefficient on the difference in the percentage of votes and the percentage of cash flow rights held by the ultimate shareholder (irrespective of type) and the coefficient on the equivalent difference for families are both significant, have the same magnitude in absolute value, but have opposite signs. In other words, the latter coefficient is negative, the former is positive and they cancel each other out for firms with a family as their ultimate controlling shareholder. Still, our results are upheld as firms controlled by families are less likely to be the target of private equity investors. Finally, in the augmented Model 6 the interaction term for families is significantly negative as before and the coefficient on the ratio of the percentage of voting rights over the percentage of cash flow rights is not significant. Hence overall, these results suggest that private benefits of control only have an effect on the likelihood of the firm being taken over by a private equity investor for firms that are ultimately controlled by a family.
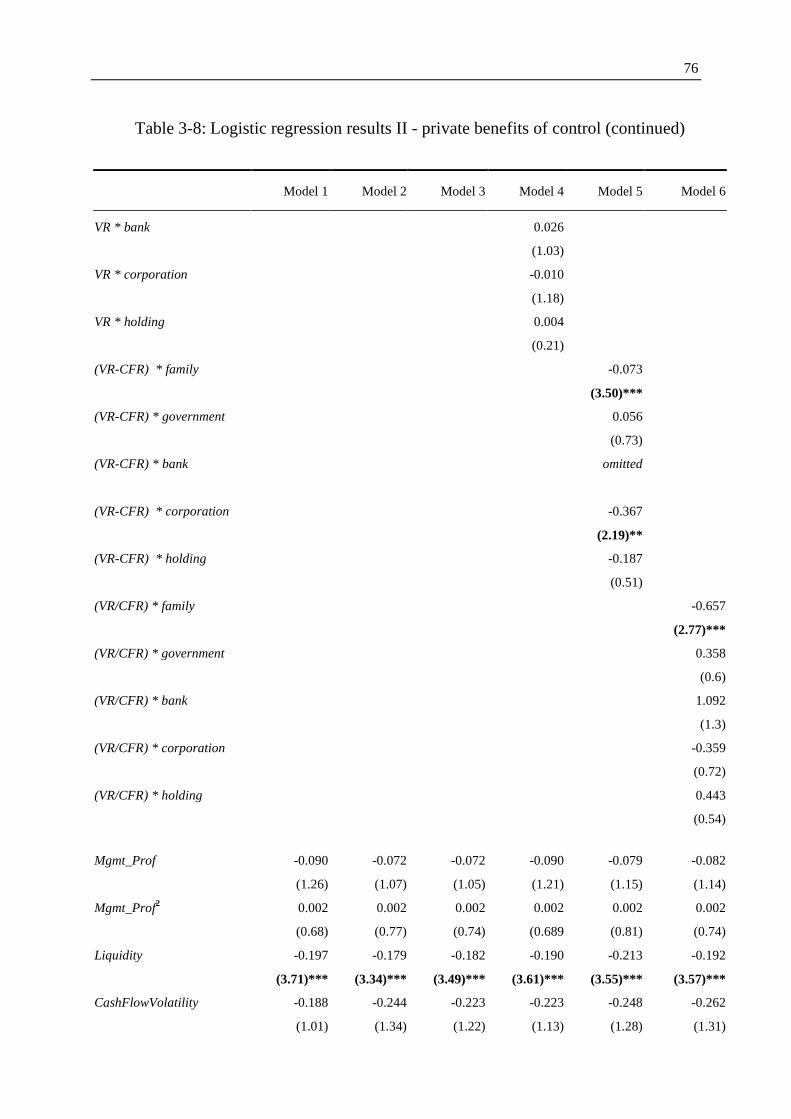
76
Table 3-8: Logistic regression results II - private benefits of control (continued)
Model 1 Model 2 Model 3 Model 4 Model 5 Model 6
VR * bank 0.026
(1.03)
VR * corporation -0.010
(1.18)
VR * holding 0.004
(0.21)
(VR-CFR) * family -0.073
(3.50)***
(VR-CFR) * government 0.056
(0.73)
(VR-CFR) * bank omitted
(VR-CFR) * corporation -0.367
(2.19)**
(VR-CFR) * holding -0.187
(0.51)
(VR/CFR) * family -0.657
(2.77)***
(VR/CFR) * government 0.358
(0.6)
(VR/CFR) * bank 1.092
(1.3)
(VR/CFR) * corporation -0.359
(0.72)
(VR/CFR) * holding 0.443
(0.54)
Mgmt_Prof -0.090 -0.072 -0.072 -0.090 -0.079 -0.082
(1.26) (1.07) (1.05) (1.21) (1.15) (1.14)
Mgmt_Prof2 0.002 0.002 0.002 0.002 0.002 0.002
(0.68) (0.77) (0.74) (0.689 (0.81) (0.74)
Liquidity -0.197 -0.179 -0.182 -0.190 -0.213 -0.192
(3.71)*** (3.34)*** (3.49)*** (3.61)*** (3.55)*** (3.57)***
CashFlowVolatility -0.188 -0.244 -0.223 -0.223 -0.248 -0.262
(1.01) (1.34) (1.22) (1.13) (1.28) (1.31)
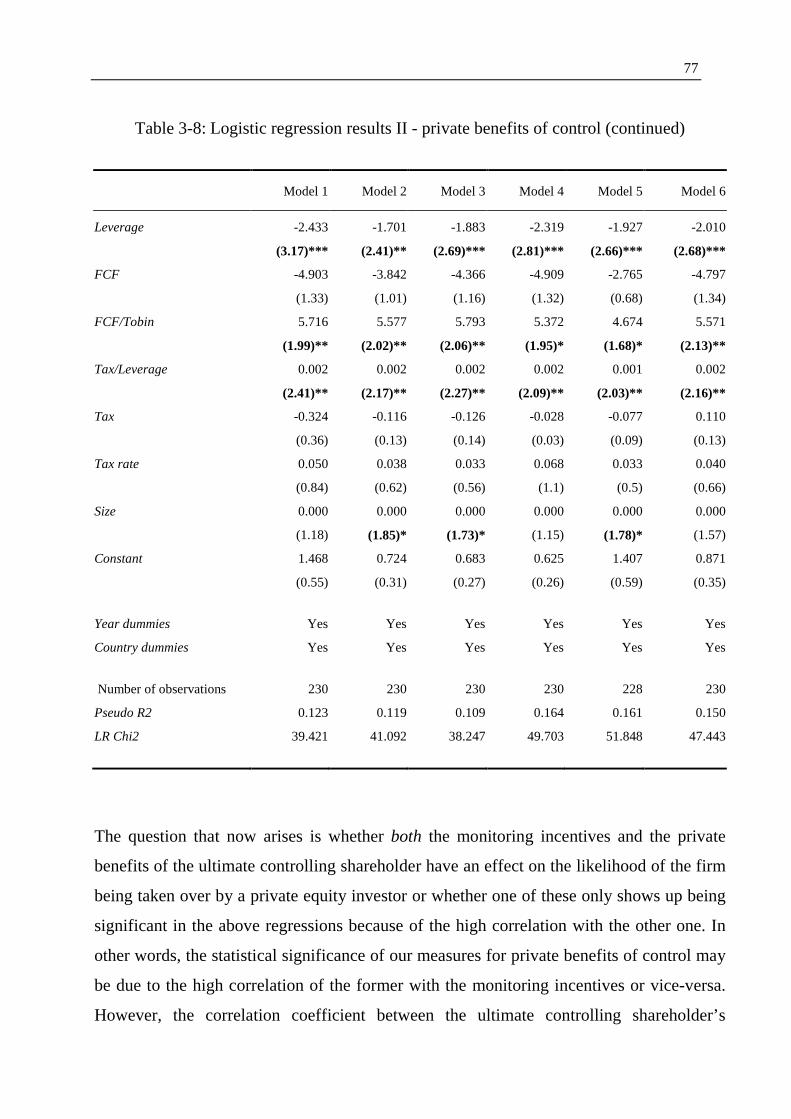
77
Table 3-8: Logistic regression results II - private benefits of control (continued)
Model 1 Model 2 Model 3 Model 4 Model 5 Model 6
Leverage -2.433 -1.701 -1.883 -2.319 -1.927 -2.010
(3.17)*** (2.41)** (2.69)*** (2.81)*** (2.66)*** (2.68)***
FCF -4.903 -3.842 -4.366 -4.909 -2.765 -4.797
(1.33) (1.01) (1.16) (1.32) (0.68) (1.34)
FCF/Tobin 5.716 5.577 5.793 5.372 4.674 5.571
(1.99)** (2.02)** (2.06)** (1.95)* (1.68)* (2.13)**
Tax/Leverage 0.002 0.002 0.002 0.002 0.001 0.002
(2.41)** (2.17)** (2.27)** (2.09)** (2.03)** (2.16)**
Tax -0.324 -0.116 -0.126 -0.028 -0.077 0.110
(0.36) (0.13) (0.14) (0.03) (0.09) (0.13)
Tax rate 0.050 0.038 0.033 0.068 0.033 0.040
(0.84) (0.62) (0.56) (1.1) (0.5) (0.66)
Size 0.000 0.000 0.000 0.000 0.000 0.000
(1.18) (1.85)* (1.73)* (1.15) (1.78)* (1.57)
Constant 1.468 0.724 0.683 0.625 1.407 0.871
(0.55) (0.31) (0.27) (0.26) (0.59) (0.35)
Year dummies Yes Yes Yes Yes Yes Yes
Country dummies Yes Yes Yes Yes Yes Yes
Number of observations 230 230 230 230 228 230
Pseudo R2 0.123 0.119 0.109 0.164 0.161 0.150
LR Chi2 39.421 41.092 38.247 49.703 51.848 47.443
The question that now arises is whether both the monitoring incentives and the private
benefits of the ultimate controlling shareholder have an effect on the likelihood of the firm
being taken over by a private equity investor or whether one of these only shows up being
significant in the above regressions because of the high correlation with the other one. In
other words, the statistical significance of our measures for private benefits of control may
be due to the high correlation of the former with the monitoring incentives or vice-versa.
However, the correlation coefficient between the ultimate controlling shareholder’s

78
percentage of votes and the percentage of cash flow rights is only 0.481. Further, the
equivalent correlation coefficient for families is even lower with 0.277. The relatively low
values for these correlation coefficients suggest the following conclusions. First, the
correlation between cash flow rights and voting rights is not severe. Second, most of the
deviations between votes and cash flow rights occur in firms under family control as
reflected by the low value of the latter correlation coefficient. This would also explain why
the monitoring incentives and the private benefits of control of the ultimate controlling
shareholder only have an impact on the likelihood of a private equity acquisition if the
latter is a family.
Still, it is important to check the robustness of our results – in particular, the validity of
both Hypothesis 1 and Hypothesis 2 - by running further regressions. These regressions
include both a measure for the monitoring incentives and a measure for the private benefits
of control of the ultimate controlling shareholder. The results of these regressions are
reported in Table 3-9. Both Model 1 and Model 2 include the interaction terms between
the dummies for the various types of ultimate controlling shareholder and the monitoring
incentives for the ultimate shareholder as proxied by the percentage of cash flow rights
s/he holds. Further, both models contain the interaction terms between the same dummies
and the measure for private benefits of control. In Model 1 the latter is the difference
between the percentage of voting rights and the percentage of cash flow rights held by the
ultimate shareholder (VR-CFR) and in Model 2 it is the ratio of the former over the latter
(VR/CFR). In both models, both the interaction term between the percentage of cash flow
rights and the dummy for families and the equivalent interaction term for private benefits
of control are negative and significantly different from zero at the 1% level. This suggests
that both Hypothesis 1 and Hypothesis 2 are valid for the case of firms that are ultimately
controlled by a family. Further, when the marginal effects are analysed Model 1 suggests
that a one-percent increase in the measure of private benefits of control has twice the effect
on the likelihood of the firm being taken over by private equity investors than a one-
percent increase in the monitoring incentives. While the units for the monitoring incentives
and the private benefits of control in Model 2 are different, the second model still confirms
that the latter’s effect is stronger than the former’s effect. This result may explain why the
previous literature has found fairly strong evidence of the exploitation of private benefits
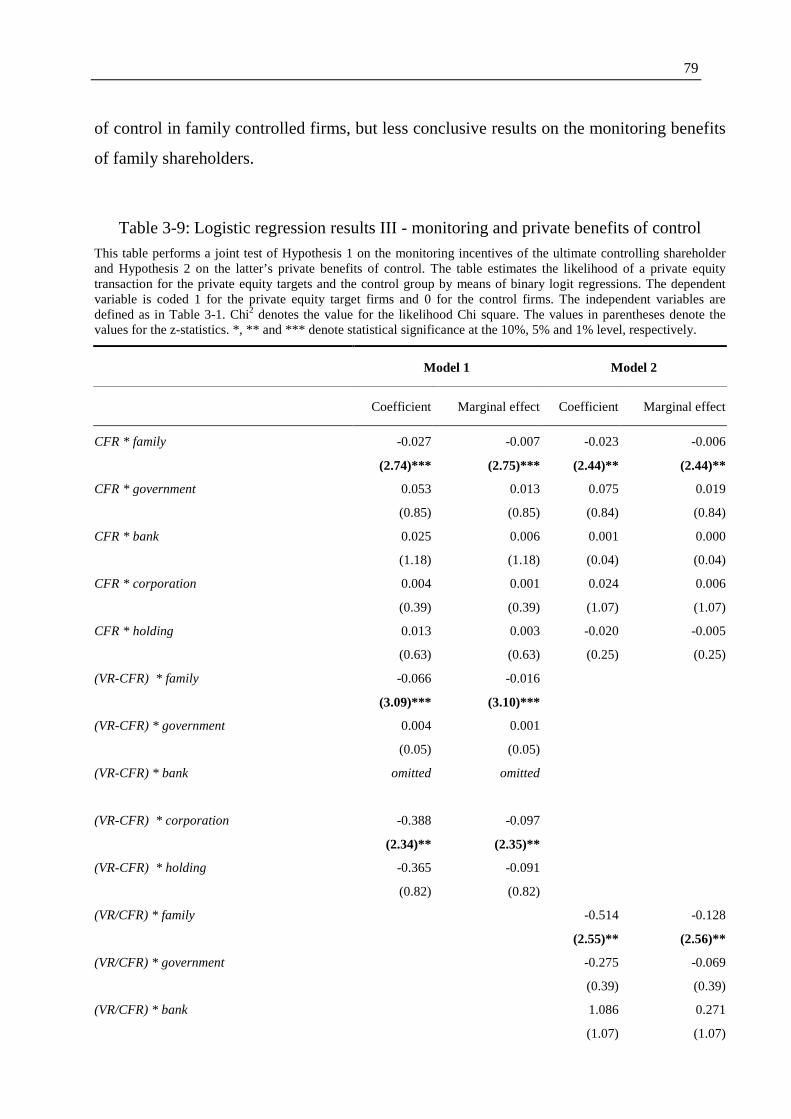
79
of control in family controlled firms, but less conclusive results on the monitoring benefits
of family shareholders.
Table 3-9: Logistic regression results III - monitoring and private benefits of control
This table performs a joint test of Hypothesis 1 on the monitoring incentives of the ultimate controlling shareholder and Hypothesis 2 on the latter’s private benefits of control. The table estimates the likelihood of a private equity transaction for the private equity targets and the control group by means of binary logit regressions. The dependent variable is coded 1 for the private equity target firms and 0 for the control firms. The independent variables are defined as in Table 3-1. Chi2 denotes the value for the likelihood Chi square. The values in parentheses denote the values for the z-statistics. *, ** and *** denote statistical significance at the 10%, 5% and 1% level, respectively.
Model 1 Model 2
Coefficient Marginal effect Coefficient Marginal effect
CFR * family -0.027 -0.007 -0.023 -0.006
(2.74)*** (2.75)*** (2.44)** (2.44)**
CFR * government 0.053 0.013 0.075 0.019
(0.85) (0.85) (0.84) (0.84)
CFR * bank 0.025 0.006 0.001 0.000
(1.18) (1.18) (0.04) (0.04)
CFR * corporation 0.004 0.001 0.024 0.006
(0.39) (0.39) (1.07) (1.07)
CFR * holding 0.013 0.003 -0.020 -0.005
(0.63) (0.63) (0.25) (0.25)
(VR-CFR) * family -0.066 -0.016
(3.09)*** (3.10)***
(VR-CFR) * government 0.004 0.001
(0.05) (0.05)
(VR-CFR) * bank omitted omitted
(VR-CFR) * corporation -0.388 -0.097
(2.34)** (2.35)**
(VR-CFR) * holding -0.365 -0.091
(0.82) (0.82)
(VR/CFR) * family -0.514 -0.128
(2.55)** (2.56)**
(VR/CFR) * government -0.275 -0.069
(0.39) (0.39)
(VR/CFR) * bank 1.086 0.271
(1.07) (1.07)
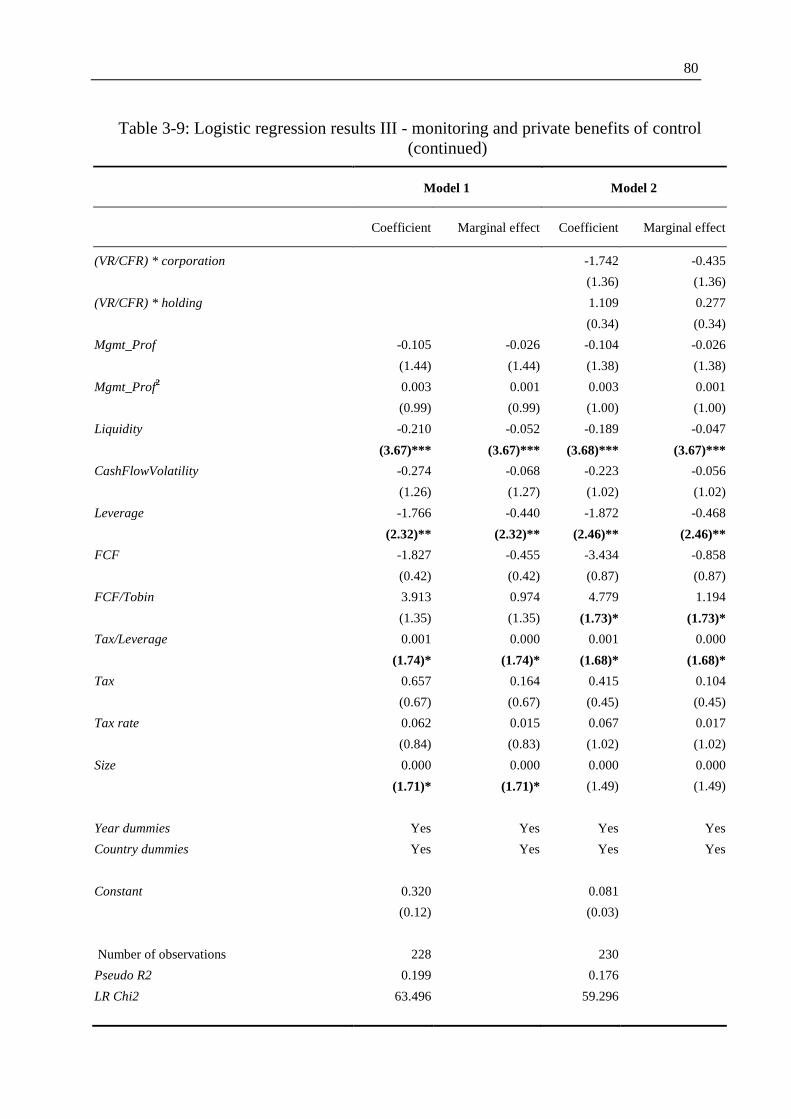
80
Table 3-9: Logistic regression results III - monitoring and private benefits of control (continued)
Model 1 Model 2
Coefficient Marginal effect Coefficient Marginal effect
(VR/CFR) * corporation -1.742 -0.435
(1.36) (1.36)
(VR/CFR) * holding 1.109 0.277
(0.34) (0.34)
Mgmt_Prof -0.105 -0.026 -0.104 -0.026
(1.44) (1.44) (1.38) (1.38)
Mgmt_Prof2 0.003 0.001 0.003 0.001
(0.99) (0.99) (1.00) (1.00)
Liquidity -0.210 -0.052 -0.189 -0.047
(3.67)*** (3.67)*** (3.68)*** (3.67)***
CashFlowVolatility -0.274 -0.068 -0.223 -0.056
(1.26) (1.27) (1.02) (1.02)
Leverage -1.766 -0.440 -1.872 -0.468
(2.32)** (2.32)** (2.46)** (2.46)**
FCF -1.827 -0.455 -3.434 -0.858
(0.42) (0.42) (0.87) (0.87)
FCF/Tobin 3.913 0.974 4.779 1.194
(1.35) (1.35) (1.73)* (1.73)*
Tax/Leverage 0.001 0.000 0.001 0.000
(1.74)* (1.74)* (1.68)* (1.68)*
Tax 0.657 0.164 0.415 0.104
(0.67) (0.67) (0.45) (0.45)
Tax rate 0.062 0.015 0.067 0.017
(0.84) (0.83) (1.02) (1.02)
Size 0.000 0.000 0.000 0.000
(1.71)* (1.71)* (1.49) (1.49)
Year dummies Yes Yes Yes Yes
Country dummies Yes Yes Yes Yes
Constant 0.320 0.081
(0.12) (0.03)
Number of observations 228 230
Pseudo R2 0.199 0.176
LR Chi2 63.496 59.296
81
3.4.2.2 Secondary variables
The above discussion has focused on the tests of Hypothesis 1 and Hypothesis 2. In what
follows, we shall concentrate on the other factors which have been advanced by
Hypotheses 3 to 7 to have an influence on the likelihood of a firm being taken over by a
private equity investor.169 Table 3-7 to Table 3-9 do not provide any support for
Hypothesis 3 which states that firms with relatively low or relatively high managerial
ownership are more likely to be taken over by private equity investors. The absence of
support for Hypothesis 3 is in line with the conclusions drawn from Table 3-6 which did
not find any differences in managerial ownership between private equity targets and the
control group of non-acquired firms either.
Conversely, there is fairly strong support for Hypothesis 4 on the tax benefit from
leverage. As predicted, Leverage and Tax/Leverage have a significantly negative and
significantly positive effect, respectively, on the likelihood of the firm being taken over by
a private equity investor. However, the other two measures of the tax benefit from leverage
– the firm’s total tax payment (Tax) and the statutory corporate tax rate (Tax Rate) – do not
have any significant impact on that likelihood. There is also support for Hypothesis 5 on
the bonding advantage of leverage as the ratio of free cash flow over Tobin’s Q is
consistently significant at the 10% level in all of the regressions in Table 3-7 to Table 3-9.
On the contrary, there is no support for Hypothesis 6 as there is no evidence suggesting
that firms with more stable cash flows are more likely targets for private equity investors.
Finally, there is very strong support for Hypothesis 7 as the liquidity of the firm’s stock
has a negative impact on the likelihood of it being acquired by a private equity firm.
3.5 Summary
Given that corporate governance in continental Europe differs markedly from that in the
UK and US (Faccio/Lang (2002)), the motives for private equity transactions and the
characteristics of targets are also likely to differ. The most important difference concerns
169 As stated in footnote 3, in line with the existing literature we also considered the firm’s valuation as a
motive for a private equity acquisition. We did not find this variable to have a significant impact on the likelihood of the firm being taken over by a private equity investor.

82
ownership and control. While most publicly traded companies in the US and the UK are
widely held, most continental European companies have large shareholders, such as
families (Faccio/Lang (2002), Andres (2008)). Given the size of their stake, these large
shareholders are likely to have the right incentives to monitor the management. However,
not all large shareholders may engage in monitoring. In other words, if the large
shareholder monitors the management, this is likely to make the firm less attractive to
private equity investors given that there is less potential for value creation by the latter.
Conversely, a large shareholder who is not able to monitor the management, maybe
because of a lack of skills, may be more intent on selling her/his firm to private equity
investors. Further, strong control may also generate costs as the large shareholders may use
their control rights to their own benefit and extract private benefits from the firm at the
expense of the other shareholders. As a result, private equity investors may avoid
companies whose controlling shareholders extract private benefits of control and are only
willing to sell their stakes at a premium which is high enough to compensate them for the
loss of their benefits.
This chapter has four major contributions. First, it contributes to the as yet limited
literature on private equity transactions outside Anglo-Saxon countries (see e.g. Andres et
al. (2007), Achleitner/Hinterramskogler (2008), Achleitner et al. (2011 forthcoming) and
Geranio/Zanotti (2011 forthcoming)). Whereas previous studies mainly focus on the
wealth effects of going private transactions or LBOs as well as their determinants, we
investigate the motivation of private equity investors to acquire target firms. Second, it
analyses the role of private equity investors in the continental European market which is
characterized by very different corporate governance compared to Anglo-Saxon countries.
In particular, we test hypotheses relating to the monitoring incentives and the private
benefits of control of the large shareholder. Third, we find further evidence about the types
of large shareholders that are likely to monitor the management and those that are unlikely
to oversee the activities of the latter. The existing literature on the types of shareholders
that are active rather than passive is as yet sparse and does not provide consistent
conclusions. Studying private equity acquisitions of continental European firms enables us
to investigate the monitoring role of a much larger range of different large shareholders –
including families, corporations, banks, holding companies and governments – than UK or
83
US data would have enabled us. Indeed, UK and US corporations are typically widely held
and the few large minority shareholders there are tend to be institutional investors. Fourth,
unlike previous studies on going private transactions, we clearly distinguish between the
tax advantage and the disciplinary role of leverage. We find evidence in favour of both
roles of leverage.
We find strong evidence that the likelihood of a company becoming the target of a private
equity investor is influenced by the monitoring incentives and the private benefits of
control enjoyed by the incumbent large shareholder. However, this pattern only emerges
when we distinguish between the various types of large shareholders and it only applies to
firms whose ultimate controlling shareholder is a family. This provides further evidence
about the types of shareholders that monitor the management and those that do not. It also
provides further insights on the types of shareholders likely to expropriate minority
shareholders. Our evidence suggests that families are more likely to expropriate the
minority shareholders in their firms than other types of controlling shareholders. Further,
we also find that for firms controlled by families that a one-percent increase in the measure
of private benefits of control has twice the negative effect on the likelihood of the firm
being taken over by private equity investors than a one-percent increase in the monitoring
incentives. This result may explain why the previous literature has found fairly strong
evidence of the exploitation of private benefits of control in family controlled firms, but
less conclusive results on the monitoring benefits of family shareholders.
We also find support that the tax benefit from increasing leverage and the bonding role of
further leverage influence the likelihood of a firm being acquired by a private equity
investor. In addition, we also find that firms with illiquid shares are more likely to be the
targets of private equity investors.
84
4 How much do Private Equity Investors Pay for Continental European Firms?170
4.1 Introduction
In the early 2000s, the buyout market recovered and commenced a new surge which
culminated with the onset of the financial crises in July 2007. One notable development of
this second buyout wave was the rise of an active continental European private equity
market as stressed by Strömberg (2007): “The non-US private equity activity has grown to
be larger than that of the US in the last few years, where the growth of continental
European LBOs has been particularly pronounced.”171 Although the continental European
market differs in many perspectives from its Anglo-Saxon relatives, there is a dearth of
private equity research in the continental European context.172 We address this gap by
examining the pricing of going private buyouts, i.e. acquisitions of large, publicly listed
companies. This type of deal has been responsible for much of the last wave’s transaction
volume173 and the availability of comprehensive data encompassing sharp market prices
provides an opportunity to examine the pricing and its underlying sources in detail.
Given that corporate governance in continental Europe differs markedly from that in the
UK and US, the pricing of private equity transactions and the characteristics of targets are
also likely to differ. The most important difference concerns the ownership structure.
While firms in the Anglo-Saxon jurisdictions are owned by small, dispersed shareholders,
firms in continental Europe are held by large blockholders (Enriques/Volpin (2007),
amongst others). Given the size of their stake, these large shareholders are likely to have
the right incentives to monitor the management (Jensen/Meckling (1976) and
Shleifer/Vishny (1986)). However, not all types of large shareholders, such as the
170 A previous version of this chapter was used as the basis for the paper “Private equity and wealth effects
in blockholder-based governance regimes” which is joint work with Ann-Kristin Achleitner. 171 Cf. Strömberg (2007), p. 5. 172 Cf. for instance Renneboog/Simons/Wright (2007) who state that “hardly anything is known about the
continental European private equity market” (Renneboog/Simons/Wright (2007), p. 620). 173 Continental European going private buyouts have seen a large wave since 1997. According to CMBOR
(2007), the annual deal volume of these transactions in Continental Europe has grown over the decade 1997-2006 from €m 286 to a new record of €m 32,027. This indicates an annual growth rate of 60%. Relative values reveal a similar pattern. In 2006, the volume of going private buyouts in comparison to all buyouts rose to a new high of 26.4%.
85
government for instance, may engage in monitoring. Ultimately, if the large shareholder
monitors the management, abnormal returns and premiums conferred by a private equity
acquisition should be lower as these targets offer less remaining potential for
corresponding agency cost reductions. While the presence of a large outside blockholder
mitigates the traditional agency conflict between managers and shareholders, it raises a
different conflict of interest which is labelled by Enriques/Volpin (2007) as the
“fundamental problem of corporate governance in CE”:174 the large stake may also induce
blockholders to use their control rights to their own benefit and extract private benefits
from the firm at the expense of remaining shareholders (Barclay/Holderness (1989) and
Bebchuk (1999)). This concern is particularly relevant on the background of a historically
weaker minority shareholder protection in continental Europe (La Porta et al. (1999)). As a
result, these blockholders are only willing to sell their stake to a private equity investor at a
premium which is high enough to compensate them for the loss of their benefits. Such
rent-extraction by the largest shareholders can be curbed by the presence of a second large
shareholder. Consequently, abnormal returns and premiums conferred by a private equity
acquisition should be lower if there is a second large blockholder in the pre-buyout
company who confines the discretion of the largest shareholder to appropriate private
benefits.
Besides the corporate governance system, there are also numerous other differences
between Anglo-Saxon and continental European markets which challenge the view that
results for the former are transferrable to the latter. For instance, the legal and fiscal
regulation for structuring and executing a private equity acquisition has been traditionally
more demanding in continental Europe than in the developed US or UK markets
(Renneboog/Simons (2005)). Consequently, the risk and expected cost of executing a
buyout is higher in continental Europe. Differences in the debt markets, such as less active
high yield bond markets in continental Europe and a syndicated loan market where pricing
still depends more on (regional) banks than institutional investors (Standard & Poor's
(2010)), are also likely to affect the financial engineering decisions of private equity
174 Cf. Enriques/Volpin (2007), p. 117.
86
funds.175 Furthermore, the market for corporate control has been traditionally less active in
continental Europe and hostile transactions are hardly encountered (Franks/Mayer (2001)
and Goergen/Renneboog (2004)). Hence, one might speculate that private equity investors
face a less competitive bidding environment. For all these reasons, a detailed examination
of the pricing of continental European private equity acquisitions is compelling.
To study the pricing of continental European private equity acquisitions, we self-collect a
sample of 101 going private buyouts including precise information about the (i) target
ownership structure,176 accounting and stock performance, (ii) private equity bidder
characteristics and (iii) deal characteristics. While the focus of this chapter is on buyout
pricing in the form of the final premiums paid by the private equity investor, we also
calculate abnormal returns to shareholders around the buyout announcement. In the
respective check of the underlying information release process, we notice that in 20 cases
the disclosure of the takeover as a private equity backed going private buyout happens not
in one but two steps.177 Consequently, a two-step event study is employed to arrive at
unbiased estimates.
We find that private equity investors pay a final mean premium of 28.3% relative to the
market price two months before the announcement date. This value is 3.0 percentage
points lower than for comparable US transactions.178 The pattern is consistent with the
aforementioned monitoring incentives of large blockholders to curtail managerial
misbehavior and, potentially, with the restriction of their own private benefits consumption
due to peer cross-monitoring. Further, we find that shareholders gain around the
175 Axelson et al. (2007) provide evidence in line with this notion. In a comparison of European and US
buyouts, they show that the former ones (1) employ a higher (lower) proportion of bank debt (bonds) (2) contain more tranches of bank debt and (3) assume higher debt amounts from their targets.
176 In this chapter, the term ownership refers to the voting rights of first-tier shareholders. Consequently, the ownership statistics and the related evidence are not fully congruent in chapter 3 and 4 but they are likely to be highly compatible. An interesting avenue for future research would be to extend the analyses in this chapter from the first-tier to the ultimate ownership level as best exemplified by the comprehensive revisions from Achleitner/Betzer/Hinterramskogler (2008) to Achleitner et al. (2011 forthcoming).
177 The first announcement generally refers to takeover negotiations with an undisclosed party or the firm’s intention to go private. The involvement of a private equity investor, however, is only disclosed in a subsequent second announcement.
178 Cf. section 4.4.1.2 for a detailed discussion. The US reference values are based on Bargeron et al. (2008) and chapter 5 of this dissertation.
87
announcement day abnormal returns of 13.0% in the [-1,1] event window. While this value
is significantly positive, it is 7.7 percentage points lower than in the US case. This value
underlines the higher deal completion risk in continental Europe and the outlined
monitoring and private benefits arguments.
When examining the underlying premium and abnormal return sources with cross-
sectional regressions, there is indeed strong support for our main argument that the
continental European blockholder structure represents a crucial determinant. Consistent
with the view that buyout targets with a large blockholder offer less remaining value
potential since the latter has the right incentives to curb managerial malpractice, we find
that the stake of the largest outside blockholder is negatively related to the premiums and
abnormal returns. Further, since monitoring efforts may not only vary with the size of the
largest blockholder but also by her/his identity, we extend the analysis and distinguish
between various types of large shareholders. The existing literature on the types of
shareholders that are active rather than passive is sparse and does not provide uniform
conclusions. Consistent with our expectation, we find that the monitoring result holds for
corporations, banks and holdings but not for the government. Interestingly and contrary to
our expectation, the monitoring result seems also to not hold for families. However, the
absence of a clear negative relationship between the stakes of family blockholders and
wealth effects has to be interpreted with care. It may be that private benefit consumption as
a competing factor may counterbalance the monitoring activities of families and
consequently, the latter effect may not show up in the form of lower premiums and
abnormal returns in the current empirical setting.179
We shed light on the private benefits argument by examining whether the presence of a
second large shareholder, who can act as a monitor of the dominant blockholder and curtail
her/his rent extraction, is related to the premiums and abnormal returns. Consistent with
the monitor-of-the-monitor argument, we find that the premiums and abnormal returns are
lower for targets where a second large blockholder was inherent in the pre-buyout firm.
179 Chapter 3 lends support to this conjecture. In particular, it was shown that companies with large family
blockholders have a lower takeover probability since these families are likely to consume substantial private benefits and therefore demand higher premiums.

88
In addition to the central monitoring and private benefits results, there is widespread
evidence that the relative underperformance of the target in comparison to the stock market
confers higher premiums and abnormal returns. This lends support to Kaplan and Schoar’s
(2005) notion that private equity investors are sophisticated investors with an excellent
network which allows them to spot underperforming firms and increase their value under
private ownership. Furthermore, there is also weak evidence that a thin, pre-buyout trading
volume of the target stock amplifies the premiums.
This chapter contributes to the work on the pricing of private equity sponsored going
private acquisitions. This stream of the literature has focused on the Anglo-Saxon capital
markets.180 Based on the increased relevance of the continental European markets, we
examine going private buyouts in continental Europe where in particular the blockholder
structure via the monitoring and private benefits argument may lead to different results. A
notable feature of the research setting is the combination of the blockholder structure and
sharp pricing measures due to market prices. Thereby, this chapter may not only help in
understanding the pricing of public buyout targets but also the pricing of private buyout
targets who are characterised by concentrated ownership but lack sharp, market quote
based pricing measures.
Most closely related is the contemporaneous work of Achleitner et al. (2011
forthcoming).181 They examine announcement returns to a limited sample of 48 private
equity investments on the German stock market encompassing both minority and majority
transactions. In contrast, this chapter focuses on the premiums for a sample of 101 private
equity deals in continental Europe consisting solely of going private transactions which
lead to full control.182 Further, this chapter examines the takeover information release
180 Most notably DeAngelo/DeAngelo/Rice (1984), Kaplan (1989a), Lehn/Poulsen (1989), Bargeron et al.
(2008) and Jenkinson/Stucke (2010). Further studies are Lowenstein (1985), Torabzadeh/Bertin (1987), Amihud (1989), Kaplan (1989a), Kaplan (1989b), Marais/Schipper/Smith (1989), Asquith/Wizman (1990), Frankfurter/Gunay (1992), Lee (1992), Harlow/Howe (1993), Slovin/Sushka (1993), Travlos/Cornett (1993), Easterwood et al. (1994), Renneboog/Simons/Wright (2007), Cao/Lerner (2009), Guo/Hotchkiss/Song (2011 forthcoming) and Officer/Ozbas/Sensoy (2010).
181 Betzer (2006) and Andres/Betzer/Weir (2007) examine as well the shareholder wealth effects of private equity investments in Europe. However, their limited samples consist mainly of UK transactions. Geranio/Zanotti (2011 forthcoming) study public to private transactions in continental Europe but they do not focus on private equity sponsored deals.
182 Consequently, the sample size allows us to arrive at robust results in econometric terms.
89
process in detail and argues that a two-step event study is required to grasp the
announcement effects of private equity acquisitions. Finally, it also tests private equity
fund and deal related hypotheses not considered in Achleitner et al. (2011 forthcoming).
This chapter is organized as follows: section 4.2 reviews the related theoretical and
empirical literature and derives the hypotheses. Section 4.3 describes the sample collection
process and the methodology. The empirical results and their interpretations are presented
in section 4.4. Finally, section 4.5 summarizes the findings and concludes.
4.2 Literature review and hypotheses
This section derives the hypotheses. As emphasized in the introduction, the focus of this
study will lie on the governance hypotheses arising from the blockholder-dominated
ownership pattern in continental Europe. These will be set apart to capital structure,
valuation and private equity hypotheses.183 All hypotheses and respective variables are
summarized in Table 4-1.
4.2.1 Governance hypotheses in the continental European context
The delegation of control from owners to managers confers a conflict of interest as the
owner’s target function of shareholder wealth maximization is unlikely to be fully
congruent with the manager’s function of personal wealth maximization (Jensen/Meckling
(1976), Fama/Jensen (1983)). The conflict is expected to be particularly accentuated at
lower levels of managerial ownership: as directors’ compensation is not adequately linked
to company performance, they face fewer incentives to act in the best interest of
shareholders. They are likely to shirk from investing adequate efforts and/or to divert
resources for their own benefit. Kaplan (1989a) stresses that value increases in buyouts
are partly attributable to such inefficient agency-settings. Private equity investors require
target managers to substantially co-invest in the buyout, thereby aligning their interests to
boost the value of the company (Kaplan/Strömberg (2009)).
183 The categorization of the hypotheses is not mutually exclusive as, for instance, the governance and
capital structure hypotheses are intertwined. The primary goal of the categorization is to impose a sensible structure that makes the study more quickly accessible to the reader.
90
At high levels of ownership, however, the argument shall turn as managerial entrenchment
is likely to set in. For instance, managers who have invested a large stake of their personal
wealth in the company tend to engage in diversifying investments at the corporate level
(May (1995)). While this behaviour benefits themselves, it comes at a cost for
shareholders. Morck et al. (1988) provide empirical evidence for such a non-linear
relationship between managerial ownership and firm value. Consequently, a squared term
of managerial ownership is included in the empirical tests.
H1.1 (incentive alignment - directors’ ownership): There is a non-linear relationship
between pre-buyout managerial ownership and the premiums or abnormal returns,
respectively. At low levels of managerial ownership the relationship is negative while at
high levels it is positive.184
Managements’ leeway in corporate decision making decreases with monitoring efforts
exercised by corporate shareholders (Alchian/Demsetz (1972) and Jensen/Meckling
(1976)). Small shareholders, however, refrain from monitoring as it incurs significant costs
in relation to the benefits earned on their marginal stake. From their perspective, it is more
sensible to free-ride on the monitoring efforts borne by third parties (Grossman/Hart
(1980)). Hence, monitoring occurs in companies where blockholders have large stakes
(Shleifer/Vishny (1986)). Consequently, if private equity investors acquire companies
which have been under the controlling eye of blockholders, premiums and abnormal
returns should be lower as these companies offer less potential for agency cost reductions
stemming from the manager-shareholder conflict. Direct evidence for this comes from
Renneboog et al. (2007). They observe that shareholder wealth effects are lower when
firms are controlled by blockholders. Indirect evidence is provided by Franks/Mayer
(2001). They show that the bid premium is significantly lower for blockholder-governed
German firms than for dispersed Anglo-Saxon firms.185
184 Due to data limitations in the continental European context, we are only able to employ managerial
shareholdings in excess of 5%.184 The expected coefficient of the variable Director is negative while the coefficient of Director2 is expected to be positive.
185 Alternatively, it could also be argued that a negative relationship between the size of the largest shareholder and the wealth effects arises from the mitigation of the free-rider problem due to the bilateral negotiations between the blockholder and private equity investor. However, Eckbo (2009)

91
H1.2 (monitoring - shareholder’s size): Premiums and abnormal returns are negatively
related to the equity stake of the incumbent, largest shareholder.186
In addition to the size of the largest blockholder, monitoring incentives may also vary with
her/his identity. The literature about the types of large shareholders that are likely to
monitor the management and those that are unlikely to oversee the activities of the latter is
as yet sparse and does not provide consistent conclusions. In line with sections 3.2.1.3 and
3.3.3.2, we expect that (outside) families, banks, industrial and commercial corporations
and holding companies monitor the management whereas the government doesn’t.
H1.3 (monitoring - shareholder’s identity): Premiums and abnormal returns are lower
when the largest shareholder is a family, bank, corporation or holding company who shall
have more incentives to engage in monitoring than the government.
The presence of a large outside blockholder renders the traditional agency conflict between
managers and shareholders, but in turn raises a different conflict of interest which is
labelled by Enriques/Volpin (2007) as the “fundamental problem of corporate governance
in continental Europe [and in most non-Anglo-Saxon countries of the world]”:187 Large
shareholders might use their power to extract private benefits at the cost of small
shareholders as stressed by Shleifer/Vishny (1997) and theoretically formalized by
Bebchuk (1999). This concern is particularly relevant on the background of a historically
weaker minority shareholder protection in continental Europe (La Porta et al. (1999)). As a
result, these blockholders are only willing to sell their stake to a private equity investor at a
premium which is high enough to compensate them for the loss of their benefits. Such
private benefit extraction by the largest shareholder can be curbed if there is a second large
shareholder who exerts a monitor-of-the-monitor role. This is demonstrated in detail by
Pagano/Röell (1998), who derive conditions under which blockholders engage in cross-
argues that the free-rider problem is only of minor importance in practice. Consequently, a negative relationship shall be mainly attributable to the monitoring argument.
186 As a proxy for monitoring efforts, we use the equity stake of the largest outside blockholder. The existence of a large shareholder induces the remaining shareholders (with lower ranks in the ownership hierarchy) to free-ride on her/his efforts, i.e. to underinvest in monitoring. Hence, our monitoring variable seems also to be a reasonable proxy from a theoretical point of view. The expected coefficient is negative.
187 Cf. Enriques/Volpin (2007), p. 117.
92
monitoring, thereby curtailing expropriation and increasing shareholder value. This
positive relationship between the existence of a second large shareholder and shareholder
value, is empirically confirmed by Edwards/Weichenrieder (2004) and Achleitner et al.
(2011 forthcoming). Hence, we argue that takeovers of companies, where a second large
shareholder is likely to confine the discretion of the largest shareholder to appropriate
private benefits in the pre-buyout company,188 confers lower premiums and abnormal
returns.
H1.4 (private benefits): Premiums and abnormal returns are lower when there is a second
large blockholder in the pre-buyout company who can confine the discretion of the largest
shareholder to appropriate private benefits.189
4.2.2 Capital structure hypotheses
Private equity investors finance their deals with a substantial increase in leverage in order
to (i) realize additional tax shields and (ii) to discipline management not to waste free cash
flow on negative net present value projects. We shall briefly review the literature on both
of these points below.
At the corporate level, interest payments are deductible from taxable income. Hence, as
highlighted by Modigliani/Miller (1963), an increase in the debt level will create additional
tax shields and thereby rise firm value. Assuming that target firms can increase leverage
independently at similar terms than private equity investors and given that the market for
corporate control is reasonably competitive, ex-ante predictable tax savings from private
equity investor’s recapitalizations should accrue to shareholders. Consequently, we expect
a positive relationship between the level of tax liabilities and premiums or abnormal
returns, respectively. The empirical picture on this question is ambiguous: Lowenstein
188 An alternative (but not mutually exclusive) interpretation would be that the second largest shareholder
acts as an additional monitor of the management besides the largest shareholder. Since the largest shareholder holds in the sample on average 35.26% of the votes, he has relatively high incentives to monitor managers and to appropriate private benefits. Consequently, it is more likely that the second large shareholder will focus her/his efforts more on monitoring the largest shareholder than the managers.
189 As empirical measure, we closely follow Gugler/Yurtoglu (2003) and employ a dummy which is set to one if there is a second large shareholder owning a stake equal or larger than 5%. A negative sign is expected.

93
(1985) and Kaplan (1989b) show results consistent with the tax benefit argument in
contrast to the results of Lehn/Poulsen (1989), Frankfurter/Gunay (1992), Halpern et al.
(1999) and Renneboog et al. (2007).
According to Jensen’s (1986) seminal free cash flow theory, managers are prone to invest
excess cash in projects which do not earn the required rate of return but increase their own
welfare. For instance, managers will rather increase firm size and their compensation
through new projects than restraining it through cash pay-outs to shareholders (Murphy
(1985)). Hence, companies with high excess cash positions are interesting candidates for
private equity investors, as managerial malpractice can be curbed through increased debt
liabilities (i.e. higher interest and principal payments). Consequently, we expect that
premiums and abnormal returns are higher for target companies with high levels of free-
cash-flow. The empirical evidence on the free-cash-flow hypothesis is inconclusive: while
Lehn/Poulsen (1989) and Frankfurter/Gunay (1992) find evidence for Jensen’s (1986)
seminal argument, the one’s of Travlos/Cornett (1993), Halpern et al. (1999) and
Renneboog et al. (2007) fail to find empirical evidence.
H 2.1 (leverage, tax and free cash flow): Premiums and abnormal returns are higher when
companies offer high debt capacities, high tax levels and high free cash flow levels.190
Buyout pricing may not only be driven by the firm-specific debt capacity, but also by the
periodical, market-wide mispricing in the debt and equity markets. When debt is relatively
cheap in comparison to equity, private equity investors will take advantage of this situation
(Kaplan/Strömberg (2009)). Favourable lending rates, which do not fully account for the
intrinsic risk of the company, will induce private equity investors to take on larger amounts
of debt financing. In particular, this might result from the compensation scheme of general
partners as pointed out by Axelson et al. (2009): general partners are typically entitled to a
carried interest of 20% if fund returns surpass an agreed hurdle rate. Hence, they hold an
option-like stake which induces them to employ more leverage in deals. The resulting 190 Debt capacity is measured in terms of the prevalent industry measure; net debt divided by EBITDA. The
expected sign is negative. In accordance with previous studies, tax payments standardized by the firm’s market value of equity are employed as a proxy for tax liabilities. The expected sign is positive. The variable FreeCashFlow is defined as operating income before depreciation and amortization minus tax, minus interest and minus dividend payments divided by the market value of equity (Lehn/Poulsen (1989)). A positive sign is expected for this variable.
94
value increase of their “option”, in turn, increases their willingness to pay higher prices.
Since shareholders are able to evaluate lending conditions at the announcement, the
perspective of a larger premium is also likely to translate into a higher announcement
return. There is empirical evidence for both the first and second buyout wave that the
availability of “cheap” debt influences the pricing of buyouts (Kaplan/Stein (1993) and
Axelson et al. (2010)).
H 2.2 (debt market timing): Premiums and abnormal returns are higher when there are
favourable lending conditions.191
4.2.3 Valuation hypotheses
There is anecdotal and academic evidence that firms with relatively low valuation levels
are taken private (Maupin et al. (1984), Weir et al. (2005) and Renneboog et al. (2007),
amongst others). Such an undervaluation may originate, for instance, from a lack of
financial visibility. In particular, small companies with low stock analyst and press
coverage shall encounter problems to reveal the firm’s true potential to the market. This
low market visibility is likely to convey a low trading volume.192
As sophisticated investors with an excellent network in the financial community, private
equity general partners are supposed to have “proprietary deal flow” (Kaplan/Schoar
(2005) which helps them to identify undervalued companies. The premiums and abnormal
returns are likely to be positively related to the level of undervaluation since the latter
indicates both a low basis price for the premium and ample value creation potential.193
Similarly, the premiums and abnormal returns are also likely to be positively related to the
illiquidity of the stock since the latter triggers strong market reactions and requires the
private equity investor to make a substantial offer to secure full control.
191 The London Interbank Offered Rate (LIBOR) is used to construct a proxy for industry-wide lending
conditions. In particular, the average of the daily LIBOR rates (maturity of 12 months) over the interval [-165, -41] relative to the announcement day is calculated.
192 Both undervaluation and illiquidity impair the management to reap the benefits of a listing, e.g. to raise relatively cheap capital (Pagano/Panetta/Zingales (1998) and Boot/Gopalan/Thakor (2008)). Considering the substantial listing costs, managers might be induced to go private.
193 This prediction is empirically supported by Maupin/Bidwell/Ortegren (1984) and Renneboog/Simons/Wright (2007), amongst others.

95
H 3.1 (performance, liquidity): Premiums and abnormal returns are higher when
companies have a low prior stock performance and a thin trading volume.194
The potential for private equity investors to benefit from their identification skills of
undervalued targets is constrained by bidding competition and resistance from target
managers.
H 3.2 (challenged, hostile): Premiums and abnormal returns are higher when the deal
involved a competing offer and/or a hostile target.
4.2.4 Private equity hypotheses
During the last buyout wave, private equity investors have increasingly joined forces to bid
as consortiums for targets. This rise was accompanied by concerns that club deals present
syndicates of potential rivals leading to less bidding competition at the detriment of target
shareholders.195 Empirical evidence on this issue is mixed. Officer et al. (2010) report that
vendors earn approximately 10% less in club- than sole-sponsored deals. This result,
however, is not upheld in contemporary work by Boone/Mulherin (2009) who find no
negative effects of club deals on either target returns or takeover competition measures.196
They argue that consortium formation seems to be rather explained by competitive reasons
(such as scale, risk and bidder expertise) than by collusion motives. Although the final jury
on this question is still out, the launch of investigations by the US Department of Justice
underlines the increased potential for anticompetitive behaviour through club deals.
Consequently, we hypothesise:
194 The variable PriorStockPerformance is defined as the share price 40 days before the announcement date
divided by the average price over the 2 antecedent years. In order to exclude market movements, the figure is divided by the equivalent ratio of the DJ EUROSTOXX market index, which embraces large, middle and small capitalisation companies of 12 Eurozone countries (UK not included). The variable liquidity is defined as the fraction of days with zero percent returns over the half year period up to the event window starting at day t = - 40.
195 Competition may be either directly reduced via the simple reduction of auction participants (Graham/Marshall (1987) and McAfee/McMillan (1992)) or indirectly via the greater likelihood for collusive agreements (Stigler (1964)).
196 Boone/Mulherin (2009) collect from SEC files “the number of potential bidders contacted by the target, the number of potential bidders receiving confidential information, and the number of bidders making both non-binding and binding offers” (Boone/Mulherin (2009), p. 4).
96
H 4.1 (private equity - syndication): Premiums and abnormal returns are lower in club-
than in sole-sponsored deals.197
Ljungqvist et al. (2007) show, in a theoretical model, that inexperienced buyout fund
managers, who want to establish a track record in order to raise follow-on funds, are less-
risk averse and more prone to overpay. High premiums by inexperienced GPs will be
anticipated by shareholders leading to high abnormal returns around the buyout
announcement. These predictions are indirectly supported by the empirical work of
Kaplan/Schoar (2005). They show that fund performance tends to increase with the
experience of the funds’ general partners. Hence, we argue:
H 4.2 (private equity - experience of general partners): Premiums and abnormal returns
are higher when the private equity investor is less experienced.198
197 Two proxies are employed: Syndicate measures the number of private equity investors conducting the
transaction while ClubDeal is a simple dummy taking the value one if there are two or more private equity investors forming a syndicate.
198 To proxy for the experience of general partners four different proxies are employed: AgePePartnership measures the age of the youngest syndicate partner whereas AgePePartnership2 measures the age of the oldest syndicate partner. FirstFund is set to one, if one of the syndicate partners is a first time-fund whereas FirstFund2 is set to one, if all of the syndicate partners are first time-funds.
97
Table 4-1: Summary of hypotheses, variables, definitions and expected signs
This table summarizes the hypotheses, the variables used to test them and the predicted effect of each variable on the premiums and abnormal returns.
Hypotheses Variables Definition Expected sign
Governance hypotheses
H 1.1 (incentive alignment - directors’ ownership): There is a non-linear relationship between pre-buyout managerial ownership and the premiums or abnormal returns, respectively. At low levels of managerial ownership the relationship is negative while at high levels it is positive.
Director Ownership stake of management team in %. Due to data limitations in the continental European context, we are only able collect managerial shareholdings in excess of 5% (cf. section 4.3.2 for details)
-
Director² Squared ownership stake of management team in %. Due to data limitations in the continental European context, we are only able collect managerial shareholdings in excess of 5%.
+
H 1.2 (monitoring - shareholder’s size): Premiums and abnormal returns are negatively related to the equity stake of the incumbent, largest shareholder.
1stShareholder Ownership stake of largest outside shareholder in % -
1stShareholder_75/100 1stShareholder_50/75 1stShareholder_25/50
Piecewise specifications of the variable 1stShareholder according to the economic thresholds at 25, 50 and 75% (cf. section 4.2.1 and 4.3.2 for details)
H 1.3 (monitoring - shareholder’s identity): Premiums and abnormal returns are lower when the largest shareholder is a family, bank, corporation or holding company who shall have more incentives to engage in monitoring than the government.
1stShareholder * Identity Interaction term of 1stShareholder with one of the dummy variables measuring the type of the largest outside shareholder (family, government, bank, insurance, corporation, holding and others).
- for “good”
monitors and + for
“bad” monitors
H 1.4 (private benefits): Premiums and abnormal returns are lower when there was a second large blockholder in the pre-buyout company who confined the discretion of the largest shareholder to appropriate private benefits.
2ndShareholder_dummy>5% Dummy set to 1 if the second largest outside shareholder holds a stake larger or equal than 5% (Gugler/Yurtoglu (2003), for more details see section 4.3.2)
-
98
Table 4-1: Summary of hypotheses, variables, definitions and expected signs (continued)
Hypotheses Variables Definition Expected sign
Capital structure hypotheses
H 2.1 (leverage, tax and free cash flow): Premiums and abnormal returns are higher when companies offer high debt capacities, high tax levels and high free cash flow levels.
DebtLevel Net debt divided by EBITDA -
FreeCashFlow Free cash flow defined as operating income before depreciation and amortization minus tax, interest and dividend payments standardized by the market value of equity (Lehn/Poulsen (1989))
+
Tax Tax payments standardized by the firm’s market value of equity (Lehn/Poulsen (1989))
+
H 2.2 (debt market timing): Premiums and abnormal returns are higher when there are favourable lending conditions.
DebtCost (LIBOR) Average of the daily LIBOR rates over a half year period up to day t = -41
-
Valuation hypotheses
H 3.1 (performance, liquidity): Premiums and abnormal returns are higher when companies have a low prior stock performance and a thin trading volume.
Valuation Share price 40 days before the announcement date divided by the average price over the two prior years. In order to exclude market movements, we divide the figure by the equivalent ratio of the DJ EUROSTOXX market index, which embraces large, middle and small capitalisation companies of 12 Eurozone countries (UK not included).
-
Liquidity Fraction of days with zero percent returns over a half year period up to day t = - 41
+
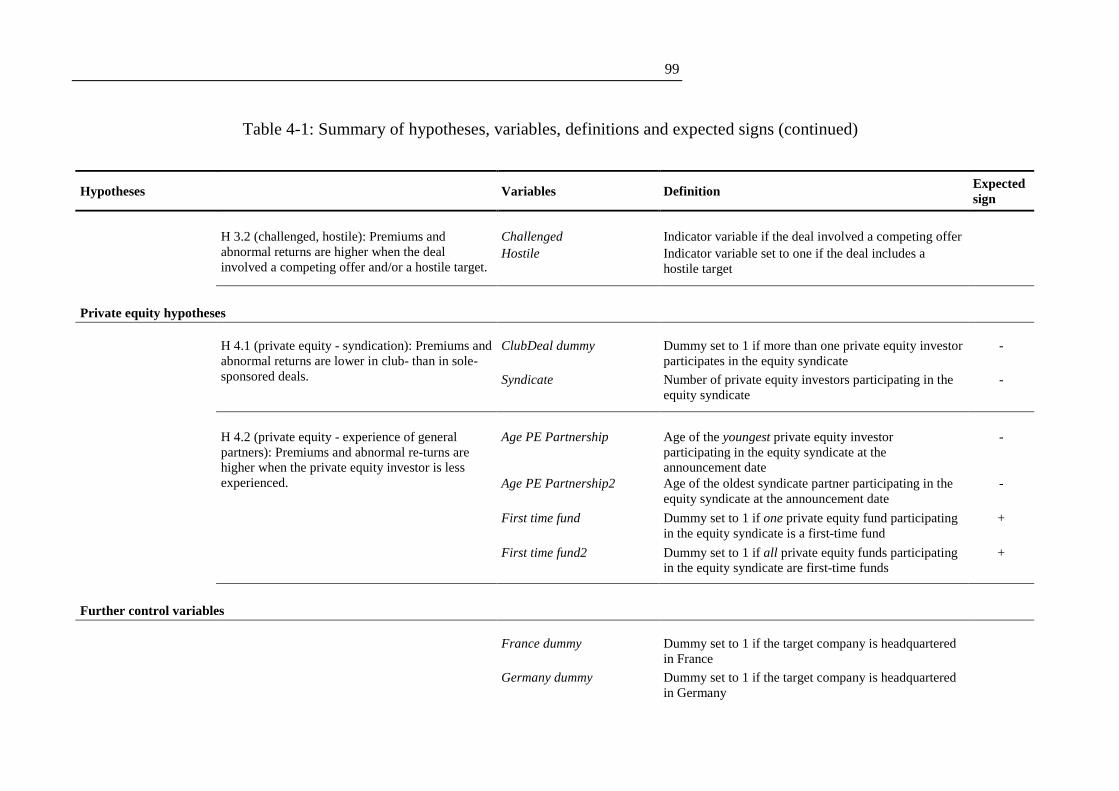
99
Table 4-1: Summary of hypotheses, variables, definitions and expected signs (continued)
Hypotheses Variables Definition Expected sign
H 3.2 (challenged, hostile): Premiums and abnormal returns are higher when the deal involved a competing offer and/or a hostile target.
Challenged Indicator variable if the deal involved a competing offer
Hostile Indicator variable set to one if the deal includes a hostile target
Private equity hypotheses
H 4.1 (private equity - syndication): Premiums and abnormal returns are lower in club- than in sole-sponsored deals.
ClubDeal dummy Dummy set to 1 if more than one private equity investor participates in the equity syndicate
-
Syndicate Number of private equity investors participating in the equity syndicate
-
H 4.2 (private equity - experience of general partners): Premiums and abnormal re-turns are higher when the private equity investor is less experienced.
Age PE Partnership Age of the youngest private equity investor participating in the equity syndicate at the announcement date
-
Age PE Partnership2 Age of the oldest syndicate partner participating in the equity syndicate at the announcement date
-
First time fund Dummy set to 1 if one private equity fund participating in the equity syndicate is a first-time fund
+
First time fund2 Dummy set to 1 if all private equity funds participating in the equity syndicate are first-time funds
+
Further control variables
France dummy Dummy set to 1 if the target company is headquartered in France
Germany dummy Dummy set to 1 if the target company is headquartered in Germany

100
Table 4-1: Summary of hypotheses, variables, definitions and expected signs (continued)
Hypotheses Variables Definition Expected sign
Sweden dummy Dummy set to 1 if the target company is headquartered in Sweden
Netherlands dummy Dummy set to 1 if the target company is headquartered in Netherlands
Period 01-03 dummy Dummy set to 1 if transaction was announced in the stock market downturn period of 01 - 03
Period 04-07 dummy Dummy set to 1 if transaction was announced in the stock market upturn period of 04 - 07
Size Market capitalization in million €

101
4.3 Sample, data and methodology
4.3.1 Sample
According to talks with industry practitioners and Wright et al. (2006), going private
buyouts started to evolve in continental Europe in the late 1990s. Respectively, all
transactions are collected which were announced between January 1997 and July 2007,
the start of the credit turmoil. To capture all transactions, the following three databases
are screened in descending order:199
• Thomson Financials’ SDC Platinum database,
• The Financial Times’ Mergermarket database,
• Incisive Medias’ Private Equity Insight database.
From the consolidated pool of takeovers, those targeting financial firms are excluded
as their accounts differ systematically from industrial firms. Subsequently, two sanity
checks are conducted in order to assure that the sample consists indeed of going
privates which are private equity sponsored.
• First, it is assured that the transactions were indeed delisted: Therefore the stock
price history is examined for trading suspensions and the findings are verified
with press searches.
• Second, it is verified that the buyers are indeed private equity investors:
Therefore, we examine each acquirer’s mission statement and investment track
record as reported on its web pages and in the financial press. Any remaining
doubts are addressed by consulting industry experts. Any acquirer who
predominantly buys majority stakes (as opposed to minority stakes which tend
to be bought by hedge funds) in mature companies (as opposed to venture
capitalists who invest in young companies) and for a limited investment horizon
(as opposed to strategic buyers who invest over the long run) is considered to be
199 Interestingly, although all data providers claim to offer comprehensive coverage, their databases are
in fact hardly intersecting but highly complementary: With regard to the final sample, SDC Platinum as the primary database accounted for 53.7% of the transactions, while Mergermarket added 29.6% and Private Equity Insight delivered the remaining 16.7%.

102
a private equity investor. In case a bank is stated as the acquirer, it is checked
whether the transaction was carried out by the bank’s private equity arm. If this
is not the case, the transaction is excluded. Similarly, it is also verified whether
transactions by formerly pure private equity investors such as Blackstone,
which have now evolved into organisations offering a range of financial
services and advice, have been carried out by their private equity divisions.
This rigorous procedure results in 136 private equity acquisitions that were
successfully completed by July 2007. Table 4-2 displays this population and the final
sample for which all required data points are available across announcement years and
target countries.
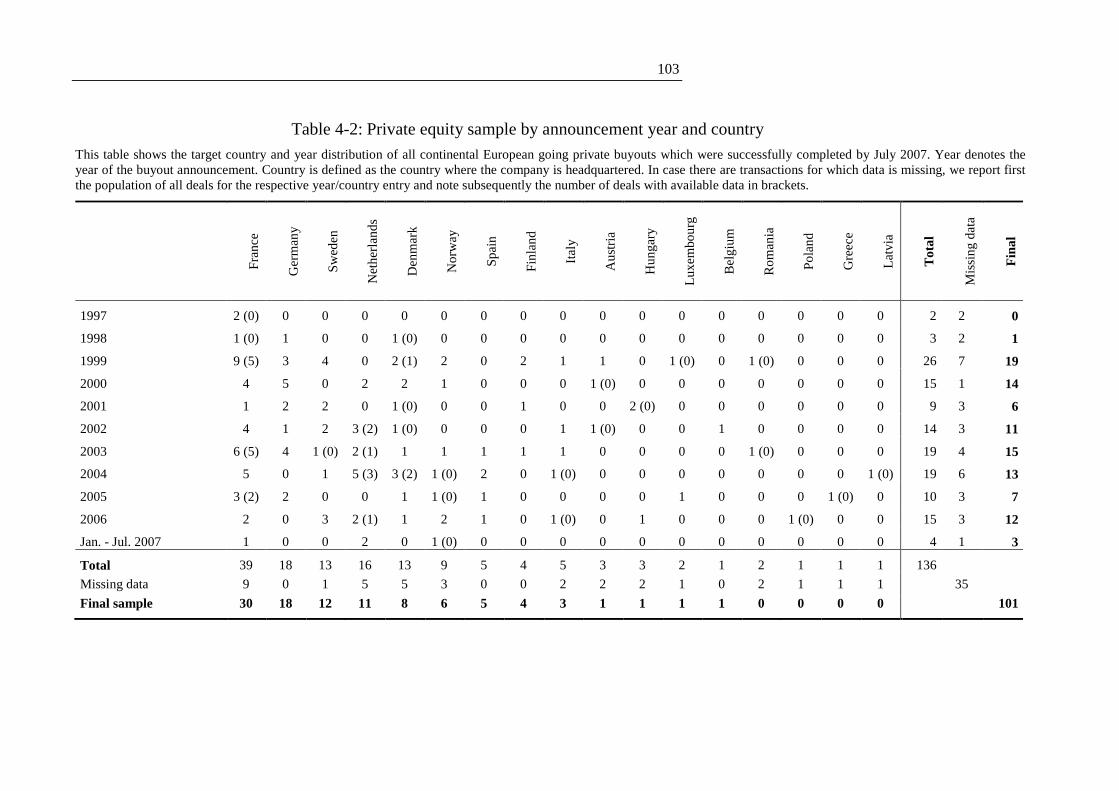
103
Table 4-2: Private equity sample by announcement year and country
This table shows the target country and year distribution of all continental European going private buyouts which were successfully completed by July 2007. Year denotes the year of the buyout announcement. Country is defined as the country where the company is headquartered. In case there are transactions for which data is missing, we report first the population of all deals for the respective year/country entry and note subsequently the number of deals with available data in brackets.
Fra
nce
Ger
man
y
Sw
ed
en
Net
her
lan
ds
De
nm
ark
No
rway
Sp
ain
Fin
lan
d
Ita
ly
Au
stri
a
Hu
ng
ary
Lu
xem
bou
rg
Be
lgiu
m
Ro
ma
nia
Po
lan
d
Gre
ece
Lat
via
Tot
al
Mis
sin
g d
ata
Fin
al
1997 2 (0) 0 0 0 0 0 0 0 0 0 0 0 0 0 0 0 0 2 2 0
1998 1 (0) 1 0 0 1 (0) 0 0 0 0 0 0 0 0 0 0 0 0 3 2 1
1999 9 (5) 3 4 0 2 (1) 2 0 2 1 1 0 1 (0) 0 1 (0) 0 0 0 26 7 19
2000 4 5 0 2 2 1 0 0 0 1 (0) 0 0 0 0 0 0 0 15 1 14
2001 1 2 2 0 1 (0) 0 0 1 0 0 2 (0) 0 0 0 0 0 0 9 3 6
2002 4 1 2 3 (2) 1 (0) 0 0 0 1 1 (0) 0 0 1 0 0 0 0 14 3 11
2003 6 (5) 4 1 (0) 2 (1) 1 1 1 1 1 0 0 0 0 1 (0) 0 0 0 19 4 15
2004 5 0 1 5 (3) 3 (2) 1 (0) 2 0 1 (0) 0 0 0 0 0 0 0 1 (0) 19 6 13
2005 3 (2) 2 0 0 1 1 (0) 1 0 0 0 0 1 0 0 0 1 (0) 0 10 3 7
2006 2 0 3 2 (1) 1 2 1 0 1 (0) 0 1 0 0 0 1 (0) 0 0 15 3 12
Jan. - Jul. 2007 1 0 0 2 0 1 (0) 0 0 0 0 0 0 0 0 0 0 0 4 1 3
Total 39 18 13 16 13 9 5 4 5 3 3 2 1 2 1 1 1 136 Missing data 9 0 1 5 5 3 0 0 2 2 2 1 0 2 1 1 1
35
Final sample 30 18 12 11 8 6 5 4 3 1 1 1 1 0 0 0 0 101
104
In terms of the population distribution across countries, Table 4-2 shows that France
represents with 39 transactions (29%) the most active playground for private equity
investors. Further attractive markets seem to be Germany (18, 13%), the Netherlands
(16, 12%) and the Scandinavian countries of Sweden (13, 10%), Denmark (13, 10%)
and Norway (9, 7%). The remaining 29 transactions (22%) are spread over 11
countries including both developed countries such as Spain and Italy and emerging
countries such as Hungary, Romania, Poland and Latvia.
In terms of the population distribution across time, Table 4-2 shows that the
acquisition activity took off sharply in the year 1999 with 26 transactions (19%). Over
the subsequent years 2000 - 2006, the number ranged between 9 to 19 deals per year,
representing a relatively stable private equity sponsored going private activity. The
reported 4 transactions for the period January - July 2007 represent only deals which
have been completed as of July 2008, the date at which data collection for this chapter
ceased. Recent examinations reveal that ultimately 10 private equity acquisitions took
place in 2007.
Despite our best efforts as laid out in the subsequent section, we were not able to
collect the required data for all transactions. In particular, precise ownership and
private equity fund data was missing for several transactions leaving a final sample of
101 acquisitions.200 This reduction exemplifies the numerous difficulties encountered
in collecting a dataset in the continental European context where disclosure
requirements have been - at least in the past - less rigorous than in the US or UK.
Nevertheless, the final sample remains in terms of the country and time distribution
relatively comparable to the underlying population.
200 The comprehensive data requirements explain also why the final sample size in this chapter is
smaller than in the previous one.

105
4.3.2 Data and variable definitions
We retrace the ownership structure of all firms by considering all voting stakes equal
or larger than 5% as this figure represents the lowest common disclosure threshold
across jurisdictions and time.201 The data is self-collected from the following sources:
1. Historical versions of Bureau Van Dijk’s Amadeus database (BVDA)
which were recorded on a semi-annual basis from 1997 - 2002 and on a
quarterly basis thereafter. The version is selected which approaches the
target’s fiscal year date prior to the going private announcement most
closely.
2. Target company publications such as annual reports and press releases or
direct target company statements from their investor relations
departments in response to requests.
3. Stock market or regulator publications.
4. Private directories such as the “Hoppenstedt Aktienführer” in Germany.
5. News searches based on Factiva and Google.
The resulting ownership structure serves as the starting point for the construction of
the management stake. As BVDA does not deliver reliable information about the
board members and their functions,202 we turn to the annual reports in order to
precisely identify the executive members which are considered part of the
management team in the study.203
201 In comparison to chapter 3.3.3.2, the threshold in this chapter is set at 5% since it builds on first-tier
ownership data. Consequently, the ownership statistics and the related evidence are not fully congruent in both chapters but they are likely to be highly compatible.
202 In continental Europe, board systems are heterogeneous in the way that there exist both unitary and two-tier boards. In this context, BVDA reveals two shortages: First, in the case of two-tier boards, members of both the corporate management and the supervisory board are sometimes labelled as “managers”. Second, in the case of unitary boards, the database does often not differentiate between executive and non-executive directors.
203 In the case of two-tier boards, we follow Barontini/Caprio (2006) and consider members of the management body (supervisory body) as executives (non-executives).

106
Stock and accounting data is retrieved from Thomson Financial’s Datastream database
and, if necessary, supplemented with information from BVDA and the firms’ annual
reports. All accounting data points are collected at the last fiscal year date prior to the
acquisition announcement. We winsorize all accounting and stock based variables on
their upper and lower tails at the 1% level in order to ensure that outliers do not distort
results.
PE partnership and fund information is obtained from Thomson VentureXPert,
Thomson Banker One, private equity partnerships’ websites and direct requests to
them.204
The definition of the individual variables is summarized in Table 4-1.
4.3.3 Methodology
Central to the calculation of both abnormal event-study returns and premiums to
corporate events is the sound assessment of the underlying information release
process. This matter is of particular importance in this study’s context since (i)
disclosure requirements have been traditionally less demanding in continental Europe
and (ii) private equity bidders shun the public spotlight. Therefore, we examine
database deal synopses and deepen our understanding through additional
investigations of Factiva press clippings. Similar to Renneboog et al. (2007), we notice
that in a few transactions, the disclosure of the takeover as a private equity backed
going private happens not in one but two steps. The first announcement generally
refers to takeover negotiations with an undisclosed party or the firm’s intention to go
private. The involvement of a private equity investor, however, is only disclosed in a
subsequent second announcement. In total, there are 20 cases where the takeover
information is released in two steps. Following Renneboog et al. (2007), we apply the
following event-study and premium methodology to these particular takeovers: With
regard to the event study methodology, we calculate event windows around both
204 Access to Thomson VentureXPert and Thomson Banker One was only available in the later stage
of the research project. This is the reason why the sample transactions were initially sourced from Private Equity Insight, Mergermarket and Thomson SDC Platinum.
107
announcement dates and sum them up in order to not bias the results.205 In 6 cases,
there is a slight overlap in the first and second event window which we exclude for
consistency. Overall, this procedure aims to put the transactions on a more common
ground and, thus, to depict the announcement effects more precisely. With regard to
the premium methodology, we set the final price paid in relation to a benchmark price
taken two months prior the first event date (Schwert (1996)).206 Further, we adjust for
market movements with the DJ EUROSTOXX market index, which embraces large,
middle and small capitalisation companies of twelve continental European countries
(Kaplan (1989a)).
Standard event study and premium methodology (Brown/Warner (1985),
Kothari/Warner (2006)) is applied. As a benchmark for the event study abnormal
return calculation, we employ the market model. For each firm, the market model
parameters α and β are estimated from an ordinary least squares (OLS) regression of
the firm’s returns on the Dow Jones (DJ) EUROSTOXX index returns over the daily
interval [-295,-43] relative to the first announcement date. Subsequently the
cumulative abnormal returns (CARs) are calculated for each firm by summing the
market model residuals over the respective event window. We winsorize event-study
returns and premiums on their upper and lower tails at the 1% level in order to ensure
that outliers will not distort the results. Standard econometric tests are employed which
are detailed in Renneboog et al. (2007).
4.4 Empirical results
4.4.1 Summary statistics
4.4.1.1 Firm fundamentals
Panel A of Table 4-3 depicts the ownership structure of the target companies.
205 Renneboog/Simons/Wright (2007) state: “Some earlier research has taken the second date as the
event date. It is clear that such results are biased due to the fact that the initial announcement (event 1) has a large effect on the share price and that event 2 could be regarded as a correction to event 1” (Renneboog/Simons/Wright (2007), p. 608).
206 Hence, this measure includes bid mark-ups and market anticipation.
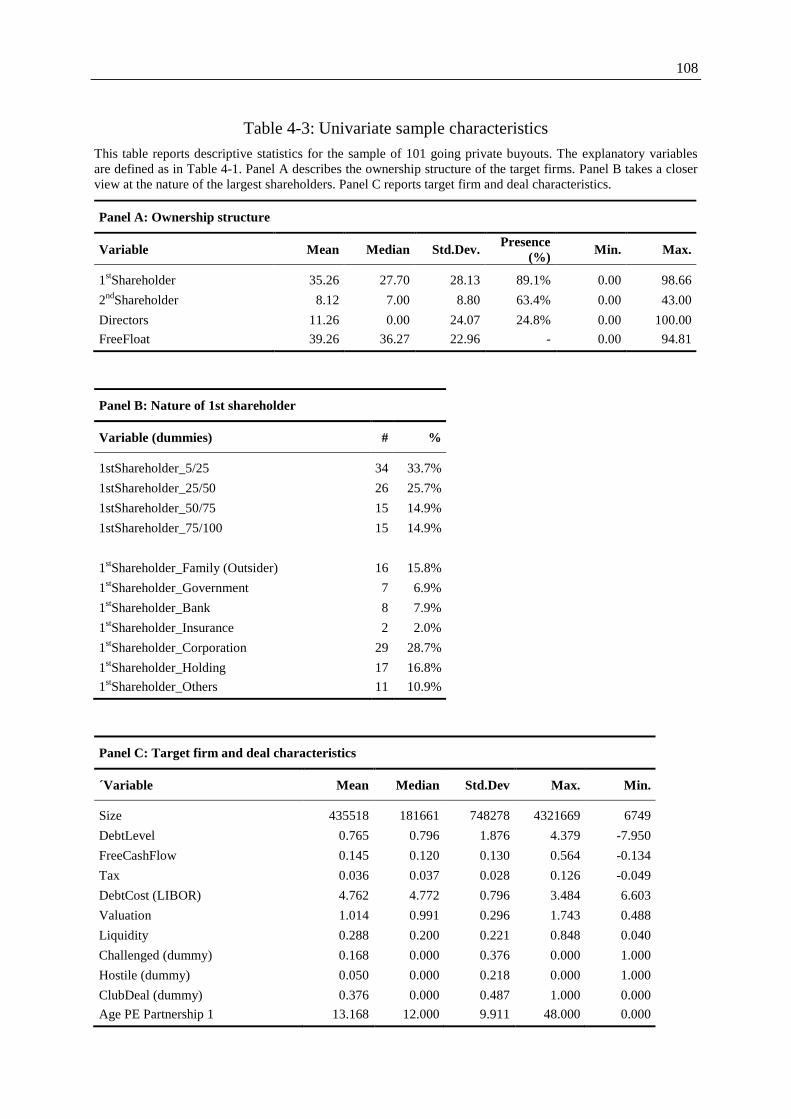
108
Table 4-3: Univariate sample characteristics
This table reports descriptive statistics for the sample of 101 going private buyouts. The explanatory variables are defined as in Table 4-1. Panel A describes the ownership structure of the target firms. Panel B takes a closer view at the nature of the largest shareholders. Panel C reports target firm and deal characteristics.
Panel A: Ownership structure
Variable Mean Median Std.Dev. Presence
(%) Min. Max.
1stShareholder 35.26 27.70 28.13 89.1% 0.00 98.66
2ndShareholder 8.12 7.00 8.80 63.4% 0.00 43.00
Directors 11.26 0.00 24.07 24.8% 0.00 100.00
FreeFloat 39.26 36.27 22.96 - 0.00 94.81
Panel B: Nature of 1st shareholder
Variable (dummies) # %
1stShareholder_5/25 34 33.7%
1stShareholder_25/50 26 25.7%
1stShareholder_50/75 15 14.9%
1stShareholder_75/100 15 14.9%
1stShareholder_Family (Outsider) 16 15.8%
1stShareholder_Government 7 6.9%
1stShareholder_Bank 8 7.9%
1stShareholder_Insurance 2 2.0%
1stShareholder_Corporation 29 28.7%
1stShareholder_Holding 17 16.8%
1stShareholder_Others 11 10.9%
Panel C: Target firm and deal characteristics
´Variable Mean Median Std.Dev Max. Min.
Size 435518 181661 748278 4321669 6749
DebtLevel 0.765 0.796 1.876 4.379 -7.950
FreeCashFlow 0.145 0.120 0.130 0.564 -0.134
Tax 0.036 0.037 0.028 0.126 -0.049
DebtCost (LIBOR) 4.762 4.772 0.796 3.484 6.603
Valuation 1.014 0.991 0.296 1.743 0.488
Liquidity 0.288 0.200 0.221 0.848 0.040
Challenged (dummy) 0.168 0.000 0.376 0.000 1.000
Hostile (dummy) 0.050 0.000 0.218 0.000 1.000
ClubDeal (dummy) 0.376 0.000 0.487 1.000 0.000
Age PE Partnership 1 13.168 12.000 9.911 48.000 0.000

109
In 89.1% of the sample firms, there is at least one outside shareholder which holds a
stake larger than 5% in the company. On average, the size of the largest blockholder
amounts up to 35.26% which markedly differs from the 23.5% found by Renneboog et
al. (2007) for a comparable UK sample. Interestingly and in line with the private
benefits hypotheses (H 1.4), private equity investors seem to slightly prefer companies
where there is at least one additional outside blockholder: in 63.4 % of buyout targets,
a second large outside shareholder is present. Based on the whole sample, the average
stake of this potential monitor-of-the-monitor amounts to 8.12%. The management
team holds in 24.8% of the sample a significant stake in the target company. Measured
over all transactions, the average directors’ stake constitutes 11.26% which is in line
with the 12.5% reported by Renneboog et al. (2007).
In aggregate, the sum of blockholdings in the sample accounts to 60.74% of the
ownership structure. This contrasts heavily to the 37.7% of
Renneboog/Simons/Wright’s (2007) UK sample. Hence, the stylized fact that
ownership is far more concentrated in continental European than Anglo-Saxon markets
(e.g. La Porta et al. (1999), Mayer (2008); amongst others) holds for our sample of
buyout targets.
Panel B takes a closer look at the size and nature of the largest outside blockholder,
which is at the heart of our governance story in the continental European context. In 15
cases, the largest blockholder owns a stake larger than 75%. Such a “super-majority”
grants them far-reaching rights, e.g. to amend the corporate charter. In a further 15
firms, the largest blockholder still possesses a majority but less or equal than 75%.
Hence, these shareholders can still extensively control the management although the
existence of an additional 25%-blockholder might limit their discretion
(Jenkinson/Ljungqvist (2001)). In 26 cases, the largest blockholder owns at least 25%
but less than 50%. Such a minority block can be used to veto against important issues
such as for example profit transfer and control agreements (Franks/Mayer (2001)).
Finally, the largest outside blockholders are primarily corporations (28.7%), holdings
(16.8%) and families (15.8%) followed by banks (7.9%), the government (6.9%) and
insurance companies (2.0%).
110
Panel C provides an overview of target firm and deal characteristics. The median
continental European private equity target has a market capitalization of 182 m€. In
terms of leverage, the average firm has a net debt to EBITDA ratio of 0.765. The
London Interbank Offer Rate (LIBOR) - the proxy for the economy wide cost of debt
refinancing – averages 4.8% across the cross-section of transactions. Free cash flow
and tax liabilities amount on average to 14.5% and 3.6% of the firms’ market value of
equity. With regard to the pre-buyout stock performance, the valuation average
(median) of 1.014 (0.991) suggests that the stocks have broadly performed in line with
the overall market development. The average (median) liquidity variable points
towards a thin trading volume: In the last half year before the buyout announcement,
the target stocks recorded a zero percent return in 28.8% (20.0%) of the trading days.
Only 16.8% of the deals involved a competing bid and only 5% included a hostile
target. Finally, 37.6% of the transactions are conducted by a syndicate of private
equity investors and the average age of the sample’s private equity partnerships is 13.2
years.207
4.4.1.2 Announcement returns and premiums
Panel A of Table 4-4 presents the cumulative abnormal returns (CARs) over different
event windows. As described in detail in the methodology section, the information
release of the private equity backed going private transaction happens in 81 cases in a
single event (event 1) but in 20 cases in two events (event 1 and 2). we account for this
particularity by reporting three tables: (i) The CARs relative to event 1 (left-handed
table), (ii) the CARs relative to event 2 (centre table) and (iii) the sum of the CARs
relative to event 1 and 2 (right-handed table).
207 This number refers to the variable AgePePartnership, i.e. in the case of a club deal it measures the
age of the youngest syndicate partner.
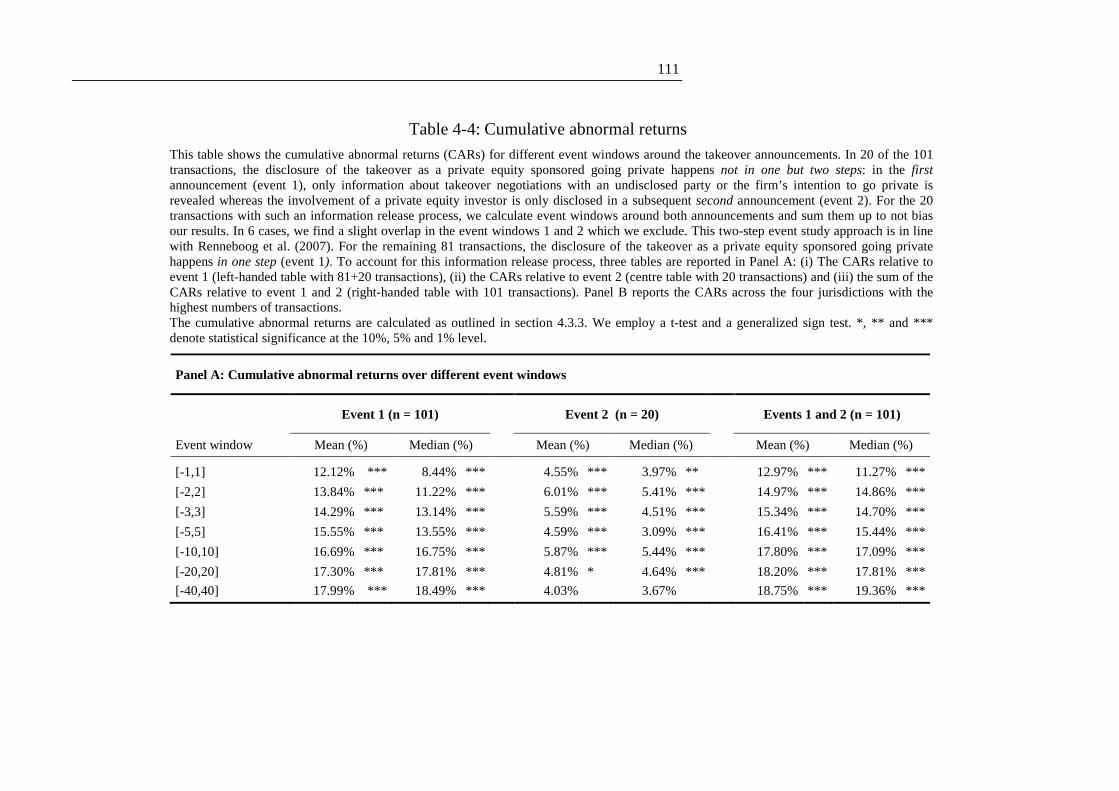
111
Table 4-4: Cumulative abnormal returns
This table shows the cumulative abnormal returns (CARs) for different event windows around the takeover announcements. In 20 of the 101 transactions, the disclosure of the takeover as a private equity sponsored going private happens not in one but two steps: in the first announcement (event 1), only information about takeover negotiations with an undisclosed party or the firm’s intention to go private is revealed whereas the involvement of a private equity investor is only disclosed in a subsequent second announcement (event 2). For the 20 transactions with such an information release process, we calculate event windows around both announcements and sum them up to not bias our results. In 6 cases, we find a slight overlap in the event windows 1 and 2 which we exclude. This two-step event study approach is in line with Renneboog et al. (2007). For the remaining 81 transactions, the disclosure of the takeover as a private equity sponsored going private happens in one step (event 1). To account for this information release process, three tables are reported in Panel A: (i) The CARs relative to event 1 (left-handed table with 81+20 transactions), (ii) the CARs relative to event 2 (centre table with 20 transactions) and (iii) the sum of the CARs relative to event 1 and 2 (right-handed table with 101 transactions). Panel B reports the CARs across the four jurisdictions with the highest numbers of transactions. The cumulative abnormal returns are calculated as outlined in section 4.3.3. We employ a t-test and a generalized sign test. *, ** and *** denote statistical significance at the 10%, 5% and 1% level.
Panel A: Cumulative abnormal returns over different event windows
Event 1 (n = 101) Event 2 (n = 20) Events 1 and 2 (n = 101)
Event window Mean (%) Median (%)
Mean (%) Median (%)
Mean (%) Median (%)
[-1,1] 12.12% *** 8.44% *** 4.55% *** 3.97% ** 12.97% *** 11.27% ***
[-2,2] 13.84% *** 11.22% *** 6.01% *** 5.41% *** 14.97% *** 14.86% ***
[-3,3] 14.29% *** 13.14% *** 5.59% *** 4.51% *** 15.34% *** 14.70% ***
[-5,5] 15.55% *** 13.55% *** 4.59% *** 3.09% *** 16.41% *** 15.44% ***
[-10,10] 16.69% *** 16.75% *** 5.87% *** 5.44% *** 17.80% *** 17.09% ***
[-20,20] 17.30% *** 17.81% *** 4.81% * 4.64% *** 18.20% *** 17.81% ***
[-40,40] 17.99% *** 18.49% *** 4.03% 3.67% 18.75% *** 19.36% ***

112
Table 4-4: Cumulative abnormal returns (continued)
Panel B: Cumulative abnormal returns across jurisdictions
France (n = 30) Germany (n = 18) Sweden (n = 12) Netherlands (n = 11)
Event window Mean (%) Median (%)
Mean (%) Median (%)
Mean (%) Median (%)
Mean (%) Median (%)
[-1,1] 4.1 *** 0.1 11.05 *** 9.66 ** 22.57 *** 19.13 ** 23.65 *** 23.39 **
[-2,2] 6.2 *** 3.2 *** 15.04 *** 14.14 *** 25.81 *** 21.32 *** 24.47 *** 22.59 **
[-3,3] 7.8 *** 4.4 *** 14.59 *** 14.22 *** 26.03 *** 20.75 *** 24.81 *** 24.70 **
[-5,5] 7.4 *** 5.9 *** 15.22 *** 15.05 *** 31.14 *** 24.40 *** 24.99 *** 25.26 **
[-10,10] 10.3 *** 9.0 *** 17.11 *** 16.95 *** 30.81 *** 27.63 *** 24.19 *** 25.40 **
[-20,20] 10.7 *** 8.7 *** 17.80 *** 14.86 *** 31.90 *** 27.80 *** 23.57 *** 26.91 **
[-40,40] 10.8 *** 11.2 *** 19.65 *** 24.41 *** 30.38 *** 25.98 *** 27.62 *** 31.62 **
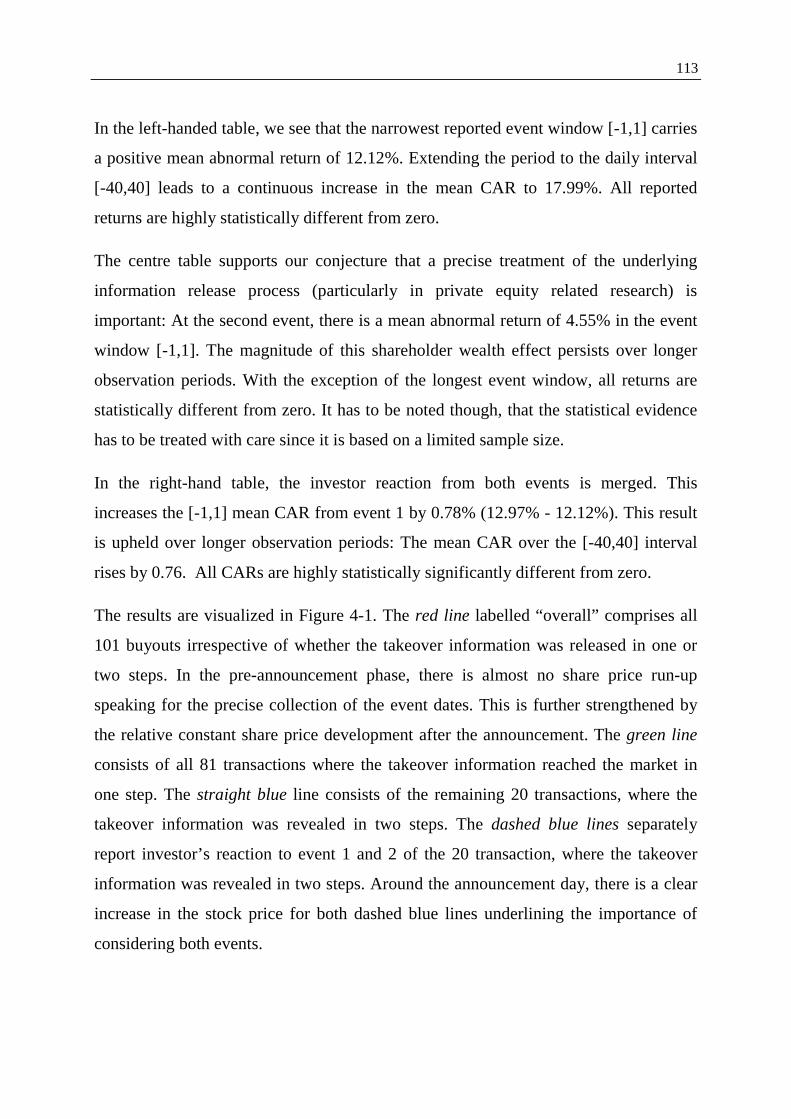
113
In the left-handed table, we see that the narrowest reported event window [-1,1] carries
a positive mean abnormal return of 12.12%. Extending the period to the daily interval
[-40,40] leads to a continuous increase in the mean CAR to 17.99%. All reported
returns are highly statistically different from zero.
The centre table supports our conjecture that a precise treatment of the underlying
information release process (particularly in private equity related research) is
important: At the second event, there is a mean abnormal return of 4.55% in the event
window [-1,1]. The magnitude of this shareholder wealth effect persists over longer
observation periods. With the exception of the longest event window, all returns are
statistically different from zero. It has to be noted though, that the statistical evidence
has to be treated with care since it is based on a limited sample size.
In the right-hand table, the investor reaction from both events is merged. This
increases the [-1,1] mean CAR from event 1 by 0.78% (12.97% - 12.12%). This result
is upheld over longer observation periods: The mean CAR over the [-40,40] interval
rises by 0.76. All CARs are highly statistically significantly different from zero.
The results are visualized in Figure 4-1. The red line labelled “overall” comprises all
101 buyouts irrespective of whether the takeover information was released in one or
two steps. In the pre-announcement phase, there is almost no share price run-up
speaking for the precise collection of the event dates. This is further strengthened by
the relative constant share price development after the announcement. The green line
consists of all 81 transactions where the takeover information reached the market in
one step. The straight blue line consists of the remaining 20 transactions, where the
takeover information was revealed in two steps. The dashed blue lines separately
report investor’s reaction to event 1 and 2 of the 20 transaction, where the takeover
information was revealed in two steps. Around the announcement day, there is a clear
increase in the stock price for both dashed blue lines underlining the importance of
considering both events.

114
Figure 4-1: Mean cumulative abnormal returns Source: Author
Overall, the announcement of a sophisticated financial investor’s entry seems to be
appreciated by shareholders. We find significant positive mean CARs over all event
windows. However, the results are substantially lower than in the Anglo-Saxon case.
For the narrow event window [-1,1], the mean CAR in continental Europe amounts to
12.97% while Bargeron et al. (2008) report for the US an estimate of 20.64% and
Renneboog et al. (2007) show for the UK an estimate of 25.11%. For the longer event
window [-5,5], the mean CAR in continental Europe equals 16.41% while the
equivalent estimates in the US and UK are 20.80% (Bargeron et al. (2008)) and
28.17% (Renneboog et al. (2007)), respectively. Consequently, when focusing on the
longer event window, the mean abnormal return in continental Europe is 4.39 and
11.76 percentage points lower than in the US and UK, respectively. Potential reasons
for the lower announcement returns in continental Europe may be the higher deal
completion risk and/or less value creation potential due to an effective governance
structure in the pre-buyout firm where blockholders monitor the management but are
constrained in their private benefit consumption.
-5%
0%
5%
10%
15%
20%
25%
-40 -30 -20 -10 0 10 20 30 40
Mea
n cu
mul
ativ
e ab
norm
al r
etur
n
Days relative to event
Overall
1 Event
2 Events_both
2 Events_first
2 Events_second
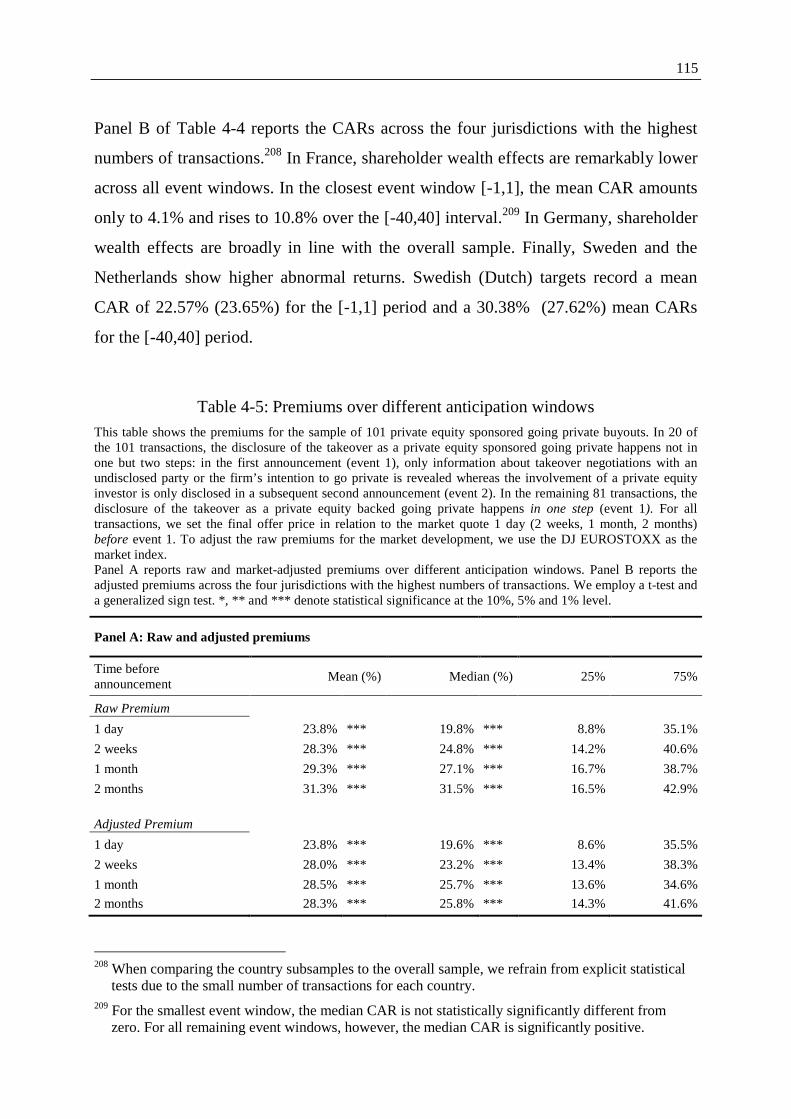
115
Panel B of Table 4-4 reports the CARs across the four jurisdictions with the highest
numbers of transactions.208 In France, shareholder wealth effects are remarkably lower
across all event windows. In the closest event window [-1,1], the mean CAR amounts
only to 4.1% and rises to 10.8% over the [-40,40] interval.209 In Germany, shareholder
wealth effects are broadly in line with the overall sample. Finally, Sweden and the
Netherlands show higher abnormal returns. Swedish (Dutch) targets record a mean
CAR of 22.57% (23.65%) for the [-1,1] period and a 30.38% (27.62%) mean CARs
for the [-40,40] period.
Table 4-5: Premiums over different anticipation windows
This table shows the premiums for the sample of 101 private equity sponsored going private buyouts. In 20 of the 101 transactions, the disclosure of the takeover as a private equity sponsored going private happens not in one but two steps: in the first announcement (event 1), only information about takeover negotiations with an undisclosed party or the firm’s intention to go private is revealed whereas the involvement of a private equity investor is only disclosed in a subsequent second announcement (event 2). In the remaining 81 transactions, the disclosure of the takeover as a private equity backed going private happens in one step (event 1). For all transactions, we set the final offer price in relation to the market quote 1 day (2 weeks, 1 month, 2 months) before event 1. To adjust the raw premiums for the market development, we use the DJ EUROSTOXX as the market index. Panel A reports raw and market-adjusted premiums over different anticipation windows. Panel B reports the adjusted premiums across the four jurisdictions with the highest numbers of transactions. We employ a t-test and a generalized sign test. *, ** and *** denote statistical significance at the 10%, 5% and 1% level.
Panel A: Raw and adjusted premiums
Time before announcement
Mean (%) Median (%) 25% 75%
Raw Premium
1 day 23.8% *** 19.8% *** 8.8% 35.1%
2 weeks 28.3% *** 24.8% *** 14.2% 40.6%
1 month 29.3% *** 27.1% *** 16.7% 38.7%
2 months 31.3% *** 31.5% *** 16.5% 42.9%
Adjusted Premium
1 day 23.8% *** 19.6% *** 8.6% 35.5%
2 weeks 28.0% *** 23.2% *** 13.4% 38.3%
1 month 28.5% *** 25.7% *** 13.6% 34.6%
2 months 28.3% *** 25.8% *** 14.3% 41.6%
208 When comparing the country subsamples to the overall sample, we refrain from explicit statistical
tests due to the small number of transactions for each country. 209 For the smallest event window, the median CAR is not statistically significantly different from
zero. For all remaining event windows, however, the median CAR is significantly positive.
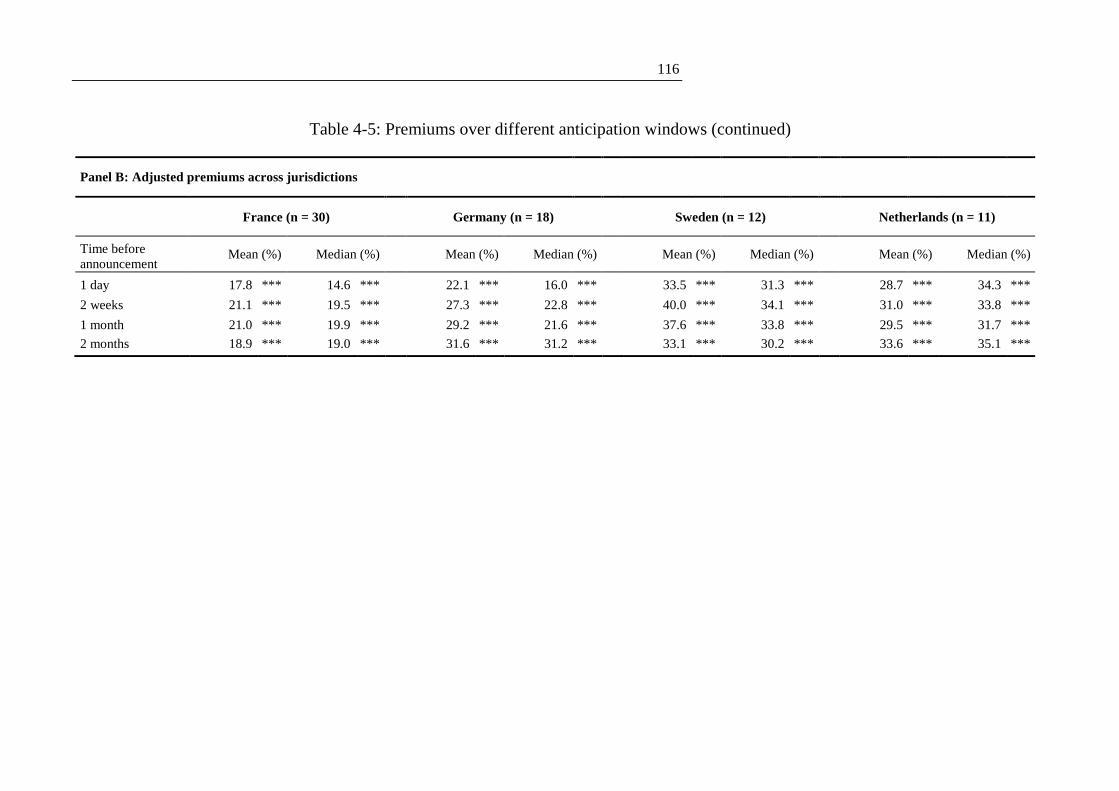
116
Table 4-5: Premiums over different anticipation windows (continued)
Panel B: Adjusted premiums across jurisdictions
France (n = 30) Germany (n = 18) Sweden (n = 12) Netherlands (n = 11)
Time before announcement
Mean (%) Median (%)
Mean (%) Median (%)
Mean (%) Median (%)
Mean (%) Median (%)
1 day 17.8 *** 14.6 *** 22.1 *** 16.0 *** 33.5 *** 31.3 *** 28.7 *** 34.3 ***
2 weeks 21.1 *** 19.5 *** 27.3 *** 22.8 *** 40.0 *** 34.1 *** 31.0 *** 33.8 ***
1 month 21.0 *** 19.9 *** 29.2 *** 21.6 *** 37.6 *** 33.8 *** 29.5 *** 31.7 ***
2 months 18.9 *** 19.0 *** 31.6 *** 31.2 *** 33.1 *** 30.2 *** 33.6 *** 35.1 ***

117
Table 4-5 reports the final premiums paid by private equity investors to target
shareholders. In line with the CAR evidence, Panel A confers that there is only little
takeover anticipation in the immediate days around the announcement. The mean
market-adjusted (raw) premium increases from 23.85% (23.76%) to 28.04% (28.26%)
when the reference stock price is set two weeks instead of one day prior to the
announcement day. Extending the window to 2 months increases the market-adjusted
(raw) premium only modestly to 28.34% (31.33%). All premiums are highly
statistically different from zero. However, they are slightly lower compared to the
Anglo-Saxon evidence. In chapter 5, this dissertation finds that the mean premium in
the US amounts to 31.30%210 and Renneboog et al. (2007) report for the UK a raw,
and thus, not directly comparable mean estimate of 40.10%. Consequently, when
focusing on the comparable US figure, the premium in continental Europe is 2.96
percentage points lower than in the US. This pattern is consistent with the notion that
continental European target firms offer less remaining value creation potential than
their US counterparts since the former are characterised by a more effective
governance structure. More precisely, blockholders have strong incentives to curtail
managerial misbehaviour and, potentially, they are constrained in their own private
benefit consumption by the cross-monitoring of their peers. The regression analysis in
section 4.4.2 will test this notion in detail.
Panel B takes a closer look at the adjusted premium pattern across the four
jurisdictions with the highest numbers of transactions.211 Similar to the CAR evidence,
we find that shareholders receive lower premiums in France. The premiums for
German targets are broadly in line with the cross-country average. In Sweden,
premiums are higher than for the overall sample when the reference price is close to
210 These values are in line with Bargeron et al. (2008). Older studies as summarized in footnote 131
report premium estimates in the range of 30 % to 55% over the market value of equity. However, these studies predominantly focus on relatively small samples from the first buyout wave while chapter 5 and Bargeron et al. (2008) are based on large samples comprehending transactions from both the first and second buyout wave. When turning to the median premium estimates, the premium differential gets smaller but Bargeron et al.’s (2008) estimate suggests that there is still a differential of 2.8 percentage points.
211 When comparing the country subsamples to the overall sample, we refrain from explicit statistical tests due to the small number of transactions for each country.
118
the announcement day but the differential diminishes if the reference price is extended
to span a market anticipation and mark up period of 2 months. Similarly, the premiums
in the Dutch context seem to lie slightly above the overall sample. These results,
however, have to be interpreted with care due to the limited number of observations
per jurisdiction.
4.4.2 Regression results
In this section, we employ multivariate regression analysis in order to understand
which factors drive the premiums and cumulative abnormal returns (CAR). With
regard to the premium analysis, the final bid price is set in relation to the stock price 2
months before the first buyout announcement. With regard to the CAR analysis, the
focus lies on the event window [-1,1] which captures the majority of the
announcement effect. Thereby, the results will be comparable to the bulk of the Anglo-
Saxon work and it is ruled out that they will be distorted by noise, i.e. other corporate
events shortly before or after the buyout announcement. The results are robust to
variations of the event window size. To control for potential heteroscedasticity, White
(1980) robust estimates of the standard errors are employed. The correlations in Table
4-6 recommend that the results are not subject to multicollinearity issues.212 Six
regression models are estimated which are all statistically significant at the 1% level.
The adjusted R² for the CAR regression models 1 to 3 ranges from 34% to 36%
whereas its equivalent for the premium regression models 4 to 6 lies between 14% and
16%.
212 Please note that the variable 1stShareholder and its respective sub variables according to (i) the
economic threshold of the stake and (ii) the identity of the shareholder are tested in separate regression models. An additional examination of the model variance inflation factors (VIFs) confirms that there are no multicollinearity issues.
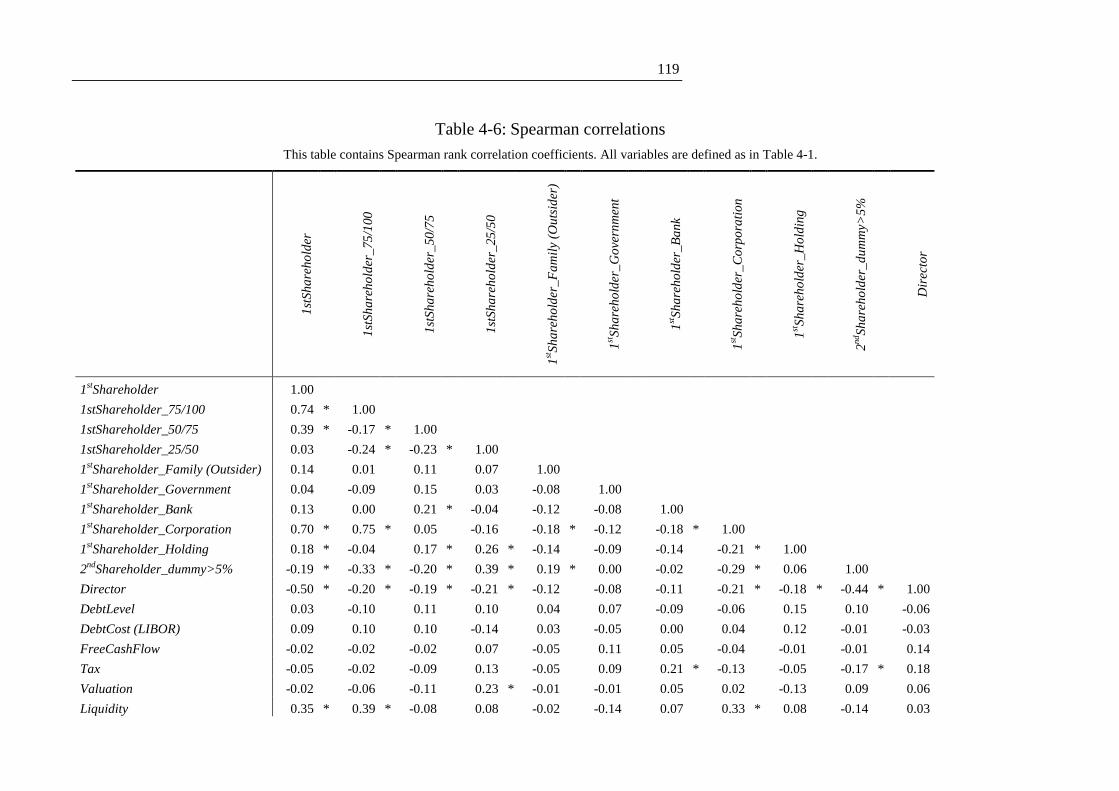
119
Table 4-6: Spearman correlations
This table contains Spearman rank correlation coefficients. All variables are defined as in Table 4-1.
1st
Sh
are
ho
lde
r
1
stS
ha
reh
old
er_
75
/100
1st
Sh
are
ho
lde
r_50
/75
1st
Sh
are
ho
lde
r_25
/50
1stS
ha
reh
old
er_
Fa
mily
(O
uts
ide
r)
1stS
ha
reh
old
er_
Go
vern
me
nt
1stS
ha
reh
old
er_
Ba
nk
1stS
ha
reh
old
er_
Co
rpo
ratio
n
1stS
ha
reh
old
er_
Ho
ldin
g
2nd S
ha
reh
old
er_
du
mm
y>5
%
Dire
cto
r
1stShareholder 1.00
1stShareholder_75/100 0.74 * 1.00
1stShareholder_50/75 0.39 * -0.17 * 1.00
1stShareholder_25/50 0.03 -0.24 * -0.23 * 1.00
1stShareholder_Family (Outsider) 0.14 0.01 0.11 0.07 1.00
1stShareholder_Government 0.04 -0.09 0.15 0.03 -0.08 1.00
1stShareholder_Bank 0.13 0.00 0.21 * -0.04 -0.12 -0.08 1.00
1stShareholder_Corporation 0.70 * 0.75 * 0.05 -0.16 -0.18 * -0.12 -0.18 * 1.00
1stShareholder_Holding 0.18 * -0.04 0.17 * 0.26 * -0.14 -0.09 -0.14 -0.21 * 1.00
2ndShareholder_dummy>5% -0.19 * -0.33 * -0.20 * 0.39 * 0.19 * 0.00 -0.02 -0.29 * 0.06 1.00
Director -0.50 * -0.20 * -0.19 * -0.21 * -0.12 -0.08 -0.11 -0.21 * -0.18 * -0.44 * 1.00
DebtLevel 0.03 -0.10 0.11 0.10 0.04 0.07 -0.09 -0.06 0.15 0.10 -0.06
DebtCost (LIBOR) 0.09 0.10 0.10 -0.14 0.03 -0.05 0.00 0.04 0.12 -0.01 -0.03
FreeCashFlow -0.02 -0.02 -0.02 0.07 -0.05 0.11 0.05 -0.04 -0.01 -0.01 0.14
Tax -0.05 -0.02 -0.09 0.13 -0.05 0.09 0.21 * -0.13 -0.05 -0.17 * 0.18
Valuation -0.02 -0.06 -0.11 0.23 * -0.01 -0.01 0.05 0.02 -0.13 0.09 0.06
Liquidity 0.35 * 0.39 * -0.08 0.08 -0.02 -0.14 0.07 0.33 * 0.08 -0.14 0.03
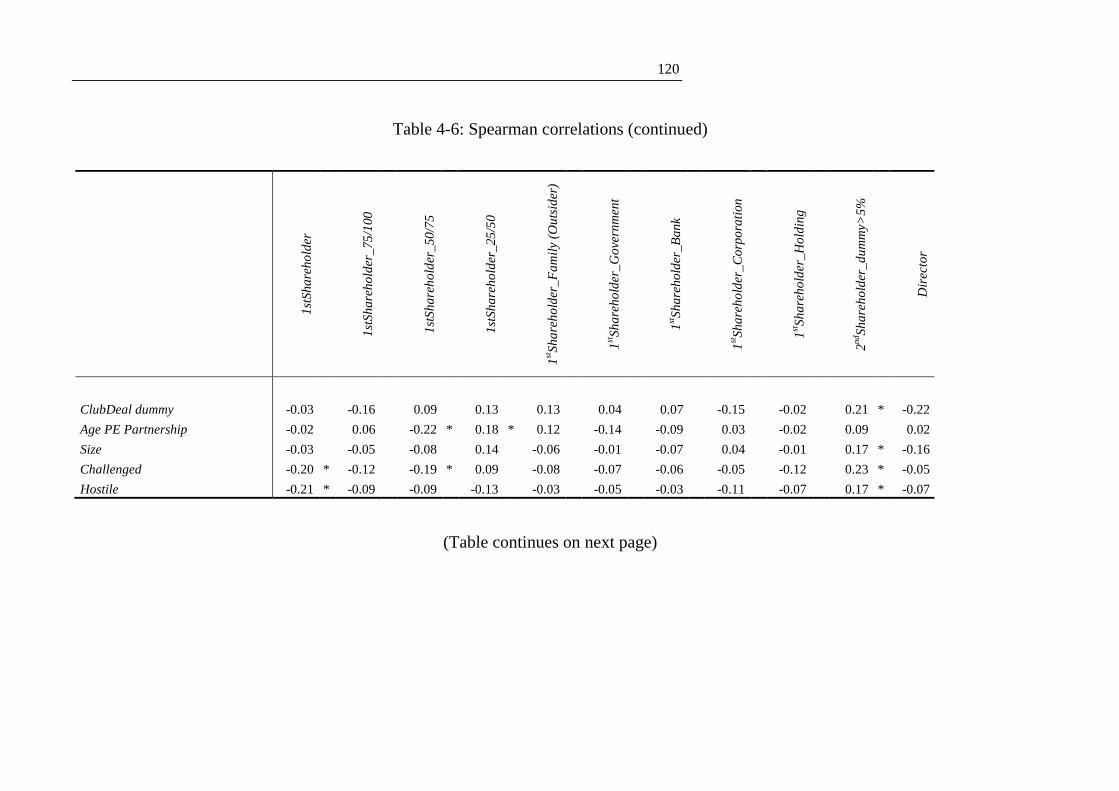
120
Table 4-6: Spearman correlations (continued)
1st
Sh
are
ho
lde
r
1
stS
ha
reh
old
er_
75
/100
1st
Sh
are
ho
lde
r_50
/75
1st
Sh
are
ho
lde
r_25
/50
1stS
ha
reh
old
er_
Fa
mily
(O
uts
ide
r)
1stS
ha
reh
old
er_
Go
vern
me
nt
1stS
ha
reh
old
er_
Ba
nk
1stS
ha
reh
old
er_
Co
rpo
ratio
n
1stS
ha
reh
old
er_
Ho
ldin
g
2nd S
ha
reh
old
er_
du
mm
y>5
%
Dire
cto
r
ClubDeal dummy -0.03 -0.16 0.09 0.13 0.13 0.04 0.07 -0.15 -0.02 0.21 * -0.22
Age PE Partnership -0.02 0.06 -0.22 * 0.18 * 0.12 -0.14 -0.09 0.03 -0.02 0.09 0.02
Size -0.03 -0.05 -0.08 0.14 -0.06 -0.01 -0.07 0.04 -0.01 0.17 * -0.16
Challenged -0.20 * -0.12 -0.19 * 0.09 -0.08 -0.07 -0.06 -0.05 -0.12 0.23 * -0.05
Hostile -0.21 * -0.09 -0.09 -0.13 -0.03 -0.05 -0.03 -0.11 -0.07 0.17 * -0.07
(Table continues on next page)
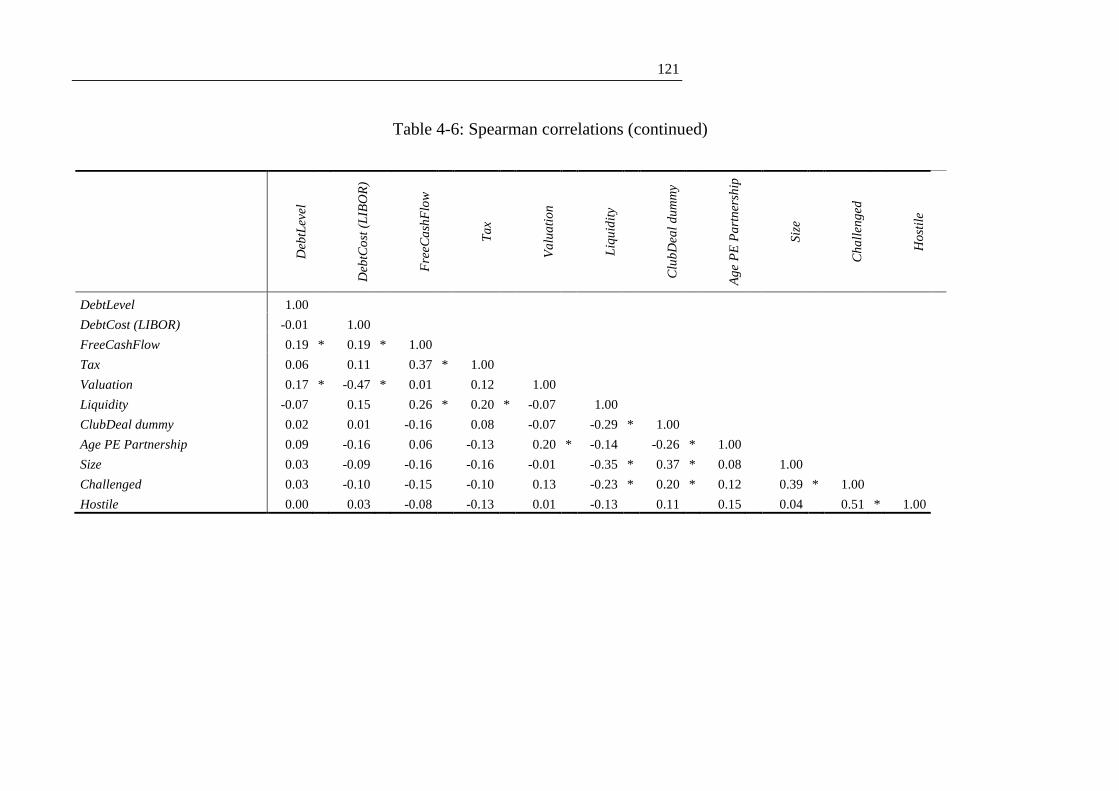
121
Table 4-6: Spearman correlations (continued)
De
btL
eve
l D
eb
tCo
st (
LIB
OR
)
Fre
eC
ash
Flo
w
Ta
x
Va
lua
tion
Liq
uid
ity
Clu
bD
ea
l du
mm
y
Ag
e P
E P
art
ne
rsh
ip
Siz
e
Ch
alle
ng
ed
Ho
stile
DebtLevel 1.00
DebtCost (LIBOR) -0.01 1.00
FreeCashFlow 0.19 * 0.19 * 1.00
Tax 0.06 0.11 0.37 * 1.00
Valuation 0.17 * -0.47 * 0.01 0.12 1.00
Liquidity -0.07 0.15 0.26 * 0.20 * -0.07 1.00
ClubDeal dummy 0.02 0.01 -0.16 0.08 -0.07 -0.29 * 1.00
Age PE Partnership 0.09 -0.16 0.06 -0.13 0.20 * -0.14 -0.26 * 1.00
Size 0.03 -0.09 -0.16 -0.16 -0.01 -0.35 * 0.37 * 0.08 1.00
Challenged 0.03 -0.10 -0.15 -0.10 0.13 -0.23 * 0.20 * 0.12 0.39 * 1.00
Hostile 0.00 0.03 -0.08 -0.13 0.01 -0.13 0.11 0.15 0.04 0.51 * 1.00
122
4.4.2.1 Governance related results in the continental European context
From Table 4-7 we see that there is no support for Hypotheses 1.1 which states that
premiums and abnormal returns are more pronounced when executive managers hold
either relatively little or high stakes in the pre-buyout company. Both the Directors
and Directors² variables are statistically insignificant across all six models.
Consequently, the potential to strongly align manager with shareholder incentives in
the post-buyout company through an adequate managerial ownership stake seems not
to be a key agency factor leading to higher announcement returns or premiums.
This finding might be attributable to the existence of large outside blockholders who
have the power and incentives to curb manager’s behaviour. As stated in Hypotheses
1.2, abnormal returns and premiums shall be lower when a blockholder has monitored
the pre-buyout firm since there is less remaining potential to improve firm
performance post-buyout. Consistent with this reasoning, we find that the stake of the
largest outside blockholder is negatively related to both abnormal returns (model 1)
and premiums (model 4). The estimated coefficients are statistically and economically
significant: a 1% increase in the stake of the largest owner implies a 2.4% (2.7%)
decrease in the abnormal return (premium).
To deepen our understanding of the monitoring hypothesis, we divide the largest
blockholders into groups according to the economic thresholds at 25, 50 and 75%. The
results for the CARs are reported in model 2 and the results for the premiums are
reported in model 5. With regard to the CARs, model 2 suggests that the monitoring
argument holds for companies where the largest blockholder holds voting rights in
excess of 75%. Such a supermajority grants the blockholder far-reaching rights213 and
thereby allows her/him to monitor the management rigorously. With regard to the
premiums, model 5 similarly implies that the monitoring argument applies to
companies where the largest blockholder holds a super- or simple-majority. From a
pure monitoring perspective, one would have expected to see a larger negative
213 For instance in Germany, a supermajority enables the blockholder to “amend the corporate charter,
change the composition of the supervisory board, and enter into profit transfer and control agreements” (Jenkinson/Ljungqvist (2001), p. 402).
123
coefficient on the variable 1stShareholder_75/100 than on the variable
1stShareholder_50/75. The estimated coefficients are, however, of similar height.
Hence, there seems to be a counter effect at work. For instance, given that squeeze out
thresholds lie in most continental European jurisdictions at 90% (Ventoruzzo (2010)),
it may be that blockholders demand higher premiums for 75% plus stakes (since they
reduce the transaction failure risk for private equity investors significantly) thereby
balancing the lower remaining monitoring potential.
Monitoring may not only vary with the size of the largest blockholder but also by
her/his identity. Consequently, we build interaction variables of the largest
blockholder’s stake with dummy variables representing her/his type (families,
governments, banks, corporations, and holding firms). As stated in Hypotheses 1.3, we
expect abnormal returns and premiums to be lower when the largest shareholder in the
pre-buyout company is a family, bank, corporation or holding company that shall have
more incentives to engage in monitoring than the government. In both the CAR (model
3) and premium (model 3) regression, the estimated coefficients for Corporations,
Banks and Holdings are economically and statistically significantly negative. This
result lends support towards the view that these blockholders act indeed as effective
monitors thereby leaving less potential for performance improvements in the post-
buyout company which translates into lower abnormal returns and premiums.
Conversely, the estimated coefficients for Government and Family are not statistically
significantly different from zero. While the result for governments seems plausible in
the light that previous empirical research has found this type of shareholder to be a
weak monitor, the result for families is less clear-cut. A plausible explanation is that
private benefit consumption as a competing factor may counterbalance the monitoring
effects and, hence, the latter explanation does not show up empirically. Indeed, in
chapter 3.4.2.1 we have seen that companies with large family blockholders have a
lower takeover probability since these families are likely to consume substantial
private benefits and therefore demand higher premiums.214
214 In particular, chapter three shows with respect to family controlled firms that a one-percent increase
in the measure of private benefits of control has twice the negative effect on the likelihood of the
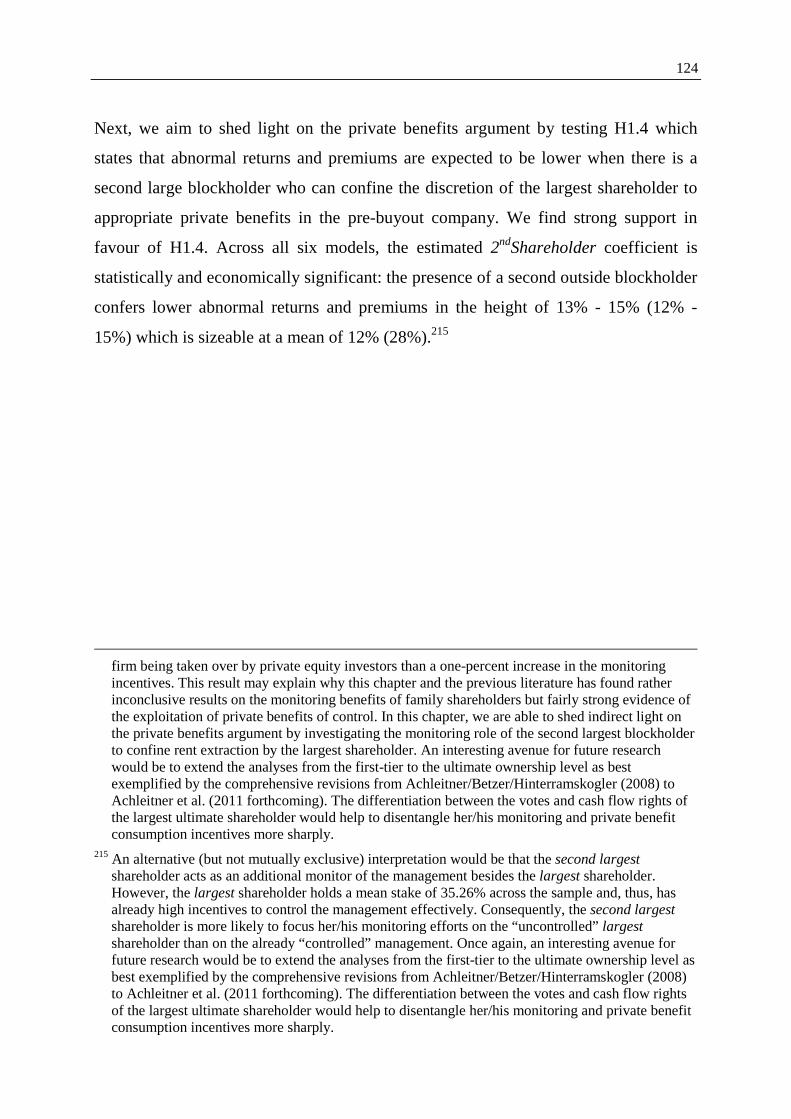
124
Next, we aim to shed light on the private benefits argument by testing H1.4 which
states that abnormal returns and premiums are expected to be lower when there is a
second large blockholder who can confine the discretion of the largest shareholder to
appropriate private benefits in the pre-buyout company. We find strong support in
favour of H1.4. Across all six models, the estimated 2ndShareholder coefficient is
statistically and economically significant: the presence of a second outside blockholder
confers lower abnormal returns and premiums in the height of 13% - 15% (12% -
15%) which is sizeable at a mean of 12% (28%).215
firm being taken over by private equity investors than a one-percent increase in the monitoring incentives. This result may explain why this chapter and the previous literature has found rather inconclusive results on the monitoring benefits of family shareholders but fairly strong evidence of the exploitation of private benefits of control. In this chapter, we are able to shed indirect light on the private benefits argument by investigating the monitoring role of the second largest blockholder to confine rent extraction by the largest shareholder. An interesting avenue for future research would be to extend the analyses from the first-tier to the ultimate ownership level as best exemplified by the comprehensive revisions from Achleitner/Betzer/Hinterramskogler (2008) to Achleitner et al. (2011 forthcoming). The differentiation between the votes and cash flow rights of the largest ultimate shareholder would help to disentangle her/his monitoring and private benefit consumption incentives more sharply.
215 An alternative (but not mutually exclusive) interpretation would be that the second largest shareholder acts as an additional monitor of the management besides the largest shareholder. However, the largest shareholder holds a mean stake of 35.26% across the sample and, thus, has already high incentives to control the management effectively. Consequently, the second largest shareholder is more likely to focus her/his monitoring efforts on the “uncontrolled” largest shareholder than on the already “controlled” management. Once again, an interesting avenue for future research would be to extend the analyses from the first-tier to the ultimate ownership level as best exemplified by the comprehensive revisions from Achleitner/Betzer/Hinterramskogler (2008) to Achleitner et al. (2011 forthcoming). The differentiation between the votes and cash flow rights of the largest ultimate shareholder would help to disentangle her/his monitoring and private benefit consumption incentives more sharply.
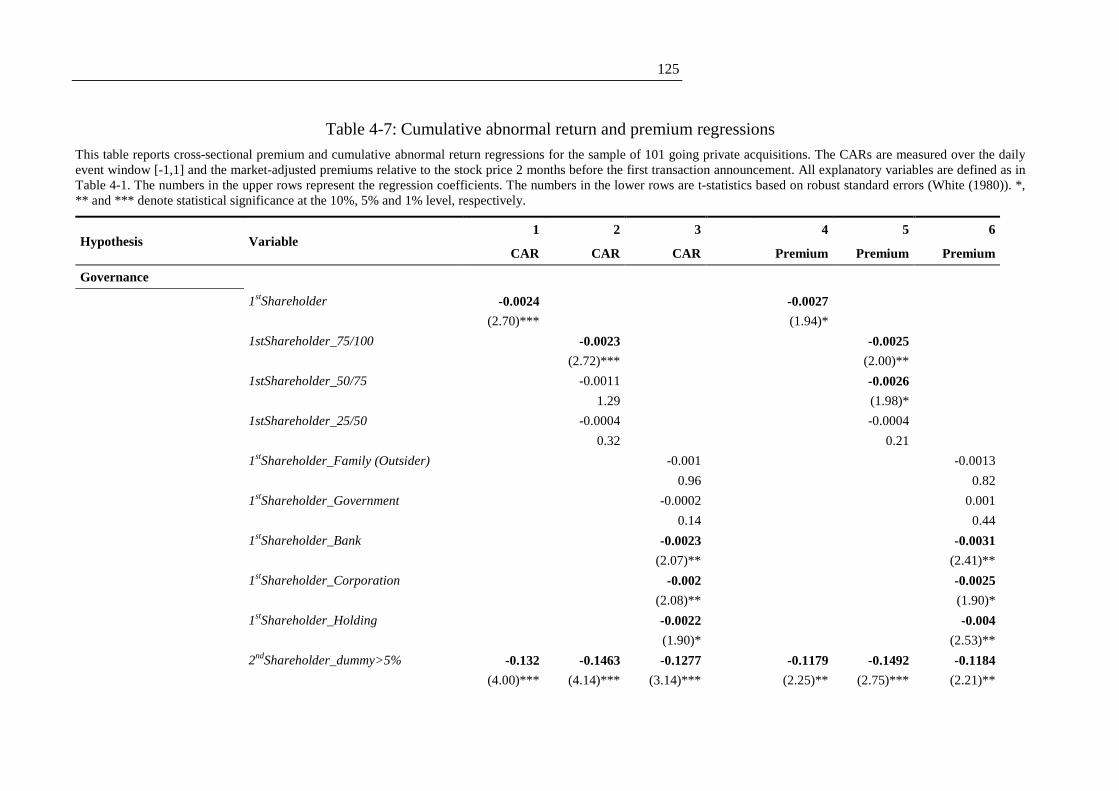
125
Table 4-7: Cumulative abnormal return and premium regressions
This table reports cross-sectional premium and cumulative abnormal return regressions for the sample of 101 going private acquisitions. The CARs are measured over the daily event window [-1,1] and the market-adjusted premiums relative to the stock price 2 months before the first transaction announcement. All explanatory variables are defined as in Table 4-1. The numbers in the upper rows represent the regression coefficients. The numbers in the lower rows are t-statistics based on robust standard errors (White (1980)). *, ** and *** denote statistical significance at the 10%, 5% and 1% level, respectively.
Hypothesis Variable 1 2 3 4 5 6
CAR CAR CAR Premium Premium Premium
Governance
1stShareholder -0.0024 -0.0027
(2.70)*** (1.94)*
1stShareholder_75/100 -0.0023 -0.0025
(2.72)*** (2.00)**
1stShareholder_50/75 -0.0011 -0.0026
1.29 (1.98)*
1stShareholder_25/50 -0.0004 -0.0004
0.32 0.21
1stShareholder_Family (Outsider) -0.001 -0.0013
0.96 0.82
1stShareholder_Government -0.0002 0.001
0.14 0.44
1stShareholder_Bank -0.0023 -0.0031
(2.07)** (2.41)**
1stShareholder_Corporation -0.002 -0.0025
(2.08)** (1.90)*
1stShareholder_Holding -0.0022 -0.004
(1.90)* (2.53)**
2ndShareholder_dummy>5% -0.132 -0.1463 -0.1277 -0.1179 -0.1492 -0.1184
(4.00)*** (4.14)*** (3.14)*** (2.25)** (2.75)*** (2.21)**

126
Table 4-7: Cumulative abnormal return and premium regressions (continued)
Hypothesis Variable 1 2 3 4 5 6
CAR CAR CAR Premium Premium Premium
Director -0.0021 -0.0012 -0.0009 -0.005 -0.005 -0.004
1.15 0.65 0.48 1.51 1.55 1.23
Director² 0 0 0 0 0.0001 0
0.01 0.23 0.42 1.16 1.25 0.9
Capital structure
DebtLevel -0.0039 -0.0064 -0.0053 0.0199 0.0194 0.0201
0.53 0.77 0.65 1.46 1.37 1.39
DebtCost (LIBOR) -0.0312 -0.0248 -0.0259 -0.0008 0.0011 0.0144
1.38 1.08 1.08 0.02 0.03 0.39
FreeCashFlow 0.0403 0.0254 0.0434 -0.1388 -0.1381 -0.1652
0.32 0.22 0.32 0.88 0.92 0.97
Tax -0.5212 -0.5233 -0.5457 -1.0474 -1.201 -1.1409
1.07 1.04 1.1 1.25 1.36 1.29
Valuation
Valuation -0.117 -0.1251 -0.1212 -0.1833 -0.1908 -0.1941
(2.20)** (2.40)** (2.15)** (2.18)** (2.30)** (2.24)**
Liquidity 0.0696 0.0649 0.0818 0.288 0.2532 0.3406
-0.82 -0.73 -0.94 (2.11)** (1.82)* (2.51)**
Challenged -0.0374 -0.0339 -0.0318 -0.0377 -0.0459 -0.0374
0.82 0.76 0.69 0.52 0.63 0.52
Hostile -0.0763 -0.0575 -0.07 0.151 0.1856 0.1474
1.05 0.83 0.97 1.33 1.61 1.23
Private equity
ClubDeal dummy 0.0092 0.0018 0.0012 0.0564 0.053 0.0469
0.28 0.06 0.04 1.19 1.09 1.01
127
Table 4-7: Cumulative abnormal return and premium regressions (continued)
Hypothesis Variable 1 2 3 4 5 6
CAR CAR CAR Premium Premium Premium
Age PE Partnership 0.0008 0.0008 0.0007 0.0017 0.0012 0.002
0.51 0.54 0.47 0.85 0.52 0.99 Control variables
Germany dummy -0.054 -0.0421 -0.0698 -0.0306 -0.0186 -0.0455
1.63 1.29 (2.35)** 0.41 0.25 0.6
France dummy -0.128 -0.1385 -0.1384 -0.0405 -0.0407 -0.0494
(4.13)*** (4.24)*** (4.43)*** 0.72 0.69 0.9
Sweden dummy 0.0418 0.0526 0.0547 0.0512 0.0464 0.0649
0.88 1.1 1.08 0.82 0.74 0.99
Netherlands dummy 0.0422 0.0521 0.0557 -0.0715 -0.0675 -0.0613
0.79 0.99 1.01 1.01 0.98 0.87
Period 01-03 dummy -0.0043 0.006 0.0159 0.042 0.0368 0.0837
0.13 0.18 0.42 0.72 0.65 1.29
Period 04-07 dummy 0.0086 0.0274 0.025 0.0572 0.0477 0.0987
0.24 0.7 0.62 1.06 0.84 1.66
Size -0.0263 -0.028 -0.0233 -0.0136 -0.0153 -0.0091
1.42 1.5 1.21 0.37 0.45 0.25
Constant 0.6297 0.558 0.5622 0.5629 0.5703 0.4457
(4.19)*** (3.63)*** (3.40)*** (2.37)** (2.39)** (1.77)*
Observations 101 101 101 101 101 101
Adjusted R-squared 0.3656 0.3665 0.3368 0.1427 0.1414 0.1565
F value 4.74*** 4.89*** 5.25*** 2.37*** 2.33*** 2.5***
128
4.4.2.2 Capital structure related results
With regard to the capital structure hypotheses, the following picture evolves. In all
six models, the leverage, free cash flow and tax liability levels do not explain cross-
sectional variation in the abnormal returns and premiums. We examine different
proxies but the aforementioned results are robust to all alternative specifications.
Hence, the potential to increase leverage in order to both realize additional tax shields
and to curtail managerial discretion at free cash flow seems not to drive abnormal
returns and premiums. Hence, Hypotheses 2.1 is rejected. Similarly, the LIBOR as our
proxy for the market-wide cost of debt is not related to abnormal returns and
premiums. Hence, there is no evidence for Hypotheses 2.2 that favourable lending
conditions stemming from periodical capital market mispricing impact buyout pricing
and, consequently, announcement returns.
4.4.2.3 Valuation related results
With regard to the valuation hypotheses, we find widespread evidence for Hypotheses
3.1 that the relative underperformance of the target in comparison to the stock market
confers higher abnormal returns and premiums. The variable Valuation is negative and
statistically significant at the 1% (5%) level across all CAR (premium) models. This
lends support to Kaplan and Schoar’s (2005) notion that private equity investors are
sophisticated institutional investors with an excellent network which allows them to
spot underperforming firms and increase their value (under private ownership).
Furthermore, we also find evidence that a thin, pre-buyout trading volume of the target
stock leads to higher premiums but not to announcement returns. A potential
explanation may be that a thin trading volume requires private equity investors to offer
ultimately a higher final (premium) offer price (since he aims to secure full control)
but that the initial offer at the announcement may have been too low to cause
illiquidity-induced abnormal return increases.
Finally, the potential for private equity investors to benefit from their identification
skills of undervalued targets seems not to be constrained by bidding competition and
resistance from target managers. Both coefficients for Challenged and Hostile are not
129
statistically significantly different from zero. Hence, Hypotheses 3.2 is rejected. It has
to be noted, however, that these results have to be treated with care since in practice it
is difficult to measure how competitive or hostile a bidding process is.216
4.4.2.4 Private equity related results
Concerning the private equity investor hypotheses, we find no evidence that the
experience of the funds’ general partners or the syndication of partnerships drives
abnormal returns and premiums. Both coefficients for Age PE Partnership and
ClubDeal are statistically insignificant in all six models. In robustness checks, various
alternative proxies for both hypotheses are tested.217 None of them helps in explaining
the cross-sectional variation in the abnormal returns or premiums. Consequently, the
syndication (H 4.1) and experience (H 4.2) hypotheses are rejected.
4.4.2.5 Further variables
With respect to country-fixed effects, we find that abnormal announcement returns in
model 1 to 3 are significantly lower in France than in other continental European
countries (at the 1% level). However, this difference vanishes for the premiums as
evidenced in model 4 to 6. A potential explanation for these results is that the deal
completion risk may be relatively high in France. Time-fixed effects for up- and down-
turn stock market periods (Period 01-03 and Period 04-07)218 and firm size do not
impact abnormal returns or premiums.
216 For instance, conventional bidding competition or intensity measures from commercial databases
consider not that “the board of directors can always threaten to open the bid process to another bidder - under so-called go-shop agreements - and so a good board of directors will negotiate hard even with a sole bidder” (Jenkinson/Stucke (2010), p. 19).
217 To proxy for syndication, two proxies are employed: ClubDeal is a dummy set to one if two or more private equity investors participate in the equity syndicate, Syndication measures the number of private equity investors participating in the equity syndicate. To proxy for the experience of general partners four proxies are employed: AgePePartnership measures the age of the youngest syndicate partner whereas AgePePartnership2 measures the age of the oldest syndicate partner. FirstFund is set to one, if one of the syndicate partners is a first time-fund whereas FirstFund2 is set to one, if all of the syndicate partners are first time-funds.
218 Time periods are used instead of years since the sample size is limited and the regression models include already a high number of independent variables.
130
4.5 Summary
With the second buyout wave, PE’s interest spilled over into continental European
markets. Although these markets are characterised by many distinctive features, little
systematic research is available on how private equity adapts to this peculiar setting.
Based on this lack of evidence, we examine the pricing of going private buyouts in the
form of the final premiums paid by private equity investors and the abnormal returns
to shareholders at the immediate announcement. Going private transactions were a
significant driver behind the last buyout wave and represent an interesting research
object in the continental European context since both (i) sharp pricing measures can be
calculated due to market quotes and (ii) targets are relatively closely held.
Consequently, this chapter may not only help in understanding the pricing of public
buyout targets but also the one of private buyout targets.
As a distinctive feature of continental European corporate governance, blockholders
are likely to impact the pricing of buyouts in two ways. On the one hand, given the
size of their stake, blockholders are likely to have pronounced monitoring incentives to
alleviate the conventional manager-shareholder conflict. However, not all types of
large shareholders, such as the government for instance, may engage in monitoring.
Ultimately, if the blockholder curtails managerial malpractice in the pre-buyout
company, premiums and abnormal returns conferred by a private equity acquisition
should be lower as these targets offer less remaining potential for corresponding
agency cost reductions. On the other hand, blockholders also have incentives to extract
private benefits at the cost of the remaining shareholders. Clearly, such blockholders
will only give up these extra rents in stake sales where private equity investors
compensate them through adequately higher prices. Rent extraction by the largest
blockholder can be curtailed by the presence of a second large shareholder. As a result,
premiums and abnormal returns conferred by a private equity acquisition should be
lower if there is a second large blockholder in the pre-buyout company who confines
the discretion of the largest shareholder to consume private benefits.
Based on a self-collected sample, we find that private equity investors pay a final
mean premium of 28.3% relative to the market price two months before the
131
announcement date. This value is 3.0 percentage points lower than for comparable US
transactions and, thus, is consistent with the monitoring and restriction of private
benefits rationales. Further, we find that shareholders gain around the announcement
day abnormal returns of 13.0% in the [-1,1] event window. This value is 7.7
percentage points lower relative to US transactions and, thus, underlines the higher
deal completion risk in continental Europe.
In terms of the underlying sources, the cross-sectional regression results lend strong
support towards the crucial role of both the monitoring and private benefits arguments.
With respect to monitoring, the stake of the largest outside blockholder is negatively
related to premiums and abnormal returns. This result is in line with the view that
blockholders with strong monitoring incentives leave less potential for the private
equity investor to reduce agency costs in the post-buyout company thereby leading to
lower premiums and abnormal returns. When taking into account the identity of the
largest blockholder, the evidence suggests that corporations, banks and holdings are
active monitors but not the government. Interestingly, (outside) families seem also not
to be active monitors but this result has to be treated with care. As we know from
chapter 3.4.2.1, this shareholder class is particularly prone to private benefit
consumption, a factor which may counterbalance the monitoring effects and thereby
lead not to lower premiums and abnormal returns as expected. We shed light on the
validity of the private benefit argument by exploiting the (non-)existence of a second
large blockholder in the target’s shareholder structure. As expected, her/his presence is
negatively related to the premiums and abnormal returns. This result is consistent with
the view that the second large blockholder acts as a monitor of the dominant
blockholder, curtails rent extraction and thereby limits the latter’s ability to demand
higher takeover prices.
In addition to the central monitoring and private benefits results, we find widespread
evidence that firms with low valuation levels confer higher premiums and abnormal
returns. This finding is consistent with the view that private equity investors are skilful
in both identifying less visible and/or underperforming firms as well as increasing their
132
value under private ownership. Furthermore, there is also evidence that a thin, pre-
buyout trading volume of the target stock amplifies the premiums.
Several avenues for extensions and future research arise from this chapter. First, given
the distinctive role of the largest blockholder in explaining the wealth effects, it would
be interesting to implement an empirical approach similar to Achleitner et al. (2011
forthcoming) which is helpful in opposing the monitoring and private benefit
incentives more directly. Second, it would be interesting to compare the results to non-
private equity sponsored transactions. Based on such an increased sample size, it
would also be possible to analyse the impact of regulatory differences between the
jurisdictions beyond country fixed effects. Third, it would be clearly compelling to
investigate how the final premiums paid compare to the actual value generated at the
portfolio company level during the private phase and to the returns realized by the
private equity funds. Access to such private data would greatly help in understanding
the private equity fund’s value generation role.

133
5 Why Do Strategic Investors Pay so Much More Compared to Private Equity
Investors? The Role of Operational Synergies
5.1 Introduction
Corporate takeovers are a prominent feature of the business landscape. At the end of
the last takeover wave in 2007, the annual aggregated global transaction value
amounted to a record-breaking $4.2 trillion.219 A central development of the last wave
was the revival of private equity, i.e. financial investors220 alongside traditional
strategic investors. Financial investors increased their market presence in terms of
competing bids to 36% at the height of their activity in 2006 compared to 14% in 2001
(Dittmar et al. (2010)). Similarly, in terms of completed deals, financial investors
accounted for 21% of the total deal volume at the wave’s peak compared to 5% at the
wave’s bottom (ThomsonReuters/JPMorgan (2009)). These figures underline the
increased economic significance of financial investors during the last wave and have
led to heightened scrutiny by the media. An often raised concern has been that
takeovers by financial investors result in “suboptimal” takeover prices. One prominent
argument given is that financial investors offer target managers high-powered
incentive contracts. In turn, they might agree to suboptimal takeover prices to the
detriment of their shareholders since they want to assume these alluring incentive
contracts.221 Such objections to relatively low takeover prices have led to a new wave
219 Cf. ThomsonReuters/JPMorgan (2009), p. 8, values are inferred from graphs. 220 The terms private equity investor and financial investor are used interchangeably in this chapter. 221 For example, Ben Stein states in the New York Times: “[..] in a management buyout, management
is seeking to pay the least it can get away with for the assets of the public holders, while the public holders want the most they can get. On its face, this is an irreconcilable conflict of interest… Why this kind of conflict is allowed is a mystery to me. Add to that the problem of a lack of full disclosure. In a management buyout, company managers generally prepare memos for the buyout investors, saying how much they expect to make on the deal. Specifically, they say how much of an internal rate of return they expect on their investment. This, in turn, involves a calculation of just how much more the assets they are buying are worth than what they are paying to us stockholders for those assets. But those memos are not disclosed to the stockholders or to the market generally… management and its worthy friends say that all is solved because it gets a “fairness letter” from an investment bank saying that the price it is offering for the stock is fair. But this means zilch. Investment banks never cross management any more than appraisers cross lenders [..]”, http://www.nytimes.com/2006/09/03/business/yourmoney/03every.html?pagewanted=2&_r=2, last accessed on March 29 2011.

134
of litigation towards financial investors.222 Yet, there is little in-depth research on these
bidders and their transactions. Only recently, Bargeron et al. (2008) address this
paucity and examine takeover premiums paid by different investor classes. They find
that public bidders pay significantly higher takeover premiums than private investors.
This gap amounts to a staggering 63% when public bidders are compared to the private
bidder subgroup of financial investors. However, they cannot pin-down the driver(s)
behind this massive premium differential and stress that future research shall help
towards addressing this important question.
This is the point of origin for this chapter. We argue that expected operational
synergies on behalf of strategic takeovers shall be an important rationale. Operational
synergies represent the excess value that is generated by combining two operating
firms; i.e. value arising, for example, from economies of scale, increased pricing
power and higher growth potential which would not have been available to these firms
operating independently (Damodaran (2005)).223 Operational synergies are an intuitive
and very important rationale, particularly in light of the aforementioned increased
criticism and litigation of financial investors. Essentially, quantifying operational
synergies and relating them to takeover premiums will shed light on the issue of
whether there is indeed a premium differential. Put differently, discounting for
operational synergies in strategic deals will set an appropriate benchmark for a well-
founded economic comparison between the two bidder types.
222 For details, see Allerhand/Aronstam (2007). 223 Hence, we refrain from including financial synergies in the form of incremental debt tax shields
since these are available to both strategic and financial investors. In particular large strategic investors (such as publicly listed corporations which we focus on in this study due to data availability reasons) have access to credit markets similar to that of financial investors. For instance, General Electric as a frequent borrower shall be able to raise leverage on similar terms as a financial investor, i.e. it is unlikely that any one of them benefits from a reputational or relationship advantage due to more frequent interactions with the credit market. In any case, even if the aforementioned commodity view of leverage does not hold and financial investors enjoy a reputational edge over strategic investors, then the former would pay higher takeover premiums than the latter (in a competitive takeover market). Consequently, financial synergies cannot serve as an explanation for the contrary empirical observation (Bargeron et al. (2008)) that strategic investors pay far higher premiums than financial investors (for further details see also Jenkinson/Stucke (2010) who provide evidence that the tax benefits in LBOs accrue to the company vendors).
135
The vast literature on takeover pricing has largely neglected synergies in explaining
takeover premiums, most likely because it is not straightforward to estimate them. One
strand of research has assessed synergies by drawing on the combined abnormal
returns of the target and bidder around the merger announcement date (Bradley et al.
(1988), Andrade et al. (2001), amongst others). This methodology is - at least for this
study’s purpose - problematic since it results in an aggregate proxy that contains both
ancillary information about the standalone values of the merging companies and new
information about expected synergies (Hietala et al. (2003)). Generally, it is difficult to
disentangle the two components and even when it is possible to confine the value of
expected synergies, it is still an aggregate proxy in the sense that it contains both
operating and financial synergies. For the purpose of this study, however, we aim to
grasp only the value of operating synergies. Alternative studies have tried to infer
synergies from realized long-term operating and stock performance following the
merger consummation (Ravenscraft/Scherer (1989), Agrawal et al. (1992),
Franks/Mayer (2001) and Healy et al. (1992), amongst others) but these measures face
considerable challenges: first, they crucially depend on the calculation approach of
abnormal returns and the respective time horizon employed. Further, the relatively
long time horizons per se lead to noisy estimates since new, merger-unrelated
information evolves and companies go out of business causing survivorship bias.
Finally, it is questionable whether the typically employed industry benchmarks are
appropriate as pointed out by Harford (2005): a merged firm which performs worse
than the industry may still do better than the sum of the stand-alone entities would
have done.
We differ from these approaches by exploiting the change in analyst expectations
around the merger consummation date. Analysts are highly informed experts and,
compared to management, relatively neutral. Arguably, almost all institutional
investors incorporate the expertise of analysts in their investment decisions. However,
this valuable source of information has been largely neglected in the vast takeover
literature. Notable exemptions are Harford (2005), Devos et al. (2009) and
Bernile/Bauguess (2010) but these studies do not focus on takeover pricing and, in

136
particular, not on explaining the premium differential between strategic and financial
investors. We capitalize on the expertise of analysts by setting cash-flow proxy
forecasts for the combined firm after the takeover consummation date in relation to the
sum of the stand-alone forecasts for the acquirer and target before the consummation
date. The difference shall result in an estimate of expected operational synergies. It is
important to stress that our focus lies on analyst revisions around the merger
consummation date and not the announcement. Thereby we shall be able to pick up
synergies per se, i.e. gains resulting from the specific fit between the target and bidder
but not stand-alone restructuring potential. The reasoning is as follows: at the
announcement date, it is unclear whether a takeover will indeed take place and, if yes,
who will be the ultimate winner. Hence, potential analyst revisions around the
announcement date would not largely capture specific synergies but rather general
restructuring potential which would be realizable by the target as a standalone entity
(either by incumbent managers due to the pressure from the market for corporate
control or by more skilled financial investors).224 The closer one approaches the
completion date, the more the general restructuring potential should already be
impounded in the analyst forecasts and any remaining revision should be mainly
attributable to synergistic gains. Consequently, considering analyst revisions around
the completion date gives a conservative synergy proxy which shall exclude
restructuring potential realizable by financial investors. This focus around the
completion date also has the additional benefit that the considered time period between
the analyst revisions is relatively short. Hence, our synergy measure should not be
systematically distorted by either corporate news unrelated to the merger or by
survivorship biases.
We apply this approach to two analyst forecast datasets which differ with respect to
the estimates’ availability and preciseness. First, we calculate an earnings appreciation
measure based on Institutional Brokers' Estimate System (IBES) data. This measure is
224 Supporting this argument, Eckbo (2009) stresses: “The attenuating effect of the residual uncertainty
about bid success at the initial offer announcement is important: it tends to produce offer premium estimates in the vicinity of 25-30% in Figure 1 when, as shown in the last two columns of Table 3, the true offer premium is about 45-50%” (Eckbo (2009), p 154).

137
available for the majority of takeovers and thus allows testing of a large sample.
However, it can only serve as a first, rough indicator of the value of operational
synergies since an earnings based proxy (i) also includes incremental tax shield gains
(even if their size is generally small due to the limited capital structure changes in
strategic deals) and (ii) may be distorted by transaction induced costs (such as
goodwill depreciations) if the analysts consider them in their post-takeover forecasts.
Second, we calculate a firm value appreciation measure based on Value Line (VL)
cash flow forecast data. This measure is constrained to large takeovers but leads to
highly precise estimates of expected operational synergies.225
As a result of the different degrees of precision with which the IBES and VL proxies
grasp operational synergies, the following discussion will sometimes refer to them
generically as synergies. However, it is important to stress that the aim of the chapter
is to understand the role of operational synergies in explaining the premium
differential. Consequently, the reader shall focus on the results for the precise
operational synergy measure based on VL data.
In order to evaluate the role of expected synergies on takeover pricing and, in
particular, on the premium differential between strategic and financial investors, we
draw on sizeable samples of 760 and 339 US takeovers depending on whether the
analysis is based on the IBES or VL synergy measure.
With respect to the economic magnitude of synergies, our first, indicative results for
the broad IBES earnings appreciation measure suggest that the median strategic deal is
expected to lead to a yearly earnings depreciation of 3.6%. This figure seems
somewhat questionable in the light of the evidence that most transactions do create
value and that sizeable target takeover premiums are paid.226 It appears that analysts
indeed factor some transaction related costs (such as goodwill depreciations) into their
225 Cf. section 5.2.2 for details. 226 Cf. for instance Sudarsanam (2010).
138
post-takeover earnings forecasts.227 This conjecture is supported when turning to the
results for the precise VL firm value appreciation measure. We find that the median
(mean) deal is expected to lead to operational synergies of $716 ($1,901) million
which equals an economically sensible 6.2% (9.7%) in terms of the combined firm’s
enterprise value. When focusing on the main question of how the value of expected
operational synergies compares to the value of the premium paid, we find that the
former is 3.1 (5.1) larger than the latter.228 Consequently, there is strong evidence
towards the view that operational synergies on behalf of strategic deals may indeed
explain the premium differential between strategic and financial takeovers.
Whilst the size of operational synergy gains relative to the takeover premium is
interesting in its own right, robust inference about the impact of operational synergies
on takeover pricing and, in particular, on the premium differential can only be drawn
from multivariate analyses. Therefore, we run cross-sectional regressions on the
takeover premium and include operational synergy quartile indicators for the strategic
investor subsample (i.e. the financial investor subsample represents the control group)
as well as a whole set of control variables in the form of deal-, target-, industry- and
year-fixed-effects.
We find strong evidence in favour of the synergy rationale for both the IBES and VL
measure. Although the IBES measure represents only an indicative synergy proxy as
outlined above, it does explain substantial parts of the premium differential. When the
premium is measured in terms of traditional equity based measures,229 the pricing
differential decreases steadily from the quartile of strategic deals with the highest
synergies to the quartile of strategic deals with the lowest synergies. When the
227 Assuming that there are no systematic differences in the treatment of these costs across analysts,
our estimated IBES synergy proxies may still include valuable ordinal information for examining the relation between synergies and takeover premiums in the course of regression models.
228 While these estimates may initially look large, they are put into perspective when taking into account that expected operational synergies (the numerator) accrue to both the bidder and the target and that the takeover premium (the denominator) accrues solely to the target. Indeed, when considering that the combined size of the bidder and target is approximately 10 times the size of the target, the operational synergy to premium estimates of 3.1 (5.1) seem reasonable.
229 Cf. section 5.2.3 for details on the premium calculation methodologies.
139
premium is measured in terms of enterprise based measures,230 the results are less
distinct: the pricing differential decreases from the fourth to the second synergy
quartile but not for the first one. Across all pricing measures, however, strategic
investors of the first synergy quartile still seem to pay higher premiums than financial
investors. There are two reasons why this may be the case: first, even after controlling
for synergies, there may still be a premium differential due to other potential reasons
not controlled for in the analysis. Second, it may be that the IBES proxy may not grasp
operational synergies sharply enough as already indicated. We address the latter
possibility by turning to the precise VL operational synergy measure. The respective
results lend strong support towards the decisive role of operational synergies. For all
pricing measures, the premium differential
• is largest for the quartile of strategic deals with the highest expected operational
synergies,
• decreases steadily across the remaining quartiles,
• is not statistically different from zero for the quartile of strategic deals with the
lowest expected operational synergies.
For instance, in terms of the enterprise premium measure PremiumCash/EV,231 the
following pattern evolves: the quartile of strategic deals with the highest expected
operational synergies pays on average 33.7% higher premiums than financial investors
(t-stat of 3.07). This differential gets steadily smaller until the quartile of strategic
deals with the lowest expected operational synergies when a statistically insignificant
coefficient of -1.0% (t-stat of 0.15) indicates that the respective strategic investors pay
similar premiums than their financial counterparts. On average, these strategic deals of
the first quartile are expected to generate operational synergies of less than 0.9%
230 Cf. section 5.2.3 for details on the premium calculation methodologies. 231 PremiumCash is the difference between the final bid price and the price two months prior to the
announcement date times the target’s outstanding common shares. It is scaled with the target’s enterprise value (EV) which is defined as market capitalization 43 days prior to the announcement date (AD) plus the book value of net debt from the last fiscal year date prior to the AD.
140
(0.2%)232 in terms of the target’s EV (combined firm’s EV). Hence, the regression
estimates also appear highly sensible from an economic point of view.
Consequently, there is very strong evidence in favour of the operational synergy
rationale being a, if not the central factor in explaining the sizeable premium
differential between strategic and financial investors. There seems to be little left in
favour of alternative explanations - such as the collusion argument between financial
investors and target managers - but clearly, more research is required with respect to
this question.
These findings contribute to the nascent work on how the takeover process and pricing
differs with respect to the identity of the bidder. Recently there have been three studies
which directly contrast takeovers by strategic and financial bidders. Bargeron et al.
(2008) examine takeover premiums between public and private bidders. They find that
the former pay significantly higher premiums than the latter. They argue that agency
costs on behalf of public acquirers may play an important role since the premium
differential declines with increasing managerial ownership.233 However, they also find
that the premium differential does not vary with institutional ownership, a result which
casts doubt on the agency argument since institutional investors are commonly
assumed to act as monitors who curtail managerial misbehaviour. In line with this
reasoning, the premium differential also poses the questions why every target company
would not wait for public bidders to enter the auction process and why the latter do not
win all contests (Bargeron et al. (2008))? One argument which could explain these
questions is the lack of a specific fit between certain targets and potential public
bidders, i.e. the synergy rationale. Related work by Gorbenko/Malenko (2010) analyse
the bidding behaviour of financial and strategic investors in takeover auctions. By
imposing a structural model on the auction process, they estimate intrinsic valuations
of both bidder types. They find that financial investors value potential targets in a
relatively homogenous way whereas strategic investors’ valuations are far more 232 Cf. Table 5-5 Panel A. 233 For instance, acquisitions can lead to higher compensation packages for managers due to the
increase in firm size even if the acquisition is value decreasing for their shareholders (Bebchuk/Grinstein (2005), Harford/Li (2007)).
141
idiosyncratic. Hence, Gorbenko/Malenko’s (2010) results are also in line with the
synergy argument. Similarly, Dittmar et al. (2010) examine bidding competing
patterns and find that strategic acquirers who compete against financial bidders earn
higher returns than strategic acquirers who compete against other corporate bidders.
Again, this result is consistent with the synergy rationale. However none of the
aforementioned studies quantifies the value of operational synergies and examines
whether they can explain the premium differential.
The remainder of this chapter is structured as follows. Section 5.2 describes the sample
and data collection process as well as the methodology for constructing the expected
operational synergy proxies. Section 5.3 contains the empirical results. Section 5.4
concludes.
5.2 Sample, methodology and variable definitions
5.2.1 Sample data
The takeover sample is collected from the Security Data Corporation (SDC) database.
We select all completed takeovers between U.S. public targets and bidders which were
announced between 1987 and 2009, the period for which forecast information is
available to construct synergy estimates. In line with the literature, the following set of
filters is applied to the dataset:
1. the deal is a majority acquisition which results in 100% ownership for the
bidder;
2. the deal is purely cash-financed;
3. the deal is not marked in SDC as a spinoff, recapitalization, self-tender,
exchange offer, repurchase, minority stake purchase, acquisition of remaining
interest, or privatization;
4. the deal value is disclosed;
142
5. the bidder is either a public operating entity (strategic investor), private
operating entity (strategic investor) or private equity fund (financial investor),
i.e. acquisitions by individuals are excluded;234
6. the target is an operating entity, i.e. acquisitions for non-operating targets such
as special purpose acquisition companies (SPACs), real estate investment trusts
(REITs) or closed-end funds are excluded;
7. target stock price and accounting data is available on the Center for Research in
Security Prices (CRSP) and Compustat tapes.
These filters result in a base sample of 1590 transactions which comprehends 264
(16.6%) by private equity funds, i.e. financial investors, 424 (26.7%) by private
operating entities which resemble strategic investors and 902 (56.7%) by public
operating entities which resemble equally strategic investors. Since the focus of this
chapter is on synergy estimates, we collect analyst forecast data for the public
operating bidder sample from both the Institutional Brokers’ Estimate System (IBES)
and Value Lines’ Estimate and Projections File (VL). The required IBES (VL) data is
available for 594 (82) transactions which represents 65.9% (9.1%) of the public
operating subsample.
Table 5-1 presents basic sample statistics by bidder types including the public
operating bidder subsamples with available IBES and VL data for the construction of
the synergy estimates. Absolute values are reported in 2009 consumer price index
(CPI) adjusted dollars. Deal value represents the total consideration paid by the
acquirer excluding fees and expenses.
234 We use the SDC deal synopsis, Capital IQ and Factiva to classify private bidders either as a private
equity bidder, a public operating bidder or as an individual(s). The central classification criterion for a private equity bidder is whether a fund on behalf of limited partners is in place to finance the equity portion of the deal. In the course of this detailed scrutiny of the bidder’s identity, several SDC misclassifications were encountered. For example, we found several deals where the bidder is classified as public although it is in fact only a non-traded subsidiary of a public company. These mistakes were corrected.
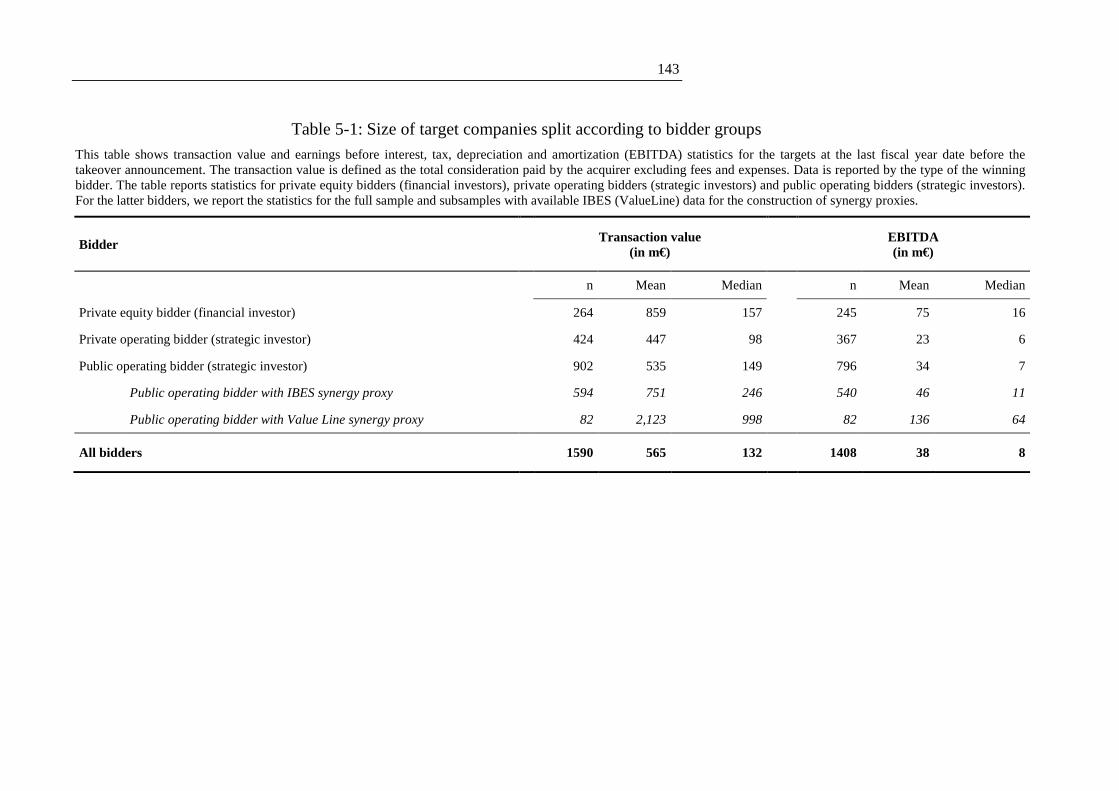
143
Table 5-1: Size of target companies split according to bidder groups
This table shows transaction value and earnings before interest, tax, depreciation and amortization (EBITDA) statistics for the targets at the last fiscal year date before the takeover announcement. The transaction value is defined as the total consideration paid by the acquirer excluding fees and expenses. Data is reported by the type of the winning bidder. The table reports statistics for private equity bidders (financial investors), private operating bidders (strategic investors) and public operating bidders (strategic investors). For the latter bidders, we report the statistics for the full sample and subsamples with available IBES (ValueLine) data for the construction of synergy proxies.
Bidder
Transaction value (in m€)
EBITDA (in m€)
n Mean Median n Mean Median
Private equity bidder (financial investor) 264 859 157 245 75 16
Private operating bidder (strategic investor) 424 447 98 367 23 6
Public operating bidder (strategic investor) 902 535 149 796 34 7
Public operating bidder with IBES synergy proxy 594 751 246 540 46 11
Public operating bidder with Value Line synergy proxy 82 2,123 998 82 136 64
All bidders 1590 565 132 1408 38 8
144
The median (mean) transaction across all bidders is priced at $132 ($565) million
which highlights that the sample includes relatively large deals. Deals consummated
by financial investors lie with a median (mean) transaction value of $157 ($859)
slightly above average values. Deals executed by strategic investors are broadly in line
with average values: private operating bidders buy slightly smaller targets with a
median (mean) transaction value of $98 ($447) and public operating bidders acquire
targets with a median (mean) transaction value of $149 ($535) which is almost
identical to the sample average. Not surprisingly, the public operating bidder
subsamples with available analyst forecast information (for the construction of the
synergy proxy) are centred towards larger deals: the median (mean) transaction in the
IBES sample is priced at $246 ($751) and the median (mean) transaction in the Value
Line sample is valued at $998 ($2,123). Statistics based on the target’s last twelve
month EBITDA lead to similar conclusions. Table B-1 in the Appendix B represents
more detailed statistics on target and deal characteristics. Since this analysis is similar
to Bargeron et al. (2008) and leads not to new insights beyond their paper, we refrain
from discussing it.
5.2.2 Methodology for grasping synergies of strategic takeovers
Measuring synergies is not straightforward. One strand of research has assessed
synergies by drawing on the combined abnormal returns of the target and bidder
around the merger announcement date (Bradley et al. (1988) and Andrade et al.
(2001)). This methodology is - at least for this study’s purpose - problematic due to the
following two reasons: first, as stressed by Hietala et al. (2003), returns around the
announcement date are driven by both ancillary information about the standalone
values of the merging companies and new information about synergies. Generally, it is
difficult to disentangle the two components. Second, even when it is possible to
confine the value of synergies, it is still an aggregate proxy in the sense that it contains
both operating and financial synergies. For the purpose of this study, however, we aim
to grasp only the value of operating synergies since financial synergies can be
consummated by both strategic and financial investors. Alternatively, another large
body of research has tried to infer synergies from realized long-term operating and
145
stock performance following the merger consummation (Ravenscraft/Scherer (1989),
Agrawal et al. (1992), Franks/Mayer (2001) and Healy et al. (1992), amongst others).
These measures face considerable challenges. First, they crucially depend on the
calculation approach of abnormal returns and the respective time horizon employed.
Further, the relatively long-time horizons per se lead to noisy estimates since new,
merger-unrelated information evolves and companies go out of business causing
survivorship bias. Finally, it is questionable whether the typically employed industry
benchmarks are appropriate as pointed out by Harford (2005): a merged firm which
performs worse than the industry may still do better than the sum of the stand-alone
entities would have.
We differ from these approaches by exploiting the change in analyst expectations
around the merger consummation date. Analysts are highly informed experts and,
compared to management, relatively neutral. We capitalize on their expertise by
setting the cash-flow (earnings) forecast for the combined firm after the takeover in
relation to the sum of the stand-alone forecasts for the acquirer and target before the
takeover. The delta represents a proxy for expected operating synergies (expected
synergies).
Synergy is a function of the specific fit between the target and bidder. At the
announcement date, it is unclear whether a takeover will indeed take place and, if yes,
who will be the ultimate winner. Hence, potential analyst revisions around the
announcement date should not largely capture specific synergies but rather general
restructuring potential which shall be realizable by the target as a standalone entity
(either by incumbent management due to pressure from the market for corporate
control or by more skilled financial investors).235 The closer one approaches the
completion date (CD), the more the general restructuring potential should already be
impounded in the analyst forecasts and any remaining revision should mainly be
attributable to synergistic gains. Consequently, considering analyst revisions around
235 Supporting this argument, Eckbo (2009) stresses: “The attenuating effect of the residual uncertainty
about bid success at the initial offer announcement is important: it tends to produce offer premium estimates in the vicinity of 25-30% in Figure 1 when, as shown in the last two columns of Table 3, the true offer premium is about 45-50%” (Eckbo (2009), p 154).

146
the CD date gives a conservative synergy proxy which largely does not include
restructuring potential realizable by incumbent management or (competing) financial
investors. This focus around the CD also has the additional benefit that the considered
time period between the analyst revision is relatively short. Hence, our synergy
measure should not be systematically distorted by either corporate news which are not
related to the merger or survivorship bias.
Two synergy estimates are constructed which differ with respect to availability and
precision. First, we draw on earnings per share estimates from IBES which are
available for the majority of the sample firms (65.9%). The resulting estimates will
allow us to get a first sense of synergies in terms of the expected earnings appreciation.
Second, we calculate precise cash-flow estimates based on Value Line data which is
limited to the larger takeovers in the sample (9.1%). The resulting estimates will grasp
the economic magnitude of operating synergies precisely in terms of the expected firm
value appreciation.
In the empirical takeover literature, forecasts of informed market participants have
been largely neglected so far to estimate synergies. Two notable exemptions are the
recent contributions of Bernile/Bauguess (2010) and Devos et al. (2009).
Bernile/Bauguess (2010) focus on voluntarily disclosed insider projections. This
approach naturally brings along selection biases with respect to both disclosure and
preciseness of forecasts: managers are only likely to report synergy related estimates if
they are likely to be economically sizeable, and even if they do, the disclosure of
precise capitalization dates will still vary heavily with its ultimate magnitude. Devos et
al. (2009) employ Value Line projections as we also do in one of our analyses.
However, their focus lies on differentiating between three sources of potential synergy
gains: tax benefits, increases in market power and efficiency improvements.
In summary, none of the two aforementioned studies focuses on the question to what
extent expected synergies may be appropriated by the target owners in the form of the
takeover premium and hence, neither tackles the premium differential between
financial and strategic takeovers. This is the question which we address in this study.

147
5.2.2.1 Synergy measure based on IBES data
We draw consensus earnings forecasts from the Summary History file of IBES. A full
information set consisting of the earnings estimates for the combined entity, the stand-
alone target and the stand-alone bidder is obtained for 594 mergers. As previously
discussed, we opt for a short event window around the completion date in order to (i)
limit the influence of corporate news unrelated to the merger, (ii) reduce the risk for
survivorship bias and (iii) to obtain a conservative synergy proxy largely free of
general restructuring potential. In particular, our IBES synergy estimate is the current
year (FY1) earnings estimate for the combined entity taken immediately after the
completion date minus the sum of the FY1 earnings estimate for the standalone bidder
and target taken a quarter before the completion date:
���_���� ������ !" ∗�$%&'(�� !" )����*+, ∗�$%&'(�*+, )����*+- ∗�$%&'(�*+- .�����*+, ∗�$%&'(�*+, /����*+- ∗�$%&'(�*+- . , (2)
where ����1(23 represents the first IBES consensus earnings estimate for the combined
entity after the completion date, ����&'� (����&'� ) the IBES consensus earnings
estimate for the stand-alone bidder (target) a quarter before the completion date and
�45678�1(23 , �45678�&'� , �45678�&'� the respective number of outstanding shares taken
from CRSP at exactly the same date as the earnings estimates.
It has to be noted that the IBES measure can only serve as a rough, indicatory proxy
for operational synergies. As an earnings based measure, the IBES proxy also
automatically comprehends financial synergies in the form of incremental tax shield
gains, even if their size is likely to be small since the capital structure typically doesn’t
change much in strategic deals. Additionally, the IBES proxy may be further distorted
by specific transaction related expenses if the analysts consider them in their post-
takeover forecasts. Generally, analysts are supposed to make their earnings forecasts
on a continuing operations basis. Hence, discontinued operations, extraordinary
charges and the like shall be discarded in the calculation of earnings forecasts. The
question which arises now is whether analysts interpret particular transaction related
costs as discontinued and/or extraordinary? For instance, how do certain analysts treat
148
goodwill depreciations resulting from the merger236 which generally accrue over
multiple years?
Nonetheless, assuming that there are no large systematic differences in the treatment
of these costs across analysts, the estimated IBES synergy proxies may still include
valuable ordinal information for examining the relationship between synergies and
takeover premiums.
5.2.2.2 Synergy measure based on Value Line data
We draw precise forecasts of income and balance sheet items from VL’s Estimates and
Projections file. All non-financial targets and bidders of the public takeover sample are
matched to VL. We obtain a full information set consisting of the precise forecasts for
the stand-alone target, the stand-alone bidder and the combined entity for 82
mergers.237 While this sample looks initially small, it is important to note that the
respective operational synergy estimates shall be highly accurate and thus will allow
us to draw sharp inferences.
As previously discussed, we opt for a short event window around the completion date
in order to (i) limit the influence of corporate news unrelated to the merger, (ii) reduce
the risk for survivorship bias and (iii) to obtain a conservative synergy proxy largely
free of general restructuring potential.
Based on the granular data, we are able to construct a precise operational synergy
proxy which will only consider expected firm value gains arising from the specific fit
between the acquirer and the target, i.e. gains from economies of scale, increasing
pricing power and/or higher growth potential, for instance. Expected gains from
financial restructuring, i.e. additional tax shields, will be excluded since these are also
236 These goodwill depreciations also usually include transaction-related costs (e.g. fees for investment
bankers and consultants) and restructuring costs (e.g. termination payments to employees) which generally are capitalized as part of the overall purchase price for an acquisition.
237 Financial corporations are excluded since their valuation models differ markedly from the ones of non-financial corporations (Bayazitova/Kahl/Valkanov (2009) and Devos/Kadapakkam/Krishnamurthy (2009)).
149
available to financial bidders.238 In particular, the VL synergy proxy will be calculated
as the difference between the expected operational gains for the combined entity and
the sum of the expected operational gains for the stand-alone bidder and target. In
order to arrive at these expected operating gains, we will employ an adjusted
compressed present value (ADV) methodology as used by Kaplan/Ruback (1995),
Ruback (2002) and Devos et al. (2009). In the following, the detailed estimation
process of the VL synergy proxy is outlined in four steps.
First, a 5-yearly series of expected cash flows is constructed for each bidder, target
and combined entity. Therefore, we collect VL forecasts for sales (S), operating
margin (OM), working capital (WC), depreciation (DEP), capital expenditure
(CAPEX), long-term debt (DEBT) and the income tax rate (T). These VL data points
are available for the next fiscal year (short-term forecast FY1) and for the fiscal year
period 3 to 5 which we consider to be year 4 (medium-term forecast FY4). In line with
Devos et al. (2009), these short- and medium-term forecasts are used to replicate the
forecasts for year 2, 3 and 5 by linearly interpolating operating profits (S x OM), DEP,
CAPEX, DEBT and working capital to sales (WC/S). Based on this information set,
we calculate for each target, bidder and combined entity expected yearly cash flows
(CF) over the next five years according to:
9: ;� ∗ <= ∗�1 �>%[email protected] � B�CD��>E, (3)
where � ∗ <= ∗�1 �>%?@. represents after-tax profits and �CD��> is investments
in fixed assets and working capital net of depreciation. It is important to highlight that
238 In particular large strategic investors (such as publicly listed corporations which we focus on in this
study due to data availability reasons) have access to credit markets similar to that of financial investors. For instance, General Electric as a frequent borrower shall be able to raise leverage on similar terms as a financial investor, i.e. it is unlikely that any one of them benefits from a reputational or relationship advantage due to more frequent interactions with the credit market. In any case, even if the aforementioned commodity view of leverage does not hold and financial investors enjoy a reputational edge over strategic investors, then the former would pay higher takeover premiums than the latter (in a competitive takeover market). Consequently, financial synergies cannot serve as an explanation for the contrary empirical observation (Bargeron et al. (2008)) that strategic investors pay far higher premiums than financial investors(for further details see also Jenkinson and Stucke (2010) who provide evidence that the tax benefits in LBOs accrue to the company vendors).
150
these cash flows exclude tax benefits of debt.239 Thereby the final synergy measure
will only grasp firm value changes arising from operating synergies but not from
financial synergies which are also available to financial investors.
Second, the cost of capital (K) is calculated for each target, bidder and combined
entity. We estimate the capital asset pricing model (CAPM) with a market risk
premium of 7%, a risk free rate equal to the yield on the 10-year Treasury bond and
the asset beta. For the stand-alone target and bidder, the asset beta is based on the VL
equity beta prior to the announcement date (AD) and a debt beta assumed to be zero.240
For the combined entity, the asset beta is the firm-value weighted average of the target
and bidder’s asset betas.
Third, the present value (PV) of expected cash flows is computed for each target,
bidder and combined entity. With regards to the terminal value (TV), we assume that
the cash flows after year 5 grow forever at the rate of the expected inflation (Inf,
obtained from the Philadelphia Federal Reserve Bank) which translates into
�DF9:G H B9:2 F1 I �G2⁄ EK
2L�IB9:K ∗ F1 I ��MGE BF� � ��MG ∗ F1 I �GKE⁄
(4)
Fourth and finally, we take the resulting present values of expected cash flows for the
combined entity (C), the stand-alone target (ST) and the stand-alone bidder (SB) and
net out the operational synergy estimate in the following way:
���NO �DF9:GP1(2'&Q'&@'&,3 � �DF9:GP&'Q'&@'&,�� ��DF9:GP&'Q'&@'&,��. (5)
Again, it is important to highlight that this measure solely grasps expected firm value
changes arising from operational synergies. Expected gains from financial synergies,
239 I.e. we restrain from including the interest tax shield. 240 For the equity value, the market capitalization 63 days prior to the announcement date is used and
for the debt value, the last twelve month’s long-term debt as reported by VL is employed.
151
i.e. increased tax shields, are excluded since these are also available to financial
investors.
5.2.3 Methodology of calculating the takeover premium
The takeover premium is measured in two ways. First and in line with the traditional
literature, we measure the equity premium – how much do investors pay on top of the
target’s equity value. In particular, it is the percentage deviation between the final bid
price and a pre-announcement basis price. For the latter, we select the price two
months prior to the earliest announcement date to allow for potential bid revisions and
market anticipation (Schwert (1996)). Consequently, there won’t be systematic
premium differences between financial and strategic acquisitions due to systematically
different bidding processes. Further, market movements are adjusted for with the
S&P500 index (Kaplan (1989a)). For robustness purposes, we also report buy-and-
hold abnormal returns (BHARs) from two months prior to the earliest announcement
up to the merger consummation date (which is bounded at day 163). As a benchmark,
5x5-Fama-French size and book-to-market portfolios are employed.
Second, we follow a recent approach by Jenkinson/Stucke (2010) and measure an
enterprise value premium. Such a measure resembles more closely the view of
financial investors since LBO execution requires not only the acquisition of the
target’s shares but also the refinancing of pre-LBO debt. Hence, the cost and
consequently the premium basis for investment decisions is the target’s enterprise
value. The premium on a company’s enterprise value can differ considerably from the
traditional premium on equity when the pre-LBO company is financed with a
significant portion of debt. In particular, we calculate the cash paid on top of the
target’s market value241 and scale it with EBITDA, a proxy for cash flow which is
available to all capital providers of the firm. This metric presents an intuitive estimate
241 Essentially, the difference between the final bid price and the price two months prior to the earliest
announcement date is multiplied by the target’s outstanding common shares.
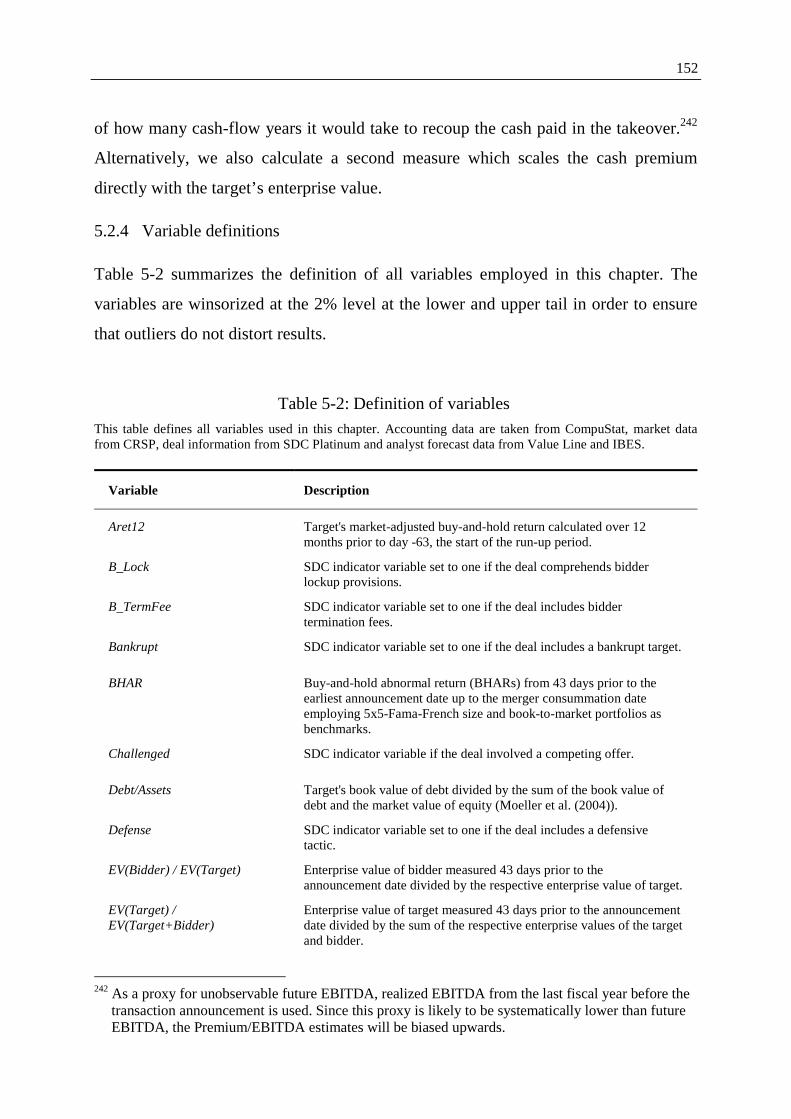
152
of how many cash-flow years it would take to recoup the cash paid in the takeover.242
Alternatively, we also calculate a second measure which scales the cash premium
directly with the target’s enterprise value.
5.2.4 Variable definitions
Table 5-2 summarizes the definition of all variables employed in this chapter. The
variables are winsorized at the 2% level at the lower and upper tail in order to ensure
that outliers do not distort results.
Table 5-2: Definition of variables
This table defines all variables used in this chapter. Accounting data are taken from CompuStat, market data from CRSP, deal information from SDC Platinum and analyst forecast data from Value Line and IBES.
Variable Description
Aret12 Target's market-adjusted buy-and-hold return calculated over 12 months prior to day -63, the start of the run-up period.
B_Lock SDC indicator variable set to one if the deal comprehends bidder lockup provisions.
B_TermFee SDC indicator variable set to one if the deal includes bidder termination fees.
Bankrupt SDC indicator variable set to one if the deal includes a bankrupt target.
BHAR Buy-and-hold abnormal return (BHARs) from 43 days prior to the earliest announcement date up to the merger consummation date employing 5x5-Fama-French size and book-to-market portfolios as benchmarks.
Challenged SDC indicator variable if the deal involved a competing offer.
Debt/Assets Target's book value of debt divided by the sum of the book value of debt and the market value of equity (Moeller et al. (2004)).
Defense SDC indicator variable set to one if the deal includes a defensive tactic.
EV(Bidder) / EV(Target) Enterprise value of bidder measured 43 days prior to the announcement date divided by the respective enterprise value of target.
EV(Target) / EV(Target+Bidder)
Enterprise value of target measured 43 days prior to the announcement date divided by the sum of the respective enterprise values of the target and bidder.
242 As a proxy for unobservable future EBITDA, realized EBITDA from the last fiscal year before the
transaction announcement is used. Since this proxy is likely to be systematically lower than future EBITDA, the Premium/EBITDA estimates will be biased upwards.

153
Table 5-2: Definition of variables (continued)
Variable Description
EV(Target+Bidder) / EV(Target)
The sum of the enterprise values of the target and bidder measured 43 days prior to the announcement date divided by the respective enterprise value of the target.
Hostile SDC indicator variable set to one if the deal includes a hostile target.
MBO SDC indicator variable set to one if the deal is classified as a MBO.
MCap Natural log of the CPI-adjusted (2009 dollars) target stock price times the number of shares outstanding 63 days prior to the announcement date.
Premium The percentage deviation of the final bid price from the basis price 43 days prior to the announcement date adjusted with the S&P500 over the same time period (Kaplan (1989a)).
PremiumCash Difference between the final bid price and the price two months prior to the announcement date times the target’s outstanding common shares.
PremiumCash/EBITDA The PremiumCash is the difference between the final bid price and the price two months prior to the announcement date times the target’s outstanding common shares. It is scaled with the targets EBITDA from the last fiscal year date prior to the AD.
PremiumCash/EV The PremiumCash is the difference between the final bid price and the price two months prior to the announcement date times the target’s outstanding common shares. It is scaled with the target’s enterprise value (market capitalization 43 days prior to the AD date plus the book value of net debt from the last fiscal year date prior to the AD).
Strategic bidder Indicator variable set to one if the bidder is a strategic investor.
SynIBES Synergy measure based on IBES data as defined in section 5.2.2.2. Measures synergies as yearly earnings appreciation percentage.
SynIBES_1Q (lowest) Indicator variable set to one if SynIBES is in the first, lowest quartile.
SynIBES_2Q Indicator variable set to one if SynIBES is in the second quartile.
SynIBES_3Q Indicator variable set to one if SynIBES is in the third quartile.
SynIBES_4Q (highest) Indicator variable set to one if SynIBES is in the fourth, highest quartile.
SynIBES_negative Indicator variable set to one if SynIBES is equal to or less than zero.
SynIBES_positive Indicator variable set to one if SynIBES is larger than zero.
SynVL (above median) Indicator variable set to one if SynVL_Cash/EV(Combined) is larger than the median value.
SynVL (below median) Indicator variable set to one if SynVL_Cash/EV(Combined) is equal or smaller than the median value.
154
Table 5-2: Definition of variables (continued)
Variable Description
SynVL_1Q (lowest) Indicator variable set to one if SynVL_Cash/EV(Combined) is in the first, lowest quartile.
SynVL_2Q Indicator variable set to one if SynVL_Cash/EV(Combined) is in the second quartile.
SynVL_3Q Indicator variable set to one if SynVL_Cash/EV(Combined) is in the third quartile.
SynVL_4Q (highest) Indicator variable set to one if SynVL_Cash/EV(Combined) is in the fourth, highest quartile.
SynVL_Cash Synergy measure based on Value Line data as defined in section 5.2.2.1. Measures synergies in absolute dollar value.
SynVL_Cash / EV (Target) SynVL_Cash (absolute dollar value of operational synergies based on VL data) scaled with the enterprise values of the target company at 43 days prior to the announcement date.
SynVL_Cash / PremiumCash SynVL_Cash divided by PremiumCash.
SynVL_Cash/EV(Combined) SynVL_Cash (absolute dollar value of operational synergies based on VL data) scaled with the combined enterprise values of the bidder and target company at 43 days prior to the announcement date.
T_Lock SDC indicator variable set to one if the deal comprehends target lockup provisions.
T_TermFee SDC indicator variable set to one if the deal includes target termination fees.
Tender SDC indicator variable set to one if the deal is a tender offer.
TobinsQ Target's firm market value assets divided by the book value of assets.
Toehold SDC indicator variable set to one if the deal involves a bidder that holds 0.5% or more of the target stock prior to the announcement.
5.3 Results
5.3.1 Sample characteristics
Table 5-3 presents takeover premiums paid by the winning bidder. We report results
both for traditional equity premiums and the alternative enterprise premiums.
Panel A highlights that financial investors pay significantly less for takeovers than
strategic investors Bargeron et al. (2008). This result holds not only for the traditional
155
equity but also for the enterprise premium measures. For all four takeover measures,
the premium differential between the private equity and public operating bidder
(private operating bidder) sample are economically and statistically sizeable: for the
equity premium measures, the difference in the means ranges from 44% to 58% and
for the enterprise premium measures, the respective difference in the means goes so far
as to range from 41% to 125%. Further, there is strong evidence that the two groups of
strategic investors – public and private operating bidders – pay similar premiums. For
three out of the four pricing measures, these two bidder types pay premiums which are
statistically not different from each other. Overall, these results indicate that synergies
play a crucial role in explaining the premium differential.
Panel B presents the same statistics for the public operating subsamples with available
analyst forecast information. For both the IBES and Value Line subsamples, the
magnitude of all four premium measures is very similar to the overall public sample.
In a few cases, the premiums in the public subsamples are higher than in the overall
public sample. Nonetheless, these positive differences will only translate into a higher
premium differential between strategic (i.e. public operating) and financial investors.
Consequently, the subsequent test of the synergy rationale takes place, if anything, in a
more demanding setting.
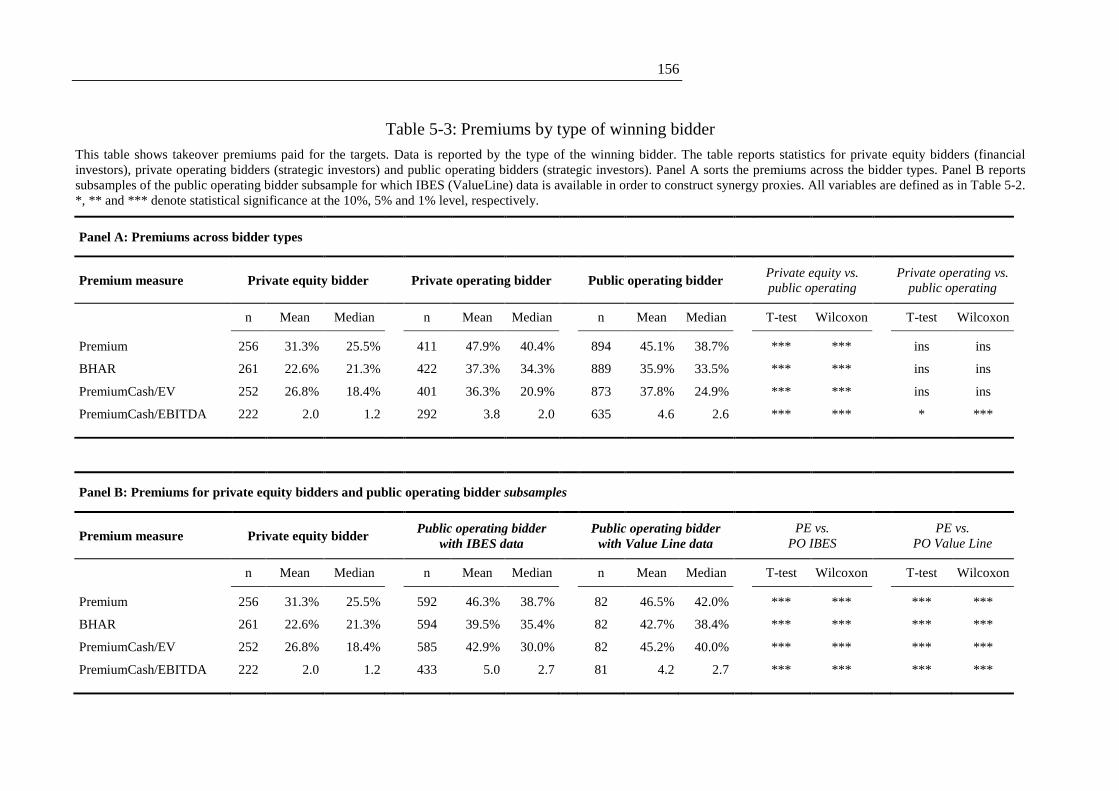
156
Table 5-3: Premiums by type of winning bidder
This table shows takeover premiums paid for the targets. Data is reported by the type of the winning bidder. The table reports statistics for private equity bidders (financial investors), private operating bidders (strategic investors) and public operating bidders (strategic investors). Panel A sorts the premiums across the bidder types. Panel B reports subsamples of the public operating bidder subsample for which IBES (ValueLine) data is available in order to construct synergy proxies. All variables are defined as in Table 5-2. *, ** and *** denote statistical significance at the 10%, 5% and 1% level, respectively.
Panel A: Premiums across bidder types
Premium measure Private equity bidder
Private operating bidder
Public operating bidder
Private equity vs. public operating
Private operating vs. public operating
n Mean Median n Mean Median n Mean Median T-test Wilcoxon T-test Wilcoxon
Premium 256 31.3% 25.5% 411 47.9% 40.4% 894 45.1% 38.7% *** *** ins ins
BHAR 261 22.6% 21.3% 422 37.3% 34.3% 889 35.9% 33.5% *** *** ins ins
PremiumCash/EV 252 26.8% 18.4% 401 36.3% 20.9% 873 37.8% 24.9% *** *** ins ins
PremiumCash/EBITDA 222 2.0 1.2 292 3.8 2.0 635 4.6 2.6 *** *** * ***
Panel B: Premiums for private equity bidders and public operating bidder subsamples
Premium measure Private equity bidder
Public operating bidder with IBES data
Public operating bidder with Value Line data
PE vs. PO IBES
PE vs. PO Value Line
n Mean Median n Mean Median n Mean Median T-test Wilcoxon T-test Wilcoxon
Premium 256 31.3% 25.5% 592 46.3% 38.7% 82 46.5% 42.0% *** *** *** ***
BHAR 261 22.6% 21.3% 594 39.5% 35.4% 82 42.7% 38.4% *** *** *** ***
PremiumCash/EV 252 26.8% 18.4% 585 42.9% 30.0% 82 45.2% 40.0% *** *** *** ***
PremiumCash/EBITDA 222 2.0 1.2 433 5.0 2.7 81 4.2 2.7 *** *** *** ***

157
5.3.2 The value of synergies
Table 5-4 Panel A presents synergy estimates based on IBES data. As previously
mentioned, the measure subtracts from the post-merger earning forecast for the
combined firm the sum of the pre-merger earnings forecasts for the standalone
acquirer and target. The respective delta is scaled with the sum of the pre-merger
acquirer and target earnings forecasts and thus gives a sense of the yearly earnings
appreciation due to the merger (in percentage points).
Based on the sample of 594 winning bids by public operating bidders, we find that the
median (mean) deal is expected to lead to an earnings reduction of 3.6% (3.0%). This
figure, which is based on the consensus of relatively neutral analysts, seems somewhat
questionable in the light of the evidence that most transactions do create value and that
sizeable target takeover premiums are paid.243 It appears that analysts do indeed not
net out transaction related costs (such as goodwill depreciations) from post-takeover
earnings forecasts leading to negatively biased synergy estimates.244 Nonetheless,
assuming that there are no systematic differences in the treatment of these costs across
analysts, the estimated IBES synergy proxies may still include valuable ordinal
information for examining the relationship between synergies and takeover premiums.
Panel B, which sorts the takeover premium according to the synergy measure in
quartiles, recommends that the indicative IBES synergy proxy indeed contains
valuable ordinal information. Across all four pricing measures, the average and
median premium is roughly the same for the takeovers in the first and second synergy
quartile and increases from the second to the fourth, both in statistical and economic
terms. Considering that there is great heterogeneity in the cross-section of takeovers
(for example in terms of bidder competition and target characteristics) which is not
taken into account in this univariate setting, the results are noteworthy and lend
support towards the synergy rationale.
243 Cf. for instance Sudarsanam (2010). 244 Cf. section 5.2.2.1 for details.
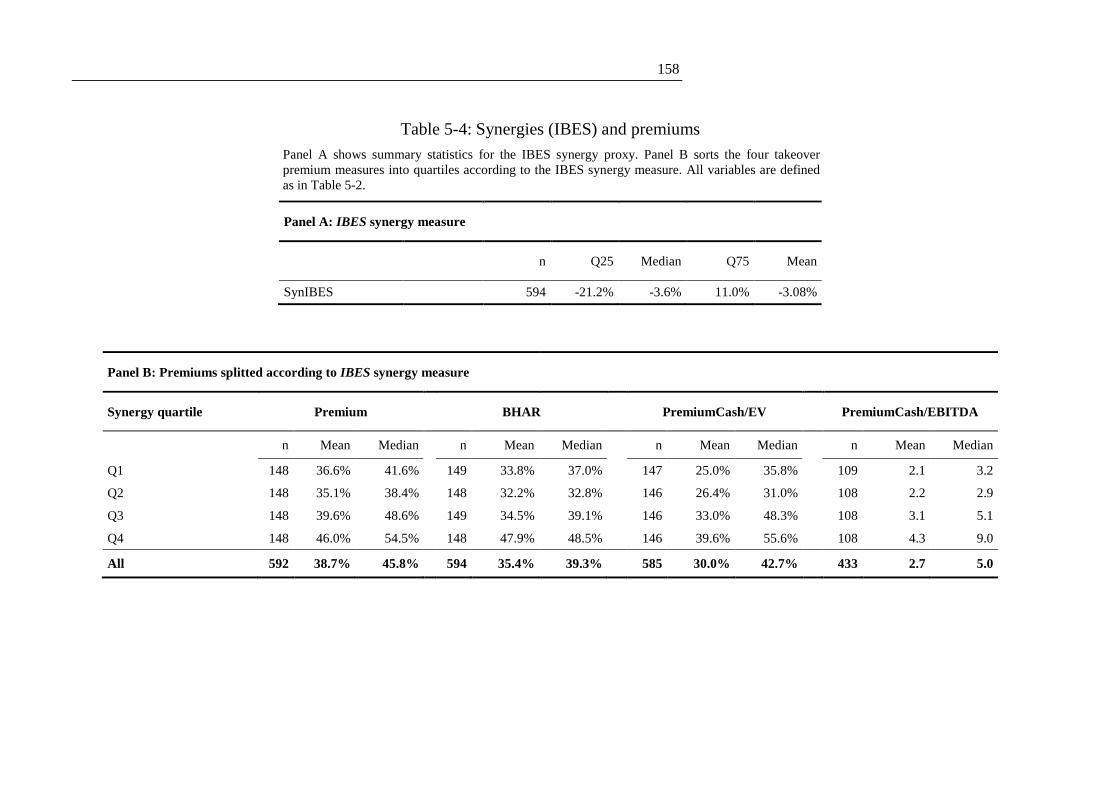
158
Table 5-4: Synergies (IBES) and premiums
Panel A shows summary statistics for the IBES synergy proxy. Panel B sorts the four takeover premium measures into quartiles according to the IBES synergy measure. All variables are defined as in Table 5-2.
Panel A: IBES synergy measure
n Q25 Median Q75 Mean
SynIBES 594 -21.2% -3.6% 11.0% -3.08%
Panel B: Premiums splitted according to IBES synergy measure
Synergy quartile Premium BHAR PremiumCash/EV PremiumCash/EBITDA
n Mean Median n Mean Median n Mean Median n Mean Median
Q1 148 36.6% 41.6% 149 33.8% 37.0% 147 25.0% 35.8% 109 2.1 3.2
Q2 148 35.1% 38.4% 148 32.2% 32.8% 146 26.4% 31.0% 108 2.2 2.9
Q3 148 39.6% 48.6% 149 34.5% 39.1% 146 33.0% 48.3% 108 3.1 5.1
Q4 148 46.0% 54.5% 148 47.9% 48.5% 146 39.6% 55.6% 108 4.3 9.0
All 592 38.7% 45.8% 594 35.4% 39.3% 585 30.0% 42.7% 433 2.7 5.0
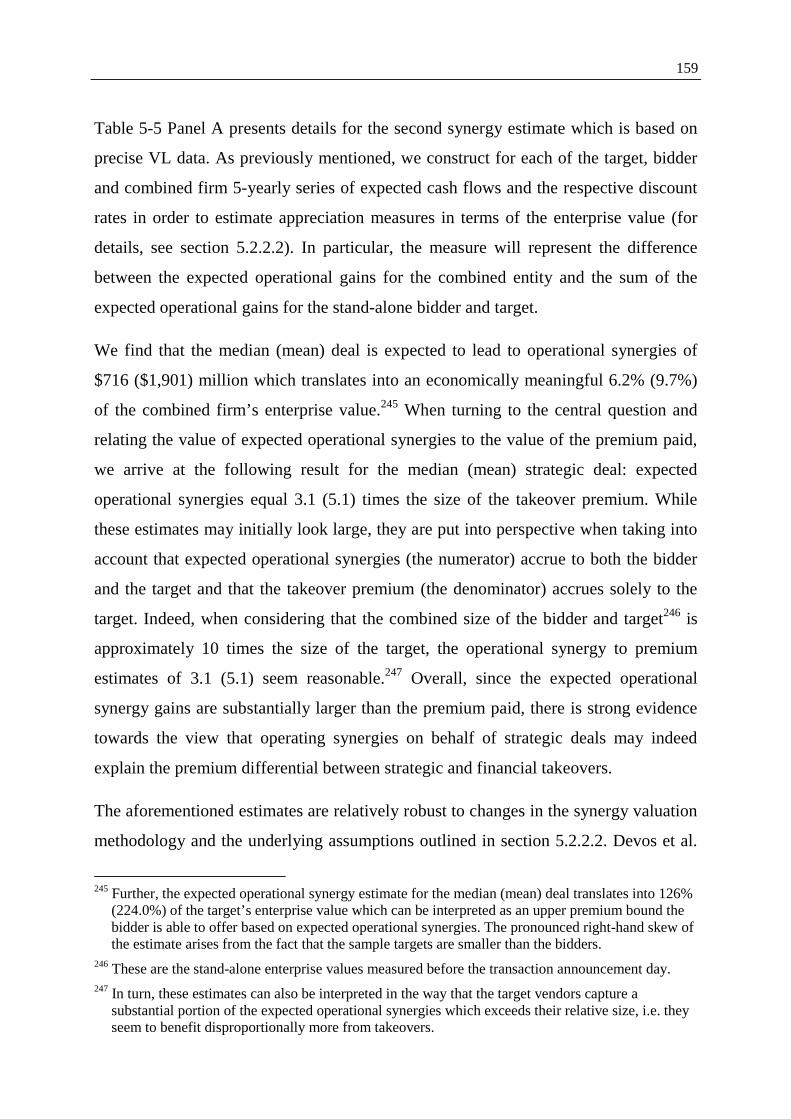
159
Table 5-5 Panel A presents details for the second synergy estimate which is based on
precise VL data. As previously mentioned, we construct for each of the target, bidder
and combined firm 5-yearly series of expected cash flows and the respective discount
rates in order to estimate appreciation measures in terms of the enterprise value (for
details, see section 5.2.2.2). In particular, the measure will represent the difference
between the expected operational gains for the combined entity and the sum of the
expected operational gains for the stand-alone bidder and target.
We find that the median (mean) deal is expected to lead to operational synergies of
$716 ($1,901) million which translates into an economically meaningful 6.2% (9.7%)
of the combined firm’s enterprise value.245 When turning to the central question and
relating the value of expected operational synergies to the value of the premium paid,
we arrive at the following result for the median (mean) strategic deal: expected
operational synergies equal 3.1 (5.1) times the size of the takeover premium. While
these estimates may initially look large, they are put into perspective when taking into
account that expected operational synergies (the numerator) accrue to both the bidder
and the target and that the takeover premium (the denominator) accrues solely to the
target. Indeed, when considering that the combined size of the bidder and target246 is
approximately 10 times the size of the target, the operational synergy to premium
estimates of 3.1 (5.1) seem reasonable.247 Overall, since the expected operational
synergy gains are substantially larger than the premium paid, there is strong evidence
towards the view that operating synergies on behalf of strategic deals may indeed
explain the premium differential between strategic and financial takeovers.
The aforementioned estimates are relatively robust to changes in the synergy valuation
methodology and the underlying assumptions outlined in section 5.2.2.2. Devos et al.
245 Further, the expected operational synergy estimate for the median (mean) deal translates into 126%
(224.0%) of the target’s enterprise value which can be interpreted as an upper premium bound the bidder is able to offer based on expected operational synergies. The pronounced right-hand skew of the estimate arises from the fact that the sample targets are smaller than the bidders.
246 These are the stand-alone enterprise values measured before the transaction announcement day. 247 In turn, these estimates can also be interpreted in the way that the target vendors capture a
substantial portion of the expected operational synergies which exceeds their relative size, i.e. they seem to benefit disproportionally more from takeovers.

160
(2009) show that (i) working capital adjustments in terms of excluding cash and debt
in current liabilities, (ii) alterations to the discount rate such as increasing the debt beta
from 0 to 0.25 or (iii) increasing the real growth rate of cash flows after year 5 from
0% to 2% changes the synergy estimates only marginally.
Panel B, which sorts the takeover premium according to the operational synergy
measure in quartiles, shows that there is a strong correlation between these two
variables. For all four pricing measures, the average premium increases across all four
synergy quartiles. The results for the median premium are highly similar, only for the
enterprise value pricing measures (CashPremium/EV and CashPremium/EBITDA) the
premium does not increase from the third to the fourth quartile. Again, considering
that there is great heterogeneity in the cross-section of takeovers which is not
controlled for in this univariate exercise, the results imply that operational synergies
indeed play a, if not the, central role in explaining takeover pricing.
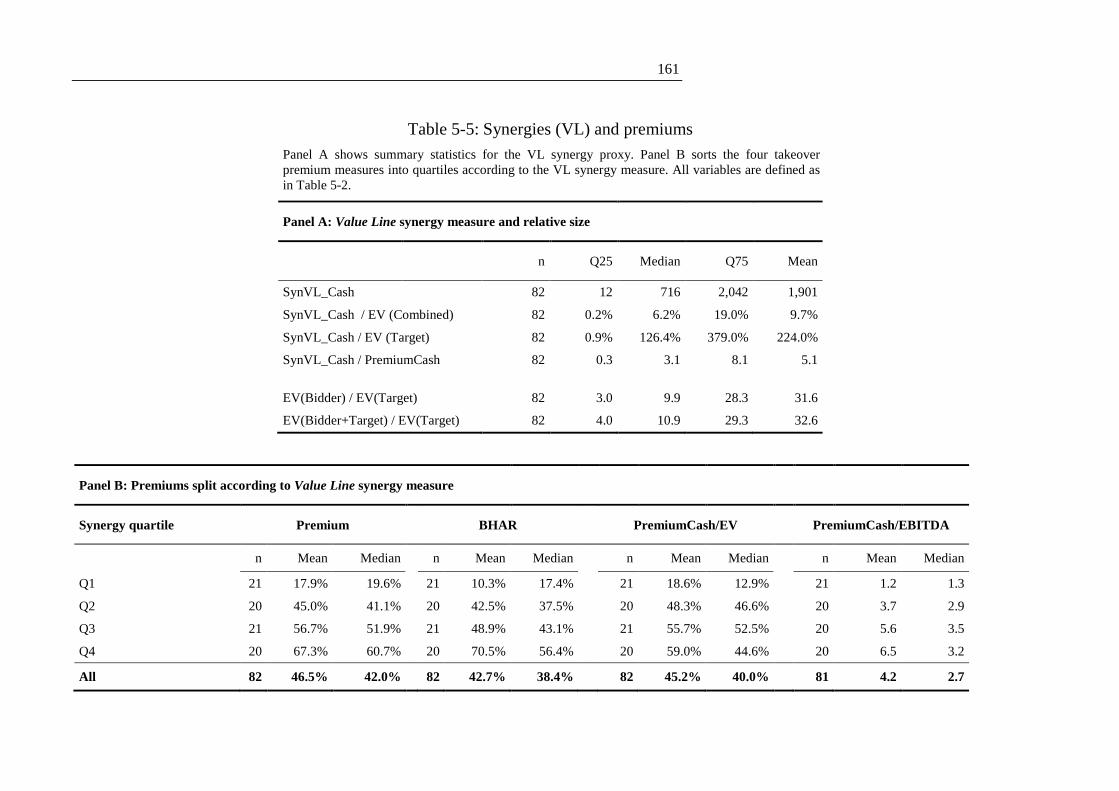
161
Table 5-5: Synergies (VL) and premiums
Panel A shows summary statistics for the VL synergy proxy. Panel B sorts the four takeover premium measures into quartiles according to the VL synergy measure. All variables are defined as in Table 5-2.
Panel A: Value Line synergy measure and relative size
n Q25 Median Q75 Mean
SynVL_Cash 82 12 716 2,042 1,901
SynVL_Cash / EV (Combined) 82 0.2% 6.2% 19.0% 9.7%
SynVL_Cash / EV (Target) 82 0.9% 126.4% 379.0% 224.0%
SynVL_Cash / PremiumCash 82 0.3 3.1 8.1 5.1
EV(Bidder) / EV(Target) 82 3.0 9.9 28.3 31.6
EV(Bidder+Target) / EV(Target) 82 4.0 10.9 29.3 32.6
Panel B: Premiums split according to Value Line synergy measure
Synergy quartile Premium BHAR PremiumCash/EV PremiumCash/EBITDA
n Mean Median n Mean Median n Mean Median n Mean Median
Q1 21 17.9% 19.6% 21 10.3% 17.4% 21 18.6% 12.9% 21 1.2 1.3
Q2 20 45.0% 41.1% 20 42.5% 37.5% 20 48.3% 46.6% 20 3.7 2.9
Q3 21 56.7% 51.9% 21 48.9% 43.1% 21 55.7% 52.5% 20 5.6 3.5
Q4 20 67.3% 60.7% 20 70.5% 56.4% 20 59.0% 44.6% 20 6.5 3.2
All 82 46.5% 42.0% 82 42.7% 38.4% 82 45.2% 40.0% 81 4.2 2.7
162
5.3.3 Regression analysis of takeover premium
So far we have shown that the expected operational synergy gains associated with
strategic takeovers are substantially larger than the estimated takeover premium. The
median (mean) strategic deal is expected to result in operational synergies 3.1 (5.1)
times the size of the takeover premium. Whilst the size of the operational synergy
gains relative to the takeover premium is interesting in its own right, simple premium
rankings by the synergy measures suggests that there may be a cross-sectional
relationship between the two variables which may help in explaining the premium
differential between strategic and financial takeovers.
We deepen the analysis by estimating cross-sectional regressions in which the
dependent variable is the takeover premium and the independent variables include
information about (i) the identity of the bidder, i.e. if the bidder is a financial or
strategic investor, (ii) the value of expected operational synergies for the strategic
subsample and (iii) multiple deal and target characteristics. For each of the four
premium measures, we present three regressions. The first regression serves as a base
case and includes a simple dummy variable which takes on the value of unity for
strategic bidders and is zero otherwise. Its estimated coefficient will indicate how large
the premium differential is between financial and strategic takeovers for the respective
premium measure (controlling for all sorts of variation at the deal and target level).
The second regression will split the strategic dummy variable into takeovers with low
and high operational synergy potential according to whether the calculated IBES (VL)
measure is above or below zero (its median value). Similarly, the third regression will
split the strategic dummy variable into quartiles for the IBES and VL measures.
Table 5-6 presents results of the regression analysis using the indicative IBES synergy
measure.
163
Table 5-6: Regression analysis of premiums with IBES synergy measure
This table presents ordinary least squares regressions of the takeover premium on explanatory variables including IBES synergy measures. All consummated deals by private equity (financial) and public operating (strategic) bidders are included in the regressions. All variables including the four takeover premium measures (Premium, BHAR, PremiumCash/EV and PremiumCash/EBITDA) are defined as in Table 5-2. The numbers in the upper rows represent the regression coefficients. The numbers in the lower rows are t-statistics based on robust White (1980) standard errors. *, ** and *** denote statistical significance at the 10%, 5% and 1% level, respectively.
IBES-1 IBES-2 IBES-3 IBES-4 IBES-5 IBES-6 IBES-7 IBES-8 IBES -9 IBES-10 IBES-11 IBES-12
Premium BHAR Premium-Cash/ EV
Premium-Cash/
EBITDA
Premium BHAR Premium-Cash/ EV
Premium-Cash/
EBITDA
Premium BHAR Premium-Cash/ EV
Premium-Cash/
EBITDA
Strategic bidder 0.165 0.207 0.177 2.582
(5.48)*** (5.81)*** (4.74)*** (4.27)***
SynIBES_negative 0.117 0.164 0.121 1.346
(3.79)*** (4.45)*** (3.25)*** (2.27)**
SynIBES_positive 0.232 0.267 0.255 4.783
(6.34)*** (6.27)*** (5.38)*** (5.86)***
SynIBES_1Q(lowest) 0.076 0.113 0.097 1.384
(2.12)** (2.62)*** (2.14)** (1.90)*
SynIBES_2Q 0.119 0.172 0.099 0.992
(3.28)*** (4.07)*** (2.39)** 1.55
SynIBES_3Q 0.195 0.237 0.209 1.368
(4.76)*** (4.95)*** (4.11)*** (1.84)*
SynIBES_4Q(highest) 0.259 0.294 0.284 6.241
(6.44)*** (6.35)*** (5.45)*** (6.64)***
MCap -0.008 0.007 -0.009 0.034 -0.007 0.007 -0.008 0.018 -0.008 0.006 -0.008 0.096
0.83 0.53 0.75 0.18 0.75 0.60 0.68 0.10 0.82 0.50 0.66 0.53
Debt/Assets 0.008 -0.040 -0.443 -0.849 0.004 -0.043 -0.446 -0.884 -0.011 -0.059 -0.458 -1.099
0.13 0.55 (5.48)*** 0.57 0.07 0.60 (5.54)*** 0.61 0.18 0.82 (5.67)*** 0.79
164
Table 5-6: Regression analysis of premiums with IBES synergy measure (continued)
IBES-1 IBES-2 IBES-3 IBES-4 IBES-5 IBES-6 IBES-7 IBES-8 IBES -9 IBES-10 IBES-11 IBES-12
Premium BHAR Premium-Cash/ EV
Premium-Cash/
EBITDA
Premium BHAR Premium-Cash/ EV
Premium-Cash/
EBITDA
Premium BHAR Premium-Cash/ EV
Premium-Cash/
EBITDA
TobinsQ 0.000 0.000 0.000 0.002 0.000 0.000 0.000 0.001 0.000 0.000 0.000 0.001
(2.18)** (3.55)*** 1.43 (3.30)*** (2.77)*** (3.98)*** (1.98)** (2.80)*** (3.01)*** (4.16)*** (2.14)** (3.04)***
Aret12 -0.108 -0.391 -0.094 -1.624 -0.098 -0.383 -0.083 -1.433 -0.094 -0.380 -0.078 -1.344
(3.36)*** (10.42)*** (2.40)** (2.11)** (3.03)*** (10.16)*** (2.10)** (1.91)* (2.93)*** (10.10)*** (2.00)** (1.86)*
Challenged 0.111 0.126 0.074 1.040 0.108 0.124 0.070 0.953 0.107 0.122 0.067 1.111
(2.53)** (2.76)*** 1.40 1.31 (2.52)** (2.74)*** 1.34 1.21 (2.50)** (2.73)*** 1.30 1.37
Hostile 0.086 0.146 0.130 -0.569 0.090 0.151 0.135 -0.486 0.102 0.165 0.143 0.070
0.89 1.48 1.07 0.49 0.94 1.54 1.10 0.39 1.04 1.64 1.15 0.06
Tender 0.030 0.054 0.045 0.135 0.036 0.060 0.052 0.084 0.035 0.060 0.052 0.154
1.08 (1.66)* 1.34 0.21 1.33 (1.85)* 1.57 0.13 1.30 (1.84)* 1.55 0.26
MBO 0.028 0.054 0.003 0.242 0.023 0.051 -0.002 0.088 0.021 0.048 -0.005 0.084
0.70 1.10 0.08 0.43 0.59 1.03 0.05 0.16 0.52 0.97 0.13 0.15
Bankrupt -0.965 -0.796 -0.572 0.000 -0.899 -0.773 -0.497 0.000 -0.894 -0.773 -0.464 0.000
(10.83)*** (7.82)*** (3.95)*** (.) (9.77)*** (8.93)*** (3.38)*** (.) (9.35)*** (8.77)*** (3.05)*** (.)
Defense 0.052 -0.059 0.003 0.889 0.037 -0.073 -0.016 0.438 0.039 -0.071 -0.016 -0.059
0.44 0.55 0.02 0.54 0.32 0.69 0.11 0.27 0.33 0.66 0.11 0.04
Toehold -0.064 -0.086 -0.052 -0.681 -0.065 -0.086 -0.052 -0.452 -0.054 -0.075 -0.042 -0.495
1.57 (1.73)* 1.11 1.24 1.59 (1.74)* 1.11 0.79 1.34 1.53 0.90 0.86
B_Lock 0.004 0.063 0.117 -1.012 0.026 0.081 0.143 -0.333 0.028 0.084 0.148 0.085
0.04 0.52 0.75 0.56 0.21 0.69 0.93 0.19 0.23 0.70 0.94 0.05
165
Table 5-6: Regression analysis of premiums with IBES synergy measure (continued)
IBES-1 IBES-2 IBES-3 IBES-4 IBES-5 IBES-6 IBES-7 IBES-8 IBES -9 IBES-10 IBES-11 IBES-12
Premium BHAR Premium-Cash/ EV
Premium-Cash/
EBITDA
Premium BHAR Premium-Cash/ EV
Premium-Cash/
EBITDA
Premium BHAR Premium-Cash/ EV
Premium-Cash/
EBITDA
T_Lock 0.117 0.287 -0.060 3.096 0.082 0.256 -0.101 1.963 0.022 0.198 -0.169 1.572
(2.07)** (4.35)*** 0.80 (2.43)** 1.07 (3.11)*** 0.96 0.86 0.32 (2.57)** (1.78)* 0.56
T_TermFee 0.048 0.037 0.032 0.279 0.049 0.038 0.032 0.287 0.047 0.036 0.029 0.213
(1.75)* 1.14 0.89 0.58 (1.82)* 1.18 0.91 0.63 (1.73)* 1.13 0.81 0.48
B_TermFee 0.020 0.060 -0.015 -0.822 0.015 0.055 -0.020 -0.913 0.020 0.061 -0.016 -0.881
0.51 1.37 0.31 1.11 0.39 1.3 0.43 1.22 0.54 1.44 0.35 1.22
Constant 0.533 0.022 0.564 -1.830 0.587 0.032 0.635 -0.313 0.628 0.053 0.658 -0.772
(2.84)*** 0.09 (2.63)*** 0.81 (3.22)*** 0.13 (2.96)*** 0.14 (3.36)*** 0.21 (2.94)*** 0.32
Time dummies yes yes yes yes yes yes yes yes yes yes yes yes
Industry dummies yes yes yes yes yes yes yes yes yes yes yes yes
Observations 788 793 780 617 788 793 780 617 788 793 780 617
Adjusted R-squared 0.222 0.305 0.210 0.160 0.239 0.314 0.225 0.208 0.246 0.319 0.229 0.247

166
For all four premium measures the strategic bidder dummy is consistently large and
significant (at the 1% level, see regression specifications IBES-1 to IBES-4). In terms of the
traditional equity measures, strategic investors pay on average 16.5% (Premium) to 20.7%
(BHAR) higher premiums than financial investors. In terms of the enterprise value measures,
the former pay higher premiums of 17.7% (PremiumCash/EV) and 2.6
(PremiumCash/EBITDA)248 than the latter. These sizeable effects are in line with the results
reported by Bargeron et al. (2008).
Next, we test whether expected operating synergies on behalf of the strategic takeovers may
help in explaining the premium differential, and if yes, to what extent. As previously
outlined, we therefore employ conservative synergy estimates which shall predominantly
capture gains from the specific fit between the target and acquirer but not stand-alone
restructuring potential (for details, see section 5.2). Regressions IBES-5 to IBES-8 present
results for including two synergy indicators which are set to one if a strategic deal is
expected to lead to an earnings gain or loss, respectively. Similarly, regressions IBES-9 to
IBES-12 report results if we extend the aforementioned analyses and build synergy quartile
indicator variables which are set to one if the strategic deals rank in the respective quartiles
(of the IBES consensus estimates). For economy of presentation, the discussion will be
limited to the latter set of regressions (IBES-9 to IBES-12).
We find that synergies play a role in explaining the premium difference. In specifications
IBES-9 and IBES-10, the equity premium measures increase almost monotonically across
the synergy quartiles, both in terms of economic and statistical significance. For instance,
regression IBES-10 shows that the quartile of strategic investors with the highest expected
synergies (Syn_Q4) pay on average 29.4% higher premiums than financial investors (t-stat
of 6.35). This difference continuously becomes smaller across the remaining quartiles of
strategic investors. For the quartile of strategic investors with the lowest expected synergies
(Syn_Q1), the difference shrinks to 11.3% (t-stat of 2.62%). The results for the enterprise
premium measures in specifications A-11 and A-12 are less distinct. In particular, strategic
248 As noted in section 5.2.3, we use realized EBITDA from the last fiscal year before the transaction
announcement as a proxy for unobservable future EBITDA. Since this proxy is likely to be systematically lower than future EBITDA, our PremiumCash/EBITDA estimates will be biased upwards.
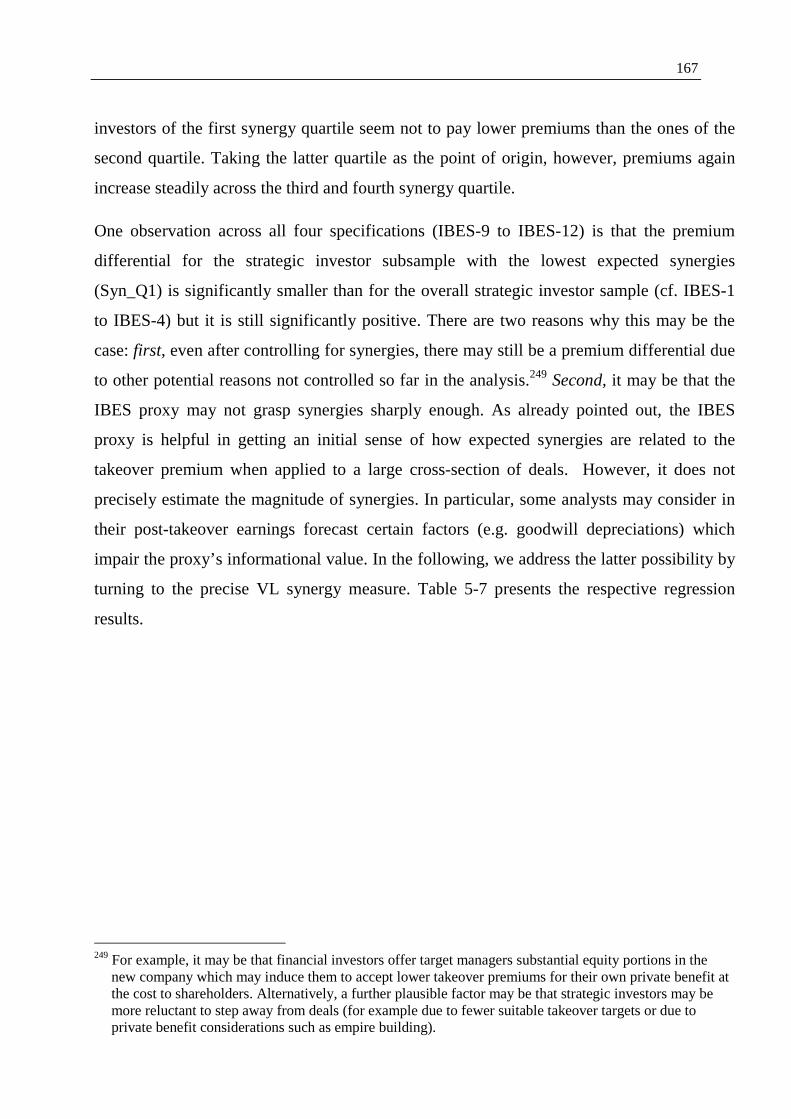
167
investors of the first synergy quartile seem not to pay lower premiums than the ones of the
second quartile. Taking the latter quartile as the point of origin, however, premiums again
increase steadily across the third and fourth synergy quartile.
One observation across all four specifications (IBES-9 to IBES-12) is that the premium
differential for the strategic investor subsample with the lowest expected synergies
(Syn_Q1) is significantly smaller than for the overall strategic investor sample (cf. IBES-1
to IBES-4) but it is still significantly positive. There are two reasons why this may be the
case: first, even after controlling for synergies, there may still be a premium differential due
to other potential reasons not controlled so far in the analysis.249 Second, it may be that the
IBES proxy may not grasp synergies sharply enough. As already pointed out, the IBES
proxy is helpful in getting an initial sense of how expected synergies are related to the
takeover premium when applied to a large cross-section of deals. However, it does not
precisely estimate the magnitude of synergies. In particular, some analysts may consider in
their post-takeover earnings forecast certain factors (e.g. goodwill depreciations) which
impair the proxy’s informational value. In the following, we address the latter possibility by
turning to the precise VL synergy measure. Table 5-7 presents the respective regression
results.
249 For example, it may be that financial investors offer target managers substantial equity portions in the
new company which may induce them to accept lower takeover premiums for their own private benefit at the cost to shareholders. Alternatively, a further plausible factor may be that strategic investors may be more reluctant to step away from deals (for example due to fewer suitable takeover targets or due to private benefit considerations such as empire building).
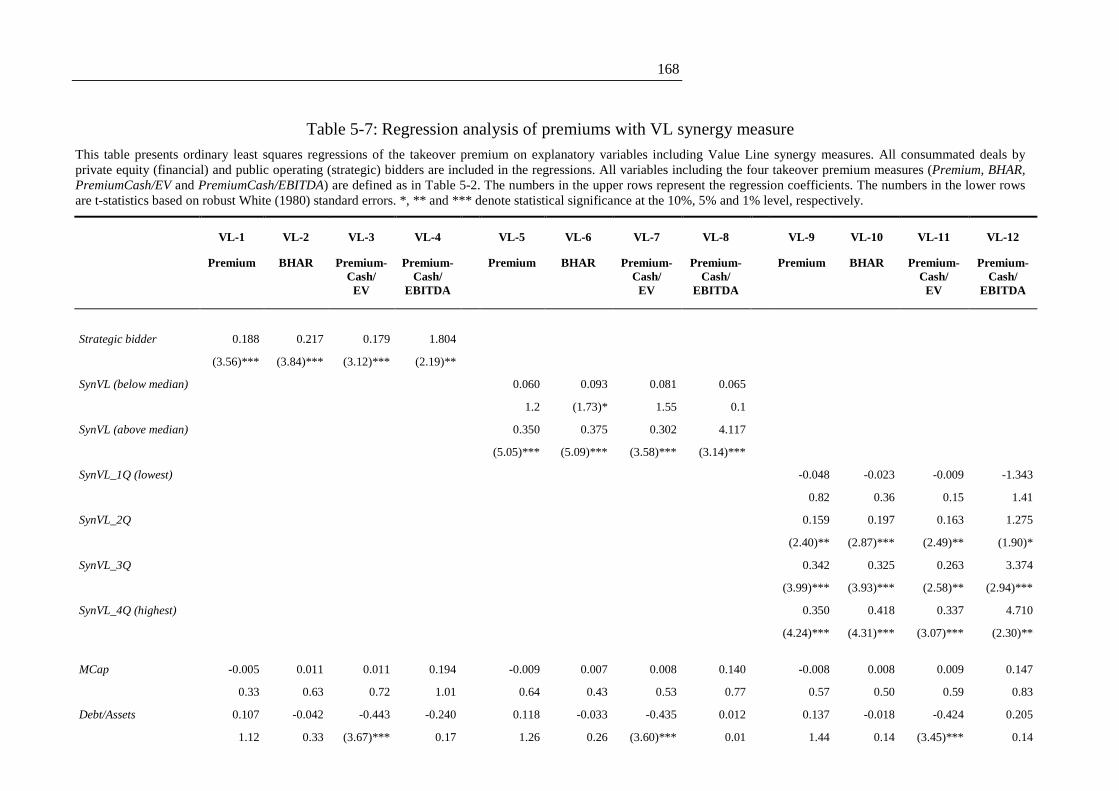
168
Table 5-7: Regression analysis of premiums with VL synergy measure
This table presents ordinary least squares regressions of the takeover premium on explanatory variables including Value Line synergy measures. All consummated deals by private equity (financial) and public operating (strategic) bidders are included in the regressions. All variables including the four takeover premium measures (Premium, BHAR, PremiumCash/EV and PremiumCash/EBITDA) are defined as in Table 5-2. The numbers in the upper rows represent the regression coefficients. The numbers in the lower rows are t-statistics based on robust White (1980) standard errors. *, ** and *** denote statistical significance at the 10%, 5% and 1% level, respectively.
VL-1 VL-2 VL-3 VL-4 VL-5 VL-6 VL-7 VL-8 VL-9 VL-10 VL-11 VL-12
Premium BHAR Premium-Cash/ EV
Premium-Cash/
EBITDA
Premium BHAR Premium-Cash/ EV
Premium-Cash/
EBITDA
Premium BHAR Premium-Cash/ EV
Premium-Cash/
EBITDA
Strategic bidder 0.188 0.217 0.179 1.804
(3.56)*** (3.84)*** (3.12)*** (2.19)**
SynVL (below median) 0.060 0.093 0.081 0.065
1.2 (1.73)* 1.55 0.1
SynVL (above median) 0.350 0.375 0.302 4.117
(5.05)*** (5.09)*** (3.58)*** (3.14)***
SynVL_1Q (lowest) -0.048 -0.023 -0.009 -1.343
0.82 0.36 0.15 1.41
SynVL_2Q 0.159 0.197 0.163 1.275
(2.40)** (2.87)*** (2.49)** (1.90)*
SynVL_3Q 0.342 0.325 0.263 3.374
(3.99)*** (3.93)*** (2.58)** (2.94)***
SynVL_4Q (highest) 0.350 0.418 0.337 4.710
(4.24)*** (4.31)*** (3.07)*** (2.30)**
MCap -0.005 0.011 0.011 0.194 -0.009 0.007 0.008 0.140 -0.008 0.008 0.009 0.147
0.33 0.63 0.72 1.01 0.64 0.43 0.53 0.77 0.57 0.50 0.59 0.83
Debt/Assets 0.107 -0.042 -0.443 -0.240 0.118 -0.033 -0.435 0.012 0.137 -0.018 -0.424 0.205
1.12 0.33 (3.67)*** 0.17 1.26 0.26 (3.60)*** 0.01 1.44 0.14 (3.45)*** 0.14
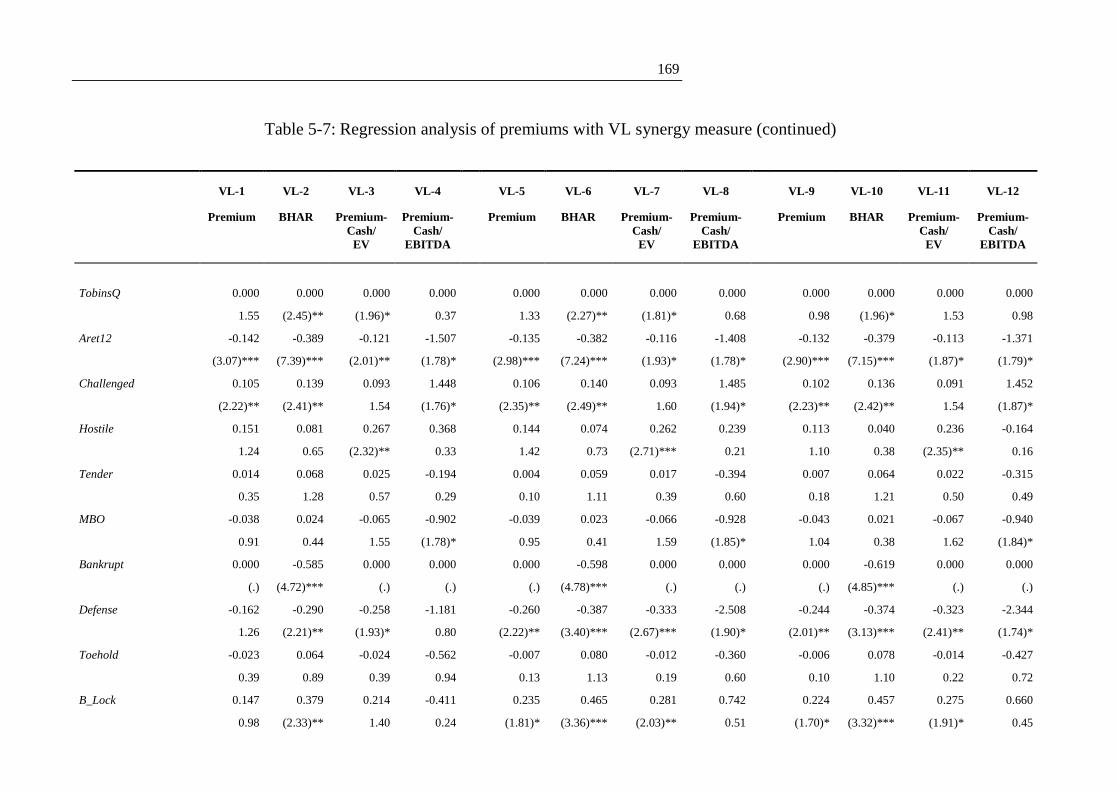
169
Table 5-7: Regression analysis of premiums with VL synergy measure (continued)
VL-1 VL-2 VL-3 VL-4 VL-5 VL-6 VL-7 VL-8 VL-9 VL-10 VL-11 VL-12
Premium BHAR Premium-Cash/ EV
Premium-Cash/
EBITDA
Premium BHAR Premium-Cash/ EV
Premium-Cash/
EBITDA
Premium BHAR Premium-Cash/ EV
Premium-Cash/
EBITDA
TobinsQ 0.000 0.000 0.000 0.000 0.000 0.000 0.000 0.000 0.000 0.000 0.000 0.000
1.55 (2.45)** (1.96)* 0.37 1.33 (2.27)** (1.81)* 0.68 0.98 (1.96)* 1.53 0.98
Aret12 -0.142 -0.389 -0.121 -1.507 -0.135 -0.382 -0.116 -1.408 -0.132 -0.379 -0.113 -1.371
(3.07)*** (7.39)*** (2.01)** (1.78)* (2.98)*** (7.24)*** (1.93)* (1.78)* (2.90)*** (7.15)*** (1.87)* (1.79)*
Challenged 0.105 0.139 0.093 1.448 0.106 0.140 0.093 1.485 0.102 0.136 0.091 1.452
(2.22)** (2.41)** 1.54 (1.76)* (2.35)** (2.49)** 1.60 (1.94)* (2.23)** (2.42)** 1.54 (1.87)*
Hostile 0.151 0.081 0.267 0.368 0.144 0.074 0.262 0.239 0.113 0.040 0.236 -0.164
1.24 0.65 (2.32)** 0.33 1.42 0.73 (2.71)*** 0.21 1.10 0.38 (2.35)** 0.16
Tender 0.014 0.068 0.025 -0.194 0.004 0.059 0.017 -0.394 0.007 0.064 0.022 -0.315
0.35 1.28 0.57 0.29 0.10 1.11 0.39 0.60 0.18 1.21 0.50 0.49
MBO -0.038 0.024 -0.065 -0.902 -0.039 0.023 -0.066 -0.928 -0.043 0.021 -0.067 -0.940
0.91 0.44 1.55 (1.78)* 0.95 0.41 1.59 (1.85)* 1.04 0.38 1.62 (1.84)*
Bankrupt 0.000 -0.585 0.000 0.000 0.000 -0.598 0.000 0.000 0.000 -0.619 0.000 0.000
(.) (4.72)*** (.) (.) (.) (4.78)*** (.) (.) (.) (4.85)*** (.) (.)
Defense -0.162 -0.290 -0.258 -1.181 -0.260 -0.387 -0.333 -2.508 -0.244 -0.374 -0.323 -2.344
1.26 (2.21)** (1.93)* 0.80 (2.22)** (3.40)*** (2.67)*** (1.90)* (2.01)** (3.13)*** (2.41)** (1.74)*
Toehold -0.023 0.064 -0.024 -0.562 -0.007 0.080 -0.012 -0.360 -0.006 0.078 -0.014 -0.427
0.39 0.89 0.39 0.94 0.13 1.13 0.19 0.60 0.10 1.10 0.22 0.72
B_Lock 0.147 0.379 0.214 -0.411 0.235 0.465 0.281 0.742 0.224 0.457 0.275 0.660
0.98 (2.33)** 1.40 0.24 (1.81)* (3.36)*** (2.03)** 0.51 (1.70)* (3.32)*** (1.91)* 0.45
170
Table 5-7: Regression analysis of premiums with VL synergy measure (continued)
VL-1 VL-2 VL-3 VL-4 VL-5 VL-6 VL-7 VL-8 VL-9 VL-10 VL-11 VL-12
Premium BHAR Premium-Cash/ EV
Premium-Cash/
EBITDA
Premium BHAR Premium-Cash/ EV
Premium-Cash/
EBITDA
Premium BHAR Premium-Cash/ EV
Premium-Cash/
EBITDA
T_Lock 0.000 0.000 0.000 0.000 0.000 0.000 0.000 0.000 0.000 0.000 0.000 0.000
(.) (.) (.) (.) (.) (.) (.) (.) (.) (.) (.) (.)
T_TermFee 0.003 0.004 -0.019 0.298 0.000 0.001 -0.021 0.246 -0.008 -0.011 -0.030 0.080
0.08 0.08 0.32 0.74 0.01 0.02 0.35 0.63 0.19 0.22 0.50 0.19
B_TermFee 0.085 0.102 0.043 0.322 0.100 0.117 0.055 0.570 0.116 0.130 0.066 0.726
(1.70)* (1.78)* 0.78 0.38 (2.19)** (2.08)** 1.02 0.73 (2.57)** (2.31)** 1.28 1.01
Constant 0.090 0.237 -0.030 -1.691 0.112 0.230 -0.032 -1.774 0.137 0.194 -0.062 -2.255
0.19 0.9 0.12 0.72 0.25 0.87 0.12 0.76 0.3 0.71 0.23 0.8
Time dummies yes yes yes yes yes yes yes yes yes yes yes yes
Industry dummies yes yes yes yes yes yes yes yes yes yes yes yes
Observations 322 326 319 289 322 326 319 289 322 326 319 289
Adjusted R-squared 0.244 0.319 0.158 0.208 0.296 0.348 0.180 0.267 0.305 0.355 0.183 0.279

171
The results for the base regression models VL-1 to VL-4 remain largely unchanged:
the estimated magnitude of the premium differential is highly similar to the
aforementioned IBES results for three out of four premium measures; solely in the
case of the Premium/EBITDA measure is the differential lower but still significantly
different from zero. Hence, although the requirement for precise VL data has
decreased the sample size, the aforementioned results imply that the regressions with
the VL proxy still take place across a very representative setting.250
Similar to the regression set with the IBES measure, specifications VL-5 to VL-8
present results for two indicator variables which are set to unity if expected operational
synergies are below or above its median value, respectively. Likewise, regressions VL-
9 to VL-12 extend this analysis to quartile indicator variables which are set to unity if
expected operational synergies rank in the respective quartiles. Again, for economy of
presentation, the discussion will be limited to the latter set of regressions. Similar to
the IBES results, we find that operational synergies play a central role in explaining
the premium differential.
For all four pricing measures, the premium differential steadily decreases from the
highest to the lowest synergy quartile. For example, if we focus on regression VL-11
which details results for the enterprise premium measure PremiumCash/EV, we can
see the following pattern: the quartile of strategic deals with the highest expected
synergies (Syn_Q4) pay on average 33.7% higher premiums than financial investors
(t-stat of 3.07). This differential steadily gets smaller across the remaining quartiles of
strategic deals. Indeed, the quartile of strategic deals with the lowest expected
synergies pay on average similar premiums to financial investors as recommended by
the statistically insignificant coefficient Syn_Q1 of -1.0% (t-stat of 0.15). We know
from Table 5-5 that on average the deals of this quartile are expected to generate
operating synergies of less than 0.9% (0.2%) in terms of the target’s EV (combined
firm’s EV). Hence, the regression estimates also appear highly sensible from an
250 In fact, one may argue that the limited sample size leads to a very demanding test for the synergy
rationale: only if there is indeed a strong relationship between expected synergies and takeover premiums, the small sample shall pick it up.
172
economic point of view. This conclusion is not limited to the PremiumCash/EV
measure but is robust to all three alternative premium measures.
Consequently, there is strong evidence in favour of the synergy rationale being a, if not
the central factor in explaining the premium differential between strategic and
financial investors. There seems to be little left in favour of alternative explanations -
such as the collusion argument between financial investors and target managers to the
detriment of their shareholders - but clearly, this conjecture is subject to a rigorous
test.
The above discussion has focused on the test of the synergy rationale. In what follows,
we shall briefly discuss the results for the battery of control variables (for both Table
5-6 and Table 5-7) which have been included in the regressions in order to provide a
rigorous setting.
With respect to target characteristics, the following picture evolves: we do not find any
evidence, that the size of the target (MCap) is related to the premiums paid. There is
also only very limited support for the notion that higher leverage (Debt/Assets) leads to
lower premiums. In particular, leverage only seems to impact on the enterprise
premium measure PremiumCash/EV. This result may be rationalized in the sense that
the dollar premium paid (which is the basis for the enterprise premiums) will decrease
with higher leverage ratios although the percentage premium (on equity) may stay
unchanged. Further, we find some evidence that firms with a high growth potential
(Tobin’s Q) are associated with higher premiums. Finally, there is strong support that a
positive share price development in the year before the run-up period (Aret) limits the
premium upside potential.
With respect to deal characteristics, we find the following results: There is clear
evidence that a competitive bidding process (Challenged) leads to higher premiums.
Further, deals for bankrupt targets (Bankrupt) are priced significantly lower. We also
find evidence that defensive deals are associated with lower premiums. Finally, there
is also some evidence that termination fees and lockup provisions on behalf of both the

173
bidder and target lead to higher premiums. For all remaining deal characteristics, we
find no consistent evidence that they help to explain the premiums paid.
5.4 Summary
This chapter compares the pricing of financial and strategic investors. Consistent with
Bargeron et al. (2008), it is first shown that financial investors pay remarkably lower
takeover premiums than strategic investors. By examining both traditional equity
premium measures and novel enterprise premium measures as suggested by
Jenkinson/Stucke (2010), it is established that the differential is not grounded in the
premium calculation methodology.
Based on these results, we contribute to the literature by empirically evaluating how
much of the premium differential can be explained by expected operational synergies
on behalf of strategic takeovers. Grasping the value of this intuitive argument is
demanding but to central importance for the discussion: only by discounting for
operational synergies in strategic deals, can a well-founded economic comparison of
both bidder types and their takeover pricing take place.
Exploiting Value Line analyst revisions around the takeover consummation date, we
calculate conservative operational synergy estimates largely free of standalone
restructuring potential. When these expected dollar operational synergy gains are set in
relation to the dollar premium paid, the median transaction is expected to generate
operational synergies 3.1 times the size of the premium paid for the target.251
Consequently, since the expected incremental value gain stemming from operational
synergies is significantly higher than the value of the premium paid, there is strong
evidence towards the view that operating synergies can indeed explain the premium
differential between strategic and financial takeovers.
In order to draw more direct and robust inference about the impact of operational
synergies on the premium differential, we run cross-sectional regressions on the
takeover premium and include operating synergy quartile indicators for the strategic 251 While this ratio may initially look large, it is put into perspective when considering that the median
combined firm to target ratio equals 10.9.
174
investor subsample (i.e. the financial investor subsample represents the control group)
as well as a whole set of control variables in the form of deal-, target-, industry- and
year-fixed-effects. The results lend strong support towards the decisive role of
synergies. For both traditional equity and alternative enterprise pricing measures, the
premium differential is largest for the quartile of strategic deals with the highest
expected operational synergies, decreases steadily across the remaining quartiles and is
not statistically different from zero for the quartile of strategic deals with the lowest
expected operational synergies. Since the strategic deals of the first quartile are
expected to generate operating synergies of less than 0.9% (0.2%) in terms of the
target’s firm value (the combined firm’s firm value), the regression estimates appear
highly sensible from an economic point of view.
Consequently, we find very strong evidence in favour of the operational synergy
rationale being a, if not the central factor in explaining the premium differential
between strategic and financial investors. This result is of great relevance in light of
the increased criticism often directed towards financial investors: that collusion with
target managers might be a decisive driver of the premium differential. In almost all
financial sponsor backed deals, respective class action complaints are filed by
stockholders. However, hardly any succeed. In line with these lawsuit outcomes, the
strong empirical evidence for operational synergies indicates that collusion may indeed
play rather a minor role in the premium differential but clearly, a rigorous, direct
comparison of both rationales is required. Such an analysis represents an interesting
avenue for future research. From a more theoretical point of view, the strong
operational synergy result is consistent with the view of an efficient takeover market,
where target vendors appropriate substantial parts252 of expected future gains and
strategic bidders win auctions when expected operational synergies allow them to
outbid financial bidders.
252 Cf. footnote 247.

175
6 Conclusion
6.1 Summary of results and contributions
This thesis draws on transactions of publicly listed companies to address the following
three largely unanswered research questions at the intersection of the fields of
takeovers and private equity:
1. What are the investment motives of private equity investors in the distinctive
continental European context?
2. How much do private equity investors pay for continental European firms?
3. Why do strategic investors pay so much more compared to private equity
investors?
The insights gained throughout the empirical analyses of chapters 3 to 5 can be
summarized as follows:
What are the investment motives of private equity investors in the distinctive
continental European context? It is analysed whether and how the distinctive
corporate governance of continental European firms impacts upon the investment
decisions of private equity investors. In terms of governance, the focus lies thereby on
the ownership and control structure. Typically, firms in continental Europe are held by
large blockholders. It is proposed that their stake size and identity influences the
investment decision of private equity investors in two ways. First, a large stake
endows the largest blockholder with powerful incentives to monitor the management.
Such monitoring is likely to make the firm less attractive to private equity investors
since there is less remaining value creation potential stemming from agency cost
reductions. Conversely, a large blockholder who is not able to monitor the
management (perhaps because of a lack of specific skills) may be more intent on
selling her/his firm to a private equity investor. Second, the largest blockholder may
use her/his control rights also to her/his own benefit and extract private benefits from
the firm at the expense of remaining shareholders. Given such rent extraction, the
largest blockholder is only willing to sell her/his stake at a premium that is high
enough to compensate her/him for the foregone benefits. Consequently, private equity
176
investors may avoid companies whose largest shareholder appropriates private benefits
since their stakes may be particularly expensive.
To test these propositions, the author self-collects all private equity sponsored going
private transactions completed between 1997 and 2007 for which the required data
points are available and identifies control firms via a country/industry/size-matching
algorithm.
Based on logistic regressions, strong evidence in favour of both central governance
arguments is found. However, this pattern largely emerges only when differentiating
between the various types of large blockholders and it only applies to firms whose
ultimate controlling shareholder is a family. Further, the chapter aims to shed light on
the relative importance of the monitoring and private benefits argument by analysing
their marginal effects. It emerges that a one-percent increase in the measure of private
benefits of control has twice the negative effect on the takeover likelihood than a one-
percent increase in monitoring incentives. This result may explain why the previous
literature has found fairly strong evidence of the exploitation of private benefits of
control in family controlled firms, but less conclusive results on the monitoring
benefits of family shareholders.
In addition to these central governance results, the evidence also suggests that
potential tax and incentive benefits stemming from a high debt capacity as well as a
low trading volume increase the likelihood of a private equity acquisition.
This chapter contributes to the literature in four main ways. First, it is one of the first
studies to examine private equity acquisitions in continental Europe, a region where
private equity sponsors have been particularly active. Second, it focuses on the firm’s
governance structure and recommends that monitoring and rent extraction by the
largest blockholder are particularly important investment determinants for private
equity sponsors in continental Europe. Third, it also analyses both rationales across
different shareholder classes thereby contributing to the sparse literature on which
types are more or less prone to monitor and/or extract private benefits. Fourth, unlike
177
previous studies on going private transactions, this study clearly distinguishes between
the tax advantage and the disciplinary role of leverage.
How much do private equity investors pay for continental European firms? The
pricing of private equity acquisitions in the distinctive continental European corporate
governance context is examined. In line with the previous chapter, the author argues
that the concentrated ownership structure of continental European firms affects the
pricing of private equity acquisitions in two crucial ways. First, due to her/his sizeable
investment in the company, the largest blockholder is likely to have sharp incentives to
mitigate the classical manager-shareholder conflict. Given that he curtails managerial
malpractice, there is less remaining potential for the private equity investor to create
value from the reduction of this agency conflict in the post-buyout company, thereby
leading to lower premiums and, hence, lower announcement returns. Yet, not all types
of blockholders, such as the government for instance, may engage in monitoring.
Second, the largest blockholder may also be tempted to abuse her/his power and
appropriate private benefits from the firm at the cost of remaining shareholders. As a
result, s/he relinquishes control to a private equity investor only for a proportionally
higher premium to offset the surrendered private benefits. Rent extraction by the
largest blockholder can be curtailed by the presence of a second large shareholder.
Consequently, private equity acquisition premiums and the respective announcement
returns are likely to be lower if there is a second large blockholder in the pre-buyout
company who confines the discretion of the largest shareholder to consume private
benefits.
Based on the same transaction sample from chapter 3,253 the following results can be
deduced: private equity investors pay a final mean premium of 28.3% relative to the
market price two months before the announcement date. This value is 3.0 percentage
points lower than for comparable US transactions and, thus, is consistent with the
monitoring and restriction of private benefits rationales. Further, shareholders gain
around the announcement day abnormal returns of 13.0% in the [-1,1] event window.
253 The final sample size is smaller due to alternative data requirements.
178
This value is 7.7 percentage points lower relative to US transactions and, thus,
underlines the higher deal completion risk in continental Europe.
With respect to the underlying sources, the cross-sectional regressions lend strong
support towards the crucial role of both the monitoring and private benefits argument.
In terms of monitoring, the stake of the largest blockholder is negatively related to
premiums and abnormal returns. This result endorses the view that large blockholders
curb managerial malpractice thereby leaving less manager-financier agency cost
reduction potential for the private equity investor in the post-buyout company. When
distinguishing between various types of large shareholders, the evidence suggests that
corporations, banks and holdings are active monitors but not so the government and,
consequently, private equity acquisitions from the former are priced less than the ones
from the latter. Interestingly, outsider families also appear not to be active monitors
but this result has to be treated with care. As shown in the previous empirical chapter,
families appear to have stronger incentives to consume private benefits than to monitor
the management. Hence, even though effective monitoring may occur, it could be
overshadowed by the extraction of private benefits. The chapter sheds light on the
validity of the private benefits argument by exploiting the existence of a second large
blockholder in the target’s shareholder structure. The simple idea is that s/he can act as
a monitor of the dominant blockholder which, in turn, limits the latter’s ability to
extract private rents and to demand higher takeover prices. In line with this monitor-
of-the-monitor argument, the presence of a second large blockholder is found to be
negatively related to the premiums and abnormal returns.
Besides the central governance results, there is also strong support that targets with
low valuation levels confer higher premiums and abnormal returns. This supports the
notion that private equity investors are skilful in both identifying less visible and/or
underperforming firms as well as increasing their value under private ownership.
Finally, there is also evidence that a thin pre-buyout trading volume amplifies the
premiums.
Similarly to the third chapter, this study contributes to the literature in four main ways.
First, it is one of the first studies to examine the role of PE investors in continental
179
European markets. These markets have experienced significant growth and are marked
by distinctive characteristics in comparison to the Anglo-Saxon markets. Second, it
focuses on the blockholder structure as one distinctive continental European feature
and suggests that monitoring and private benefit consumption are crucial pricing
factors. Third, it analyses monitoring incentives not only in terms of stake size but also
in terms of blockholder identity. Thereby, it contributes to the sparse and inconclusive
literature about the types of shareholders that are active rather than passive monitors.
Fourth, an interesting feature of this research setting is the combination of the
blockholder structure and sharp pricing measures due to market prices. Thereby, the
chapter may not only help in understanding the pricing of public private equity targets
but also the pricing of private private equity targets who are characterised by
concentrated ownership but lack sharp pricing measures.
Why do strategic investors pay so much more compared to private equity investors?
The premium differential between strategic and private equity, i.e. financial
acquisitions is analysed. It is first demonstrated that the differential is not grounded in
the methodology of calculating the takeover premium: it holds for both traditional
equity premium measures and novel enterprise premium measures as suggested by
Jenkinson/Stucke (2010). For the former, the premium differential ranges from 44% to
58% while for the latter it varies from 41% to 125%.
The author argues that a crucial reason behind the premium differential is expected
operational synergies on behalf of strategic takeovers. While this is an intuitive
rationale, it is very hard to grasp empirically. To estimate it, analyst revisions around
the merger consummation date are exploited and, thereby, the majority of limitations
encountered by traditional approaches are circumvented. In particular, the measure is
calculated as the difference between the expected operational gains for the combined
entity and the sum of the expected operational gains for the stand-alone bidder and
target. In order to arrive at these expected operating gains, the author constructs 5-
yearly series of expected cash flows, discount rates and terminal values based on
precise Value Line forecast data and employs adjusted compressed present value
methodology. By focusing on the analyst revisions around the merger consummation
180
date, the resulting operational synergy proxy mainly picks up gains from the specific
target-bidder fit, i.e. it is largely free of standalone restructuring potential.
This approach yields an expected operational synergy estimate of $716 million which
equals approximately three times the size of the premium’s dollar value. This figure
lends strong support towards the notion that operational synergies play a, if not the
central role in explaining the substantially higher premiums paid by strategic than
financial investors.
To examine this proposition more directly and thoroughly, cross-sectional regressions
are run on the takeover premium with quartile synergy indicator variables and a
battery of controls on the right hand side. The results underline the decisive role of
operational synergies in explaining the premium differential. For both traditional
equity and novel enterprise pricing measures, the premium differential
• is largest for the quartile of strategic deals with the highest expected operational
synergies,
• decreases steadily across the remaining quartiles and
• is not statistically different from zero for the quartile of strategic deals with the
lowest expected operational synergies.
Since the strategic deals of the latter, i.e. the lowest quartile, are expected to confer
marginal operating synergies of less than 0.9% (0.2%) in terms of the target firm’s
(combined firm’s) value, the regression estimates appear highly sensible from an
economic point of view. Consequently, there is very strong evidence that operational
synergies explain the premium differential between strategic and financial
acquisitions. This is consistent with the view of an efficient takeover market, where
target vendors appropriate substantial parts of expected future gains and strategic
bidders win auctions when expected operational synergies allow them to outbid
financial bidders.
This study contributes to the literature in four main ways: First, it examines the
unresolved issue why financial investors pay substantially lower takeover premiums
than strategic investors, a question which has drawn much interest by academics,
181
practitioners and regulators alike. Second, it tests the robustness of the premium
differential against the novel enterprise measure of Jenkinson/Stucke (2010): the result
stays intact. Third, this study argues that operational synergies on behalf of strategic
acquisitions are a crucial determinant of the differential and tests this proposition
rigorously. In particular, analyst revisions around the merger consummation date are
exploited. This methodology circumvents the majority of limitations encountered by
traditional approaches and results in a sharp operational synergy estimate largely free
of standalone restructuring potential. Fourth, the strong results in favour of the
operational synergy argument suggest that alternative explanations, such as the often
cited collusion conjecture between financial investors and target managers, may play a
rather minor role in explaining the sizeable premium differential, but clearly, more
research is required with respect to this question.
6.2 Outlook
Thus far, history has seen the takeover tide rising and falling six times. While the
financial crises stopped the unprecedented activity of the last wave, recent statistics
deny the notion of the post 2007 takeover market as a calm one: in each year, the
global aggregated transaction value amounted to or surpassed $2.0 trillion.254 Indeed,
takeover activity in the first quarter of 2011 has risen to a sizeable $800 billion again
and, thus, represents the strongest quarter since the early 2008s.255 While the
aforementioned statistics are mainly attributable to strategic investors, the renewed rise
in takeover activity is likely being spurred on by financial investors. Private equity will
draw on the sizeable capital commitments of $500 billion and given the improved
credit market conditions, LBO activity arising solely from existing funds is likely to be
254 Cf. ThomsonReuters deals report November 2010, p. 2 (values are inferred from graphs), see
http://online.thomsonreuters.com/DealsIntelligence/Content/Files/MA%20Snapshot%20November%202010.pdf, last accessed on March 29 2011.
255 Cf. ThomsonReuters deals report April 2011, p. 3, see http://online.thomsonreuters.com/DealsIntelligence/Content/Files/1Q11_MA_Financial_Advisory_Review.pdf, last accessed on May 1 2011.
182
in the range of $1.5 trillion over the next few years.256 In sum, these figures illustrate
that takeover waves are approaching faster and transactions are becoming a more
constant phenomena.257 In turn, deal-making in terms of tactics and strategy will
evolve rapidly and require adequate regulatory response which underlines the
unaltered need for impartial and thorough academic analyses of takeovers.258 In this
context, while there are numerous interesting research questions, the subsequent
recommendations will focus on a few avenues which directly evolve from this thesis
and are deemed most fruitful.
First, given the long-standing discussion of target managers’ conflicts of interests in
private equity backed transactions,259 putting these conjectures to a rigorous test would
be of particular interest. To investigate if, and in the case of yes, to what extent
collusion between private equity investors and target managers poses a problem to
company vendors, one approach would be to analyse the expected change in
managerial ownership around the takeover. Therefore, comparisons should be made
between the ownership change of managers who leave the company (and thereby have
a personal incentive to increase the bid price in the takeover negotiations) and of
managers who are invited to stay on after the buyout (and thereby have a personal
incentive to keep the bid price in the takeover negotiations at a low level260).261 In
addition, it would be crucial to take into account the presence of so-called “special
committees of disinterested directors”. These are sometimes but not always installed
256 Cf. Bain report March 2011, p. 2 and p.35, see
http://www.bain.com/bainweb/PDFs/Bain_and_Company_Global_PE_Report_2011.pdf, last accessed on April 15 2011.
257 Cf. Davidoff (2009), p. 16. 258 Cf. Davidoff (2009), p. 16. 259 Cf. section 5.1 for a more extensive discussion and anecdotal evidence. 260 Certainly, the manager’s incentive to keep the bid price at a low level depends ultimately on
whether her/his expected net wealth change from the buyout is positive. In any case, even if the sample would include a “stay-on manager” for whom the expected net wealth change is estimated to be negative, this negative cash value simply represents an incentive to negotiate for a rather higher than lower bid price and thus would be cleared against the “stay-on managers” for whom the net wealth changes are estimated to be positive.
261 In particular, one would measure their expected ownership change in terms of stock- and option-based compensation.
183
by the target’s board to lead the takeover negotiations. They consist of directors who
have no ties to the target or the bidder, nor will they receive any equity interest in the
new company. Consequently, such special committees mitigate the collusion potential
in takeover contests. By merging both pieces of information, a first collusion proxy
would have been generated. In relating it to the takeover premium, evidence would be
shed on the question of whether, and in the case of yes, to what extent, managers may
face a conflict of interest in private equity acquisitions.
A second avenue would be to focus efforts further on grasping the value of expected
synergies and understanding how it pours into takeover pricing. When compared to its
utmost relevance, our understanding of synergies and their relation to takeover pricing
is still limited.262 This thesis has contributed in this area by exploiting the change in
analyst cash flow forecasts around the merger consummation date. However, besides
this approach, there are further largely unexploited, forward-looking sources of
information that could help in this respect. For instance, analyst forecasts of stock
prices per se (which are available for large cross-sections) or option prices (which
provide data on a more frequent basis) warrant further investigation as to their value.
Finally, another highly valuable avenue would be to analyse empirically the complex
takeover bidding process. Gorbenko/Malenko (2010) and Dittmar et al. (2010) provide
interesting recent contributions in this field but the way different bidder types interact
in terms of the number, timing and underlying valuations of their bids is as yet still
poorly understood. In this context, it would be particularly interesting to analyse
proprietary information from advising investment banks. Precise deal documentation
from sell-side mandates encompassing the whole bid history would enable us to gain
highly valuable insights. Access to such data would greatly help in understanding the
complex bidding process.
262 Cf. section 5.1 for a detailed discussion.

184
A. APPENDIX
Appendix Chapter 3
Chapter 3, which is joint work with Ann-Kristin Achleitner, André Betzer and Marc
Goergen, is forthcoming in the European Financial Management Journal under the title
“Private Equity Acquisitions of Continental European Firms: the Impact of Ownership
and Control on the Likelihood of Being Taken Private”. The reader is referred to chapter
3.
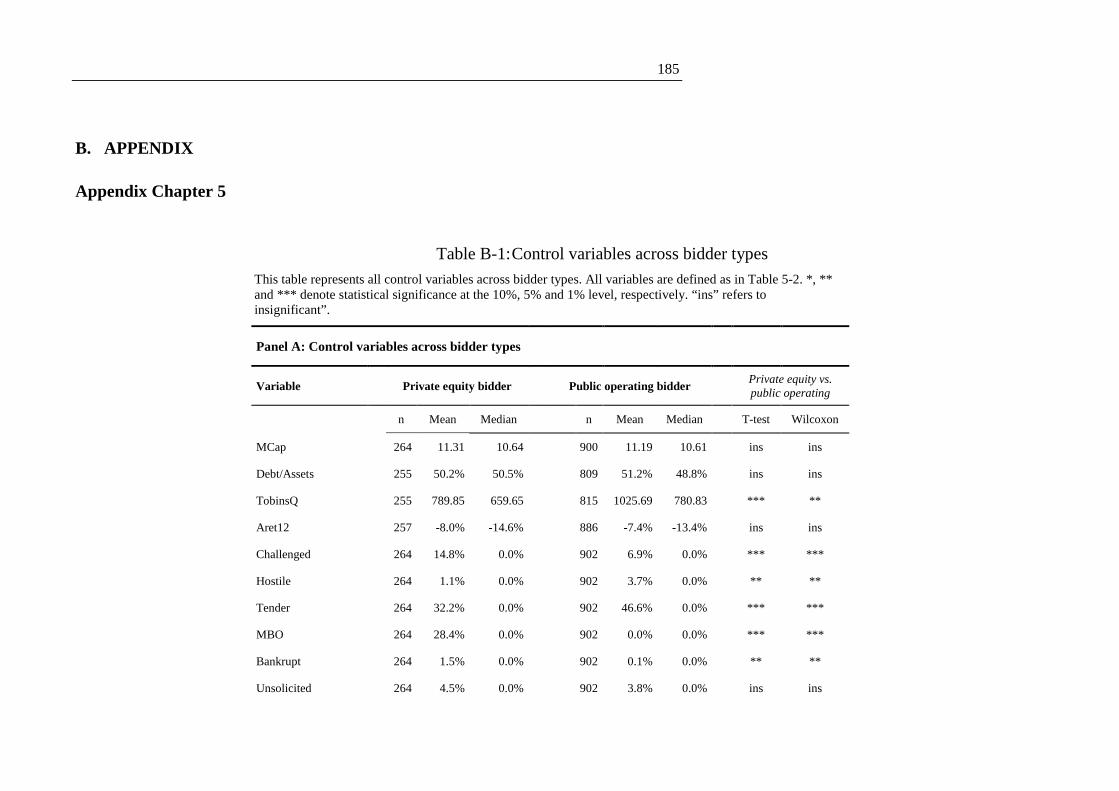
185
B. APPENDIX
Appendix Chapter 5
Table B-1: Control variables across bidder types
This table represents all control variables across bidder types. All variables are defined as in Table 5-2. *, ** and *** denote statistical significance at the 10%, 5% and 1% level, respectively. “ins” refers to insignificant”.
Panel A: Control variables across bidder types
Variable
Private equity bidder
Public operating bidder
Private equity vs. public operating
n Mean Median
n Mean Median T-test Wilcoxon
MCap 264 11.31 10.64 900 11.19 10.61 ins ins
Debt/Assets 255 50.2% 50.5% 809 51.2% 48.8% ins ins
TobinsQ 255 789.85 659.65 815 1025.69 780.83 *** **
Aret12 257 -8.0% -14.6% 886 -7.4% -13.4% ins ins
Challenged 264 14.8% 0.0% 902 6.9% 0.0% *** ***
Hostile 264 1.1% 0.0% 902 3.7% 0.0% ** **
Tender 264 32.2% 0.0% 902 46.6% 0.0% *** ***
MBO 264 28.4% 0.0% 902 0.0% 0.0% *** ***
Bankrupt 264 1.5% 0.0% 902 0.1% 0.0% ** **
Unsolicited 264 4.5% 0.0% 902 3.8% 0.0% ins ins

186
Table B-1: Control variables across bidder types (continued)
Panel A: Control variables across bidder types
Variable
Private equity bidder
Public operating bidder Private equity vs. public operating
n Mean Median n Mean Median T-test Wilcoxon
Defense 264 2.7% 0.0% 902 17.7% 0.0% *** ***
Toehold 264 11.0% 0.0% 902 8.8% 0.0% ins ins
B_lock 264 1.5% 0.0% 902 15.6% 0.0% *** ***
T_lock 264 0.0% 0.0% 902 0.3% 0.0% ins ins
T_termfee 264 57.2% 100.0% 902 52.9% 100.0% ins ins
B_termfee 264 12.9% 0.0% 902 8.2% 0.0% ** **
(Table continues on next page)

187
Table B-1: Control variables across bidder types (continued)
Panel B: Control variables across private equity bidders and public operating bidder subsamples
Variable
Private equity bidder
Public operating bidder with IBES data
Public operating bidder with Value Line data
PE vs. PO IBES
PE vs. PO Value Line
n Mean Median n Mean Median n Mean Median T-test Wilcoxon T-test Wilcoxon
MCap 264 11.31 10.64 594 11.49 11.07 82 12.05 11.96 ** **
*** ***
Debt/Assets 255 50.2% 50.5% 547 46.9% 43.2% 79 46.8% 46.0% * **
ins ins
TobinsQ 255 789.85 659.65 554 1181.91 932.83 81 1292.74 1211.71 *** ***
*** ***
Aret12 257 -8.0% -14.6% 593 -10.7% -15.5% 82 -8.8% -10.2% ins ins
ins ins
Challenged 264 14.8% 0.0% 594 7.9% 0.0% 82 11.0% 0.0% *** ***
ins ins
Hostile 264 1.1% 0.0% 594 4.4% 0.0% 82 14.6% 0.0% *** ***
*** ***
Tender 264 32.2% 0.0% 594 54.2% 100.0% 82 69.5% 100.0% *** ***
*** ***
MBO 264 28.4% 0.0% 594 0.0% 0.0% 82 0.0% 0.0% *** ***
*** ***
Bankrupt 264 1.5% 0.0% 594 0.2% 0.0% 82 0.0% 0.0% ** **
ins ins
Unsolicited 264 4.5% 0.0% 594 4.7% 0.0% 82 11.0% 0.0% ins ins
** **
Defense 264 2.7% 0.0% 594 18.4% 0.0% 82 19.5% 0.0% *** ***
*** ***
Toehold 264 11.0% 0.0% 594 10.9% 0.0% 82 14.6% 0.0% ins ins
ins ins
B_lock 264 1.5% 0.0% 594 15.3% 0.0% 82 12.2% 0.0% *** ***
*** ***
T_lock 264 0.0% 0.0% 594 0.3% 0.0% 82 0.0% 0.0% ins ins
ins ins
T_termfee 264 57.2% 100.0% 594 60.8% 100.0% 82 72.0% 100.0% ins ins
** **
B_termfee 264 12.9% 0.0% 594 8.4% 0.0% 82 14.6% 0.0% ** **
ins ins

188
REFERENCES
Acharya, V.V. / Hahn, M. / Kehoe, C. (2010): Corporate governance and value creation: Evidence from private equity, Working Paper, Centre for Economic Policy Research (CEPR).
Acharya, V.V. / John, K. / Sundaram, R.K. (2000): On the optimality of resetting executive stock options, in: Journal of Financial Economics, 57 (1), pp. 65-101.
Achleitner, A.-K. (2002): Handbuch Investment Banking, Ed. 3, Wiesbaden.
Achleitner, A.-K. / Andres, C. / Betzer, A. / Weir, C. (2011 forthcoming): Economic consequences of private equity investments on the German stock market, in: European Journal of Finance.
Achleitner, A.-K. / Betzer, A. / Goergen, M. / Hinterramskogler, B. (2011 forthcoming): Private equity acquisitions of continental European firms: The impact of ownership and control on the likelihood of being taken private, in: European Financial Management.
Achleitner, A.-K. / Braun, R. / Engel, N. / Figge, C. / Tappeiner, F. (2010): Value creation drivers in private equity buyouts: Empirical evidence from Europe, in: Journal of Private Equity, Spring 2010.
Achleitner, A.-K. / Hinterramskogler, B. (2008): Private equity and wealth effects in blockholder-based governance regimes, Working Paper, TUM Business School.
Achleitner, A.-K. / Lutz, E. (2009): Angels or demons? Evidence on the impact of private equity firms on employment, in: Zeitschrift für Betriebswirtschaft, 5, pp. 53-81.
Agarwal, R. / Elston, J.A. (2001): Bank-firm relationships, financing and firm performance in Germany, in: Economics Letters, 72 (2), pp. 225-232.
Agrawal, A. / Jaffe, J.F. / Gershon, N.M. (1992): The post-merger performance of acquiring firms: A re-examination of an anomaly, in: Journal of Finance, 47 (4), pp. 1605-1621.
Akerlof, G.A. (1970): The market for "lemons": Quality uncertainty and the market mechanism, in: Quarterly Journal of Economics, 84 (3), pp. 488-500.
Alchian, A.A. / Demsetz, H. (1972): Production, information costs, and economic organization, in: American Economic Review, 62 (5), pp. 777-795.
Allerhand, A. / Aronstam, B. (2007): New wave of mergers and acquisition litigation attacks private equity deals, in: New York Law Journal, pp. 1-3.
Amess, K. / Wright, M. (2007a): Barbarians at the gate? Leveraged buyouts, private equity and jobs, Working Paper.

189
Amess, K. / Wright, M. (2007b): The wage and employment effects of leveraged buyouts in the UK, in: International Journal of the Economics of Business, 14 (2), pp. 179-195.
Amihud, Y. (Ed.) (1989): Leveraged management buyouts and shareholders’ wealth, Homewood.
Amihud, Y. / Kahan, M. / Sundaram, R.K. (2004): The foundations of freezeout laws in takeovers, in: Journal of Finance, 59 (3), pp. 1325-1344.
Amihud, Y. / Lev, B. (1981): Risk reduction as a managerial motive for conglomerate mergers, in: Bell Journal of Economics, 12 (2), pp. 605-617.
Andrade, G. / Mitchell, M. / Stafford, E. (2001): New evidence and perspectives on mergers, in: Journal of Economic Perspectives, 15 (2), pp. 103-120.
Andres, C. (2008): Large shareholders and firm performance - an empirical examination of founding-family ownership, in: Journal of Corporate Finance, 14 (4), pp. 431-445.
Andres, C. / Betzer, A. / Weir, C. (2007): Shareholder wealth gains through better corporate governance - the case of European LBO-transactions, in: Financial Markets and Portfolio Management, 21, pp. 403-424
Asquith, P. / Wizman, T.A. (1990): Event risk, covenants, and bondholder returns in leveraged buyouts, in: Journal of Financial Economics, 27 (1), pp. 195-213.
Auerbach, A.J. / Reishus, D. (1988): The effects of taxation on the merger decision: Corporate takeovers - auses and consequences, pp. 157-190.
Axelson, U. / Jenkinson, T. / Stromberg, P. / Weisbach, M.S. (2010): Borrow cheap, buy high? The determinants of leverage and pricing in buyouts, Working Paper, National Bureau of Economic Research.
Axelson, U. / Jenkinson, T. / Strömberg, P. / Weisbach, M.S. (2007): Leverage and pricing in buyouts: An empirical analysis, Working Paper, Swedish Institute for Financial Research.
Axelson, U. / Strömberg, P. / Weisbach, M.S. (2009): Why are buyouts levered? The financial structure of private equity funds, in: Journal of Finance, 64 (4), pp. 1549-1582.
Banerjee, S. / Leleux, B. / Vermaelen, T. (1997): Large shareholdings and corporate control: An analysis of stake purchases by French holding companies, in: European Financial Management, 3 (1), pp. 23-43.
Barclay, M.J. / Holderness, C.G. (1989): Private benefits from control of public corporations, in: Journal of Financial Economics, 25, pp. 371-395.
190
Bargeron, L.L. / Schlingemann, F.P. / Stulz, R.M. / Zutter, C.J. (2008): Why do private acquirers pay so little compared to public acquirers?, in: Journal of Financial Economics, 89 (3), pp. 375-390.
Barnhart, S.W. / Marr, W.M. / Rosenstein, S. (1984): Firm performance and board composition: Some new evidence, in: Managerial and Decision Economics, 15 (4), pp. 329-340.
Barontini, R. / Caprio, L. (2006): The effect of family control on firm value and performance: Evidence from continental Europe, in: European Financial Management, 12 (5), pp. 689-723.
Baums, T. / Fraune, C. (1995): Institutionelle Anleger und Publikumsgesellschaft: Eine empirische Untersuchung, in: Die Aktiengesellschaft, 3, pp. 97-112.
Bayazitova, D. / Kahl, M. / Valkanov, R. (2009): Which mergers destroy value? Only mega-mergers, Working Paper, Leeds School of Business, University of Colorado at Boulder.
Bebchuk, L.A. (1999): A rent-protection theory of corporate ownership and control, Working Paper, National Bureau of Economic Research.
Bebchuk, L.A. / Fried, J.M. (2003): Executive compensation as an agency problem, in: Journal of Economic Perspectives, 17, pp. 71-92.
Bebchuk, L.A. / Grinstein, Y. (2005): The growth of executive pay, in: Oxford Review of Economic Policy, 21 (2), pp. 283-303.
Bebchuk, L.A. / Weisbach, M.S. (2010): The state of corporate governance research, in: Review of Financial Studies, 23 (3), pp. 939-961.
Becht, M. / Bolton, P. / Röell, A.A. (2005): Corporate governance and control, Working Paper.
Berg, A. / Gottschalg, O. (2005): Understanding value generation in buyouts, in: Journal of Restructuring Finance, 2 (1), pp. 9-37.
Bergström, C. / Grubb, M. / Jonsson, S. (2007): The operating impact of buyouts in Sweden: A study of value creation, in: Journal of Private Equity, 11 (1), pp. 22-39.
Berle, A.A. / Means, G.C. (1932): The modern corporation and private property, New York.
Bernile, G. / Bauguess, S.W. (2010): Do merger synergies exist?, Working Paper.
Bernstein, S. / Lerner, J. / Sorensen, M. / Stromberg, P.J. (2010): Private equity and industry performance, Working Paper, NBER.
Betton, S. / Eckbo, B.E. / Thorburn, K.S. (2008): Corporate takeovers, Working Paper, Tuck School of Business
191
Betzer, A. (2006): Why private equity investors buy dear or cheap in European leveraged buyout transactions, in: Kredit und Kapital, 39 (3), pp. 397-417.
Black, F. / Scholes, M. (1973): The pricing of options and corporate liabilities, in: The Journal of Political Economy, 81 (3), pp. 637-654.
Boone, A.L. / Mulherin, J.H. (2009): Do private equity consortiums facilitate collusion in takeover bidding?, Working Paper, AFA 2009 San Francisco Meetings Paper.
Boot, A.W.A. / Gopalan, R. / Thakor, A.V. (2008): Market liquidity, investor participation, and managerial autonomy: Why do firms go private?, in: Journal of Finance, 63 (4), pp. 2013-2059
Borokhovich, K.A. / Parrino, R. / Trapani, T. (1996): Outside directors and CEO selection, in: Journal of Financial and Quantitative Analysis, 31 (03), pp. 337-355.
Bott, C. (2002): Aktionärsstruktur, Kontrolle und Erfolg von Unternehmen, Wiesbaden.
Boucly, Q. / Sraer, D. / Thesmar, D. (2011 forthcoming): Job creating LBOs, in: Journal of Financial Economics.
Bradley, M. / Desai, A. / Kim, E.H. (1988): Synergistic gains from corporate acquisitions and their division between the stockholders of target and acquiring firms, in: Journal of Financial Economics, 21 (1), pp. 3-40.
Brenner, M. / Sundaram, R.K. / Yermack, D. (2000): Altering the terms of executive stock options, in: Journal of Financial Economics, 57 (1), pp. 103-128.
Brown, S.J. / Warner, J.B. (1985): Using daily stock returns: The case of event studies, in: Journal of Financial Economics, 14 (1), pp. 3-31.
Bruner, R.F. (2002): Does M&A pay? A survey of evidence for the decision-maker, in: Journal of Applied Finance, 12 (1), pp. 48-69.
Burkart, M.C. / Panunzi, F. (2008): Takeovers, in: X.H. Freixas, P.; Mayer, C. (Ed.): Handbook of European financial markets and institutions, Oxford, Oxford University Press.
Cable, J. (1985): Capital market information and industrial performance: The role of west German banks, in: Economic Journal, 95 (377), pp. 118-132.
Campa, J.M. / Hernando, I. (2004): Shareholder value creation in European M&As, in: European Financial Management, 10 (1), pp. 47-81.
Cao, J. / Lerner, J. (2009): The performance of reverse leveraged buyouts, in: Journal of Financial Economics, 91 (2), pp. 139-157.

192
Carter, M.E. / Lynch, L.J. (2001): An examination of executive stock option repricing, in: Journal of Financial Economics, 61 (2), pp. 207-225.
Chance, D.M. / Kumar, R. / Todd, R.B. (2000): The repricing of executive stock options, in: Journal of Financial Economics, 57 (1), pp. 129-154.
Chidambaran, N.K. / Prabhala, N.R. (2003): Executive stock option repricing, internal governance mechanisms, and management turnover, in: Journal of Financial Economics, 69 (1), pp. 153-189.
Chirinko, R.S. / Elston, J.A. (1998): Finance, control and profitability: The influence of German banks, Working Paper, American Institute for Contemporary German Studies.
Chowdhry, B. / Jegadeesh, N. (1994): Pre-tender offer share acquisition strategy in takeovers, in: Journal of Financial and Quantitative Analysis, 29 (01), pp. 117-129.
Claessens, S. / Djankov, S. / Fan, J.P.H. / Lang, L.H.P. (2002): Disentangling the incentive and entrenchment effects of large shareholdings, in: Journal of Finance, 57 (6), pp. 2741-2771.
CMBOR (2007): European management buy-outs, Nottingham
Coase, R.H. (1937): The nature of the firm, in: Economica, 4 (16), pp. 386-405.
Coles, J.L. / Hoi, C.-K. (2003): New evidence on the market for directors: Board membership and Pennsylvania Senate Bill 1310, in: Journal of Finance, 58 (1), pp. 197-230.
Connelly, B.L. / Hoskisson, R.E. / Tihanyi, L. / Certo, S.T. (2010): Ownership as a form of corporate governance, in: Journal of Management Studies, 47 (8), pp. 1561-1589.
Core, J. / Guay, W. (1999): The use of equity grants to manage optimal equity incentive levels, in: Journal of Accounting and Economics, 28 (2), pp. 151-184.
Core, J.E. / Guay, W.R. / Larcker, D.F. (2003): Executive equity compensation and incentives: A survey, in: Economic Policy Review, 9 (1), 27-50.
Core, J.E. / Guay, W.R. / Thomas, R.S. (2005): Is U.S. CEO compensation inefficient pay without performance?, in: Vanderbilt Law and Economics Research Paper No. 05-05.
Croci, E. (2007): Corporate raiders, performance and governance in Europe, in: European Financial Management, 13 (5), pp. 949-978.
Cronqvist, H. / Fahlenbrach, R. (2009): Large shareholders and corporate policies, in: Review of Financial Studies, 22 (10), pp. 3941-3976.
193
Cumming, D. / Zambelli, S. (2010): Illegal buyouts, in: Journal of Banking & Finance, 34 (2), pp. 441-456.
Damodaran, A. (2005): The value of synergy, Working Paper, New York University, Stern School of Business.
Davidoff, S.M. (2009): Gods at war: Shotgun takeovers, government by deal and the private equity implosion, in: Gods at war, Chapter 1, John Wiley & Sons, Inc.
Davis, S.J. / Haltiwanger, J.C. / Jarmin, R.S. / Lerner, J. / Miranda, J. (2008): Private equity and employment, Working Paper.
Davydenko, S.A. / Franks, J.R. (2008): Do bankruptcy codes matter? A study of defaults in France, Germany, and the UK, in: Journal of Finance, 63 (2), pp. 565-608.
DeAngelo, H. / DeAngelo, L. / Rice, E.M. (1984): Going private: Minority freezeouts and stockholder wealth, in: Journal of Law and Economics, 27 (2), pp. 367-401.
Demsetz, H. (1983): The structure of ownership and the theory of the firm, in: Journal of Law and Economics, 26 (2), pp. 375-390.
Demsetz, H. / Lehn, K. (1985): The structure of corporate ownership: Causes and consequences, in: Journal of Political Economy, 93 (6), pp. 1155.
Demsetz, H. / Villalonga, B. (2001): Ownership structure and corporate performance, in: Journal of Corporate Finance, 7 (3), pp. 209-233.
Desbrieres, P. / Schatt, A. (2002): The impacts of LBOs on the performance of acquired firms: The French case, in: Journal of Business Finance & Accounting, 29 (5 & 6), pp. 695-729.
Devos, E. / Kadapakkam, P.-R. / Krishnamurthy, S. (2009): How do mergers create value? A comparison of taxes, market power, and efficiency improvements explanations for synergies, in: Review of Financial Studies, 22 (3), pp. 1179-1211.
Dietl, H.M. (1998): Capital markets and corporate governance in Japan, Germany and the United States - organizational response to market inefficiences, London, New York.
Dittmar, A. / Li, D. / Nain, A. (2010): It pays to follow the leader: Acquiring targets picked by private equity, Working Paper
Dlugosz, J. / Fahlenbrach, R. / Gompers, P. / Metrick, A. (2006): Large blocks of stock: Prevalence, size, and measurement, in: Journal of Corporate Finance, 12 (3), pp. 594-618.
Drobetz, W. / Schillhofer, A. / Zimmermann, H. (2004): Corporate governance and expected stock returns: Evidence from Germany, in: European Financial Management, 10 (2), pp. 267-293.

194
Dyck, A. / Zingales, L. (2004): Private benefits of control: An international comparison, in: Journal of Finance, 59 (2), pp. 537-600.
Easterwood, J.C. / Singer, R.F. / Seth, A. / Lang, D.F. (1994): Controlling the conflict of interest in management buyouts, in: Review of Economics and Statistics, 76 (3), pp. 512-522.
Eckbo, B.E. (1983): Horizontal mergers, collusion, and stockholder wealth, in: Journal of Financial Economics, 11 (1-4), pp. 241-273.
Eckbo, B.E. (2009): Bidding strategies and takeover premiums: A review, in: Journal of Corporate Finance, 15, pp. 149-178.
Edwards, J.S. / Nibler, M. / Berglöf, E. / Franks, J. (2000): Corporate governance in Germany: The role of banks and ownership concentration, in: Economic Policy, 15 (31), pp. 239-267.
Edwards, J.S. / Weichenrieder, A.J. (2004): Ownership concentration and share valuation, in: German Economic Review, 5 (2), pp. 143-171.
Emmons, W.R. / Schmid, F.A. (1998): Universal banking, allocation of control rights, and corporate finance in Germany, Working Paper, Federal Reserve Bank of St. Louis.
Enriques, L. / Volpin, P. (2007): Corporate governance reforms in continental Europe, in: Journal of Economic Perspectives, 21 (1), pp. 117-140.
Faccio, M. / Lang, L.H.P. (2002): The ultimate ownership of western European corporations, in: Journal of Financial Economics, 65 (3), pp. 365-395.
Fama, E.F. (1980): Agency problems and the theory of the firm, in: Journal of Political Economy, 88 (2), pp. 288-307.
Fama, E.F. / Jensen, M.C. (1983): Separation of ownership and control, in: Journal of Law and Economics, 26 (2), pp. 301-325.
Fenn, G.W. / Liang, N. / Prowse, S. (1997): The private equity market: An overveiw, in: Financial Markets, Institutions & Instruments, 6 (4), pp. 1-106.
Frankfurter, G.M. / Gunay, E. (1992): Management buy-outs: The sources and sharing of wealth between insiders and outside shareholders, in: Quarterly Review of Economics and Finance, 32 (3), pp. 82-95.
Franks, J. / Harris, R. / Titman, S. (1991): The postmerger share-price performance of acquiring firms, in: Journal of Financial Economics, 29 (1), pp. 81-96.
Franks, J. / Mayer, C. (2001): Ownership and control of German corporations, in: Review of Financial Studies, 14, pp. 943-977.
Furubotn, E.G. / Pejovich, S. (1972): Property rights and economic theory: A survey of recent literature, in: Journal of Economic Literature, 10 (4), pp. 1137-1162.

195
Geranio, M. / Zanotti, G. (2011 forthcoming): Equity markets don`t fit all companies: An analysis of puplic-to-private deals in continental Europe, in: European Financial Management.
Gertner, R. / Kaplan, S.N. (1996): The value maximizing board, Working Paper.
Gillan, S.L. (2006): Recent developments in corporate governance: An overview, in: Journal of Corporate Finance, 12 (3), pp. 381-402.
Goergen, M. / Renneboog, L. (2004): Shareholder wealth effects of European domestic and cross-border takeover bids, in: European Financial Management, 10 (1), pp. 9-45.
Gompers, P. / Lerner, J. (2004): The venture capital cylce, Cambridge, MA.
Gorbenko, A.S. / Malenko, A. (2010): Strategic and financial bidders in takeover auctions, Working Paper.
Gorton, G.B. / Schmid, F.A. (2000a): Class struggle inside the firm: A study of German codetermination, Working Paper.
Gorton, G.B. / Schmid, F.A. (2000b): Universal banking and the performance of German firms, in: Journal of Financial Economics, 58 (1-2), pp. 29-80.
Graham, D.A. / Marshall, R.C. (1987): Collusive bidder behavior at single-object second-price and english auctions, in: Journal of Political Economy, 95 (6), pp. 1217-1239.
Grossman, S.J. / Hart, O.D. (1980): Takeover bids, the free-rider problem, and the theory of the corporation, in: Bell Journal of Economics, 11 (1), pp. 42-64.
Grossman, S.J. / Hart, O.D. (1988): One share-one vote and the market for corporate control, in: Journal of Financial Economics, 20, pp. 175-202.
Guay, W.R. (1999): The sensitivity of CEO wealth to equity risk: An analysis of the magnitude and determinants, in: Journal of Financial Economics, 53 (1), pp. 43-71.
Gugler, K. / Mueller, D.C. / Yurtoglu, B.B. (2004): Corporate governance and globalization, in: Oxford Review of Economic Policy, 20 (1), pp. 129-156.
Gugler, K. / Yurtoglu, B.B. (2003): Corporate governance and dividend pay-out policy in Germany in: European Economic Review, 47 (4), pp. 731-758.
Guo, S. / Hotchkiss, E.S. / Song, W. (2011 forthcoming): Do buyouts (still) create value in: Journal of Finance.
Halpern, P. / Kieschnick, R. / Rotenberg, W. (1999): On the heterogeneity of leveraged going private transactions, in: Review of Financial Studies, 12 (2), pp. 281-309.

196
Harford, J. (2005): What drives merger waves?, in: Journal of Financial Economics, 77 (3), pp. 529-560.
Harford, J. / Li, K. (2007): Decoupling CEO wealth and firm performance: The case of acquiring CEOs, in: Journal of Finance, 62 (2), pp. 917-949.
Harlow, W.V. / Howe, J.S. (1993): Leveraged buyouts and insider nontrading, in: Financial Management, 22 (1), pp. 109-118.
Harris, R.D.F. / Siegel, D.S. / Wright, M. (2005): Assessing the impact of management buyouts on economic efficiency: Plant-level evidence from the United Kingdom, in: Review of Economics and Statistics, 87 (1), pp. 148-153.
Harvey, C.R. / Lins, K.V. / Roper, A.H. (2004): The effect of capital structure when expected agency costs are extreme, in: Journal of Financial Economics, 74 (1), pp. 3-30.
Haubrich, J.G. (1994): Risk aversion, performance pay, and the principal-agent problem, in: Journal of Political Economy, 102 (2), pp. 258-276.
Healy, P.M. / Palepu, K.G. / Ruback, R.S. (1992): Does corporate performance improve after mergers?, in: Journal of Financial Economics, 31 (2), pp. 135-175.
Hermalin, B.E. / Weisbach, M.S. (1988): The determinants of board composition, in: Rand Journal of Economics, 19 (4), 589-606.
Hermalin, B.E. / Weisbach, M.S. (2003): Boards of directors as an endogenously determined institution: A survey of the economic literature, in: Economic Policy Review, 9, pp. 7-26.
Hietala, P. / Kaplan, S.N. / Robinson, D.T. (2003): What is the price of hubris? Using takeover battles to infer overpayments and synergies, in: Financial Management, 32 (3), pp. 5-31.
Holderness, C.G. / Kroszner, R.S. / Sheehan, D.P. (1999): Were the good old days that good? Changes in managerial stock ownership since the great depression, in: Journal of Finance, 54 (2), pp. 435-469.
Holmstrom, B. / Kaplan, S.N. (2001): Corporate governance and merger activity in the united states: Making sense of the 1980s and 1990s, in: Journal of Economic Perspectives, 15 (2), pp. 121-144.
Hotchkiss, E.S. / John, K. / Thorburn, K.S. / Mooradian, R.M. (2008): Bankruptcy and the resolution of financial distress, Working Paper.
Januszewski, S.I. / Köke, J. / Winter, J.K. (2002): Product market competition, corporate governance and firm performance: An empirical analysis for Germany, in: Research in Economics, 56 (3), pp. 299-332.

197
Jenkinson, T. / Ljungqvist, A. (2001): The role of hostile stakes in German corporate governance, in: Journal of Corporate Finance, 7 (4), pp. 397-446.
Jenkinson, T. / Stucke, R. (2010): Who benefits from the leverage in LBOs?, Working Paper, University of Oxford, Said Business School.
Jensen, M.C. (1986): Agency costs of free cash flow, corporate finance and takeovers, in: American Economic Review, 76 (2), pp. 323-329.
Jensen, M.C. (1989): Eclipse of the public corporation, in: Harvard Business Review, 67 (5), pp. 61-74.
Jensen, M.C. (1993): The modern industrial revolution, exit, and the failure of internal control systems, in: Journal of Finance, 48 (3), pp. 831-880.
Jensen, M.C. / Meckling, W.H. (1976): Theory of the firm: Managerial behavior, agency costs and ownership structure, in: Journal of Financial Economics, 3 (4), pp. 305-360.
Jensen, M.C. / Murphy, K. (1990): Performance pay and top-management incentives, in: Journal of Political Economy, 98 (2), pp. 225-264.
Junker, L. (2005): Equity carveouts, agency costs, and firm value, Wiesbaden.
Kaplan, S.N. (1989a): The effects of management buyouts on operating performance and value, in: Journal of Financial Economics, 24, pp. 217-254.
Kaplan, S.N. (1989b): Management buyouts: Evidence on taxes as a source of value, in: Journal of Finance, 44 (3), pp. 611-632.
Kaplan, S.N. / Ruback, R.S. (1995): The valuation of cash flow forecasts: An empirical analysis, in: Journal of Finance, 50 (4), pp. 1059-1093.
Kaplan, S.N. / Schoar, A. (2005): Private equity performance: Returns, persistence and capital flows, in: Journal of Finance, 60 (4), pp. 1791-1823.
Kaplan, S.N. / Stein, J.C. (1993): The evolution of pricing and financial structure in the 1980s, in: Quarterly Journal of Economics, 108 (2), pp. 313-357.
Kaplan, S.N. / Strömberg, P. (2009): Leveraged buyouts and private equity, in: Journal of Economic Perspectives, 23 (1), pp. 121-146.
Kaserer, C. / Achleitner, A.-K. / Von Einem, C. / Schiereck, D. (2007): Private Equity in Deutschland: Rahmenbedingungen, ökonomische Bedeutung und Handlungsempfehlungen, Norderstedt.
Kieschnick, R.L. (1998): Free cash flow and stockholder gains in going private transactions revisited, in: Journal of Business Finance & Accounting, 25 (1/2), pp. 187-202.
198
Klein, A. / Zur, E. (2009): Entrepreneurial shareholder activism: Hedge funds and other private investors, in: Journal of Finance, 64 (1), pp. 187-229.
Klöckner, O. (2009): Buy-outs in family businesses - changes in corporate governance, instruments in managerial control, and financial practices, Munich.
Köke, J. / Renneboog, L. (2005): Do corporate control and product market competition lead to stronger productivity growth? Evidence from market‐oriented and blockholder‐based governance regimes, in: Journal of Law and Economics, 48 (2), pp. 475-516.
Kothari, S.P. / Warner, J.B. (Ed.) (2006): The econometrics of event studies, Elsevier-North-Holland.
La Porta, R. / Lopez-de-Silanes, F. / Shleifer, A. (1999): Corporate ownership around the world, in: Journal of Finance, 54 (2 ), pp. 471-517.
Lahr, H. (2010): Pricing of listed private equity - risk and return, net asset values, and loss aversion, Munich.
Lee, D.S. (1992): Management buyout proposals and inside information, in: Journal of Finance, 47 (3), pp. 1061-1079.
Lehmann, E. / Weigand, J. (2000): Does the governed corporation perform better? Governance structures and corporate performance in Germany, in: European Finance Review, 4 (2), pp. 157-195.
Lehn, K. / Poulsen, A. (1989): Free cash flow and stock holder gains in going private transactions, in: Journal of Finance, 44 (3), pp. 771-787.
Leland, H.E. / Pyle, D.H. (1977): Informational asymmetries, financial structure, and financial intermediation, in: Journal of Finance, 32 (2), pp. 371-387.
Lewellen, W. / Loderer, C. / Rosenfeld, A. (1985): Merger decisions and executive stock ownership in acquiring firms, in: Journal of Accounting and Economics, 7 (1-3), pp. 209-231.
Lichtenberg, F.R. / Siegel, D. (1990): The effects of leveraged buyouts on productivity and related aspects of firm behavior, in: Journal of Financial Economics, 27 (1), pp. 165-194.
Ljungqvist, A. / Richardson, M. / Wolfenzon, D. (2007): The investment behavior of buyout funds: Theory and evidence, Working Paper, National Bureau of Economic Research.
Lopez de Silanes, F. / Phalippou, L. / Gottschalg, O. (2011): Giants at the gate: On the cross-section of private equity investment returns, Working Paper.
Lowenstein, L. (1985): Management buyouts, in: Columbia Law Review, 85 (4), pp. 730-784.

199
Malmendier, U. / Tate, G.A. (2008): Who makes acquisitions? CEO overconfidence and the market's reaction, in: Journal of Financial Economics, 89 (1), pp. 20-43.
Manne, H.G. (1965): Mergers and the market for corporate control, in: The Journal of Political Economy, 73 (2), pp. 110-120.
Marais, L. / Schipper, K. / Smith, A. (1989): Wealth effects of going private for senior securities, in: Journal of Financial Economics, 23 (1), pp. 155-191.
Marris, R. (1963): A model of the "managerial" enterprise, in: Quarterly Journal of Economics, 77 (2), pp. 185-209.
Marris, R. (1964): The economic theory of managerial capitalism, London.
Martynova, M. / Renneboog, L. (2008): A century of corporate takeovers: What have we learned and where do we stand?, in: Journal of Banking & Finance, 32 (10), pp. 2148-2177.
Maupin, R.J. / Bidwell, C.M. / Ortegren, A.K. (1984): An empirical investigation of the characteristics of publicly quoted corporations which change to closely held ownership through management buyouts, in: Journal of Business Finance & Accounting, 11 (4), pp. 435-450.
May, D.O. (1995): Do managerial motives influence firm risk reduction strategies?, in: Journal of Finance, 50 (4), pp. 1291-1308.
Mayer, C. (2008): Trust in financial markets, in: European Financial Management, 14 (4), pp. 617-632.
McAfee, R.P. / McMillan, J. (1992): Bidding rings, in: American Economic Review, 82 (3), pp. 579-599.
McCahery, J.A. / Renneboog, L. / Ritter, P. / Haller, S. (2004): The economics of the proposed European takeover directive, in: G.H. Ferrarini, Klaus J.; Winter, Jaap; Wymeersch, Eddy (Ed.): Modern company and takeover law in Europe, Oxford, pp. 575-646, Oxford University Press.
McConnell, J.J. / Servaes, H. (1990): Additional evidence on equity ownership and corporate value, in: Journal of Financial Economics, 27 (2), pp. 595-613.
McGuckin, R.H. / Nguyen, S.V. (1995): On productivity and plant ownership change: New evidence from the longitudinal research database, in: RAND Journal of Economics, 26 (2), pp. 257-276.
Metrick, A. / Yasuda, A. (2010): The economics of private equity funds, in: Review of Financial Studies, 23 (6), pp. 2303-2341.
Metrick, A. / Yasuda, A. (2011 forthcoming): Venture capital and other private equity: A survey, in: European Financial Management.

200
Modigliani, F. / Miller, M.H. (1958): The cost of capital, corporation finance and the theory of investment, in: American Economic Review, 48 (3), pp. 261-297.
Modigliani, F. / Miller, M.H. (1963): Corporate income taxes and the cost of capital: A correction, in: American Economic Review, 53 (3), pp. 433-443.
Moeller, S.B. / Schlingemann, F.P. / Stulz, R.M. (2004): Firm size and the gains from acquisitions, in: Journal of Financial Economics, 73 (2), pp. 201-228.
Moldenhauer, B. (2007): Insider ownership, shareholder structure and corporate governance, Sternenfels.
Morck, R. / Shleifer, A. / Vishny, R.W. (1988): Management ownership and market valuation - an empirical analysis, in: Journal of Financial Economics, 20, pp. 293-315.
Müller, H.M. / Panunzi, F. (2004): Tender offers and leverage, in: Quarterly Journal of Economics, 119 (4), pp. 1217-1248.
Murphy, K. (1999): Executive compensation, in: O. Ashenfelter, Card, D (Ed.): Handbook of labor economics, Ed. 3, Amsterdam, North-Holland.
Murphy, K.J. (1985): Corporate performance and managerial remuneration: An empirical analysis, in: Journal of Accounting and Economics, 7 (1-3), pp. 11-42.
Myers, S.C. (1977): Determinants of corporate borrowing, in: Journal of Financial Economics, 5 (2), pp. 147-175.
North, D.S. (2001): The role of managerial incentives in corporate acquisitions: Evidence from the 1990s, in: Journal of Corporate Finance, 7 (2), pp. 125-149.
OECD (2004): OECD principles of corporate governance, Organisation for Economic Cooperation and Development.
Officer, M.S. / Ozbas, O. / Sensoy, B.A. (2010): Club deals in leveraged buyouts, in: Journal of Financial Economics, 98 (2), pp. 214-240.
Opler, T. / Titman, S. (1993): The determinants of leveraged buyout activity: Free cash flow vs. financial distress costs in: Journal of Finance, 48 (5), pp. 1985-1999.
Pagano, M. / Panetta, F. / Zingales, L. (1998): Why do companies go public? An empirical analysis, in: Journal of Finance, 53 (1), pp. 27-64.
Pagano, M. / Röell, A. (1998): The choice of stock ownership structure: Agency costs, monitoring, and the decision to go public, in: Quarterly Journal of Economics, 113 (1), pp. 187-225.
Peasnell, K.V. / Pope, P.F. / Young, S. (2003): Managerial equity ownership and the demand for outside directors, in: European Financial Management, 9 (2), pp. 231-250.
201
Phalippou, L. / Gottschalg, O. (2009): The performance of private equity funds, in: Review of Financial Studies, 22 (4), pp. 1747-1776.
Porta, R.L. / Lopez-De-Silanes, F. / Shleifer, A. / Vishny, R.W. (1997): Legal determinants of external finance, in: Journal of Finance, 52 (3), pp. 1131-1150.
Ravenscraft, D.J. / Scherer, F.M. (1987): Life after takeover, in: Journal of Industrial Economics, 36 (2), pp. 147-156.
Ravenscraft, D.J. / Scherer, F.M. (1989): The profitability of mergers, in: International Journal of Industrial Organization, 7 (1), pp. 101-116.
Renneboog, L. / Simons, T. (2005): Public-to-private transactions: LBOs, MBOs, MBIs and IBOs, Working Paper.
Renneboog, L. / Simons, T. / Wright, M. (2007): Why do public firms go private in the UK? The impact of private equity investors, incentive realignment and undervaluation, in: Journal of Corporate Finance, 13 (4), pp. 591-628.
Rogers, D.A. (2005): Managerial risk-taking incentives and executive stock option repricing: A study of US casino executives, in: Financial Management, 34 (1), pp. 95-121.
Roll, R. (1986): The hubris hypothesis of corporate takeovers, in: Journal of Business, 59 (2), pp. 197-216.
Rosenstein, S. / Wyatt, J.G. (1990): Outside directors, board independence, and shareholder wealth, in: Journal of Financial Economics, 26 (2), pp. 175-191.
Rosett, J.G. (1990): Do union wealth concessions explain takeover premiums?: The evidence on contract wages, in: Journal of Financial Economics, 27 (1), pp. 263-282.
Ross, S.A. (1973): The economic theory of agency: The principal's problem, in: The American Economic Review, 63 (2), pp. 134-139.
Ruback, R.S. (2002): Capital cash flows: A simple approach to valuing risky cash flows, in: Financial Management, 31 (2), pp. 85-103.
Rudolph, B. (2006): Unternehmensfinanzierung und Kapitalmarkt, Tübingen.
Schoar, A. (2002): Effects of corporate diversification on productivity, in: The Journal of Finance, 57 (6), pp. 2379-2403.
Scholich, M. / Burton, R. (2010): Private equity trend report 2010: Navigating the rocky road to recovery, Frankfurt am Main.
Schwert, G.W. (1996): Markup pricing in mergers and acquisitions, in: Journal of Financial Economics, 41 (2), pp. 153-192.

202
Scott, K. (1999): Institutions of corporate governance, in: Journal of Institutional and Theoretical Economics, 155 (1), pp. 3-13.
Servaes, H. (1994): Do takeover targets overinvest?, in: Review of Financial Studies, 7 (2), pp. 253-277.
Shleifer, A. / Summers, L.H. (1988): Breach of trust in hostile takeovers, in: A.J. Auerbach (Ed.): Corporate takeovers: Causes and consequences, Chicago, University of Chicago Press.
Shleifer, A. / Vishny, R.W. (1986): Large shareholders and corporate control, in: Journal of Political Economy, 94 (3), pp. 461-488.
Shleifer, A. / Vishny, R.W. (1989): Management entrenchment: The case of manager-specific investments, in: Journal of Financial Economics, 25 (1), pp. 123-139.
Shleifer, A. / Vishny, R.W. (1997): A survey of corporate governance, in: Journal of Finance, LII (2), pp. 737-783.
Short, H. / Keasey, K. (1999): Managerial ownership and the performance of firms: Evidence from the uk, in: Journal of Corporate Finance, 5 (1), pp. 79-101.
Singh, H. (1990): Management buyouts: Distinguishing characteristics and operating changes prior to public offering, in: Strategic Management Journal, 11, pp. 111-129.
Slovin, M.B. / Sushka, M.E. (1993): Ownership concentration, corporate control activity, and firm value: Evidence from the death of inside blockholders, in: Journal of Finance, 48 (4), pp. 1293-1321.
Smith, A. ([1994]1937): An inquiry into the nature and causes of the wealth of nations (reprint), New York.
Smith, A.J. (1990): Corporate ownership structure and performance: The case of management buyouts, in: Journal of Financial Economics, 27 (1), pp. 143-164.
Smith, C.W. / Warner, J.B. (1979): On financial contracting: An analysis of bond covenants, in: Journal of Financial Economics, 7 (2), pp. 117-161.
Sorensen, M. / Stromberg, P.J. / Lerner, J. (2011 forthcoming): Private equity and long-run investment: The case of innovation, in: Journal of Finance.
Standard&Poors (2010): A guide to the European loan market, London.
Stein, J.C. (1988): Takeover threats and managerial myopia, in: Journal of Political Economy, 96 (1), pp. 61-80.
Stigler, G.J. (1964): A theory of oligopoly, in: Journal of Political Economy, 72 (1), pp. 44-61.
203
Strömberg, P. (2007): The new demography of private equity, Working Paper, Swedish Institute for Financial Research.
Stulz, R.M. / Walkling, R.A. / Moon, H.S. (1990): The distribution of target ownership and the division of gains in successful takeovers, in: Journal of Finance, 45 (3), pp. 817-833.
Sudarsanam, S. (2010): Creating value from mergers and acquisitions, Ed. 2, London.
Tappeiner, F. (2010): Structure and determinants of financial covenants in leveraged buyouts, Munich.
ThomsonReuters / JPMorgan (2009): The era of globalized M&A - winds of change, London.
Tirole, J. (2006): The theory of corporate finance, Princeton, New Jersey.
Torabzadeh, K.M. / Bertin, W.J. (1987): Leveraged buyouts and shareholder returns in: Journal of Financial Research, 10 (4), pp. 313-319.
Travlos, N.G. / Cornett, M.M. (1993): Going private buyouts and determinants of shareholders' returns, in: Journal of Accounting, Auditing & Finance, 8 (1), pp. 1-25.
Ventoruzzo, M. (2010): Freeze-outs: Transcontinental analysis and reform proposals, in: Virginia Journal of International Law, 50, pp. 842-916.
Weir, C. / Jones, P. / Wright, M. (2008a): Public to private transactions, private equity and performance in the UK: An empirical analysis of the impact of going private, Working Paper.
Weir, C. / Laing, D. / McKnight, P.J. (2002): Internal and external governance mechanisms: Their impact on the performance of large UK public companies, in: Journal of Business Finance & Accounting, 29 (5/6), pp. 579-611.
Weir, C. / Laing, D. / Wright, M. (2005): Incentive effects, monitoring mechanisms and the market for corporate control: An analysis of the factors affecting public to private transactions in the UK, in: Journal of Business Finance & Accounting, 32 (5), pp. 909-943.
Weir, C. / Wright, M. / Scholes, L. (2008b): Public-to-private buy-outs, distress costs and private equity, in: Applied Financial Economics, 18 (10), pp. 801-819.
Weston, F.J. / Mitchell, M.L. / Mulherin, J.H. (2003): Takeovers, restructuring, and corporate governance, Ed. 4, Upple Saddle River, New Jersey.
Weston, F.J. / Siu, J.A. / Johnson, B.A. (2001): Takeovers, restructuring & corporate governance, New Jersey.
White, H. (1980): A heteroskedasticity-consistent covariance matrix estimator and a direct test for heteroskedasticity, in: Econometrica, 48 (4), pp. 817-838.

204
World Economic Forum (2008): Globalization of alternative investments, Working Papers Volume 1, 01/2008, World Economic Forum.
Wright, M. / Renneboog, L. / Simons, T. / Scholes, L. (2006): Leveraged buyouts in the UK and continental Europe: Retrospect and prospect, in: Journal of Applied Corporate Finance, 18 (3), pp. 38-55.
Wright, M. / Robbie, K. (1998): Venture capital and private equity: A review and synthesis, in: Journal of Business Finance & Accounting, 25 (5/6), pp. 521-570.
Wright, M. / Weir, C. / Burrows, A. (2007): Irrevocable commitments, going private and private equity, in: European Financial Management, 13 (4), pp. 757-775.
Wright, M. / Wilson, N. / Robbie, K. (1996): The longer term effects of management-led buyouts, in: Journal of Entrepreneurial and Small Business Finance, 5, pp. 213-234.
Yarrow, G.K. (1985): Shareholder protection, compulsory acquisition and the efficiency of the takeover process, in: Journal of Industrial Economics, 34 (1), pp. 3-16.
Yermack, D. (1996): Higher market valuation of companies with a small board of directors, in: Journal of Financial Economics, 40 (2), pp. 185-211.
Zingales, L. (1994): The value of the voting right: A study of the Milan stock exchange experience in: Review of Financial Studies, 7 (1), pp. 125-148.