takashi kohda et al- variation in gene expression and aberrantly regulated chromosome regions in...
TRANSCRIPT

8/3/2019 Takashi Kohda et al- Variation in Gene Expression and Aberrantly Regulated Chromosome Regions in Cloned Mice
http://slidepdf.com/reader/full/takashi-kohda-et-al-variation-in-gene-expression-and-aberrantly-regulated 1/10
BIOLOGY OF REPRODUCTION 73, 1302–1311 (2005)Published online before print 24 August 2005.DOI 10.1095/biolreprod.105.044958
Variation in Gene Expression and Aberrantly Regulated Chromosome Regionsin Cloned Mice1
Takashi Kohda,3,4 Kimiko Inoue,4,5 Narumi Ogonuki,5 Hiromi Miki,5 Mie Naruse,3
Tomoko Kaneko-Ishino,4,6 Atsuo Ogura,4,5 and Fumitoshi Ishino2,3,4
Department of Epigenetics,3 Medical Research Institute, Tokyo Medical and Dental University, Chiyoda-ku,Tokyo 101-0062, JapanCREST,4 Japan Science and Technology Agency (JST), Kawaguchi, Saitama 332-0011, JapanBioResource Center,5 RIKEN, Tsukuba, Ibaraki 305-0074, JapanSchool of Health Sciences,6 Tokai University, Bohseidai, Isehara, Kanagawa 259-1193, Japan
ABSTRACT
DNA microarray analysis was used to determine the precisegenome-wide gene expression profiles of somatic cloned micederived from Sertoli and cumulus cells. It demonstratedunexpectedly large epigenetic diversity in neonatal cloned mice,despite their normal appearance and genetic identity. In three
neonatal tissues of the cloned mice, the expression of 9–40% of the genes examined was more than two times higher or lower indonor cell-dependent or -independent manners compared withnormal controls. Relatively few (0.4–4%) of the genes exhibitedup- or downregulation in the same manner in both types of clone. A cluster analysis of the variation in gene expression ledto the identification of several chromosome regions in whichgene expression was aberrantly controlled in the somatic clones.These results provide a more complete understanding of howsomatic clones differ from each other and from normalindividuals produced by sexual reproduction and indicate thesignificant difficulties that face the application of somaticcloning in regenerative medicine.
cumulus cells, developmental biology, gene regulation, Sertoli
cells
INTRODUCTION
Animals cloned from somatic cells have attracted a great deal of attention due to their peculiar manner of reproduction.The somatic nuclear cloning technique itself has also hada major impact on human society because nuclear-transferredembryonic stem (ES) cells are expected to be the material best suited for therapeutic cloning. However, one must still ask:What exactly are somatic clones? Does somatic cloningproduce animals and tissues identical to those of the nucleusdonor animals? Unlike ES cell-derived clones, which have highrates of neonatal abnormalities [1–3], we and others have
previously reported that the majority of term pups cloned fromsomatic cells using nuclear transfer appeared healthy ondelivery, gained active movement rapidly, and grew into fertileadults, despite the low success rate due to high embryonallethality, particularly at early postimplantation stages [4–7].Abnormal enlarged placentas are commonly observed in bothES and somatic clones and there have been many reports ontheir abnormal epigenetic status, such as aberrant geneexpression [6, 8–11] and DNA methylation [12]. However, it has been reported that a relatively small number of genesexhibit abnormal expression in the livers of neonatal clonesderived from cumulus and ES cells compared with the number of genes expressed abnormally in the corresponding placentasof clones [8]. Recently, the long-term health consequences of somatic clones, such as obesity [13], short life span, andimmune-system anomalies [14], have been reported. Theseresults suggest that broad effects also occur in neonatal or adult somatic clones, in addition to the commonly observed enlargedplacentas. Here, we present detailed gene expression data fromsomatically cloned mice to further understanding of their biology, a necessary step before these techniques can be
applied to regenerative medicine.
MATERIALS AND METHODS
Production of Cloned MiceCloning by nuclear transfer was performed according to the method
developed by Wakayama et al. [4], with slight modification [5]. ImmatureSertoli and cumulus cells were collected from newborn male (0–8 days after birth) and mature female (2–3 mo old) C57BL/6 3 DBA/2 F1 (BDF1) mice,respectively, and used as nucleus donor cells. Cloned pups were obtained fromthe recipients at term (Day 19.5) by cesarean section. All control mice weregenetically identical to the somatic cell clones, e.g., BDF1. As the majority(95% and 82% of immature Sertoli clones and cumulus clones, respectively) of term pups appeared healthy on delivery and rapidly gained active movement under our experimental conditions, we did not select individuals but insteadused all of the eight pups that we obtained. After confirmation of the start of respiration at the time of cesarean section, we killed the pups and collected
tissues and organs. The control neonates were produced by in vitro fertilizationand also recovered by cesarean section. All samples from cesarean section wereimmediately frozen and stored in liquid nitrogen until use. All proceduresdescribed here were reviewed and approved by the Animal ExperimentationCommittee at RIKEN and were performed in accordance with the RIKENGuiding Principles for the Care and Use of Laboratory Animals.
DNA Microarray Experiments
The CodeLink system (Amersham Biosciences) was used to determine andcompare the expression levels of 10 012 genes (UniSet mouse I) in the neonataltissues of four Sertoli cell-derived clones, four cumulus cell-derived clones, andfour normal controls (two males and two females each). Total RNA waspurified using Isogen (Nippon Gene). The cRNA preparation and CodeLinkhybridization were conducted according to the manufacturers’ protocols. Theexpression levels of the different genes were assessed using GenePix Pro
1Supported by grants from CREST, the research program of the JapanScience and Technology Agency (JST), the Uehara Memorial ScienceFoundation, the Ministries of Health, Labour, and Welfare for ChildHealth and Development (14-C) and Education, Culture, Sports,Science and Technology of Japan.2Correspondence: Fumitoshi Ishino, Department of Epigenetics, Med-ical Research Institute, Tokyo Medical and Dental University, 2–3–10Kanda-surugadai, Chiyoda-ku, Tokyo 101-0062, Japan.FAX: 81 3 5280 8073; e-mail: [email protected]
Received: 27 June 2005First decision: 4 August 2005Accepted: 22 August 2005Ó 2005 by the Society for the Study of Reproduction, Inc.ISSN: 0006-3363. http://www.biolreprod.org
1302
8/3/2019 Takashi Kohda et al- Variation in Gene Expression and Aberrantly Regulated Chromosome Regions in Cloned Mice
http://slidepdf.com/reader/full/takashi-kohda-et-al-variation-in-gene-expression-and-aberrantly-regulated 2/10
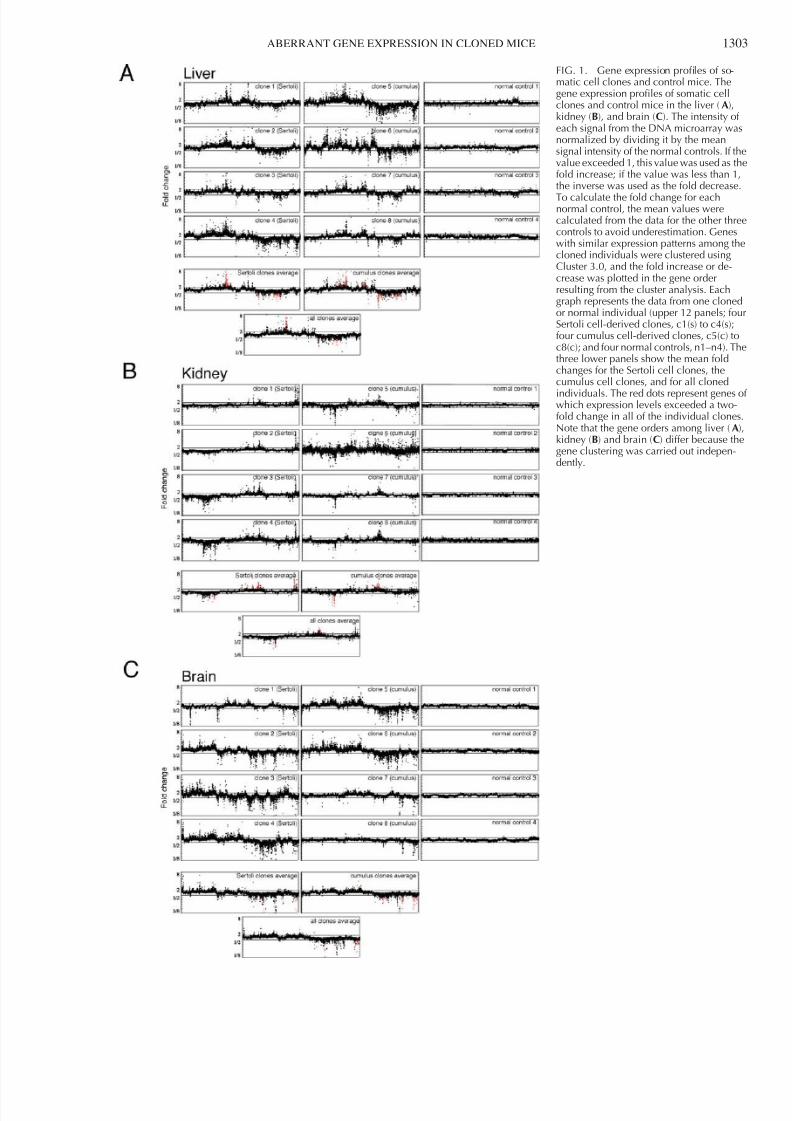
FIG. 1. Gene expression profiles of so-matic cell clones and control mice. Thegene expression profiles of somatic cellclones and control mice in the liver (A),kidney (B), and brain (C). The intensity of each signal from the DNA microarray wasnormalized by dividing it by the meansignal intensity of the normal controls. If thvalue exceeded 1, this value was used as thfold increase; if the value was less than 1,the inverse was used as the fold decrease
To calculate the fold change for eachnormal control, the mean values werecalculated from the data for the other threcontrols to avoid underestimation. Geneswith similar expression patterns among thcloned individuals were clustered usingCluster 3.0, and the fold increase or de-crease was plotted in the gene orderresulting from the cluster analysis. Eachgraph represents the data from one clonedor normal individual (upper 12 panels; fouSertoli cell-derived clones, c1(s) to c4(s);four cumulus cell-derived clones, c5(c) toc8(c); and four normal controls, n1–n4). Ththree lower panels show the mean foldchanges for the Sertoli cell clones, thecumulus cell clones, and for all cloned
individuals. The red dots represent genes owhich expression levels exceeded a two-fold change in all of the individual clonesNote that the gene orders among liver (A)kidney (B) and brain (C) differ because thgene clustering was carried out indepen-dently.
ABERRANT GENE EXPRESSION IN CLONED MICE 130

8/3/2019 Takashi Kohda et al- Variation in Gene Expression and Aberrantly Regulated Chromosome Regions in Cloned Mice
http://slidepdf.com/reader/full/takashi-kohda-et-al-variation-in-gene-expression-and-aberrantly-regulated 3/10
software. The signals were normalized using the qspline algorithm imple-mented in the Bioconductor package of the statistics program R [15]. Genes
with similar expression profiles were clustered and displayed using Cluster 3.0and Java TreeView, originally developed by Eisen et al. [16]. The data from the
individual microarrays are accessible for download through the National Center for Biotechnology Information’s Gene Expression Omnibus (http://www.ncbi.nlm.nih.gov/geo/) via series accession number GSE3128.
QuantitativeReverseTranscription-PolymeraseChain Reaction
Genomic DNA and total RNA were prepared from neonatal tissues of the
Sertoli cell- and cumulus cell-derived clones and from normal controls using
ISOGEN (Nippon Gene), as described previously [17]. All RNA samples weretreated with RNase-free DNase I. The cDNA was synthesized from 1 lg totalRNA using Superscript II reverse transcriptase (Life Technologies) with anoligo(dT) primer. For reverse transcription-polymerase chain reaction (RT-PCR), 1 ng cDNA in a 100-ll reaction mixture containing 13 ExTaq buffer (TaKaRa), 2.5 mM dNTP mixture, primers, and 2.5 U ExTaq enzyme(TaKaRa) was subjected to 30 PCR cycles at 968C for 15 sec, 658C for 30 sec,and 728C for 30 sec on a Perkin Elmer GeneAmp PCR system 9600. Target
TABLE 1. The numbers of genes exhibiting increased or decreased expression levels in each clone and control individual.
Tissue c1(s) c2(s) c3(s) c4(s) c5(c) c6(c) c7(c) c8(c) n1 n2 n3 n4
LiverUpa 275 441 195 697 913 791 316 287 45 19 21 10Downb 191 565 224 911 1159 771 316 236 29 145 51 23Changedc 466 1006 419 1608 2072 1562 632 523 74 164 72 33
KidneyUpa 188 246 298 414 235 839 95 207 4 21 3 51Downb 52 154 560 568 357 929 124 202 77 138 93 81
Changedc
240 400 858 982 592 1768 219 409 81 159 96 132Brain
Upa 231 699 1101 817 883 918 240 22 5 7 110 94Downb 263 882 1186 1099 1191 1184 250 188 147 95 119 95Changedc 494 1581 2287 1916 2074 2102 490 210 152 102 229 189
Totald
Upa 666 1232 1410 1621 1590 2063 589 471Downb 468 1356 1583 1884 1826 2105 642 470Changedc 1134 2588 2993 3505 3416 4168 1231 941
a Upregulated by at least two-fold.b Downregulated to less than half.c The sum of the numbers of up- and downregulated genes.d The sum of the number of genes with altered expression in the three tissues, without duplicates.
TABLE 2. The numbers of genes in each of the donor cell types exhibitinga two-fold or greater difference in mean expression level that wassignificantly different from the controls.a
Tissue
Sertoli clone-
specific
Cumulus clone-
specific
Sertoli and
cumulus clones
LiverUp 119 154 54Down 121 128 99Changed 240 282 153
KidneyUp 169 58 20Down 80 69 26Changed 249 127 46
BrainUp 16 24 1Down 23 27 4Changed 39 51 5
Liver and kidneyUp 5 4 0Down 4 10 2
Changed 9 14 2Kidney and liver
Up 1 1 0Down 0 0 0Changed 1 1 0
Brain and liverUp 3 3 1Down 0 0 0Changed 3 3 1
Liver, kidney, and brainUp 0 0 0Down 1 1 1Changed 1 1 1
a Differences were tested using Student t -test (P , 0.05). The numbers of genes with altered expression levels in all tissues are also shown.
TABLE 3. Genes exhibiting increased expression levels in the kidneys of Sertoli cell-derived clones.
Gene nameAverage fold change
in Sertoli cloneAverage fold change
in cumulus clone
Fgg 12.65 1.07 Alb1 11.37 0.36 Apoa2 10.69 1.56
Trf 9.33 0.91Vtn 8.91 1.09
Ahsg 8.72 0.53Fga 7.57 2.33
Apoa1 7.31 0.59Serpina1d 6.41 1.36Rbp4 6.41 2.02Fetub 6.38 1.37Fgb 6.31 0.58Bhmt 6.08 1.65Sedrpina1a 5.97 0.85Serpinc1 5.50 0.47Hp 4.97 1.40Itih3 4.93 0.79
Ambp 4.67 1.28Serpina1e 4.06 0.73Fabp1 3.89 0.36
Pon1 3.54 1.12Vnn3 3.52 1.31Serpina3n 3.29 2.19NM_015779 3.16 0.96
Apoc4 3.13 0.68Itih1 3.07 0.89Tmod1 2.87 0.93Ttr 2.85 1.73Serpina1b 2.72 1.24Uox 2.69 0.83Mug1 2.53 0.95
Asgr1 2.49 0.98Rhced 2.46 0.94Lrg 2.29 2.64Hpxn 2.24 0.90
1304 KOHDA ET AL.
8/3/2019 Takashi Kohda et al- Variation in Gene Expression and Aberrantly Regulated Chromosome Regions in Cloned Mice
http://slidepdf.com/reader/full/takashi-kohda-et-al-variation-in-gene-expression-and-aberrantly-regulated 4/10
cDNA fragments were cloned into plasmids to use as standards in the
quantitative analysis of gene expression. The primers used for quantification
were Alb1-F, 50-TCA GAG ACT GCC TTG TGT GG-30; Alb1-R, 50-CAGCCT TGC AAC ATG TAT CC-30; Trf -F, 50-GTC CTG GAT AAC ACC GAAGG-30; Trf -R, 50-ACA GAT TGC ATG TAC TCC GC-30; Ahsg-F, 50-ATA
GCC ACC ACT GAA GCT GG-3 0; Ahsg-R, 50-TGA AGA TTG GCA AGA
GCA CC-30; Actb-F, 50-AAG TGT GAC GTT GAC ATC CG-3 0; and Actb-R,50-GAT CCA CAT CTG CTG GAA GG-30. The gene expression levels weremeasured using an ABI PRISM 7700 detection system and SYBR Green PCR
Core Reagents (Applied Biosystems). No amplification of RT-PCR productswas detected in the reverse transcriptase-minus controls.
RESULTS
Using DNA microarrays, we analyzed the gene expressionprofiles of the liver, kidney, and brain tissues of four neonatalclones derived from immature Sertoli cells, four neonatalclones derived from cumulus cells, and four neonatal normalcontrol mice produced by in vitro fertilization. Figure 1Aillustrates the gene expression profiles of the liver for eachindividual. The fold change in the expression level of eachgene in each animal was calculated relative to the meanexpression level of the corresponding gene in the four normalcontrol individuals. The results were plotted in the gene order derived from the cluster analysis of the expressed genes in themicroarray. It was apparent that, in the normal controls, theexpression of all genes was tightly regulated within a factor of two (as indicated by the horizontal lines in each panel of Fig.1A) for each individual. Therefore, the overall pattern of geneexpression was uniform, with little divergence among thenormal control individuals (Fig. 1A, right panels). In contrast,
in the clones derived from Sertoli (Fig. 1A, left panels) an
cumulus (Fig. 1A, middle panels) cells, many genes werexpressed abnormally in each clone, and the gene expressioprofiles were divergent among the cloned individuals. In aclones, between 4% and 20% (419-2072 of the 10 012 genes ithe microarray) of the genes exhibited a more than two-folincrease or decrease in signal intensity compared with the meaexpression level in the controls (Table 1). The extent oabnormal gene expression in the kidney and brain was similato that in the liver (2–20%; Table 1 and Fig. 1, B and C).
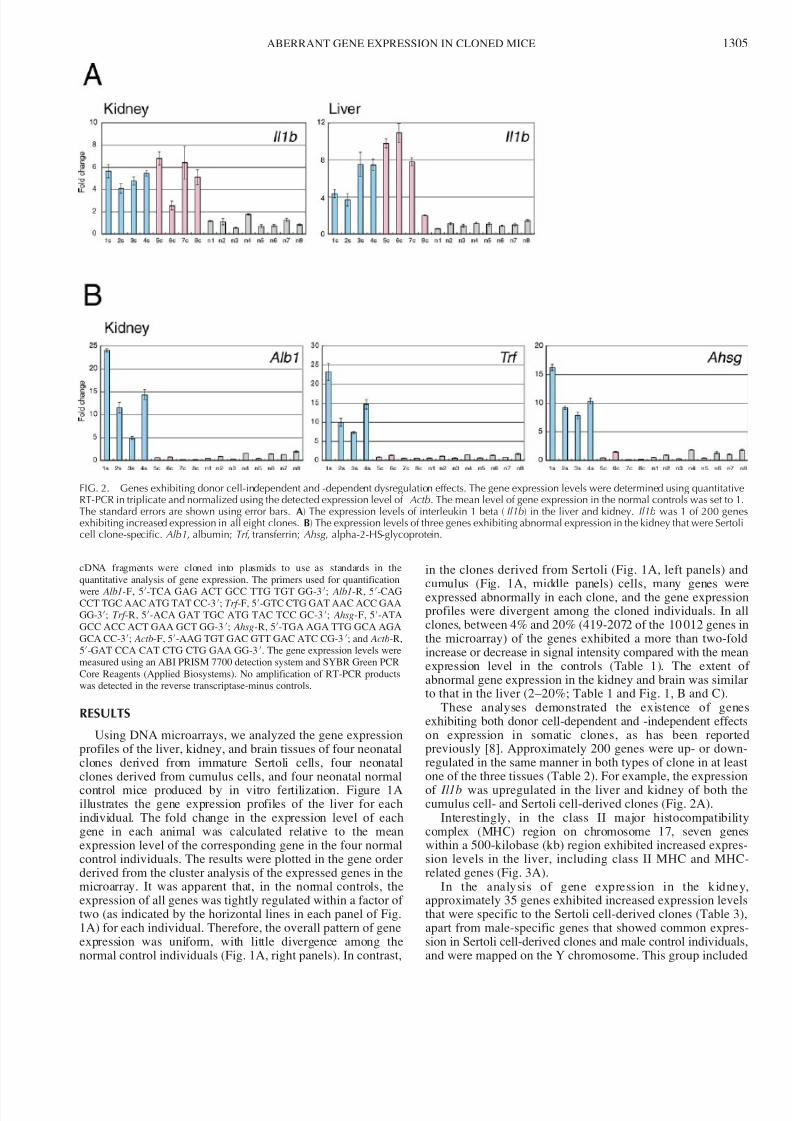
These analyses demonstrated the existence of geneexhibiting both donor cell-dependent and -independent effecton expression in somatic clones, as has been reportepreviously [8]. Approximately 200 genes were up- or downregulated in the same manner in both types of clone in at leasone of the three tissues (Table 2). For example, the expressioof Il1b was upregulated in the liver and kidney of both thcumulus cell- and Sertoli cell-derived clones (Fig. 2A).
Interestingly, in the class II major histocompatibilitcomplex (MHC) region on chromosome 17, seven genewithin a 500-kilobase (kb) region exhibited increased expression levels in the liver, including class II MHC and MHCrelated genes (Fig. 3A).
In the analysis of gene expression in the kidneyapproximately 35 genes exhibited increased expression levelthat were specific to the Sertoli cell-derived clones (Table 3)apart from male-specific genes that showed common expression in Sertoli cell-derived clones and male control individualand were mapped on the Y chromosome. This group include
FIG. 2. Genes exhibiting donor cell-independent and -dependent dysregulation effects. The gene expression levels were determined using quantitativRT-PCR in triplicate and normalized using the detected expression level of Actb. The mean level of gene expression in the normal controls was set to 1The standard errors are shown using error bars. A) The expression levels of interleukin 1 beta ( Il1b) in the liver and kidney. Il1b was 1 of 200 geneexhibiting increased expression in all eight clones. B) The expression levels of three genes exhibiting abnormal expression in the kidney that were Sertocell clone-specific. Alb1, albumin; Trf , transferrin; Ahsg , alpha-2-HS-glycoprotein.
ABERRANT GENE EXPRESSION IN CLONED MICE 130

8/3/2019 Takashi Kohda et al- Variation in Gene Expression and Aberrantly Regulated Chromosome Regions in Cloned Mice
http://slidepdf.com/reader/full/takashi-kohda-et-al-variation-in-gene-expression-and-aberrantly-regulated 5/10
markers of the acute phase of inflammation, such as Trf , Alb1, Ahsg, Hp, Serpina1a, Serpina1d , and Serpina1e. Semiquanti-tative RT-PCR confirmed that the expression of Trf , Alb1, and Ahsg was increased 5- to 25-fold in the kidneys of Sertoli cell-derived clones compared with the normal controls (Fig. 2B).The microarray signal intensities for these genes were morethan 50 times greater in the liver samples compared with brain
and kidney samples (data not shown), indicating that theexpression of these genes is highly tissue specific and may beunder the control of a common gene regulatory mechanism.We found that the genes showing upregulation in a Sertoli-clone-specific manner also formed clusters in three chromo-some regions, including apolipoproteins ( Apoc2, Apoc4, Apoc1), fibrinogens ( Fgg, Fga, Fgb), and serine protease
FIG. 3. Chromosome regions containing multiple upregulated genes in cloned mice. The physical maps of the genes were drawn using the mousegenome sequence assembly coordinates from NCBI Build 33, version 1. Black and gray arrows represent genes with and without expression profiles,respectively. The lack of expression profiles for some genes was the result of the absence of a probe in the DNA microarray or expression levels below thedetection threshold. The gray background in the genome maps indicates regions outside the hypothesized area of coregulation. Scale bars ¼ 100 kb. Thegene expression profiles are charted as follows. The fold changes in gene expression were calculated from the signal intensities on the microarrays,normalized to the mean value of the controls. Panels with a white background represent the profiles of coregulated genes, while panels with a graybackground represent the profiles of genes adjacent to the coregulated gene clusters. A) Chromosome region containing the class II MHC gene cluster. B)Chromosome regions containing the fibrinogen, apolipoprotein, and serine protease inhibitor gene clusters.
1306 KOHDA ET AL.
8/3/2019 Takashi Kohda et al- Variation in Gene Expression and Aberrantly Regulated Chromosome Regions in Cloned Mice
http://slidepdf.com/reader/full/takashi-kohda-et-al-variation-in-gene-expression-and-aberrantly-regulated 6/10
inhibitors (Serpina1b, Serpina1d , Serpina1a, Serpina1e; Fig.
3B).
The large difference between the total number of aberrantly
expressed genes and the number of genes exhibiting aberrant
expression in all individual clones indicated that mean
expression levels did not represent the real expression profiles
of individual somatic cell clones. Therefore, another analytical
method is needed to define the genetic character of cloned
individuals more precisely. Closer examination of the data
revealed that the number of genes showing increased or
decreased expression differed among the cloned individuals
(Table 1 and Fig. 1), suggesting that the extent of the initia
perturbation on the affected chromosome regions and th
extent of the abnormalities caused by nuclear transfer differe
among cloned individuals.
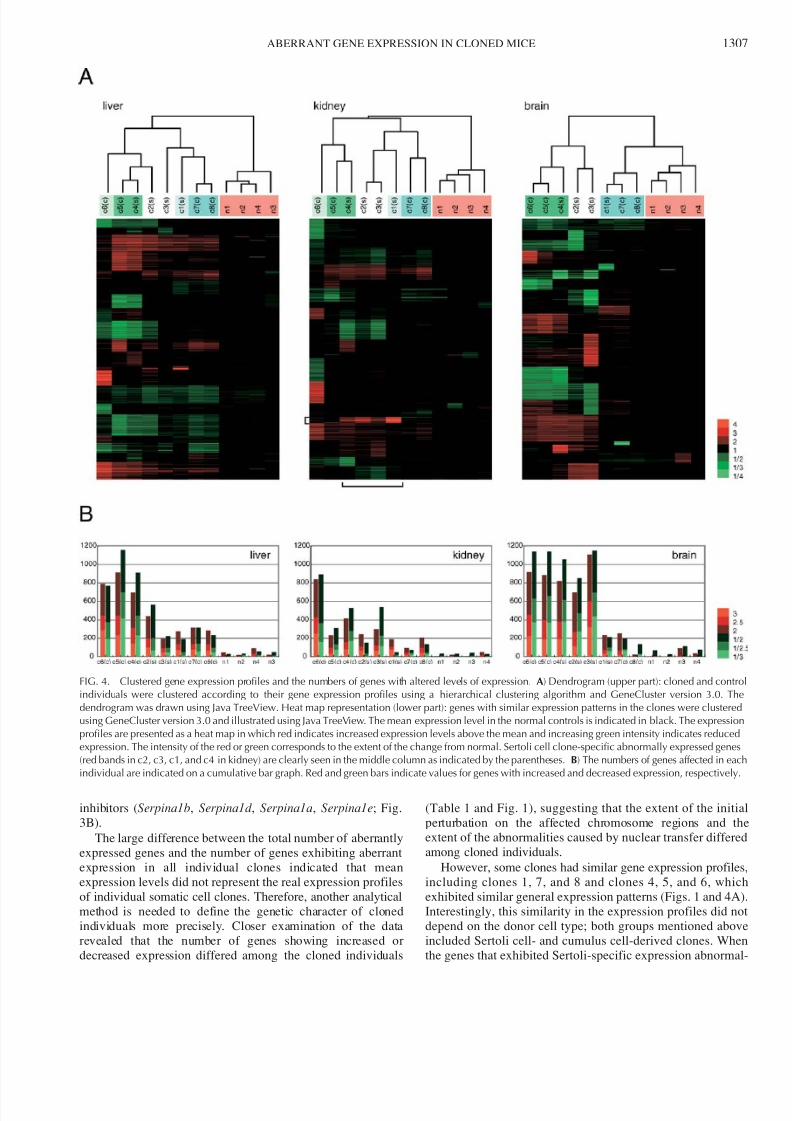
However, some clones had similar gene expression profiles
including clones 1, 7, and 8 and clones 4, 5, and 6, whic
exhibited similar general expression patterns (Figs. 1 and 4A
Interestingly, this similarity in the expression profiles did no
depend on the donor cell type; both groups mentioned abov
included Sertoli cell- and cumulus cell-derived clones. Whe
the genes that exhibited Sertoli-specific expression abnorma
FIG. 4. Clustered gene expression profiles and the numbers of genes with altered levels of expression. A) Dendrogram (upper part): cloned and controindividuals were clustered according to their gene expression profiles using a hierarchical clustering algorithm and GeneCluster version 3.0. Thdendrogram was drawn using Java TreeView. Heat map representation (lower part): genes with similar expression patterns in the clones were clustereusing GeneCluster version 3.0 and illustrated using Java TreeView. The mean expression level in the normal controls is indicated in black. The expressioprofiles are presented as a heat map in which red indicates increased expression levels above the mean and increasing green intensity indicates reducedexpression. The intensity of the red or green corresponds to the extent of the change from normal. Sertoli cell clone-specific abnormally expressed gene(red bands in c2, c3, c1, and c4 in kidney) are clearly seen in the middle column as indicated by the parentheses. B) The numbers of genes affected in eacindividual are indicated on a cumulative bar graph. Red and green bars indicate values for genes with increased and decreased expression, respectively
ABERRANT GENE EXPRESSION IN CLONED MICE 130

8/3/2019 Takashi Kohda et al- Variation in Gene Expression and Aberrantly Regulated Chromosome Regions in Cloned Mice
http://slidepdf.com/reader/full/takashi-kohda-et-al-variation-in-gene-expression-and-aberrantly-regulated 7/10
ities in the kidney were excluded, comparable pattern
similarities were also observed for the expression profiles in
the brain and kidney. The two groups corresponded to the
individuals exhibiting fewer gene expression abnormalities (9–
12%) and to those exhibiting many abnormalities (34–41%;
Table 1 and Fig. 4). These results suggest that the susceptibilityof genes to dysregulation caused by somatic cloning varies in
a nonrandom manner.
FIG. 5. Chromosome regions containing genes with related functions or structures that were coregulated in the clones. The physical maps of the genesand the gene expression profiles are as shown in Figure 3. Scale bars ¼ 100 kb. As shown in Figure 4B, each clone individual showed increased ordecreased expression by more than a factor of two in 2–10% of genes. Assuming that the gene expression of all clones was affected independently, theprobability of a nearest neighbor gene showing the same pattern of aberrant gene expression in at least three clone individuals is less than 10 À3 to 10À6.Therefore, the gene clusters observed here are significant.
1308 KOHDA ET AL.

8/3/2019 Takashi Kohda et al- Variation in Gene Expression and Aberrantly Regulated Chromosome Regions in Cloned Mice
http://slidepdf.com/reader/full/takashi-kohda-et-al-variation-in-gene-expression-and-aberrantly-regulated 8/10
FIG. 6. Chromosome regions con-taining genes that were coregulated inthe clones, including gene(s) withnonrelated function(s). The physicalmaps ofthe genes and the geneexpression profiles are as shown inFigure 3 and Supplementary Figure 5(available online at http://www.biolreprod.org).
ABERRANT GENE EXPRESSION IN CLONED MICE 130

8/3/2019 Takashi Kohda et al- Variation in Gene Expression and Aberrantly Regulated Chromosome Regions in Cloned Mice
http://slidepdf.com/reader/full/takashi-kohda-et-al-variation-in-gene-expression-and-aberrantly-regulated 9/10
Next, we clustered the genes into 20 groups and assignedgroup numbers using k -means clustering with nonparametricanalysis of similarities according to the expression patternamong cloned and control individuals in each tissue, aspresented in Figure 4. Then, the assigned group numbers werealigned along the mouse genome according to their gene order using assembled mouse genome sequences (NCBI mouse build33) so that regions with the same assigned numbers could beabstracted automatically. Finally, we checked the gene
expression pattern of each gene in these regions manually, indetail, and confirmed that genes with similar patterns of variedexpression were clustered. Twenty-one such gene clustersconsisting of three or more neighboring genes (Figs. 5 and 6)and more than 70 gene pairs (Supplementary Table, availableonline at http://www.biolreprod.org) were identified in thegenome, in addition to the genes that showed aberrant expression in all clones (described above; Figs. 2 and 3). Thisanalysis revealed that gene expression is regulated abnormallyin clusters within many chromosome regions of somatic clonesand that the dysregulating effect of somatic cloning sometimesinfluences genes within one to several hundred kilobases in thegenome.
Approximately half of these clusters consisted of genes with
similar functions (Fig. 5), while the other half contained geneswith no functional or structural similarities (Fig. 6). Coregu-lation in the former clusters may arise from the abnormalexpression of common upstream regulatory genes. In contrast,coregulation of the nonrelated gene clusters implies thepresence of functional chromosome domains for regional generegulation and perturbation of these regulatory systems bysomatic cell cloning.
Note that cluster analysis based on variation in geneexpression was useful for identifying abnormalities in severalmetabolic pathways of the clones. We found that genes in someimportant pathways, including glycolysis, heme synthesis, andsteroid synthesis, were aberrantly coregulated in individualcloned mice (Supplementary Figs. 1–3, available online at http://www.biolreprod.org).
DISCUSSION
Our data demonstrated a general disturbance of geneexpression in cloned mice from somatic cells that includeddysregulation associated with the donor cell type, as well asdysregulation inherent to cloning; whereas a few genes wereconsistently affected in all clones, many genes showedvariation in gene expression among the clones. Unexpectedly,normal-appearing mice cloned from somatic cells had a largenumber of affected genes compared with normal controls, andthe expression profiles differed among the cloned individualsdespite their identical genotypes and normal appearance. Thiswas in marked contrast with the observations in the offspring of the control produced by in vitro fertilization, which exhibitedhomogeneous, strictly regulated gene-expression profiles. Most cloned individuals die before developing to term: the birth rateof mice cloned using somatic cells is only 2–5%. Therefore, theclones we analyzed represented selected individuals, and thenumber of genes affected was likely the minimum number that met all essential conditions for survival and development, i.e.,the changes in gene expression observed here fell within thetolerance levels of mouse development and subsequent growth.
As shown in Figures 2 and 3, the abnormally expressedgenes in the neonatal cloned mice included many genesassociated with the immune system, including cytokines,specific markers of immune system cells, such as histocom-patibility antigens, and markers of inflammation. Although we
did not assess the impact of this variation in gene expression onthe physiology or life span of the clones [14], theseabnormalities may represent a disturbance of the immunesystem, as reported for other clones [18].
Our data clearly demonstrated major disturbances of geneexpression in cloned animals, including effects that wereinherent to cloning (donor cell-independent) and donor cell-dependent effects. Note that these common effects accountedfor only a small portion of the affected genes; the remaining
abnormally expressed genes showed wide variation across theindividual somatic clones. One important consequence of thisvariation is that the calculation and comparison of meanexpression levels tend to mask many of the gene expressionabnormalities in each individual. Genes that were expressedabnormally in all of the individual Sertoli cell- or cumulus cell-derived clones accounted for only 0.4% or 4% of the totalexamined genes, respectively (red dots in the lower panels of Fig. 1, A–C, and Table 2). These values were consistent withthose in a previous report, which found that less than 0.1% of the genes in the liver of neonatal clones derived from cumulusor embryonic stem cells showed expression levels that differedby more than two-fold [8].
The large variation in gene expression among individualsmay be attributable to initial errors in the reprogrammingprocess after nuclear transfer or may simply represent anabnormal epigenetic state that arises in the donor cells despiteavoiding in vitro culture steps in their preparation. In either case, the first event affects target genes at random and mayinduce many secondary effects and ultimately lead to genome-wide, multilayered, mosaic abnormalities in somatically de-rived clones. In this respect, applications of nuclear transfer tohuman or veterinary medicine, such as therapeutic cloning,have serious limitations at present.
Recently, extensive evidence has accumulated for theclustering of coexpressed genes in mammalian genomes. Theimportance of the hierarchical architecture of epigeneticregulation that partitions the mammalian genome functionally,including very large domains such as isochors, as well as
relatively small chromosomal domains of several hundredkilobase pairs, has now been recognized [19]. However,detailed, genome-wide surveys of gene regulation in thesechromosome regions have not yet been reported for mamma-lian systems. The abnormal expression patterns observed insome gene clusters in this study may represent disturbances of a regionally regulated architecture of the chromosome. Thegene expression variation-based cluster analysis used in thisstudy may be generally applicable to the classification of genesthat are coordinately regulated in the mammalian genome bypermitting systematic analysis of apparently random biologicalphenomena that have previously been difficult to study.
REFERENCES
1. Humpherys D, Eggan K, Akutsu H, Hochedlinger K, Rideout WM III,Biniszkiewicz D, Yanagimachi R, Jaenisch R. Epigenetic instability in EScells and cloned mice. Science 2001; 293:95–97.
2. Rideout WM, Eggan K, Jaenisch R. Nuclear cloning and epigeneticreprogramming of the genome. Science 2001; 293:1093–1098.
3. Ohta H, Wakayama T. Generation of normal progeny by intracytoplasmicsperm injection following grafting of testicular tissue from cloned micethat died postnatally. Biol Reprod 2005; 73:390–395.
4. Wakayama T, Perry AC, Zuccotti M, Johnson KR, Yanagimachi R. Full-term development of mice from enucleated oocytes injected with cumuluscell nuclei. Nature 1998; 394:369–374.
5. Ogura A, Inoue K, Ogonuki N, Noguchi A, Takano K, Nagano R, SuzukiO, Lee J, Ishino F, Matsuda J. Production of male cloned mice from fresh,cultured, and cryopreserved immature Sertoli cells. Biol Reprod 2000; 62:1579–1584.
6. Inoue K, Kohda T, Lee J, Ogonuki N, Mochida K, Noguchi Y, Tanemura
1310 KOHDA ET AL.

8/3/2019 Takashi Kohda et al- Variation in Gene Expression and Aberrantly Regulated Chromosome Regions in Cloned Mice
http://slidepdf.com/reader/full/takashi-kohda-et-al-variation-in-gene-expression-and-aberrantly-regulated 10/10
K, Kaneko-Ishino T, Ishino F, Ogura A. Faithful expression of imprintedgenes in cloned mice. Science 2002; 295:297.
7. Ogura A, Inoue K, Ogonuki N, Lee J, Kohda T, Ishino F. Phenotypiceffects of somatic cell cloning in the mouse. Cloning Stem Cells 2002; 4:397–405.
8. Humpherys D, Eggan K, Akutsu H, Friedman A, Hochedlinger K,Yanagimachi R, Lander ES, Golub TR, Jaenisch R. Abnormal geneexpression in cloned mice derived from embryonic stem cell and cumuluscell nuclei. Proc Natl Acad Sci U S A 2002; 99:12889–12894.
9. Bortvin A, Eggan K, Skaletsky H, Akutsu H, Berry DL, Yanagimachi R,Page DC, Jaenisch R. Incomplete reactivation of Oct4-related genes in
mouse embryos cloned from somatic nuclei. Development 2003; 130:1673–1680.
10. Suemizu H, Aiba K, Yoshikawa T, Sharov AA, Shimozawa N, TamaokiN, Ko MS. Expression profiling of placentomegaly associated withnuclear transplantation of mouse ES cells. Dev Biol 2003; 253:36–53.
11. Singh U, Fohn L, Wakayama T, Ohgane J, Steinhoff C, Lipkowitz B,Schulz R, Orth A, Ropers H, Behringer R, Tanaka S, Shiota K, et al.Different molecular mechanisms underlie placental overgrowth pheno-types caused by interspecies hybridization, cloning, and Esx1 mutation.Dev Dyn 2004; 230:149–164.
12. Ohgane J, Wakayama T, Kogo Y, Senda S, Hattori N, Tanaka S,Yanagimachi R, Shiota K. DNA methylation variation in cloned mice.Genesis 2001; 30:45–50.
13. Tamashiro K, Wakayama T, Akutsu H, Yamazaki Y, Lachey J, Wortma
M, Seeley R, D’Alessio D, Woods S, Yanagimachi R, Sakai R. Clone
mice have an obese phenotype not transmitted to their offspring. Nat Me
2002; 8:262–267.
14. Ogonuki N, Inoue K, Yamamoto Y, Noguchi Y, Tanemura K, Suzuki O
Nakayama H, Doi K, Ohtomo Y, Satoh M, Nishida A, Ogura A. Earl
death of mice cloned from somatic cells. Nat Genet 2002; 30:253–254.
15. Gentleman R, Carey V, Bates D, Bolstad B, Dettling M, Dudoit S, Ellis B
Gautier L, Ge Y, Gentry J, Hornik K, Hothorn T, et al. Bioconductor: ope
software development for computational biology and bioinformatic
Genome Biol 2004; 5:R80.16. Eisen M, Spellman P, Brown P, Botstein D. Cluster analysis and display
genome-wide expression patterns. Proc Natl Acad Sci U S A 1998; 95
14863–14868.
17. Kaneko-Ishino T, Kuroiwa Y, Miyoshi N, Kohda T, Suzuki R, Yokoyam
M, Viville S, Barton SC, Ishino F, Surani MA. Peg1/Mest imprinted gen
on chromosome 6 identified by cDNA subtraction hybridization. N
Genet 1995; 11:52–59.
18. Renard JP, Chastant S, Chesne P, Richard C, Marchal J, Cordonnier N
Chavatte P, Vignon X. Lymphoid hypoplasia and somatic cloning. Lance
1999; 353:1489–1491.
19. Hurst L, Pal C, Lercher M. The evolutionary dynamics of eukaryotic gen
order. Nat Rev Genet 2004; 5:299–310.
ABERRANT GENE EXPRESSION IN CLONED MICE 131