tailored low consistency refining for targeted fiber
TRANSCRIPT

1
Tailored low consistency refining for targeted fiber properties
Master of Science Thesis
Md Riza Bin Taher
Supervisor: Jan Gustafsson
Laboratory of Natural Materials Technology
2
Preface
This Master of Science thesis has been written as a part of the Master’s Degree
Programme in Chemical Engineering at Abo Akademi, Finland. The experimental
part has been done in the Fiber Technology research group (part of Laboratory of
Natural Materials Technology), Gadolinia, under the supervision of Jan Gustafsson.
The idea of the Thesis topic has been generated by Jan Gustafsson. My heartiest
thanks go to Jan Gustafsson for being such a fantastic mentor and providing me with
such flexibility during my lab work. His guidance has made the entire completion
process much more comfortable and transparent.
I would also like to thank Tom Lundin for his amazing doctoral thesis on Low
consistency refining. This has been a pathfinder for my thesis writing, and his
knowledge as expressed in the thesis is both clear and vast, which has helped to
gain a clear understanding of the topic.
At last, I would like to show my respect to my workplace supervisor Andreea
Bejinariu for her continuous support and encouragement. She has been a blessing
for me by providing me with all the possible flexibility that has enabled the
completion of this thesis .
3
Abstract
The main aim of the study has been to analyze the impact of refining on the physical
and optical properties of paper sheets with respect to change in three refining
parameters. The three parameters that have been changed are the volumetric flow
rate of the feed during refining, fiber concentration in the feed, and pumping
direction in the refiner. In this study, three volumetric flow rates have been
maintained. These are 60 l/min, 100 l/min, and 120 l/min. Two pulp consistency
have been maintained, which are 2% and 4%. Bleached pine (softwood) kraft pulp was
used as raw material and refining was done through pumping and non-pumping
directions for all samples.
After collecting the samples at 50 kWh/t, 150 kWh/t, 200 kWh/t, and 250 kWh/t
SECCum, paper sheets were made, and properties were measured. Sheet thickness,
drainibility, air permeability, brightness, tensile strength, tear strength, water
retention value, amount of fines, fiber lengths were measured and analyzed.
After analyzing, it has been understood that refining intensity had a significant
impact on paper properties, but no significant changes have been observed in the
features due to the change in the refining parameters. Interestingly, properties such
as drainability, fines percentage, air permeability, and brightness for refining
samples that were controlled by stator and rotor gap instead of power control
showed changes in values . Further studies can be proposed to understand the
impact of gap-controlled refining on paper sheet properties.
4
Contents
1. Introduction …………………………………………………………………………………………………….1
1.1. Objective………………………………………………………………………………………………..2
1.2. Thesis outline………………………………………………………………………………………….2
2. Theory………………………………………………………………………………………………………………3
2.1. Fibers………………………………………………………………………………………………………3
2.2. Fiber structure…………………………………………………………………………………………4
2.3. Fiber raw material……………………………………………………………………………………6
2.4. Papermaking fiber sources……………………………………………………………………….7
3. Refining…………………………………………………………………………………………………………….8
3.1. LC Refining mechanism…………………………………………………………………………….8
3.2. Types of refiners……………………………………………………………………………………11
3.2.1. Conical designs…………………………………………………………………………….11
3.2.2. Cylindrical designs……………………………………………………………………….13
3.3. Types of bars…………………………………………………………………………………………13
3.4. Impact of refining in fibers…………………………………………………………………….16
3.5. Refining management…………………………………………………………………………..20
3.6. Impact of refining on physical and optical properties…………………………….22
5
4. Experimental ………………………………………………………………………………………………...27
4.1. Raw material………………………………………………………………………………………..27
4.2. Refining ……………………………………………………………………………………………….27
4.3. Pulp preparation………………………………………………………………………………….28
4.4. Process of refining…………………………………………………………………………….….28
4.5. Parameters……………………………………………………………………………………….….31
4.6. Sample prepared……………………………………………………………………………….…31
4.7. Sample analysis method………………………………………………………………………32
5. Results and discussion………………………………………………………………………………….…33
6. Conclusion………………………………………………………………………………………………………45
7. References………………………………………………………………………………………………………47

6
Abbrevations
LC- Low consistency
SEC- Specific energy consumption
SR- Schopper Riegler
HW- Hardwood
SW- Softwood
CTMP- Chemi thermo mechanical pulp
SEL- Specific energy load
NBSK- Non bleached softwood kraft
SECCum – Specific energy consumption commulative
WRV- Water retention value
1
1. Introduction
Fiber-related products are being used worldwide for various purposes, and the
demand has been decreasing day by day with the advancement of other materials
for uses, so the scientific challenges to improve the properties of fibers are
increasing. Much research is being carried out currently to develop a new quality of
fiber products by changing the features throughout the pulping and papermaking
process as well as the refining process. The production of the final paper-based
product starts from the raw material as wood chips. The whole process from wood
chips to the final product goes through many processes, which include mechanical
and chemical treatment. Refining is a mechanical treatment process for pulp that is
done to achieve the desired paper quality. By changing refining parameters such as
temperature, consistency, pulp type, raw material source, chemical treatment,
refining intensity, refiner stator, and rotor gap, pumping speed, type and structure of
refiner fillings can be altered. This change in fiber structure changes the properties of
final products. Colossal energy consumption is required for the total pulping
process, which is costly. One of the many scientific challenges has also been to find
out the balance between achieving the desired quality of paper product and cost
involved due to energy consumption.
The study aim was to optimize the fiber properties of wood fibers towards a
targeted application by using a treatment procedure known as low consistency
refining. In this study, the main focus has been analyzing the changes happening to
the properties of fibers due to the refining done by a conical segment refiner ProLab
at Abo Akademi University. During the refining, parameters such as pump speed,
the rotational direction of the rotor, and pulp consistency have been changed to
analyze the changes in fiber structures, their physical properties, and optical
properties.

2
Some of the changes in pulp due to refining are still not fully understood, as so
many complicated situations are responsible for a change in any properties of pulp.
1.1. Objective
The objectives of this thesis are to observe the refining actions carefully from mild to
harsh taking account of the fiber-fiber and fiber-bar interactions to evaluate out the
influence of volumetric flow or pumping speed variation at varying pulp
consistencies for softwood pulps and to asses the changes in fibers due to the
changes in refining parameters for enhanced understanding of the impact of low
consistency refining.
1.2. Thesis outline
This thesis analyzes tailored low consistency refining of softwood pulp (pine
bleached softwood kraft pulp) at varying pumping speed of 60 l/min, 100 l/min, and
120 l/min at both pumping and non-pumping rotor direction and pulp consistency of
2% and 4% has been performed. During the lab work Schopper Riegler (°SR)
Freeness, water retention, opacity, air permeability, tensile strength, tear strength
testing, fiber length and fines percentages have been analyzed for all samples to
discover the changes in fiber properties.
3
2. Theory
The theory part consists of the basic understanding of pulps and refining factors and
refining impact on fibers due to the refining. Low consistency refining of the pulp is
a complex process as many parameters are involved, which have effects on the
refining intensity and pattern.
2.1. Fibers
Wood fibers are different in dimensions and structure, depending on the type of
tree or plant. The cells living in the tree can be different depending on the main
functions and according to their role in the stem. The cells are tube-like structures,
and the wall thickness depends on the purpose, and the common goal is to provide
strength and storage of liquid and nutrition. Pits connect the cells. Softwood mainly
consists of cells called tracheids, which provide support and conduction and
parenchyma cells that work as storage. Softwoods comprise 90% tracheids and 5-10
% parenchyma cells. Hardwood consists of cells called tracheids and thick-walled
fibers that provide mechanical support and parenchayma that provides storage and
vessels works as conducting cells. Fibers are the cells that are dead and empty when
functional. Parenchymas are brick-like cells; tracheids are fibers that provide
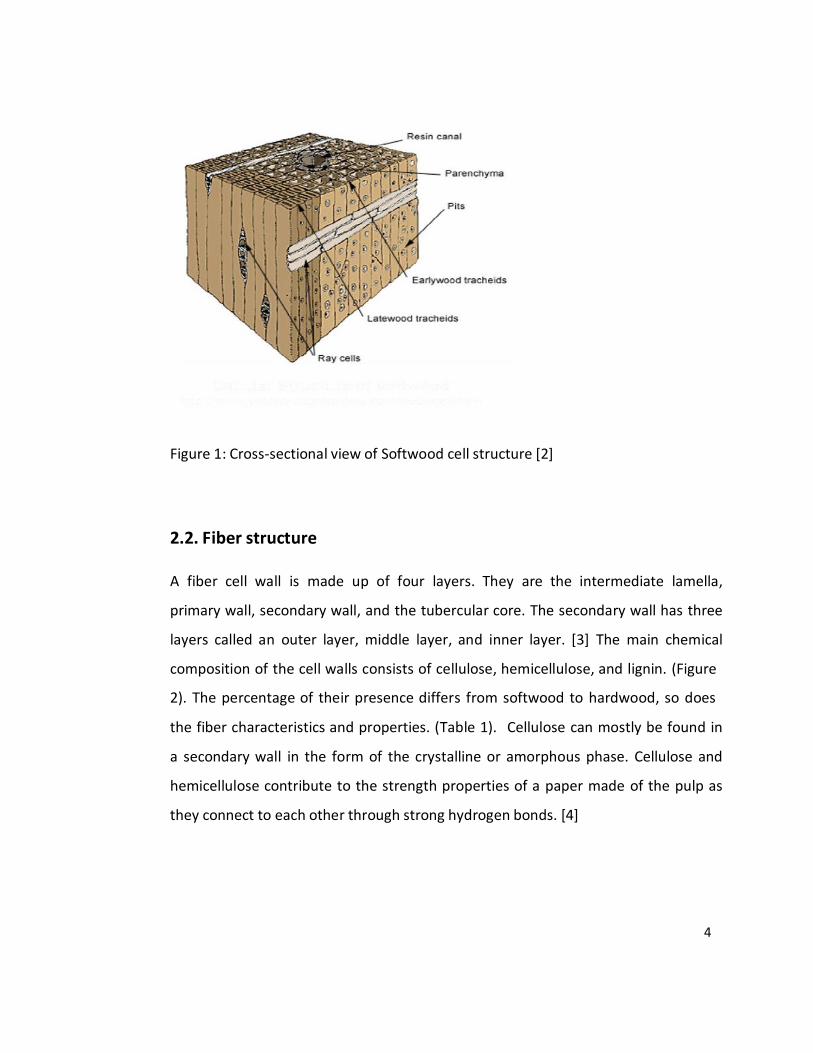
earlywood conduction and latewood support, whereas vessels are vertical tubes [1].
Hardwood has more complex structures compared to softwood (Figure
1).Hardwood has vassels or pores of different sixes, shapes and cell wall structure.
Softwood has s simpler cellular structure.Softwood only consists of tracheids and
parenchyma cells where as hardwood consists of fibers, cell, parenchyma and
vessels.
4
Figure 1: Cross-sectional view of Softwood cell structure [2]
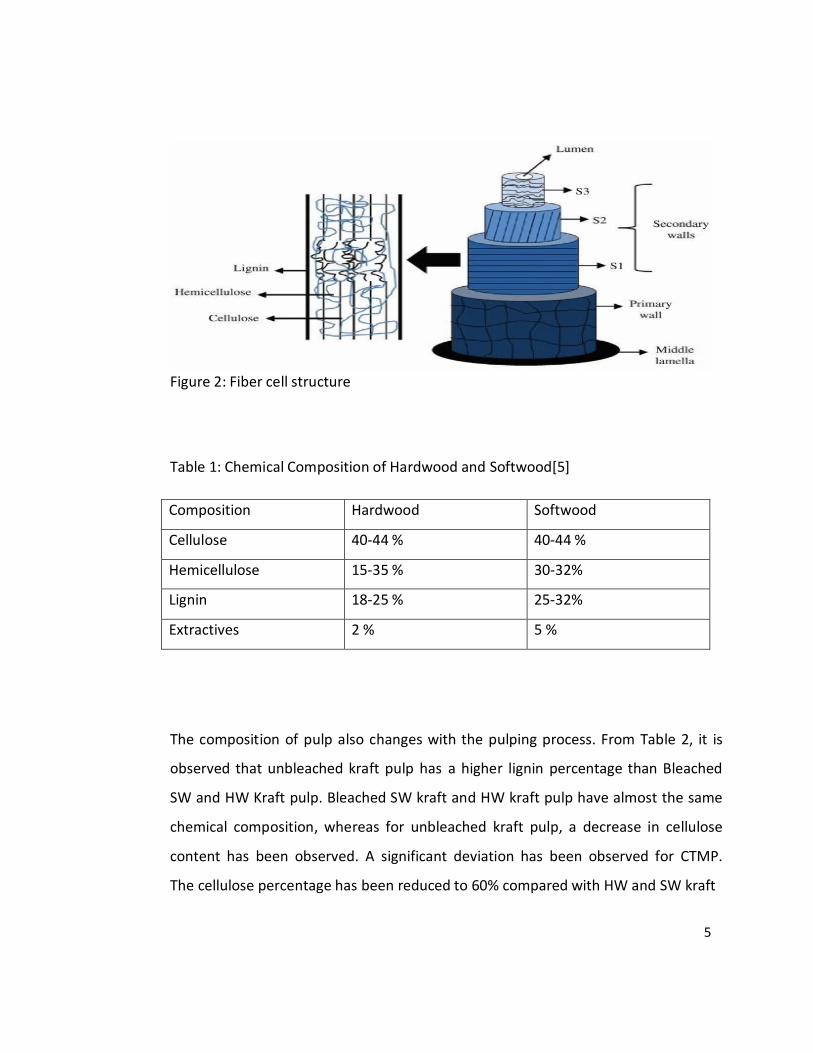
2.2. Fiber structure
A fiber cell wall is made up of four layers. They are the intermediate lamella,
primary wall, secondary wall, and the tubercular core. The secondary wall has three
layers called an outer layer, middle layer, and inner layer. [3] The main chemical
composition of the cell walls consists of cellulose, hemicellulose, and lignin. (Figure
2). The percentage of their presence differs from softwood to hardwood, so does
the fiber characteristics and properties. (Table 1). Cellulose can mostly be found in
a secondary wall in the form of the crystalline or amorphous phase. Cellulose and
hemicellulose contribute to the strength properties of a paper made of the pulp as
they connect to each other through strong hydrogen bonds. [4]
5
Figure 2: Fiber cell structure
Table 1: Chemical Composition of Hardwood and Softwood[5]
Composition Hardwood Softwood
Cellulose 40-44 % 40-44 %
Hemicellulose 15-35 % 30-32%
Lignin 18-25 % 25-32%
Extractives 2 % 5 %
The composition of pulp also changes with the pulping process. From Table 2, it is
observed that unbleached kraft pulp has a higher lignin percentage than Bleached
SW and HW Kraft pulp. Bleached SW kraft and HW kraft pulp have almost the same
chemical composition, whereas for unbleached kraft pulp, a decrease in cellulose
content has been observed. A significant deviation has been observed for CTMP.
The cellulose percentage has been reduced to 60% compared with HW and SW kraft
6
pulp. Fines amount has shown a doubled value compared to other pulps. There has
been no difference in water retention value with the variation of pulp types.
Depending on the required properties of the pulp, the treatment is performed.
Table 2: Variation in chemical and physical properties for types of the pulping
process[6]
2.3. Fiber raw material
Wood is the most common raw material used for fibers. Different types of wood
species are used as raw material for different types of pulp grades. Softwood is
mostly used as raw material when the desired output is a higher strength of papers,
whereas hardwoods are used for paper needed higher quality of printing properties.
[7]
Softwood has long and thick fibers with higher lignin content than hardwood, which
gives the pulp more tensile strength and flexibility, whereas hardwood has short
and thin fibers with a high density of fibers, resulting in excellent printing
properties, opacity, and strong absorption capability. [8]
7
For making paper-related products, mostly used softwoods are spruce, pine
redwood, douglas, birch, and most used hardwoods are beech, balsa, maple and
oak. [9]
2.4. Papermaking fiber sources
Fibers used to make paper products are used depending on the availability of the
raw materials in that geographical region. In 2013, a total of 403 million tons of
paper were produced in total. Approximately 51% of the total paper production was
used for packaging materials, whereas 33% was used for writing purposes. In 2018,
the amount of paper consumed was 423 million tons. Out of the total amount, 55%
was used for packing materials and 26% for writing purposes. [10]
In 2016, the majority of the world’s entire paper was produced in Asia, secondly in
Europe. Germany was leading with a supply of one-fourth of the aggregate demand,
whereas Finland and Sweden combined supplied one fourth (Figure 3).
France
9%
Italy 10%
Finland 11%
Others 34%
Germany 25%
Sweden 11%
Figure 3: Paper and board production by country in Europe 2016[11]
8
3. Refining
Refining is a treatment process used for pulps to bring changes in the properties of
papers depending on the desired paper quality. In the early days, refining was done
by beating pulp with a stick in the early days. At that time, the beater that was used
was called Hollander beaters before the refining process came into play effectively.
As a result of refining process of pulp, the fiber bonding properties improves, so
does the smoothness and printing properties depend on the extent of the refining
process. When the intensity of refining is increased, more fibrils are formed, which
causes increased features of papers such as opacity, absorbance quality, and
porosity [12].
A significant amount of energy is consumed for refining purposes in the paper
industry. Also, it should be mentioned that not all energy consumed by a refiner is
required for fiber treatment. The rotor of the refiner dissipates approximately 20%
of the total energy consumed by a refiner. [13]
3.1. LC Refining mechanism
Low consistency refining is implemented using fibers diluted in water (2-7%
consistency). LC refining is used to save energy expenses due to low energy
consumption and has a good effect on low-quality fibers. The fiber-water solution is
treated in the refiner between metallic bars. The solution enters between the
rotating rotor and stationary rotor filling, where the fiber floc is compressed by the
pressure created by the leading edge of the stator bar and rotor bar. How much
pressure it will build on the pulp suspension depends on the gap clearance. The
refining continues between both rotors by the bars between them. The impact of
refining depends on the width of the bars of rotors and also the angle of bars. The
width in the grooves is vital for better refining percentages of fibers. During the
9
movement of the rotor bar from the static bar, vortex flows strongly in the grooves;
this helps the fibers to be stapled on bar edges, increasing the percentage of
fibrillation. Refining also has an impact on the straightening of the fibers, creates a
compressed portion of fibers, kinks, and nodes. Moreover, if the grooves are too
narrow, then the fibers get shucked in the groves and leave the refiner without
refining [14].
During the refining, when fibers flow between the two bars, preliminary dewatering
happens up to 15-30 %. Then, the mechanical pressure of 6.9-34.5 MPa applies to
the fiber flow, which causes water expulsion of 50% approximately. Then the sliding
wads get under pressure (Figure 4). Afterward, while the moving bar starts moving
from the stator bar, mechanical pressure starts releasing, and water reabsorption
starts. At last, dispersion happens, and wad gets ready for the next refining cycle
[15].
10
Figure 4: Refining mechanism between stator and rotor bars[16]
Different types of forces are observed in fibers due to bar pressure in refining. The
fibers experiences three directional forces. Due to the movement mechanism of the
rotor from the stator, normal force, shear force, and edge force applies in a fiber
causing the fibrillation and compression(Figure 5).
Figure 5: Refining impact on fibers between stator and rotor bars [17]

11
3.2. Types of Refiners
Various kinds of refiners are used for pulp tailoring. The three designs are Conical
desins, cylindrical designs and disk designs.
3.2.1. Conical Designs
The conical designs refer to the conical shape rotor filling that is fixed with the
refining motor and a stator filling. The gap between the rotor and stator impacts the
refining intensity. In the time of the invention, the conical refiners were expensive
as high energy was required and was not able to cope up with the capacity of
refining needed by the paper mills. This design was best applicable for refining pulp
with higher length of fibers, which became a significant issue for the pulp companies
when short length of hardwood fibers came into play and which required dense
refining [18].
OptiFiner Conical Refiner
OptiFiner conical refiner is a current technology developed by Valmet, Finland
(Figure 6). The most significant of this refiner is the precisely controlled gap
clearance between stator and rotor, which provides precise refining of pulp. This
refining unit has a high refining zone, and the flow pattern of pulp suspension
ensures more fiber to bars interaction providing high refining intensity. This design
offers a wide range of filling patterns. Through this refining process, higher
printability quality, uniform refining, a better solution for frequent web breaks a nd
better machine run ability are ensured. This refining process is famous for lower
energy consumption and lower maintenance cost. The top-notch parameter control
system and high-end automation have been the main improvements seen in the
OptiFiner refiner. In this refiner, a newly developed sealing has been used. As the
breaking of sealing is a common problem in refiners, which leads to less efficiency

12
and high cost of refining, this sealing provides long life service. This sealing
mechanism provides high efficiency for refiners, where sealing water is difficult to
manage [19].
Figure 6: Cross sectional view of OptiFiner Refiner
Jordan Mill
Jordan refiners are typically used for softwood refining. This refiner was the first
conical refiner that was built after the beater concept. The stator and rotor of the
refining were set to an 11-16 degree angle. One offset was changing the fillings of
the refiner as the refiner shaft had two bearings on each side, which made it time-
consuming [20].
Claflin Mills
After the Jordan refiner, the Claflin refiner was invented, which had an angle of 30
degrees between rotor and stator filings. This is the widest angle of all conical -
shaped refiners. This refiner is currently used for currency papers and high-density
paper qualities. It has the same drawback as the Jordan refiner due to the bearings
13
on both sides of the refiner shaft.
3.2.2. Cylindrical designs
Hollander beater was first developed in 1680 by Dutch. Hollander beater is the most
used in recent time for producing specific grade paper. In this process, pulp slurry
passes through a refining beater. The slurry keeps circulating in the circular tank and
keeps passing through the beater
The gap between the beater and plate is used for the pulp to pass in between and
perform refining. The gap is adjusted to increase and decrease the refining intensity
[21].
The power efficiency is high as the idling power and rotational speed has lower
value. Later on, the principle was used by various paper industries by changing the
type of beaters for the desired properties [22].
3.3. Types of bars
Valmet refiner Attack Bars
Attack bars are designed to be tilted and contain sharp bar edges (Figure 7). This
helps the fibers to move effectively in the disk gap. The increased bar gap helps the
fibers to be treated effectively, resulting in higher strength properties and reducing
energy consumption [23]. With the use of attack bars, higher average fiber length
can be obtained by consuming less energy (Figure 8).

14
Figure 7:Refining impact difference between attack bars and normal bars
Figure 8: Energy consumption vs. fiber length(mm) for attack bar refining compared
with traditional bar filling.
Micro Bar
Micro bar is designed for the higher runnability of the refiner. This orientation and
shape of bars provide dense refining zone and long cutting-edge length (Figure 9).
This design helps the refiner to consume 10% less energy while refining hardwood
and 20% less energy while refining softwood and mixed pulp. This design is used for
all fiber lengths that provide a longer runnability without the need of filling change,
which is time-consuming. As a result of longer cutting edges of the micro bars, the
load can be more than general as the fibers get more area of refining grooves. The
total load can be increased by up to 50% with micro bar refining [24].

15
Figure 9: Bar orientation of microbar in a refiner
As there is higher edge length, more fibers experience refining treatment resulting
in external and internal fibrillation. The increase of tensile strength of paper sheets
can be observed while comparing with standard refining as a result. (Figure 10)
Figure 10: Energy consumption vs. fiber tensile strength for micro bar refining
compared with traditional bar filling.

16
Parallel Bar
Parallel bars are used widely for low-intensity refining. The parallel bar has one
specific bar at a fixed angle, and other bars have comparatively higher angles (Figure
11). As this setup has more bars edge crossing, it provides higher distance covered
per revolution during refining. The parallel bar also provides better hydraulic
capacity and breakage resistance.
Grove depth plays a critical role while meeting the required refining intensity. If the
groove depth is lower, the refining intensity will be higer as the fibers will receive
more treatment. If the groove depth increases the intensity will decrease as there will
be fiber trapped in the groves. But more width among groves will provide more
effeciency than grove depth. Moreover, energy consumption will be higher for
increasing depth as it will need more energy for the rotation of the refining bars
[25].
Figure 11: Bar orientation of
parallel bar in refiner
3.4. Impact of refining on fibers
The fibers that are being refined the effect depend on the raw pulp chemical
composition, morphology, and fiber orientation. The amount of lignin in the pulp,
the porosity, and rigidity has a big influence on refining intensity. The refining
outcome also has a considerable contributor which is the rheological behaviour of
the suspension. If the fibers are left untreated, which means not refined, the paper
17
made out of it will show uncontrolled properties. The distribution of the fibers along
the sheet will be highly uneven. There will be fewer hydrogen bonds among the
fibers resulting in poor formation. Refining increases the conformability and
interfiber bonds due to the result of external and internal fibrillation. Along with
maintaining good fiber strength and average fiber, length conformability is achieved
due to the refining [26].
Traditionally the only chemical treated pulps are refined by low consistency refining
mechanism. But in the earlier years, mechanical pulps were also being treated as it
was found that LC refining is able to produce the same required properties of paper
as HC refining. This means the same quality can be achieved using less energy. But
the refining condition control and parameter control was a bit more sophisticated to
reduce the fiber curl and, at the same time, produce less number of fines to
maintain good bonding properties. Welch came to the conclusion that de-latent
pulp could be produced without latency removal step if refining was done by LC
refining [27].
The impact of refining depends mostly on the type of pulp that is being refined, and
the changes in variables such as pulp consistency, rotor speed and the width of
grooves in bars.
The main impacts of refining are the opening of the primary fiber wall, fibrillation of
the secondary wall, swelling of fibers, shortening of fibers, and production of fines.
Fibrillation of fibers causes more bonds among fibers, which causes an increase of
tensile strength and tensile stiffness. Internal fibrillation causes an increase in the
surface area of paper, which improves the paper flexibility [28]. Shortening of fibers
or fines produced due to refining is a result of cuts at the bar edges due to extreme
refining. Fines produced by refining cause low paper strength and decreases
drainability due to the high density of fibers. As a secondary effect of refining is
fibers delamination of fibers, fiber stretching and collapse, fiber straightening, fiber
18
curling, and also redistribution of hemicellulose is observed [12].
It has been observed that the amount of hydroxyl groups in a paper sheet also
depends on the inetnsityof refining and bonding. The amount of free hydroxyl
bonds increases when the sheet is made from unrefined pulp. If the pulp is refined,
the amount of bonded hydroxyl groups increases. From figure 12, it can be
observed that for unrefined pulp deuterated hydroxyl group percentage was higher
by 1.4% than refined pulp. The x-axis indicates the number of free OH-groups. The
number was reduced as the degree of inter-fiber bonding increased that was
measured as higher sheet strengths. Depending on the refining intensity, 0,5-2 % of
hydroxyl groups are responsible for the increase in the number of fiber bonds in the
paper sheet [29].
Figure 12: . Deuteration curves of cellulose fibers and paper made by Corte and
Schaschek: (1) sheet from unbeaten fibers; (2) isolated fibers; (3) sheet from beaten
fibers; (4) sheet from fibers beaten longer than (3) [30]
19
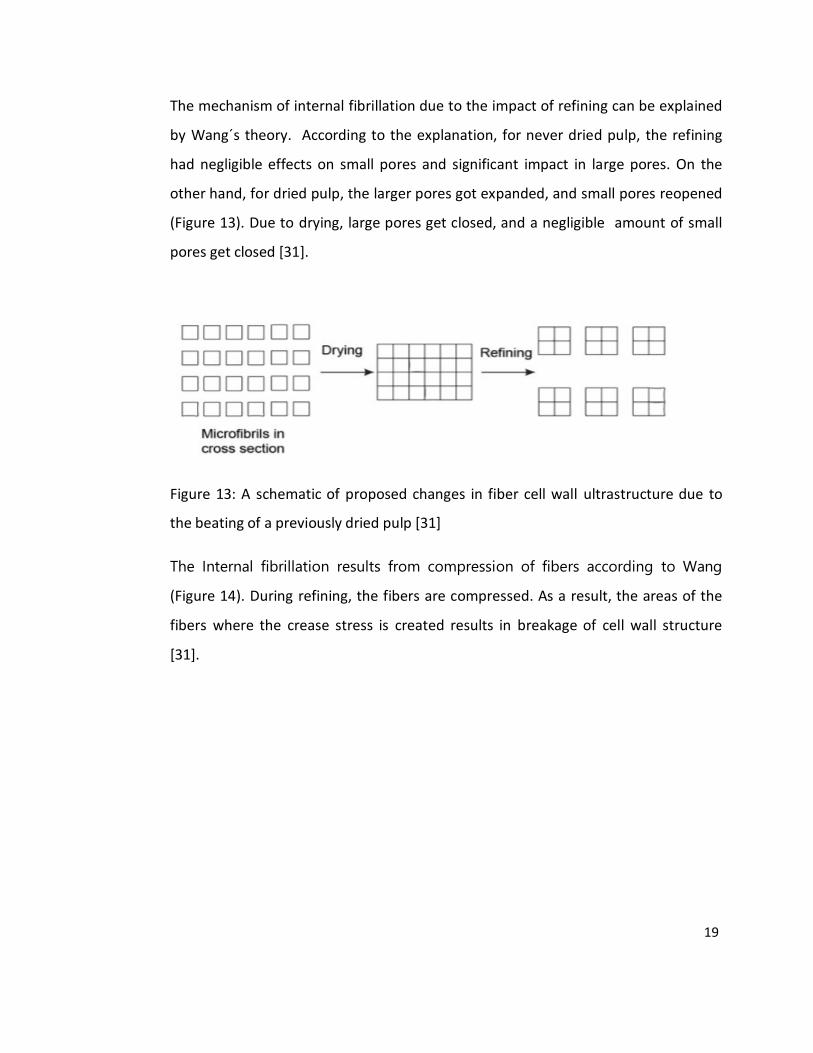
The mechanism of internal fibrillation due to the impact of refining can be explained
by Wang´s theory. According to the explanation, for never dried pulp, the refining
had negligible effects on small pores and significant impact in large pores. On the
other hand, for dried pulp, the larger pores got expanded, and small pores reopened
(Figure 13). Due to drying, large pores get closed, and a negligible amount of small
pores get closed [31].
Figure 13: A schematic of proposed changes in fiber cell wall ultrastructure due to
the beating of a previously dried pulp [31]
The Internal fibrillation results from compression of fibers according to Wang
(Figure 14). During refining, the fibers are compressed. As a result, the areas of the
fibers where the crease stress is created results in breakage of cell wall structure
[31].

20
Figure 14: A proposed mechanism for internal fibrillation created by compressive
action. Compressive action flattening and compressing the fibre (A) that causes
deformation resulting in breakage of cross links between microfibrils (B)
The percentage of fines also impacts the optical properties such as opacity, light
scattering, and brightness. Fibril amount increases with the increased time of
refining that provides more surface area causing more absorption of lights into the
fiber [32].
3.5. Refining Management
To measure the intensity of refining, the parameter that is calculated is SEC ( specific
energy consumption), which is measured as energy consumed to treat the fiber.
Specific Energy Consumption describes the net power used by the refiner
elaminating the portion of the energy that is lost to hydro dynamics to refine the
pulp. The formula used for determining SEC is :
SEC = PTotal −Pno load
M
Eq:1
21
where,
P total =Total motor load in the refiner with pulp, kW
Pno-load =Total motor load in the refiner without pulp, kW
M = Mass flow rate of pulp, t/h
Specific energy load, SEL is also called the refining intensity. The equation for
determining SEL is,
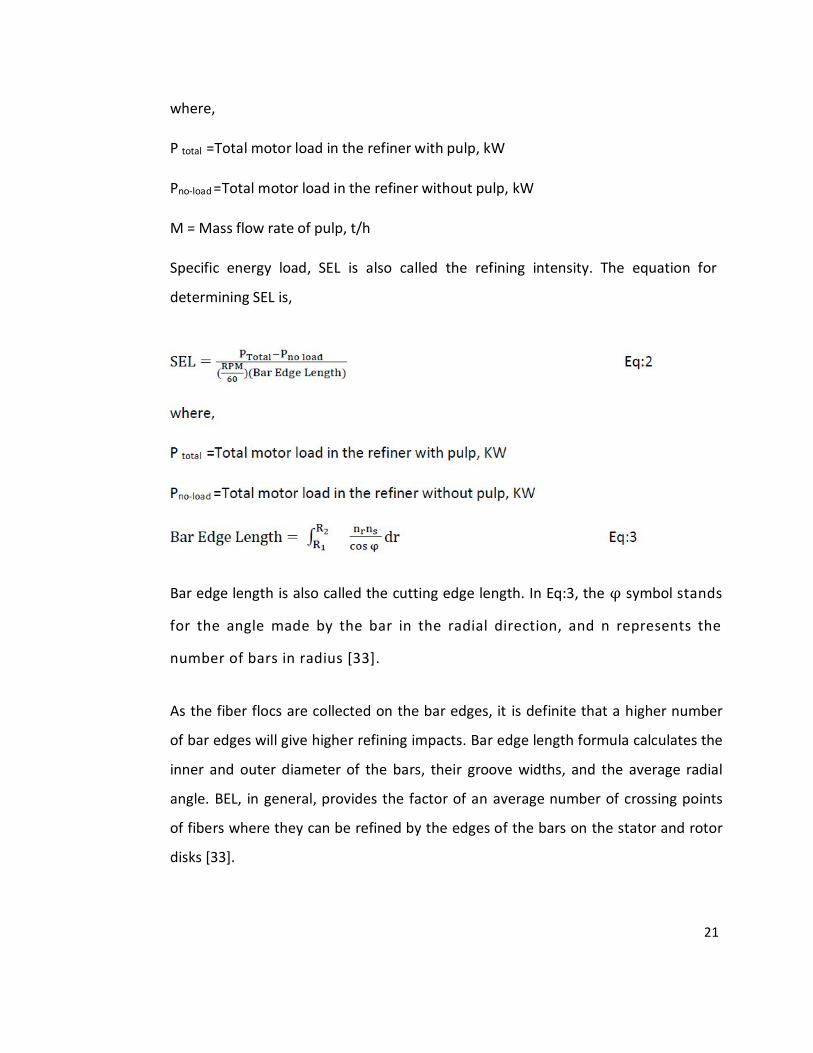
Bar edge length is also called the cutting edge length. In Eq:3, the φ symbol stands
for the angle made by the bar in the radial direction, and n represents the
number of bars in radius [33].
As the fiber flocs are collected on the bar edges, it is definite that a higher number
of bar edges will give higher refining impacts. Bar edge length formula calculates the
inner and outer diameter of the bars, their groove widths, and the average radial
angle. BEL, in general, provides the factor of an average number of crossing points
of fibers where they can be refined by the edges of the bars on the stator and rotor
disks [33].

22
3.6. Impact of refining on physical and optical properties
Absorbing capacity is one of the essential properties of the fiber. The mechanism
that helps to achieve higher absorbing capacity is the maximization of internal
fibrillation. When internal fibrillation increases, the number of pores among the
fibers increases as well as the size of the pores, which holds more water. This
process is called swelling of fibers. When internal fibrillation occurs, external
fibrillation occurs as well.
Water retention value is a method to determine the capability of a paper sheet to
absorb water [34]. Tissue paper has higher WRV than standard paper as tissues are
manufactured to absorb more water.
For experiment, WRV 2 g/L solution is prepared from the pulp fiber solution. Then
the solution is passed through a wired filter that is used for dewatering the pulp
from the solution. Then the extracted fiber pad is rolled and centrifuged in a
centrifugal rotor. The centrifugal force that is maintined is 3940 rpm at 23° C for 15
min. The weight of the pulp pad is measured afterward. After that, the pulp is oven-
dried at 105° C for 4 hours. The weight of the oven-dried pulp pad is measured. The
formula that is used to find WRV is
WRV = Weight of centrifuged wet test pad
− 1 Eq:3 Weight of oven−dried test pad
WRV= (Weight of centrifuged wet test pad/Weight of oven-dried test pad)-1
From figure 15 it is clear that water-absorbing capability increases with the refining
intensity. It has been observed that for NBSK pulp, less energy is required to achieve
a high WRV value compared with bleached bamboo pulp. For bleached bamboo
pulp, 25 kWh/t more energy is needed for making water retention value close to 1.9
g/g. From the graph, it can be stated that NBSK requires less specific energy
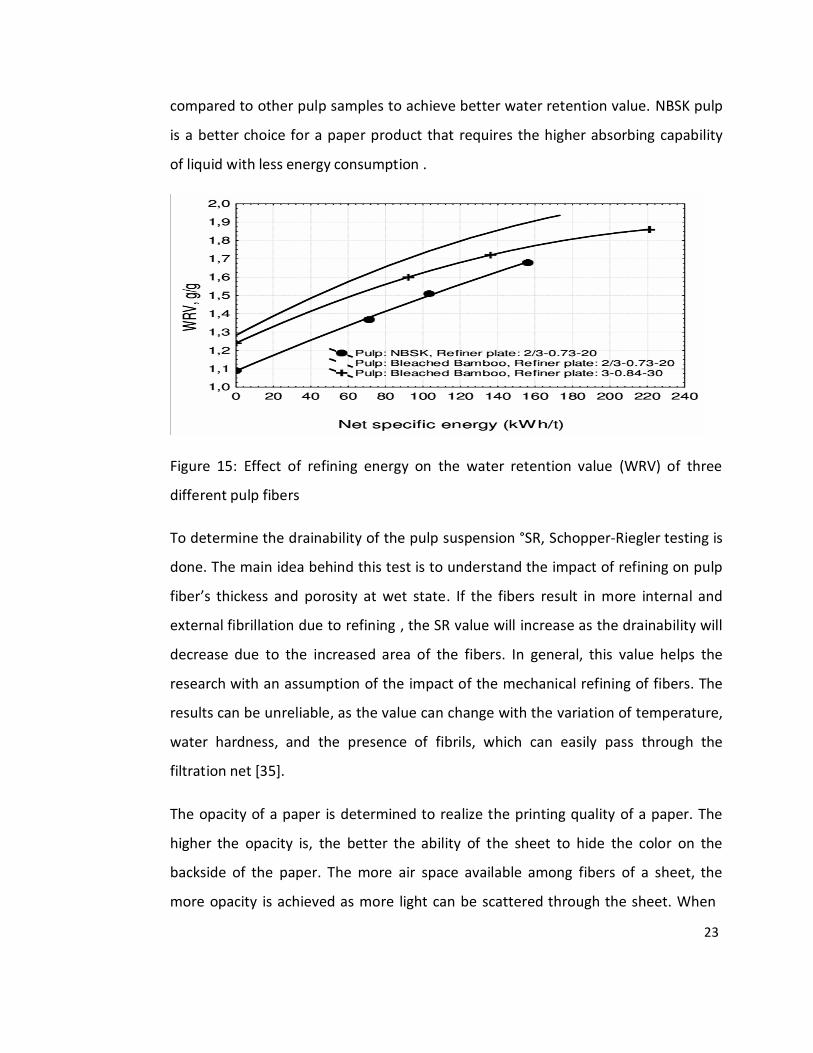
23
compared to other pulp samples to achieve better water retention value. NBSK pulp
is a better choice for a paper product that requires the higher absorbing capability
of liquid with less energy consumption .
Figure 15: Effect of refining energy on the water retention value (WRV) of three
different pulp fibers
To determine the drainability of the pulp suspension °SR, Schopper-Riegler testing is
done. The main idea behind this test is to understand the impact of refining on pulp
fiber’s thickess and porosity at wet state. If the fibers result in more internal and
external fibrillation due to refining , the SR value will increase as the drainability will
decrease due to the increased area of the fibers. In general, this value helps the
research with an assumption of the impact of the mechanical refining of fibers. The
results can be unreliable, as the value can change with the variation of temperature,
water hardness, and the presence of fibrils, which can easily pass through the
filtration net [35].
The opacity of a paper is determined to realize the printing quality of a paper. The
higher the opacity is, the better the ability of the sheet to hide the color on the
backside of the paper. The more air space available among fibers of a sheet, the
more opacity is achieved as more light can be scattered through the sheet. When

24
fibers are refined or mechanically treated, the fibers are internally and externally
fibrillated, and the fiber-fiber bonds increased, causing a decrease in air space,
which decreases opacity [36].
Meanwhile, with an increase of fines, the opacity increases as the pulp fines have
high surface areas and irregular shapes. The main challenge is to reach a point
where the sheet will provide high opacity and excellent strength. Bulky sheets have
high opacity with low strength and refined pulp sheets have good strength but low
opacity. The brightness of a paper sheet is measured as ISO Brightness (%). When
light arrives in a sheet of paper, four different types of action take place. Some
portion of the light creates scattered reflection which causes brightness, some
creates specular reflection creating gloss of the paper, some light gets absorbed
providing color, and some has permeance through the paper causing opacity (Figure
16) These values change with the change in the structure of the fibers in the paper
sheet due to refining [37].
Figure 16: Effects of light on paper when in contact and refining effect on light
scattering coefficient
Air permeability is one of the properties that is dependent on the thickness and air
porosity of a paper. The higher the porosity, the higher the value of air permeability
is achieved. The higher the thickness is, the lower the air permeability value goes.

25
Air permeability is the measurement of air flow passing the paper sheet per unit
area which is independent of sheet thickness [38].
If the pulp is refined, the internal and external fibrillation occurs along with fibrils
formation, which lowers the porosity in the paper. The longer time the pulp is
refined, the more the air permeance value decreases (Fig 17).Air permance is
measured as air permeability per unit thickness. However, this parameter can show
a difference in behavior depending on the raw material, intensity of refining, fiber
properties, and orientation. When calculated for air permeability, the value
increases as the number of pores increases per unit area due to the expansion of
fibers and formation in fibrils (Figure 18). If the refiner load is lower, there will be
less fiber to refiner bar interaction, causing less fibrillation of f ibers and fewer fines
formation. This will create a high air permeance value of paper sheets [39].
Figure 17: Impact of refining duration with Air permeance
26
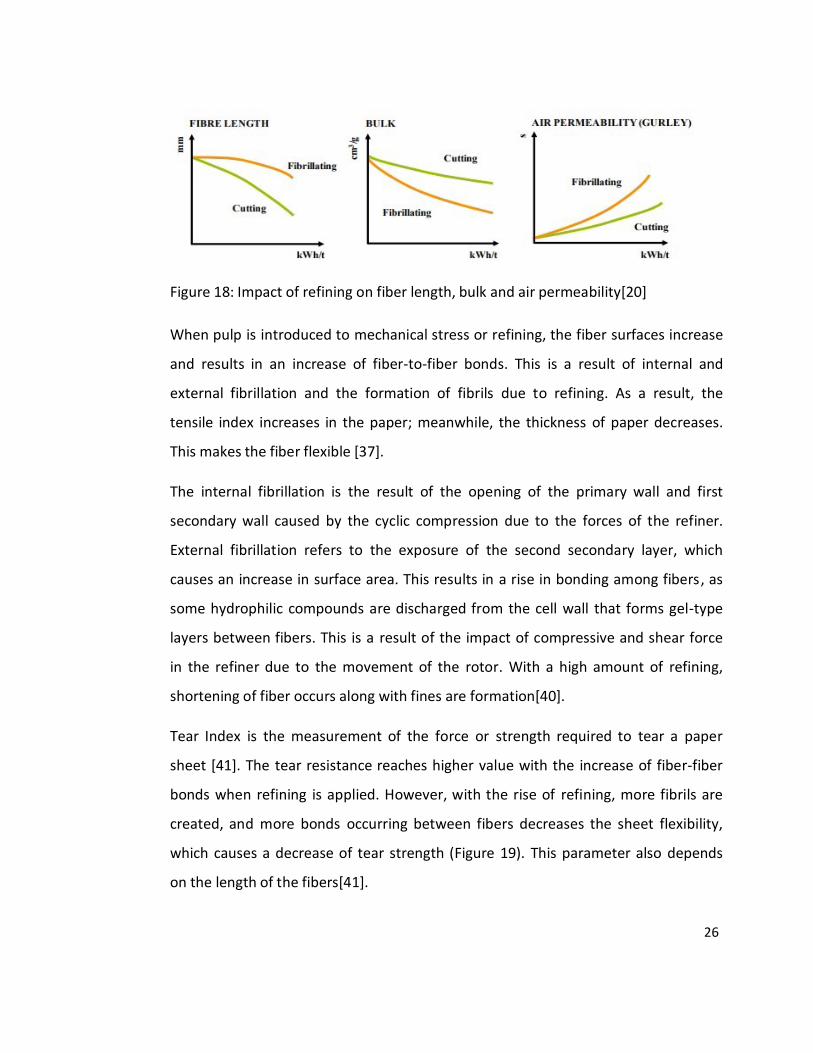
Figure 18: Impact of refining on fiber length, bulk and air permeability[20]
When pulp is introduced to mechanical stress or refining, the fiber surfaces increase
and results in an increase of fiber-to-fiber bonds. This is a result of internal and
external fibrillation and the formation of fibrils due to refining. As a result, the
tensile index increases in the paper; meanwhile, the thickness of paper decreases.
This makes the fiber flexible [37].
The internal fibrillation is the result of the opening of the primary wall and first
secondary wall caused by the cyclic compression due to the forces of the refiner.
External fibrillation refers to the exposure of the second secondary layer, which
causes an increase in surface area. This results in a rise in bonding among fibers , as
some hydrophilic compounds are discharged from the cell wall that forms gel-type
layers between fibers. This is a result of the impact of compressive and shear force
in the refiner due to the movement of the rotor. With a high amount of refining,
shortening of fiber occurs along with fines are formation[40].
Tear Index is the measurement of the force or strength required to tear a paper
sheet [41]. The tear resistance reaches higher value with the increase of fiber-fiber
bonds when refining is applied. However, with the rise of refining, more fibrils are
created, and more bonds occurring between fibers decreases the sheet flexibility,
which causes a decrease of tear strength (Figure 19). This parameter also depends
on the length of the fibers[41].
27
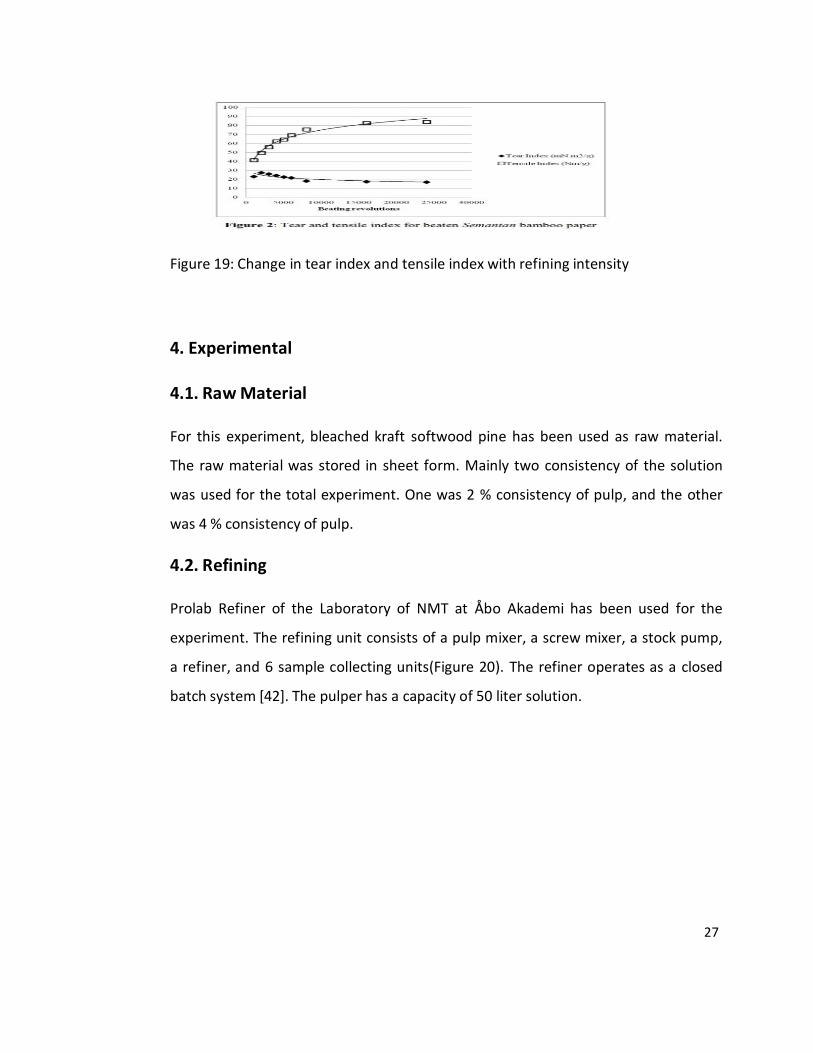
Figure 19: Change in tear index and tensile index with refining intensity
4. Experimental
4.1. Raw Material
For this experiment, bleached kraft softwood pine has been used as raw material.
The raw material was stored in sheet form. Mainly two consistency of the solution
was used for the total experiment. One was 2 % consistency of pulp, and the other
was 4 % consistency of pulp.
4.2. Refining
Prolab Refiner of the Laboratory of NMT at Åbo Akademi has been used for the
experiment. The refining unit consists of a pulp mixer, a screw mixer, a stock pump,
a refiner, and 6 sample collecting units(Figure 20). The refiner operates as a closed
batch system [42]. The pulper has a capacity of 50 liter solution.

28
Figure 20: Process flow of ProLab [42]
4.3. Pulp Preparation
Dry sheet of pulp was calculated and mixed with water to make the desired
consistency of pulp. It was assumed that the pulp sheet contained 5 % moisture. So
taking that into account, the calculation was made targeting the most precise
weight of dry pulp weight for the desired consistency.
4.4. Process of refining
At first, the no-load is measured only for each different volumetric flow rate for
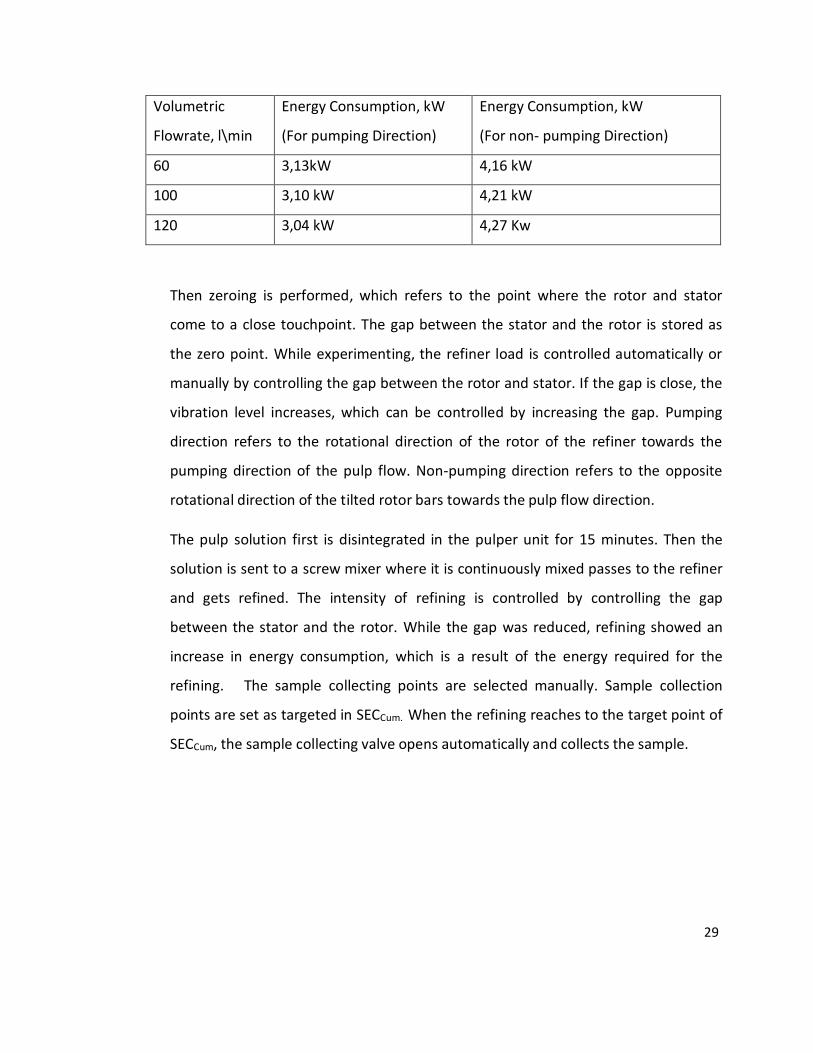
different rotational speeds by using water. No-load power for 60 l\min, 100 l\min,
and 120 l\min has been measured for pumping direction and non-pumping direction
(Table 3). It has been observed that the increased flow rate in pumping direction the
energy consumption has reduced while vice versa occurred for non-pumping
direction.
Table 3: Change of no-load power for different volumetric flow rate at pumping and
non-pumping direction
29
Volumetric
Flowrate, l\min
Energy Consumption, kW
(For pumping Direction)
Energy Consumption, kW
(For non- pumping Direction)
60 3,13kW 4,16 kW
100 3,10 kW 4,21 kW
120 3,04 kW 4,27 Kw
Then zeroing is performed, which refers to the point where the rotor and stator
come to a close touchpoint. The gap between the stator and the rotor is stored as
the zero point. While experimenting, the refiner load is controlled automatically or
manually by controlling the gap between the rotor and stator. If the gap is close, the
vibration level increases, which can be controlled by increasing the gap. Pumping
direction refers to the rotational direction of the rotor of the refiner towards the
pumping direction of the pulp flow. Non-pumping direction refers to the opposite
rotational direction of the tilted rotor bars towards the pulp flow direction.
The pulp solution first is disintegrated in the pulper unit for 15 minutes. Then the
solution is sent to a screw mixer where it is continuously mixed passes to the refiner
and gets refined. The intensity of refining is controlled by controlling the gap
between the stator and the rotor. While the gap was reduced, refining showed an
increase in energy consumption, which is a result of the energy required for the
refining. The sample collecting points are selected manually. Sample collection
points are set as targeted in SECCum. When the refining reaches to the target point of
SECCum, the sample collecting valve opens automatically and collects the sample.
30
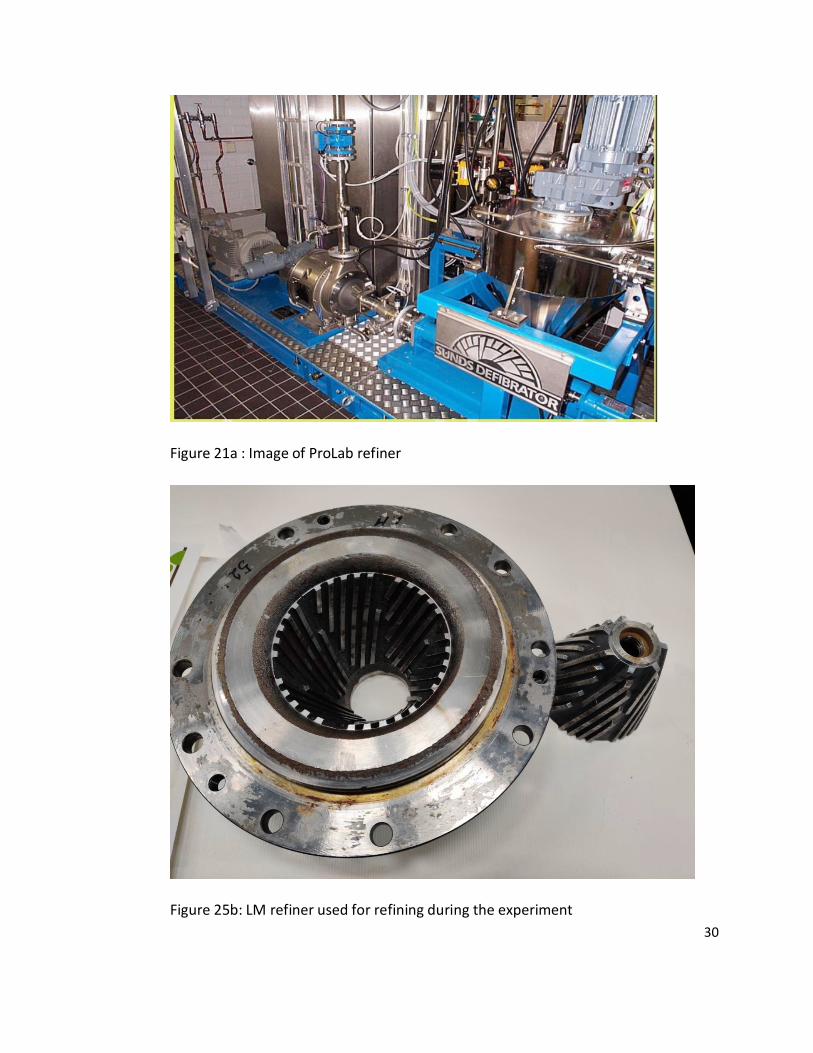
Figure 21a : Image of ProLab refiner
Figure 25b: LM refiner used for refining during the experiment
31
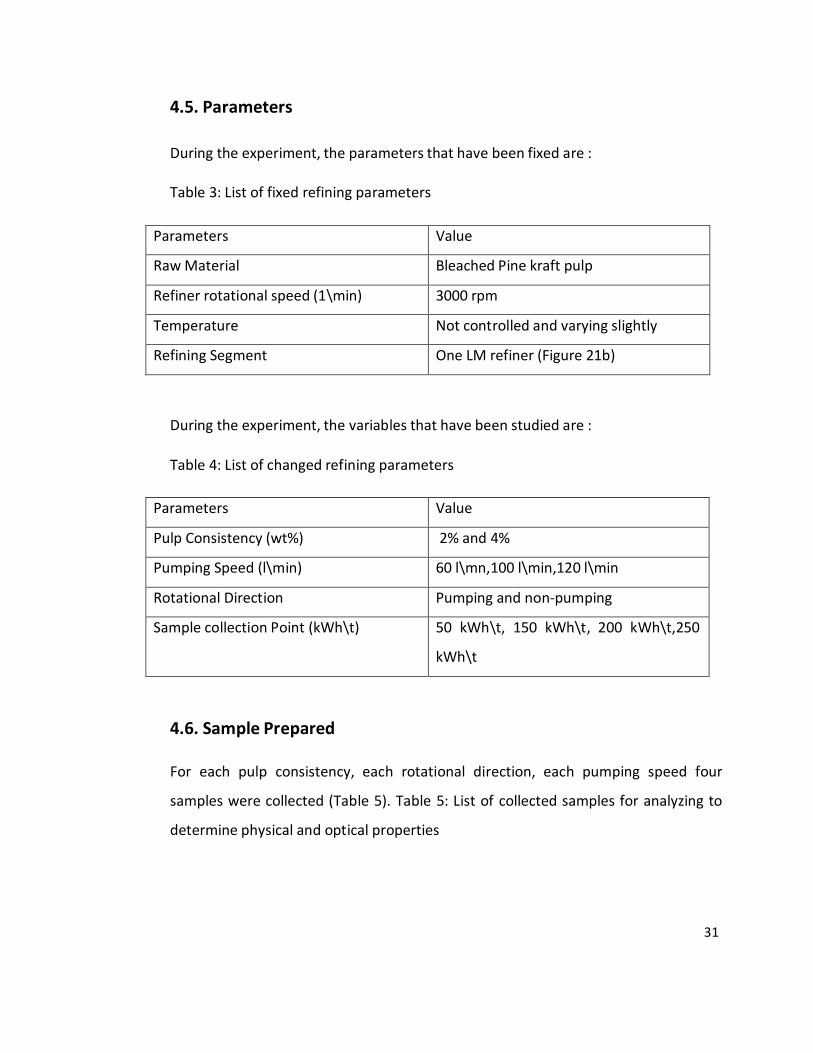
4.5. Parameters
During the experiment, the parameters that have been fixed are :
Table 3: List of fixed refining parameters
Parameters Value
Raw Material Bleached Pine kraft pulp
Refiner rotational speed (1\min) 3000 rpm
Temperature Not controlled and varying slightly
Refining Segment One LM refiner (Figure 21b)
During the experiment, the variables that have been studied are :
Table 4: List of changed refining parameters
Parameters Value
Pulp Consistency (wt%) 2% and 4%
Pumping Speed (l\min) 60 l\mn,100 l\min,120 l\min
Rotational Direction Pumping and non-pumping
Sample collection Point (kWh\t) 50 kWh\t, 150 kWh\t, 200 kWh\t,250
kWh\t
4.6. Sample Prepared
For each pulp consistency, each rotational direction, each pumping speed four
samples were collected (Table 5). Table 5: List of collected samples for analyzing to
determine physical and optical properties

32
Pulp
Consistency
Rotational
Direction
Pumping
Speed
(l\min)
Sample Collection
Point (kWh\t)
Total
Experimental
Sample
2% Pumping 60, 120 50, 150, 200, 250 8
2% Non Pumping 60, 120 50, 150, 200, 250 8
4% Pumping 60,100,
120
50, 150, 200, 250 12
4% Non Pumping Pumping 60,100, 120 12
Total=40
4.7. Sample analysis method
To observe and evaluate the changes in the physical and optical properties of the
fibers due to the various changes done in refining process parameters; the
parameters that have been analyzed are :
1. Schopper Riegler (°SR) freeness testing
2. Density measurement
3. Grammage measurement
4. Optical properties testing
5. Air permeability testing
6. Tensile strength testing
7. Tear strength testing
8. Water retention value testing
9. The average fiber length measurement
10. Fines percentage detection

33
Re
fin
ing
Inte
nsi
ty( °
SR)
5. Results and Discussion
For all pumping speed in pumping and non-pumping direction, the increase in °SR
value has been observed with the increase of specific energy consumption by the
refiner, which clearly indicated the increase of refining intensity causing more
external and internal fibrillation (Figure 22) Comparatively higher change in °SR
value has been observed for the sample with pumping direction, 4 % pulp
consistency,60 l/min flow rate and pumping direction, 2 % pulp consistency,120
l/min flow rate with the increase of refining intensity.
Pumping, 4%, 60 l/min
60 Pumping, 4%, 120 l/min
55 Non Pumping,
4%, 60 l/min 50
Non Pumping,
45 4%, 120 l/min
Pumping, 2%, 60 40 l/min
Pumping, 2%, 120 35 l/min
30 Non Pumping, 2%, 60 l/min
25 Non Pumping, 2%, 120 l/min
20
15
10
50 150 200 250
Specific energy consumption (SEC,kWh/t)
Figure 22: Change in °SR value with respect to SEC for all collected samples

34
For all experiments, the refining intensity has been controlled by controlling the
power consumption by the refiner except the refining done at 60 l/min and 120
l/min speed in pumping direction for 2 % pulp consistency, which has been done by
gap control. Comparatively higher °SR values have been observed with the increase
of refining energy SEC for gap controlled refining than power controlled refining.
The hypothesis behind this can be explained as, with the manual control done by
the gap, the gap was set smaller compared using the power option. This increased
the fiber-bar contact causing more internal and external fibrillation and formation of
fines. As a result, more surface area was created, resulting in a decrease of
drainability and increase in °SR. Moreover, when the refining was being controlled
by gap control, the gap between the stator and rotor was reduced in a short period
of time.As a result, the refining intensity was higher. On the other hand, while using
power controlled refining, the gap between the stator and rotor was reduced
gradually taking more time which can be explained as the reason of less refining
intensity compared with gap controlled refining.
From figure 23, it is seen for both pumping and non-pumping direction regardless of
pumping speed; the curve follows a trend where with the increase of °SR values, the
thickness decreases. This is explained as a high intensity of refining, causing external
and internal fibrillation decreasing the thickness with an increase of °SR values. The
decrease of thickness can be explained as; the density of fiber is more per volume as
a presence of more fibrillated and swollen fibers.
35
Thic
kne
ss, μ
m
251
201
Pumping, 4%, 60 l/min Pumping, 4%, 120 l/min
Non Pumping, 4%, 60 l/min Non Pumping, 4%, 120 l/min
Pumping, 2%, 60 l/min Pumping, 2%, 120 l/min
Non Pumping, 2%, 60 l/min Non Pumping, 2%, 120 l/min
151
101
51
1
0 10 20 30 40 50 60
Schopper Riegler (°SR)
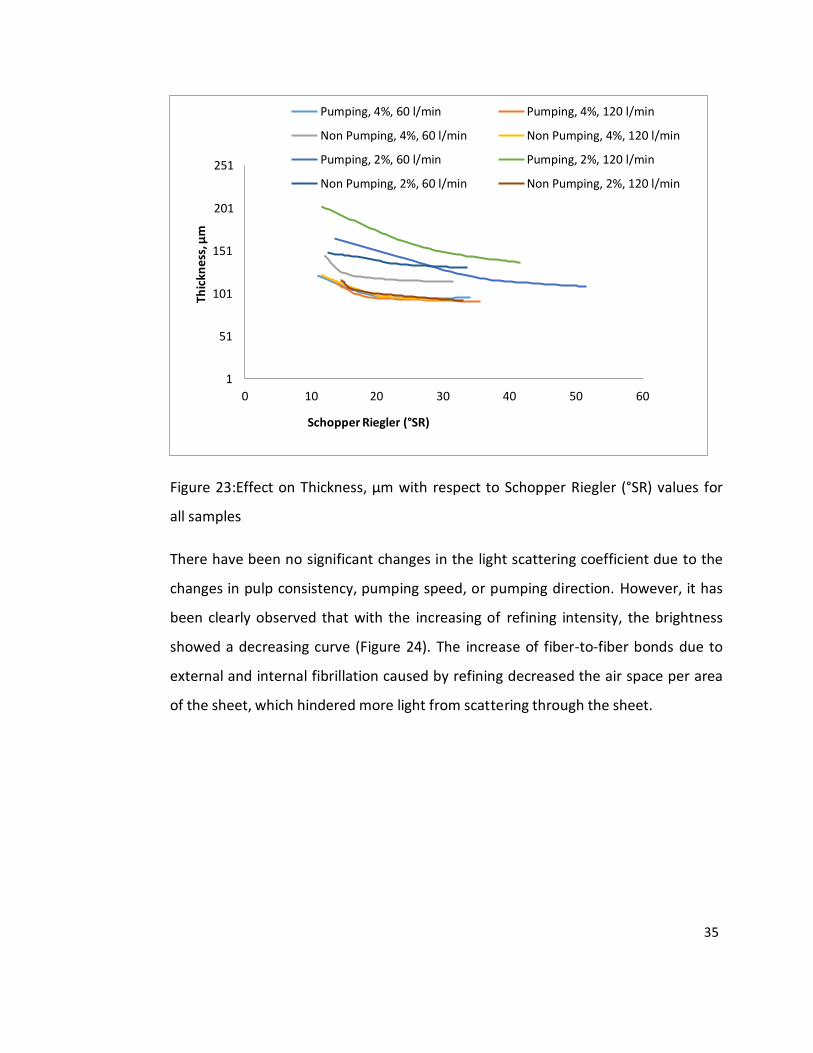
Figure 23:Effect on Thickness, μm with respect to Schopper Riegler (°SR) values for
all samples
There have been no significant changes in the light scattering coefficient due to the
changes in pulp consistency, pumping speed, or pumping direction. However, it has
been clearly observed that with the increasing of refining intensity, the brightness
showed a decreasing curve (Figure 24). The increase of fiber-to-fiber bonds due to
external and internal fibrillation caused by refining decreased the air space per area
of the sheet, which hindered more light from scattering through the sheet.

36
ISO
Bri
ghtn
ess
, %
Pumping, 4%, 120 l/min
90 Non Pumping, 4%, 120
89 l/min
88 Pumping, 2%, 120 l/min
87 Non Pumping, 2%, 120
86 l/min
85
84
83
82
81
80
50 150 200 250
SEC ,Kwh/t
Figure 24: Changes in ISO Brightness (%) with respect to refining intensity
While analyzing air permeability for all experimental samples, the results have
shown similar behavior. A decrease in air permeability was observed with the
increase of refining degree. Formation of more fines result in the porosity per unit
area decrease as a result of reduced thickness. Moreover, a significant decrease of
air permeability has been observed along with refining intensity for 2 % pulp
consistency at pumping direction for 60l/min pumping speed and at a non-pumping
direction for 120 l/min speed(Figure 25 a).
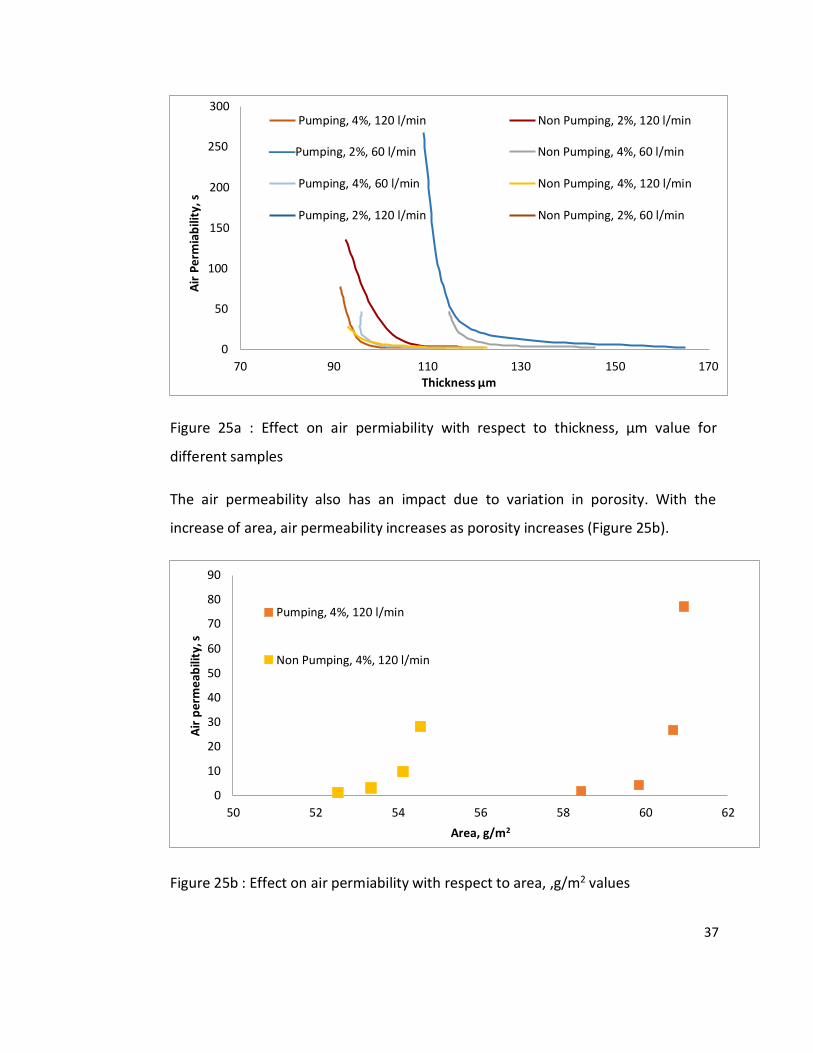
37
Air
pe
rme
abili
ty, s
A
ir P
erm
iab
ility
, s
300 Pumping, 4%, 120 l/min Non Pumping, 2%, 120 l/min
250 Pumping, 2%, 60 l/min Non Pumping, 4%, 60 l/min
200 Pumping, 4%, 60 l/min Non Pumping, 4%, 120 l/min
150
Pumping, 2%, 120 l/min Non Pumping, 2%, 60 l/min
100
50
0
70 90 110 130 150 170 Thickness μm
Figure 25a : Effect on air permiability with respect to thickness, μm value for
different samples
The air permeability also has an impact due to variation in porosity. With the
increase of area, air permeability increases as porosity increases (Figure 25b).
90
80 Pumping, 4%, 120 l/min
70
60 Non Pumping, 4%, 120 l/min
50
40
30
20
10
0
50 52 54 56 58 60 62
Area, g/m2
Figure 25b : Effect on air permiability with respect to area, ,g/m2 values

38
Fin
es
%
While analyzing the amount of fines at 120 l/min pumping speed for both pumping
and non-pumping direction with 2 % and 4 % pulp consistency, it was observed that
the amount of fines increased with the increase in refining intensity (Figure 26).
However, the difference between the percentage of fines was not significant
enough, which can be explained as less fiber-bar interaction during refining, as the
reason behind the creation of more fines depends on the level of the fibers friction
with the refiner bars. Also, no major change has been observed in the fines
percentages due to the change in direction or pulp consistency.
4.5
Pumping, 4%, 60 l/min Pumping, 4%, 120 l/min
Non Pumping, 4%, 60 l/min Non Pumping, 4%, 120 l/min
Pumping, 2%, 60 l/min Pumping, 2%, 120 l/min 4 Non Pumping, 2%, 60 l/min Non Pumping, 2%, 120 l/min
3.5
3
2.5
2
1.5 0 10 20 30 40 50 60
Refining Intensity °SR
Figure 26: Variation in fines with respect to °SR values
During the analysis of the fines content for all samples at different refining intensity,
it has been observed that the amount of fines has increased with the increase of
intensity with prolonged refining. For the samples (2 % consistency, 60 l/min flow
rate, and pumping direction) and (2 % consistency, 60 l/min flow rate and pumping
direction), the amount of the fines has been seen to increase by 0.5% units
compared to other samples along with the increase of SEC value. The reason for the
deviation can be assumed as the refining control method. For these 2 samples, the
refining has been controlled by controlling the gap whereas the other samples have
39
Co
nto
ur
fib
er
len
gth
(m
m)
been controlled by SEC value. This requires further research to determine the
changes in properties due to refining intensity controlled by gap control between
the stator and rotor.
2.5
2
1.5
1
0.5
Pumping, 4%, 60 l/min
Pumping, 4%, 120 l/min
Non Pumping, 4%, 60 l/min
Non Pumping, 4%, 120 l/min
0
0 50 100 150 200 250 300
SEC (Kwh/t)
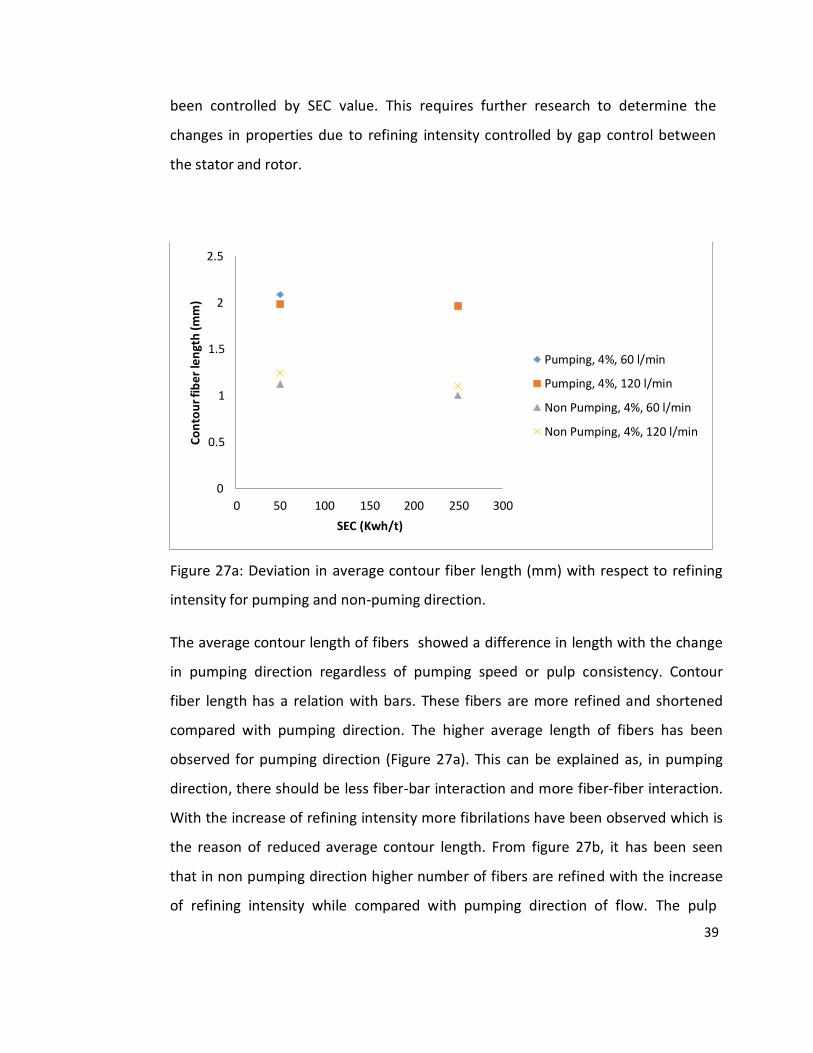
Figure 27a: Deviation in average contour fiber length (mm) with respect to refining
intensity for pumping and non-puming direction.
The average contour length of fibers showed a difference in length with the change
in pumping direction regardless of pumping speed or pulp consistency. Contour
fiber length has a relation with bars. These fibers are more refined and shortened
compared with pumping direction. The higher average length of fibers has been
observed for pumping direction (Figure 27a). This can be explained as, in pumping
direction, there should be less fiber-bar interaction and more fiber-fiber interaction.
With the increase of refining intensity more fibrilations have been observed which is
the reason of reduced average contour length. From figure 27b, it has been seen
that in non pumping direction higher number of fibers are refined with the increase
of refining intensity while compared with pumping direction of flow. The pulp

40
suspension flows in the pumping direction with more force compared to the non-
pumping direction. So during non-pumping direction, the fibers have more time
inside the refiner causing more interaction. However, this change showed no
significant impact on the other properties compared to other samples.
A B
C D
Figure 27b: Microscopic image of refined fibers at
A. Pumping direction,4 % pulp consistency,50 kWh/t SEC
B. Pumping direction,4 % pulp consistency,250 kWh/t SEC
C. Non pumping direction,4 % pulp consistency,50 kWh/t SEC
D. Non pumping direction,4 % pulp consistency,250 kWh/t SEC

41
Ten
sile
ind
ex,
Nm
/g
90
80
70
Pumping, 4%, 60 l/min
60 Pumping, 4%, 120 l/min
50 Non Pumping, 4%, 60 l/min
Non Pumping, 2%, 120 40 l/min
30
0 5 10 15 20 25 30 35 40
Schopper Riegler (°SR) value
Figure 28: Impact on tensile index (Nm/g) with respect to °SR values
For all the experiments, according to the figure 28, a trend of higher tensile strength
index has been noticed with respect to the increase in refining intensity. With the
increased SEC value, the refining impact increases. As a result, the fibers present in
the pulp experiences fibrillation externally and internally, which creates more bonds
among fibers. From the figure, it is clear that with higher SR value higher tensile
index is obtained. No drastic change has been observed in tensile strength due to
the change in pulp consistency, pumping speed, or pumping direction.
42
Tear
ind
ex,
mN
m2
/g
Pumping, 4%, 60 l/min
20 Pumping, 4%, 120 l/min
18 Pumping, 4%, 100 l/min
16
14
12
10
8
35 45 55 65 75 85 95
Tensile index, Nm/g
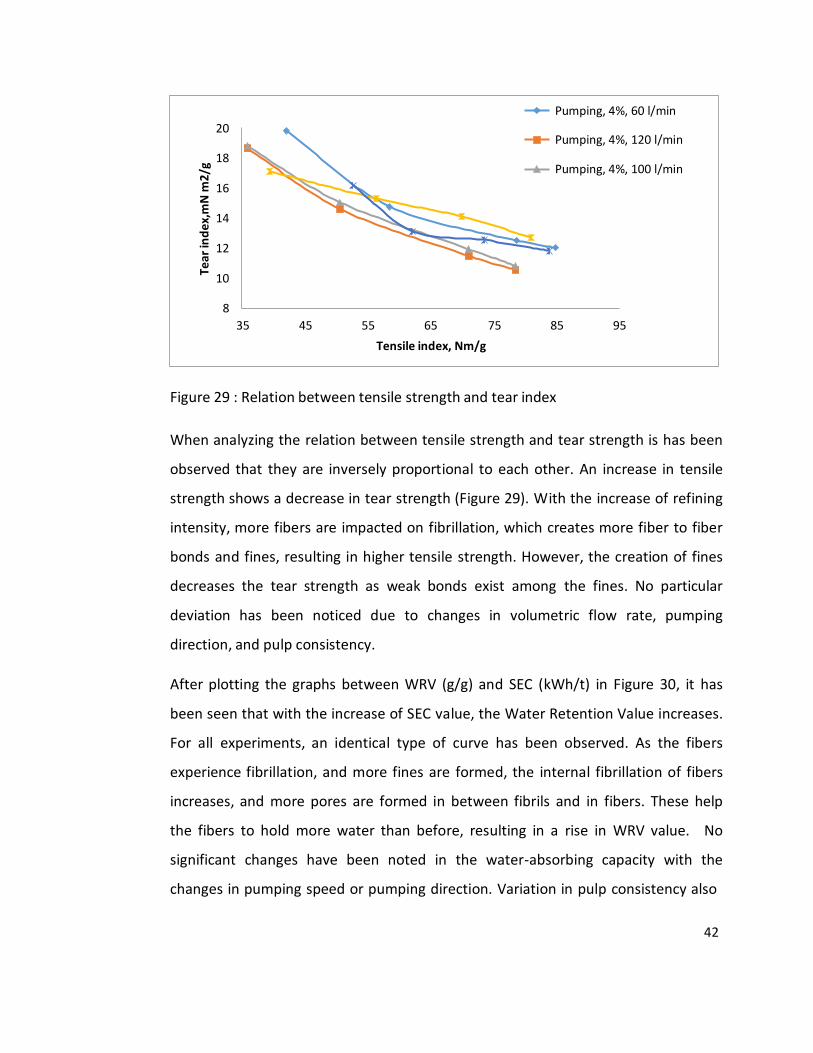
Figure 29 : Relation between tensile strength and tear index
When analyzing the relation between tensile strength and tear strength is has been
observed that they are inversely proportional to each other. An increase in tensile
strength shows a decrease in tear strength (Figure 29). With the increase of refining
intensity, more fibers are impacted on fibrillation, which creates more fiber to fiber
bonds and fines, resulting in higher tensile strength. However, the creation of fines
decreases the tear strength as weak bonds exist among the fines. No particular
deviation has been noticed due to changes in volumetric flow rate, pumping
direction, and pulp consistency.
After plotting the graphs between WRV (g/g) and SEC (kWh/t) in Figure 30, it has
been seen that with the increase of SEC value, the Water Retention Value increases.
For all experiments, an identical type of curve has been observed. As the fibers
experience fibrillation, and more fines are formed, the internal fibrillation of fibers
increases, and more pores are formed in between fibrils and in fibers. These help
the fibers to hold more water than before, resulting in a rise in WRV value. No
significant changes have been noted in the water-absorbing capacity with the
changes in pumping speed or pumping direction. Variation in pulp consistency also
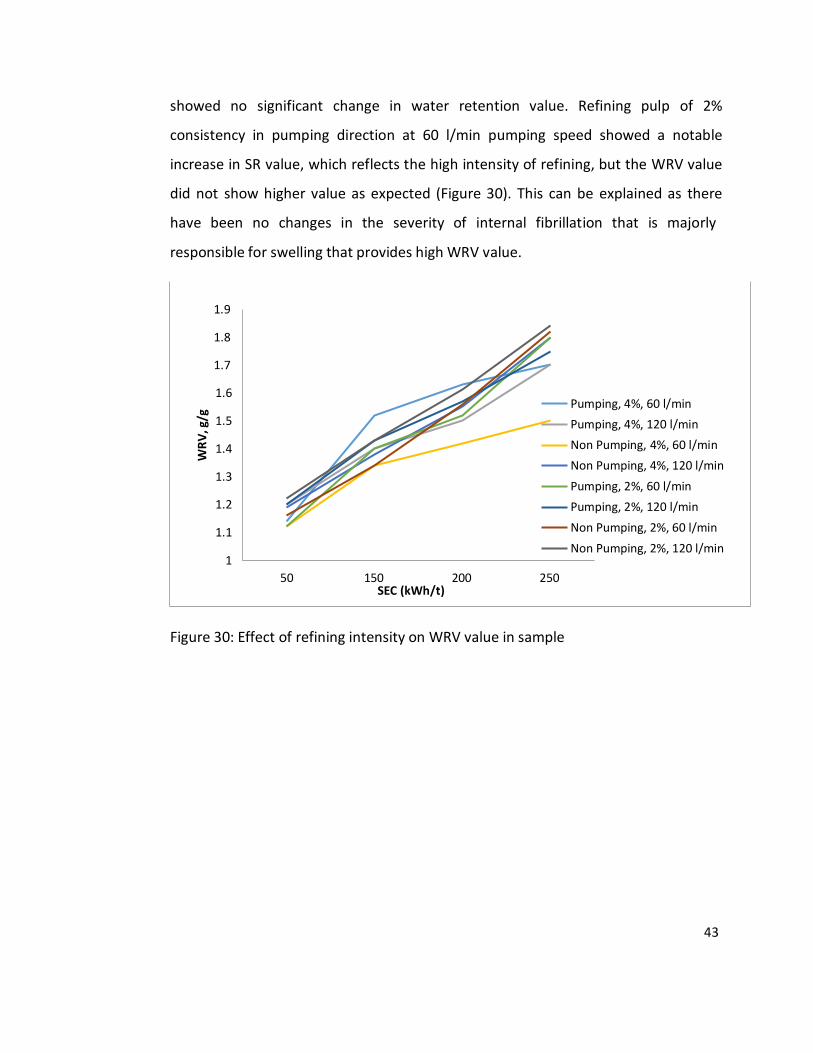
43
WR
V, g
/g
showed no significant change in water retention value. Refining pulp of 2%
consistency in pumping direction at 60 l/min pumping speed showed a notable
increase in SR value, which reflects the high intensity of refining, but the WRV value
did not show higher value as expected (Figure 30). This can be explained as there
have been no changes in the severity of internal fibrillation that is majorly
responsible for swelling that provides high WRV value.
1.9
1.8
1.7
1.6
1.5
1.4
1.3
1.2
1.1
1
50 150 200 250
SEC (kWh/t)
Pumping, 4%, 60 l/min
Pumping, 4%, 120 l/min
Non Pumping, 4%, 60 l/min
Non Pumping, 4%, 120 l/min
Pumping, 2%, 60 l/min
Pumping, 2%, 120 l/min
Non Pumping, 2%, 60 l/min
Non Pumping, 2%, 120 l/min
Figure 30: Effect of refining intensity on WRV value in sample
44
WR
V, g
/g
1.9
1.8
1.7
1.6
1.5
1.4
1.3
1.2
1.1
1
0 10 20 30 40 50 60
Pumping, 4%, 60 l/min
Pumping, 4%, 120 l/min
Non Pumping, 4%, 60 l/min
Non Pumping, 4%, 120 l/min
Pumping, 2%, 60 l/min
Pumping, 2%, 120 l/min
Non Pumping, 2%, 60 l/min
Non Pumping, 2%, 120 l/min
Schopper Riegler (°SR) value
Figure 31: Relation between WRV (g/g) and Schopper Riegler (°SR) value for all
samples
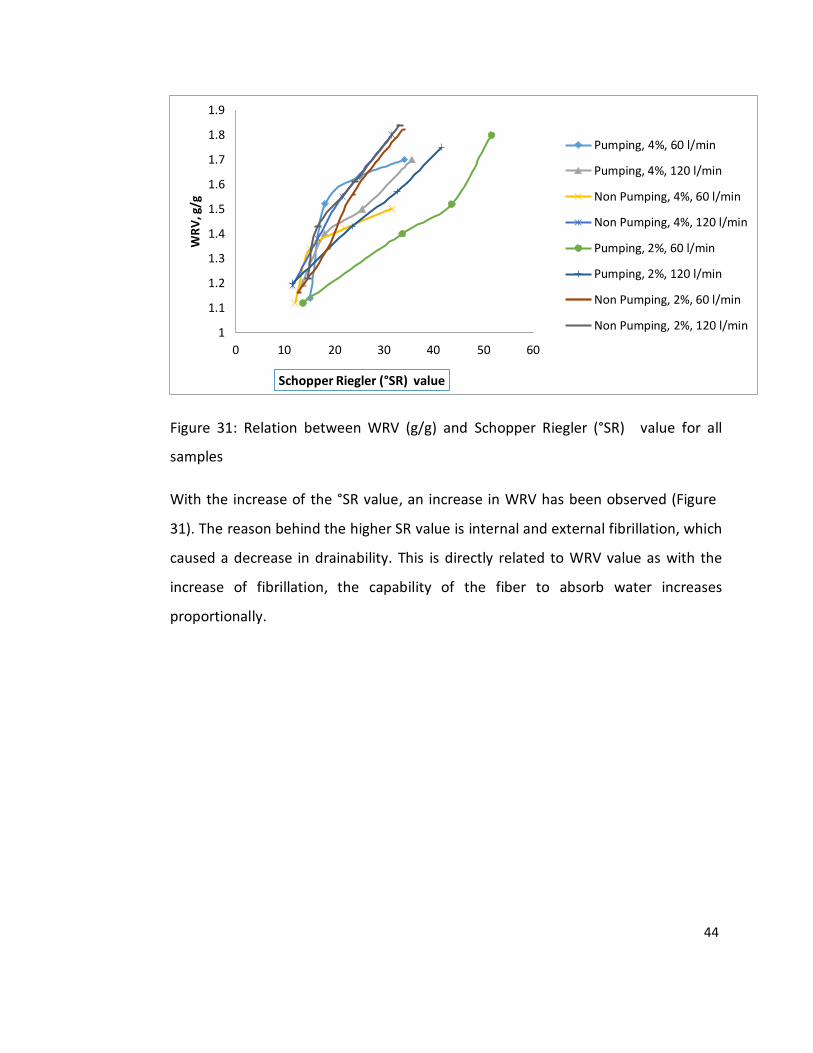
With the increase of the °SR value, an increase in WRV has been observed (Figure
31). The reason behind the higher SR value is internal and external fibrillation, which
caused a decrease in drainability. This is directly related to WRV value as with the
increase of fibrillation, the capability of the fiber to absorb water increases
proportionally.
45
6. Conclusion
The main aim of this research was to investigate and analyze the changes in the
physical and optical properties of paper sheets due to changes in some refining
parameters. During this study, three pumping speeds have been utilized for 2% and
4% pulp consistency for both pumping direction and non-pumping direction. The
refiner from where the refining samples have been collected is ProLab refiner.
Finnish bleached pine softwood has been used during the whole experiment. The
sample collecting points were achieved when the cumulative specific energy
reached 50 kWh/t, 150 kWh/t, 200 kWh/t and 250 kWh/t during refining. These
samples were further analyzed to study the impact on physical and optical
properties.
From the experimental results has been observed that with the increase of refining
intensity from 50 kWh/t to 250 kWh/t, the Schopper Riegler value increased. This
degree of change implies that the fibrillation increased along with refining intensity.
Interestingly a deviation has been noted for 2% consistency in pumping direction at
60 l/min and 120 l/min compared with other samples results in S-R value.
There has been a slight decrease in ISO brightness with the increase of refining
intensity. However, no major change has been observed due to change in
volumetric flow rate or pulp consistency or pumping direction.
Air permeability has increased with refining intensity, but for 2% concentrated pulp
at 60 l/min flow rate at pumping direction showed 50 % lower air permeability value
than other values .
Tear strength, tensile strength, and WRV value have shown increased value with
respect to refining intensity, but no significant changes have been notified due to
the change in the flow rate of fiber concentration, pulp consistency in solution on
pumping direction.
46
At the end of the study, we controlled the gap of the stator and rotor for increasing
the refining intensity manually for 2% pulp consistency in pumping direction for 60
l/min and 120 l/min volumetric flow rate whereas, for the other experiments we
controlled the refining intensity by power control. This parameter can be an idea for
future research. It can be studied if the increase in refining intensity caused by gap
control shows a difference in optical and physical properties compared with the
power-controlled refining.
In conclusion, the main purpose has been to analyze if any changes occur in the
properties of the paper sheet due to changes in these three parameters. From this
study, it can be stated that there have been no significant changes in the properties.
Thus, it can be said that changes in these parameters do not impact the changes in
paper sheet properties, and further investigation can be done by controlling the
refining intensity with a gap control and for power control method.

47
7. References
1. Rowell, R., 2005. Handbook Of Wood Chemistry And Wood Composites. Boca
Raton, Fla.: CRC Press.
2. Hoadley, R., 2000. Understanding Wood. Newtown, CT: Taunton Press. p-7.
3. Marko Loijas, 2010, Factors affecting the axial force in Low consistency refining,
Thesis, Department of paper Technology, Turku University of Applird Science, P-14
4. Erik Sjöström , 2018, Production of microfibrillated cellulose by LC-refining Master
of Science Thesis, , Abo Akademi, Finland
5. K Doelle1 and B Bajrami, 2017, Sodium Hydroxide and Calcium Hydroxide Hybrid
Oxygen Bleaching with System, p-1
6. He, M., Yang, G., Chen, J., Ji, X. and Wang, Q., 2018. Production and
Characterization of Cellulose Nanofibrils from Different Chemical and Mechanical
Pulps. Journal of Wood Chemistry and Technology, 38(2), p.152.
7. J.R., Dillén S., and Hamza M.F., 2016. Pulp and Paper: Wood Sources. In: Saleem
Hashmi. Reference Module in Materials Science and Materials Engineering. Oxford:
Elsevier; p. 1-6
8.Anyang Machinary co, Ltd, Comparison of Softwood Pulp and Hardwood Pulp.
[online] Available at: http://www.paperpulpingmachine.com/softwood-pulp-and-
hardwood-pulp-comparison/[Accessed 23 Feb. 2020].
9. Hardwood Vs. Softwood. [online] Available at:
<https://www.diffen.com/difference/Hardwood_vs_Softwood/[> [Accessed 14
March 2020].
10. Hari Goyal, MS, P.Eng., 2020. PAPER & PAPERBOARD PRODUCTION &
CONSUMPTION FOR WORLD 2013. [online] Available at:
http://www.paperonweb.com/World.htm/[Accessed 03 Feb. 2020].
11. 2020. Hardwood Vs. Softwood. [online] Available at:
<https://www.diffen.com/difference/Hardwood_vs_Softwood/[> [Accessed 14
March 2020].
12. 28. Lumiainen, J., 1998. Papermaking Part 1, volume 8; Stock Preparation and
wet end Ch. 4; Refining of chemical pulp. [Online] Available at: http://turbulence-
initiated.sites.olt.ubc.ca/files/2013/01/1998-Lumiainen-Ch4.pdf [Accessed 1 3
2018].
48
13. Valmet,2013. Pulping Developments . [online] Available at: <https://
www.valmet.com/globalassets/media/downloads/white-papers/board-and-paper-
making/wppb_pulpingdevts.pdf/[Accessed 23 Feb. 2020].
14.Mesto 2008b. OptiFiner RF for low consistency refining. [online] Available at:
https://www.intrafiles.mesto.com/ [Accessed 23 Feb. 2020].
15. Smook, G. A., 1992. Handbook for Pulp & Paper technologists. 2nd ed.
Vancouver: Angus Wilde
Puplications.
16. Gharehkhani, S., Sadeghinezhad, E., Kazi, S., Yarmand, H., Badarudin, A., Safaei,
M., and Zubir, M., 2015. Basic effects of pulp refining on fiber properties—A
review. Carbohydrate Polymers, 115, pp.785-803.
17. Valmet., 2020. Low consistency refiner. [online] Available at:
https://www.valmet.com/pulp/mechanical-pulping/refining-and-grinding/optifiner-
low-consistency-refiner/ [Accessed 23 Feb. 2020].
18.Al Lankfold, Refining Refiners: New Conical Design. Pulp&Paper, Issue 2.
19. Valmet.com., 2020. Low consistency refiner. [online] Available at:
https://www.valmet.com/pulp/mechanical-pulping/refining-and-grinding/optifiner-
low-consistency-
20.. Swanson, J.W., 1964: Stock preparation in Handbook of pulp and paper
technology. Ed. K.W. Britt, Rheinhold, New York, 537 pp.
21. Clapp, Verner, W.,1972. "The story of permanent/durable book-paper, 1115–
1970". Restaurator (Suppl. No. 3): 1–51
22. Clark, J. d'A., 1978.: Pulp technology and treatment for paper. San Francisco :
Miller Freeman, 752 pp.
23. Valmet., 2020. Low consistency refiner. [online] Available at:
https://www.valmet.com/pulp/mechanical-pulping/refining-and-grinding/optifiner-
low-consistency-
24. Micro bar. [online] Available at:
https://valmetsites.secure.force.com/solutionfinderweb/ [Accessed 23 Feb. 2020].
25. JL Fiber Services., 2020. Parallel Bar Refiner Plates - JL Fiber Services. [online]
Available at: https://www.jlfiberservices.com/products/low-consistency-refiner-

49
plates/parallel-bar/ [Accessed 23 Feb. 2020].
26. Tasman, J.E., 1966. The mechanical modification of papermaking fibres. Pulp and
Paper Magazine of Canada 67(12):T553-T569
27. Welch, L.V.S., 1999. Low consistency refining of mechanical pulps. PhD-thesis,
University of British Columbia, Vancouver, Canada, 131 pp.
28. Kada, D., Migneault, S., Tabak, G. and Koubaa, A., 2015. Physical and Mechanical
Properties of Polypropylene-Wood-Carbon Fiber Hybrid Composites. BioResources,
11(1).
29. Corte, H. and H. Schaschek., 1955. Physikalische Natur die Papierfestigkeit.
Papier 9(21):519-530
30. Corte, H.,1966. Paper and board. Chapter X in Composite materials, ed. L.
Holliday Elsevier, London, 540 P.
31. Wang, X., 2006. Improving the papermaking properties of kraft pulp by
controlling hornification and internal fibrillation. PhD-thesis, Helsinki University of
Technology, Espoo, 88 p
32. Balticforestry.mi.lt., 2020. [online] Available at:
https://www.balticforestry.mi.lt/bf/PDF_Articles. [Accessed 23 Feb. 2020].
33. Fibrelab.ubc.ca., 2020. Refining Management [online] Available at:
http://www.fibrelab.ubc.ca/files/2013/01/Topic-7-Mechanical-Pulping-low-
consistency-refining.pdf [Accessed 23 Feb. 2020].
34. Zhao, Guanglei & Lai, Ronald & Li, Xiaofeng & He, Beihai & Greschik, Thomas.,
2010. Replacement of softwood kraft pulp with ECF-bleached bamboo kraft pulp in
fine paper. Bioresources. 5. 10.15376/biores.5.3.1733-1744.
35. Iso.org., 2020. [online] Available at: https://www.iso.org/ [Accessed 23 Feb.
2020].
36. Bajpai, P. (n.d.). Biermann's handbook of pulp and paper. 3rd ed. p.282.
37. Mesto 2008b. OptiFiner RF for low consistency refining. [online] Available at:
https://www.intrafiles.mesto.com/ [Accessed 23 Feb. 2020].
38. Rajesh Mishra, Jiri Militky,In The Textile Institute Book Series,Nanotechnology in
Textiles,Woodhead Publishing,2019,Pages 219-261,
39. Agro.icm.edu.pl. (2020). [online] Available at:
http://agro.icm.edu.pl/agro/element/bwmeta1.element.agro-d8c67b8a-7e7e-46de-

50
aa5e-246684c13714/c/92-95.pdf [Accessed 23 Feb. 2020].
40. Gharehkhani, S., Sadeghinezhad, E., Kazi, S., Yarmand, H., Badarudin, A., Safaei,
M. and Zubir, M. (2015). Basic effects of pulp refining on fiber properties—A
review. Carbohydrate Polymers, 115, pp.785-803.
41. Rose Sinclair, 2014, Materials, Design and Technology, A vlume in Woodhead
Publishing Series in Textiles
42. Lundin, T., 2008. Tailoring Pulp Fiber Properties In Low Consistency Refining. 1st
ed. Turku:
Laboratory of Fibre and Cellulose Technology, Faculty of Technology, Åbo Akademi
University.