tail risk hedging - canadian investment revie · tail risk hedging should be an integral part of...
TRANSCRIPT

August 2012
Tail Risk Hedging2012 Risk Management Conference
This document is provided for informational purposes only and is not intended to be an offer or solicitation, or the basis for any contract to purchase or sell any security or other instrument, or for AllianceBernstein to enter into or arrange any type of transaction as a consequence of any information contained herein. AllianceBernstein and its business units do not provide tax, legal or accounting advice and you should consult your professional advisors with respect to such matters. This presentation is not intended for public use or distribution. Neither this presentation nor any of its contents may be used for any other purpose without the express consent of AllianceBernstein.
This presentation is being provided to you upon request as a financially sophisticated investor.
Please Read the Following Disclosure
Simulated Performance: HYPOTHETICAL OR SIMULATED PERFORMANCE RESULTS HAVE CERTAIN INHERENT LIMITATIONS. The data presented herein is solely for illustrative purposes which may include among other things back testing, simulated results and scenario analyses. The information is based upon certain factors, assumptions and historical information that AllianceBernstein may in its discretion have considered appropriate, however, AllianceBernstein provides no assurance or guarantee that actual trades or trade structures will be the same as shown, or that this product will operate or would have operated in the past in a manner consistent with these assumptions. In the event any of the assumptions used do not prove to be true, results are likely to vary materially from the examples shown herein. Additionally, the results may not reflect material economic and market factors, such as liquidity constraints, transaction costs and other expenses which could reduce potential return. All levels are indicative and there is no representation that any transaction can or could have been effected at such level.
Fees: Investment management fees and incentive fees associated this this service may be higher than those charged by traditional funds and can offset trading profits. The incentive allocation made to the investment manager may create an incentive for the investment manager, to make investments that are riskier or more speculative than if the there was no incentive fee.
Investment and Trading Risks: The AllianceBernstein Tail Risk Hedging Strategy may engage in speculative investment practices, including the use of leverage, short sales and derivatives, that may increase the risk of investment loss.
Strategy-Specific Risks: In addition to the risks discussed above, the strategy is subject to the following investment and trading risks, risks associated with investment techniques such as limited diversification, margin transactions, short sales and leverage through derivative instruments, including options, futures and forward contracts, and swaps; and risks associated with investments in undervalued securities, in fixed income securities, in commodities futures, and in non-US securities and currencies, including those of emerging markets countries.
1

Tail Hedging: Mitigate Draw Downs, Higher Risk Premium, Lower Volatility
Tail risk frequency and severity are often underestimated using traditional methods
Managing tail risk and avoiding large losses is critical to long term wealth creation
Exp
ecte
d R
etur
n
long term wealth creation
Traditional methods of hedging tail risk are expensive and may have limited effectiveness
Innovative tail risk hedging techniques may help:
Lower overall portfolio risk and mitigate tail risk
Protect portfolios against increased tail correlations (diversification failure)
Tail risk hedging should be an integral part of asset allocation
2
RiskPortfolio+Tail HedgingOriginal Portfolio
Risk
allocation
August, 2012For illustrative purposes onlyThere can be no assurances objectives will be achieved.
What Is a Tail Hedge?
Technical Definition: A Tail Hedge strategy is designed to buffer a portfolio during a 3-standard deviation market event
Practical Definition: A Tail Hedge Strategy is like an umbrella…you want to own one before it rains
3

Traditional Portfolios Are Not Diversified By Risk
12-Month 99%VaR of a 60/40 Portfolio = 23.6%January 1988–December 2011
Equity96.8%
Source of VaR
Equity60%
Fixed Income
40%
Common Diversified Portfolio
4
Curve 0.8%Swap Spreads 0.0%Spread Credit and EMG 1.7%Spread Securitized 0.4%
Analysis for the period January 1988-December 2011
The Challenge:60% of the Allocation = 96.8% of the Risk
10%
…..60/40 Portfolio Drawdown vs SPX Drawdowns
Correlation: 88%
(40)%
(30)%
(20)%
(10)%
0%
(60)%
(50)%
71 73 75 77 79 81 83 85 87 89 91 93 95 97 99 01 03 05 07 09 11
SPX Drawdown 60% SPX 40% Agg Drawdown
5
60/40 portfolio is 60% SPX/40% Barclays US AGG Index from 1976. Prior to1976, it is 60% SPX/40%US10yr Note
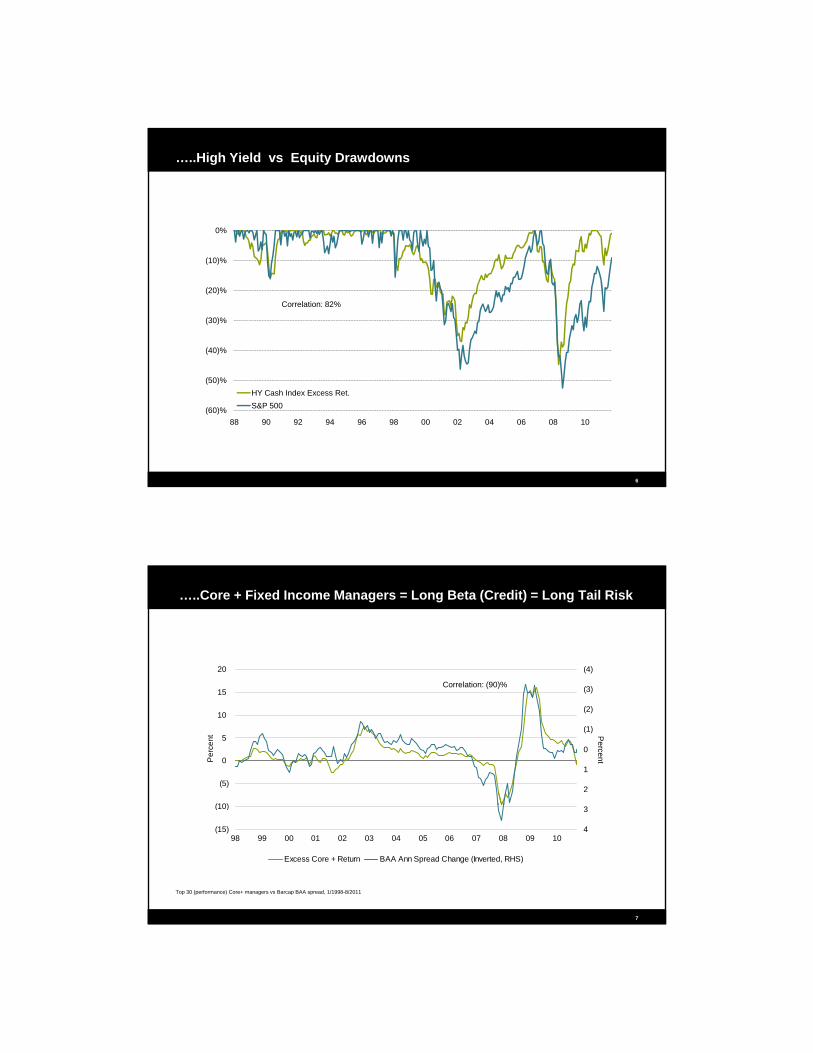
…..High Yield vs Equity Drawdowns
0%
(40)%
(30)%
(20)%
(10)%
Correlation: 82%
6
(60)%
(50)%
88 90 92 94 96 98 00 02 04 06 08 10
HY Cash Index Excess Ret.S&P 500
…..Core + Fixed Income Managers = Long Beta (Credit) = Long Tail Risk
20 (4)
Correlation: (90)%
(10)
(5)
0
5
10
15
Per
cent
(3)
(2)
(1)
0
1
2
Percent
Correlation: (90)%
7
Top 30 (performance) Core+ managers vs Barcap BAA spread, 1/1998-8/2011
(15)
(10)
98 99 00 01 02 03 04 05 06 07 08 09 10
3
4
Excess Core + Return BAA Ann Spread Change (Inverted, RHS)
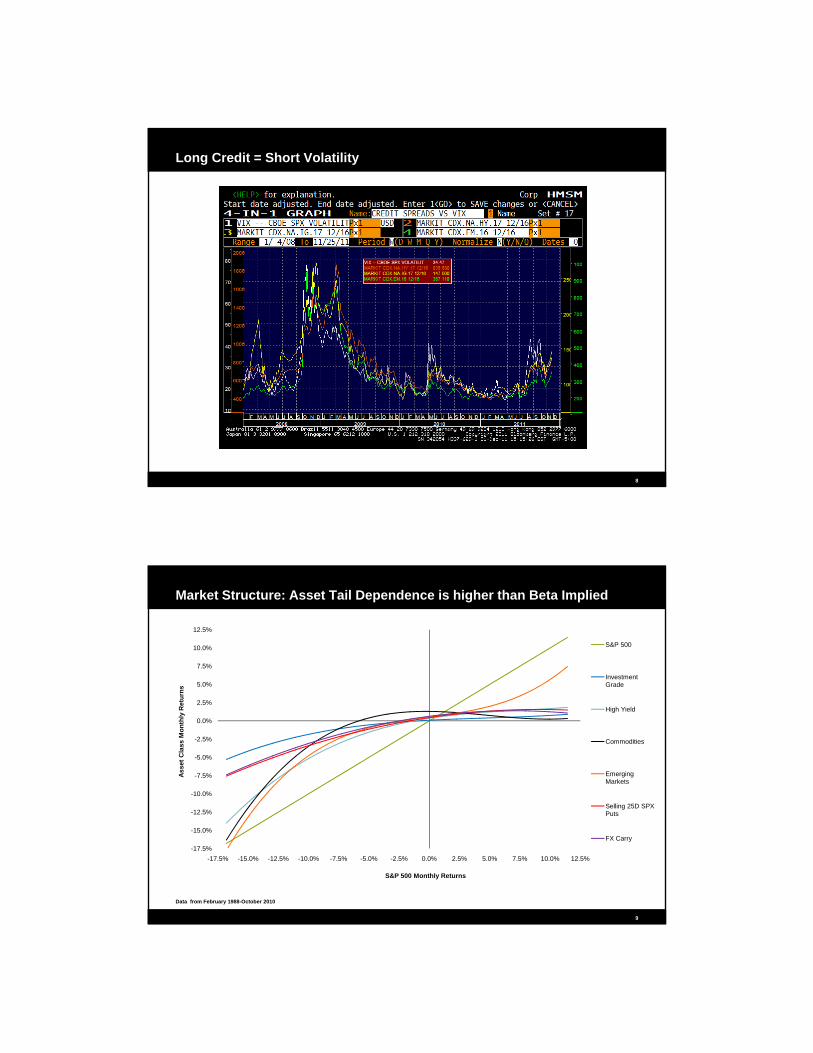
Long Credit = Short Volatility
8
5 0%
7.5%
10.0%
12.5%
S&P 500
Investment Grade
Market Structure: Asset Tail Dependence is higher than Beta Implied
-10.0%
-7.5%
-5.0%
-2.5%
0.0%
2.5%
5.0%
Asse
t Cla
ss M
onth
ly R
etur
ns
Grade
High Yield
Commodities
Emerging Markets
Selling 25D SPX
9
-17.5%
-15.0%
-12.5%
-17.5% -15.0% -12.5% -10.0% -7.5% -5.0% -2.5% 0.0% 2.5% 5.0% 7.5% 10.0% 12.5%
S&P 500 Monthly Returns
Selling 25D SPX Puts
FX Carry
Data from February 1988-October 2010

Statistics vs Reality: Tail Events Occur More Frequently Than Expected
Actual Tails Are “Fatter” Than Implied by a Normal Distribution
2.0%
on
0.5%
1.0%
1.5%
Cum
ulat
ive
Dis
tribu
tion
Func
tio
“In a normal distribution, a negative tail event should have occurred on about 28 days since 1928. In reality, extreme losses occurred about seven times as often, on 198 days”
Alli B t i Whit P
10
10January 1992–December 2011There can be no assurances fund objectives will be achieved*Copies of “Taking The Sting Out of the Tail: Hedging Against Extreme Events” are available upon requestSource: Bloomberg and AllianceBernstein
0.0%(4.5) (4.0) (3.5) (3.0) (2.5) (2.0)
Standard DeviationUS 10Yr S&P 500 BRL VIX US IG Normal
AllianceBernstein White Paper -Taking The Sting Out of the Tail: Hedging Against Extreme Events: October 2011*
Hedge Fund vs. SPX Monthly Returns
Hedge Fund Return Profiles: Short Volatility, Liquidity and/or Correlation
11
Hedge Fund Universe–HFRX Global Hedge Fund data from 01/98–10/10. Distressed/Restruc.–HFRI Distresssed/Restructuring Index data from 12/94–10/10. Convertible Arb–DJCS Convertible Arbitrage index data from 12/94–10/10. Event Driven–HFRI Event Driven (Total) index data from 12/94–10/10. Equity Hedge–HFRX Equity Hedge Index data from 01/98–10/10. Macro–HFRX Macro Index from 01/96–10/10. Managed Futures–DJCS Managed Futures Index from 12/94–10/10. Selling 25D Puts in S&P–data from 01/96–10/10.

VIX Distribution = Attractive Tail Hedge Profile, But Too Costly
12%
14%
Vix Daily Return Distribution
%
2%
4%
6%
8%
10%
Prob
abili
ty
12
-2%
0%-30% -23% -17% -11% -5% 1% 7% 13% 20% 26% 32% 38% 44% 50% 57% 63%
Daily Return
Data: 1/1997- 12/2010
Traditional Methods of Hedging are Expensive and May Have Marginal Impact
3m Delta 25 Put/Call Strike Moneyness 3mo Cost Annual Cost
Annual Breakeven
S&P 500 Put 1185 ‐7.21% 198bps 792bps ‐15.13%
VIX Call 37.5 39.93% 578bps 2312bps 63.05%Receiver On US 10yr Rates 1.9 27bps 70bps 280bps ‐49bps
CDX IG Payer 160 42bps 27.5bps 110bps 67bps
Brazilian Real Put 2.03 8.80% 161bps 644bps ‐15.24%
13
*Annual breakeven is the movement required (in % or in bps) in the underlying in order for the hedge to breakeven.
As of January 3, 2012

Tail Hedging Process
Seek to be long volatility (and liquidity/correlation)
Long Volatility
Objective: seek cost-effective tail-risk hedging opportunities across multiple asset classes
Identify the most efficient tail hedges (cost vspayout)
Diversify hedges across asset classes and structures, including indirect or non-traditional hedges that provide long volatility exposure
Interest rates / yield curve
Currencies
C dit
Long Volatility Exposure
Identify Most Efficient Tail
HedgesActively Manage
Tail Hedge Portfolio
14
Credit
Equity
Actively manage the strategy
Diversify Across Asset
Classes
As of July, 2012There can be no assurances fund objectives will be achieved.
Volatility Correlated Across Asset Classes
15

Diverse Range of Hedging Choices
Equities
VolatilityThe market has evolved to allow investors to implement strategies based on market volatility
h ti th VIX i d
Option strategies in global equity markets are just one way to hedge tail risk
Volatility
Rates
Sovereign Relative value opportunities in sovereign credit risk can offer attractive cost-efficient tail hedging
Duration and exposure to ‘risk-free’ assets may serve investors well in periods of market stress. Yield curve strategies (ie curve flatteners) may also help
such as options on the VIX index
16
CurrencyAs one of the most liquid markets in the world, currency strategies can provide effective and efficient tail hedge strategies including ‘anti-carry’ trades
As of August, 2012There can be no assurances fund objectives will be achieved.
CreditCredit and credit derivatives can offer compelling payout profiles in tail hedging. Credit strategies can span CDS to default protection on credit tranches
Objective: Seek Cost Effective Tail Risk hedging Opportunities Across Multiple Asset Classes
40 00%
50.00%
Seeks to provide large payoff in the tail (>3 Std), while minimizing hedge costs in calm/rising markets.
10 00%
0.00%
10.00%
20.00%
30.00%
40.00%
-8.40 -7.80 -7.20 -6.60 -6.00 -5.40 -4.80 -4.20 -3.60 -3.00 -2.40 -1.80 -1.20 -0.60 0.00
0.60
1X2
Pay
Off
At Expiration
Before Expiration
17
-20.00%
-10.00%
Underlying Asset Return
Strike X2 Strike X1
Simulation assumes hedge of selling 1x delta 25, 3 month options, buying 2x delta 12.5, 3 month options, rolling both monthly. Underlying asset classes assumed are Vix calls, AUD/JPY puts, AUD/USD puts and receivers on 10yr USD swaps, weighted by volatility.
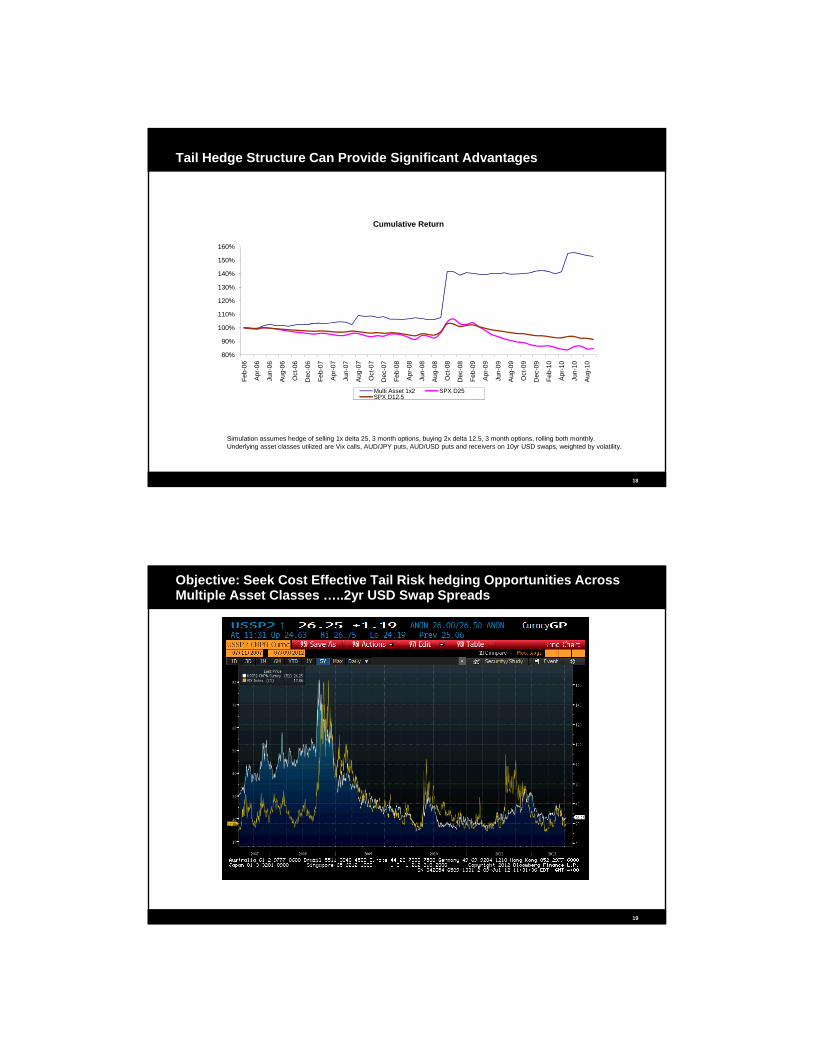
Tail Hedge Structure Can Provide Significant Advantages
160%
Cumulative Return
80%
90%
100%
110%
120%
130%
140%
150%
160%06 06 06 06 06 06 07 07 07 07 07 07 08 08 08 08 08 08 09 09 09 09 09 09 10 10 10 10
18
Feb-
0
Apr-
0
Jun-
0
Aug-
0
Oct
-0
Dec
-0
Feb-
0
Apr-
0
Jun-
0
Aug-
0
Oct
-0
Dec
-0
Feb-
0
Apr-
0
Jun-
0
Aug-
0
Oct
-0
Dec
-0
Feb-
0
Apr-
0
Jun-
0
Aug-
0
Oct
-0
Dec
-0
Feb-
1
Apr-
1
Jun-
1
Aug-
1
Multi Asset 1x2 SPX D25SPX D12.5
Simulation assumes hedge of selling 1x delta 25, 3 month options, buying 2x delta 12.5, 3 month options, rolling both monthly. Underlying asset classes utilized are Vix calls, AUD/JPY puts, AUD/USD puts and receivers on 10yr USD swaps, weighted by volatility.
Objective: Seek Cost Effective Tail Risk hedging Opportunities Across Multiple Asset Classes …..2yr USD Swap Spreads
19
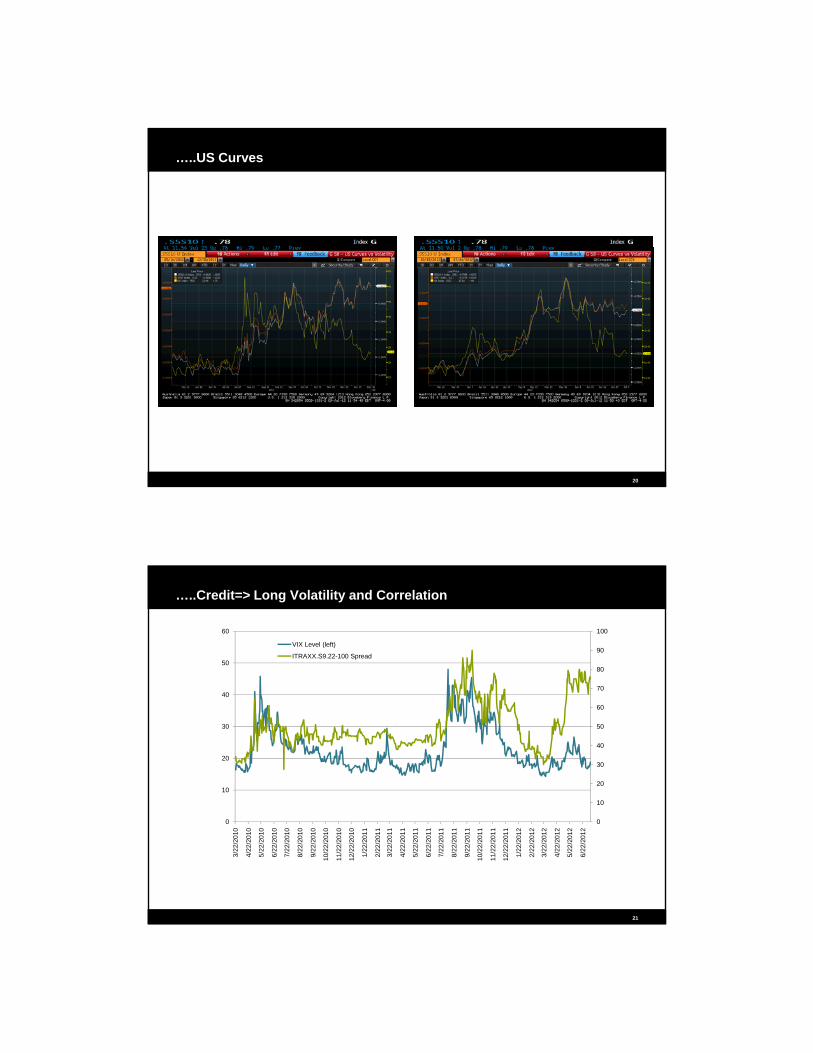
…..US Curves
20
…..Credit=> Long Volatility and Correlation
80
90
100
50
60
VIX Level (left)
ITRAXX.S9.22-100 Spread
10
20
30
40
50
60
70
10
20
30
40
21
0
10
0
3/22
/201
0
4/22
/201
0
5/22
/201
0
6/22
/201
0
7/22
/201
0
8/22
/201
0
9/22
/201
0
10/2
2/20
10
11/2
2/20
10
12/2
2/20
10
1/22
/201
1
2/22
/201
1
3/22
/201
1
4/22
/201
1
5/22
/201
1
6/22
/201
1
7/22
/201
1
8/22
/201
1
9/22
/201
1
10/2
2/20
11
11/2
2/20
11
12/2
2/20
11
1/22
/201
2
2/22
/201
2
3/22
/201
2
4/22
/201
2
5/22
/201
2
6/22
/201
2

…..Brazil, Mexico CDS
22
…..FX =>Short AUD, Long CAD (inverted)
23
Implementation and Challenges
Implementation
InternalResources/expertiseResources/expertise
FundLimited track recordsRange of strategies
Challenges
Basis RiskBasis Risk
Counterparty Risk
24
Summary
Mitigating large drawdowns is critical to investment success
Asset class based allocation/diversification is not sufficient
Innovative tail risk hedging strategies can provide downside protection at reasonable cost
Tail risk hedging should become an integral part of the asset allocation decision
25

Appendix
Presentation Disclosure
This presentation is for informational purposes only and is not intended to be an offer or solicitation, or the basis for any contract to purchase or sell any security or other instrument, or for AllianceBernstein to enter into or arrange any type of transaction as a consequence of any information contained herein. AllianceBernstein and its business units do not provide tax, legal or accounting advice and you should consult your professional advisors with p , g g y y prespect to such matters. This presentation is not intended for public use or distribution. Neither this presentation nor any of its contents may be used for any other purpose without the express consent of AllianceBernstein.
AllianceBernstein utilizes research and data from proprietary, public and private sources. Third party sources include Barclays Capital, Bloomberg, Bridgewater Associates, eVestment, HFRX, JP Morgan Securities, RiskMetrics.
26