taheri k, et al. determination of petrophysical parameters
TRANSCRIPT
Petroleum & Petrochemical Engineering JournalISSN: 2578-4846
MEDWIN PUBLISHERSCommitted to Create Value for Researchers
Determination of Petrophysical Parameters of Reservoir Rock with a Special Look to Shale Effect (Case Study: One of the Gas Fields in Southern Iran)
Pet Petro Chem Eng J
Determination of Petrophysical Parameters of Reservoir Rock with a Special Look to Shale Effect (Case Study: One of the Gas
Fields in Southern Iran)
Taheri K1*, Ansari AH2 and Kaveh F1
1MSc in Petroleum Engineering (Exploration), Department of Mining and Metallurgical Engineering, Yazd University, Iran2Associate Professor, Department of Mining and Metallurgical Engineering, Yazd University, Iran *Corresponding author: Kioumars Taheri, Department of Mining and Metallurgical Engineering, Yazd University, Yazd, Iran, Tel: +989388007475; Email: [email protected]
Research ArticleVolume 5 Issue 2
Received Date: April 05, 2021
Published Date: April 27, 2021
DOI: 10.23880/ppej-16000262
Abstract
Determination of petrophysical parameters is necessary for modeling hydrocarbon reservoir rock. The petrophysical properties of rocks influenced mainly by the presence of clay in sedimentary environments. Accurate determination of reservoir quality and other petrophysical parameters such as porosity, type, and distribution of reservoir fluid, and lithology are based on evaluation and determination of shale volume. If the effect of shale volume in the formation not calculated and considered, it will have an apparent impact on the results of calculating the porosity and saturation of the reservoir water. This study performed due to the importance of shale in petrophysical calculations of this gas reservoir. The shale volume and its effect on determining the petrophysical properties and ignoring it studied in gas well P19. This evaluation was performed in Formations A and B at depths of 3363.77 to 3738.98 m with a thickness of 375 m using a probabilistic calculation method. The results of evaluations of this well without considering shale showed that the total porosity was 0.1 percent, the complete water saturation was 31 percent, and the active water saturation was 29 percent, which led to a 1 percent increase in effective porosity. The difference between water saturation values in Archie and Indonesia methods and 3.3 percent shale volume in the zones show that despite the low shale volume in Formations A and B, its effect on petrophysical parameters has been significant. The results showed that if the shale effect not seen in the evaluation of this gas reservoir, it can lead to significant errors in calculations and correct determination of petrophysical parameters.
Keywords: Porosity; Indonesia methods; Shale effect; Water saturation; Lithology
Introduction
Determining petrophysical parameters using logs is one of the best methods to identify the formation and the study zones in a well [1]. Using petrophysical parameters, the reservoir parameters’ distribution within the three-
dimensional reservoir model can be predicted [2]. Knowledge of reservoir lithology and accuracy in selecting the studied well and the position of the well to other sectors of the field is one of the first steps in determining the petrophysical parameters of the reservoir rock [3]. The presence of shale in the formation is one of the main reasons for errors in
Petroleum & Petrochemical Engineering Journal 2
Taheri K, et al. Determination of Petrophysical Parameters of Reservoir Rock with a Special Look to Shale Effect (Case Study: One of the Gas Fields in Southern Iran). Pet Petro Chem Eng J 2021, 5(2): 000262.
Copyright© Taheri K, et al.
petrophysical assessment and estimation of water saturation, porosity, and consequently the volume of hydrocarbons in the formation. Changes in the mineralogical composition of shale affect their other properties. Variable properties and extensive modifications shale volume changes are very effective in exploration, drilling, and well completion, and most importantly, evaluation of formations using logs. Without sufficient information about the type of minerals present in the reservoir rock, the formation’s permeability may be severely affected despite improper drilling mud [4]. In recent years, studies have conducted in this field, some of which mentioned here. El-Din, et al. conducted a study to evaluate the petrophysical parameters using well logs in the upper Miocene of the El-Wastani Gas Field, the Nile Coastal Delta in Egypt. Shale volume, porosity, and water saturation obtained for hydrocarbon production areas of 50 percent, 10 percent, and 70 percent, respectively, based on cross-plot values and Gamma-Ray log data. Obtaining parameters such as net production thickness, average porosity, shale volume, and water saturation showed that Abu Madi Formation and Qawasim Formation have high reservoir quality and, in the future is a suitable place for gas storage [5]. Movahed, et al. conducted a study to investigate the petrophysical parameters of the Sarvak Formation in an oil field in southern Iran. Using conventional cross-plots such as neutron, density, and neutron-sonic cross-plots, the lithology of the Sarvak Formation evaluated. The results showed that zone the S2 with lime lithology and low shale volume is the best reservoir production zone [6]. Zhao, et al. using well logs, Obtained the petrophysical parameters of a finite oil reservoir. In this study, a new approach to estimation proposed a combination of the refractive index method of the formation and the Quasi-Archie method, which used to calculate its saturation from Di-Electric Logs. The effectiveness and reliability of this method were confirmed using a small oil layer in North-West China [7].
The following is a study by Al-Dousari, et al. that investigated the shear wave velocity in determining petrophysical parameters. In this study, the conventional regression Neural Network Model used to develop wave velocity predictions in sandstones, sandy shale, and carbonates. Some of the data were used as blind test sets to confirm this regression Neural Network model. The general regression neural network model calculates Vs. as a function of Vp in an average error of approximately 4 percent on average. At the same time, the mean absolute error for the blind test dataset was 3 percent [8]. Essien, et al. conducted another study to evaluate the petrophysical parameters of the Niger Delta in Nigeria. In this study, petrophysical parameters evaluated by logs of Gamma, Resistivity, sonic, density and Caliper. Parameters such as shale volume, porosity, water saturation, irreducible water saturation and total water volume obtained. The results also showed that
the favorable properties of this sandstone reservoir could be increased [9].
In this study, complete information of petrophysical logs and chart header were collected, and their qualitative analysis was performed. Petrophysical row data was entered into the software, and the data was processed. Necessary corrections were also made, and finally, shale volume was determined by drawing cross plots and comparing the results of different methods. The effect of shale on the practical porosity values was investigated. By dividing reservoir Formations A and B, the average petrophysical parameters and the thickness of the pay zone used in each section were determined. In this study, shale volume was calculated in production formations, which obtained porosity and saturation of formations using conventional methods. This study aimed to determine the type of lithology and the effect of shale on the values of porosity and saturation in Formations A and B.
Geological Setting
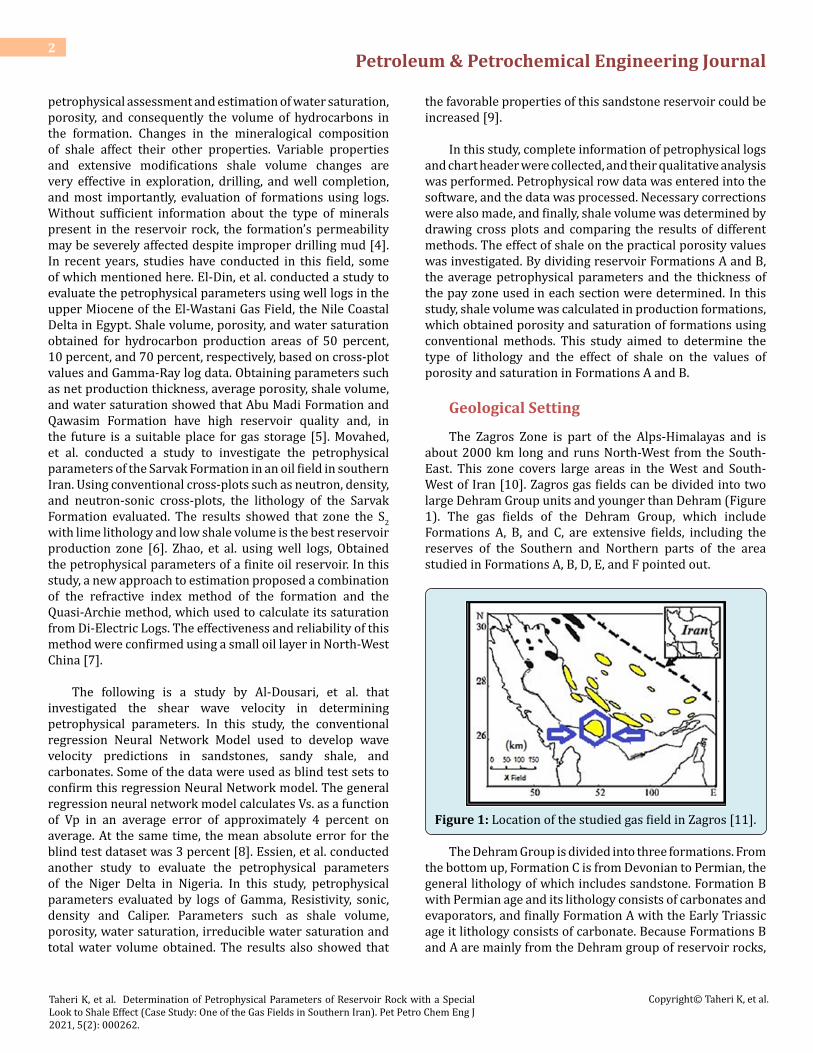
The Zagros Zone is part of the Alps-Himalayas and is about 2000 km long and runs North-West from the South-East. This zone covers large areas in the West and South-West of Iran [10]. Zagros gas fields can be divided into two large Dehram Group units and younger than Dehram (Figure 1). The gas fields of the Dehram Group, which include Formations A, B, and C, are extensive fields, including the reserves of the Southern and Northern parts of the area studied in Formations A, B, D, E, and F pointed out.
Figure 1: Location of the studied gas field in Zagros [11].
The Dehram Group is divided into three formations. From the bottom up, Formation C is from Devonian to Permian, the general lithology of which includes sandstone. Formation B with Permian age and its lithology consists of carbonates and evaporators, and finally Formation A with the Early Triassic age it lithology consists of carbonate. Because Formations B and A are mainly from the Dehram group of reservoir rocks,
Petroleum & Petrochemical Engineering Journal 3
Taheri K, et al. Determination of Petrophysical Parameters of Reservoir Rock with a Special Look to Shale Effect (Case Study: One of the Gas Fields in Southern Iran). Pet Petro Chem Eng J 2021, 5(2): 000262.
Copyright© Taheri K, et al.
these reservoirs are also known as B-A [12]. The study field is one of the enormous gas fields, which is called initially the Northern-Dome, and its Northern Slope is located in the waters of Iran [13]. The production formations of this field currently include A and B, which are produced from 4 layers X1 to X4 as the main reservoir formations. Also, anhydrite layers are the non-productive zone of the reservoir in this field. This formation is 854 meters thick and is composed of carbonate rocks along with anhydrite, dense dolomite, and calcite. The porosity of this reservoir area is between 5 and 15 percent. Recyclable and commercial hydrocarbons of this field are located in 4 reservoir layers Y1, Y2, Y3, and Y4, of which the Y4 layer is the main production potential of this reservoir. At the end of 2009, Iran reached a production of 171,428,000 cubic meters per day. The total production from this field until 1392 was 22.4 trillion cubic feet [14].
Materials and Methods
For this study, information about gas well P19 with about 2 million cubic feet per day of gas production was used and was of great importance in this gas field. Excel and Geolog Software were used in the process of determining petrophysical parameters and investigating the effect of shale on calculations. Digital data related to well logging and chart header information was collected as raw data. Table 1 shows the available logs. The information contained in the chart header includes the mud properties, the temperature at the bottom-hole, the resistivity of the mud samples, the mud filtrate and their associated temperatures, mud density, and the bit size [15]. Along with the above information, reservoir data such as hydrocarbon density (oil and gas), formation fluid salinity, and drilling mud salinity were also used.
Available logs Well Name
BS, CALI, DT, CGR, SGR, RLA5,RXO, PEF, RHOB, NPHI, POTA, URAN, THOR P19
Table 1: Logs in Formations A and B of the studied well.
After preparing the information and converting all the files with different formats (LAS, DLIS, LIS, and Excel) to LAS format, which is one of the acceptable formats of Geolog Software, all the required information in Geolog Software was uploaded and stored in the database. After displaying the data, the next step is their quality control, and if there is a problem with the data during the quality control process, the data is edited. Thus, it is clear that one of the purposes of the displays is to control their quality.
This study was performed using the probabilistic calculation method. This method describes the physical properties and properties of the fluids in the rock along
with the parameters affecting them, which are covered by the related equations. These equations are affected by and depend on various parameters. In the probabilistic method, there is a multiple and reciprocal relationship between the measured values and the responses. Archie coefficients are not only used to calculate water saturation and can also affect the calculation of porosity. The reason for this is the simultaneous solution of all equations. In the probabilistic method, it is also possible to calculate the uncertainties as a fixed value or a log for all the records present in the equations used in this method. With the help of these uncertainties, the validity of each log can be determined. One record can be considered for each log. For records whose uncertainty diagram shows different values from their original log or generally do not have suitable conditions, more weight was supposed less effective than that log. To be taken.
Investigation of Hole and Bit Size Logs and Depth Matching
If the log value of the density difference outside the range of 0.2 to -0.2 g / cm3 and the difference between the log caliper and the bit size is more than 1 inch (according to the hole size of 8.5 inches), the desired depth is considered as a wrong hole. According to the mentioned conditions, Geolog identified the depth range of 3364 to 3450 as a wrong hole. In the quality control of the data, attention was paid to the depth matching of different logs in this well. In case of stopping or stretching of the cable logging in the well can be corrected and depth matching operations can be performed on them [16]. Another reason for depth matching is to perform logging operations in several stages. If a log does not peak at the same depth as other logs, depth matching operations should be performed on that log [17]. In this study, due to the predominant lithology of the lime, the neutron log was considered the source log, and the other logs showed a good deep agreement with the source log, and as a result, all depth matching was omitted.
Preliminary Calculations and Environmental Corrections
This stage is calculated using specific parameters, including bottom-hole temperature (BLT) and top-hole (TLT), mud density, specific drilling mud resistivity, mud filtrate with their temperature, formation pressure, and bit size. In the depth range of the wells studied in Formations A and B, the maximum and minimum temperatures according to the information in the chart header are 219.5 and 203 degrees Fahrenheit, respectively, the density of drilling mud is 11 pounds per gallon (lb/g), and the bit size is 8.5 inches. Since the resistivity changes with temperature and depth and it is not possible to use a fixed number for the whole formation, a log or resistivity profile should be used for mud resistivity
Petroleum & Petrochemical Engineering Journal 4
Taheri K, et al. Determination of Petrophysical Parameters of Reservoir Rock with a Special Look to Shale Effect (Case Study: One of the Gas Fields in Southern Iran). Pet Petro Chem Eng J 2021, 5(2): 000262.
Copyright© Taheri K, et al.
(Rm), mud filtrate resistivity (Rmf), and mud-cake resistivity (Rmc). The profiles of the named resistors were determined according to the resistance presented in the chart header and their related temperatures. Table 2 shows the different resistivity of drilling mud.
Mud-Cake Resistivity
Mud Filtrate Resistivity
Mud Resistivity
Well Name
0.09 ohm-m at 96 °F
0.056 ohm-m at 96 °F
0.019 ohm-m at 96 °F P19
Table 2: Resistivity information in the well chart header.
Conversion values are obtained by inverting the resistance of the uninvaded zone (Rt) and the flushed zone (Rxo). Various companies, such as Schlumberger and Halliburton, conduct well surveying and logging wells, each of which uses its charts to perform environmental corrections. Therefore, according to the company that carried out the well logging operation, the charts related to the same company should correct environmental factors [17]. Logging in the well P19 has been done by Schlumberger Company, so in performing environmental corrections, standard charts related to this company, which are available in Geolog Software, have been used. In this study, all logs have been environmentally corrected.
Identifying of Lithology and Type of Clay Mineral
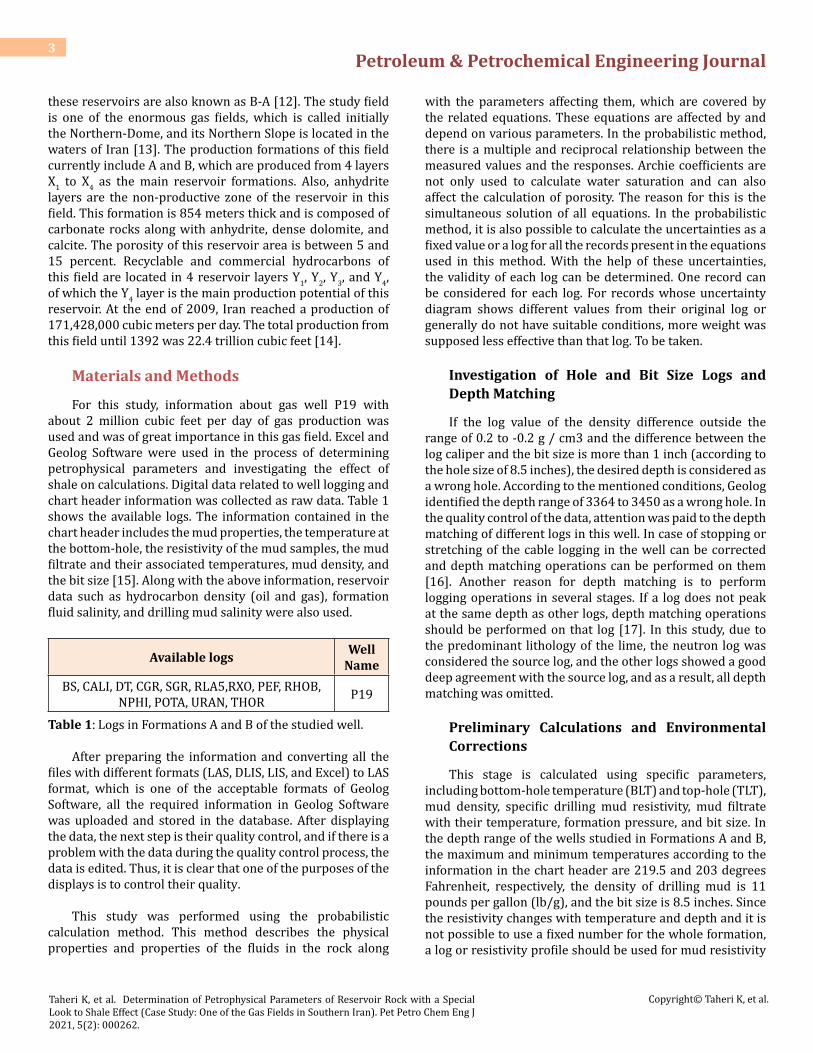
Figure 2: M-N plot for mineral identification [18].
Figure 2 shows the M-N diagram, in which the M value was obtained from the Density-Sonic cross-plate and the N value was obtained from the Neutron-Density cross-plate, and Equations 1 & 2.
( ) 1( ) / – – 0.0fl b flM t t ρ ρ= ∆ ∆ × (1)
( ) ( ) – / – 0.01Nfl N b flN ϕ ϕ ρ ρ= × (2)
In these equations, ∆tf is the time of Transmitting acoustic through the rock fluid, ∆t is the time of Transmitting sound waves through the rock, ρ is the rock density, ρf is the fluid density, φNf is the response of the neutron log to the rock fluid, φN is the response of the neutron log to the formation. The M-N Plot is a cross-sectional diagram used to determine the type of rock matrix minerals. This cross-plot is used to assess lithology using three porosity diagrams. The combination of density and sonic logs for M’s definition is not more than the slope of the ρb-∆t curve. The neutron-density cross-plot ends in a similar slope called N. In this cross-plot, M and N plot against each other.
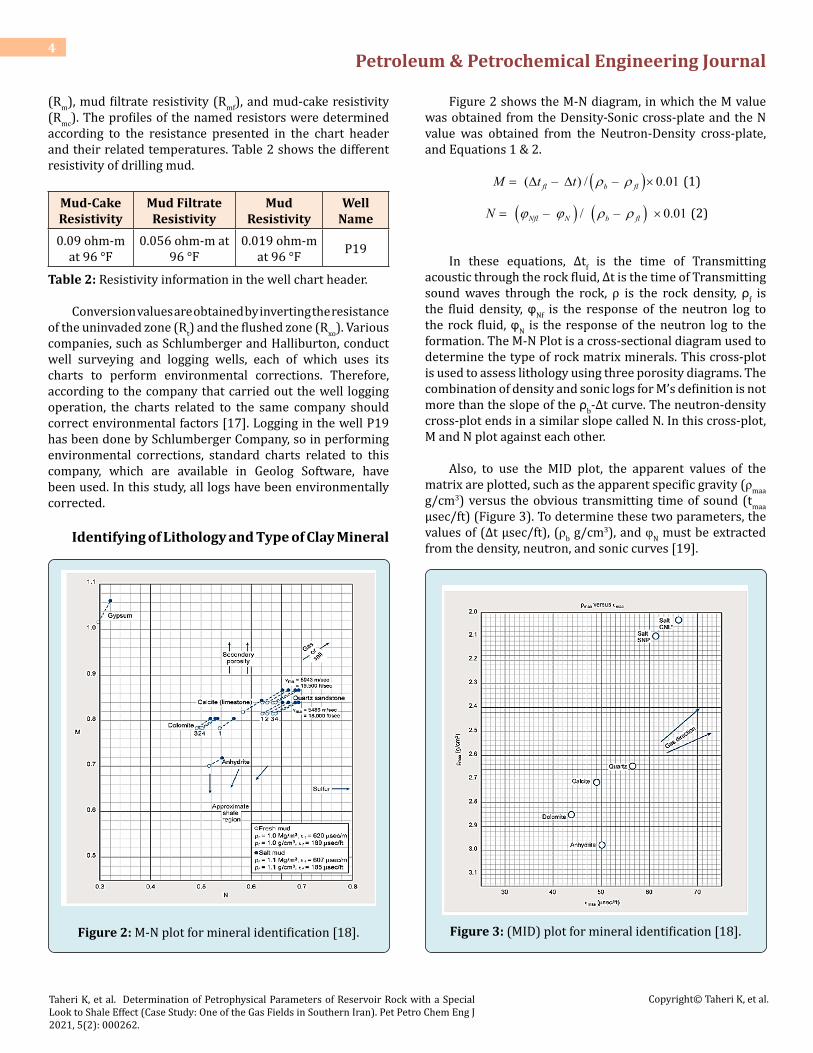
Also, to use the MID plot, the apparent values of the matrix are plotted, such as the apparent specific gravity (ρmaa g/cm3) versus the obvious transmitting time of sound (tmaa µsec/ft) (Figure 3). To determine these two parameters, the values of (∆t µsec/ft), (ρb g/cm3), and φN must be extracted from the density, neutron, and sonic curves [19].
Figure 3: (MID) plot for mineral identification [18].

Petroleum & Petrochemical Engineering Journal 5
Taheri K, et al. Determination of Petrophysical Parameters of Reservoir Rock with a Special Look to Shale Effect (Case Study: One of the Gas Fields in Southern Iran). Pet Petro Chem Eng J 2021, 5(2): 000262.
Copyright© Taheri K, et al.
In this study, after environmental corrections, neutron-density, M_N, and MID plots were used to determine lithological facies, shown in Figure 4 (all three cross-plots using the Gamma-ray log. Have been painted). The result
of the drawn plots indicates that the predominant lithology in the well P19 is dolomite and calcite and between layers of anhydrite and shale. Geological data from the area also confirms these results.
B A
C
Figure 4: Determination of well lithology using A) Neutron-Density plot B) M-N plot C) MID plot.
XRD data should be used to determine the type of clay minerals accurately. If this information is not available, the kind of clay mineral can be selected from Geology Software using thorium-potassium (Th/K) cross-platform. In this study, due to the shallow volume of thorium and potassium, the software could not draw the crossover for well P19. Because it was difficult to determine a specific clay mineral for Formations A and B. The shale of these formations was a mixture of Illite, Kaolinite, and Mont-Morillonite, wet clay was used in software calculations instead of a specific mineral.
Determination of Water Salinity, Real Resistivity of Formation, Specific Resistivity of Water and Archie Coefficients
The most accurate method of calculating this parameter is a direct measurement of formation water salinity. In this
study, the saltiness of the water formation was 284000 ppm, and the percentage of KCl salt in the formation was 4.4 percent, which due to the inverse relationship between the water-resistivity of the formation and its salinity, the resistivity value was determined to be 0.0138. Also, the RLA5 log was used as a resistivity log with high search depth to determine the actual resistivity of the formation. Archie coefficients in this study, according to reports, were considered for n = 2, m = 2, and for a = 1, which were correct by drawing the NPHI-RXO picket plot and placing all plotted values between two saturation lines of 10 and 100 percent, the selected values were confirmed (Figure 5).
Finally, the shale volume obtained using the probabilistic calculation method was plotted as a histogram in Figure 6, which sufficiently shows the shale volume in Formations A and B in the well P19.

Petroleum & Petrochemical Engineering Journal 6
Taheri K, et al. Determination of Petrophysical Parameters of Reservoir Rock with a Special Look to Shale Effect (Case Study: One of the Gas Fields in Southern Iran). Pet Petro Chem Eng J 2021, 5(2): 000262.
Copyright© Taheri K, et al.
Figure 5: RXO-NPHI picket plot to check the accuracy of m, n, and values.
Figure 6
Table 3 shows the results of the shale volume histogram, in which the average, maximum and minimum shale volume calculated in the well are indicated. As can be seen, the average shale volume is 3.37 percent and suggests that these formations are composed of dolomite and clean lime without
clay.
Maximum Volume of Hydrated
Shale (Percent)
Minimum Volume of Hydrated
Shale (Percent)
Average Volume of Hydrated
Shale (Percent)
Well Name
50 0 3.3 P19
Table 3: Average and maximum shale volume calculated in the studied well.
Table 4 shows the mean, minimum, and maximum porosity values calculated in two modes with and without shale. As expected, if shale is considered in calculations Due to the high and non- effective porosity of the shale, the amount of total porosity increases, and the amount of effective porosity decreases.
Finally, the shale volume obtained using the probabilistic calculation method was plotted as a histogram
in Figure 6, which sufficiently shows the shale volume in
Formations A and B in the well P19.
Without Shale
With Shale
Average Total Porosity (percent) 4.25 4.39Maximum Total Porosity (percent) 18.36 23.07Minimum Total Porosity (percent) 0 0Mean Effective Porosity (percent) 4.25 3.82
Maximum Effective Porosity (percent) 24 18Minimum Effective Porosity (percent) 0 0
Table 4: Average, minimum and maximum porosity calculated in two modes with shale and without shale.
Investigation of Shale Effect on Water Saturation Values
Table 5 shows the average total and effective water saturation calculated in two modes with and without shale. As expected, if shale is taken into account in the calculations, due to the presence of Bound Water in the shale, the total and effective water saturation will increase.
Without Shale
With Shale
Average Total Water Saturation 0.3706 0.6829Average Effective Water Saturation 0.3706 0.6624
Table 5: Average water saturation calculated in two modes, with shale, and without shale.

Petroleum & Petrochemical Engineering Journal 7
Taheri K, et al. Determination of Petrophysical Parameters of Reservoir Rock with a Special Look to Shale Effect (Case Study: One of the Gas Fields in Southern Iran). Pet Petro Chem Eng J 2021, 5(2): 000262.
Copyright© Taheri K, et al.
Determining the Correlation between Archie and Indonesia Methods with Shale and without Shale
This model was offered by Poupon-Leveaux, known as Indonesia, and was introduced for use in Indonesia. Because the existence of freshwater formation and high shale percentage caused the inefficiency of other methods in this country, this equation states that Vsh has a power that is itself a function of Vsh [20]. In this method, if we obtain the electrical conductivity of hydrocarbons from Equation 3 and the actual electrical conductivity from Equation 4, the amount of water saturation is calculated from Equation 5. In the hydrocarbon zones, Indonesia’s relationship is:
12shV
Wo sh sh
cC V C
F−
= + × (3)
12 2 2
shVn nW
t w sh sh wc
C S V C SF
−= × + × × (4)
1w shnw mt sh
aR vS
R Rϕ
= × −
(5)
In this equation, CO: Electrical conductivity of hydrocarbon, Cw: Electrical conductivity of water, F: Formation coefficient, Vsh: Shale volume, Csh: Electrical conductivity of shale, Ct: absolute electrical conductivity of the formation, and Sw are the water saturation of the formation.
Discussion and Results
In this study, to emphasize the effect of shale in water saturation calculations, the correlation between Archie and Indonesia methods in two cases with shale and without shale was calculated and plotted in Figures 7 & 8.
Figure 7: Correlation diagram of two methods of calculating water saturation of Archie and Indonesia with shale.
Figure 8: Correlation diagram of two methods of calculating water saturation of Archie and Indonesia without shale.
Petroleum & Petrochemical Engineering Journal 8
Taheri K, et al. Determination of Petrophysical Parameters of Reservoir Rock with a Special Look to Shale Effect (Case Study: One of the Gas Fields in Southern Iran). Pet Petro Chem Eng J 2021, 5(2): 000262.
Copyright© Taheri K, et al.
The methods of calculating water saturation for shale formations are converted to Archie relation in shale-less formations; therefore the saturation values calculated by the Indonesia method without shale show a high correlation with the Archie method, and Conversely, with shale, the amount of correlation decreases significantly. Conversely, with the presence of shale, the correlation value decreased significantly. The graph in Figure 9 was used to show the difference between the water saturation values calculated by the Archie and Indonesia methods. Based on the chart, water saturation values calculated by Indonesia and Archie models showed more difference with increasing shale volume in the formations.
Figure 9: Difference between water saturation values calculated by Archie and Indonesia models with shale.
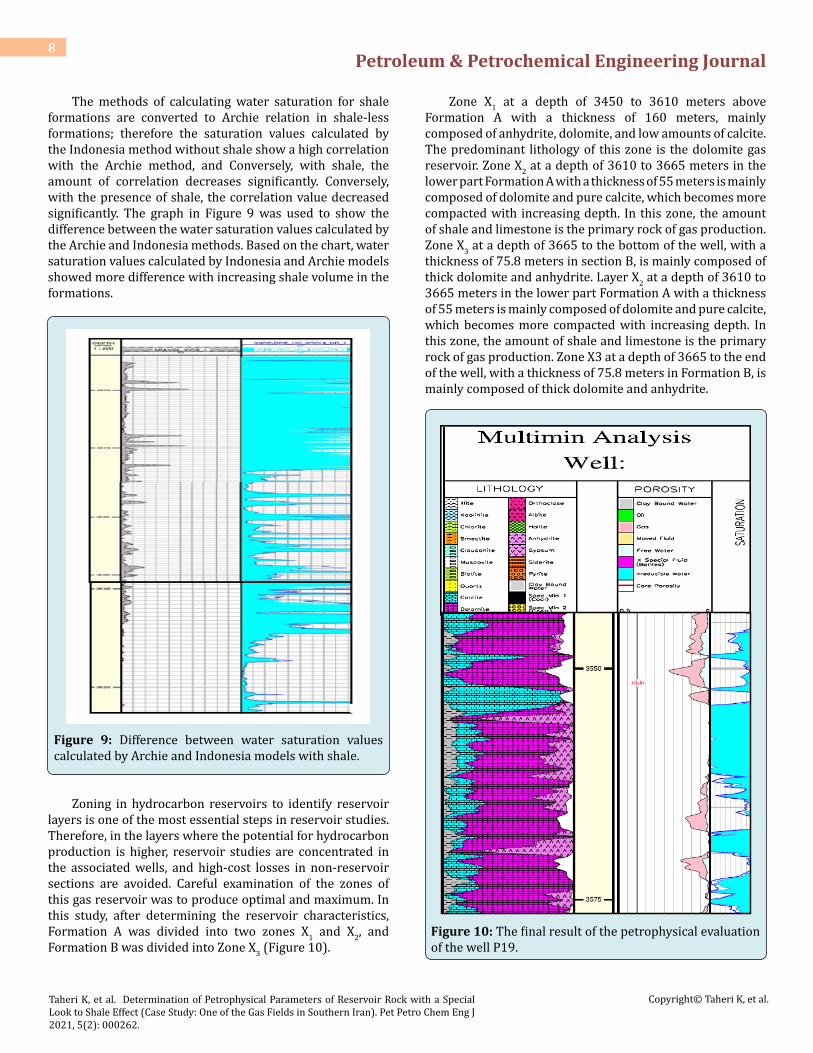
Zoning in hydrocarbon reservoirs to identify reservoir layers is one of the most essential steps in reservoir studies. Therefore, in the layers where the potential for hydrocarbon production is higher, reservoir studies are concentrated in the associated wells, and high-cost losses in non-reservoir sections are avoided. Careful examination of the zones of this gas reservoir was to produce optimal and maximum. In this study, after determining the reservoir characteristics, Formation A was divided into two zones X1 and X2, and Formation B was divided into Zone X3 (Figure 10).
Zone X1 at a depth of 3450 to 3610 meters above Formation A with a thickness of 160 meters, mainly composed of anhydrite, dolomite, and low amounts of calcite. The predominant lithology of this zone is the dolomite gas reservoir. Zone X2 at a depth of 3610 to 3665 meters in the lower part Formation A with a thickness of 55 meters is mainly composed of dolomite and pure calcite, which becomes more compacted with increasing depth. In this zone, the amount of shale and limestone is the primary rock of gas production. Zone X3 at a depth of 3665 to the bottom of the well, with a thickness of 75.8 meters in section B, is mainly composed of thick dolomite and anhydrite. Layer X2 at a depth of 3610 to 3665 meters in the lower part Formation A with a thickness of 55 meters is mainly composed of dolomite and pure calcite, which becomes more compacted with increasing depth. In this zone, the amount of shale and limestone is the primary rock of gas production. Zone X3 at a depth of 3665 to the end of the well, with a thickness of 75.8 meters in Formation B, is mainly composed of thick dolomite and anhydrite.
Figure 10: The final result of the petrophysical evaluation of the well P19.

Petroleum & Petrochemical Engineering Journal 9
Taheri K, et al. Determination of Petrophysical Parameters of Reservoir Rock with a Special Look to Shale Effect (Case Study: One of the Gas Fields in Southern Iran). Pet Petro Chem Eng J 2021, 5(2): 000262.
Copyright© Taheri K, et al.
To obtain a suitable output from petrophysical parameters and determine the thickness of the pay zone, boundaries and cut-off are needed. For the studied reservoir, the cut-off values of porosity and water saturation were considered 1.5 percent and 70 percent, respectively. Using the output results of Geolog software, potential reservoir zones were identified. The net and gross zone thickness, its ratio, and the average of petrophysical parameters in different zones were
obtained. Also, to determine the thickness of the economic layers in this study, the value of the net zone thickness to the gross zone and then its value relative to the total thickness of the formation was obtained. The closer this value came to number one, the better the quality of the reservoir. Table 6 shows the values of gross zone thickness, net zone thickness, and net to gross zone thickness ratio, mean effective porosity, and average effective water saturation for zones X1, X2, and X3.
Average Effective Water Saturation
Average Effective Porosity
Net to Gross Zone Thickness
Net Zone Thickness (Pay Zone)
Gross Zone Thickness
Zone Name
0.199 0.093 0.433 70.891 160 X10.085 0.087 0.776 42.681 55 X20.228 0.073 0.352 26.661 75 X3
Table 6: Average petrophysical parameters and production layer thickness in three zones X1, X2 and X3.
Conclusions
1. To obtain the best results in determining the petrophysical properties, the parameters of shale volume, porosity, and water saturation were calculated by conventional methods (according to available data) and core data used to confirm the calculations of this method. The results showed that using the CGR log to determine shale volume, neutron-density method to determine porosity, Indonesia method to calculate water saturation are the most suitable methods in this gas reservoir.
2. Drawn cross-plots showed that Formations A and B are composed of dolomite, lime, anhydrite and scant shale volume. The average volume of shale in this well was low and about 3 percent. The results showed that these formations are mainly composed of dolomite and clean lime without clay and had a high reservoir quality for hydrocarbon accumulation.
3. The results show that the difference in the values of total porosity and effective porosity of the formation is due to the relatively large shale volume that the X1 zone had the highest effective porosity.
4. To determine the gross thickness, net, and production zone, cutting limits were defined, which showed that the ratio of net thickness to gross X2 zone has the highest value and has a high reservoir quality. Also, Formations A and B have reservoir conditions, and the X2 zone is the best reservoir zone in these formations.
5. Comparing Indonesian and Archie methods for measuring water saturation, the results showed that the Archie method should not be used in reservoir rocks with low shale volume and the difference between the two methods increased by examining the specific effect of shale in calculating petrophysical parameters. The increase in the difference between total water saturation and effective water saturation in shallow depth ranges
indicated the shale effect, even with small volumes, on water saturation calculations, with Zone X3 having the lowest water saturation.
Acknowledgments
The authors would like to thank the Petrophysics Department, the National Oil Company and those who assisted in developing this study.
References
1. Taheri K, Hadadi A (2021) Improving the petrophysical evaluation and fractures study of Dehram Group Formations using conventional petrophysical logs and FMI image log in one of the wells of South Pars Field. Journal of Petroleum Science and Technology 10(4): 31-40.
2. Taheri K, Morshedy A (2017) Three-dimensional Modeling of Mud Loss Zones Using the Improved Gustafson-Kessel Fuzzy Clustering Algorithm (Case Study: One of the South-western Oil Fields). Journal of Petroleum Research 27(5): 82-97.
3. Movahed B (2010) Foundations of wells. 5th(Edn.), Amir Kabir University of Technology, Tehran, Iran, pp: 330.
4. Taheri K, Mohammad Torab F (2017) Applying indicator kriging in modeling of regions with critical drilling fluid loss in Asmari reservoir in an oil field in Southwestern Iran. Journal of Petroleum Research 27(95): 91-104.
5. El-Din E, Mesbah M, Kassab M, Mohamed I, Cheadle B, et al. (2013) Assessment of petrophysical parameters of clastics using well logs: The Upper Miocene in El-Wastani gas field, onshore Nile Delta, Egypt. Journal of Petroleum

Petroleum & Petrochemical Engineering Journal 10
Taheri K, et al. Determination of Petrophysical Parameters of Reservoir Rock with a Special Look to Shale Effect (Case Study: One of the Gas Fields in Southern Iran). Pet Petro Chem Eng J 2021, 5(2): 000262.
Copyright© Taheri K, et al.
Exploration and Development 40(4): 488-494.
6. Movahed A, Masihi M, Hashemi A (2015) Investigation of petrophysical parameters of upper Sarvak Formation in one of the Iran South Oilfields. Journal of Current World Environment 10(1): 740-751.
7. Zhao P, Zhuang W, Sun Z, Wang Z, Luo X, et al. (2016) Methods for estimating petrophysical parameters from well logs in tight oil reservoirs: a case study. Journal of Geophysics and Engineering 13(1): 78-85.
8. Al-Dousari M, Garrouch A, Al-Omair O (2016) Investigating the dependence of shear wave velocity on petrophysical parameters. Journal of Petroleum Science and Engineering 146(1): 286-296.
9. Essien U, Akankpo A, Agbasi O (2017) Evaluation of reservoir’s petrophysical parameters, Niger Delta, Nigeria. International Journal of Advanced Geosciences 5(1): 19-25.
10. Darvishzadeh A (2003) Geology of Iran. 3rd(Edn.), Neda Publications house, Amirkabir University, Tehran, Iran, pp: 902.
11. Aqanbati A (2004) Geology of Iran. Geological Survey of Iran, Tehran, Iran, pp: 606.
12. Sepehr M, Cosgrove J.W (2004) Structural framework of the Zagros Fold–Thrust Belt Iran. Marine and Petroleum Geology 21(7): 829-843.
13. Kiany D (2019) Comparison of gas production between Iran and Qatar in South Pars Field. Journal of Economic and Social Research 18(1): 77-86.
14. Shammas P (2001) Iran: review of petroleum developments and assessments of the oil and gas fields. Energy Exploration & Exploitation 19(2&3): 207-260.
15. Taheri K, Mohammad Torab F (2016) Modeling mud loss in Asmari Formation using geostatistics in Gachsaran oil field. Iranian Journal of Petroleum Geology 6(11): 84-101.
16. Taheri K, Nakhaee A, Alizadeh H, Naseri Karimvand M (2018) Correction investigating the design of casing pipes using drilling data analysis in Bangestan wells, one of the oil fields in the Southwest of Iran. Journal of Petroleum Geomechanics 2(1): 41-54.
17. Mondol NH (2015) Well Logging: Principles, Applications and Uncertainties. In: Bjørlykke K (Ed.), Petroleum Geoscience. Springer, Berlin, Heidelberg, Germany, pp: 425.
18. Schlumberger Co (1997) Schlumberger log interpretation charts. Schlumberger wireline & Testing, Houston, Texas, United State, pp: 330.
19. Islam ARMT, Habib MA, Islam MT, Mita MR (2013) Interpretation of wireline log data for reservoir characterization. Journal of Applied Geology and Geophysics 1(4): 47-54.
20. Ehsan M, Gu H, Ahmad Z, Akhtar M, Abbasi S (2019) A modified approach for volumetric evaluation of shaly sand formations from conventional well logs: A case study from the Talhar Shale, Pakistan. Arabian Journal for Science and Engineering, 44(8): 417-428.