tackle 25 - 2019
TRANSCRIPT
Tackle Trading - Tackle 252
Tackle 25
Dividends Fireworks
Poor Boy’s Covered Call
Dirty Sexy Money
Module 1: Meet the Covered Call
Module 2: Call Option Basics
Module 3: The Covered Call Playbook
Module 4: Trade Management › Bulls
Module 5: Trade Management › Sideways
Module 6: Trade Management › Bears
Module 7: Earnings & Collars
The Ultimate Power in the Universe
Rule of 72
Interests for Investors
Covered Calls Compounded
The Search for Better Risk-Adjusted Returns
How to Build a Better Mouse Trap
Covered Calls: Weekly vs. Monthly
Cash Flow Trickery: Part I
Cash Flow Trickery: Part II
3
4
5
6
7
10
13
16
19
21
23
27
28
28
29
31
36
40
42
44
SUMMARY
Tackle Trading - Tackle 253
Symbol Company Name Sector | Industry | CountryAAPL Apple Inc. Consumer Goods | Electronic Equipment | USA
AMAT Applied Materials, Inc. Technology | Semiconductor Equipment & Materials | USA
ATVI Activision Blizzard, Inc. Technology | Multimedia & Graphics Software | USA
BSX Boston Scientific Corporation Healthcare | Medical Appliances & Equipment | USA
CSX CSX Corporation Services | Railroads | USA
CVS CVS Health Corp Healthcare | Health Care Plans | USA
DAL Delta Air Lines, Inc. Industrials
DIS Walt Disney Co Services | Entertainment - Diversified | USA
ETFC E*TRADE Financial Corp Financial | Investment Brokerage - National | USA
INTC Intel Corporation Technology | Semiconductor - Broad Line | USA
JPM JPMorgan Chase & Co. Financial | Money Center Banks | USA
KMX CarMax, Inc Services | Auto Dealerships | USA
MO Altria Group Inc Consumer Goods | Cigarettes | USA
MSFT Microsoft Corporation Technology | Business Software & Services | USA
NEM Newmont Mining Corp Basic Materials | Gold | USA
NRG NRG Energy Inc Utilities | Diversified Utilities | USA
NUE Nucor Corporation Basic Materials | Steel & Iron | USA
PFE Pfizer Inc. Healthcare | Drug Manufacturers - Major | USA
PYPL Paypal Holdings Inc Financial | Credit Services | USA
SBUX Starbucks Corporation Services | Specialty Eateries | USA
STZ Constellation Brands, Inc. Class A Consumer Goods | Beverages - Wineries & Distillers | USA
TOL Toll Brothers Inc Industrial Goods | Residential Construction | USA
VLO Valero Energy Corporation Basic Materials | Oil & Gas Refining & Marketing | USA
WMT Walmart Inc Services | Discount, Variety Stores | USA
XOM Exxon Mobil Corporation Basic Materials | Major Integrated Oil & Gas | USA
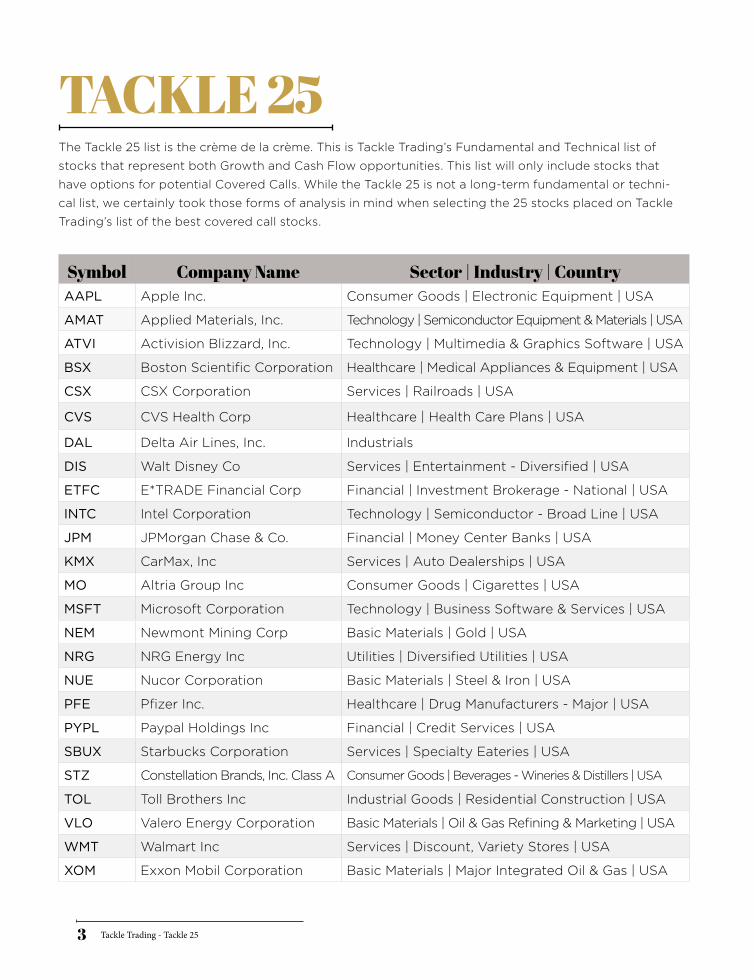
TACKLE 25The Tackle 25 list is the crème de la crème. This is Tackle Trading’s Fundamental and Technical list of
stocks that represent both Growth and Cash Flow opportunities. This list will only include stocks that
have options for potential Covered Calls. While the Tackle 25 is not a long-term fundamental or techni-
cal list, we certainly took those forms of analysis in mind when selecting the 25 stocks placed on Tackle
Trading’s list of the best covered call stocks.
Tackle Trading - Tackle 254
Symbol Company Name Sector | Industry | Country
BA Boeing Co Industrial Goods | Aerospace/Defense Products & Services | USA
BK Bank of New York Mellon Corp Financial | Asset Management | USA
IP International Paper Co Consumer Goods | Packaging & Containers | USA
KO The Coca-Cola Co Consumer Goods | Beverages - Soft Drinks | USA
OKE ONEOK, Inc. Utilities | Gas Utilities | USA
PM Philip Morris International Inc. Consumer Goods | Cigarettes | USA
TGT Target Corporation Services | Discount, Variety Stores | USA
TSN Tyson Foods, Inc. Consumer Goods | Meat Products | USA
TXN Texas Instruments Incorpo-rated Technology | Semiconductor - Broad Line | USA
VZ Verizon Communications Inc. Technology | Telecom Services - Domestic | USA
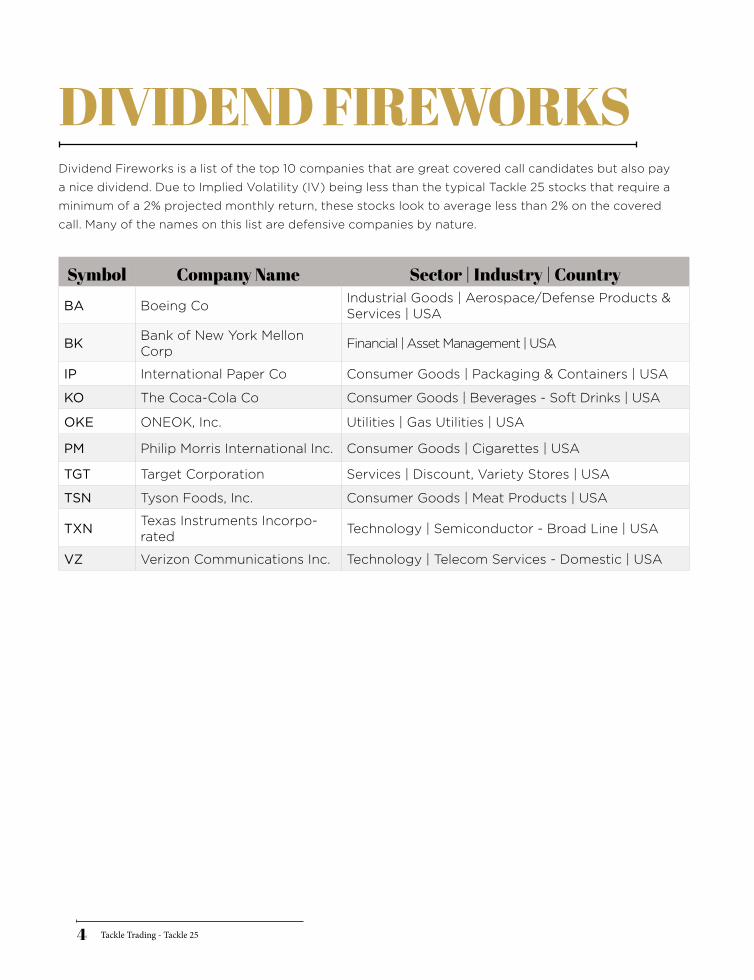
DIVIDEND FIREWORKSDividend Fireworks is a list of the top 10 companies that are great covered call candidates but also pay
a nice dividend. Due to Implied Volatility (IV) being less than the typical Tackle 25 stocks that require a
minimum of a 2% projected monthly return, these stocks look to average less than 2% on the covered
call. Many of the names on this list are defensive companies by nature.
Tackle Trading - Tackle 255
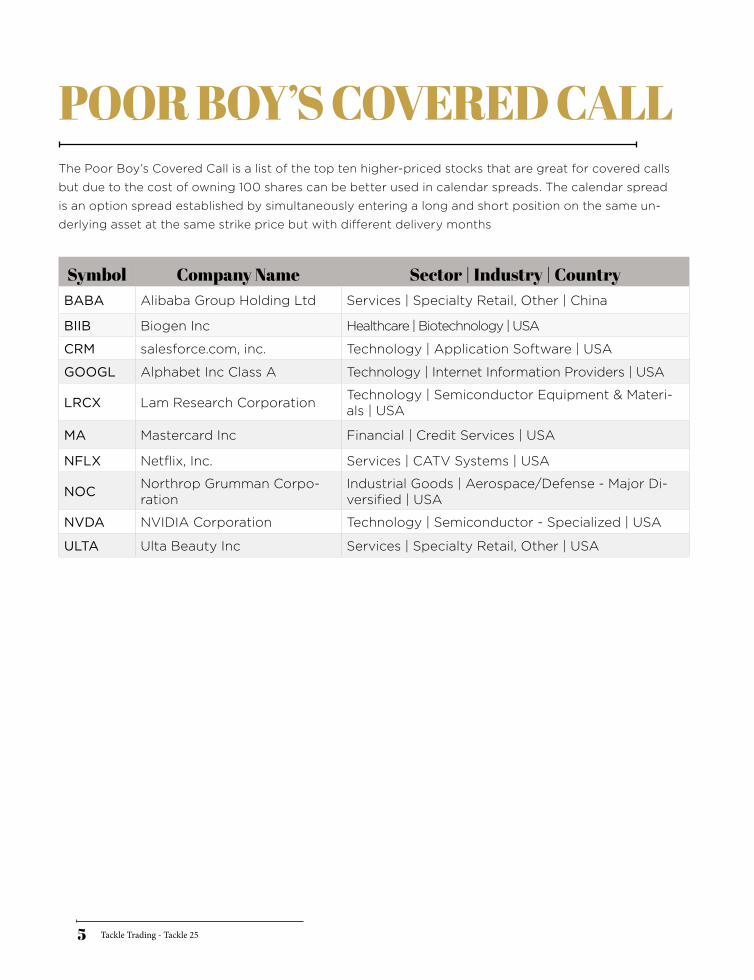
Symbol Company Name Sector | Industry | CountryBABA Alibaba Group Holding Ltd Services | Specialty Retail, Other | China
BIIB Biogen Inc Healthcare | Biotechnology | USA
CRM salesforce.com, inc. Technology | Application Software | USA
GOOGL Alphabet Inc Class A Technology | Internet Information Providers | USA
LRCX Lam Research Corporation Technology | Semiconductor Equipment & Materi-als | USA
MA Mastercard Inc Financial | Credit Services | USA
NFLX Netflix, Inc. Services | CATV Systems | USA
NOC Northrop Grumman Corpo-ration
Industrial Goods | Aerospace/Defense - Major Di-versified | USA
NVDA NVIDIA Corporation Technology | Semiconductor - Specialized | USA
ULTA Ulta Beauty Inc Services | Specialty Retail, Other | USA
POOR BOY’S COVERED CALLThe Poor Boy’s Covered Call is a list of the top ten higher-priced stocks that are great for covered calls
but due to the cost of owning 100 shares can be better used in calendar spreads. The calendar spread
is an option spread established by simultaneously entering a long and short position on the same un-
derlying asset at the same strike price but with different delivery months
Tackle Trading - Tackle 256
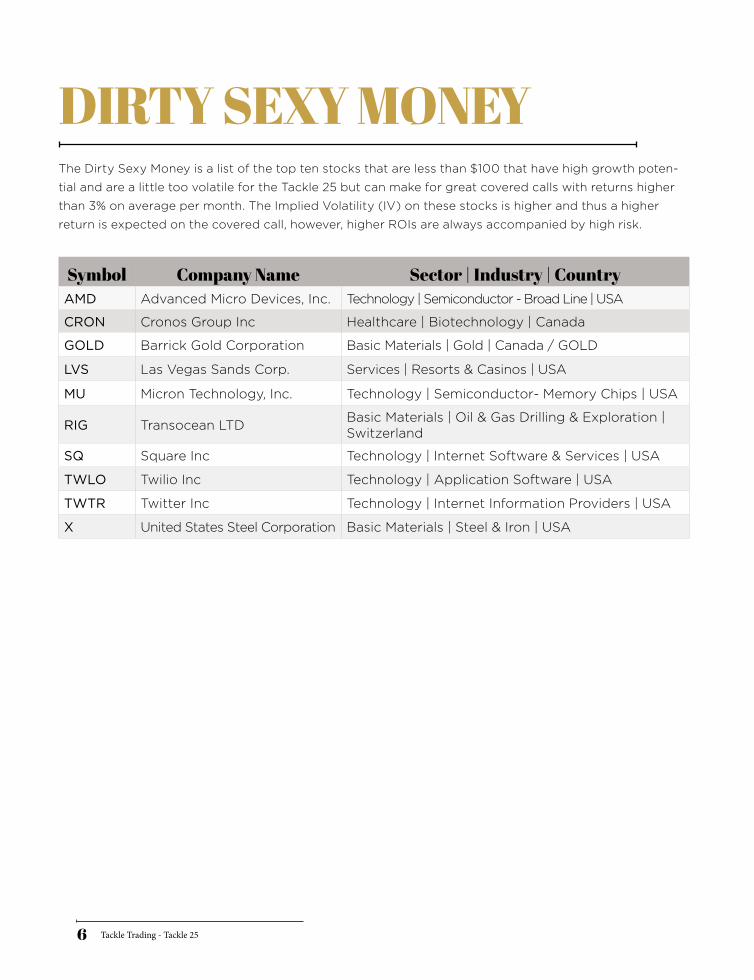
Symbol Company Name Sector | Industry | CountryAMD Advanced Micro Devices, Inc. Technology | Semiconductor - Broad Line | USA
CRON Cronos Group Inc Healthcare | Biotechnology | Canada
GOLD Barrick Gold Corporation Basic Materials | Gold | Canada / GOLD
LVS Las Vegas Sands Corp. Services | Resorts & Casinos | USA
MU Micron Technology, Inc. Technology | Semiconductor- Memory Chips | USA
RIG Transocean LTD Basic Materials | Oil & Gas Drilling & Exploration | Switzerland
SQ Square Inc Technology | Internet Software & Services | USA
TWLO Twilio Inc Technology | Application Software | USA
TWTR Twitter Inc Technology | Internet Information Providers | USA
X United States Steel Corporation Basic Materials | Steel & Iron | USA
DIRTY SEXY MONEYThe Dirty Sexy Money is a list of the top ten stocks that are less than $100 that have high growth poten-
tial and are a little too volatile for the Tackle 25 but can make for great covered calls with returns higher
than 3% on average per month. The Implied Volatility (IV) on these stocks is higher and thus a higher
return is expected on the covered call, however, higher ROIs are always accompanied by high risk.
Tackle Trading - Tackle 257
Meet the Covered Call
• How Stock Investors Profit
• How Real Estate Investors Profit
• How to generate Cash Flow with Covered Calls
Stock Investors (without options)
Stock investors have 2 ways to profit. 1st is price appreciation. This is the buy low, sell high mindset.
If you buy low and sell high you can capture profit through the gains on the stock. 2nd is through
dividend payments. Not all companies pay dividends, but some do, and it’s an extra payment to you
as a shareholder. Many investors look at the dividend as a key factor in the stocks they purchase.
There are 3 caveats, first, to buy low and then sell high for a profit, the stock does in fact has to go
up. Not all companies do rise over time. Even if you do all of your analysis, and make a strong entry,
there will be many times where the stock simply drops over time. Price appreciation is not as pre-
dictable or consistent as we might like as investors.
Dividends are nice and can be considered a bonus to your investment. To maximize profitability
on dividend paying companies, you will need to learn how to cash flow by selling calls and how to
protect downside risk with put options. Dividend payments aren’t enough on their own to make an
investment viable. It’s an incomplete system. That’s where the Covered Calls and Collars come in.
Real Estate Investors
When you buy a property to turn into a rental for income. How does an investor profit? Price appre-
ciation and rental income are the most common ways of doing so, for real estate investors.
Some years, price appreciation in Real Estate can provide fantastic returns. Other years, it doesn’t
beat the rate of inflation. The more predictable factor of the two, for real estate investors, is through
collecting rents from Tenants.
MODULE 1: MEET THE COVERED CALL/01
Tackle Trading - Tackle 258
How lucrative are the returns from rental income? Well, it depends on the circumstance and the
nature of the deal. You can do a simple calculation of the monthly Return on Investment with the
following formula:
Return / Investment = ROI % (Return on Investment)
In our example, the Real Estate investor received a $300 / month net cash flow. The cost to invest in the
property was $40,000 down payment. So, using this simple example, the formula would look like this:
$300 / $40,000 = 0.75% ROI % per month
For investors, this is called your Cash Flow Expectation (CFE). It’s important to measure to help you
identify the strength of any opportunity.
Break-Even Cost
Once you have calculated what your Investment cost and Cash Flow Expectation is, you can identify
how long it will take to pay off your initial investment with profits. In our Real Estate example, if you
make $300 per month, and you had a $40,000 down payment, it would take 133 months to pay off
your down payment with your profit. That’s over 11 years!
Break-Even Cost Formula:
Investment Cost / Cash Flow Expectation (monthly) = Total Months needed to Break-Even
$40,000 / $300 monthly = 133.33 months
Covered Calls Instead
Many Covered Call Investors prefer the strategy over Real Estate. Do they compete? No. You can
do both, and many investors do. But, you should evaluate the opportunities with some of the same
calculations and principles as you do in Real Estate Investing.
Tackle 25 candidates generally will produce 2-4% monthly Cash Flow Expectation (CFE). These
returns can vary from month to month, but the ROI % potential is usually going to be a little higher
when you look at the numbers.
Consider our example from Module 1:
AMD share cost is $19.90. If you buy 1000 shares, you spend $9950 down to control those shares.
This is based on your 50% requirement through standard margin rates. If you receive $100 per
contract when you sell a call option, and can sell 10 contracts against 1000 shares, then your total
premium received is $1000 per month.
$1000 premium / $9950 investment cost = 10% Return on Investment (ROI)
In this example with AMD, the break-even cost would be less than 1 year in time.
Tackle Trading - Tackle 259
Covered Call Philosophy
The Covered Call is the financial markets version of the real estate rental agreement. Whereas in a
rental agreement the Real Estate Investor will find a property to invest in and create monthly cash
flow through renting out the property. The Covered Call is similar in that an investor will find a differ-
ent asset class called a stock and create monthly cash flow through selling call options against the
stock that is owned.
The Covered Call has limited potential reward, positive cash flow expectation, higher downside risk
and these characteristics are very important for any investor to understand to trade Covered Calls
effectively. Throughout these modules, you will learn management techniques and mechanics to
help you build better Covered Calls and manage them wisely.
When you trade Covered Calls, you are simply giving up your rights to your stock in advance, and
by doing that, you receive a credit premium from the market. In other words, you promise to sell
your stock and you Get Paid by doing so.
Trade Management Basics
If you enter a Covered Call, and the stock price rises, you will build a profit on your stock, potentially
lose money on your short call, but you have the highest profit potential from a rise in the underlying
stock price. We’ll discuss more management techniques throughout these sessions, but, for a begin-
ner remember this: upward moving prices give you the potential to make the most net profit from
the strategy.
If the stock stays neutral, you will not gain on the stock through price appreciation, but you will gain
from the Cash Flow received when you sold the call and collected the premium. Sideways is a good
result for a Covered Call Investor, but it’s not as good as up in price.
If the stock drops in price, you will lose money on the stock, and reduce that risk from the call premi-
um that you received. You can lose money trading Covered Calls, particularly if the stocks you buy
drop in price. Managing downside risk is a critical skillset to develop. Modules 6 and 7 will help you
learn techniques to offset this downside risk, when prices drop on the stocks you buy.
Pre-Requisites to good Covered Call Trading
1. Options Trading Permission in your Brokerage Account
2. Enough Capital to buy 100 shares
3. Education to be able to implement and execute the system
Tackle Trading - Tackle 2510
What is a Call Option?
A Call Option is a contract. If you get options trading authority, you have access to be able to buy
and sell these contracts.
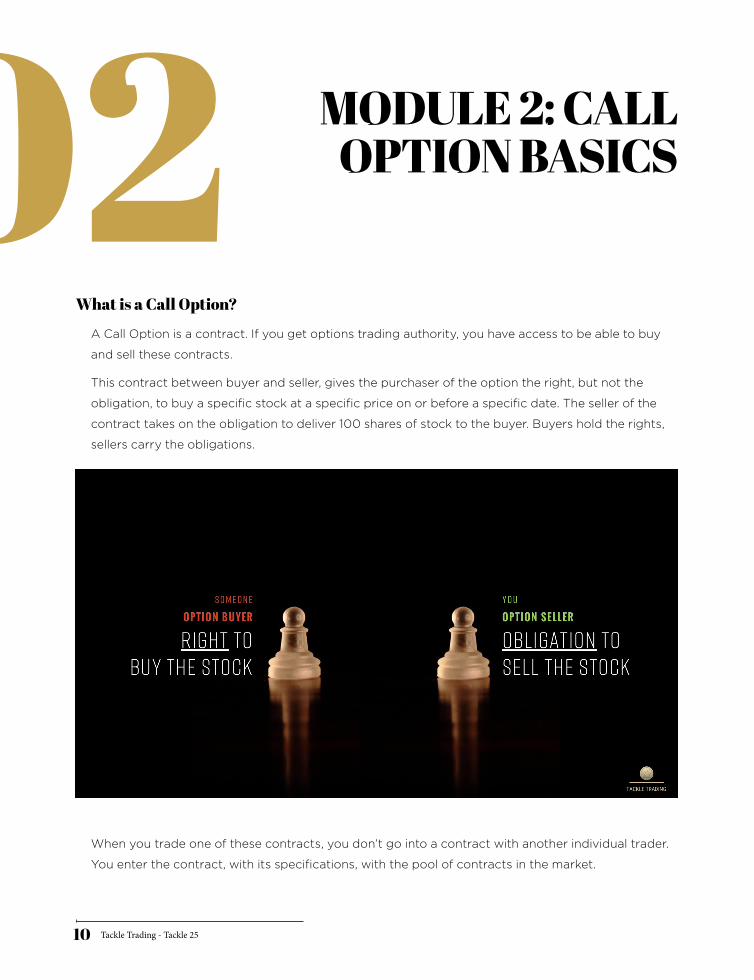
This contract between buyer and seller, gives the purchaser of the option the right, but not the
obligation, to buy a specific stock at a specific price on or before a specific date. The seller of the
contract takes on the obligation to deliver 100 shares of stock to the buyer. Buyers hold the rights,
sellers carry the obligations.
When you trade one of these contracts, you don’t go into a contract with another individual trader.
You enter the contract, with its specifications, with the pool of contracts in the market.
MODULE 2: CALL OPTION BASICS/02
Tackle Trading - Tackle 2511
The Terms of the Deal
• Time: 30 Days
• Terms: 0.40 Delta per contract
When you build Covered Calls using the Tackle 25 system, you want to use the options that are
closest to 30 days in time until expiration. To determine your strike price, locate the delta per
contract in the option chain and find the strike closest to .40 delta per contract. Delta can range
between 0.01 to 1.00, so the 0.40 delta will be slightly Out of the Money (OTM) of the current
stock price when you enter the trade.
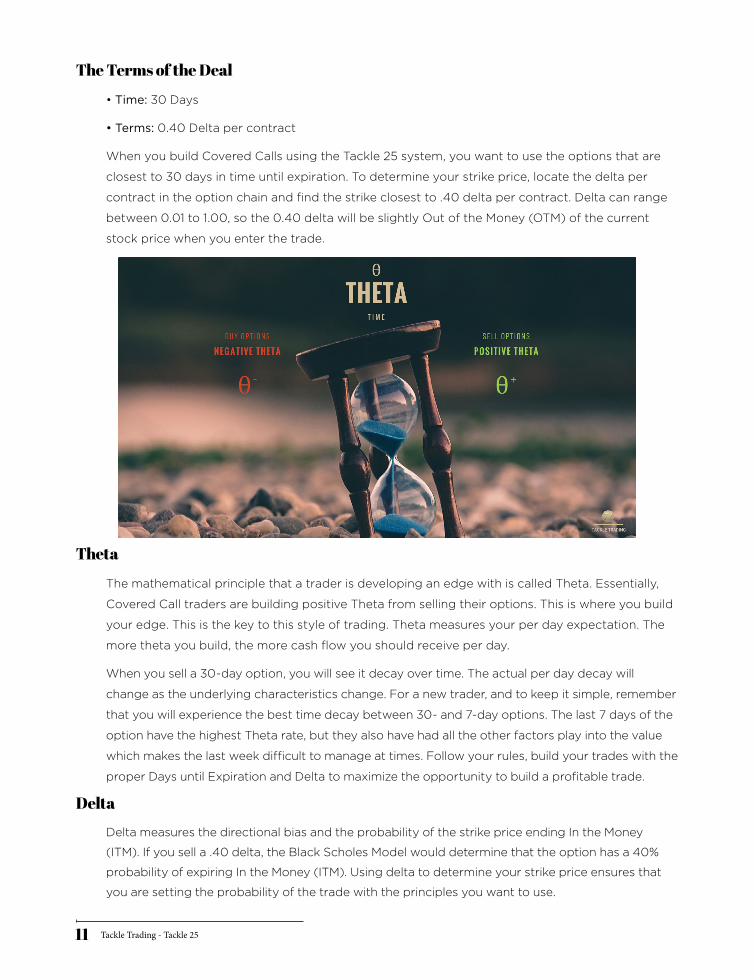
Theta
The mathematical principle that a trader is developing an edge with is called Theta. Essentially,
Covered Call traders are building positive Theta from selling their options. This is where you build
your edge. This is the key to this style of trading. Theta measures your per day expectation. The
more theta you build, the more cash flow you should receive per day.
When you sell a 30-day option, you will see it decay over time. The actual per day decay will
change as the underlying characteristics change. For a new trader, and to keep it simple, remember
that you will experience the best time decay between 30- and 7-day options. The last 7 days of the
option have the highest Theta rate, but they also have had all the other factors play into the value
which makes the last week difficult to manage at times. Follow your rules, build your trades with the
proper Days until Expiration and Delta to maximize the opportunity to build a profitable trade.
Delta
Delta measures the directional bias and the probability of the strike price ending In the Money
(ITM). If you sell a .40 delta, the Black Scholes Model would determine that the option has a 40%
probability of expiring In the Money (ITM). Using delta to determine your strike price ensures that
you are setting the probability of the trade with the principles you want to use.
Tackle Trading - Tackle 2512
Key Terms
• Strike: price at which the buyer has the right to purchase the underlying asset
• Expiration: the last day the contract owner can exercise their rights
• Underlying: The asset upon which the contract is based
• Premium: The cost (or value) of the contract
Covered Call traders sell the contract(s) and carry the obligation to deliver the underlying asset to
the market if the price moves above your strike and becomes an In-the-Money (ITM) option.
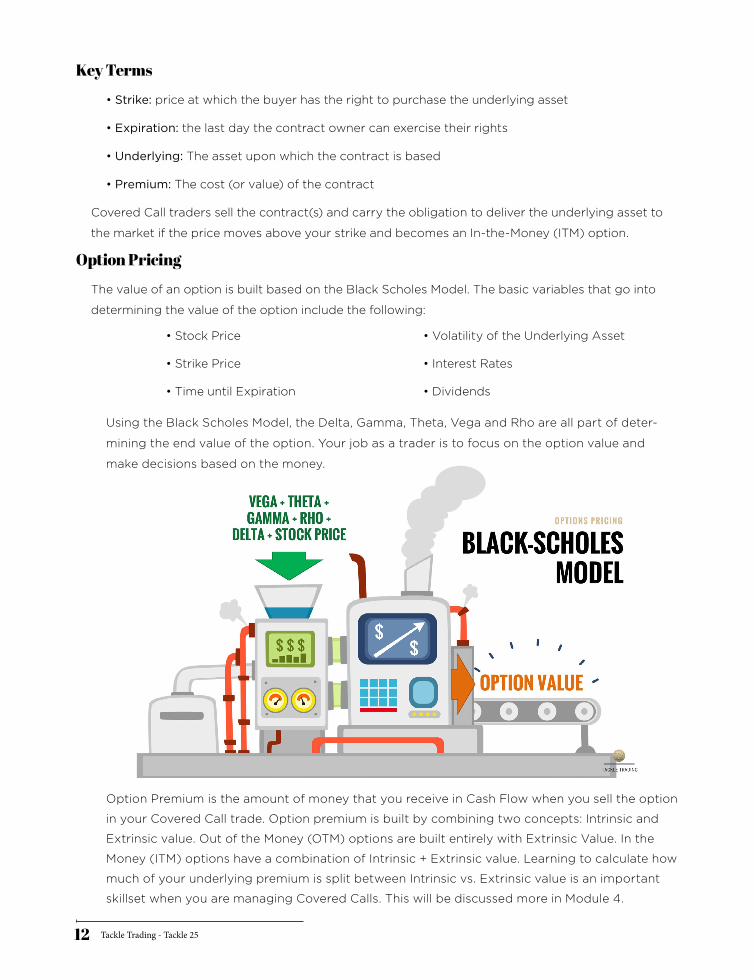
Option Pricing
The value of an option is built based on the Black Scholes Model. The basic variables that go into
determining the value of the option include the following:
Using the Black Scholes Model, the Delta, Gamma, Theta, Vega and Rho are all part of deter-
mining the end value of the option. Your job as a trader is to focus on the option value and
make decisions based on the money.
Option Premium is the amount of money that you receive in Cash Flow when you sell the option
in your Covered Call trade. Option premium is built by combining two concepts: Intrinsic and
Extrinsic value. Out of the Money (OTM) options are built entirely with Extrinsic Value. In the
Money (ITM) options have a combination of Intrinsic + Extrinsic value. Learning to calculate how
much of your underlying premium is split between Intrinsic vs. Extrinsic value is an important
skillset when you are managing Covered Calls. This will be discussed more in Module 4.
• Stock Price
• Strike Price
• Time until Expiration
• Volatility of the Underlying Asset
• Interest Rates
• Dividends

Tackle Trading - Tackle 2513
Covered Call Playbook
Building a Covered Call includes buying 100 shares of stock and selling 1 call option. You can sell 1 call
for every 100 shares that you won. The act of selling the call is what makes the position ‘Covered’.
When you trade one of these contracts, you don’t go into a contract with another individual trader.
You enter the contract, with its specifications, with the pool of contracts in the market.
Remember from Module 2, the rules are clear. Your Theta rule is to use an option closest to 30 days
until expiration. Your Delta rule is to use an option closest to 0.40 per contract. Follow these rules to
optimize your Covered Call system.
MODULE 3: THE COVERED
CALL PLAYBOOK/03
Tackle Trading - Tackle 2514
1. Cost Basis = Purchase Price – Call Premium
• $20 - $1 = $19
2. Max Risk = Cost Basis
• Max Risk = $19
3. Max Reward = Strike Price – Cost Basis
• $23 - $19 = $4
4. Downside Protection = Call Premium
• Downside Protection = $1
Formulas
Case Study
• XYZ Stock @ $20
• Sell $23 Call @ $1
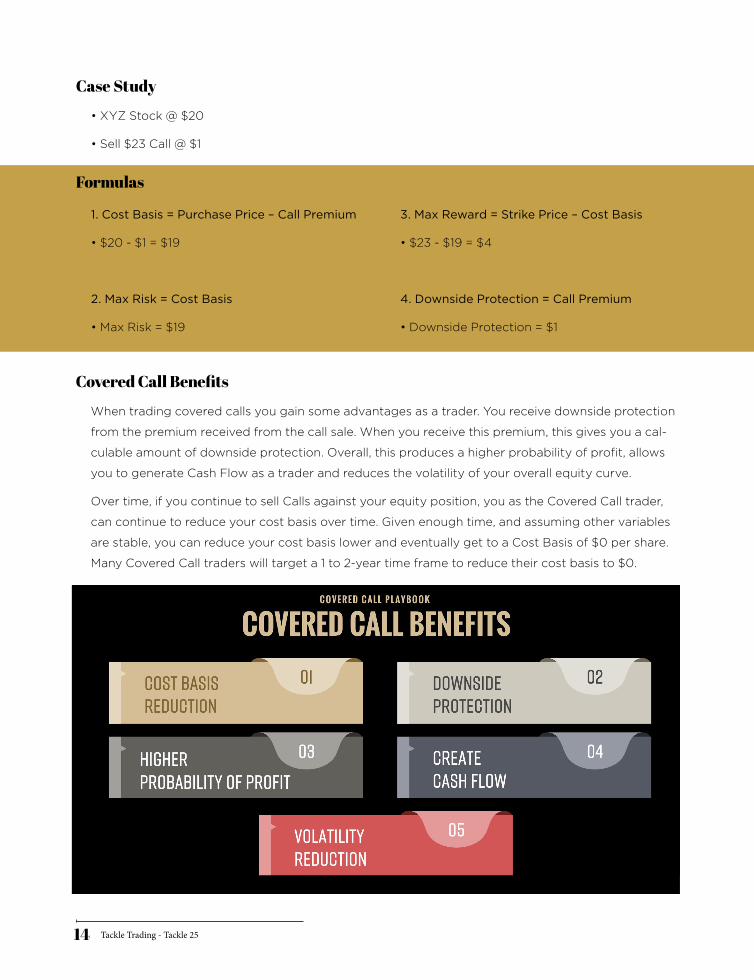
Covered Call Benefits
When trading covered calls you gain some advantages as a trader. You receive downside protection
from the premium received from the call sale. When you receive this premium, this gives you a cal-
culable amount of downside protection. Overall, this produces a higher probability of profit, allows
you to generate Cash Flow as a trader and reduces the volatility of your overall equity curve.
Over time, if you continue to sell Calls against your equity position, you as the Covered Call trader,
can continue to reduce your cost basis over time. Given enough time, and assuming other variables
are stable, you can reduce your cost basis lower and eventually get to a Cost Basis of $0 per share.
Many Covered Call traders will target a 1 to 2-year time frame to reduce their cost basis to $0.
Tackle Trading - Tackle 2515
Probability of Profit (POP)
Every trading strategy has an inherent probability built into it. Covered Call traders have a higher
Probability of Profit (POP) over the traditional stock investor. This is due to the collection of the pre-
mium from the call sold. Traditional investing has a built in 50/50 POP. Covered Call traders using
the rules from the Tackle 25 system have an assumed 60/40 POP or 60% POP.
By increasing your overall POP in your trading system, you also should experience a smoother
equity curve over time. Simply put, Covered Call traders can build a better portfolio through these
higher probabilities, which lead to a more consistent return over time. It doesn’t mean more money
each month, but it means a more consistent portfolio if you do it right and the market operates as
it’s intended.
Position Size
The adage “don’t put all of your eggs in one basket” is appropriate in this part of the system. Every
trader has a limited amount of capital. How much will you spend per position as you build your port-
folio? Whatever the % is, it shouldn’t be too much relative to your overall portfolio. The maximum
and aggressive position size would be near 10% of your account per trade. The actual amount must
be determined by you the trader for your portfolio.
Journaling
It’s critical to journal each trade you take. Because a Covered Call involves buying shares and selling
calls, it’s best to separate the entries as individual trades. This is the best approach so that you can
keep an accurate journal for each entry, especially when you roll options and trade more than one
Covered Call on your underling asset over time.
Tackle Trading - Tackle 2516
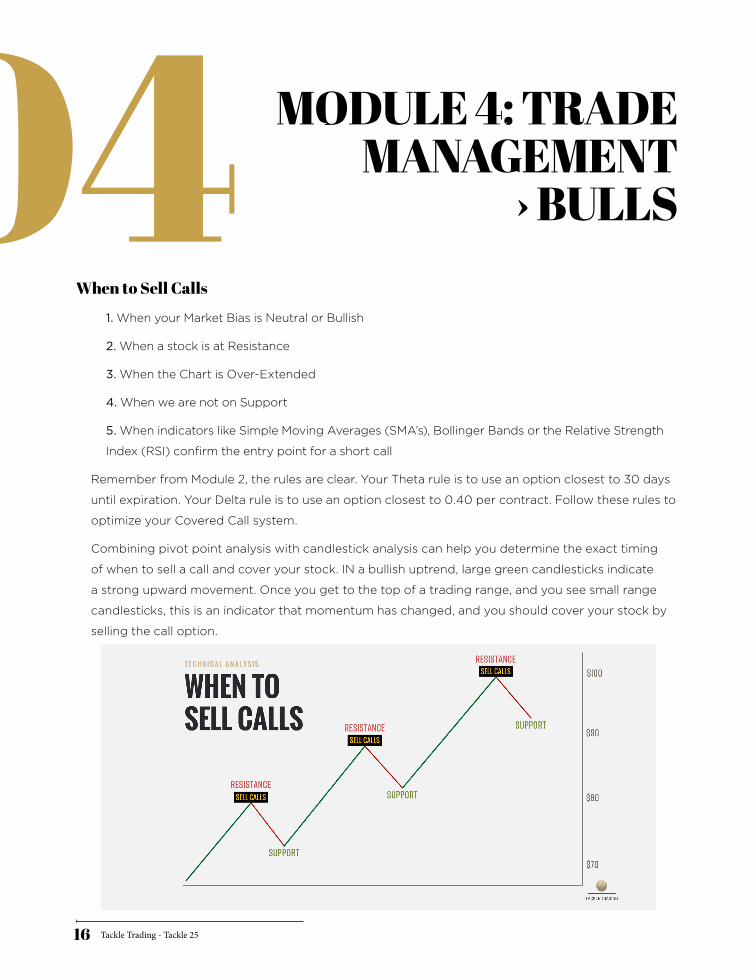
When to Sell Calls
1. When your Market Bias is Neutral or Bullish
2. When a stock is at Resistance
3. When the Chart is Over-Extended
4. When we are not on Support
5. When indicators like Simple Moving Averages (SMA’s), Bollinger Bands or the Relative Strength
Index (RSI) confirm the entry point for a short call
Remember from Module 2, the rules are clear. Your Theta rule is to use an option closest to 30 days
until expiration. Your Delta rule is to use an option closest to 0.40 per contract. Follow these rules to
optimize your Covered Call system.
Combining pivot point analysis with candlestick analysis can help you determine the exact timing
of when to sell a call and cover your stock. IN a bullish uptrend, large green candlesticks indicate
a strong upward movement. Once you get to the top of a trading range, and you see small range
candlesticks, this is an indicator that momentum has changed, and you should cover your stock by
selling the call option.
MODULE 4: TRADE MANAGEMENT
› BULLS/04
Tackle Trading - Tackle 2517
Cash Flow Expectation (CFE)
When building Covered Calls, you should calculate this value.
Management Situations
If the call you sell is Out of the Money (OTM), over time, the premium will decay, and you will materi-
alize profit. Once you’ve made 70-80% of the extrinsic value you should buy the call back and roll it
into a new call.
If your original trade starts with a credit of $1.00 premium, then each penny of that credit rep-
resents a part of the total value of the option and trade that you’ve taken. Once the option starts
to drop in value, you will start to materialize the profit in the position. You don’t need to wait until
it’s worth 0.00 to do something with your trade. Using the rules from the Tackle 25 system you
should buy the option back once you’ve made 70-80% of the call premium. In this example, you
would materialize that profit when the option is worth 0.20 or 0.30 cents per contract because
you started it at 1.00 per contract. The value of the option dropping represents profit that you
have materialized from the call sold.
If the call you sell moves In the Money (ITM), you will need to make a management decision at some
point. Do you want to let the market take your stock? Then you can let it run in the money and do
nothing. Do you want to keep the stock and continue to sell calls? If so, you will need to buy the call
back and roll it into a new option.
In our example, if you let the market take your stock at $23 you capture the profit on the entire trade
and maximize your profit. There are times, when you are in this situation you should still buy the call
back and sell the stock manually. This mechanic is used to help avoid the assignment fee and reduce
your overall transaction costs.
(Call Premium / Purchase Price) * 100
• $1 Premium / $20 Per Shar Cost = 5% CFE
Formula
Tackle Trading - Tackle 2518
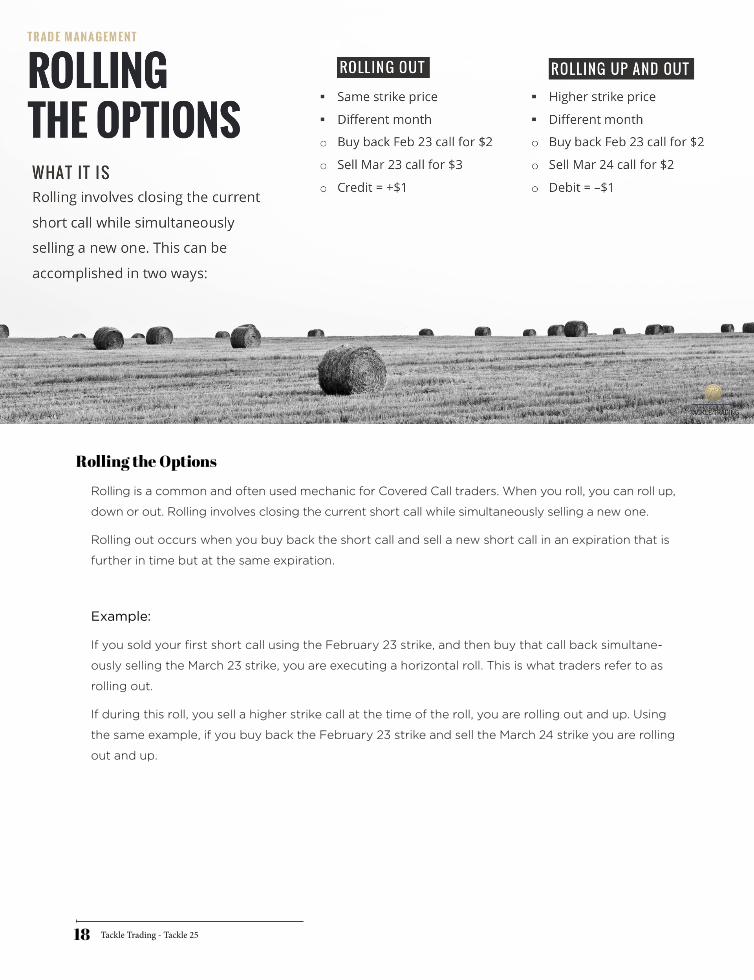
Rolling the Options
Rolling is a common and often used mechanic for Covered Call traders. When you roll, you can roll up,
down or out. Rolling involves closing the current short call while simultaneously selling a new one.
Rolling out occurs when you buy back the short call and sell a new short call in an expiration that is
further in time but at the same expiration.
Example:
If you sold your first short call using the February 23 strike, and then buy that call back simultane-
ously selling the March 23 strike, you are executing a horizontal roll. This is what traders refer to as
rolling out.
If during this roll, you sell a higher strike call at the time of the roll, you are rolling out and up. Using
the same example, if you buy back the February 23 strike and sell the March 24 strike you are rolling
out and up.
Tackle Trading - Tackle 2519
Trade Management: Sideways
When a stock is moving sideways, it will still have days where it moves up and days when it moves
down. At resistance, a trader tries to maximize their profitability when trading Covered Calls by
selling calls. At support, traders buy back their short calls to give them opportunities to gain on the
stock when it moves back up in price.
Near resistance, watch the daily candlesticks closely. Small range candlesticks, in conjunction with
the price being at resistance, gives the trader the cue to go ahead and sell call options to collect
premium. When the stock drops back towards support, watch the candlesticks closely. If they slow
in momentum near support and produce small range candlesticks, go ahead and buy the call back
to open up the profit potential on the call and capture the profit you’ve built in the call.
Management Situations
If the call option stays Out of the Money over time (OTM) the value of the premium will evaporate from
the passage of time and due to theta decay. Once you have materialized 70-80% of your net liquida-
tion in profit, you should buy your short call back and sell a new call. This is when you roll the option.
Traders who watch the extrinsic value of the option can better identify when they should buy the
short call back. Out of the Money (OTM) options are entirely made of extrinsic value. Every penny
in the price is extrinsic, when they are OTM. When that price drops over time, it gives you oppor-
tunities to buy the call back and capture your profit. A common mechanic is to watch the Extrinsic
Value relative to the underlying stock price.
MODULE 5: TRADE MANAGEMENT ›
SIDEWAYS/05
Call Premium / Stock Price = Extrinsic Value
Formula for OTM options:
Tackle Trading - Tackle 2520
Examples:
$20 Stock with 0.40 Call premium = 2% extrinsic value
$20 Stock with 0.30 Call premium = 1.5% extrinsic value
$20 stock with 0.20 Call premium = 1% extrinsic value
$20 stock with 0.10 Call Premium = 0.5% extrinsic value
Because the life cycle of an option will experience time decay at different points, watching the ex-
trinsic value will help you best identify when to buy back your short call and roll it into a new call op-
tion. Essentially, there isn’t much incentive to wait the last 5-10 days until expiration if you’ve already
built most of your profitability from the sale of the short call option. Watch these values to help you
identify when to buy these call options back.
If the sideways trend moves higher and breaks out, you have now moved into a bullish condition.
You should use your rules from Module 4 to manage these situations.
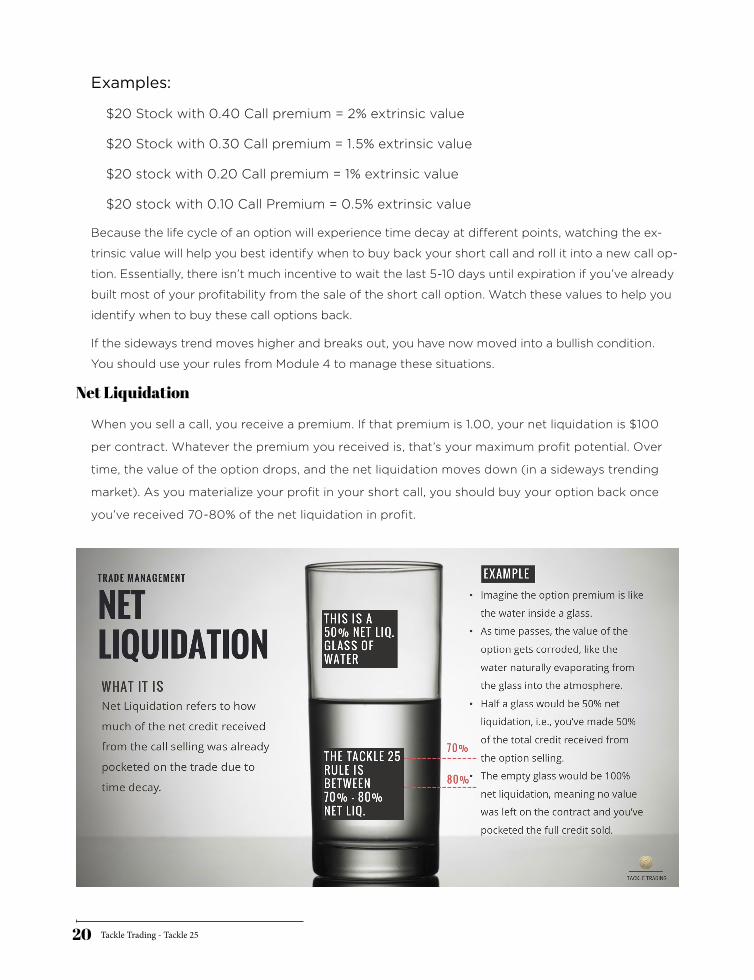
Net Liquidation
When you sell a call, you receive a premium. If that premium is 1.00, your net liquidation is $100
per contract. Whatever the premium you received is, that’s your maximum profit potential. Over
time, the value of the option drops, and the net liquidation moves down (in a sideways trending
market). As you materialize your profit in your short call, you should buy your option back once
you’ve received 70-80% of the net liquidation in profit.
Tackle Trading - Tackle 2521
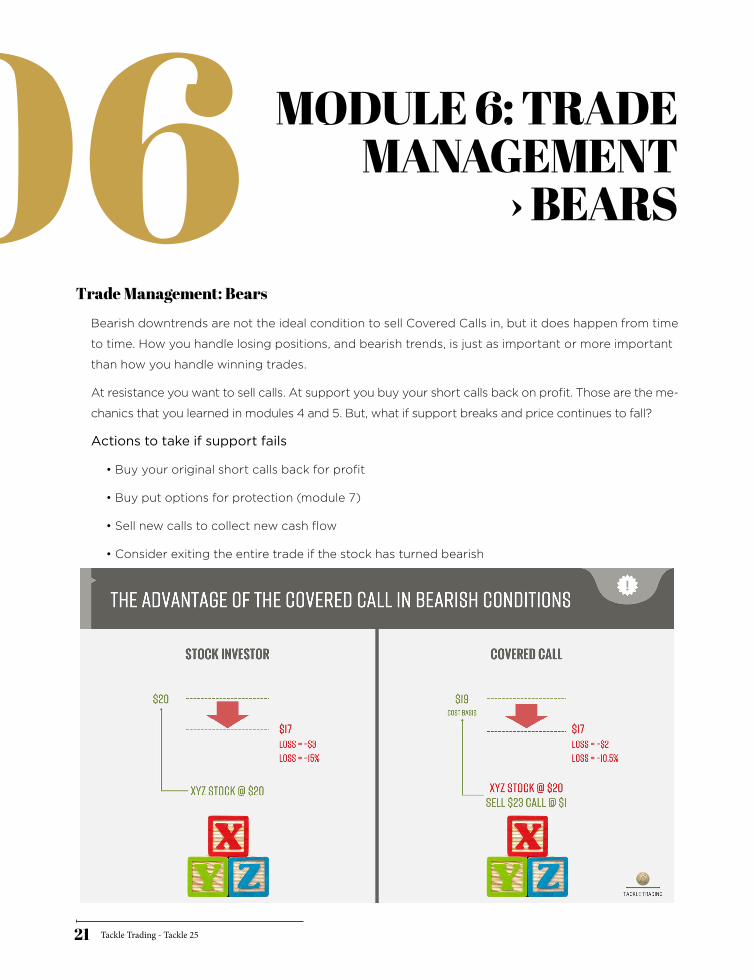
Trade Management: Bears
Bearish downtrends are not the ideal condition to sell Covered Calls in, but it does happen from time
to time. How you handle losing positions, and bearish trends, is just as important or more important
than how you handle winning trades.
At resistance you want to sell calls. At support you buy your short calls back on profit. Those are the me-
chanics that you learned in modules 4 and 5. But, what if support breaks and price continues to fall?
Actions to take if support fails
• Buy your original short calls back for profit
• Buy put options for protection (module 7)
• Sell new calls to collect new cash flow
• Consider exiting the entire trade if the stock has turned bearish
MODULE 6: TRADE MANAGEMENT
› BEARS/06
Tackle Trading - Tackle 2522
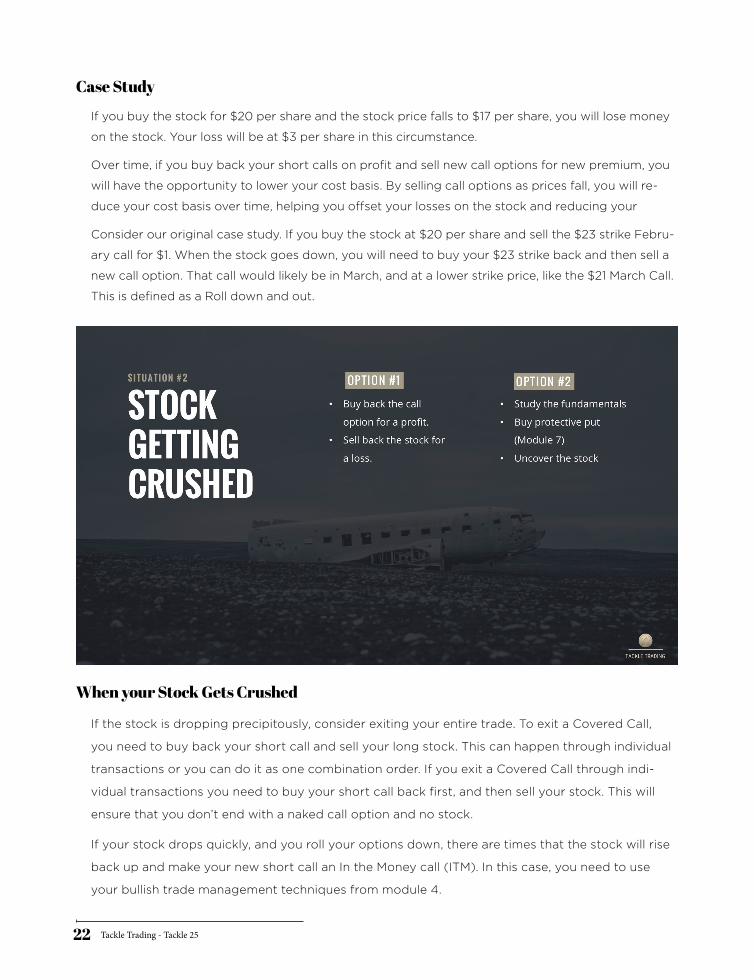
Case Study
If you buy the stock for $20 per share and the stock price falls to $17 per share, you will lose money
on the stock. Your loss will be at $3 per share in this circumstance.
Over time, if you buy back your short calls on profit and sell new call options for new premium, you
will have the opportunity to lower your cost basis. By selling call options as prices fall, you will re-
duce your cost basis over time, helping you offset your losses on the stock and reducing your
Consider our original case study. If you buy the stock at $20 per share and sell the $23 strike Febru-
ary call for $1. When the stock goes down, you will need to buy your $23 strike back and then sell a
new call option. That call would likely be in March, and at a lower strike price, like the $21 March Call.
This is defined as a Roll down and out.
When your Stock Gets Crushed
If the stock is dropping precipitously, consider exiting your entire trade. To exit a Covered Call,
you need to buy back your short call and sell your long stock. This can happen through individual
transactions or you can do it as one combination order. If you exit a Covered Call through indi-
vidual transactions you need to buy your short call back first, and then sell your stock. This will
ensure that you don’t end with a naked call option and no stock.
If your stock drops quickly, and you roll your options down, there are times that the stock will rise
back up and make your new short call an In the Money call (ITM). In this case, you need to use
your bullish trade management techniques from module 4.
Tackle Trading - Tackle 2523
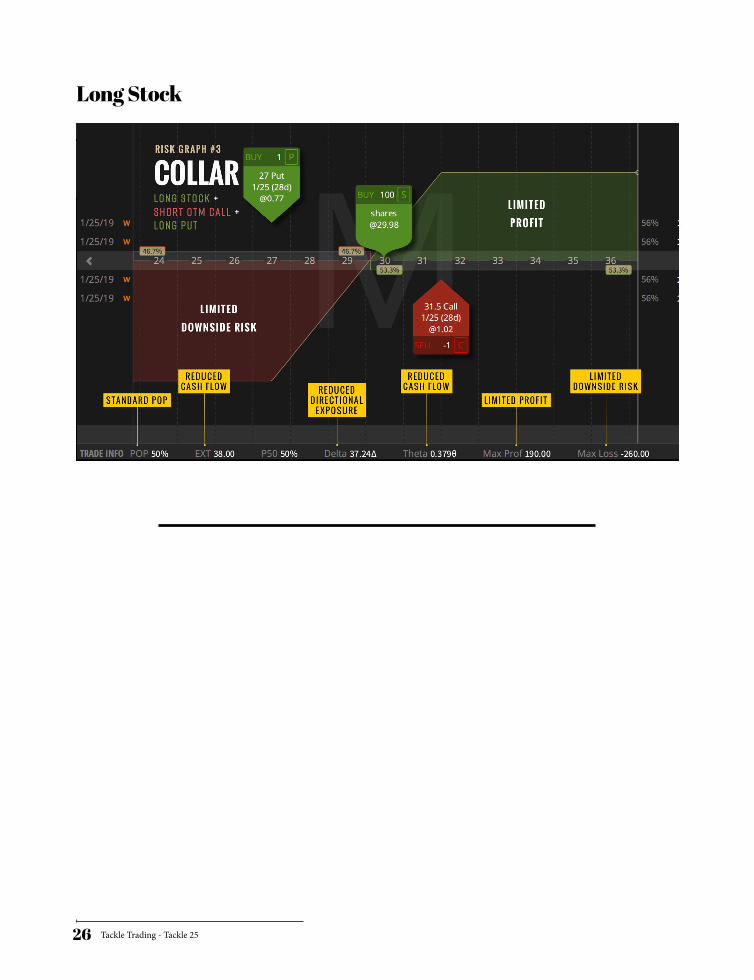
What is a Collar?
A Collar is a protective strategy that is implemented on a long stock position. Traders and investors
create a collar by purchasing an OTM put option while simultaneously selling an Out of the Money
(OTM) call option.
Key Elements
• Long Stock
• OTM Call Option
• OTM Put Option
• Adds downside protection
Characteristics of your Trade
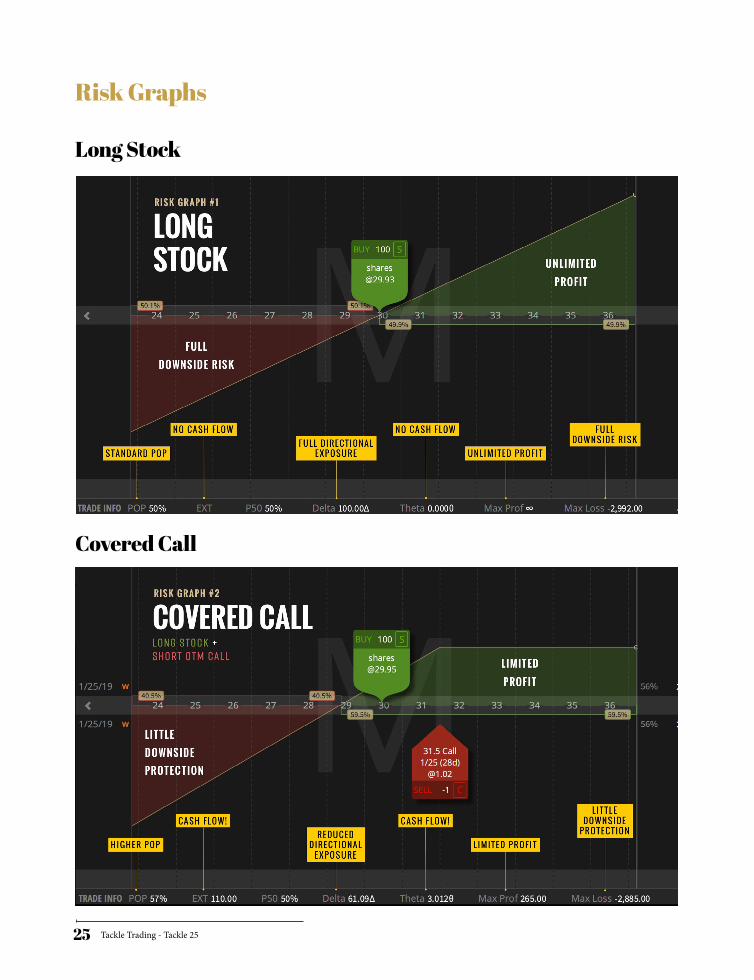
When you start a trade with a long stock position, you have unlimited profit and full downside
risk. Your Probability of Profit is 50%. A long stock position has no cash flow elements, carries full
directional exposure but gives a trader unlimited profit potential while carrying full downside risk.
Adding a short call, turns the trade into a Covered Call. This limits your profit potential, improves
your Probability of Profit (POP) to near 60% and adds a cash flow element through the short call.
We call this a positive Theta position. But you still have higher downside risk in this position.
Adding a put option, and turning your trade into a collar, essentially reduces your downside risk
by adding a floor to your trade. When you do this, the intention is to reduce the risk. If the stock
is behaving as you planned, and staying bullish or neutral, you don’t need to add a collar. When
a trader adds a collar, you instantly reduce your Probability of Profit (POP)
MODULE 7: EARNINGS
& COLLARS/07
Tackle Trading - Tackle 2524
Collar Rules
Pre-Earnings Collar
• Theta Rule: Same expiration as your short call
• Delta Rule: 0.25 to 0.30 Delta per contract
There are essentially two situations where you should consider collaring your trade. First, you
should consider doing it before an earnings release to help you hedge your risk and avoid the
random risk of the earnings gap.
When you are before an earnings report, use the call premium you received to pay for your put
option. The Theta rule you will use is to use the same expiration as the call you have sold. In our
case study, if you are short the February call, you will buy a put in the same expiration of Febru-
ary. The Delta you will use is near 0.25 to 0.30 delta per contract.
Breaking of Support Collar
• Theta Rule: 2 months or more in time
• Delta Rule: .40
If a stock breaks support, you should consider adding a collar. You can do this manually, or you
can create an order before the break happens to protect risk on breakdowns. Using an ad-
vanced order to buy the put, and turn your trade into a collar, gives you a form of a ‘stop loss’ or
risk reduction order to help you control the downside risk.
Mechanics of adding the Collar on Support Breaks
• Identify the Weekly Support zone
• Subtract 1.5 of the Average True Range (ATR) below the support zone and trigger your
collar at this price
• Use a conditional or contingent order to buy this collar on the break of support
Tackle Trading - Tackle 2525
Risk Graphs
Long Stock
Covered Call
Tackle Trading - Tackle 2526
Long Stock

Tackle Trading - Tackle 2527
“This station is now the ultimate power in the universe. I suggest we use it.”
– Admiral Motti
Today we tackle a concept I’ve wanted to dig into
for a while now. It’s extremely powerful. And con-
trary to the late Admiral Motti ’s opinion, it’s not
the Death Star. Perhaps there is no more glowing
endorsement for the topic than that widely att rib-
uted to Albert Einstein, “The most powerful force
in the universe is compound interest.”
During my recent visit on the Trading Justi ce
Podcast my buddy Tim posed an interesti ng
questi on to Matt and me. The gist of it was, “If
you could go back what advice would you share
with your younger self now that you have all this
experience?” Matt and I shared similar thoughts in
regards to co pounding, re-allocati ng gains and
the like. Today I want to elaborate on my answer.
First, what is compound interest? Well, these days
any discussion surrounding interest usually re-
volves around how the Fed killed interest a long
ti me ago with its craft y plan to put the screws
to savers save the universe. Indeed, many of us
look back with fondness to the old days when you
could get 5% or so in the bank. But of course, inter-
est rates are making a comeback (if a 0.25% hike
even qualifi es as a comeback, that is).
Back to compounding. Let’s say interest rates do
eventually normalize to 3% and you have $100k in
the bank that you let sit for ten years. Check out
how the account will grow over time:
Take note, the first year your money grew by
$3,000 but by the last year it grew by $3,915.
That’s 30% more growth. You can thank the mag-
ic of compounding for the accelerati on. As Ben
Franklin once quipped, “The money that money
makes, makes money.” Remember, you didn’t add
any additi onal capital to your account. The sole
reason you made a 30% higher return during the
last year is because you had accumulated some
$30,477 in interest over the prior nine years that
was now earning interest itself. What a beautiful
thing!
Now, I know what you’re thinking. Well, that’s nice
and dandy Tyler but at this pace it will be five years
before Grandma Yellen takes rates anywhere close
to 3%. Tough to get excited about compounding
when rates are pinned near zero.
Well, friends, worry not. I’m just illustrati ng the
concept. We’re going to try to boost the rate of
return using a bit of magic from the double D’s.
I’m talking dividends and derivati ves. More on those in
a second. But fi rst, let’s take a look at the rule of 72.
Year 1: $103,000 / $3000 gainYear 2: $106,090 / $3090 gainYear 3: $109,273 / $3183 gainYear 4: $112,551 / $3278 gainYear 5: $115,927 / $3376 gainYear 6: $119,405 / $3478 gainYear 7: $122,987 / $3582 gainYear 8: $126,677 / $3690 gainYear 9: $130,477 / $3800 gainYear 10: $134,392 / $3915 gain
THE ULTIMATE POWER IN THE UNIVERSE
/01
Tackle Trading - Tackle 2528
One of the popular concepts that inevitably
weaves its way into a discussion on compound-
ing is the rule of 72. It’s a quick way to determine
how long it would take to double your original
principle. Let’s use the previous example where
we have $100K earning 1% per year. To estimate
how long it would take for the $100K to double
to $200K simply take 72 divided by the interest
rate of 1%.
Yep, that’s a whopping 72 years. Hate to break it to
you but you’ll probably be dead by then.
But, hey, your kids will enjoy it. Obviously we
need a higher rate of return to get any kind
of excitement out of this. Let’s say you throw
that $100K in the S&P 500 which conti nues to
produce its historical average of 10%. Well, then
you’ll double your money in 7.2 years. Woo-hoo!
The takeaway: earn a higher return and you’ll dou-
ble your principle faster. Captain Obvious, out.
Hopefully we all know that interest isn’t what
stock investors are gunning for. No, it’s price ap-
preciati on and dividends that deliver the good-
ies. And since dividends are virtually guaranteed
to be paid out for all but the most troubled com-
panies they can be thought of like interest.
If you want to compound the growth of your
money in stocks then don’t squander those divi-
dends. Re-invest them. That is, take the cash and
use it to buy more shares. Then, the next time a
dividend is paid you’ll receive even more. Rinse
and repeat.
Suppose instead of throwing your $100k in the
S&P 500 you purchased a basket of emerging
market stocks. They’re trading at lower valua-
ti ons (as of 2016) due to the commodity bear
market and boast a higher dividend yield. The iS-
hares MSCI Emerging Markets ETF (EEM) will do
the trick. The current dividend yield is just shy of
3%. That means every year you’ll receive around
$3,000 in cash for your investment in EEM.
Here’s another way to look at it. With EEM
trading at $33.25 your $100k would buy about
3,000 shares. The annual dividend payout is
approximately $1 per share. And with the $3,000
in dividends you can purchase another 90 shares
of stock every year (assuming the price remains
around $33.25).
Check out how the compounding will work over
five years:
RULE OF 72/02
INTEREST FOR INVESTORS
/03
Tackle Trading - Tackle 2529
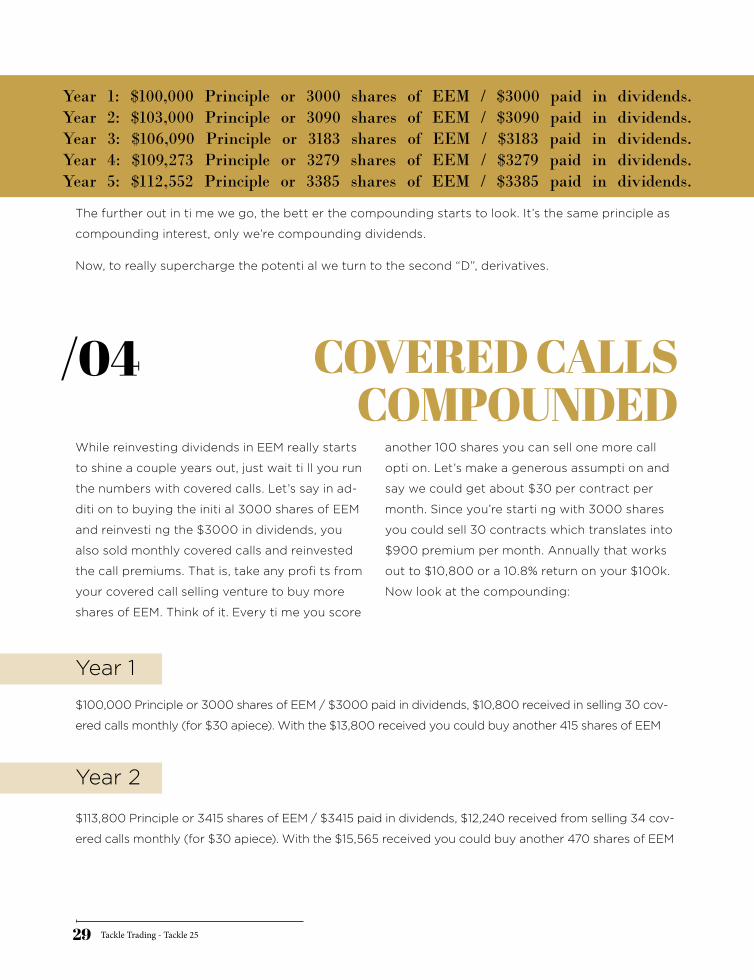
While reinvesting dividends in EEM really starts
to shine a couple years out, just wait ti ll you run
the numbers with covered calls. Let’s say in ad-
diti on to buying the initi al 3000 shares of EEM
and reinvesti ng the $3000 in dividends, you
also sold monthly covered calls and reinvested
the call premiums. That is, take any profi ts from
your covered call selling venture to buy more
shares of EEM. Think of it. Every ti me you score
another 100 shares you can sell one more call
opti on. Let’s make a generous assumpti on and
say we could get about $30 per contract per
month. Since you’re starti ng with 3000 shares
you could sell 30 contracts which translates into
$900 premium per month. Annually that works
out to $10,800 or a 10.8% return on your $100k.
Now look at the compounding:
The further out in ti me we go, the bett er the compounding starts to look. It’s the same principle as
compounding interest, only we’re compounding dividends.
Now, to really supercharge the potenti al we turn to the second “D”, derivatives.
Year 1: $100,000 Principle or 3000 shares of EEM / $3000 paid in dividends.Year 2: $103,000 Principle or 3090 shares of EEM / $3090 paid in dividends.Year 3: $106,090 Principle or 3183 shares of EEM / $3183 paid in dividends.Year 4: $109,273 Principle or 3279 shares of EEM / $3279 paid in dividends.Year 5: $112,552 Principle or 3385 shares of EEM / $3385 paid in dividends.
COVERED CALLS COMPOUNDED
/04
Year 1
Year 2
$100,000 Principle or 3000 shares of EEM / $3000 paid in dividends, $10,800 received in selling 30 cov-
ered calls monthly (for $30 apiece). With the $13,800 received you could buy another 415 shares of EEM
$113,800 Principle or 3415 shares of EEM / $3415 paid in dividends, $12,240 received from selling 34 cov-
ered calls monthly (for $30 apiece). With the $15,565 received you could buy another 470 shares of EEM
Tackle Trading - Tackle 2530
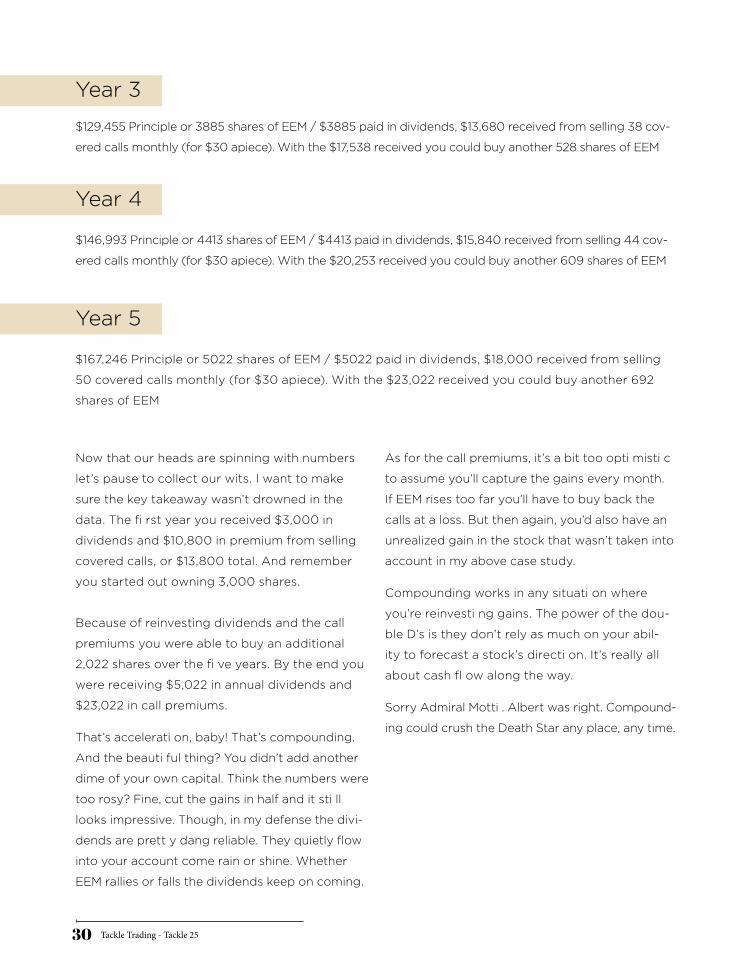
Now that our heads are spinning with numbers
let’s pause to collect our wits. I want to make
sure the key takeaway wasn’t drowned in the
data. The fi rst year you received $3,000 in
dividends and $10,800 in premium from selling
covered calls, or $13,800 total. And remember
you started out owning 3,000 shares.
Because of reinvesting dividends and the call
premiums you were able to buy an additional
2,022 shares over the fi ve years. By the end you
were receiving $5,022 in annual dividends and
$23,022 in call premiums.
That’s accelerati on, baby! That’s compounding.
And the beauti ful thing? You didn’t add another
dime of your own capital. Think the numbers were
too rosy? Fine, cut the gains in half and it sti ll
looks impressive. Though, in my defense the divi-
dends are prett y dang reliable. They quietly flow
into your account come rain or shine. Whether
EEM rallies or falls the dividends keep on coming.
As for the call premiums, it’s a bit too opti misti c
to assume you’ll capture the gains every month.
If EEM rises too far you’ll have to buy back the
calls at a loss. But then again, you’d also have an
unrealized gain in the stock that wasn’t taken into
account in my above case study.
Compounding works in any situati on where
you’re reinvesti ng gains. The power of the dou-
ble D’s is they don’t rely as much on your abil-
ity to forecast a stock’s directi on. It’s really all
about cash fl ow along the way.
Sorry Admiral Motti . Albert was right. Compound-
ing could crush the Death Star any place, any time.
Year 3
Year 4
Year 5
$129,455 Principle or 3885 shares of EEM / $3885 paid in dividends, $13,680 received from selling 38 cov-
ered calls monthly (for $30 apiece). With the $17,538 received you could buy another 528 shares of EEM
$146,993 Principle or 4413 shares of EEM / $4413 paid in dividends, $15,840 received from selling 44 cov-
ered calls monthly (for $30 apiece). With the $20,253 received you could buy another 609 shares of EEM
$167,246 Principle or 5022 shares of EEM / $5022 paid in dividends, $18,000 received from selling
50 covered calls monthly (for $30 apiece). With the $23,022 received you could buy another 692
shares of EEM
Tackle Trading - Tackle 2531
Hang around the halls of the Street long enough
and you’ll be inundated with all sorts of jargon.
One of the most satisfying endeavors in life is to
travel from ignorance to understanding to mas-
tery of a subject. For dollar seeking drones like
us, that topic is trading and understanding the
language of fi nance.
The first time I read the Wall Street Journal I was
a babe in the woods. Sure, I could pronounce the
words, but I was oblivious to the meaning. Now,
I’m a well-oiled writi ng machine with a vocabu-
lary the size of Delaware.
Hyperbole much?
Why, yes, yes indeed.
There’s a particular phrase I suspect you have
come across in your journey, but have yet to
grasp its relevance fully. It’s known as risk-adjust-
ed returns. I wanted to take a deep dive into the
topic for selfi sh purposes. And what bett er way
to learn than to teach it to the masses?
Investors tend to focus on the market’s fi nal desti
nati on. In 2013 the S&P 500 was up 30%, in 2014
the S&P 500 was up 11%, year-to-date it’s up 3%,
so on and so forth. For attentive traders, however
it’s not just the fi nal desti nati on that matt ers but
also the path traveled to get there. Was it a windy
route punctuated by surprising twists and turns?
Or, was it a steady ascent with nary a setback?
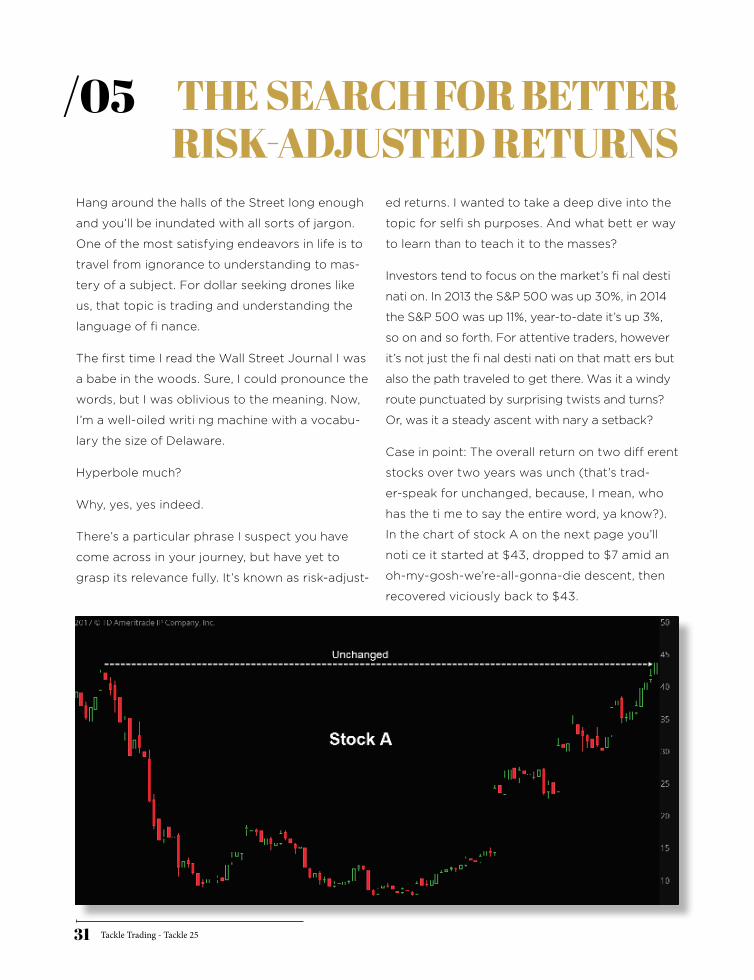
Case in point: The overall return on two diff erent
stocks over two years was unch (that’s trad-
er-speak for unchanged, because, I mean, who
has the ti me to say the entire word, ya know?).
In the chart of stock A on the next page you’ll
noti ce it started at $43, dropped to $7 amid an
oh-my-gosh-we’re-all-gonna-die descent, then
recovered viciously back to $43.
THE SEARCH FOR BETTERRISK-ADJUSTED RETURNS
/05
Tackle Trading - Tackle 2532
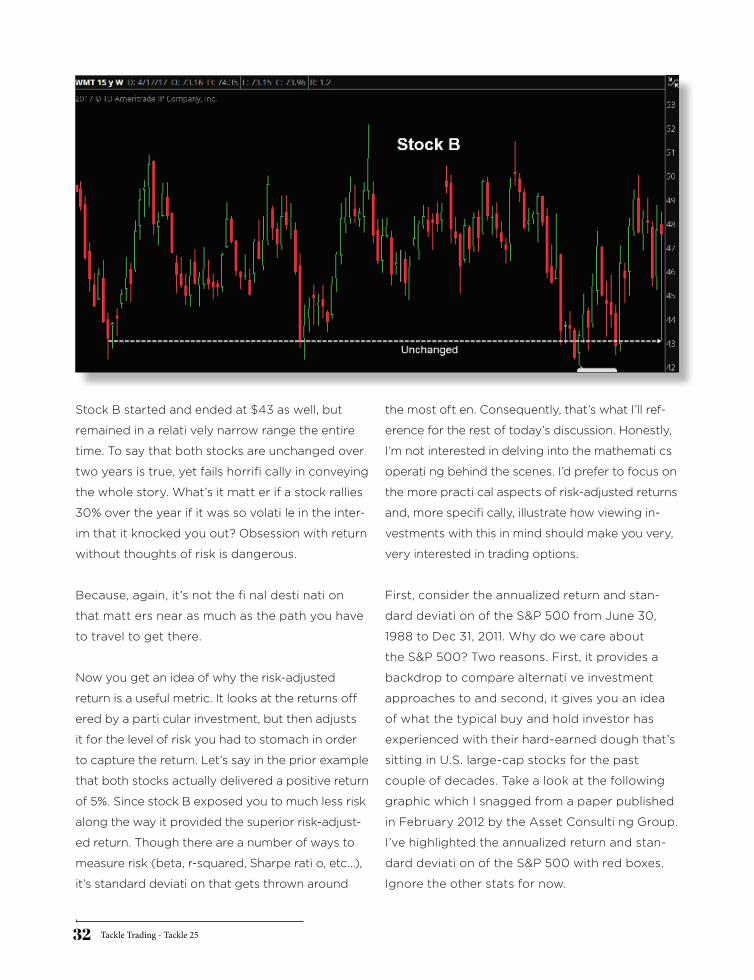
Stock B started and ended at $43 as well, but
remained in a relati vely narrow range the entire
time. To say that both stocks are unchanged over
two years is true, yet fails horrifi cally in conveying
the whole story. What’s it matt er if a stock rallies
30% over the year if it was so volati le in the inter-
im that it knocked you out? Obsession with return
without thoughts of risk is dangerous.
Because, again, it’s not the fi nal desti nati on
that matt ers near as much as the path you have
to travel to get there.
Now you get an idea of why the risk-adjusted
return is a useful metric. It looks at the returns off
ered by a parti cular investment, but then adjusts
it for the level of risk you had to stomach in order
to capture the return. Let’s say in the prior example
that both stocks actually delivered a positive return
of 5%. Since stock B exposed you to much less risk
along the way it provided the superior risk-adjust-
ed return. Though there are a number of ways to
measure risk (beta, r-squared, Sharpe rati o, etc…),
it’s standard deviati on that gets thrown around
the most oft en. Consequently, that’s what I’ll ref-
erence for the rest of today’s discussion. Honestly,
I’m not interested in delving into the mathemati cs
operati ng behind the scenes. I’d prefer to focus on
the more practi cal aspects of risk-adjusted returns
and, more specifi cally, illustrate how viewing in-
vestments with this in mind should make you very,
very interested in trading options.
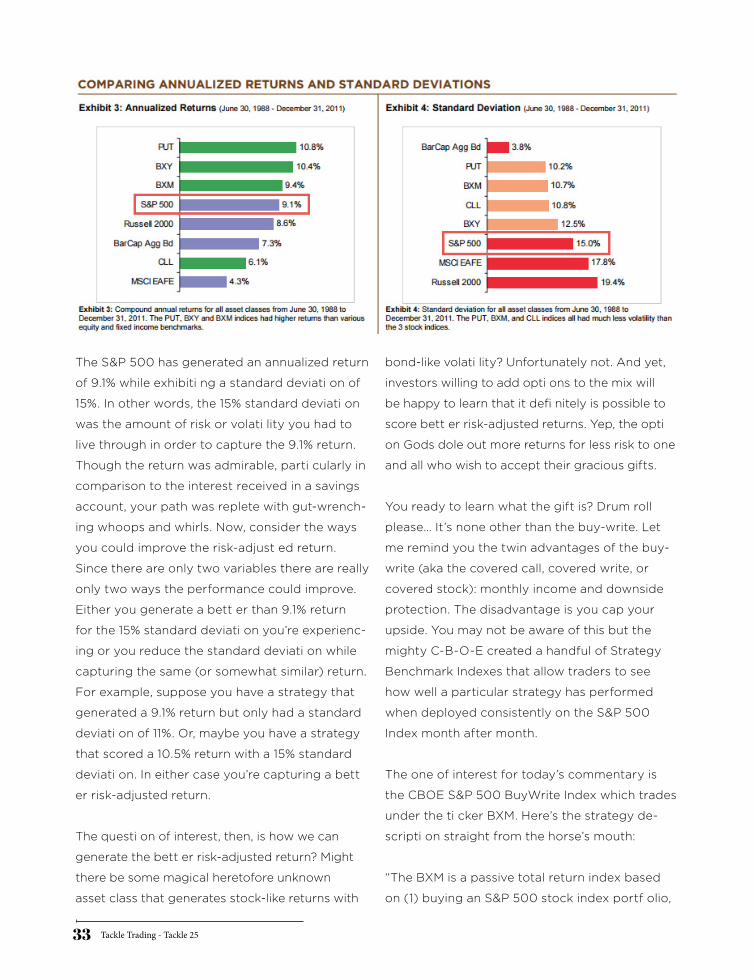
First, consider the annualized return and stan-
dard deviati on of the S&P 500 from June 30,
1988 to Dec 31, 2011. Why do we care about
the S&P 500? Two reasons. First, it provides a
backdrop to compare alternati ve investment
approaches to and second, it gives you an idea
of what the typical buy and hold investor has
experienced with their hard-earned dough that’s
sitting in U.S. large-cap stocks for the past
couple of decades. Take a look at the following
graphic which I snagged from a paper published
in February 2012 by the Asset Consulti ng Group.
I’ve highlighted the annualized return and stan-
dard deviati on of the S&P 500 with red boxes.
Ignore the other stats for now.
Tackle Trading - Tackle 2533
The S&P 500 has generated an annualized return
of 9.1% while exhibiti ng a standard deviati on of
15%. In other words, the 15% standard deviati on
was the amount of risk or volati lity you had to
live through in order to capture the 9.1% return.
Though the return was admirable, parti cularly in
comparison to the interest received in a savings
account, your path was replete with gut-wrench-
ing whoops and whirls. Now, consider the ways
you could improve the risk-adjust ed return.
Since there are only two variables there are really
only two ways the performance could improve.
Either you generate a bett er than 9.1% return
for the 15% standard deviati on you’re experienc-
ing or you reduce the standard deviati on while
capturing the same (or somewhat similar) return.
For example, suppose you have a strategy that
generated a 9.1% return but only had a standard
deviati on of 11%. Or, maybe you have a strategy
that scored a 10.5% return with a 15% standard
deviati on. In either case you’re capturing a bett
er risk-adjusted return.
The questi on of interest, then, is how we can
generate the bett er risk-adjusted return? Might
there be some magical heretofore unknown
asset class that generates stock-like returns with
bond-like volati lity? Unfortunately not. And yet,
investors willing to add opti ons to the mix will
be happy to learn that it defi nitely is possible to
score bett er risk-adjusted returns. Yep, the opti
on Gods dole out more returns for less risk to one
and all who wish to accept their gracious gifts.
You ready to learn what the gift is? Drum roll
please… It’s none other than the buy-write. Let
me remind you the twin advantages of the buy-
write (aka the covered call, covered write, or
covered stock): monthly income and downside
protection. The disadvantage is you cap your
upside. You may not be aware of this but the
mighty C-B-O-E created a handful of Strategy
Benchmark Indexes that allow traders to see
how well a particular strategy has performed
when deployed consistently on the S&P 500
Index month after month.
The one of interest for today’s commentary is
the CBOE S&P 500 BuyWrite Index which trades
under the ti cker BXM. Here’s the strategy de-
scripti on straight from the horse’s mouth:
“The BXM is a passive total return index based
on (1) buying an S&P 500 stock index portf olio,
Tackle Trading - Tackle 2534
and (2) “writing” (or selling) the near-term S&P
500 Index (SPXSM) “covered” call option, gener-
ally on the third Friday of each month. The SPX
call written will have about one month remaining
to expirati on, with an exercise price just above
the prevailing index level (i.e., slightly
out of the money). The SPX call is held unti l ex-
pirati on and cash sett led, at which ti me a new
one-month, near-the-money call is written.”
Let me break that down for you. The Index is buy-
ing the S&P 500 and selling one month slightly
out-of-the-money call opti ons. Then, riding to
expiration and letting the call option settle.
Rinse and repeat. How might you expect BXM has
stacked up versus simply buying and holding the
S&P 500? Your basic understanding of the cov-
ered call should give you some clues. For starters,
it should defi nitely outperform in sideways to
down markets since you’re capturing premium
that buy-and-holders aren’t. On the fl ipside the
BuyWrite Index will underperform in strong up
markets (you cap your upside, remember?). Ad-
diti onally, you probably experience less volati lity
since the premium received from the short call
helps buffer some of the downside each month.
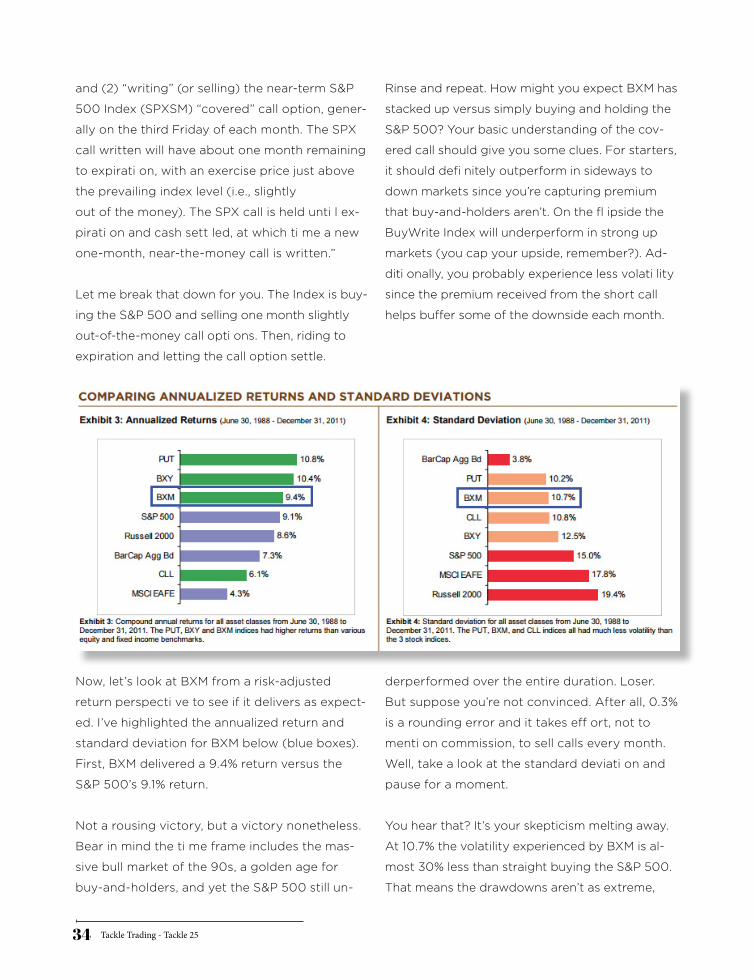
Now, let’s look at BXM from a risk-adjusted
return perspecti ve to see if it delivers as expect-
ed. I’ve highlighted the annualized return and
standard deviation for BXM below (blue boxes).
First, BXM delivered a 9.4% return versus the
S&P 500’s 9.1% return.
Not a rousing victory, but a victory nonetheless.
Bear in mind the ti me frame includes the mas-
sive bull market of the 90s, a golden age for
buy-and-holders, and yet the S&P 500 still un-
derperformed over the entire duration. Loser.
But suppose you’re not convinced. After all, 0.3%
is a rounding error and it takes eff ort, not to
menti on commission, to sell calls every month.
Well, take a look at the standard deviati on and
pause for a moment.
You hear that? It’s your skepticism melting away.
At 10.7% the volatility experienced by BXM is al-
most 30% less than straight buying the S&P 500.
That means the drawdowns aren’t as extreme,
Tackle Trading - Tackle 2535
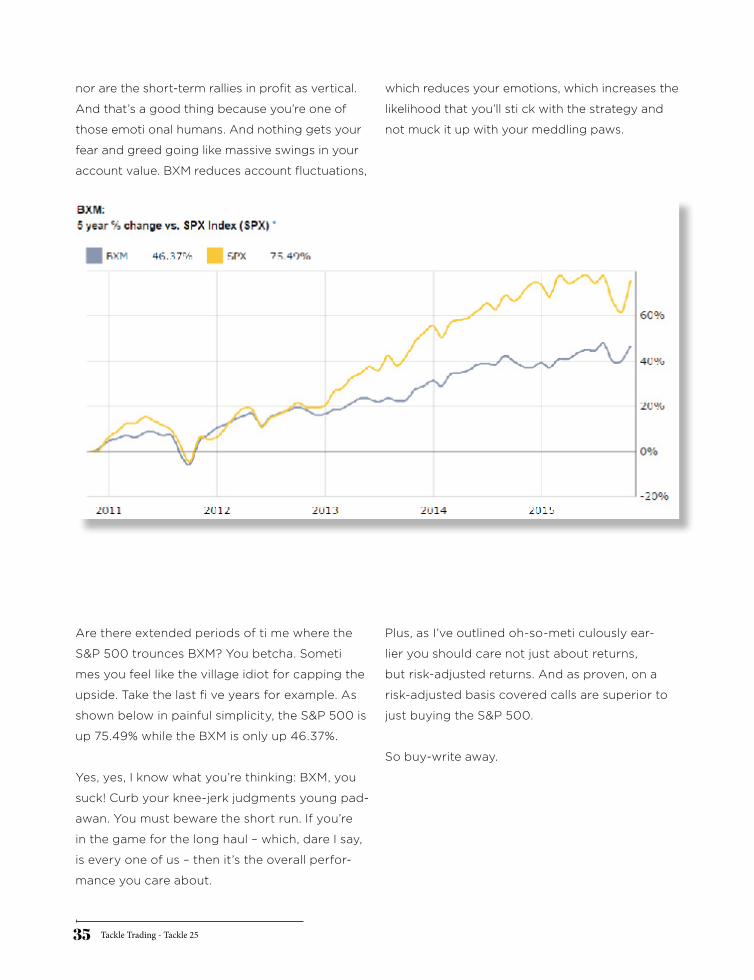
nor are the short-term rallies in profit as vertical.
And that’s a good thing because you’re one of
those emoti onal humans. And nothing gets your
fear and greed going like massive swings in your
account value. BXM reduces account fluctuations,
which reduces your emotions, which increases the
likelihood that you’ll sti ck with the strategy and
not muck it up with your meddling paws.
Are there extended periods of ti me where the
S&P 500 trounces BXM? You betcha. Someti
mes you feel like the village idiot for capping the
upside. Take the last fi ve years for example. As
shown below in painful simplicity, the S&P 500 is
up 75.49% while the BXM is only up 46.37%.
Yes, yes, I know what you’re thinking: BXM, you
suck! Curb your knee-jerk judgments young pad-
awan. You must beware the short run. If you’re
in the game for the long haul – which, dare I say,
is every one of us – then it’s the overall perfor-
mance you care about.
Plus, as I’ve outlined oh-so-meti culously ear-
lier you should care not just about returns,
but risk-adjusted returns. And as proven, on a
risk-adjusted basis covered calls are superior to
just buying the S&P 500.
So buy-write away.

Tackle Trading - Tackle 2536
The ti nker temptati on is oft en undeniable for
traders. It’s an itch to squeeze just a wee bit
more alpha out of your strategy that just never
goes away. No matt er your trading approach
the question of, “how can I make it better?” is
always circling that big old brain of yours.
The ultimate objecti ve is to craft a set of rules, a
master plan, which eff ecti vely maximizes gains
while minimizing losses in both turbulent and calm
seas. Even those who have long since optimized
their strategy still feel the tinkering itch beckoning.
Side Note: Alternate ti tles for this arti cle are
“Behold, Covered Call Perfecti on” and “The
Quest for Covered Call Perfection.” I just couldn’t
pass up the picture of the cute little mouse sec-
onds away from getting whacked. Don’t worry
though. All mice go to heaven.
Covered calls have commanded my attention
on and off over the past few months and I’ve
discovered a few tricks to improve the returns
delivered by the income generator.
And what better way to test my comprehension,
not to menti on signal to Karma that I’m a good little
soul willing to share my fi ndings with the masses,
than to divulge the details in all their glory to you?
Remember, the covered call (aka buy-write, cov-
ered write, synthetic short put) consists of buy-
ing 100 shares of stock and selling a call option
to score both income and downside protection.
If you own an ETF like the SPY and are selling
monthly covered calls then the only questi on
you really obsess over is strike price selection.
Selling lower strike calls aff ords more income,
more protection, but less potenti al profi t (you
quickly cut-off your upside in the stock). Selling
higher strike calls, say, 2% OTM, affords less in-
come, less protecti on, but more potenti al profit
since you can parti cipate in more upside in the
stock before having to part with your shares.
HOW TO BUILD ABETTER MOUSE TRAP
/06
Tackle Trading - Tackle 2537
Most traders selling calls on a monthly basis will
choose which approach appeals to them at the
outset and then conti nue to sell the same strike
price month after month. It’s systematic, consistent
and delivers the goodies as promised.
For example, suppose we purchased the Nas-
daq-100 ETF (QQQ) in April 2015 and had been
selling slightly OTM calls every month. As prom-
ised, the covered call has indeed delivered superior
risk-adjusted returns. At the time of this writing,
we’re up 3.8% while those who have simply bought
and held QQQ are down 3.5%.That right there is
what the high falut in traders like to call 730 basis
points of outperformance Alpha achieved!
But what if adopting a more adaptive approach
could yield better results? What if instead of
selling the same strike every month, we modified
the threshold depending on our directional bias?
When more bullish we could sell 2% OTM calls,
when neutral to bearish sell ATM calls.
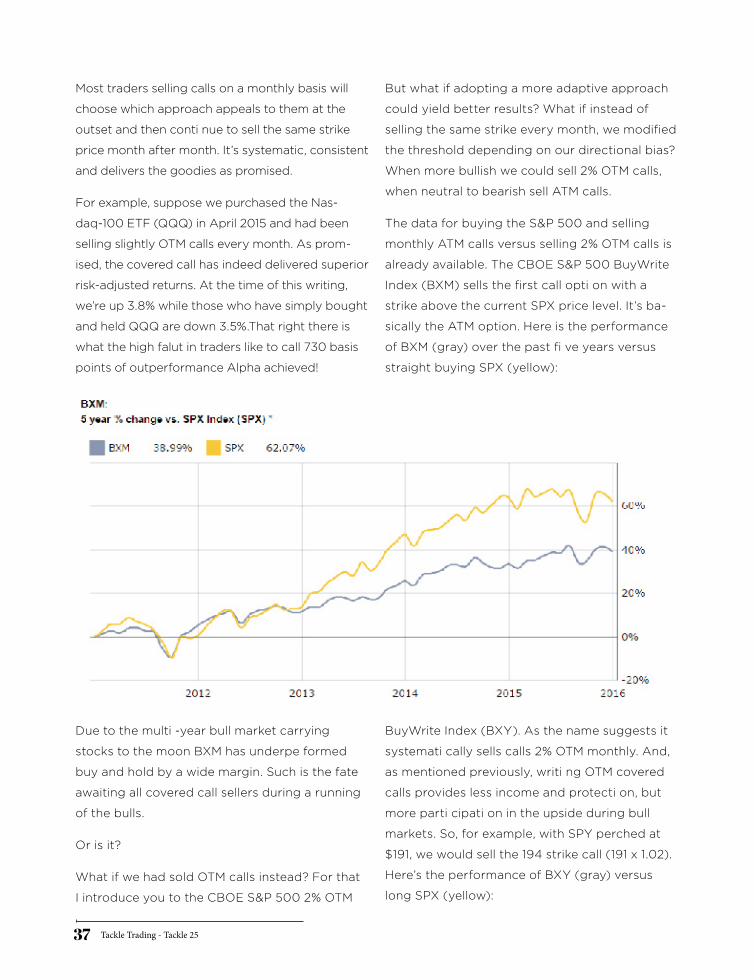
The data for buying the S&P 500 and selling
monthly ATM calls versus selling 2% OTM calls is
already available. The CBOE S&P 500 BuyWrite
Index (BXM) sells the first call opti on with a
strike above the current SPX price level. It’s ba-
sically the ATM option. Here is the performance
of BXM (gray) over the past fi ve years versus
straight buying SPX (yellow):
Due to the multi -year bull market carrying
stocks to the moon BXM has underpe formed
buy and hold by a wide margin. Such is the fate
awaiting all covered call sellers during a running
of the bulls.
Or is it?
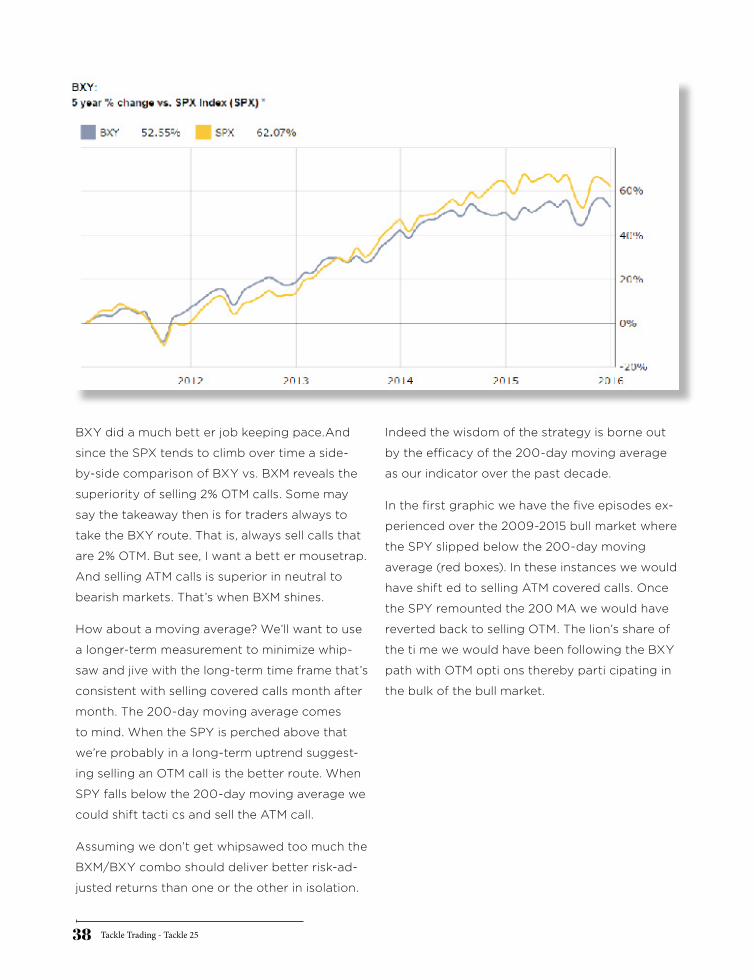
What if we had sold OTM calls instead? For that
I introduce you to the CBOE S&P 500 2% OTM
BuyWrite Index (BXY). As the name suggests it
systemati cally sells calls 2% OTM monthly. And,
as mentioned previously, writi ng OTM covered
calls provides less income and protecti on, but
more parti cipati on in the upside during bull
markets. So, for example, with SPY perched at
$191, we would sell the 194 strike call (191 x 1.02).
Here’s the performance of BXY (gray) versus
long SPX (yellow):
Tackle Trading - Tackle 2538
BXY did a much bett er job keeping pace.And
since the SPX tends to climb over time a side-
by-side comparison of BXY vs. BXM reveals the
superiority of selling 2% OTM calls. Some may
say the takeaway then is for traders always to
take the BXY route. That is, always sell calls that
are 2% OTM. But see, I want a bett er mousetrap.
And selling ATM calls is superior in neutral to
bearish markets. That’s when BXM shines.
How about a moving average? We’ll want to use
a longer-term measurement to minimize whip-
saw and jive with the long-term time frame that’s
consistent with selling covered calls month after
month. The 200-day moving average comes
to mind. When the SPY is perched above that
we’re probably in a long-term uptrend suggest-
ing selling an OTM call is the better route. When
SPY falls below the 200-day moving average we
could shift tacti cs and sell the ATM call.
Assuming we don’t get whipsawed too much the
BXM/BXY combo should deliver better risk-ad-
justed returns than one or the other in isolation.
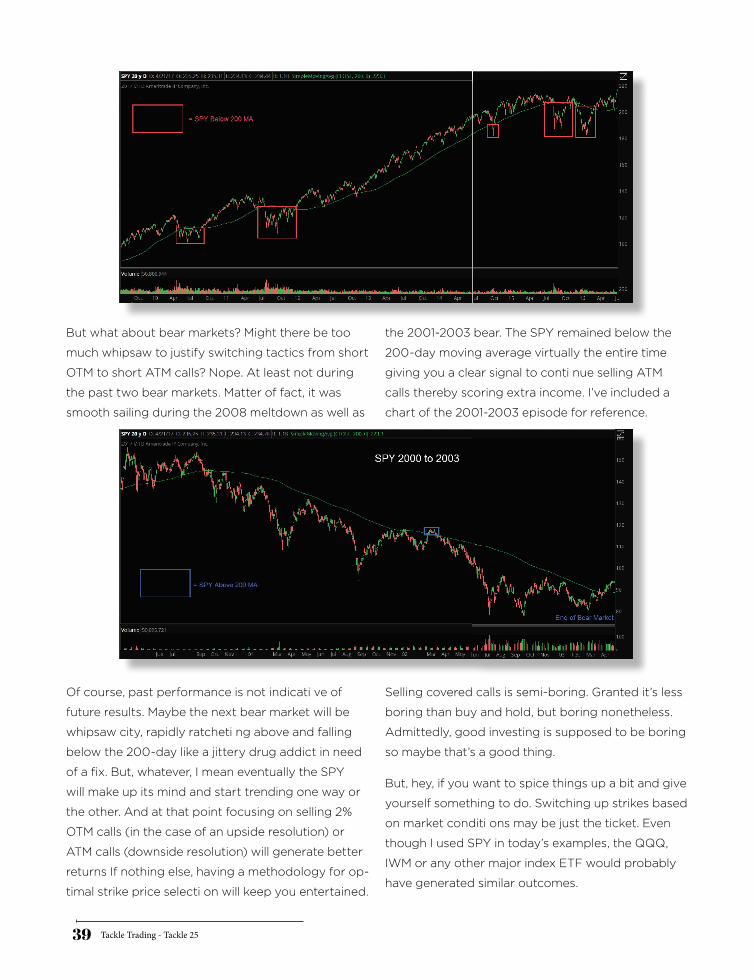
Indeed the wisdom of the strategy is borne out
by the efficacy of the 200-day moving average
as our indicator over the past decade.
In the first graphic we have the five episodes ex-
perienced over the 2009-2015 bull market where
the SPY slipped below the 200-day moving
average (red boxes). In these instances we would
have shift ed to selling ATM covered calls. Once
the SPY remounted the 200 MA we would have
reverted back to selling OTM. The lion’s share of
the ti me we would have been following the BXY
path with OTM opti ons thereby parti cipating in
the bulk of the bull market.
Tackle Trading - Tackle 2539
But what about bear markets? Might there be too
much whipsaw to justify switching tactics from short
OTM to short ATM calls? Nope. At least not during
the past two bear markets. Matter of fact, it was
smooth sailing during the 2008 meltdown as well as
the 2001-2003 bear. The SPY remained below the
200-day moving average virtually the entire time
giving you a clear signal to conti nue selling ATM
calls thereby scoring extra income. I’ve included a
chart of the 2001-2003 episode for reference.
Of course, past performance is not indicati ve of
future results. Maybe the next bear market will be
whipsaw city, rapidly ratcheti ng above and falling
below the 200-day like a jittery drug addict in need
of a fix. But, whatever, I mean eventually the SPY
will make up its mind and start trending one way or
the other. And at that point focusing on selling 2%
OTM calls (in the case of an upside resolution) or
ATM calls (downside resolution) will generate better
returns If nothing else, having a methodology for op-
timal strike price selecti on will keep you entertained.
Selling covered calls is semi-boring. Granted it’s less
boring than buy and hold, but boring nonetheless.
Admittedly, good investing is supposed to be boring
so maybe that’s a good thing.
But, hey, if you want to spice things up a bit and give
yourself something to do. Switching up strikes based
on market conditi ons may be just the ticket. Even
though I used SPY in today’s examples, the QQQ,
IWM or any other major index ETF would probably
have generated similar outcomes.
Tackle Trading - Tackle 2540
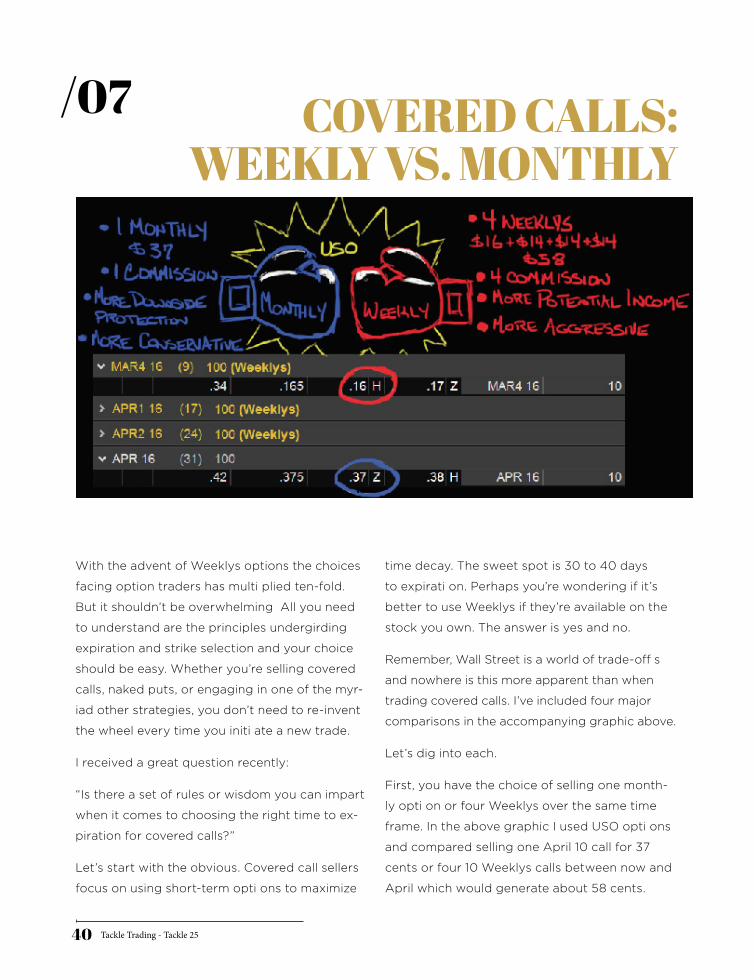
With the advent of Weeklys options the choices
facing option traders has multi plied ten-fold.
But it shouldn’t be overwhelming All you need
to understand are the principles undergirding
expiration and strike selection and your choice
should be easy. Whether you’re selling covered
calls, naked puts, or engaging in one of the myr-
iad other strategies, you don’t need to re-invent
the wheel every time you initi ate a new trade.
I received a great question recently:
“Is there a set of rules or wisdom you can impart
when it comes to choosing the right time to ex-
piration for covered calls?”
Let’s start with the obvious. Covered call sellers
focus on using short-term opti ons to maximize
time decay. The sweet spot is 30 to 40 days
to expirati on. Perhaps you’re wondering if it’s
better to use Weeklys if they’re available on the
stock you own. The answer is yes and no.
Remember, Wall Street is a world of trade-off s
and nowhere is this more apparent than when
trading covered calls. I’ve included four major
comparisons in the accompanying graphic above.
Let’s dig into each.
First, you have the choice of selling one month-
ly opti on or four Weeklys over the same time
frame. In the above graphic I used USO opti ons
and compared selling one April 10 call for 37
cents or four 10 Weeklys calls between now and
April which would generate about 58 cents.
COVERED CALLS:WEEKLY VS. MONTHLY
/07
Tackle Trading - Tackle 2541
When it comes to income generati on Weeklys
have the upper hand. You generate more cash
flow by selling four one-week opti ons instead
of a single one month opti on. But we can’t stop
there. How about cost?
If you sell monthly covered calls you’re essenti
ally paying one commission a month. If you sell
four Weeklys you’re paying four commissions.
The transaction costs for the Weeklys route is
four times greater. If you’re paying a minimal
amount of commission perhaps this isn’t a big
deal. If you’ve yet to get your commission down
to around $1 a contract then this could be a big
negative associated with Weeklys.
Using monthly options wins the transacti on cost
contest. Now, what of protecti on? Let’s say I sell
the April monthly covered call for 37 cents and
you sell the Mar 4 weekly for 16 cents. Then USO
plummets. Initi ally I have more than double the
amount of protecti on as you do. My call premi-
um will off set a 37 cent drop in the stock, yours
will only off set a 16 cent drop. Now, sure you can
roll to bring in more premium but so can I. That
doesn’t negate the fact that traders whoshort
monthly opti ons carry more protecti on than
those with Weeklys.
From a downside protecti on standpoint, month-
ly options are superior.
One final comparison of note is liquidity. Month-
ly opti ons are almost always more liquid. That
means the open interest is higher and the bid-
ask spreads are ti ghter. As a result the slippage
suffered using Weeklys will be worse If you’re
concerned with liquidity, then you should be
using monthly options.
There’s your match up.
Tackle Trading - Tackle 2542
/Part ICASH FLOW TRICKERY
When introducing the masses to the covered call
strategy we wisdom dispensers like to equate
real estate and rental income to stock ownership
and covered call selling. If you’ve yet to have the
pleasure to hear such a tale, then allow me.
In 2012 you bought a residential property for
$100k. All cash, because that’s how you roll. You’ve
heard for years that real estate can be a good
investment. It goes up in value, hedges against
inflation, and chicks dig real estate tycoons.
Fast forward to today. Five years have passed and
your home value is now, drum roll please … $100k.
So you complain to me, your buddy. Our conver-
sati on goes like so:
You: Curse you real estate gods! I’ve tied up
my hard earned dough for fi ve long years and
you’ve given me zippo for my troubles.
Me: Well, Tom (Dick, Harry, whatever your name
is) did you rent out your house along the way?”
You: Rent? What’s renting? Never heard of it.
I thought the only way you made money on a
house was if it went up in value.
Me: Well that’s one way but you also could have
rented your house out to someone in need of a
place to live. In doing so you could have brought
in I dunno, maybe $500 or $1,000 a month in
income. If you brought in even $500 per month
you would have scored $30K over the last five
years just in cash flow.
You: Wow, I’m dumb.
Me: Nope. Just ill-informed. There’s a diff erence.
And check this out. By scoring $30K along the
way you reduced your cost basis on the house to
$70K. Get it?
You: Got it.
Me: Imagine if you kept renti ng out the house
for the next 20 years. At some point you will
have captured $100K in income eff ecti vely
reducing your basis in the house to zero. Then
if the house blows up, technically you’re not out
any money at all.
Now to the stock market. Suppose instead of buy-
ing a house for $100K you bought shares of the
SPY in 2012. And pretend like the SPY has gone
sideways for the past fi ve years leaving you with
nothing to show for your big investment.
Guess what. If you came to me complaining my
response would be the same as that to the real
estate investor.
You: Curse you stock gods! Five years and noth-
ing to show for it.
Me: Well, did you rent out your stock along the
way?
You: Of what do you speak?
Me: You could have been renting out your stock
every month to score some income along the way.
Tackle Trading - Tackle 2543
You: No way!
Me: Way! It’s known as selling covered calls. Let’s
say you bought shares of the SPY at $100 apiece
in 2012. For $100K you could have purchased
1,000 shares. And every month you could have
sold ten call opti ons allowing you to capture,
let’s say, $1,000 per month ($100 per contract).
Over five years you would have generated accu-
mulated $60K in cash fl ow ($12k per year) from
selling covered calls. Think about the eff ect
that would have on your cost basis. Since you
brought in basically $60 per share, your basis
on the stock would have dropped to $40 from
the initi al $100. And if you conti nue to generate
income from covered calls for the next decade
there may even come a ti me where you reduced
your basis on the stock to zero.
So that’s the gist of the analogy. Now, here’s
where things diverge. When you rent out a
house you capture the rent no matter what the
house value does. Plus you’re not limiting how
much you can make in the house if it appreciates
in value. With covered calls it’s a bit different.
First off when you sell a call option you promise
to sell your stock at a set price. That limits your
upside in the stock right off the bat. In that sense
covered calls are more like a lease option in real
estate. Basically a lease opti on is when you allow
someone to rent your house with the opti on to
buy at a certain price for a set ti me frame. If my
house is $100K and I give you the right to buy it
at $105K for the next year, then I’m capping my
profi t potential on the house at $5K.
But it doesn’t stop there. If your stock falls you
have to keep selling lower strike calls. With XYZ
at $100 maybe I start out selling the 105 call.
But if the stock drops I’ll have to sell a 100 call,
then 95 call, then 90 call month to month if the
descent persists. Suppose aft er six months the
stock is down at $70 and I’m short the 75 call.
Sure, I may have brought in some income along
the way (say, $7) but I’m down $30 on the stock.
Feel free to get all excited about that $7, but
let’s be honest, your account value is sti ll down
substanti ally. So what’s the proper way to think
about your positi on here? Because of the short
75 call even if the stock were to magically recov-
er back to $100 tomorrow I wouldn’t parti cipate
in the bulk of the upside. Tricky, tricky.
You’ll find my answer in Cash Flow Trickery Part Two.
Tackle Trading - Tackle 2544
/Part IICASH FLOW TRICKERY
Previously we highlighted the poster child strate-
gy for cash fl ow kings – covered calls. Consider
the situation we left with last time:
“If your stock falls you have to keep selling lower
strike calls. With XYZ at $100 maybe I start out
selling the 105 call. But if the stock drops I’ll
have to sell a 100 call, then 95 call, then 90 call
month to month if the descent persists. Suppose
aft er six months the stock is down at $70 and
I’m short the 75 call. Sure, I may have brought
in some income along the way (say, $7) but
I’m down $30 on the stock. Feel free to get all
excited about that $7, but let’s be honest, you’re
account value is still down substantially.
So what’s the proper way to think about your
positi on here? Because of the short 75 call even
if the stock were to magically recover back to
$100 tomorrow I wouldn’t parti cipate in the bulk
of the upside. Tricky, tricky.”
In sum, we’re down $30 on the stock (an un-
realized loss) while having captured $7 along
the way in call premiums (a realized gain). The
fundamental problem is that we need the stock
to recover back towards $100 (our original pur-
chase price), and yet by virtue of our short 75
call option we are obligati ng ourselves to sell the
stock relati vely quickly if it were ever to recover.
Side note – our cost basis is really $93 for the
stock due to the $7 of premium received over
the past six months.
Consider your choices.
First, you could buy back the 75 call if the S70
stock were to rally past the $75 zone. Once
the short call has been closed you’re left with a
straight stock position allowing unfett ered parti
cipati on in any further rally. The drawback? You
no longer have any protecti on and you probably
just locked in a heft y sized loss on the 75 call.
Second, you could simply stop selling covered
calls altogether. Now that the stock is perched at
$70 (a substanti al 30% discount from its highs)
perhaps you’re willing to simply be long stock
at this point. At $70 it certainly has less down-
side risk than at $100. The drawback? What if
the stock languishes at $70 for months on end,
or worse, conti nues plumbing the depths? By
halting your covered call campaign you may be
leaving some serious dough on the table.
Third, stay the course. Remember, short calls
limit your profi t potential for a time. You’re not
limiting your profit potential on the stock forev-
er. Simply for the next month, or however long
you have ti ll expirati on. The beauty of selling
short-term covered calls (one month being the
preferred ti me slot) is that you can adjust the
strikes frequently as the stock undergoes price
shifts, subtle or otherwise.
For example, though we’re short a one month 75
call against our $70 stock it merely limitSs our
upside to $5 in the stock for one month. Aft er
Tackle Trading - Tackle 2545
that if the stock is hanging at $80, we could sell
the one month 85 call. If the stock keeps power-
ing higher and is sitti ng at $90 then, you guessed
it, we could sell the 95 call. Even if the stock ran
through my call strike month after month I’d sti ll
be capturing the lion’s share of the upside.
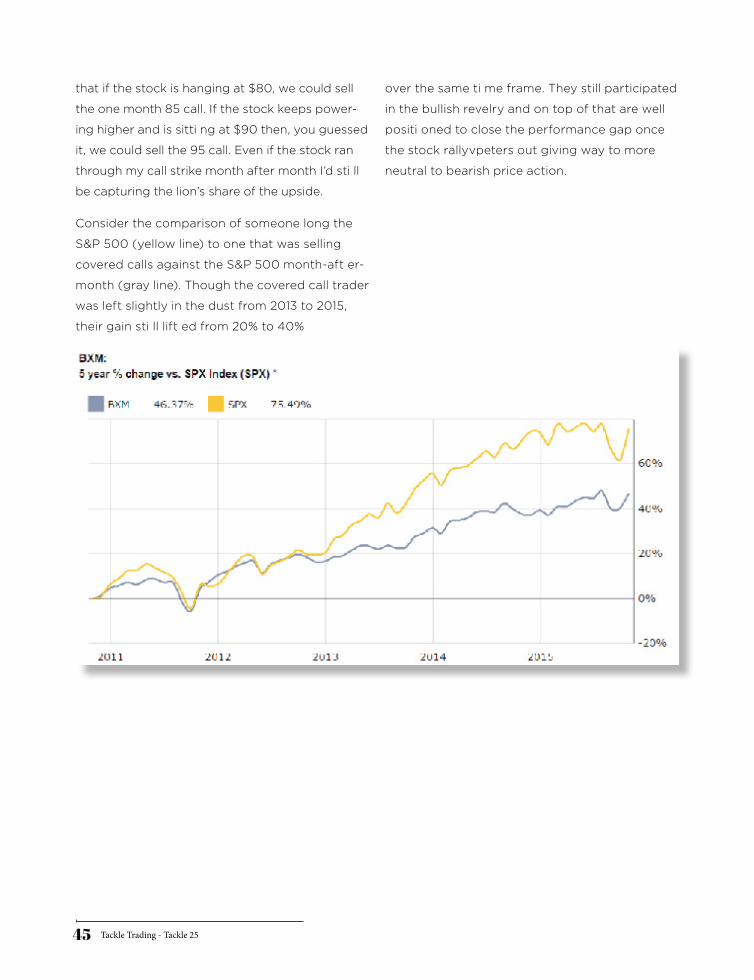
Consider the comparison of someone long the
S&P 500 (yellow line) to one that was selling
covered calls against the S&P 500 month-aft er-
month (gray line). Though the covered call trader
was left slightly in the dust from 2013 to 2015,
their gain sti ll lift ed from 20% to 40%
over the same ti me frame. They still participated
in the bullish revelry and on top of that are well
positi oned to close the performance gap once
the stock rallyvpeters out giving way to more
neutral to bearish price action.

Tackle Trading - Tackle 2546
www.tackletrading.com
IT IS A NO BRAINER, IF YOU ARE NOT ALREADY A TACKLE TRADING MEMBER, JOIN US FOR A 15-FREE TRIAL
SIGN UP NOW