tabor to the river program - portland state university · tabor to the river program an evaluation...
TRANSCRIPT

B u r e a u o f E n v i r o n m e n t a l S e r v i c e s • C i t y o f P o r t l a n d
D a n S a l t z m a n , C o m m i s s i o n e r • D e a n M a r r i o t t , D i r e c t o r
Tabor to the RiverProgram
An Evaluation of Outreach Efforts
and Opportunities for EngagingResidents in Stormwater
Management
�
October2010
REPORT CV-T2R eval_ REPORT COVER 8.5 x 11" 2/12/10 5:20 PM Page 1

Study and Report by:Vivek Shandas, PhD
Toulan School of Urban Studies and Planning, Portland State [email protected] 503-725-5222
Anne NelsonEnvironmental Program Coordinator
Bureau of Environmental Services, City of Portland, Oregon
Carine ArendesResearch Assistant, Portland State University
Cathy Cibor, MURPResearch Assistant, Portland State University
AcknowledgementsThe City of Portland and Portland State University (PSU) have a long history of partnerships andcollaboration. Portland State University researchers have been working with the Bureau of
Environmental Services (BES) to address current research needs, which can help improve policiesand programs. In addition, BES has enabled undergraduate and graduate students to engagewith projects of immediate and regional concern, enriching their educational experience.
Several members at BES and PSU have been instrumental in the completion of the first phase of this project. Specifically, Susan Barthel, Kristan Burkert, Matt Burlin, Megan Callahan,
Amber Clayton, Jennifer Devlin, Linda Dobson, Rhetta Drennan, Ivy Dunlap, Ryan Durocher,Dave Elkin, Megan Hanson, Emily Hauth, Diana Hinton, Dawn Hottenroth, Jennifer Karps, Paul Ketcham, Linc Mann, Alice Meyers, Colleen Mitchell, Sara Morrissey, Bill Owen, Anne Peterson, Josh Robben, Allen Schmidt, Rowan Steele, Henry Stevens, Erica Timm,
Naomi Tsurumi, Lynn Vanderkamp, Dan Vizzini, Mary Wahl, Marlies Wierenga and BrandonWilson at BES provided assistance in survey design, testing, analysis, and insights on the resultsof the survey. Leslie Winter-Gorsline at BES was instrumental in designing the survey and othermaterials for public presentation. Members of the PSU faculty who have helped in designingthe survey and interpreting results include Barry Messer and Connie Ozawa. We are also
especially grateful to all respondents of the survey, our partners for watershed health in Taborto the River, without whom the first phase of this project could not have been completed.
REPORT CV-T2R eval_ REPORT COVER 8.5 x 11" 2/12/10 5:20 PM Page 2
- 1 -
Table of Contents
Executive Summary....................................................................................................................................................2
Key Findings...................................................................................................................................................................8
Recommendations.......................................................................................................................................................9
Full Report....................................................................................................................................................................10
Introduction.................................................................................................................................................................10
Assessment Protocol................................................................................................................................................13
SE Portland Neighborhood Survey Design.....................................................................................................13
Sampling........................................................................................................................................................................16
Analysis of Survey.....................................................................................................................................................16
Survey Results............................................................................................................................................................17
Descriptive Analysis.................................................................................................................................................18
Awareness of Neighborhood Stormwater Projects....................................................................................24
Neighborhood Perceptions...................................................................................................................................26
Stormwater Management Techniques and Strategies: Current Understanding............................27
Social Determinants of Stormwater Management......................................................................................30
Stormwater Management Techniques and Strategies: Supporting Implementation……....……32
Participation and Involvement............................................................................................................................33
Respondent Participation in Neighborhood Involvement.......................................................................34
Civic Involvement......................................................................................................................................................35
Considerations for Future Actions.....................................................................................................................35
Appendix A: SE Portland Neighborhood Survey.…………….......................................................................39
Appendix B: Responses to All Survey Questions………...............................................................................48
Appendix C: Researcher Profiles……………………...………..............................................................................64

- 2 -
Executive Summary
Stormwater management using green infrastructure such as bioswales, green streets, trees and rain
gardens are effective at mitigating environmental impacts caused by urban development, while reducing
the costs associated with replacing aging stormwater infrastructure. Equally important are the potential
community benefits of green infrastructure, which can include a better understanding and knowledge by
citizens of ecological systems, increased access to urban green spaces, safer and healthier neighborhoods
and informed residents who are able to take appropriate action for improving neighborhoods and
watershed health.
While much effort is devoted to understanding the hydrology of urban watersheds and the infrastructure of
stormwater management (e.g. pipes, drainage systems, etc.), few evaluations have been conducted on the
extent to which sustainable stormwater systems are acceptable to citizens or the social conditions that can
help ensure their long-term success. This study is the first phase in a long-term research effort to develop a
replicable model of best practices in working with the community for mutually-beneficial and well-
stewarded green infrastructure in Portland. While there is currently only a limited understanding about the
extent and acceptance of sustainable stormwater systems within the U.S., the City of Portland is pursing an
aggressive campaign to integrate green infrastructure as part of the overall stormwater management
system. This campaign is coupled with an extensive partnership with the community, encouraging
residents to learn more about and take a more active role in these systems.
This report summarizes the key findings from a neighborhood survey that focused on household
perceptions of sustainable stormwater systems. The survey was conducted in collaboration with the City of
Portland’s Bureau of Environmental Services (BES) and Portland State University’s Center for Urban
Studies. In May 2009, a neighborhood survey was successfully mailed to 2,192 households in the Tabor to
the River (T2R) Program area. This area consists of 1,400 acres of predominately residential
neighborhoods in the southeast quadrant of the city. The area was chosen for evaluation because of the
geographic extent and scale of the T2R Program (installation of 500+ green streets, 100+ private property
stormwater retrofit projects, 3,500 trees and 81,000 linear feet of new pipe) and a recognition by the city
that the long-term success of the program depends on effective outreach activities prior to, during, and
after construction.
Areas within the T2R Program are categorized based on the city’s project defined boundaries – these are
referred to as TGDs. Survey project areas were selected based on the immediacy of construction; those

- 3 -
residents surveyed were living in neighborhoods where many new sustainable stormwater facilities would
be located. Based on the construction schedule, those residents living in neighborhoods where extensive
outreach occurred were slated to undergo construction earlier, while those receiving less information were
expected to begin construction later in the program schedule. For example, those neighborhoods expecting
to see changes to the stormwater infrastructure many years away would only have been exposed to area-
wide outreach on the program: newsletters, SE Examiner ads, tabling at community events, etc. rather than
city-sponsored direct mailings.
Prior to administering the survey, publicly available data was used to characterize the social and built
environments for each neighborhood within the T2R study area. Information about the social and built
conditions of the neighborhoods in the study area allowed for the selection of two comparable control
neighborhoods, one located north of the study area (Control 1) and the other south (Control 2). To assess
differences between each TGD and control area, each survey was color-coded according to location. To
increase response rates, the survey administrators sent each household an introductory postcard one week
prior to mailing the survey, a reminder postcard one week after the surveys were received, posted
advertising about the survey in a local newspaper and offered several prize drawings for respondents if
they returned the survey within three weeks. The survey contained 28 questions divided into four sections:
(1) awareness of the T2R stormwater program; (2) perceptions of their neighborhood; (3) understanding
of and interest in stormwater management; and (4) an optional section on general demographics of
respondents.
Since the explicit aims of the survey were to understand the effectiveness of outreach efforts in the T2R
Program area and to assess the likelihood for engaging households in watershed enhancement, stormwater
management projects on their property and potential interest in stewarding publicly owned stormwater
facilities, the surveys were examined using qualitative and quantitative analysis with a focus on the social
determinants of stormwater management and stewardship. Most importantly, this survey reflects a
collection of baseline data and is the first stage of an evaluation of T2R outreach and education efforts. The
second stage consists of interviews with a subset of respondents who noted they would welcome follow-up
questions. This follow-up survey is currently in development. This study design, collecting data from
residents prior and post stormwater facility construction, will allow for a robust analysis of the types of
strategies that are most effective in engaging residents in stormwater management and for understanding
whether neighborhood perceptions change as a result of the T2R Program.

- 4 -
Of the 2,579 surveys mailed, a total of 387 were undeliverable by the post office due to faulty addresses,
vacant housing or other reasons. Accordingly, a total of 2,192 were successfully mailed to residents in the
T2R area and control areas, resulting in a response rate of 27% (583). Response rates varied across the
study areas however, from as low as 20% (Control Area 2) to as high as 69% (Control Area 1). The
demographic profile of respondents was generally educated (78% attainment of a Bachelor’s Degree or
higher) and above the median income for the city (65% greater than $50,000/year). The age of
respondents, the most variable of all demographics considered, was approximately an even break between
25 and 64 years of age. A smaller proportion (14%) were above 65 years of age. This range of responses
(normal distribution) allowed for several analytical techniques to be employed (e.g. statistical tests). Of the
key findings from each of the three main survey sections (information sources, neighborhood perceptions
and stormwater management strategies) the largest portion of this executive summary and the report’s
focus on the findings related to respondents’ understanding of and interest in stormwater management
strategies.
Information Sources
Outreach efforts to inform residents in the study area appear to be successful. Over half the respondents
knew about the T2R Program and direct mailings by the city were cited as the primary information source
accounting for 73% of the respondents. Most respondents (62%) also reported that the information they
had received about stormwater projects, from any source, did not affect what they did on their own
property. When asked about sources of stormwater management information, respondents cited city-
sponsored mailings (20%), the internet (17%), friends, family and neighbors (14%), technical experts
(7%), and regional newspapers (5%). Approximately 30% of respondents stated they do not actively look
for information on stormwater management.
Overall, residents in TGDs and control areas would like to know more about sustainable stormwater
practices. The most popular topics among respondents included rain gardens, rainwater harvesting, native
plants and managing stormwater on private property. Statements of interest regarding stormwater
management were met with neutral levels of agreement. Responses to the statement “I would take a course
on managing stormwater” had the highest level of agreement, while the statement with the least agreement
was “I would like more vegetation on my street.”

- 5 -
Neighborhood Perceptions
Survey respondents were asked to rate their perception of neighborhood conditions based on several
categories, including attractiveness, safety, greenery and walking and biking facilities. Overall, survey
respondents rated the following neighborhood provisions positively: walking facilities, greenery/trees,
parks and open spaces, biking facilities, parking and neighborhood associations. Respondents had lower
ratings for street-cleaning services, community centers and public art across all study areas. While
responses contained variation across perceived neighborhood conditions, the largest variation occurred
between TGD areas and control areas. Respondents from the T2R Program areas rated their neighborhoods
higher on each neighborhood characteristic than the respondents from the control areas, specifically
Control Area 1 (A map of all the study areas is available in the Full Report). The exceptions to this were
community centers and parks (and other open spaces), where control area respondents rated their
neighborhoods slightly higher than those in the T2R Program area. Control Area 2 respondents
consistently gave their neighborhood lower ratings than Control Area 1 respondents.
Stormwater Management Strategies
Responses to implementing stormwater management strategies on private property contained minimal
variation between T2R Program areas and the control areas. Of the stormwater strategies identified in the
survey, those already being implemented by survey respondents include: disconnection of downspouts
(58%), planting trees (44%), naturescaping (31%) and removal of lawns (28%). The responses contained a
high level of correlation between those strategies already being implemented with those that had a high
probability for implementing other strategies indicating that residents who were currently using one type
of stormwater management technique on their property were highly likely to implement others. On the
other hand, those strategies that respondents had little knowledge about or were not likely to implement
included: infiltration planter (73%), flow-through planter (67%), ecoroofs (53%), bioswales (51%),
drywells (46%), and removal of paved areas (38%). Respondents cited financial assistance (28%) and
technical assistance (27%) as the most helpful resources for considering and/or installing stormwater
management strategies on their property.
The majority of respondents (51%) described that they would be willing to spend one to three hours per
month to help maintain vegetation on their street, while 11% said they would not spend any time
maintaining vegetation on their street. On average, respondents in the T2R Program areas were twice as
likely to spend time maintaining vegetation on their street than those in the control areas. When asked
what would encourage respondents to get more involved with stormwater management in their

- 6 -
neighborhood and on their property, participants were able to select up to three responses. Most
respondents identified a “how-to guide” about caring for stormwater management facilities or an “in-
person tutorial.” Other common responses to the question of what would encourage involvement with
stormwater management included having the city install a green street in their neighborhood (67%) and
seeing neighbors take similar actions (48%).
In a final analysis of the likelihood of maintaining stormwater facilities, responses to specific questions
were assessed against demographic and other factors through a linear regression technique (i.e. ordinary
least squares). Analyses were divided into two categories, income and TGD area versus control areas. In
terms of income, higher income households (greater than $75,000 annually) were more likely to help
maintain neighborhood sustainable stormwater facilities. Higher income households were also more likely
to maintain neighborhood sustainable stormwater systems if they were involved with other environmental
projects, had frequent conversations with their neighbors, or if they rated their neighborhood lower in
terms of the presence of parks or other open spaces. Those in lower income households were more likely to
help maintain stormwater facilities if they had higher education (graduate degree), perceived a high quality
neighborhood association coupled with low access to parks or other open space, or were in the younger
demographic groups. Respondent willingness to help maintain neighborhood sustainable stormwater
facilities varied extensively between the T2R Program areas and control areas. Program area respondents
were more likely to help maintain these facilities if one of the following also described them: (1) they were
younger; (2) were involved in other environmental projects and kids groups; (3) perceived a high quality
neighborhood association coupled with low access to parks or other open space; (4) considered their
neighborhood lacking in greenery; or (5) had more frequent attendance at community meetings. Those in
the control groups were more likely to help maintain stormwater facilities if they had graduate degrees or
(believed there was) a lack of street cleaning services in their neighborhood.
Conclusion
Residents who responded to the survey seem to be well informed of current stormwater projects by the
City of Portland, and, in general, have favorable perceptions of the T2R neighborhoods. Those who reported
being aware of upcoming stormwater projects in their neighborhood have a greater and more nuanced
understanding of managing stormwater systems, whether on their property or in their neighborhood.
While the level of knowledge and interest in sustainable stormwater management varies, a significant
proportion of the respondents currently are involved with different forms of stormwater management on
their property. Those who self-identified as having a high level of stormwater knowledge also are more

- 7 -
involved in neighborhood and city activities. The survey results illustrate an interest in several stormwater
management strategies and highlights information gaps among respondents. Currently, residents are
implementing strategies that are easily understood and not technically difficult. Respondents indicated
hands-on trainings and in-person tutorials would encourage them to get more involved in stormwater
management. Supportive strategies that appeal to respondents are financial incentives and technical
assistance. In addition, reducing costs and keeping time commitments down can overcome obstacles to
involvement.
The T2R Program - a long term investment in green infrastructure - has a high potential for involving
residents in managing newly installed stormwater facilities and to take action on their own property to
improve watershed health. Through greater involvement with residents, the city will enable citizens to
better manage stormwater and vegetation on and off private property, lower infrastructure and
maintenance costs, build greener neighborhoods and improve watershed health. After installation of the
T2R green infrastructure is complete, further research will need to be conducted to measure awareness
and knowledge of sustainable stormwater management strategies and benefits post-construction in
comparison with this pre-construction research. As the T2R Program and the Grey to Green initiative
continue to expand the application of green infrastructure across Portland, it will be important to continue
examining the opportunities for understanding the social determinants of sustainable stormwater
management specifically and watershed stewardship more generally.
For additional program information please refer to: portlandonline.com/bes/tabortoriver
For additional information about the research and other similar efforts please refer to:
http://web.pdx.edu/~vshandas/

- 8 -
Key Findings
• The City of Portland’s Bureau of Environmental Services’ stormwater outreach and education efforts
are effective. In terms of the sources of information regarding stormwater management and the level
of understanding of changes in the neighborhood, BES has effectively informed residents of the Tabor
to the River area about the imminent changes to the stormwater system in their neighborhood.
• Although the information provided by BES resulted in mixed responses in terms of the stormwater
management actions taken by property owners, the majority of respondents (51%) described that
they would be willing to spend one to three hours per month maintaining vegetation on their street.
On average, respondents in the TGDs were more likely to spend time maintaining vegetation on their
street than those in the control areas. When asked what would encourage respondents to get more
involved with stormwater management in their neighborhood and on their property, most
respondents identified a “how-to guide” about caring for stormwater management facilities or an “in-
person tutorial.” Other common responses included having the city install a green street in their
neighborhood and seeing neighbors take similar actions.
• Those who reported being aware of upcoming stormwater projects in their neighborhood have a
greater and more nuanced understanding of managing stormwater systems, whether on their
property or in their neighborhood.
• Many residents are actively involved in downspout disconnection, tree planting and naturescaping
programs that are currently active city programs. These results underscore the importance of
citywide efforts to engage citizens in private property stormwater management and greater
willingness to participate in community greening efforts.
• Residents who are actively involved in various forms of civic life (e.g. neighborhood meetings or
associations, community programs, etc.) also have a higher interest and willingness to participate in
stormwater management activities on their street.
• Respondents indicated that they could have a positive impact on their neighborhood by maintaining
landscaping and engaging neighbors. In addition, a significant number of respondents also suggested
that planting vegetation, maintaining trees and participating in neighborhood events were important
parts of ensuring a healthy neighborhood.
• Stormwater management strategies that are easily understood and less technically involved are highly
preferred, as are financial and technical assistance for expanding citizen involvement.
• Of those expressing interest in neighborhood scale stormwater activities, respondents wanted to learn
more about stormwater management and indicated a willingness to take workshops on rain gardens,
rainwater harvesting, native plants and managing stormwater on private property.

- 9 -
Recommendations
• Strengthen opportunities for residents to participate in neighborhood activities through the Tabor to
the River Program area and other outreach program locations. The study results suggest that those
who have a greater involvement in community activities (e.g. civic groups, neighborhood associations,
PTA, etc.) are more likely to implement and help maintain stormwater facilities and participate in
neighborhood efforts to improve stormwater management.
• Engage residents through expanding education and outreach activities alongside stormwater
management classes and hands-on training programs to increase the likelihood of successful
sustainable stormwater management programs. By providing stormwater maintenance training
curricula for use by citizens and trusted organizations, residents can participate in the maintenance of
facilities, and support their functioning for the long-term.
• The implementation of stormwater facilities throughout the Tabor to the River Program area offers
many opportunities to leverage ongoing sustainability efforts by many city and regional programs. By
linking the Tabor to the River Program to other city programs, such as the EcoDistricts initiative, the
Portland Plan, the Pedestrian Master Plan, etc., the city can increase community involvement and
interest in sustainable stormwater programs, while supporting citizens to improve other
neighborhood conditions. Increasing the conceptual linkages between various city sponsored
programs and the Tabor to the River Program, neighborhood involvement can be leveraged, which
can lead to greater awareness of sustainable stormwater management, both on private property and
within the neighborhood.
• Continue providing opportunities for residents to receive financial and/or technical assistance for
managing stormwater on private property. This assistance also may improve the acceptance of the
publicly-owned facilities in addition to increasing awareness of neighborhood residents.
• Continue conducting assessment of resident perceptions and experiences in and around new and
existing facilities. Ongoing monitoring and assessment are vital to the city’s and community’s capacity
to learn about and address long-term projects like the Tabor to River Program. Information gathered
from surveys and outreach activities can assist managers in applying and adapting proven methods to
other neighborhoods. Such research can provide insights about how interventions like the Tabor to
the River Program can improve the quality of neighborhoods, and, if sustained over many years, offer
insights about the most effective approaches to improve watershed health.
• Continue partnerships with other bureaus on projects that increase community livability as they will
improve resident attitudes about neighborhoods, thus increasing their willingness to get involved
with stormwater management.

- 10 -
FULL REPORT
Introduction
Strategies for working with neighborhood residents to implement and manage green infrastructure (e.g.
vegetated stormwater facilities, bioswales, rain gardens, ecoroofs and trees) are not as common or as well
understood as those related to traditional sewer and stormwater drainage and pipe systems installation
and maintenance. While green infrastructure is an important part of the City of Portland’s stormwater
management plan, the current understanding about the role of green infrastructure in improving social,
economic, and environmental conditions is limited. These green approaches to stormwater management
can mitigate the environmental impacts of development while reducing the costs of upgrading aging
stormwater pipe systems. Equally important, however, are the potential community benefits that might
include an increased understanding and knowledge of ecological systems, increased access to nature, safer
and healthier neighborhoods and informed residents who are equipped and inspired to take action that
promotes watershed health. This report examines whether an increased understanding of stormwater
management techniques can reduce the costs associated with stormwater management while reducing
water flow into the combined sewer system.
The City of Portland seeks to be responsive to and involve citizens when providing necessary services.
Outreach efforts on the part of the Bureau of Environmental Services (BES) have been extensive and based
upon a vision that describes residents as instrumental in the long-term success of city operations, including
the management of stormwater. As the city accelerates implementation of innovative strategies to address
stormwater management, increasing citizen knowledge and participation is also a critical component of
successfully implementing sustainable infrastructure. Benefits of successful outreach include reduction of
stormwater flows into the combined sewer system from both public and private property, removal of
pollutants entering the watershed, successful long-term functioning of vegetated stormwater facilities,
engaging citizens in the stewardship of newly installed green infrastructure facilities and increased
vegetation plantings and stormwater management on private property. Finally, well-designed outreach and
education strategies can improve the conditions of a neighborhood by enhancing property values1 and
creating social networks2.
1 Donovan, G.H. and Butry, D.T. (2008), Market-based approaches to tree valuation. Arborist News: 52-55. 2 Uphoff, N. (1998). Understanding social capital: learning from the analysis and experience of participation. In
I. Serageldin, & P. Dasgupta (Eds.), Social Capital. Oxford: Oxford University Press.

- 11 -
A model of implementation of the Portland Watershed Management Plan – the primary driver of BES’
approach to improving watershed conditions within the city – the Tabor to the River (T2R) Program will
significantly expand the amount of green infrastructure in Portland through the construction of 500
stormwater facilities in the public right of way, over 100 private stormwater facilities and the planting of
3,500 trees over a ten to fifteen year time period beginning in 2009. The first 35 stormwater facilities were
completed in the spring of 2010. The project is a large scale green infrastructure and watershed
enhancement project that aims to improve the sewer and stormwater system in a discrete area of the city:
an area of approximately 1,400 acres in the southeast quadrant of the city. The T2R Program goal is “to
develop a healthy urban watershed that supports natural functions and a reliable sewer system.” As an
integrated plan to improve the capacity of the existing storm/sewer pipe infrastructure, the installation of
hundreds of sustainable stormwater management facilities will divert large amounts of stormwater away
from the combined sewer pipe system to vegetated stormwater facilities. The T2R Program builds on
earlier dimensions of Portland’s sustainable stormwater program by increasing the installation of
vegetated stormwater facilities coupled with watershed improvements and education. The city anticipates
expanding the network of stormwater facilities throughout the city, based in part on the T2R Program
model. For additional program information please refer to: portlandonline.com/bes/tabortoriver.
As part of the construction of the T2R stormwater facilities, the city has been conducting an extensive
outreach and education program in the area since early 2008 (in addition to outreach related to the
predesign between 2005-2007). The purpose of the outreach and education element of the program is to
engage residents in contextualizing the role of sustainable stormwater infrastructure within the larger
program of sewer pipe retrofits and to improve watershed health. The education program provides
information on how green infrastructure works, why the city is using it and how it will benefit the
community. The education program also encourages residents to participate in the program by managing
stormwater on private property, removing invasive plants, planting trees and joining in community
watershed health activities. The outreach component informs residents in the T2R Program area about
imminent construction occurring in their neighborhood, the benefits of the program and provides an
avenue for residents to share their perspectives on the changes created by T2R. The feedback received in
response to these practices will be analyzed and compiled to further construct a model to implement a
Tabor to the River type of program in other parts of the city.
Other BES and City of Portland studies have contributed to a baseline understanding of residents’
perceptions of stormwater management. For example, one study used to help develop the T2R outreach

- 12 -
program was conducted in May 2008. Campbell Delong Resources Incorporated (CDRI) conducted focus
groups with renters, landlords and homeowners in the T2R Program area and found that T2R residents
generally had a fairly good level of environmental awareness and action and that “nearly everyone worries
about maintenance of stormwater facilities and the loss of parking.” An important recommendation from
this study was that the city continue to communicate with residents about the progress being made in
stormwater management and BES’ maintenance program and to continually connect this work to the
health of the river: a concept participants most strongly agreed with when provided the many benefits of
sustainable stormwater management.
The CDRI study provided a snapshot of residents’ perceptions towards stormwater management and
identified key messaging and communication tools for increasing citizen knowledge and participation over
the long-term. This information was critical in creating a successful program integrating the new green
infrastructure with stewardship activities. In the spring of 2009, collaboration between BES and Portland
State University’s Center for Urban Studies provided an opportunity to evaluate, over a two-year period,
resident knowledge of and participation in stormwater management in the T2R Program area. The
objectives of the collaboration were threefold: (1) evaluate the effectiveness of current outreach and
educational techniques used in the T2R Program; (2) measure residents’ perceptions of their
neighborhood’s current conditions (phase one of a two phase study); and (3) collect information on
residents’ preferences regarding stormwater management strategies and current participation in
stormwater management and watershed health improvement. The latter objective focused on types of
information residents desired and their willingness to implement strategies. The social determinants of
stormwater management (the social and demographic attributes that help explain an individual’s interest
in stormwater management) to help guide the city’s ongoing stormwater management efforts were also
assessed.
To address these objectives, researchers at Portland State University (PSU) and BES administered a survey
of households located in the T2R area of the city. The SE Portland Neighborhood Survey was conducted in
May 2009 and was successfully delivered to 2,192 households in the T2R Program area. The target area
included six designated neighborhood areas (also known as TGDs) within the T2R Program area and two
control areas, one north and one south of the study area. TGDs within the T2R Program area differed from
the control groups in the levels of outreach received, as determined by the schedule of green street
construction and related outreach. Specifics of the survey are provided in the Assessment Protocol section
of this report (Appendix A). In addition to the research objectives listed above, the purpose of the survey

- 13 -
was two-fold: (1) to create a baseline set of data, prior to construction of green infrastructure; and (2) to
compare responses to survey questions from households receiving city-sponsored material (specific TGDs)
with those households that did not receive city-sponsored material (Control Areas). The survey aimed to
provide information regarding residents’ preferences for information sources, perceptions about current
conditions in their neighborhoods and willingness to implement and steward green infrastructure on both
private and public properties. A second survey will be conducted after the installation of the first green
stormwater facilities in a series of green infrastructure projects and will provide information about
changes in neighborhood perceptions and the willingness to implement stormwater management practices
on private property and steward green infrastructure projects. Results of the first survey will help inform
BES on immediate opportunities to enhance existing outreach strategies, strengthen community
partnerships and provide a baseline for future research into the connections between green infrastructure
and livable neighborhoods; the second survey will be instrumental in identifying specific actions for
engaging residents in managing stormwater on and around their property, as well as showing impacts of
ongoing outreach in areas of new green infrastructure. The rest of this report describes results from the
first survey.
Assessment Protocol
SE Portland Neighborhood Survey Design
The survey instrument was designed to query residents of SE Portland living within the Tabor to the River
Program area. Residents within six current and upcoming project areas (TGDs), along with two control
areas (Figure 1), received a mailed survey containing 28 questions (see Appendix A) that was color coded
by project/control area. Using Geographic Information Systems (GIS) and publicly available demographic
information (U.S. Census, 2008), each of the TGDs and control areas were characterized for their
biophysical (e.g. canopied vegetation, grass, road network) and social conditions (e.g. education, income,
race). To ensure a representative sample within each TGD, boundaries of two TGDs (31 and 33) were
modified to ensure a homogeneous set of demographic conditions in study areas. Control areas were
selected based on representative demographic conditions.

- 14 -
Figure 1. Map of surveyed areas
The survey contained four sections gauging: (1) residents’ awareness of neighborhood stormwater
projects; (2) perceptions of neighborhood characteristics; (3) levels of civic involvement; and (4) interest
and involvement in stormwater management projects on private property and on shared streets. A fourth
optional section looked at general demographic characteristics of each respondent (Appendix A). The first
section asked respondents whether or not they were aware of city stormwater projects in their
neighborhood, as well as where they had heard about these stormwater projects, which source was most
informative and whether any information they received had affected their actions on their own property.
This section also asked respondents whether they had stormwater problems on their own property and
where they had looked for more information regarding managing stormwater on their property.
In the second section of the survey, respondents were asked to rate their neighborhood on a number of
amenities and services using Likert scales3. Specific amenities and services included neighborhood
attractiveness, safety, walkability, friendliness and overall health. Respondents were asked to rate how well
3 Likert scales ask respondents to rate statements on a numeric scale. For these statements, responses ranged from 1 = Poorly/Not at all to 6 = Very/Very Well.

- 15 -
their neighborhood provided parks and greenery, community centers and associations, parking, walking
and bicycling facilities, street cleaning services and public art. This section of the survey also gauged civic
and neighborhood involvement (i.e., social capital) by asking respondents how many neighbors they knew
by first name and how often or whether they had been involved with specific activities, such as
neighborhood meetings and volunteering. Other questions focused on self efficacy, including two open
ended questions asking in what ways respondents felt they could have a positive impact on their
neighborhood and what prevented them from making a positive impact.
The third section of the survey addressed stormwater management interest and practices. Respondents
were asked how likely they were to or whether they already utilized individual stormwater management
techniques on their own property. Participants were asked how much time they would be willing to spend
maintaining vegetation on their street. An additional series of questions was presented to identify
conditions that would be helpful in installing stormwater strategies, resources that would encourage
respondents to get more involved with stormwater management and stormwater topics about which
respondents would like to learn more. Finally, respondents were asked to rate their agreement with first-
person statements that were intended to gauge further interest in stormwater management on private
property and in the neighborhood (Table 1).
Table 1. Agreement statements included in survey
The last section of the survey asked a series of optional demographic questions. Demographic questions
included age range, tenure (rent vs. own), highest level of education, household income, housing type and
length of time in current residence. Included in the final portion of the survey was an opportunity for
respondents to provide permission for future follow-up and share additional comments with the
researchers.
Please tell us how you feel about the following statements (1 = Strongly disagree, 6 = strongly agree, NA = not applicable):
I would take a course on managing stormwater
I am interested in learning more about caring for my trees
I would like more vegetation on my street
I would be willing to help maintain a stormwater facility
I am aware of city projects before they happen in my neighborhood
The city makes an effort to let me know the need for a project
I want to help with stormwater projects in my neighborhood
I am interested in having more neighborhood events and activities

- 16 -
Sampling
In addition to the six TGD project areas, two control areas were selected to receive the survey. These
control areas were selected to represent a range of demographic factors present in the TGD areas including,
the proportion of single family residential households, the proportion of owners and average median
income (Table 2).
Table 2. Basic characteristics of project and control areas
TGD % SFR % Owners Median Income
9 53.4% 49.0% $43,145
15 81.6% 55.8% $42,044
20 92.2% 61.5% $40,219
24 88.2% 70.3% $45,000
31 95.2% 69.2% $50,909
33 97.9% 71.7% $50,125
TGD Average 84.8% 62.9% $45,240
Control 1 73.8% 59.2% $46,033
Control 2 96.5% 68.1% $46,667
All Study Areas Average
84.9% 63.10% $45,518
Analysis of Survey
To evaluate the effectiveness of outreach efforts, responses from households located in the TGDs were
assessed in comparison with those located in the control groups. Standard statistical tests of significance of
means (ANOVA and t-tests) were conducted along with visual evaluations of scatter-plots. Means across
TGDs and control groups were compared and scatter plots were created to compare subjective measures of
neighborhood conditions to objective measures (e.g. bicycling and walking facilities). In addition, a ‘social
capital’ metric was developed by summing responses to questions in Section B and an ‘interest in
stormwater management’ metric by summing all the responses in Section C. The single numeric measures
for social capital and interest in stormwater management allowed for Pearson’s correlation and ordinary
least squares regression to understand whether social capital and demographics were associated with
interest in and likeliness to implement stormwater management. The aim of these analyses was to elicit an
understanding of the factors that best described the likelihood of a household to implement projects on
their own property and/or to steward a sustainable stormwater facility. For Likert questions, answers

- 17 -
were averaged and aggregated for purposes of analysis, although the original data of individual scalar
responses was retained. Statistical Package for Social Sciences, Inc. (SPSS 15.0 Inc) was used to conduct
correlation and multivariate regression analysis where social capital measures and preference factors were
independent variables and scalar responses to specific questions were the dependent variables.
The quantitative survey responses were supplemented by qualitative, open-ended questions. The
responses to these questions were analyzed by content (grounded theory approach). An iterative two-step
process enabled researchers to reduce various textual responses into descriptive categories. First, text was
entered into a spreadsheet and responses were identified by TGD and coded according to specific
categories. The second step involved the use of an online tool called Wordle that allowed for a visual
representation of the frequency of specific words used in response to specific questions. The qualitative
analysis provided a second step that aimed to corroborate findings from the quantitative analysis.
Survey Results
Of the 2,579 surveys mailed, a total of 387 were undeliverable by the post office due to faulty addresses,
vacant housing, or other reasons. Accordingly, a total of 2,192 were successfully mailed to residents in the
T2R Program area and control areas, resulting in a 27% (583) response rate. Not every respondent
answered every survey question, and as a result the total number of responses varies from question to
question. Survey responses varied by TGD and control groups (Table 3), with response rates as low as 20%
(Control Group 2), and as high as 69% (Control Group 1). Almost all respondents provided qualitative
responses, which made for a rich set of data for analysis.
Table 3. Survey response arranged by TGD (SFR is for Single Family Residential)
TGD SRF Count Surveys
Returned
Response
Rate
9 126 25 25%
15 577 131 21%
20 345 63 24%
24 299 80 21%
31 180 50 51%
33 138 34 29%
Control 1 245 159 69%
Control 2 305 41 20%
Total / Average 2215 583 27%

- 18 -
Descriptive Analysis
This section describes the survey results by first examining the responses to open-ended questions. While
the survey contained several opportunities to provide qualitative responses to questions, the primary
responses came from five questions:
(1) Did the information you received about these stormwater projects affect what you do on your
own property?
(2) Do you have stormwater problems on your property?
(3) In what ways can you have a positive impact on your neighborhood?
(4) What keeps you from making a positive impact on your neighborhood?
(5) Please share any additional comments you have with us.
Responses to these questions were first examined using Wordle (www.wordle.com), an online application
that creates a ‘word cloud’ representing the frequency of individual words. Size indicates frequency, with
larger font words being used more frequently and smaller font words less frequently (colors and font types
are arbitrary and are only meant to distinguish among the different words). Below are the results to
individual questions.
Figure 2. Word cloud responses to the question, “Did the information you received about these stormwater projects
affect what you do on your own property?” (n = 256)
In assessing the responses to this question, many households had used the downspout disconnect program,
and the ‘word cloud’ results suggest a similar trend. Although less frequently mentioned, others had
planted trees and shrubs and installed rain gardens and drainage facilities on their own property.

- 19 -
Figure 3. Word cloud responses to the question, “Do you have stormwater problems on your property?” (answered
affirmative and described problem, n = 76)
Although fewer descriptive responses were received for this question, the general sentiment was that
households with stormwater problems on their property had challenges with water in their basements.
The location of these responses varied across TGDs with no systematic patterns regarding the TGDs and
presence of water in basements.
Figure 4. Word cloud response to question: “In what ways can you have a positive impact on your neighborhood?”
(n = 497)
Responses to this question varied, but several thematic areas were identified, including interaction with
neighbors, maintaining property or yard, being friendly and being considerate in and watchful of activities
in the neighborhood.

- 20 -
Figure 5. Word cloud responses to question, “What keeps you from making a positive impact on your neighborhood?”
(n = 499)
Responses to this question suggest that time is the primary barrier to having a positive impact on the
neighborhood. Other responses, although less frequently mentioned, suggested that work, family and
generally being busy are other barriers. Another group indicated that nothing was keeping them from
having an impact. Finally, the survey instrument contained an area where respondents could provide open
ended comments (Figure 6).
Figure 6. Word cloud responses to the phrase, “please share any additional comments you have with us” (n = 324)
While this type of response may be challenging to decipher, in terms of frequency of words used, a few
dominant words were mentioned including; neighborhood, street and city. Other frequently used words
include: traffic, trees, stormwater, work, people, water, management, property and time. Analyses of all

- 21 -
these comments suggest consistent enthusiasm and commitment to managing stormwater, and some
suggestions for specific activities that could help their neighborhood (e.g. trees, information, management,
etc.).
The above frequency descriptions using a word cloud system was complemented using additional
qualitative analysis. Specifically, in response to the question, “In what ways can you have a positive impact
on your neighborhood?” responses were coded into general thematic categories, each of which reflected
the manner through which individuals contribute to the neighborhood. A total of six specific responses
were created (with a 7th “other” response). In some instances, respondents were placed in multiple
thematic categories; for example, respondent #24 answered, “present a pleasant yard, greet people, watch
for and report crime, be an advocate,” and as a result was placed in categories 2 (present a pleasant yard =
individual place), 3 (greet people, watch for and report crime = collective people), and 6 (be an advocate =
civic statements or actions) (Table 4).
Table 4. Sample responses to question: “In what ways can you have a positive impact on your neighborhood?”
Category of Response Example of Statements
individual people be friendly, know neighbors, share resources (tools, food, information, transportation) to individuals, offers of support and help to individuals
individual place maintain property, plant trees and other vegetation
collective people neighborhood association, meetings, block parties, volunteer
shared place plant sidewalk trees, care of sidewalk and streets, neighborhood clean up, observance and willingness to report crime, traffic safety
people and place economic choices (buy local, money is a barrier), environmental choices (water consumption, gardening inputs, recycling) and the intersection of both environment and economics (transportation)
civic statements or actions
be a good neighbor, be a good citizen, set a good example, creating/building community or vote, advocate, pay taxes, support schools and other services
other uncategorized
When responses were categorized there were a total of 291 individual people responses (24%), 327
individual property responses (28%), 169 collective people responses (14%), 184 shared place responses
(15%), 112 people and place responses (9%), 99 civic statements and action responses (8%) and 23 other
responses (2%).

- 22 -
These responses were used to categorize involvement type. Many respondents had a mix of both
individualistic and collective responses but the proportions varied across study areas. In general the
control areas had a larger percent of respondents than the TGD areas for the open-ended questions. This
may indicate that the control area residents are already engaged in activities on their private property or
with immediate neighbors. The responses to this question T2R Program area varied between TGDs (chart
1).
Chart 1. Types of involvement by study area
When thematically organized, the two most frequently mentioned responses included individual people
and individual place, suggesting that people made a positive impact to their neighborhood by being
involved in the neighborhood and taking care of their property. The next most frequent responses were
collective people and shared place that consisted of helping neighbors and contributing to the local
community. While these responses indicate interest in community involvement and environmental
stewardship, the researchers assessed the potential for their involvement in stormwater management
specifically.
The responses to the question, “What keeps you from having a positive impact on your neighborhood?”
varied and also were thematically categorized (Table 5). Categories of responses were created based on
content of response and the histogram of responses. The histogram of ‘word cloud’ results for responses to
this question indicated several barriers to ‘making a positive impact’ on the neighborhood: time, family and
money were common themes. Responses identifying more than one barrier were separated into individual
thematic categories. Individual responses were analyzed and placed into a total of eight possible thematic
categories: time, money, people, civic or city-oriented, information or other resources needed, internal,
uncertainty or no barriers identified, place and other.
0%
10%
20%
30%
40%
Control 1
Control 2
TGD 9 TGD 15 TGD 20 TGD 24 TGD 31 TGD 33 Pe
rce
nt
wit
hin
stu
dy
are
a
Most Individualistic
Somewhat Individualistic
Mixed Responses
Somewhat Collective
Most Collective

- 23 -
Table 5. Sample of responses for question: “What keeps you from having a positive impact on your neighborhood?”
Category of Response Example of Statements
time lack of, other responsibilities, i.e. work or family
money lack of, costs too much
people lack of interest from others, organizations, neighbors
civic/city obstacles related to city procedures and regulation
information or resource needed need for information or other resources
internal (ability/energy and interest) lack of interest, physical capabilities
none identified NA, "nothing", "best neighborhood ever"
place lack of facilities in neighborhood, traffic safety, rental properties
other uncategorized
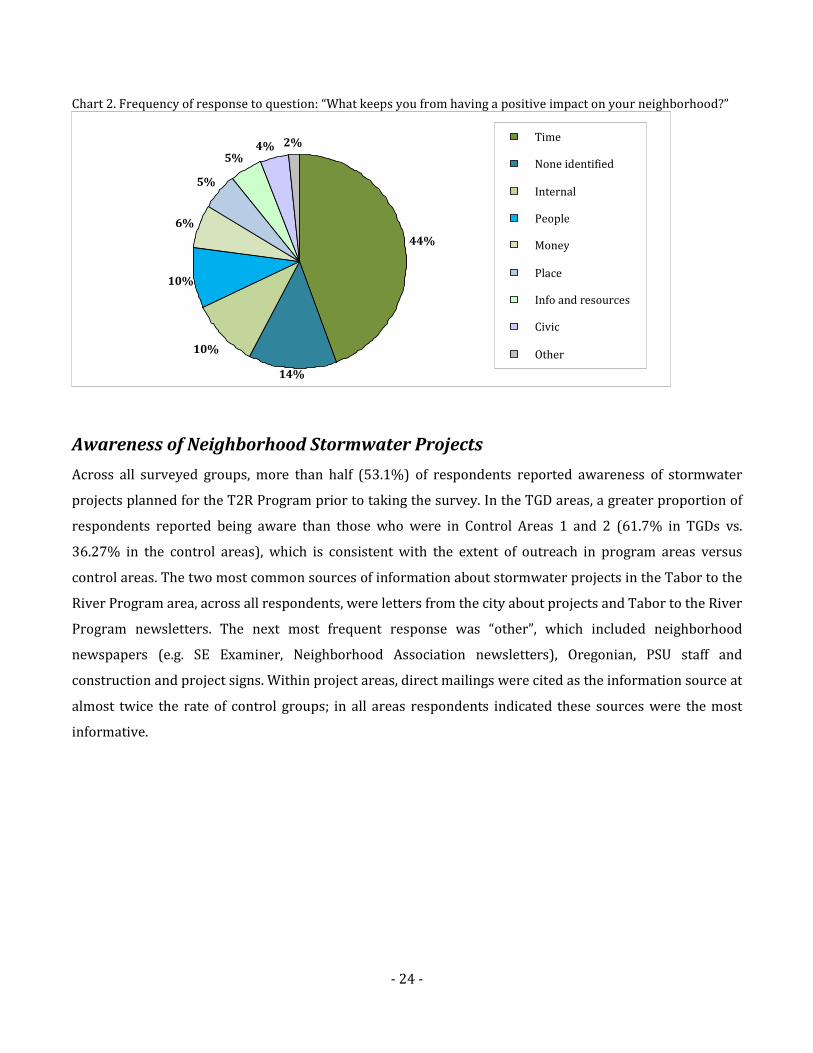
A closer look at the responses indicated that there are both very active and engaged neighbors already
concerned about their impact as well as residents who have internal barriers (Chart 2). Respondents self-
identified time as the greatest barrier to impact (44%). A smaller number of respondents indicated no
barriers (14%); examples of responses from these respondents included “best neighborhood ever,”
“nothing- I’m doing it,” and the simple “n/a.” Internal barriers (10%) related to a variety of factors;
frequently, responses were regarding a lack of interest or motivation, or doubts of competency or ability,
especially physical. The next frequently mentioned external barriers included people, neighborhood
organizations or groups and individual neighbors (10%) and money (6%). The least frequently mentioned
barriers were information and other resources (5%), place – often referring to lack of facilities or rental
properties - although weather (5%), civic (4%) and other (2%) conditions were also identified. The
interpretation of these results suggests a general willingness to participate in neighborhood activities and
the next sections will describe additional details about the types of activities (and the conditions) that
respondents are least and most likely to consider.
- 24 -
Chart 2. Frequency of response to question: “What keeps you from having a positive impact on your neighborhood?”
Awareness of Neighborhood Stormwater Projects
Across all surveyed groups, more than half (53.1%) of respondents reported awareness of stormwater
projects planned for the T2R Program prior to taking the survey. In the TGD areas, a greater proportion of
respondents reported being aware than those who were in Control Areas 1 and 2 (61.7% in TGDs vs.
36.27% in the control areas), which is consistent with the extent of outreach in program areas versus
control areas. The two most common sources of information about stormwater projects in the Tabor to the
River Program area, across all respondents, were letters from the city about projects and Tabor to the River
Program newsletters. The next most frequent response was “other”, which included neighborhood
newspapers (e.g. SE Examiner, Neighborhood Association newsletters), Oregonian, PSU staff and
construction and project signs. Within project areas, direct mailings were cited as the information source at
almost twice the rate of control groups; in all areas respondents indicated these sources were the most
informative.
44%
10%
10%
6%
5%
5% 4% 2%
14%
Time
None identified
Internal
People
Money
Place
Info and resources
Civic
Other

- 25 -
Table 6. Cited sources of information on the Tabor to the River Program (boxes contain number of responses)
T2R Program Areas Control Information Source
9 15 20 24 31 33 1 2
Grand Total
Percent (of total
responses)
Letter from BES 9 38 24 66 36 9 32 3 217 34.44%
Tabor to the River newsletter
11 27 26 27 21 10 42 1 165 26.19%
Other communication 1 19 10 16 5 6 23 1 81 12.86%
Friends, family, neighbors
4 7 7 16 8 3 11 1 57 9.05%
Community group or neighborhood associations
2 12 5 4 6 6 8 0 43 6.83%
Internet 1 6 3 8 2 0 4 1 25 3.97%
Community meeting or workshop
1 5 2 2 7 1 2 0 20 3.17%
Tabor to the River table at event
1 5 1 3 2 0 0 0 12 1.90%
Tour by bike, boat or walking
0 2 0 5 0 0 0 0 7 1.11%
Survey, other than this one
0 0 2 0 0 0 1 0 3 0.48%
Friends, family, neighbors, community groups and neighborhood associations also were frequent
responses regarding Tabor to the River information sources. The least common sources of information
were the internet, community meetings, Tabor to the River tables (at local events), local tours and other
general surveys. Most respondents (62.1%) reported that the information they had received about
stormwater projects did not affect what they did on their own property (though information received was
primarily on right-of-way stormwater project construction coming to their street). This proportion
remained relatively constant across TGDs and the control areas.

- 26 -
Table 7. Stormwater management information sources
Information Source Total Number of Responses City-sponsored mailings 204 (19.2%)
Internet 181 (17.28%)
I don't look for information [on this topic] 174 (16.37%)
Friends, family, neighbors 152 (14.3%)
Neighborhood newspapers 132 (12.42%)
Technical experts 84 (7.9%)
Regional newspapers 63 (5.93%)
Other 42 (3.95%)
Television 31 (2.91%)
n = 1063^ ^Some respondents indicated multiple sources
While most respondents (61.8%) reported not having stormwater problems on their property, there was
significant variation across the TGDs and control areas. Within the T2R Program areas, those reporting
stormwater problems varied between 55% and 23.53%, contrasted with only 10.3% of respondents in
Control Area 2 reporting stormwater problems. When respondents were asked about sources of
stormwater management information in general, about 1/3 stated they utilized city-sponsored mailings,
about 1/3 utilized the internet and almost 30% stated they simply did not look for this kind of information
at all. While a significant number of respondents indicated that the information about the T2R Program did
not affect their actions on their own property, among the residents who indicated that they had stormwater
problems on their property (24.22% of the total), the amount who stated using the information increased
to 39.82%.
Neighborhood Perceptions
The perceptions of neighborhood characteristics showed significant variation between the TGDs and the
control areas. Responses to neighborhood characteristics ranged on a scale of 1 to 6, where 1 = not at all
and 6 = very well. Overall, perceptions of neighborhoods characteristics were favorable, consisting of
average individual responses: walkable (μ = 5.39), friendly/social (μ = 4.92), attractive (μ = 4.85),
family/child friendly (μ = 4.73), safe from crime (μ = 4.59), healthy (μ = 4.58) and traffic (μ = 4.01), with an
average rating of 4.72 across all characteristics. Respondents from the TGDs rated their neighborhoods, on
average, higher on each characteristic than the respondents from the control areas. The control area
averages were brought down by the responses for Control Area 2, which scored lower than Control Area 1
(μ = 3.75 and μ = 4.61, respectively).

- 27 -
Chart 3. Perceptions of neighborhood characteristics: To what extent do you believe your neighborhood is…?
Perceptions of neighborhood provisions were relatively lower compared to perceptions of neighborhood
characteristics. Overall survey respondents rated the following neighborhood provisions positively:
walking facilities (μ = 4.95), greenery/trees (μ = 4.79), parks and open spaces (μ = 4.61), biking facilities (μ
= 4.28), parking (μ = 4.19) and neighborhood associations (μ = 4.08). Respondents rated street cleaning
services (μ = 3.54), community centers (μ = 2.80) and public art (μ = 2.66) at lower means. The average
neighborhood rating across all provisions for the entire sample was 3.99. For nearly every provision,
respondents from the TGDs rated their neighborhoods higher than the respondents from the control areas.
The exceptions are community centers and parks and open spaces, where control area respondents rated
their neighborhoods slightly higher than study TGD respondents. Control Area 2 respondents once again
consistently gave their neighborhood lower ratings than Control Area 1 respondents.
This survey provided the baseline for neighborhood perceptions. Residents generally believed their
neighborhoods were walkable, friendly, social, and attractive places. The post-construction second survey
will again assess neighborhood perceptions to note any changes that may have occurred due to
construction, maintenance and operation of new green stormwater facilities.
Stormwater Management Techniques and Strategies: Current Understanding
The most common stormwater management strategy already being implemented was planting or
preserving trees, followed by downspout disconnection, naturescaping and removal of lawn. Some of the
strategies were relatively unknown, especially infiltration and flow through planters, followed by
bioswales, drywells, soakage trenches and rain gardens. When all of the strategies were considered in
0 1 2 3 4 5 6
Walkable
Friendly/Social
Attractive
Family/Child friendly
Safe (with respect to crime)
Healthy
Safe (with respect to traffic)
Average of all characteristics
Scale of 1 to 6, where 1 = not at all and 6 = very
Average of Control Areas
Average of Study TGDs

- 28 -
aggregate, residents were more likely to understand and implement certain strategies than others, such as:
planting and preserving trees, disconnection of downspouts, naturescaping, removal of lawn, rain barrels
and porous pavers.
Chart 4. Measuring likeliness to implement stormwater strategies on individual property
Average responses regarding knowledge of each technique were similar between the TGDs and the control
areas; however, respondents from the TGDs were more likely to implement many of the stormwater
management techniques on their property. Although each of these strategies has a different distribution
(from not likely to very likely to be implemented), each technique and the overall level of reported
familiarity will be described below. For additional information about one of these techniques, please
contact the authors.
Planting or Preserving Trees for Stormwater Management
A majority of respondents reported either already using trees for stormwater (44.3%) or being very likely
to use trees in the future (25.7%).
Disconnecting Downspouts
A majority of respondents (57.9%) reported that they currently had disconnected downspouts. The
remaining responses were spread across the rankings of likeliness with 11.3% reporting that they were not
likely to disconnect downspouts and 9.1% reporting that they were very likely to do so.
1.231.55
2.022.18
2.923.04
3.043.78
4.174.27
5.125.41
5.74
0 1 2 3 4 5 6 7
Infiltration planterFlow-through planter
Ecoroof (green roof)Bioswale
Rain gardenDrywell or soaking
Removal of paved areas Porous pavers
Rain barrels Removal of lawn
Naturescaping Downspout disconnect
Trees (plant or preserve)
Scale of 0 to 7, where 0 = no knowledge of strategy and 7 = already using strategy

- 29 -
Naturescaping
Nearly a third (30.6%) of respondents reported already naturescaping and 20.5% of the respondents
reported being very likely to naturescape. Four percent of respondents said they were unfamiliar with
naturescaping.
Removal of Lawn
Most respondents (28.4%) reported already removing lawn from their own property. On the other hand,
20.1% reported not being likely to de-lawn. The remaining responses were spread fairly evenly across
other options, except for a small proportion not knowing about lawn removal (0.5%).
Rain Barrels
Responses for the likeliness of using rain barrels were spread fairly evenly across possible responses, with
several respondents (20.4%) reporting that they were very likely to use rain barrels.
Use of Porous Pavement or Pavers
Responses for the likeliness of using porous pavement or pavers were spread fairly evenly across possible
response options with the most respondents (16.8%) reporting that they were not likely implement the
strategy. Those already using porous pavers made up 14.8% of respondents, and those saying that they did
not know what porous pavers were made up 8.9%.
Removal of Pavement
Most respondents (36.6%) reported not being likely to depave on their own property. On the other hand,
11.2% reported already having removed pavement. The remaining responses were spread fairly evenly
across other options, except for not knowing what depaving was, which received only 1.3% of responses.
Drywells and Soaking Trenches
Nearly a third (29.8%) of respondents answering the question reported a lack of familiarity with drywells.
On the other hand, 7.9% reported already using drywells and 11.1% said they were very likely to
implement drywells and soaking trenches. Those who said they were not likely to implement the strategy
made up 15.9% of the respondents.
- 30 -
Rain Gardens
Responses for the likeliness of using rain gardens were spread fairly evenly across possible responses, with
the most respondents (23.8%) reporting an unfamiliarity with rain gardens.
Bioswales
Thirty-three percent of respondents reported not knowing about bioswales. Based on the remaining
responses, respondents did not appear likely to implement bioswales on their own property. Those already
using bioswales made up 3.9% of those who answered this question.
Ecoroofs
A large percentage of respondents (47.2%) reported not being likely to implement ecoroofs on their
property. Very few reported being very likely to implement or were already using ecoroofs (4.0% and 0.7%
respectively).
Flow-through Planters
A majority of respondents (54.5%) reported not knowing about flow-through planters. About 4% reported
already using flow-through planters, while 13.4% (the second largest group) reported not being likely to do
so.
Infiltration Planters
A majority of respondents (60.3%) answering the question reported not knowing what infiltration planters
were. Only 1.3% reported already using infiltration planters, while 12.9% (the second largest group)
reported being not likely to do so.
Social Determinants of Stormwater Management
This section attempts to address the question: which people are more likely to engage in stormwater
management? Researchers address this question by examining the relationship among responses to several
questions within different sections of the survey. The survey results suggest that those who favorably rated
their neighborhoods (higher means on neighborhood characteristics and provisions) were more likely to
get involved with stormwater management on their private property. For example, positive ratings of
neighborhood biking and walking facilities, neighborhood associations, greenery or trees and parking were
positively correlated with measures of interest in stormwater management (Pearsons r=0.65).

- 31 -
Furthermore, positive ratings of neighborhood friendliness, walkability, attractiveness and safety from
crime and traffic were positively correlated with measures of interest in stormwater management. These
results suggest that a stormwater management strategy utilizing green infrastructure likely will be
supported in areas where neighborhood perceptions are favorable.
To further assess the social determinants of stormwater management, researchers examined the
relationship between demographic variables (optional survey section) and willingness to help maintain a
stormwater facility (Section C). Several questions in the survey asked respondents to rate the degree to
which they agreed with particular statements. These responses were included in a series of regression
models to evaluate the extent to which each demographic factor helped to explain respondent interest in
stormwater management. The statement of interest for the regression models (dependent variable) was “I
would be willing to help maintain a stormwater facility.” Four series of regression models were developed
to assess the relationship between sociodemographics and stormwater management. While regression
models were developed for the whole sample set, models for each study area were also developed. Two
regression models enabled a comparison of the TGDs with control areas. Another set of regression models
helped to compare two income groups, those with household incomes of less than $75,000 and those with
household incomes greater than or equal to $75,000 in 2008. Finally, another set of regression models
were developed to compare those who reported being aware of stormwater projects prior to the survey
and those who said they were not aware.
Several demographics were associated to the likelihood of managing stormwater on private property.
Income and education were positively correlated with measures of interest in stormwater management.
When looking at the two income groups, other demographics and neighborhood perceptions explained the
greatest variation in residents’ willingness to help maintain a stormwater facility. For example,
respondents with higher levels of education – regardless of income – were positively and significantly
correlated to interest in stormwater management. These results suggest that self-reported education status
was more important than income in predicting interest in stormwater management. In addition, younger
respondents and those who rated neighborhood parks and green space as less present in their
neighborhood were more likely to help in maintaining stormwater facilities. Results also suggest that
higher income residents are more likely to help maintain stormwater facilities if they already are involved
in environmental or community projects and if they have frequent conversations with neighbors.

- 32 -
In examining other analysis of the social determinants of stewardship the likelihood to help maintain
stormwater facilities were compared across the TGDs and control areas. For residents living in TGDs the
social factors that were positively correlated to maintaining stormwater facilities included: level of
education, involvement in environmental projects and kids groups, and the rating of neighborhood
associations. Among those living in control areas or those who reported limited awareness of the T2R
Program, only one factor was positively correlated to maintaining stormwater facilities; the frequency of
sharing things with neighbors.
Age and years of residence in current home were demographics negatively correlated with the likelihood of
managing stormwater on private property. In both TGDs, and control areas, those with greater involvement
in religious organizations and lower ratings on neighborhood parks were less inclined to help maintain
stormwater facilities, regardless of income. Factors that detracted from maintaining stormwater facilities
included: years living in the residence and rating of community centers. This suggests that people who
recently moved into the TGD areas or feel more served by community centers might be more likely to help
in maintaining stormwater facilities.
Stormwater Management Techniques and Strategies: Supporting Implementation
Supporting implementation of stormwater management on private property will reduce the overall load on
the stormwater system and improve watershed health. Assessing the extent to which specific techniques
will improve the likelihood of resident involvement in managing neighborhood stormwater can be one way
to expand and sustain maintenance of new and old facilities. The results of the survey suggest several
factors that are instrumental to supporting the implementation and long-term maintenance of stormwater
facilities. Although currently unable to identify the specific reasons for these factors, researchers are able
to discern the types of strategies that would help respondents to participate in a maintenance program.
When asked what would encourage respondents to get more involved with stormwater management in
their neighborhood and on their property, the greatest percentage (21.4%) of the responses chosen were
being provided a how-to guide or in-person instruction. Other common responses included having the city
install a green street in their neighborhood (16.8%), seeing neighbors take similar actions (16.5%),
rotating responsibility (12.4%), better understanding of benefits (11.9%) and being able to choose the
plants in city-owned facilities (8.5%). Respondents also cited financial and technical assistance as the most
helpful potential resources for installing stormwater management strategies, with 27.8% and 26.9% of the
responses respectively. The remaining involvement strategies were ranked in order of importance: more
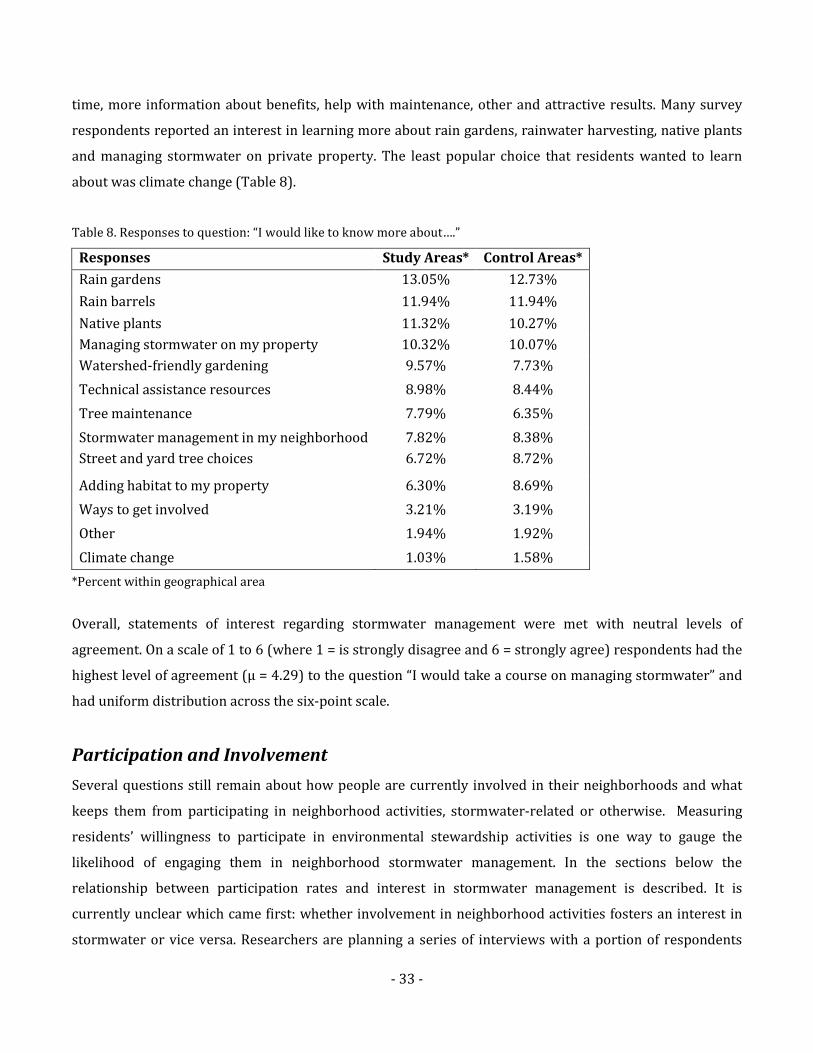
- 33 -
time, more information about benefits, help with maintenance, other and attractive results. Many survey
respondents reported an interest in learning more about rain gardens, rainwater harvesting, native plants
and managing stormwater on private property. The least popular choice that residents wanted to learn
about was climate change (Table 8).
Table 8. Responses to question: “I would like to know more about….”
*Percent within geographical area
Overall, statements of interest regarding stormwater management were met with neutral levels of
agreement. On a scale of 1 to 6 (where 1 = is strongly disagree and 6 = strongly agree) respondents had the
highest level of agreement (μ = 4.29) to the question “I would take a course on managing stormwater” and
had uniform distribution across the six-point scale.
Participation and Involvement
Several questions still remain about how people are currently involved in their neighborhoods and what
keeps them from participating in neighborhood activities, stormwater-related or otherwise. Measuring
residents’ willingness to participate in environmental stewardship activities is one way to gauge the
likelihood of engaging them in neighborhood stormwater management. In the sections below the
relationship between participation rates and interest in stormwater management is described. It is
currently unclear which came first: whether involvement in neighborhood activities fosters an interest in
stormwater or vice versa. Researchers are planning a series of interviews with a portion of respondents
Responses Study Areas* Control Areas*
Rain gardens 13.05% 12.73%
Rain barrels 11.94% 11.94%
Native plants 11.32% 10.27%
Managing stormwater on my property 10.32% 10.07%
Watershed-friendly gardening 9.57% 7.73%
Technical assistance resources 8.98% 8.44%
Tree maintenance 7.79% 6.35%
Stormwater management in my neighborhood 7.82% 8.38%
Street and yard tree choices 6.72% 8.72%
Adding habitat to my property 6.30% 8.69%
Ways to get involved 3.21% 3.19%
Other 1.94% 1.92%
Climate change 1.03% 1.58%

- 34 -
who provided permission to be contacted for follow-up information to further explore this topic. This will
strengthen the understanding of the relationship between neighborhood involvement and opportunities
for stormwater management.
Respondent Participation in Neighborhood Involvement
Social capital is difficult to measure. Proxy questions in the
survey that indicated social capital were: familiarity with their
neighbors, caring about neighborhood, ability to make a positive
impact in their neighborhood and frequency of involvement
with local organizations (within the neighborhood, city, region,
or national). When asked how many neighbors on the block they
knew by first name, the majority of respondents, 62.41%, indicated they knew few or most neighbors4,
while 27.45% indicated they knew all their neighbors by first name. The remainder (13.11%) knew two or
less. The majority believed that their neighbors cared about the neighborhood; only six respondents
answered that they had no opinion. The majority of residents who responded to this question indicated
that they believed their actions had a significant impact on the neighborhood.
More interesting was the correlation between the calculation of social capital and respondent interest in
stormwater management. A social capital score (SCS) consisting of all the questions related to civic
engagement and responses to several questions related to stormwater management was developed. When
analyzing the relationship between these two groups, researchers found a strong and significant
correlation between SCS and several measures of stormwater management, including willingness to
implement stormwater management strategies on private property, take a course on stormwater
management, higher expressed interest in maintaining vegetation in the neighborhood and willingness to
help with neighborhood stormwater projects. While these results are correlations, the results do suggest
that respondents who are more involved in neighborhood activities - even if only walking and knowing
their neighbors names - have a higher likelihood of participating in local stormwater management
activities.
4 Most was not a choice given in the text of the survey, however many respondents added a box or indicated in some way that their response was most, rather than a few neighbors. “Most” responses were entered as few, unless the respondent had checked the all box, then response was entered as all.
Results suggest that respondents
who are more involved in
neighborhood activities - even if
only walking and knowing
neighbors names - have a higher
likelihood of participating in local
stormwater management activities.

- 35 -
Civic Involvement
Across all TGDs the survey results suggest that those who are more civically engaged are more likely to get
involved with stormwater management on their private property or in their neighborhood. Civic
involvement was defined as both formal and informal actions, therefore there was some overlap with
measures of social involvement. When looking at significant correlations with measures of likeliness of
maintaining stormwater on private property and in the neighborhood, the most frequently occurring civic
involvement measures are an interest in having more neighborhood events or activities, the number of
neighbors known by first name, frequency of working on community projects, frequency of attending
neighborhood or town meetings and frequency of volunteering. For those already using stormwater
management strategies on their property, the survey results suggest that these residents are more likely to
have conversations with neighbors (r = 0.112, p-value <0.001) and volunteer more often (r = 0.114, p-value
<0.001) than the overall population.
When asked how much time they would be willing to spend maintaining vegetation on their street, the
majority of respondents (51%) chose 1-3 hours per month, while 10.8% said they would not spend any
time maintaining vegetation on their street. The distribution of responses was fairly similar when looking
at all of the TGDs or control areas. Responses differed, however, for each individual TGD and control area. A
greater percentage of respondents in TGD 31 (20.8%) said they would not be willing to spend any time
maintaining vegetation. However, in TGD 9, 72.0% reported that they would be willing to maintain
vegetation for 1-3 hours per month and the other 28.0% reported that they would be willing to spend 1-3
hours every few months. TGDs 20 and 33 had similar distributions, with the other TGDs and control areas
more closely resembled the overall distribution.
Considerations for Future Actions
This survey seeks to expand current knowledge of how residents receive and use information about
stormwater management. It is a description of how things are, rather than why they are, and as such can
highlight where residential interests and motivations exist. Identifying the topics of greatest interest
regarding stormwater management and likeness of residents to implement stormwater strategies may
inform decisions about outreach focus and effectiveness. The results suggest a number of key findings that
may guide future program management decisions. Given the long-term nature of the T2R Program the aim
of this report is not necessarily to provide a prescription for better engaging citizens.

- 36 -
Residents who responded to the survey seem to be well informed of current stormwater projects by the
City of Portland and in general, in the T2R Program area, to have favorable perceptions of their
neighborhoods. While the level of knowledge and interest in stormwater management varies, there
appears to be a significant group of residents who are already taking actions on their individual property
and are involved either in their neighborhood or in the wider community. Those who reported being aware
of upcoming stormwater projects in their neighborhood have more nuanced social determinants of interest
than those who were not aware, including a number of variables describing demographics, neighborhood
perceptions, and civic involvement.
Although a majority of the respondents were familiar with the current T2R Program from mailings,
neighborhood newspapers, social connections (both formal and informal) and the internet, a significant
number do not seek out stormwater management knowledge. However a number of respondents included
comments suggesting interest in “straight info about cost/benefits” and “info on environmental benefits to
educate/guilt husband” to the question “What would encourage you to get more involved with stormwater
management in your neighborhood or on your property?” The survey results show an interest in certain
stormwater strategies and highlights information gaps among respondents. Continuing to provide
residents with information on the environmental and financial benefits can help motivate individual and
community actions to manage stormwater. Currently residents are implementing strategies that are easily
understood and not technically difficult (i.e. downspout disconnection and vegetation plantings).
The survey results revealed variability throughout the program areas and within TGDs. Researchers infer
that there is no one typical SE Portland resident that BES can appeal to, and as a result, a one-size-fits-all
outreach model would be ineffective. For example, those residents expressing greater individualistic
interests might benefit from hands-on training on their own property, while others who indicated a
community involvement interest may be motivated to attend a stormwater management class. Reducing
costs and finding innovative financial incentives could increase implementation. Keeping time
commitments down might offer a possibility to increase stewardship activities. Engaging with existing
Survey Respondent: [I have a positive impact on my neighborhood by] attending the
annual block party, being an active participate on our block, hanging out in
summer evenings w/ neighbors, keeping our property pesticide free, taking care of
our stormwater on site, unclogging street drains.
Survey Respondent: [I now have an] increased awareness of watershed issues as I
develop a new landscape plan for my property.

- 37 -
groups or facilitating the formation of neighborhood stewardship groups may help recruit some
participants. Overall, supportive strategies that appeal most to respondents are financial incentives,
technical assistance, outreach through classes and hands on training, reducing costs and keeping time
commitments down; using these strategies can overcome obstacles to resident involvement. Continuing to
utilize a variety of outreach tactics will reach the greatest amount of people.
Stormwater management is a complex field. As a result, communicating the science and techniques of
management to residents requires considerable attention. The first step may be developing language that
relies less on the technical dimensions and more on colloquial language, which may contribute to
conceptual understanding of strategies. Stormwater management strategies can consider, for example, an
emphasis on easily accessible language that is both relevant to everyday actions and to regional resource
management efforts.
In addition, encouraging stormwater management as an innovative and attractive way to transform urban
areas into healthier, greener and livable places is an idea that has considerable traction with the general
public and city managers. Stormwater management can be one means for building a storyline that has
broad appeal and enabling citizens to participate in the making of convivial and ecologically healthy
neighborhoods.
The Tabor to the River Program is a long term investment in green infrastructure; potential returns on the
investment include lower infrastructure/construction costs, increased knowledge, and greener
neighborhoods with more engaged residents. After the installation of the green stormwater infrastructure
is complete, further research will be conducted to measure awareness and knowledge of stormwater
management strategies and benefits. As the Bureau of Environmental Services continues work in the T2R
Program area, there will be ample opportunities to engage residents, share information and increase
Survey Respondent: Now [I] know there are solutions [to mitigating stormwater].
[I] Need expert & detailed advice.
Survey Respondent: I think more information from the city making the connection
between stormwater management and its impact on health, ecology, and civic
engagement would help [encourage residents to maintain stormwater facilities]. By
this I mean to really enrich that dialogue, make it engaging, and well, fun. On first
read, information regarding "storm water management" feels dry, and a little
tedious. The cause is not. Maybe include something else in the name, so that
"management" does not set the tone.

- 38 -
knowledge for wiser stormwater management. Stormwater services are strongly affected by individual
property owners’ actions. Reducing the load on the overall system benefits all parties served by the
stormwater infrastructure. Green infrastructure, in particular, is vulnerable to neglect and misuse by
individuals, as a number of studies in other parts of the U.S. illustrate. As the city explores innovative
strategies to address stormwater management, increasing citizen knowledge and participation is seen as
critical component of successfully implementing green infrastructure. Benefits of successful outreach
include reduced private property demands on water resources and the combined stormwater/sewer
system, reduced pollutants from private property entering the watershed and citizen stewardship roles for
maintaining green infrastructure. These actions will not only contribute to a successful implementation of
the T2R Program but will also achieve goals BES has identified in the Portland Watershed Management
Plan and reduce overall cost to managing stormwater.
For additional program information please refer to: portlandonline.com/bes/tabortoriver
For additional information about the research and other similar efforts please refer to:
http://web.pdx.edu/~vshandas/
- 39 -
APPENDIX A: SE Portland Neighborhood Survey
Why respond to this survey?
Portland State University and the City of Portland Bureau of Environmental Services are conducting this
survey to evaluate outreach work for the Tabor to the River: Brooklyn Creek Basin Program. Your input is
valuable and will help us improve programs and projects in your community over the coming years.
The survey will take about 15 minutes.
You are a one of a select few to receive this survey, and when we receive your response we’ll enter your
name in a drawing to win one of 21 prizes. To notify you if you win a prize, we need your phone number or
email address on page 10. We won’t contact you for any other reason, unless you are interested in working
with us further on this study.
Thank you for your time and consideration.
Background
The Brooklyn Creek Basin extends from Mt. Tabor to the Willamette River between SE Hawthorne and SE
Powell boulevards. Some sewer pipes in the basin are nearly 100 years old, and many are too small to
handle large volumes of stormwater runoff during heavy rain, which causes street flooding and sewer
backups into basements.
The Tabor to the River: Brooklyn Creek Basin Program combines innovative stormwater management
techniques with sewer improvements to stop sewer backups, manage stormwater more naturally, and to
restore watershed health. The program includes constructing 500 green stormwater management facilities,
planting 4,000 street trees, removing invasive vegetation from natural areas and encouraging individual
and community actions to improve watershed health.
How do green stormwater facilities and trees improve watershed health?
• They filter pollutants from the stormwater.
• They keep stormwater out of the combined sewer system.
• They slow stormwater flow and allow water to soak into the soil replenishing groundwater.

- 40 -
How can communities improve watershed health?
People taking individual actions and working together can help improve watershed health. Plant a tree in
your yard, use native plants in your landscaping, learn about using alternatives to pesticides and fertilizers
in your yard. Improving watershed health improves neighborhood livability.
A. In this section, we’d like to find out how much you’ve heard about the city’s stormwater projects.
1) Before taking this survey, were you aware of stormwater-related projects planned in the
Brooklyn Creek Basin?
□ Yes □ No (If no, skip to #4) □ Not Sure
2) If yes, where did you hear about these projects? (Check all that apply)
A. □ Letter about the stormwater projects in your neighborhood
B. □ Tabor to the River newsletter
C. □ Tabor to the River table at a community event
D. □ Community meeting or workshop
E. □ Tours: □ bike □ boat □ walking
F. □ Survey other than this one
G. □ Internet (website or email)
H. □ Friends, family, neighbors
I. □ Community groups/neighborhood association
Which ones: _____________________________________________________________________________________
J. □ Other communications: ____________________________________________________________________
Which one of the above methods (A-J) was most informative about stormwater/watershed health
projects in your area? (Choose one) □ A □ B □ C □ D □ E □ F □ G
□ H □ I □ J
3) Did the information you received about these projects (question #2 above) affect what you do on
your own property?
□ Yes: Describe how: _______________________________________________________________________________
□ No □ Not Sure

- 41 -
4) Do you have stormwater problems on your property?
□ Yes: Describe how: ________________________________________________________________________
□ No □ Not Sure
5) Where do you look for information about managing stormwater on your property? (Check all
that apply)
A. □ Internet
B. □ Regional newspaper
C. □ Neighborhood newspaper
D. □ City-sponsored mailings
E. □ Friends, family, neighbors
F. □ Technical experts
G. □ Television
H. □ Other: ________________________________________
I. □ I don’t look for information about stormwater management
B. In this section, we’d like to hear about your neighborhood.
1) To what extent do you believe your neighborhood is…..?
Not at all ----------------- Very No Opinion
Attractive 1 2 3 4 5 6 NO
Safe (with respect to crime) 1 2 3 4 5 6 NO
Safe (with respect to traffic) 1 2 3 4 5 6 NO
Walkable 1 2 3 4 5 6 NO
Friendly/Social 1 2 3 4 5 6 NO
Family/Child friendly 1 2 3 4 5 6 NO
Healthy 1 2 3 4 5 6 NO

- 42 -
2) Rate how well you believe your neighborhood provides the following:
Poorly/Not at all ----------- Very Well No Opinion
Parks and open spaces 1 2 3 4 5 6 NO
Community centers 1 2 3 4 5 6 NO
Neighborhood associations 1 2 3 4 5 6 NO
Parking 1 2 3 4 5 6 NO
Walking facilities (e.g. sidewalks, safe crossings) 1 2 3 4 5 6 NO
Bike facilities (e.g. bike parking, paths) 1 2 3 4 5 6 NO
Street cleaning services 1 2 3 4 5 6 NO
Greenery / Trees 1 2 3 4 5 6 NO
Public art 1 2 3 4 5 6 NO
3) How many neighbors on your block do you know by first name?
□ All neighbors □ A few neighbors □ One or two neighbors □ None
4) Would you say most people living in your area care about the neighborhood?
No one cares ----Everyone cares No Opinion
1 2 3 4 5 6 NO
5) How much impact do you feel you can have in making your neighborhood a better place to live?
No impact at all----Big Impact No Opinion
1 2 3 4 5 6 NO
6) In what ways can you have a positive impact on your neighborhood?
________________________________________________________________________
7) What keeps you from making a positive impact on your neighborhood?
________________________________________________________________________

- 43 -
8) How often do you…... (Check only one box per question)
Attend public or town meetings?
□ Never/ Rarely □ A few times per year □ Monthly □ Weekly or more
Attend neighborhood/community meetings?
□ Never/ Rarely □ A few times per year □ Monthly □ Weekly or more
Attend any club or organizational meetings?
□ Never/ Rarely □ A few times per year □ Monthly □ Weekly or more
Attend educational workshops?
□ Never/ Rarely □ A few times per year □ Monthly □ Weekly or more
Work on community projects?
□ Never/ Rarely □ A few times per year □ Monthly □ Weekly or more
Share conversations with neighbors?
□ Never/ Rarely □ A few times per year □ Monthly □ Weekly or more
Share things or time with neighbors (food, tools, help with tasks, etc.)?
□ Never/ Rarely □ A few times per year □ Monthly □ Weekly or more
Have neighbors over to your home?
□ Never/ Rarely □ A few times per year □ Monthly □ Weekly or more
Take a walk in your neighborhood?
□ Never/ Rarely □ A few times per year □ Monthly □ Weekly or more
Volunteer?
□ Never/ Rarely □ A few times per year □ Monthly □ Weekly or more
9) Have you been involved in any of the following in the past 12 months? (Check all that apply)
□ Neighborhood or community group
□ School group
□ Religious organization
□ Adult sports or cultural group
□ Sports or cultural program for children
□ Environmental project (e.g. tree planting, ivy pull)

44
C. In this section, we’d like to hear your opinions about your yard and property.
1) Of the following stormwater management strategies, how likely are you to use each on your property? (Not likely = 1, very likely = 6, if you’re already using it, or don’t know what it is, check the box under that
heading; please feel free to provide us with comments about how you are using these –there is comment
space on page 12 or attach pages as needed) (Circle your choices) Not likely --------------------------Very likely Already Don’t know Comments
using what this is
Bioswales 1 2 3 4 5 6 □ □ _______________
Downspout disconnection 1 2 3 4 5 6 □ □ _______________
Ecoroofs (green roofs) 1 2 3 4 5 6 □ □ _______________
Rain barrels to reuse water 1 2 3 4 5 6 □ □ _______________
Rain gardens 1 2 3 4 5 6 □ □ _______________
Removal of paved areas 1 2 3 4 5 6 □ □ _______________
Removal of lawn 1 2 3 4 5 6 □ □ _______________
Trees (plant and/or preserve) 1 2 3 4 5 6 □ □ _______________
Natural gardening/naturescaping 1 2 3 4 5 6 □ □ _______________
Drywell or soakage trench 1 2 3 4 5 6 □ □ _______________
Porous pavement or pavers 1 2 3 4 5 6 □ □ _______________
Infiltration planter 1 2 3 4 5 6 □ □ _______________
Flow-through planter 1 2 3 4 5 6 □ □ _______________
2) What would be most helpful in installing any of the above stormwater strategies? (Choose one)
□ Financial assistance
□ More time
□ Help with maintenance
□ More information about benefits
□ More technical information or expertise
□ More attractive results
□ Other: _________________________________

45
3) How much time would you be willing to spend maintaining vegetation on your street?
□ None
□ 1-3 hours per month
□ 1-3 hours every few months
□ 1-3 hours per year
4) What would encourage you to get more involved with stormwater management in your
neighborhood or on your property? (Check your top three)
□ Seeing my neighbors taking similar actions
□ Feeling like I could choose the plants in city-owned stormwater facilities
□ Better understanding of how my actions benefit watershed and community health
□ Adopting a stormwater facility and being responsible for its care
□ Rotating care responsibilities with neighbors
□ Having the city install a green street in front of my property
□ Being provided a how-to guide or in-person instruction
□ I am already involved, what else can I do?
□ Other: _____________________________
5) I would like to know more about… (Check your top five)
□ Stormwater management in my neighborhood
□ Managing stormwater on my property
□ Rain gardens
□ Native plants
□ Street and yard trees choices
□ Tree maintenance
□ Ways to get involved
□ Climate change
□ Technical assistance resources
□ Rainwater harvesting
□ Watershed-friendly gardening
□ Adding habitat to my property
□ Other: _____________________________________________

46
6) Please tell us how you feel about the following statements:
(1= Strongly disagree, 6 = strongly agree, NA = not applicable)(Circle your choices)
Strongly Strongly Not
disagree agree applicable
I would take a course on managing stormwater 1 2 3 4 5 6 NA
I am interested in learning more about caring for my trees 1 2 3 4 5 6 NA
I would like more vegetation on my street 1 2 3 4 5 6 NA
I would be willing to help maintain a stormwater facility 1 2 3 4 5 6 NA
I am aware of city projects before they happen in my neighborhood 1 2 3 4 5 6 NA
The city makes an effort to let me know the need for a project 1 2 3 4 5 6 NA
I want to help with stormwater projects in my neighborhood 1 2 3 4 5 6 NA
I am interested in having more neighborhood events or activities 1 2 3 4 5 6 NA
-----------------------------------------------------------------------------------------------------------------------------------------
Can we follow up with you to get a little more feedback about your neighborhood?
□ Yes (Provide a phone number or email address): __________________________ □ No
Please share any additional comments you have with us:
___________________________________________________________________________________________________________________________
To Be Eligible for Prizes
To be entered in the drawing, please supply the following contact information.
Your name____________________________________________________________
Phone number:_______________________________________________________
And/or email address:______________________________________________
This section asks a few optional questions about you and your property.
1) In which range does your age fit?
□ Under 18 □ 45-54
□ 18-24 □ 55-64
□ 25-34 □ 65+
□ 35-44
2) Is this a home or business address?
□ Home □ Business □ Other: ___________________

47
3) Do you rent or own your home/business space:
Home: □ Rent □ Own
Business: □ Rent □ Own
4) What is your highest level of education? (Choose only one)
□ Less than High School □ Associate's Degree
□ High School Degree □ Bachelor's Degree
□ Some College □ Post-Graduate Degree
5) What was your approximate household income in 2008 before taxes? (Choose only one)
□ Less than $15,000 □ $50,000-74,999
□ $15,000-24,999 □ $75,000-99,999
□ $25,000-34,999 □ $100,000-150,000
□ $35,000-49,999 □ Over $150,000
6) What kind of building do you live in?
□ Detached house/business
□ Attached house or townhouse
□ Multi-house/business (e.g. apartment/multi-use complex)
□ Other: _______________________________
7) How long have you lived in your current residence? ________ Years _________ Months
Thank you for your time and contributions to this survey. Your responses will make a difference.

48
APPENDIX B: Responses to All Survey Questions (by Section and Question Number)
Section A. Question 1: Before taking this survey, were you aware of stormwater-related projects planned in
the Brooklyn Creek Basin?
TGD Program Areas Control Areas Response
9 15 20 24 31 33 1 2 Percent
Grand Total
Yes 15 59 37 68 34 19 65 5 53.08% 302
No 7 57 24 7 11 10 79 32 39.89% 227
Not Sure 2 11 2 4 4 5 11 1 7.03% 40
Grand Total 24 127 63 79 49 34 155 38 569
0
10
20
30
40
50
60
70
80
90
TGD 9 TGD 15 TGD 20 TGD 24 TGD 31 TGD 33 Control 1 Control 2
Nu
mb
er
of
resp
on
de
nts
Yes
No
Not Sure

49
Section A. Question 2: If yes, where did you hear about these projects?
3 7 12
20 25
57
81
165
43
217
0
50
100
150
200
250
Survey Tours T 2R table Community
mtg/workshop
Internet Community
Group /NA
Friends etc
Other BES letter
Nu
mb
er
of
resp
on
de
nts
81*
n=630
*Most common other responses are the SE Examiner, neighborhood newsletters and project signs
T2R newsletter

50
Section A. Question 2: Where did you hear about these projects?
TGD Program Areas Control Areas Information Source 9 15 20 24 31 33 1 2
Grand Total
Percent
Survey, other than this one 0 0 0 0 0 0 0 0 0 0.00%
Tour by bike, boat or walking 0 1 0 0 0 0 0 0 1 0.33%
Tabor to the River table at event 0 2 0 1 0 0 1 0 4 1.34%
Friends, family, neighbors 2 1 3 0 0 0 0 1 7 2.34%
Community meeting or workshop 0 3 0 2 2 1 1 0 9 3.01%
Internet 1 2 1 1 0 0 2 2 9 3.01%
Community group or neighborhood association
0 7 2 1 0 4 3 0 17 5.69%
Other communication 0 11 3 6 3 1 14 1 39 13.04%
Tabor to the River newsletter 6 20 18 7 9 10 23 1 94 31.44%
Letter from BES 5 12 9 43 23 3 23 1 119 39.80%
Grand Total 14 59 36 61 37 19 67 6 299 100.00%

51
Section A. Question 3: Did the information you received about these projects affect what you do on your
own property?
TGD Program Areas* Response
9 15 20 24 31 33
Yes 17.65% 17.91% 28.21% 30.43% 31.58% 22.73%
No 64.71% 71.64% 61.54% 59.42% 60.53% 59.09%
Not Sure 17.65% 10.45% 10.26% 10.14% 7.89% 18.18%
Grand Total^ 5.15% 20.30% 11.82% 20.91% 11.52% 6.67%
* = % within TGD ^ = grand total percent is response rate to question, n=330
0%
20%
40%
60%
80%
100%
TGD 9 TGD 15 TGD 20 TGD 24 TGD 31 TGD 33
Pe
rce
nt
of
resp
on
de
nts
w
ith
in t
he
TG
D
Yes
No
Not Sure
n=252

52
Section A. Question 3: Did the information you received about these projects affect what you do on your
own property?
Control Areas* Response
1 2
Yes 21.13% 28.57%
No 57.75% 57.14%
Not Sure 21.13% 14.29%
Grand Total^ 21.52% 2.12 %
* = % within Control Area ^ = grand total percent is response rate to question, n=330
0%
20%
40%
60%
80%
100%
Control 1 Control 2
Pe
rce
nt
of
resp
on
de
nts
wit
hin
th
e c
on
tro
l a
rea
Yes
No
Not Sure
n=78

53
Section A. Question 4: Do you have stormwater problems on your property?
Geographical Areas Yes No Not Sure Total
TGD 9 33.33% 54.17% 12.50% 24
TGD 15 23.66% 66.41% 9.92% 131
TGD 20 55.00% 38.33% 6.67% 60
TGD 24 41.25% 55.00% 3.75% 80
TGD 31 26.53% 67.35% 6.12% 49
TGD 33 23.53% 58.82% 17.65% 34
Control 1 23.68% 70.39% 5.92% 152
Control 2 10.26% 84.62% 5.13% 39
Grand Total 28.47% 61.75% 7.38% 569
0%
30%
60%
90%
TGD 9 TGD 15 TGD 20 TGD 24 TGD 31 TGD 33 Control 1 Control 2
Pe
rce
nt
of
resp
on
se w
ith
in
geo
gra
ph
ica
l a
rea Yes
No
Not Sure

54
Section A. Question 5: Where do you look for information about managing stormwater on your property?
Information Source Total Number of
Responses Percent*
City-sponsored mailings 204 19.2%
Internet 181 17.28%
I don't look for information [on this topic] 174 16.37%
Friends, family, neighbors 152 14.3%
Neighborhood newspapers 132 12.42%
Technical experts 84 7.9%
Regional newspapers 63 5.93%
Other 42 3.95%
Television 31 2.91%
* Percent reply greater than 100% because respondents indicated multiple sources
0
50
100
150
200
250
Television Other Regionalnewspapers
Technical experts
Neighborhoodnewspapers
Friends, family,
neighbors
I don't look for information on this topic
Internet City-sponsored
mailings
Nu
mb
er
of
resp
on
de
nts
n=1063

55
Section B. Question 1: To what extent do you believe your neighborhood is…
0.00 1.00 2.00 3.00 4.00 5.00 6.00
Walkable
Friendly/Social
Attractive
Family/Child friendly
Safe (with respect to crime)
Healthy
Safe (with respect to traffic)
Average of all characteristics
Average of Control Areas
Average of Study TGDs
Scale of 0 to 6 where 0 = not at all and 6 = very

56
Section B. Question 2: Rate how well you believe your neighborhood provides the following…
0.00 1.00 2.00 3.00 4.00 5.00 6.00
Walking facilities
Greenery/Trees
Parks and open spaces
Biking facilities
Parking
Neighborhood association
Street cleaning services
Community centers
Public art
Average of all facilities
Average of Control Areas
Average of Study TGDs
Scale of 1 to 6, where 1= poorly/not at all and 6 = very well

57
Section C. Question 1: Of the following stormwater management strategies, how likely are you to use each
on your property?
TGD Program Areas Control Areas Stormwater Strategy*
9 15 20 24 31 33 1 2
Grand Total
Infiltration planter 1.04 1.11 1 1.11 1.2 1.22 1.39 1.78 1.23
Flow-through planter 1.08 1.66 1.25 1.32 1.24 1.39 1.74 2.2 1.55
Ecoroof (green roof) 2 1.89 2.18 1.88 2.19 2.16 1.94 2.49 2.02
Bioswale 3.05 2.27 2.37 1.91 3.07 1.76 2.06 1.48 2.18
Rain garden 4.08 2.78 2.88 2.35 3.04 3.61 2.94 3.05 2.92
Drywell or soakage trench
2.17 2.96 2.92 3.62 3.23 2.5 3.26 2.25 3.04
Removal of paved areas 2.5 3.05 3.36 3.27 2.62 2.81 3.07 3.05 3.04
Porous pavers 4.79 3.59 3.7 3.95 4.16 3.48 3.74 3.45 3.78
Rain barrels 4.08 4.18 4.46 4.14 4 4.11 4.01 4.62 4.17
Removal of lawn 4.58 4.4 4.55 4.08 4.27 4.97 3.93 4.31 4.27
Naturescaping 5.25 5.29 5.12 5 4.9 5.15 5.02 5.3 5.12
Downspout disconnect 5.63 5.19 6.05 5.11 5.49 5.33 5.56 4.92 5.41
Trees (plant or preserve) 6.17 5.77 5.87 5.62 5.78 5.42 5.7 5.85 5.74
*the response "don't know what this is" was converted to 0 and the response "already using" converted to 7, to find the mean of likeliness of implementing each stormwater strategy

58
Section C. Question 1: Of the following stormwater management strategies, how likely are you to use each
on your property?
Stormwater Strategy Control Area
Average Project
Average Grand Total
Infiltration planter 1.58 1.11 1.23
Flow-through planter 1.97 1.32 1.55
Ecoroof (green roof) 2.21 2.05 2.02
Bioswale 1.77 2.4 2.18
Rain garden 3 3.12 2.92
Drywell or soakage trench 2.76 2.9 3.04
Removal of paved areas 3.06 2.93 3.04
Porous pavers 3.6 3.94 3.78
Rain barrels 4.31 4.16 4.17
Removal of lawn 4.12 4.47 4.27
Naturescaping 5.16 5.12 5.12
Downspout disconnect 5.24 5.47 5.41
Trees (plant or preserve) 5.77 5.77 5.74
0.00 1.00 2.00 3.00 4.00 5.00 6.00 7.00
Infiltration planter
Flow-through planter
Ecoroof (green roof) Bioswale
Rain garden
Drywell or soaking
Removal of paved areas
Porous pavers
Rain barrels
Removal of lawn
Naturescaping Downspout disconnect
Trees (plant or preserve)
Average of Study TGDs
Average of Control Areas
Scale of 0 to 7, where 0 = no knowledge of strategy, 7 = already using strategy

59
Section C. Question 2: What would be most helpful in installing stormwater strategies?
Supportive Action Total Percent*
Financial assistance 292 27.76%
Technical assistance 283 26.90%
More time 152 14.45%
More information about benefits 132 12.55%
Help with maintenance 84 7.98%
Other 56 5.32%
More attractive results 53 5.04%
n =1052 * = greater than 100% due to multiple of responses
0
50
100
150
200
250
300
350
Financial assistance
Technical assistance
More time More informationabout benefits
Help with maintenance
Other More attractiveresults
Nu
mb
er
of
resp
on
ses

60
Section C. Question 4: What would encourage you to get more involved with stormwater management in
your neighborhood or on your property?
* = percent within geographical area
0%
5%
10%
15%
20%
25%
Be
ing
pro
vid
ed
ho
w-t
o-g
uid
e
Ha
vin
g t
he
cit
y
inst
all
gre
en
stre
et
Se
ein
g m
y n
eig
hb
ors
ta
kin
g s
imil
ar
act
ion
s
Ro
tati
ng
resp
on
sib
ilit
y
Be
tte
ru
nd
ers
tan
din
g o
f b
en
efi
ts
Fe
eli
ng
lik
e I
co
uld
ch
oo
se
Ad
op
tin
g a
st
orm
wa
ter
faci
lity
Oth
er
I a
m a
lre
ad
y
inv
olv
ed
Pe
rce
nt
wit
hin
ge
og
rap
hic
al
are
a
Study Area*
Control Area*

61
Project Area By TGD Control Area Encouragement
9 15 20 24 31 33 Total % of Total
1 2 Total % of Total
Grand Total
Being provided how-to-guide
16 66 37 31 21 14 185 21.02 82 22 104 22.17 289
Having the city install greenstreet
10 55 26 26 20 18 155 17.61 56 15 71 15.14 226
Seeing my neighbors taking similar actions
9 45 29 29 19 10 141 16.02 62 20 82 17.48 223
Rotating responsibility
7 37 21 23 15 9 112 12.73 51 4 55 11.73 167
Better understanding of benefits
3 33 19 12 9 13 89 10.11 54 18 72 15.35 161
Feeling like I could choose plants…
6 20 10 22 18 4 80 9.09 24 11 35 7.46 115
Adopting a stormwater facility
4 10 13 8 2 5 42 4.77 17 4 21 4.48 63
Other 3 13 5 10 7 3 41 4.66 16 3 19 4.05 60
I am already involved
0 11 5 9 5 5 35 3.98 6 4 10 2.13 45
Grand Total 58 290 165 170 116 81 880 100 368 101 469 100 1349

62
Section C. Question 5: I would like to know more about….
0
50
100
150
200
250
300
350
Raingardens
Rain barrels
Native plants
Managing stormwater (private property)
Watershed-friendly gardening
Technical assistance resources
Tree maintenance
Stormwater management (neighborhood)
Street and yard tree choices
Adding habitat (private property)
Ways to get involved
OtherClimate change
Nu
mb
er
of
Re
spo
nse
s

63
Section C. Question 6: Please tell us how you would feel about the following statements….
0.00 2.00 4.00 6.00
I would take a course on managing stormwater
I am interested in learning moreabout caring for my trees
The city makes an effort to let me know the need for projects
I would be willing to help maintain a stormwater facility
I am aware of city projects before they happen in my neighborhood
I would like more vegetation on my street
Scale of 0 to 6, where 0 = not applicable, 1 = strongly disagree and 6 = strongly agree
I want to help with stormwater projects in my neighborhood
I am interested in having more neighborhood events or activities

64
APPENDIX C: Researcher Profiles
Vivek Shandas is an Associate Professor in the Toulan School of Urban Studies and Planning, and a
Research Associate in the Center for Urban Studies at Portland State University. He is the founder of the
newly established Sustaining Urban Places Research Lab (SUPR Lab), where his team focuses on three
substantive areas of research: (1) examining feedbacks between stormwater management and human
behavior; (2) developing community-based indicators for measuring urban ecosystems; and (3)
characterizing the relationship between urban development patterns and environmental quality. He
teaches undergraduate and graduate courses in geographic information systems and environmental
planning.
Anne Nelson is an Environmental Program Coordinator with the City of Portland Bureau of Environmental
Services. Her work focuses on linking watershed health, policy development, community initiatives and
research to help implement the Portland Watershed Management Plan. She developed and leads the
outreach and education strategy of the Tabor to the River Program. Integral to this program is the
development of a research-based model in partnership with universities, schools, community members and
non-profit partners to grow the social infrastructure necessary for long-term functioning of green
infrastructure and improving overall watershed health.
Carine Arendes is a graduate of the Community Development Bachelor's program at Portland State
University, where she worked as a research assistant for Dr. Shandas.
Cathy Cibor is a graduate of the Master of Urban and Regional Planning program at Portland State
University. She worked as a research assistant for Dr. Shandas, and upon graduating accepted a position at
Alta Planning and Design in Portland, OR.
Printed on recycled paper. WS 10150
REPORT CV-T2R eval_ REPORT COVER 8.5 x 11" 2/12/10 5:20 PM Page 3