table of contents - wsc
TRANSCRIPT


1 Message from the Chairman 1
2 Message from the General Manager 2
3 Vision and Mission 3
4 Key Indicators of WSC’s Performance 4
5 Strategic Initiatives Carried out in 2015 7
6 The WSC’s Performance in 2015 10
6.1 Coverage 11
6.2 Operating Performance 13
6.2.1 Quality of Service 13
6.2.2 Operational Efficiency 16
6.3 Financial Performance 17
6.3.1 The WSC’s Revenues, Operating Costs, and Cost Recovery 18
6.3.2 Capital Expenditures 22
7 Audited Financial Statements 23
Page
Table of ConTenTs

noTe:
The 2015 Annual Report reflects the Board and Executive Management team in place at 31-Dec-2015.
The Board and Management wishes to acknowledge the contributions of Bishop Lester E. Cox, Chairman, July 2014 – July 2015.
1
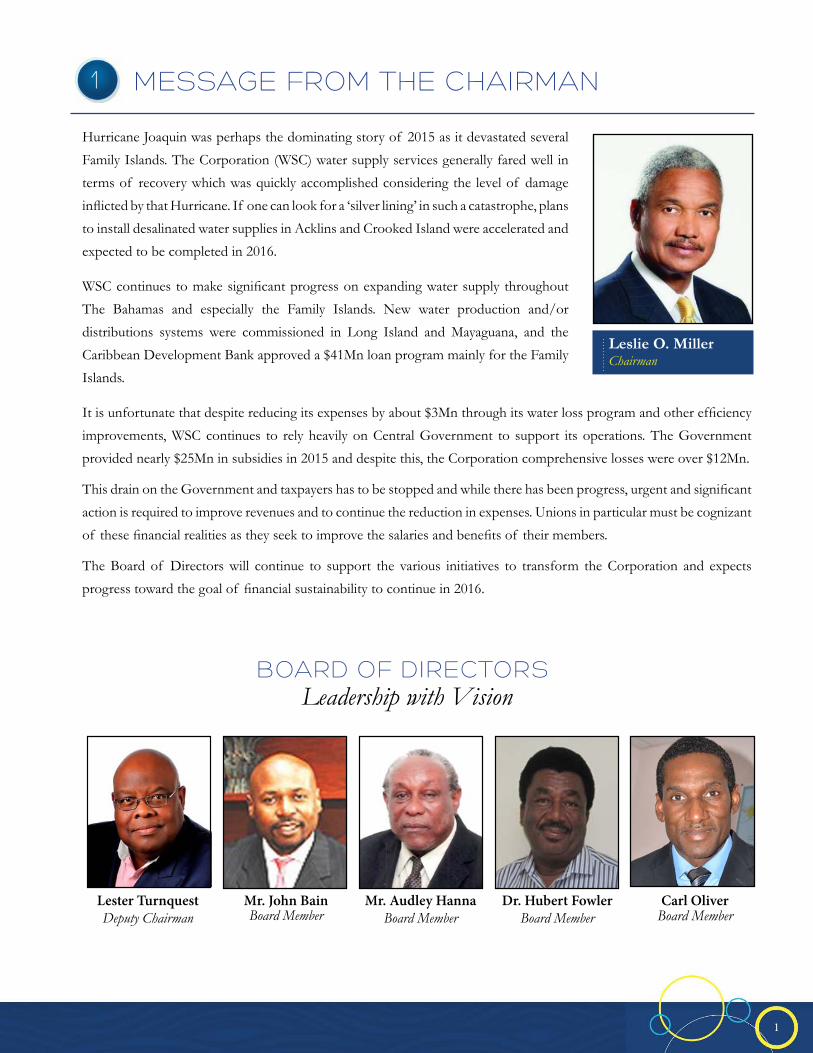
Hurricane Joaquin was perhaps the dominating story of 2015 as it devastated several
Family Islands. The Corporation (WSC) water supply services generally fared well in
terms of recovery which was quickly accomplished considering the level of damage
inflicted by that Hurricane. If one can look for a ‘silver lining’ in such a catastrophe, plans
to install desalinated water supplies in Acklins and Crooked Island were accelerated and
expected to be completed in 2016.
WSC continues to make significant progress on expanding water supply throughout
The Bahamas and especially the Family Islands. New water production and/or
distributions systems were commissioned in Long Island and Mayaguana, and the
Caribbean Development Bank approved a $41Mn loan program mainly for the Family
Islands.
It is unfortunate that despite reducing its expenses by about $3Mn through its water loss program and other efficiency
improvements, WSC continues to rely heavily on Central Government to support its operations. The Government
provided nearly $25Mn in subsidies in 2015 and despite this, the Corporation comprehensive losses were over $12Mn.
This drain on the Government and taxpayers has to be stopped and while there has been progress, urgent and significant
action is required to improve revenues and to continue the reduction in expenses. Unions in particular must be cognizant
of these financial realities as they seek to improve the salaries and benefits of their members.
The Board of Directors will continue to support the various initiatives to transform the Corporation and expects
progress toward the goal of financial sustainability to continue in 2016.
board of direCTorsLeadership with Vision
Message froM The ChairMan
Dr. Hubert FowlerBoard Member
Lester TurnquestDeputy Chairman
Mr. Audley HannaBoard Member
Mr. John BainBoard Member
Carl OliverBoard Member
1
Leslie O. MillerChairman
2
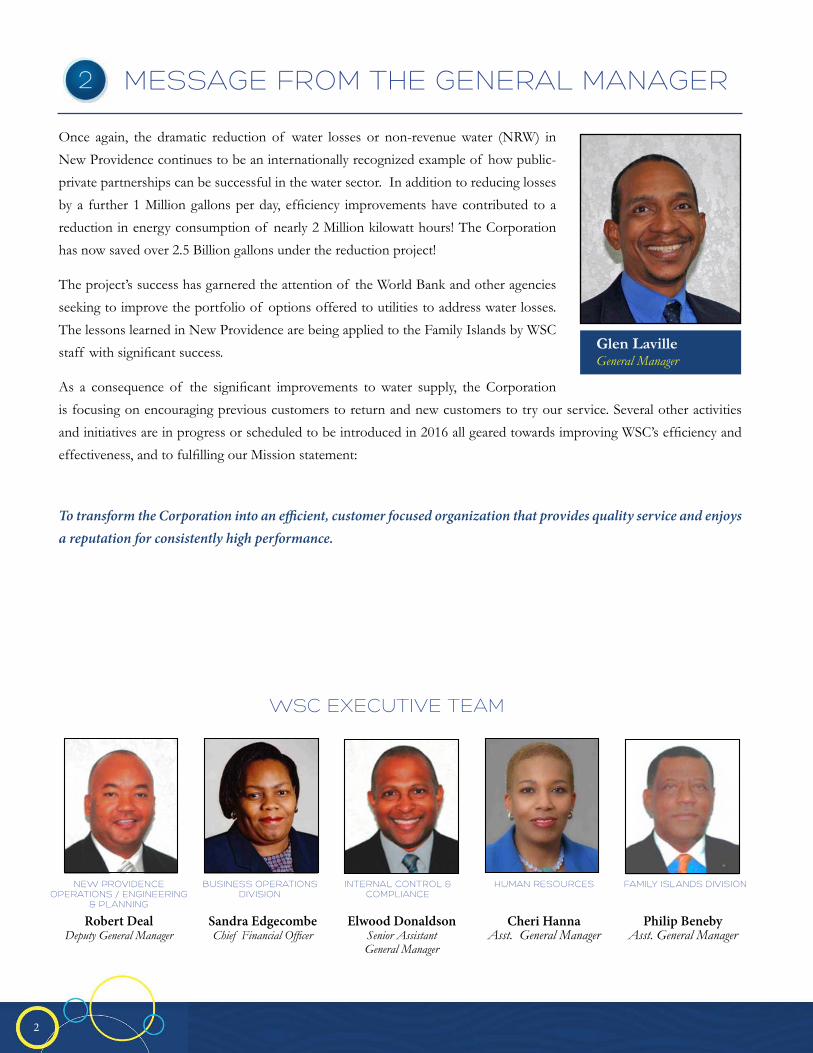
Once again, the dramatic reduction of water losses or non-revenue water (NRW) in
New Providence continues to be an internationally recognized example of how public-
private partnerships can be successful in the water sector. In addition to reducing losses
by a further 1 Million gallons per day, efficiency improvements have contributed to a
reduction in energy consumption of nearly 2 Million kilowatt hours! The Corporation
has now saved over 2.5 Billion gallons under the reduction project!
The project’s success has garnered the attention of the World Bank and other agencies
seeking to improve the portfolio of options offered to utilities to address water losses.
The lessons learned in New Providence are being applied to the Family Islands by WSC
staff with significant success.
As a consequence of the significant improvements to water supply, the Corporation
is focusing on encouraging previous customers to return and new customers to try our service. Several other activities
and initiatives are in progress or scheduled to be introduced in 2016 all geared towards improving WSC’s efficiency and
effectiveness, and to fulfilling our Mission statement:
To transform the Corporation into an efficient, customer focused organization that provides quality service and enjoys a reputation for consistently high performance.
Message froM The general Manager
WsC exeCuTive TeaM
neW ProvidenCeoPeraTions / engineering
& Planning
business oPeraTions division
inTernal ConTrol & CoMPlianCe
huMan resourCes faMily islands division
Elwood DonaldsonSenior AssistantGeneral Manager
Sandra EdgecombeChief Financial Officer
Robert DealDeputy General Manager
Cheri HannaAsst. General Manager
Philip BenebyAsst. General Manager
2
Glen LavilleGeneral Manager

33
vision sTaTeMenT
our Mission
Committed to growth, committed to quality.
To transform the Corporation into an efficient, customer focused organization that provides quality service and enjoys a reputation for consistently high performance.
4
4
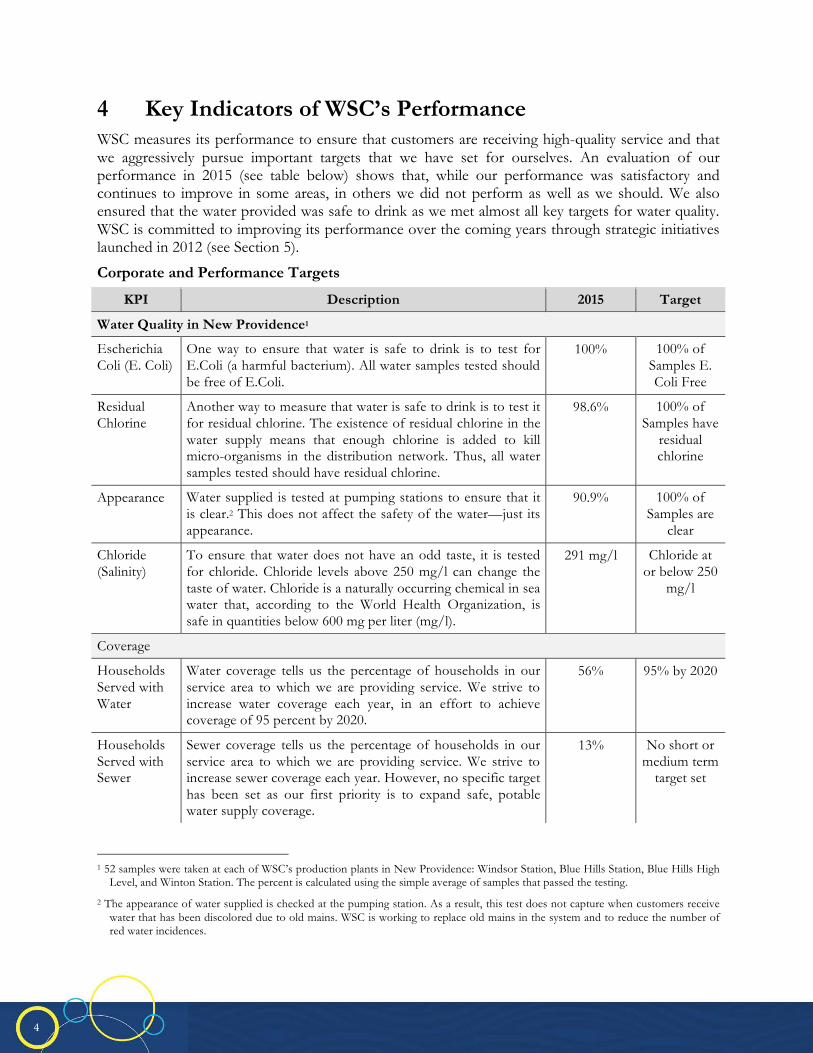
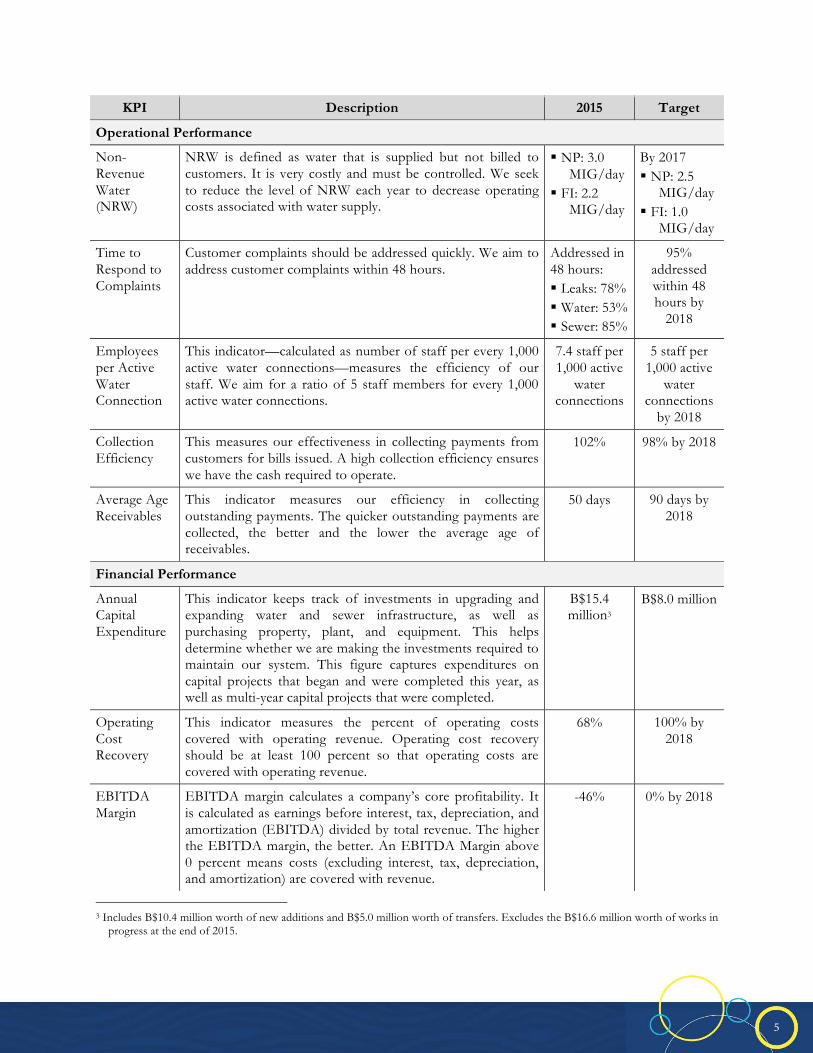
4 Key Indicators of WSC’s Performance WSC measures its performance to ensure that customers are receiving high-quality service and that we aggressively pursue important targets that we have set for ourselves. An evaluation of our performance in 2015 (see table below) shows that, while our performance was satisfactory and continues to improve in some areas, in others we did not perform as well as we should. We also ensured that the water provided was safe to drink as we met almost all key targets for water quality. WSC is committed to improving its performance over the coming years through strategic initiatives launched in 2012 (see Section 5).
Corporate and Performance Targets
KPI Description 2015 Target
Water Quality in New Providence1
Escherichia Coli (E. Coli)
One way to ensure that water is safe to drink is to test for E.Coli (a harmful bacterium). All water samples tested should be free of E.Coli.
100% 100% of Samples E. Coli Free
Residual Chlorine
Another way to measure that water is safe to drink is to test it for residual chlorine. The existence of residual chlorine in the water supply means that enough chlorine is added to kill micro-organisms in the distribution network. Thus, all water samples tested should have residual chlorine.
98.6% 100% of Samples have
residual chlorine
Appearance Water supplied is tested at pumping stations to ensure that it is clear.2 This does not affect the safety of the water—just its appearance.
90.9% 100% of Samples are
clear
Chloride (Salinity)
To ensure that water does not have an odd taste, it is tested for chloride. Chloride levels above 250 mg/l can change the taste of water. Chloride is a naturally occurring chemical in sea water that, according to the World Health Organization, is safe in quantities below 600 mg per liter (mg/l).
291 mg/l Chloride at or below 250
mg/l
Coverage
Households Served with Water
Water coverage tells us the percentage of households in our service area to which we are providing service. We strive to increase water coverage each year, in an effort to achieve coverage of 95 percent by 2020.
56% 95% by 2020
Households Served with Sewer
Sewer coverage tells us the percentage of households in our service area to which we are providing service. We strive to increase sewer coverage each year. However, no specific target has been set as our first priority is to expand safe, potable water supply coverage.
13% No short or medium term
target set
1 52 samples were taken at each of WSC’s production plants in New Providence: Windsor Station, Blue Hills Station, Blue Hills High
Level, and Winton Station. The percent is calculated using the simple average of samples that passed the testing.
2 The appearance of water supplied is checked at the pumping station. As a result, this test does not capture when customers receive water that has been discolored due to old mains. WSC is working to replace old mains in the system and to reduce the number of red water incidences.
5
5
KPI Description 2015 Target
Operational Performance
Non-Revenue Water (NRW)
NRW is defined as water that is supplied but not billed to customers. It is very costly and must be controlled. We seek to reduce the level of NRW each year to decrease operating costs associated with water supply.
NP: 3.0 MIG/day
FI: 2.2 MIG/day
By 2017 NP: 2.5
MIG/day FI: 1.0
MIG/day
Time to Respond to Complaints
Customer complaints should be addressed quickly. We aim to address customer complaints within 48 hours.
Addressed in 48 hours: Leaks: 78% Water: 53% Sewer: 85%
95% addressed within 48 hours by
2018
Employees per Active Water Connection
This indicator—calculated as number of staff per every 1,000 active water connections—measures the efficiency of our staff. We aim for a ratio of 5 staff members for every 1,000 active water connections.
7.4 staff per 1,000 active
water connections
5 staff per 1,000 active
water connections
by 2018
Collection Efficiency
This measures our effectiveness in collecting payments from customers for bills issued. A high collection efficiency ensures we have the cash required to operate.
102% 98% by 2018
Average Age Receivables
This indicator measures our efficiency in collecting outstanding payments. The quicker outstanding payments are collected, the better and the lower the average age of receivables.
50 days 90 days by 2018
Financial Performance
Annual Capital Expenditure
This indicator keeps track of investments in upgrading and expanding water and sewer infrastructure, as well as purchasing property, plant, and equipment. This helps determine whether we are making the investments required to maintain our system. This figure captures expenditures on capital projects that began and were completed this year, as well as multi-year capital projects that were completed.
B$15.4 million3
B$8.0 million
Operating Cost Recovery
This indicator measures the percent of operating costs covered with operating revenue. Operating cost recovery should be at least 100 percent so that operating costs are covered with operating revenue.
68% 100% by 2018
EBITDA Margin
EBITDA margin calculates a company’s core profitability. It is calculated as earnings before interest, tax, depreciation, and amortization (EBITDA) divided by total revenue. The higher the EBITDA margin, the better. An EBITDA Margin above 0 percent means costs (excluding interest, tax, depreciation, and amortization) are covered with revenue.
-46% 0% by 2018
3 Includes B$10.4 million worth of new additions and B$5.0 million worth of transfers. Excludes the B$16.6 million worth of works in
progress at the end of 2015.
6
6
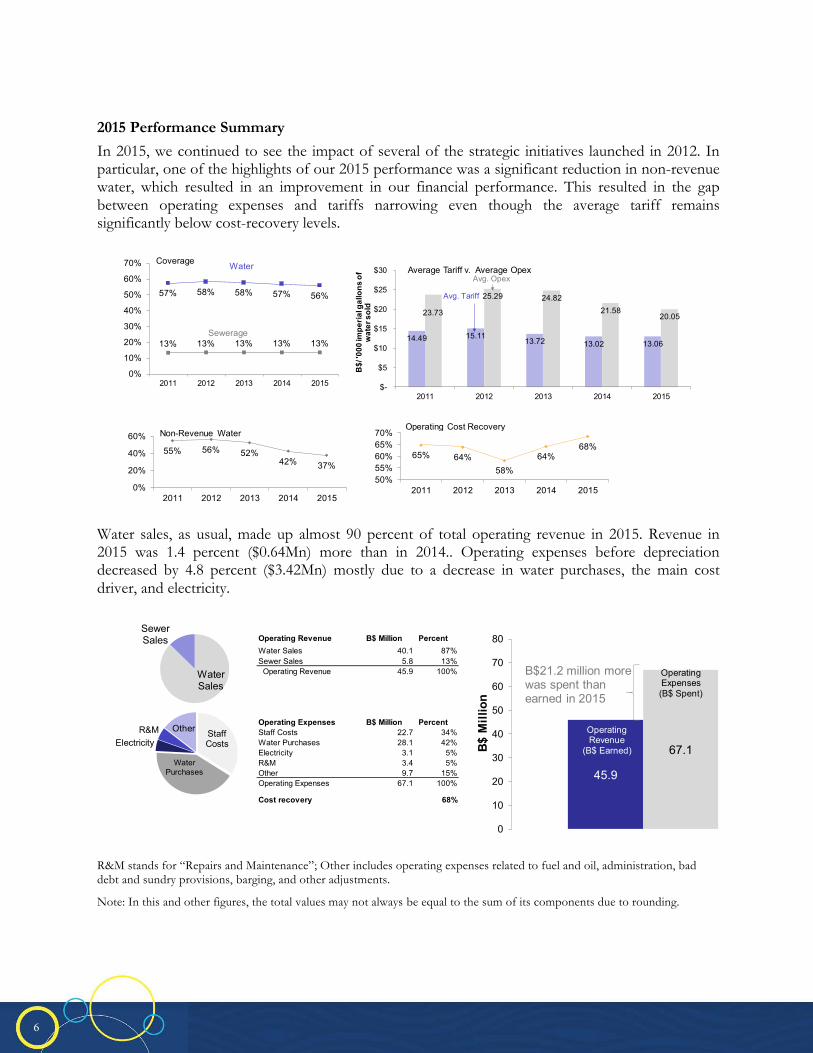
2015 Performance Summary
In 2015, we continued to see the impact of several of the strategic initiatives launched in 2012. In particular, one of the highlights of our 2015 performance was a significant reduction in non-revenue water, which resulted in an improvement in our financial performance. This resulted in the gap between operating expenses and tariffs narrowing even though the average tariff remains significantly below cost-recovery levels.
Water sales, as usual, made up almost 90 percent of total operating revenue in 2015. Revenue in 2015 was 1.4 percent ($0.64Mn) more than in 2014.. Operating expenses before depreciation decreased by 4.8 percent ($3.42Mn) mostly due to a decrease in water purchases, the main cost driver, and electricity.
R&M stands for “Repairs and Maintenance”; Other includes operating expenses related to fuel and oil, administration, bad debt and sundry provisions, barging, and other adjustments.
Note: In this and other figures, the total values may not always be equal to the sum of its components due to rounding.
65% 64%58%
64%68%
50%55%60%65%70%
2011 2012 2013 2014 2015
Operating Cost Recovery
57% 58% 58% 57% 56%
13% 13% 13% 13% 13%
0%
10%
20%
30%
40%
50%
60%
70%
2011 2012 2013 2014 2015
Coverage Water
Sewerage
55% 56% 52%42% 37%
0%
20%
40%
60%
2011 2012 2013 2014 2015
Non-Revenue Water
14.49 15.1113.72 13.02 13.06
23.73
25.29 24.8221.58
20.05
$-
$5
$10
$15
$20
$25
$30
2011 2012 2013 2014 2015
B$/
'000
impe
rial g
allo
ns o
f w
ater
sol
d
Average Tariff v. Average OpexAvg. Opex
Avg. Tariff
Operating Revenue B$ Million PercentWater Sales 40.1 87%Sewer Sales 5.8 13%
Operating Revenue 45.9 100%
Operating Expenses B$ Million PercentStaff Costs 22.7 34%Water Purchases 28.1 42%Electricity 3.1 5%R&M 3.4 5%Other 9.7 15%Operating Expenses 67.1 100%
Cost recovery 68%
45.9
67.1
0
10
20
30
40
50
60
70
80
B$ M
illio
n
B$21.2 million more was spent than earned in 2015
OperatingRevenue
(B$ Earned)
OperatingExpenses(B$ Spent)
Staff Costs
Water Purchases
ElectricityR&M Other
Water Sales
Sewer Sales

7
7
5 Strategic Initiatives Carried Out in 2015 The focus in 2015 was to continue progressing with the strategic initiatives launched in 2012. WSC is committed to carrying out these initiatives in a timely manner, in order to achieve our objectives by the target years set. Table 5.1 presents the strategic initiatives launched in 2012 that we continued to execute in 2015, and new initiatives launched in 2015.
Table 5.1: Strategic Initiatives Carried Out in 2015
Initiative Progress in 2015
Reduce Non-Revenue Water (NRW) MIYA (the firm hired to execute our NRW reduction program) continued with the implementation of the Strategic Plan developed in 2012 to reduce NRW in New Providence.
Implement a New Organizational Structure
Implementation of the New Organizational Structure continued with a review of some of the business processes of the company.
Public Relations & Customer Win-Back Campaign
Barefoot Marketing developed a marketing and public relations plan to assist in rebranding WSC.
Prepare a master plan and rehabilitate wastewater treatment plants (WWTP)
Adin Holdings (the firm hired to prepare the Master Plan), completed the Wastewater Master Plan for New Providence and commenced design of critical .infrastructure rehabilitation
Update the legal and regulatory framework
Draft legislation issued to the Office of the Attorney General for review.
In 2015, we received US$10.6million in disbursements from the Inter-American Development Bank (IDB) and spent US$16.2 million. This is a part of the US$81.0 million loan that we executed in 2011 to finance our strategic initiatives.
Strategic Initiative 1: Reduce Non-Revenue Water (NRW)
NRW is of concern to all water utilities but is especially costly to WSC due to the use of energy-intensive desalination (by reverse osmosis – RO) for water production. NRW creates the need to produce more water than would otherwise be needed, and therefore increases operating costs associated with water supply.
In 2013, MIYA began implementing the Strategic Plan to reduce NRW in New Providence, which was developed in 2012. Additionally, the second Baseline Survey was completed in June 2013. The NRW reduction targets were revised (see Table 5.2) according to the findings of the Baseline Survey.
MIYA continued to exceed contractual targets by achieving 3.0 million imperial gallons per day compared to its (reduced) target of 3.2 million imperial gallons per day. In three years of implementation, NRW has been reduced from 6.9 million imperial gallons per day (58 percent of water supplied) in 2012, to 3.0 million imperial gallons per day (33 percent of water supplied). A total of 2.5 billion gallons of water has been saved since the project started.

8
8
Table 5.2: Revised NRW Reduction Targets for New Providence
New Providence NRW
Historic Estimated Reduction Under Contract (Revised)4
2011 2012 2013 2014 2015 2016 2017 2018 2019 2020 2021
MIG/Day 6.65 6.96 6.47 4.38 3.09 2.7 2.5 2.5 2.0 2.0 2.0
Strategic Initiative 2: Implement a New Organizational Structure
We launched the initiative to implement a New Organizational Structure with the objective of becoming a more efficient company. The proposed organizational structure is designed to reduce bureaucracy, ensure that related functions or dependent functions are grouped together, and allow the WSC to focus on its core functions. The proposed structure will also improve the staff’s performance by establishing clear job descriptions and responsibilities for each position, establishing indicators to measure the performance, and establishing the qualifications and skills needed for each position.
In 2015, progress on this initiative was limited to further refining of the proposed organization and planning/preparation for training activities in 2016. Outsourcing activities that were planned had to be postponed due to a legal challenge by the Water & Sewerage Management Union. At year end, the case had been concluded, but parties were awaiting the written ruling.
Strategic Initiative 3: Implement Public Relations & Customer Win-Back Campaigns
Barefoot Marketing (Bahamas) continued implementation of the Public Relations Campaign aimed at rebranding the Corporation and winning back customers. The objectives are to improve the relationship and communications with our customers, ensure awareness and buy-in of our initiatives by customers and staff, and carry out a Customer Win-Back campaign to expand our customer base. The formal campaign to win back customers was launched in the 4th quarter and it is hoped that we will see significant results in 2016.
Strategic Initiative 4: Prepare a Master Plan and Rehabilitate Wastewater Treatment Plants
The objective of this initiative is to improve the quality of wastewater services provided by rehabilitating wastewater treatment plants (WWTP) and other critical sewerage infrastructure. Consultants—Adin Holdings (Israel) and Integrated Building Services (Bahamas)—were contracted in November 2013 to develop the Wastewater Master Plan and to prepare detailed designs for
4 MIYA, “Re: Revised annual NRW targets.” 19 January 2015.
5 Final Baseline Survey 2012 Report (Executive Summary) states that the “total validated volume of NRW [in 2011] was 2,400.1 MIG (6.58 MIGPD)”.
6 Baseline Survey 2013 Report,(Executive Summary) states that the “total validated volume of NRW of 2,506.4 MIG (6.87 MIGPD).”
7 Annual Project Implementation Report for 2013, (Executive Summary) states that the “total validated volume of NRW of 2,328.41 MIG (6.38 MIGPD).”.
8 Annual Project Implementation Report for 2014, (Executive Summary) states that the “total validated volume of NRW of 1,562.56 MIG (4.28 MIGPD).”.
9 Annual Project Implementation Report for 2015, (Executive Summary) states that the “total validated volume of NRW of 1,098.72 MIG (3.01 MIGPD).”
9
9
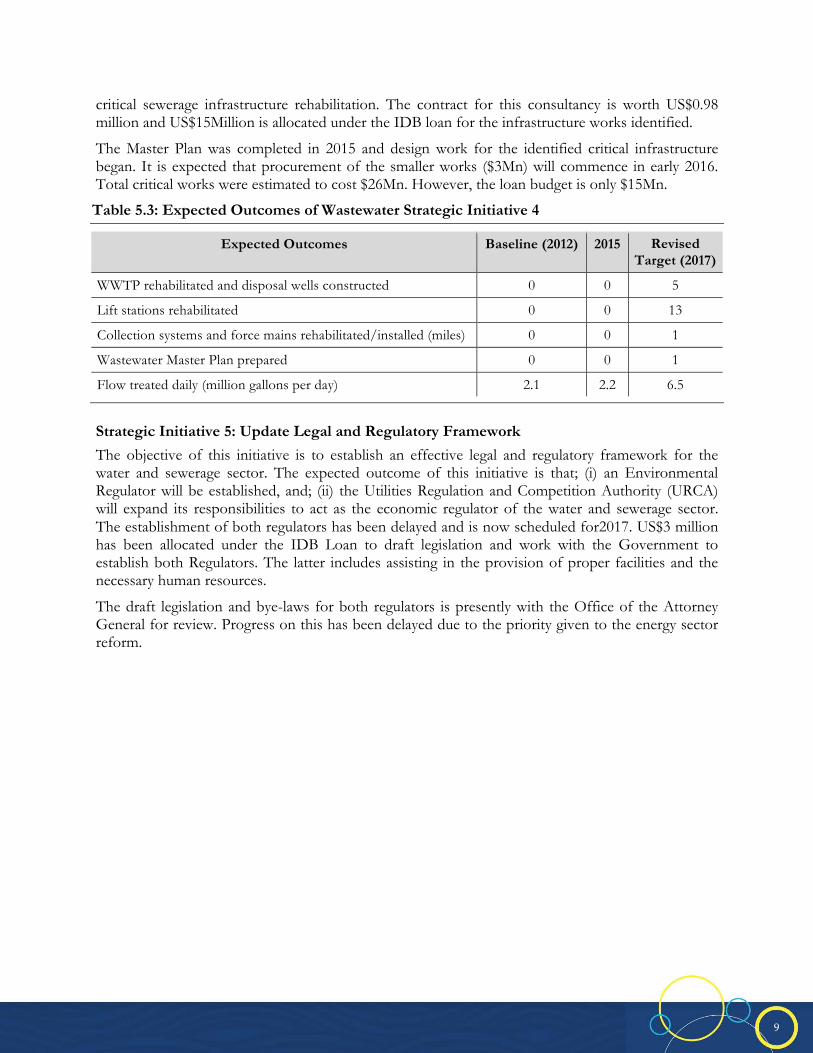
critical sewerage infrastructure rehabilitation. The contract for this consultancy is worth US$0.98 million and US$15Million is allocated under the IDB loan for the infrastructure works identified.
The Master Plan was completed in 2015 and design work for the identified critical infrastructure began. It is expected that procurement of the smaller works ($3Mn) will commence in early 2016. Total critical works were estimated to cost $26Mn. However, the loan budget is only $15Mn.
Table 5.3: Expected Outcomes of Wastewater Strategic Initiative 4
Expected Outcomes Baseline (2012) 2015 Revised Target (2017)
WWTP rehabilitated and disposal wells constructed 0 0 5
Lift stations rehabilitated 0 0 13
Collection systems and force mains rehabilitated/installed (miles) 0 0 1
Wastewater Master Plan prepared 0 0 1
Flow treated daily (million gallons per day) 2.1 2.2 6.5
Strategic Initiative 5: Update Legal and Regulatory Framework
The objective of this initiative is to establish an effective legal and regulatory framework for the water and sewerage sector. The expected outcome of this initiative is that; (i) an Environmental Regulator will be established, and; (ii) the Utilities Regulation and Competition Authority (URCA) will expand its responsibilities to act as the economic regulator of the water and sewerage sector. The establishment of both regulators has been delayed and is now scheduled for2017. US$3 million has been allocated under the IDB Loan to draft legislation and work with the Government to establish both Regulators. The latter includes assisting in the provision of proper facilities and the necessary human resources.
The draft legislation and bye-laws for both regulators is presently with the Office of the Attorney General for review. Progress on this has been delayed due to the priority given to the energy sector reform.

10
10
6 WSC’s Performance in 2015 There have been several improvements in WSC’s 2015 performance, of which the most notable was the reduction in our Non-Revenue Water (NRW). This trend is expected to continue in future years thanks to the strategic initiative to reduce NRW in New Providence.
Despite these improvements, we continued to face challenges that affected our operational and financial performance. Staffing costs increased and the tariffs remain below efficient cost recovery levels. Table 6.1 summarizes the key operating statistics that capture the changes in our performance during the last three years.
Table 6.1: WSC’s Key Operating Statistics Performance (2013-2015)
Indicator Units 2013 2014 2015 Performance Rating
Operational Indicators
NRW (Volume)* IG/connection/day 141 108 85 1
NRW (%) % 52 42 37 3
Collection Rate % 95 100 102 4
Staff Efficiency Employees per 1,000 customers10
7.3 7.4 7.4 1
Financial Indicators
Average Tariff B$/’000 IG 13.72 13.02 13.06 2
Average OPEX B$/’000 IG 24.82 21.58 20.05 1
Operating cost recovery % 58 64 68 1
EBITDA Margin % -72 -56 -46 1
Net Income (Loss) B$ millions (14.5) (2.0) (12.2) 1
Annual Capital Expenditure11 B$ millions 30.9 18.0 15.4 2
Operating Subsidies B$ millions 29.9 40.0 24.7 1
Capital Subsidies B$ millions 5.6 1.8 0.5
Note: 1 denotes lowest rating, 4 denotes highest rating.
*Calculated as the volume of NRW in New Providence (as estimated by Miya-Veritec) and the volume of NRW in Family Islands, divided by the total number of customers in WSC’s service area.
10 This includes contract employees.
11 This represents the value of capital projects which began and ended during the year (referred to as additions in our PPE schedule) and multi-year projects which were completed this year (referred to as transfers in our PPE schedule). Includes B$10.4 million worth of new additions and B$5.0 million worth of transfers (works that were completed in 2015). Excludes the B$16.6 million worth of works started in 2015 but still in progress at the end of 2015.

11
11
6.1 Coverage WSC is the largest service provider in the sector in The Bahamas. We provide water service to 15 islands and sewerage service in two islands (New Providence and Abaco). Our water coverage decreased from 58 percent in 2013 to 56 percent in 2015. Sewer coverage remained at 13 percent (see Figure 6.1).12
Figure 6.1: Water and Sewerage: Customers and Coverage (2011-2015)
The decline in water coverage was the result of the loss of almost 400 water customers (driven by a decline in residential customers in New Providence), as well as an increase in the number of households in WSC’s service area. The decline in New Providence is mainly a result of the NRW reduction initiative where accounts that have had no consumption for more than one year, are targeted for disconnection as they can contribute to water losses. Over 1,500 connections were disconnected during 2015 under this activity.
The number of sewer customers increased by just over 200 (see Figure 6.2). 12 Coverage (for water and sewerage) was calculated using the number of our active residential customers reported in each year,
divided by the number of household in our service area as presented by the Department of Statistics of The Bahamas (DOS). 2010 was the only year for which the DOS provided historic data on the number of households in our service area. Thus, we use an estimated number of households in our service area in the other years to determine coverage.
57% 58% 58% 57% 56%
52% 53% 52% 51% 50%
81% 82% 82% 82% 81%
40%
60%
80%
100%
2011 2012 2013 2014 2015
Family Islands
WSC
New Providence
Water Coverage
13% 13% 13% 13% 13%
16% 16% 16% 16% 16%
4% 4% 4% 4% 4%
0%
5%
10%
15%
20%
2011 2012 2013 2014 2015
Sewer Coverage
Family Islands
New Providence
WSC

12
12
Figure 6.2: WSC’s Water and Sewerage Customers (2011-2015)
WSC provides service to New Providence and 14 Family Islands (see Table 6.2). Four of the 14 Family Islands receive water via water tanker13 services either exclusively or in certain areas of the island.
Table 6.2: Active Connections by Region (2011-2015)
As a result of non-revenue water (NRW) reduction, total water supplied decreased by 338 million imperial gallons (6 percent) from 2014. About three quarters of the water (3.6 billion imperial gallons) was supplied using reverse osmosis, and the remaining quarter was supplied using wells (groundwater) as shown in Table 6.3.
13 Tanker services provided in Acklins, Cat Island, Long Island and South Andros
50.3 51.6 52.0 52.0 51.6
5.8 5.9 6.0 6.0 5.9
57.4 58.9 59.4 59.5 59.0
45
50
55
60
65
2011 2012 2013 2014 2015
Wat
er C
usto
mer
s ('0
00) Non-residential Customers
Residential Customers
Total Water CustomersGovernment Customers
11.6 11.9 12.1 12.3 12.5
- 2 4 6 8
10 12 14
2011 2012 2013 2014 2015
Sew
erag
e Cus
tom
ers
('000
)
Region Water Sewerage
2011 2015 2011 2015
New Providence 41,476 42,062 11,044 11,858
Family Islands 15,693 16,939 603 645
Total 57,439 59,001 11,647 12,503
13
13
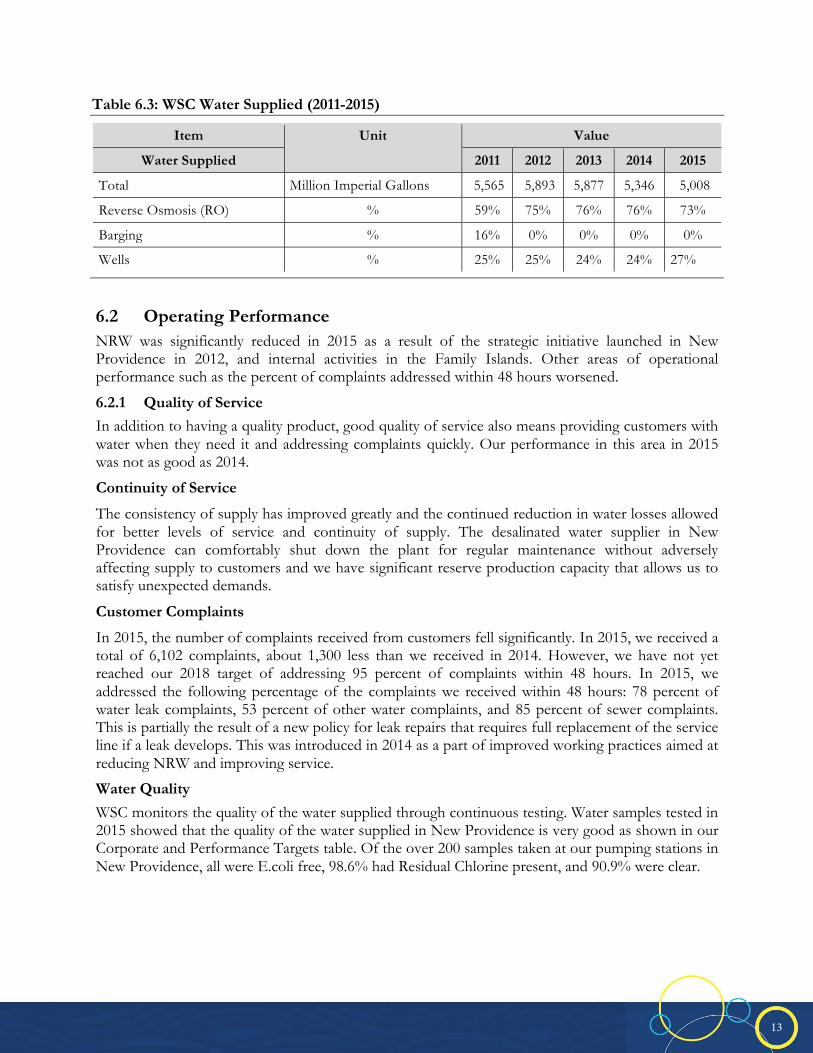
Table 6.3: WSC Water Supplied (2011-2015)
Item Unit Value
Water Supplied 2011 2012 2013 2014 2015
Total Million Imperial Gallons 5,565 5,893 5,877 5,346 5,008
Reverse Osmosis (RO) % 59% 75% 76% 76% 73%
Barging % 16% 0% 0% 0% 0%
Wells % 25% 25% 24% 24% 27%
6.2 Operating Performance NRW was significantly reduced in 2015 as a result of the strategic initiative launched in New Providence in 2012, and internal activities in the Family Islands. Other areas of operational performance such as the percent of complaints addressed within 48 hours worsened.
6.2.1 Quality of Service
In addition to having a quality product, good quality of service also means providing customers with water when they need it and addressing complaints quickly. Our performance in this area in 2015 was not as good as 2014.
Continuity of Service
The consistency of supply has improved greatly and the continued reduction in water losses allowed for better levels of service and continuity of supply. The desalinated water supplier in New Providence can comfortably shut down the plant for regular maintenance without adversely affecting supply to customers and we have significant reserve production capacity that allows us to satisfy unexpected demands.
Customer Complaints
In 2015, the number of complaints received from customers fell significantly. In 2015, we received a total of 6,102 complaints, about 1,300 less than we received in 2014. However, we have not yet reached our 2018 target of addressing 95 percent of complaints within 48 hours. In 2015, we addressed the following percentage of the complaints we received within 48 hours: 78 percent of water leak complaints, 53 percent of other water complaints, and 85 percent of sewer complaints. This is partially the result of a new policy for leak repairs that requires full replacement of the service line if a leak develops. This was introduced in 2014 as a part of improved working practices aimed at reducing NRW and improving service.
Water Quality
WSC monitors the quality of the water supplied through continuous testing. Water samples tested in 2015 showed that the quality of the water supplied in New Providence is very good as shown in our Corporate and Performance Targets table. Of the over 200 samples taken at our pumping stations in New Providence, all were E.coli free, 98.6% had Residual Chlorine present, and 90.9% were clear.

14
14
Table 6.4: Results of Water Samples Tested in New Providence (2015)
Water Quality Indicator Definition Calculating
Formula %
Compliance
Escherichia Coli (E. coli)
Bacteria
These bacteria are specific inhabitants of the animal or human gut and are indicators of possible contamination with harmful bacteria. Because they occur in larger numbers and survive longer than many harmful bacteria, they are good indicators of quality. The presence of these bacteria in water is an indication of contamination by pollution such as sewage. They must be absent from any drinking water sample. Any detection must be investigated as a matter of urgency as their presence in drinking water supplies could cause intestinal infections, dysentery, hepatitis, typhoid fever, cholera and other illnesses.
# of complying samples/total # of samples
taken (x100) 100
Residual Chlorine
(Disinfection)
When chlorine is added to water to kill bacteria, some of it is used up in the process. Some remains ‘free chlorine’ to kill microorganisms, thus ensuring that the water remains safe as it passes through the system to your home.
# of complying samples/total # of samples
taken (x100) 98.6
Appearance Water should be clear and bright, but may occasionally show a slight reddish or yellowish tint caused by natural organic matter of the water, or by iron from old cast-iron mains.
# of complying samples/total # of samples
taken (x100) 90.9
Chloride (salinity)
Chloride comes from the rocks through which the water has passed. It is not harmful to health. In the Bahamas, its presence in groundwater is influenced by seawater intrusion. The aesthetic objective for chloride is 250 mg/l. At concentrations above 250 mg/l, chloride may impart an undesirable “salty” taste to water.
Simple average salinity based on samples taken
throughout the year 291mg/L
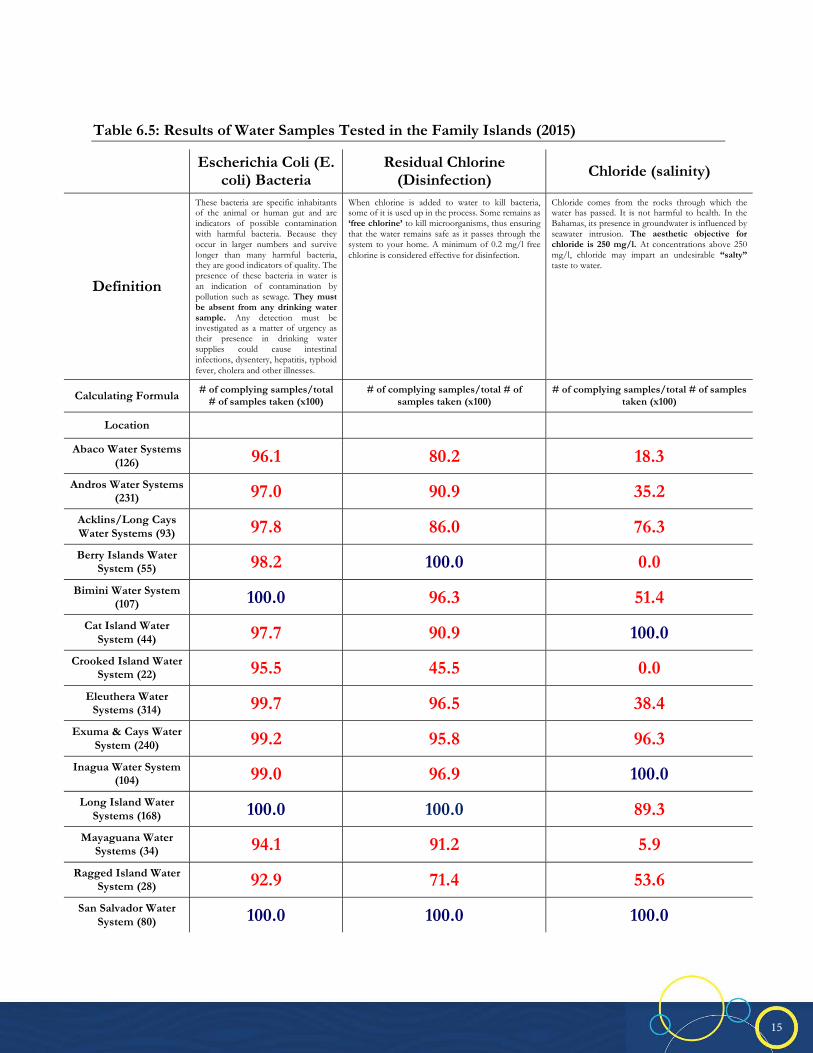
Operationally, during the Year 2015, the Water Quality Laboratory executed 145 sampling and analytical jobs consisting of 1,646 samples collected and 52,672 analyses performed for the Family Islands. Overall, Family Island water quality compliance is 98.5% for E. Coli bacteria; 93.1% for Residual Chlorine (> 0.2 mg/l) present at time of sampling; and 59.4% for samples meeting the objective of less than 250 mg/l for Chloride (salinity). This must be improved going forward. Salinity levels in several areas are expected to see improvements with the introduction of desalinated water supplies in late 2015 (ie Mayaguana, Simms-Long Island) and those targeted for 2016 (ie Crooked Island and Acklins).
15
15
Table 6.5: Results of Water Samples Tested in the Family Islands (2015)
Escherichia Coli (E. coli) Bacteria
Residual Chlorine (Disinfection) Chloride (salinity)
Definition
These bacteria are specific inhabitants of the animal or human gut and are indicators of possible contamination with harmful bacteria. Because they occur in larger numbers and survive longer than many harmful bacteria, they are good indicators of quality. The presence of these bacteria in water is an indication of contamination by pollution such as sewage. They must be absent from any drinking water sample. Any detection must be investigated as a matter of urgency as their presence in drinking water supplies could cause intestinal infections, dysentery, hepatitis, typhoid fever, cholera and other illnesses.
When chlorine is added to water to kill bacteria, some of it is used up in the process. Some remains as ‘free chlorine’ to kill microorganisms, thus ensuring that the water remains safe as it passes through the system to your home. A minimum of 0.2 mg/l free chlorine is considered effective for disinfection.
Chloride comes from the rocks through which the water has passed. It is not harmful to health. In the Bahamas, its presence in groundwater is influenced by seawater intrusion. The aesthetic objective for chloride is 250 mg/l. At concentrations above 250 mg/l, chloride may impart an undesirable “salty” taste to water.
Calculating Formula # of complying samples/total # of samples taken (x100)
# of complying samples/total # of samples taken (x100)
# of complying samples/total # of samples taken (x100)
Location Abaco Water Systems
(126) 96.1 80.2 18.3
Andros Water Systems (231) 97.0 90.9 35.2
Acklins/Long Cays Water Systems (93) 97.8 86.0 76.3
Berry Islands Water System (55) 98.2 100.0 0.0
Bimini Water System (107) 100.0 96.3 51.4
Cat Island Water System (44) 97.7 90.9 100.0
Crooked Island Water System (22) 95.5 45.5 0.0
Eleuthera Water Systems (314) 99.7 96.5 38.4
Exuma & Cays Water System (240) 99.2 95.8 96.3
Inagua Water System (104) 99.0 96.9 100.0
Long Island Water Systems (168) 100.0 100.0 89.3
Mayaguana Water Systems (34) 94.1 91.2 5.9
Ragged Island Water System (28) 92.9 71.4 53.6
San Salvador Water System (80) 100.0 100.0 100.0

16
16
6.2.2 Operational Efficiency
2015 was an excellent year for operational efficiency as NRW decreased by over 4 million imperial gallons per day compared to 2012 (see Figure 6.3). Despite this important improvement in our operating performance, other aspects of our operating performance, such as our staff efficiency continue to require improvements.
Figure 6.3: Non-Revenue Water—Million Imperial Gallons per Day (2011-2015)
7.1 7.2 7.6 8.5 8.4
8.5 9.1 8.3 6.2 5.0
15.6 16.2 16.0 14.6 13.5
-
5.0
10.0
15.0
20.0
2011 2012 2013 2014 2015
MIll
ion
impe
rial
gallo
ns p
er d
ay Water Supplied
NRW
Water Sold
6.6 6.9 6.4 4.3
2.9
1.9 2.2 1.9
1.9
2.2
8.5 9.1
8.3
6.2 5.0
-
2.0
4.0
6.0
8.0
10.0
2011 2012 2013 2014 2015
NR
W (M
IG/d
ay)
Total (WSC)Family IslandsNewProvidence
55% 56%52%
42% 37%
58% 58%54%
41%
31%
46%51%
47% 46%
50%
20%
30%
40%
50%
60%
2011 2012 2013 2014 2015
NR
W/T
otal
Wat
er
Pro
duce
d
Family Islands
WSCNew Providence
17
17
Non-Revenue Water (NRW)
NRW is the difference in the amount of water supplied and the amount of water billed to consumers.14 High levels of NRW lead to the need to increase the amount of water produced/supplied and to higher operating expenses. To address the rise of NRW, WSC hired the firm MIYA in 2012 for a period of 10 years to reduce NRW in New Providence. This initiative has already resulted in over 2.5 billion gallons of water being saved, which in turn allowed a significant reduction in water production/supply while meeting increased demand. This reduction is an important achievement since NRW greatly affects our financial performance. NRW decreased from 9.1 million imperial gallons per day in 2012 (56 percent of water supplied) to 5 million imperial gallons per day (37 percent of water supplied) in 2015. Almost all of the reduction has occurred in New Providence but there has also been some internal success in the Family Islands most notably Waterford, South Eleuthera
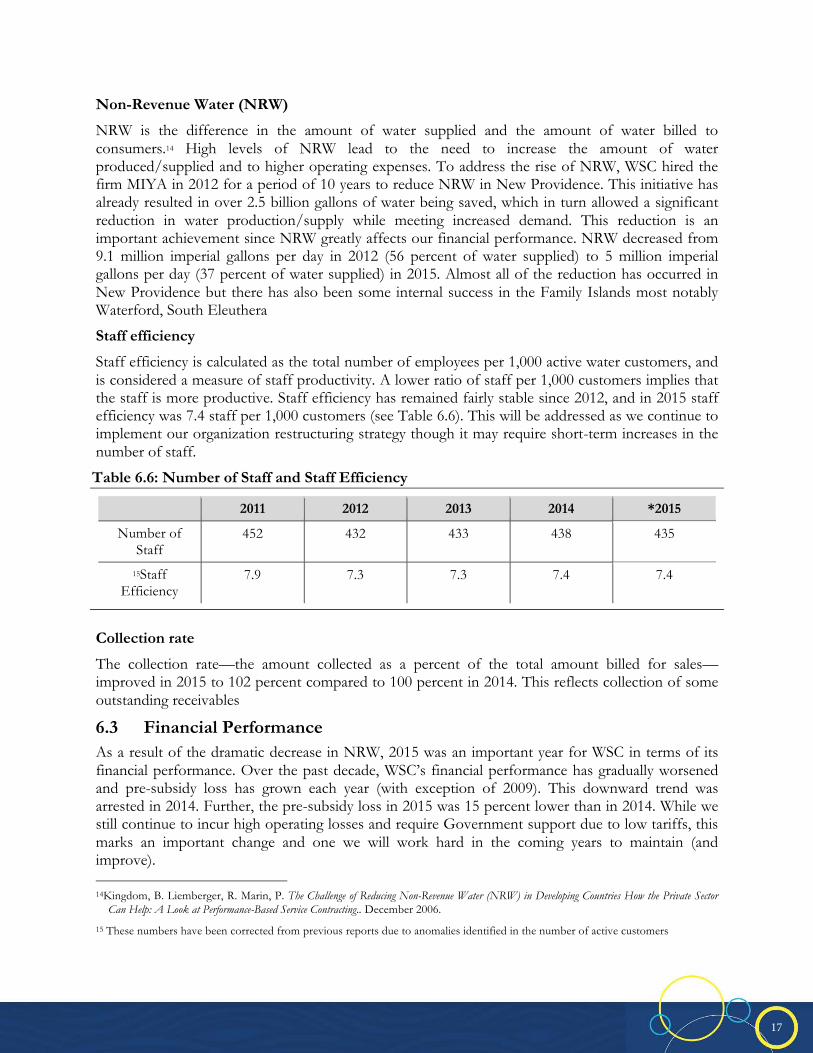
Staff efficiency
Staff efficiency is calculated as the total number of employees per 1,000 active water customers, and is considered a measure of staff productivity. A lower ratio of staff per 1,000 customers implies that the staff is more productive. Staff efficiency has remained fairly stable since 2012, and in 2015 staff efficiency was 7.4 staff per 1,000 customers (see Table 6.6). This will be addressed as we continue to implement our organization restructuring strategy though it may require short-term increases in the number of staff.
Table 6.6: Number of Staff and Staff Efficiency
2011 2012 2013 2014 *2015
Number of Staff
452 432 433 438 435
15Staff Efficiency
7.9 7.3 7.3 7.4 7.4
Collection rate
The collection rate—the amount collected as a percent of the total amount billed for sales—improved in 2015 to 102 percent compared to 100 percent in 2014. This reflects collection of some outstanding receivables
6.3 Financial Performance As a result of the dramatic decrease in NRW, 2015 was an important year for WSC in terms of its financial performance. Over the past decade, WSC’s financial performance has gradually worsened and pre-subsidy loss has grown each year (with exception of 2009). This downward trend was arrested in 2014. Further, the pre-subsidy loss in 2015 was 15 percent lower than in 2014. While we still continue to incur high operating losses and require Government support due to low tariffs, this marks an important change and one we will work hard in the coming years to maintain (and improve). 14Kingdom, B. Liemberger, R. Marin, P. The Challenge of Reducing Non-Revenue Water (NRW) in Developing Countries How the Private Sector
Can Help: A Look at Performance-Based Service Contracting.. December 2006.
15 These numbers have been corrected from previous reports due to anomalies identified in the number of active customers
18
18
However, WSC still continues to face tough challenges that negatively affect its financial performance. Tariffs are well below cost recovery levels and, as a result, the reform of the regulatory framework for water and sewerage sector remains very important. An effective regulatory framework will ensure that tariffs are set at a level that allows recovery of reasonable operating costs while ensuring efficient operations and good customer service.
6.3.1 The WSC’s Revenues, Operating Costs, and Cost Recovery
In 2015, operating losses decreased due to decreased operating costs. While tariffs only recovered 68 percent of operating costs in 2015, this was a great improvement over 2013 when only 58 percent of operating costs were recovered. For New Providence operating cost recovery was 82 percent in 2015 compared to 75 percent in 2014, and for Family Islands it remained effectively unchanged at 34 percent in 2015 compared to 35 percent in 2013. Despite the challenges, several important improvements were made in our financial performance. Notably, this is the third consecutive year that the average operating expenses per thousand imperial gallons sold was reduced, in large part, due to the reduction in NRW. This means that we purchased and produced less water while still meeting an increased demand.
WSC continued to rely heavily on subsidies, which only partially covered operating losses. We expect the strategic initiatives being implemented to improve our financial performance in the coming years by reducing NRW, increasing our customer base, and adjusting tariffs to better reflect the reasonable costs of providing service.
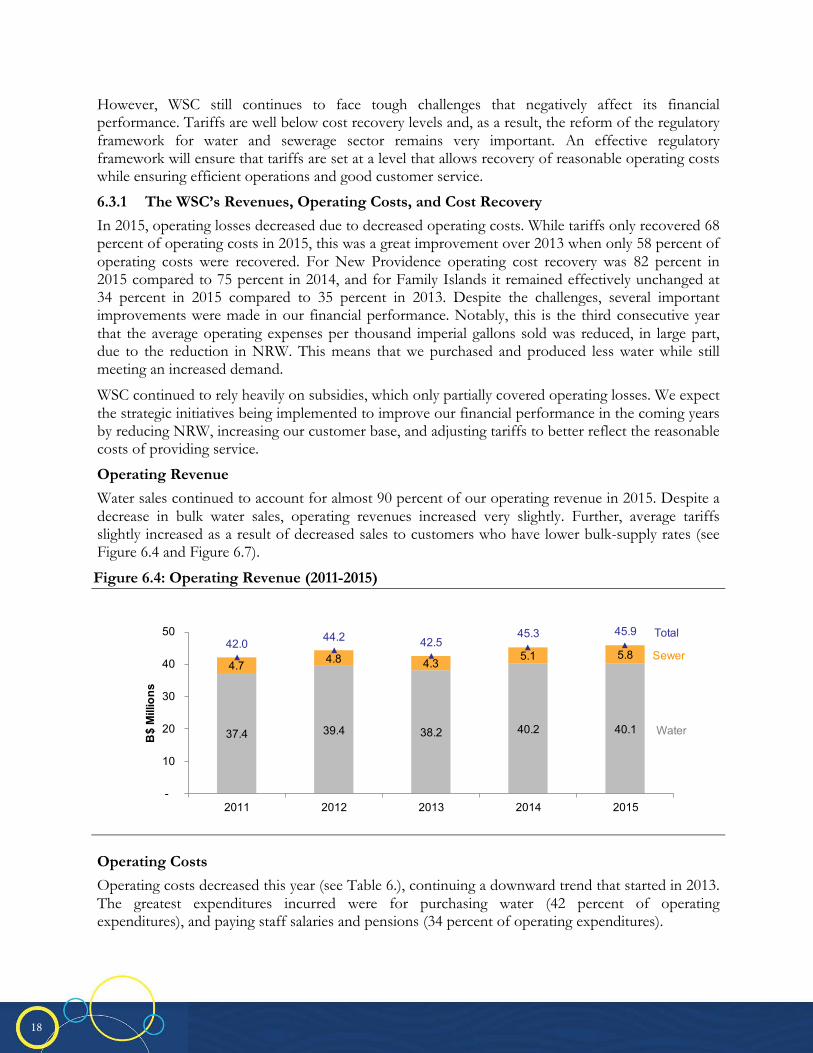
Operating Revenue
Water sales continued to account for almost 90 percent of our operating revenue in 2015. Despite a decrease in bulk water sales, operating revenues increased very slightly. Further, average tariffs slightly increased as a result of decreased sales to customers who have lower bulk-supply rates (see Figure 6.4 and Figure 6.7).
Figure 6.4: Operating Revenue (2011-2015)
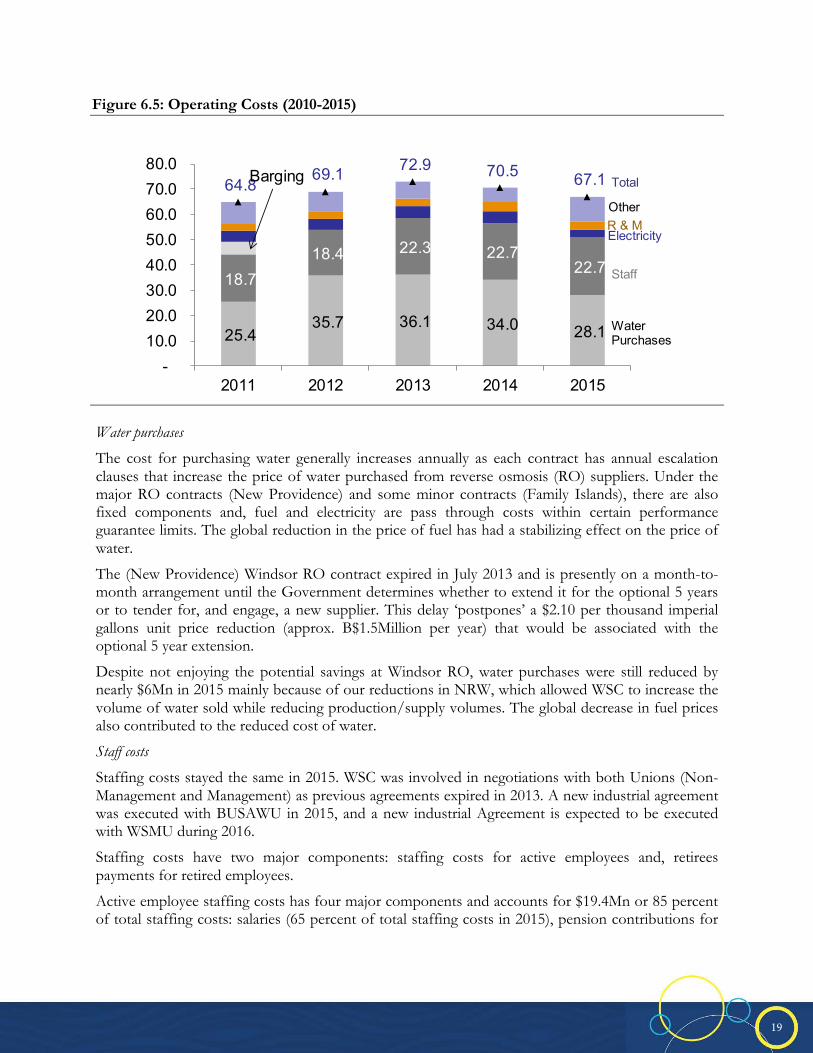
Operating Costs
Operating costs decreased this year (see Table 6.), continuing a downward trend that started in 2013. The greatest expenditures incurred were for purchasing water (42 percent of operating expenditures), and paying staff salaries and pensions (34 percent of operating expenditures).
37.4 39.4 38.2 40.2 40.1
4.7 4.8 4.35.1 5.8
42.0 44.2 42.545.3 45.9
-
10
20
30
40
50
2011 2012 2013 2014 2015
B$
Mill
ions
Total
Water
Sewer
19
19
Figure 6.5: Operating Costs (2010-2015)
Water purchases
The cost for purchasing water generally increases annually as each contract has annual escalation clauses that increase the price of water purchased from reverse osmosis (RO) suppliers. Under the major RO contracts (New Providence) and some minor contracts (Family Islands), there are also fixed components and, fuel and electricity are pass through costs within certain performance guarantee limits. The global reduction in the price of fuel has had a stabilizing effect on the price of water.
The (New Providence) Windsor RO contract expired in July 2013 and is presently on a month-to-month arrangement until the Government determines whether to extend it for the optional 5 years or to tender for, and engage, a new supplier. This delay ‘postpones’ a $2.10 per thousand imperial gallons unit price reduction (approx. B$1.5Million per year) that would be associated with the optional 5 year extension.
Despite not enjoying the potential savings at Windsor RO, water purchases were still reduced by nearly $6Mn in 2015 mainly because of our reductions in NRW, which allowed WSC to increase the volume of water sold while reducing production/supply volumes. The global decrease in fuel prices also contributed to the reduced cost of water.
Staff costs
Staffing costs stayed the same in 2015. WSC was involved in negotiations with both Unions (Non-Management and Management) as previous agreements expired in 2013. A new industrial agreement was executed with BUSAWU in 2015, and a new industrial Agreement is expected to be executed with WSMU during 2016.
Staffing costs have two major components: staffing costs for active employees and, retirees payments for retired employees.
Active employee staffing costs has four major components and accounts for $19.4Mn or 85 percent of total staffing costs: salaries (65 percent of total staffing costs in 2015), pension contributions for
25.4 35.7 36.1 34.0 28.1
18.7 18.4 22.3 22.7
22.7
64.8 69.1 72.9 70.5 67.1
- 10.0 20.0 30.0 40.0 50.0 60.0 70.0 80.0
2011 2012 2013 2014 2015
Barging
Water Purchases
Staff
ElectricityR & MOther
Total
20
20
active employees (10 percent of total staffing costs in 2015), medical insurance 8 percent of total staffing costs in 2015), and National Insurance (3 percent of total staffing costs in 2015).
Retired employee staffing costs accounts for $3.3Mn or 15 percent of total staffing costs
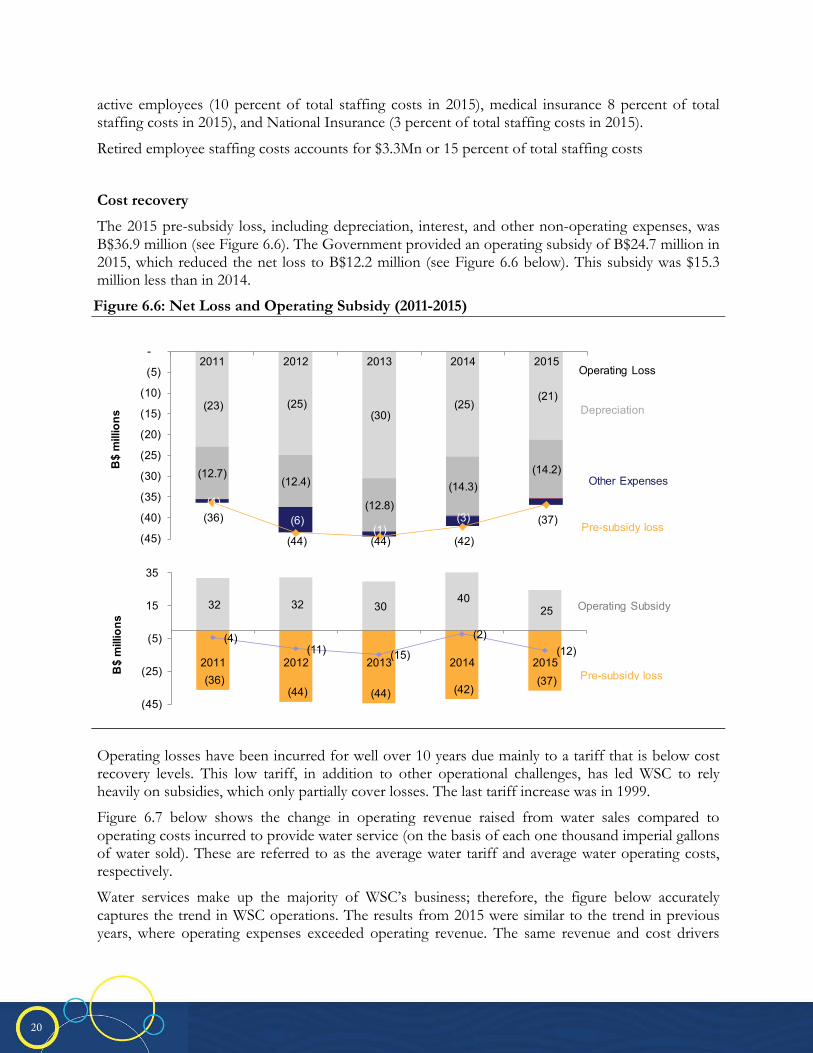
Cost recovery
The 2015 pre-subsidy loss, including depreciation, interest, and other non-operating expenses, was B$36.9 million (see Figure 6.6). The Government provided an operating subsidy of B$24.7 million in 2015, which reduced the net loss to B$12.2 million (see Figure 6.6 below). This subsidy was $15.3 million less than in 2014.
Figure 6.6: Net Loss and Operating Subsidy (2011-2015)
Operating losses have been incurred for well over 10 years due mainly to a tariff that is below cost recovery levels. This low tariff, in addition to other operational challenges, has led WSC to rely heavily on subsidies, which only partially cover losses. The last tariff increase was in 1999.
Figure 6.7 below shows the change in operating revenue raised from water sales compared to operating costs incurred to provide water service (on the basis of each one thousand imperial gallons of water sold). These are referred to as the average water tariff and average water operating costs, respectively.
Water services make up the majority of WSC’s business; therefore, the figure below accurately captures the trend in WSC operations. The results from 2015 were similar to the trend in previous years, where operating expenses exceeded operating revenue. The same revenue and cost drivers
(23) (25)(30)
(25)(21)
(12.7)(12.4)
(12.8)
(14.3)(14.2)
(1)
(6)(1)
(3)(36)
(44) (44) (42)
(37) (45)
(40)
(35)
(30)
(25)
(20)
(15)
(10)
(5)
-2011 2012 2013 2014 2015
B$
mill
ions
Other Expenses
Depreciation
Pre-subsidy loss
Operating Loss
(36)(44) (44) (42)
(37)
32 32 30 40
25
(4)(11) (15)
(2)(12)
(45)
(25)
(5)
15
35
2011 2012 2013 2014 2015
B$
mill
ions
Pre-subsidy loss
Operating Subsidy

21
21
discussed previously are responsible for the changes seen in the average water tariff and the average water operating costs. However, in 2015 average operating costs decreased.
In 2015, an average of B$13.06 per thousand imperial gallons of water sold was earned and operating expenses of B$20.05 per thousand imperial gallons of water sold was incurred. This means that, on average, WSC lost B$6.99 per thousand imperial gallons of water sold compared to $8.56 per thousand imperial gallons of water sold in 2014. This is an 18 percent improvement with respect to the efficient provision of water services to our customers
Figure 6.7: Average Water Tariff v. Average Water Operating Costs (2011-2015)
The operating cost recovery in 2015 was 68 percent and marks the second consecutive year that we have had an upward trend in our cost recovery (see Figure 6.8).
Figure 6.8: Operating Cost Recovery
14.49 15.1113.72 13.02 13.06
23.73
25.29 24.8221.58
20.05
$-
$5
$10
$15
$20
$25
$30
2011 2012 2013 2014 2015
B$/
'000
impe
rial g
allo
ns o
f w
ater
sol
d
Average Tariff v. Average OpexAvg. Opex
Avg. Tariff
65% 64%58%
64%68%
50%55%60%65%70%
2011 2012 2013 2014 2015
Operating Cost Recovery

22
22
6.3.2 Capital Expenditures
In 2015, capital expenditures amounted to B$32.0 million.16 93 percent of total capital expenditures were invested in New Providence. Figure 6.9 shows capital expenditures in the past five years, compared to subsidies that were received from the Government and applied to capital expenditures.
Figure 6.9: Capital Expenditures vs. Capital Subsidies (2011-2015)
The Mains Renewal programme in New Providence continued during the year with just under 8 miles of water mains installed. Our focus continues to be replacement of unlined iron mains to reduce the incidences of red water. Some of the areas included: Mackey Street, Culmersville, Claridge Road area, Miami Street, Key West Street, Masons Addition, Garden Hills No. 1, and various small projects. Work also continued on the Gladstone Road Wastewater Treatment Plant which is intended to serve Baha Mar Resort and surrounding areas
In the Family Islands, major improvement and expansion works were completed and commissioned in Mayaguana in conjunction with the road improvement project. The Mayaguana project included desalination plants for Betsy Bay, Pirates Well, and Abrahams Bay. Additionally, a desalination plant was commissioned in Simms, Long Island bringing significant quality improvements to residents.
In addition, investments were made in water service lines, sewer treatment plants, and sewer connections. B$16.6 million was also invested in capital works which were ongoing in 2015, but which were not completed in 2015. Some of these works are associated with the NRW reduction project.
1616 Includes B$10.4 million worth of new additions and B$5.0 million worth of transfers, and B$16.6 million worth of works in
progress that has yet to be completed.
21.024.1
40.136.9
32.0
23.0
0.85.6
1.8 0.505
1015202530354045
2011 2012 2013 2014 2015
B$
milli
ons
Capital Expenditures
Capital Subsidies
23
22
7 Audited Financial Statements [Insert Audited Financial Statements for 2012 at end of Annual Report.]
24
Independent Auditors’ Report 25
Statement of Financial Position 27
Statement of Comprehensive Loss 28
Statement of Comprehensive Loss – New Providence 29
Statement of Comprehensive Loss – Family Islands 30
Statement of Changes in Equity 31
Statement of Cash Flows 32
Notes to Financial Statements 33
Page
Table of ConTenTs
25
1
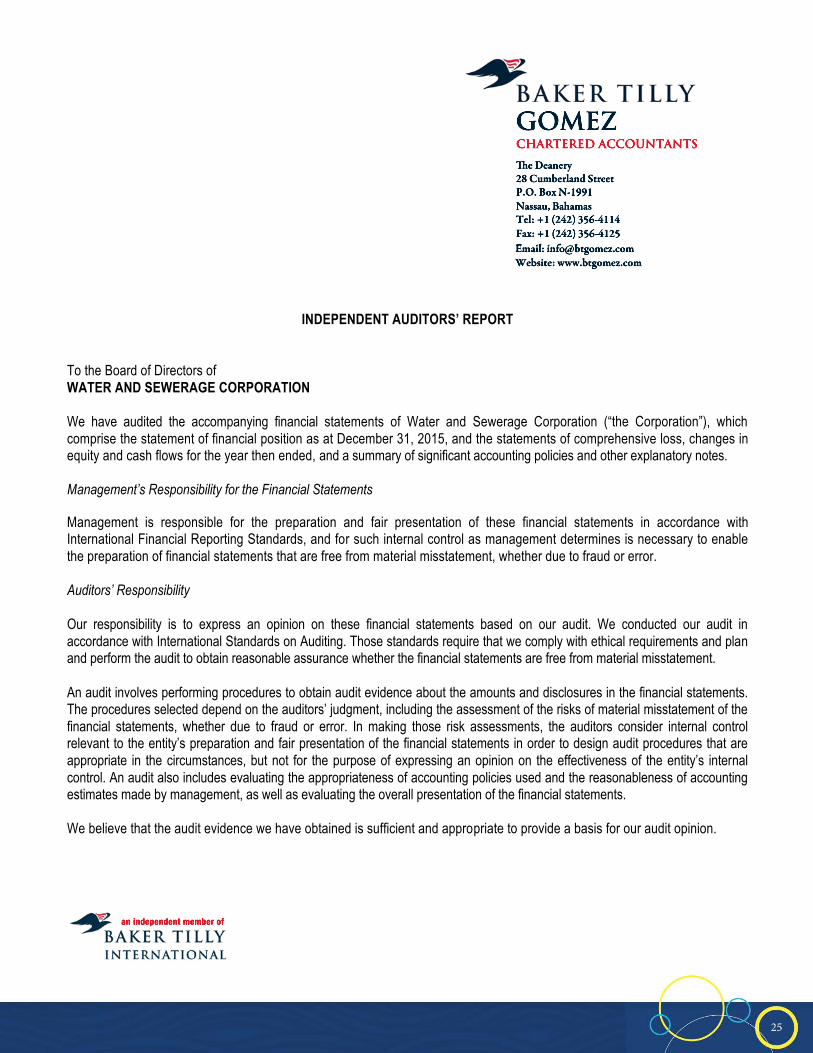
INDEPENDENT AUDITORS’ REPORT To the Board of Directors of WATER AND SEWERAGE CORPORATION We have audited the accompanying financial statements of Water and Sewerage Corporation (“the Corporation”), which comprise the statement of financial position as at December 31, 2015, and the statements of comprehensive loss, changes in equity and cash flows for the year then ended, and a summary of significant accounting policies and other explanatory notes. Management’s Responsibility for the Financial Statements Management is responsible for the preparation and fair presentation of these financial statements in accordance with International Financial Reporting Standards, and for such internal control as management determines is necessary to enable the preparation of financial statements that are free from material misstatement, whether due to fraud or error. Auditors’ Responsibility Our responsibility is to express an opinion on these financial statements based on our audit. We conducted our audit in accordance with International Standards on Auditing. Those standards require that we comply with ethical requirements and plan and perform the audit to obtain reasonable assurance whether the financial statements are free from material misstatement. An audit involves performing procedures to obtain audit evidence about the amounts and disclosures in the financial statements. The procedures selected depend on the auditors’ judgment, including the assessment of the risks of material misstatement of the financial statements, whether due to fraud or error. In making those risk assessments, the auditors consider internal control relevant to the entity’s preparation and fair presentation of the financial statements in order to design audit procedures that are appropriate in the circumstances, but not for the purpose of expressing an opinion on the effectiveness of the entity’s internal control. An audit also includes evaluating the appropriateness of accounting policies used and the reasonableness of accounting estimates made by management, as well as evaluating the overall presentation of the financial statements. We believe that the audit evidence we have obtained is sufficient and appropriate to provide a basis for our audit opinion.
GOMEZCHARTERED ACCOUNTANTS
e Deanery28 Cumberland StreetP.O. Box N-1991Nassau, BahamasTel: +1 (242) 356-4114Fax: +1 (242) 356-4125Email: [email protected]: [email protected]: www.btgomez.com
an independent member of

26
INDEPENDENT AUDITORS’ REPORT (continued)
Opinion In our opinion, the financial statements present fairly, in all material respects, the financial position of the Corporation as at December 31, 2015, and its financial performance and cash flows for the year then ended in accordance with International Financial Reporting Standards. Emphasis of Matter Without qualifying our report, we draw attention to Note 13 of the financial statements which states that as at December 31, 2015, the Corporation’s current liabilities exceeded its current assets by $26,424,745 (2014: $12,260,631) and it had an accumulated deficit of $147,048,897 (2014: $134,391,914). These conditions, along with other matters as set forth in Note 13, indicate the existence of material uncertainties which may cast significant doubt about the Corporation’s ability to continue as a going concern without the continued financial support of the Government of The Bahamas. CHARTERED ACCOUNTANTS June 30, 2016 Nassau, Bahamas
2
27
3
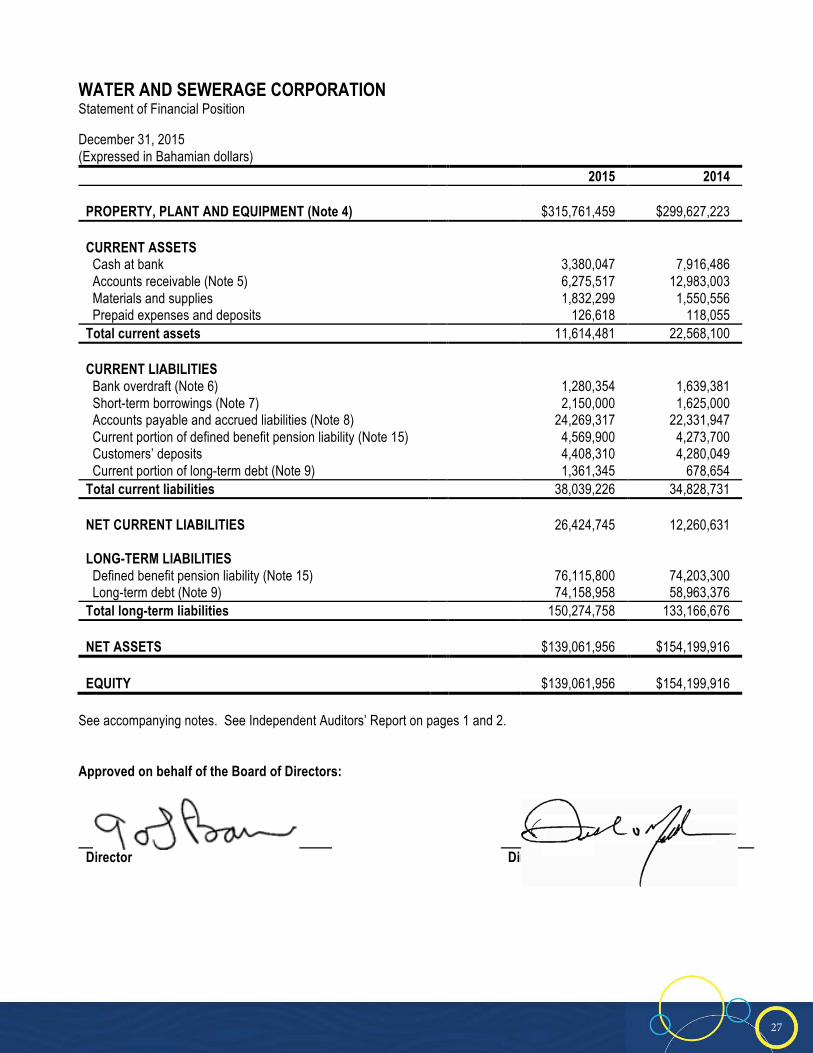
WATER AND SEWERAGE CORPORATION Statement of Financial Position December 31, 2015 (Expressed in Bahamian dollars)
2015 2014 PROPERTY, PLANT AND EQUIPMENT (Note 4) $315,761,459 $299,627,223 CURRENT ASSETS Cash at bank 3,380,047 7,916,486 Accounts receivable (Note 5) 6,275,517 12,983,003 Materials and supplies 1,832,299 1,550,556 Prepaid expenses and deposits 126,618 118,055 Total current assets 11,614,481 22,568,100 CURRENT LIABILITIES Bank overdraft (Note 6) 1,280,354 1,639,381 Short-term borrowings (Note 7) 2,150,000 1,625,000 Accounts payable and accrued liabilities (Note 8) 24,269,317 22,331,947 Current portion of defined benefit pension liability (Note 15) 4,569,900 4,273,700 Customers’ deposits 4,408,310 4,280,049 Current portion of long-term debt (Note 9) 1,361,345 678,654 Total current liabilities 38,039,226 34,828,731 NET CURRENT LIABILITIES 26,424,745 12,260,631 LONG-TERM LIABILITIES
Defined benefit pension liability (Note 15) 76,115,800 74,203,300 Long-term debt (Note 9) 74,158,958 58,963,376 Total long-term liabilities 150,274,758 133,166,676 NET ASSETS $139,061,956 $154,199,916 EQUITY $139,061,956 $154,199,916
See accompanying notes. See Independent Auditors’ Report on pages 1 and 2. Approved on behalf of the Board of Directors:
Director Director

28
4
WATER AND SEWERAGE CORPORATION Statement of Comprehensive Loss For the year ended December 31, 2015
2015 2014 OPERATING REVENUE
Water $ 40,114,452 $40,177,645 Sewerage 5,814,224 5,109,088 45,928,676 45,286,733 OPERATING EXPENSES Water (Note 11) 43,515,710 47,535,143 Sewerage (Note 11) 3,863,614 2,773,916 General and administrative (Note 11) 19,688,366 20,174,288 67,067,690 70,483,347 Loss from operations before depreciation (21,139,014) (25,196,614) Depreciation (Notes 4, 12) (14,160,249) (14,275,979) OPERATING LOSS (35,299,263) (39,472,593) Other income (expenses) Amortization of deferred income/valuation adjustment 3,889,757 3,828,707 Other income 1,824 2,147 Finance charges (Note 14) (4,095,901) (3,940,001) Miscellaneous (loss) (Note 21) (1,266,550) (2,402,637) Net foreign exchange loss (62,917) (34,868) (1,533,787) (2,546,652) Net loss before government subsidy (36,833,050) (42,019,245) Government subsidy (Note 13) 24,684,167 39,989,012 NET OPERATING LOSS (12,148,883) (2,030,233) Other comprehensive (loss) income Item that will not be reclassified subsequently to profit or loss Re-measurement (loss) gain on defined benefit plan (Note 15) (508,100) 486,900
TOTAL COMPREHENSIVE LOSS FOR THE YEAR $(12,656,983) $(1,543,333) See accompanying notes. See Independent Auditors’ Report on pages 1 and 2.
29
5
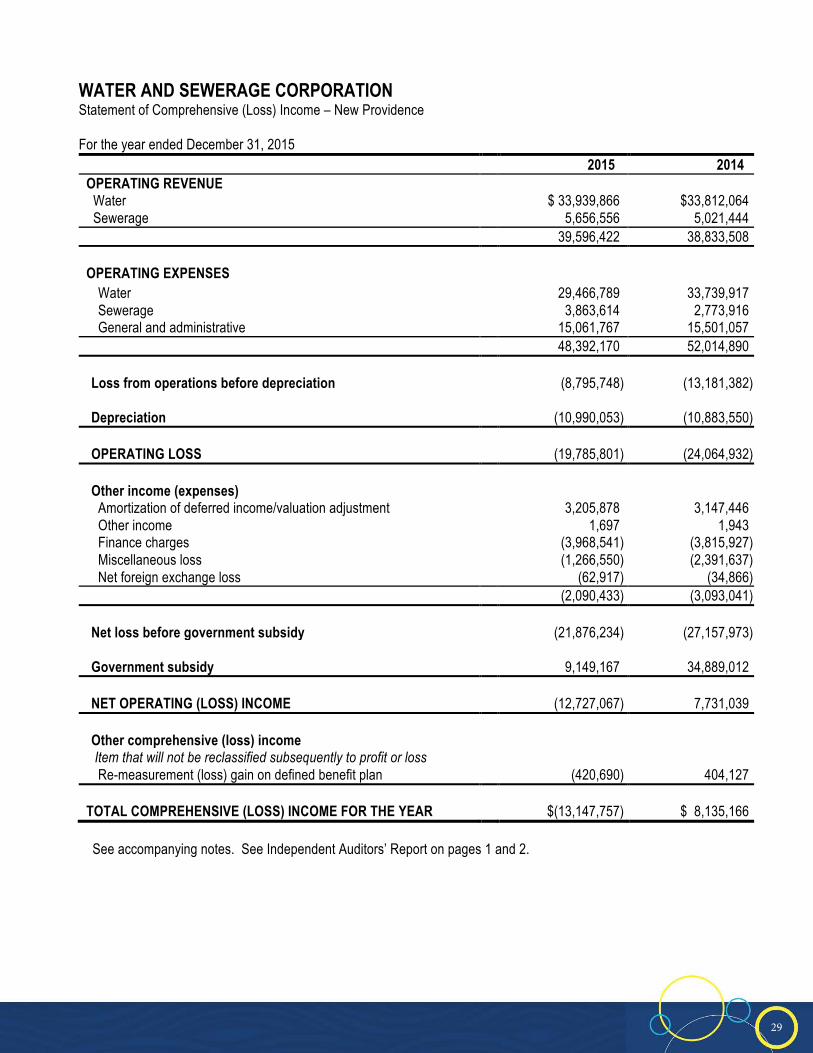
WATER AND SEWERAGE CORPORATION Statement of Comprehensive (Loss) Income – New Providence For the year ended December 31, 2015
2015 2014 OPERATING REVENUE Water $ 33,939,866 $33,812,064 Sewerage 5,656,556 5,021,444 39,596,422 38,833,508 OPERATING EXPENSES Water 29,466,789 33,739,917 Sewerage 3,863,614 2,773,916 General and administrative 15,061,767 15,501,057 48,392,170 52,014,890 Loss from operations before depreciation (8,795,748) (13,181,382) Depreciation (10,990,053) (10,883,550) OPERATING LOSS (19,785,801) (24,064,932) Other income (expenses) Amortization of deferred income/valuation adjustment 3,205,878 3,147,446 Other income 1,697 1,943 Finance charges (3,968,541) (3,815,927) Miscellaneous loss (1,266,550) (2,391,637) Net foreign exchange loss (62,917) (34,866) (2,090,433) (3,093,041) Net loss before government subsidy (21,876,234) (27,157,973) Government subsidy 9,149,167 34,889,012 NET OPERATING (LOSS) INCOME (12,727,067) 7,731,039 Other comprehensive (loss) income Item that will not be reclassified subsequently to profit or loss Re-measurement (loss) gain on defined benefit plan (420,690) 404,127
TOTAL COMPREHENSIVE (LOSS) INCOME FOR THE YEAR $(13,147,757) $ 8,135,166 See accompanying notes. See Independent Auditors’ Report on pages 1 and 2.
30
6
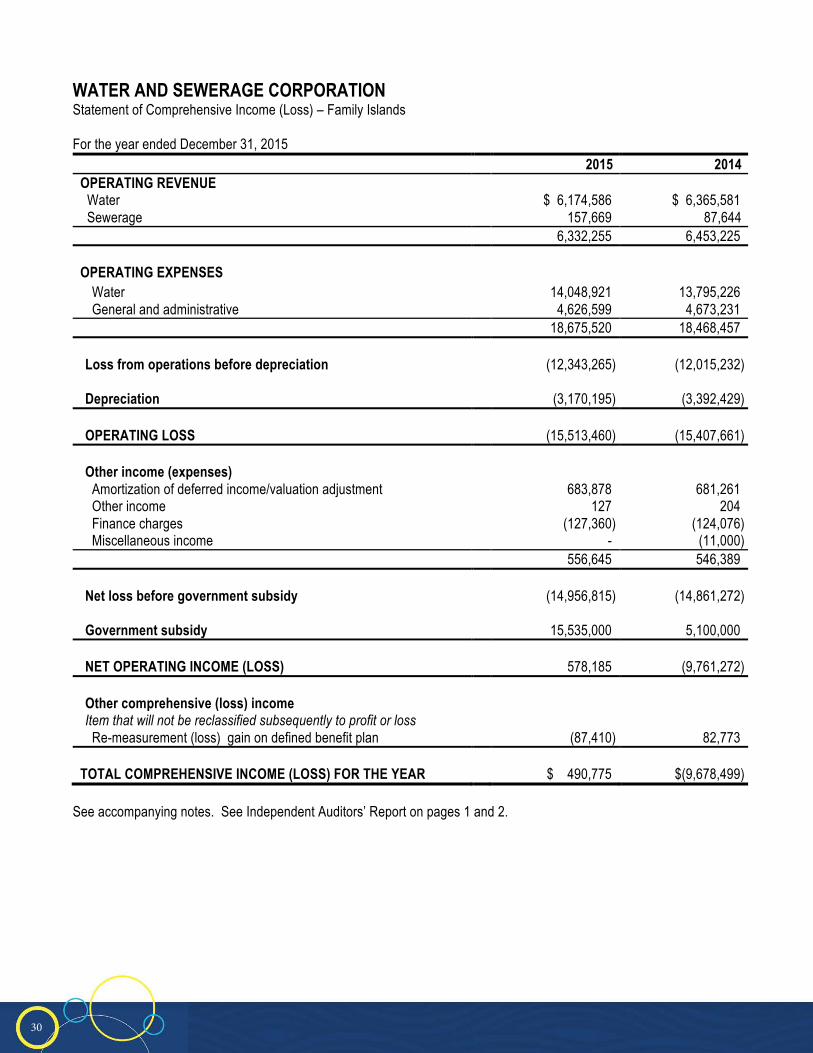
WATER AND SEWERAGE CORPORATION Statement of Comprehensive Income (Loss) – Family Islands For the year ended December 31, 2015
2015 2014 OPERATING REVENUE Water $ 6,174,586 $ 6,365,581 Sewerage 157,669 87,644 6,332,255 6,453,225 OPERATING EXPENSES Water 14,048,921 13,795,226 General and administrative 4,626,599 4,673,231 18,675,520 18,468,457 Loss from operations before depreciation (12,343,265) (12,015,232) Depreciation (3,170,195) (3,392,429) OPERATING LOSS (15,513,460) (15,407,661) Other income (expenses) Amortization of deferred income/valuation adjustment 683,878 681,261 Other income 127 204 Finance charges (127,360) (124,076) Miscellaneous income - (11,000) 556,645 546,389 Net loss before government subsidy (14,956,815) (14,861,272) Government subsidy 15,535,000 5,100,000 NET OPERATING INCOME (LOSS) 578,185 (9,761,272) Other comprehensive (loss) income Item that will not be reclassified subsequently to profit or loss Re-measurement (loss) gain on defined benefit plan (87,410) 82,773
TOTAL COMPREHENSIVE INCOME (LOSS) FOR THE YEAR $ 490,775 $(9,678,499) See accompanying notes. See Independent Auditors’ Report on pages 1 and 2.

31
7
WATER AND SEWERAGE CORPORATION Statement of Changes in Equity For the year ended December 31, 2015
Equity Contributions
Accumulated Deficit
Valuation Adjustment
Deferred Income
Total Equity
Balance at December 31, 2013 $ 170,939,443 $ (132,848,581) $ 43,891,642 $ 70,457,449 $ 152,439,953 Contributions (Note 10) 1,786,308 - - - 1,786,308 Distributions (Note 10) (1,734,800) - - - (1,734,800) Net operating loss - (2,030,233) - - (2,030,233) Other comprehensive income for the year - 486,900 - - 486,900 Contribution to projects completed during the year - - - 174,522 174,522 Third-party infrastructure - - - 6,905,973 6,905,973 Amortization of deferred income/valuation adjustment - - (1,416,831) (2,411,876) (3,828,707)
Balance at December 31, 2014 $ 170,990,951 $ (134,391,914) $ 42,474,811 $ 75,126,068 $ 154,199,916 Contributions (Note 10) 523,750 - - - 523,750 Distributions (Note 10) (1,251,692) - - - (1,251,692) Net operating loss - (12,148,883) - - (12,148,883) Other comprehensive loss for the year - (508,100) - - (508,100) Contribution to projects completed during the year - - - 158,056 158,056 Third-party infrastructure - - - 1,978,666 1,978,666 Amortization of deferred income/valuation adjustment - - (1,416,834) (2,472,923) (3,889,757)
Balance at December 31, 2015 $170,263,009 $(147,048,897) $41,057,977 $74,789,867 $139,061,956
32
8
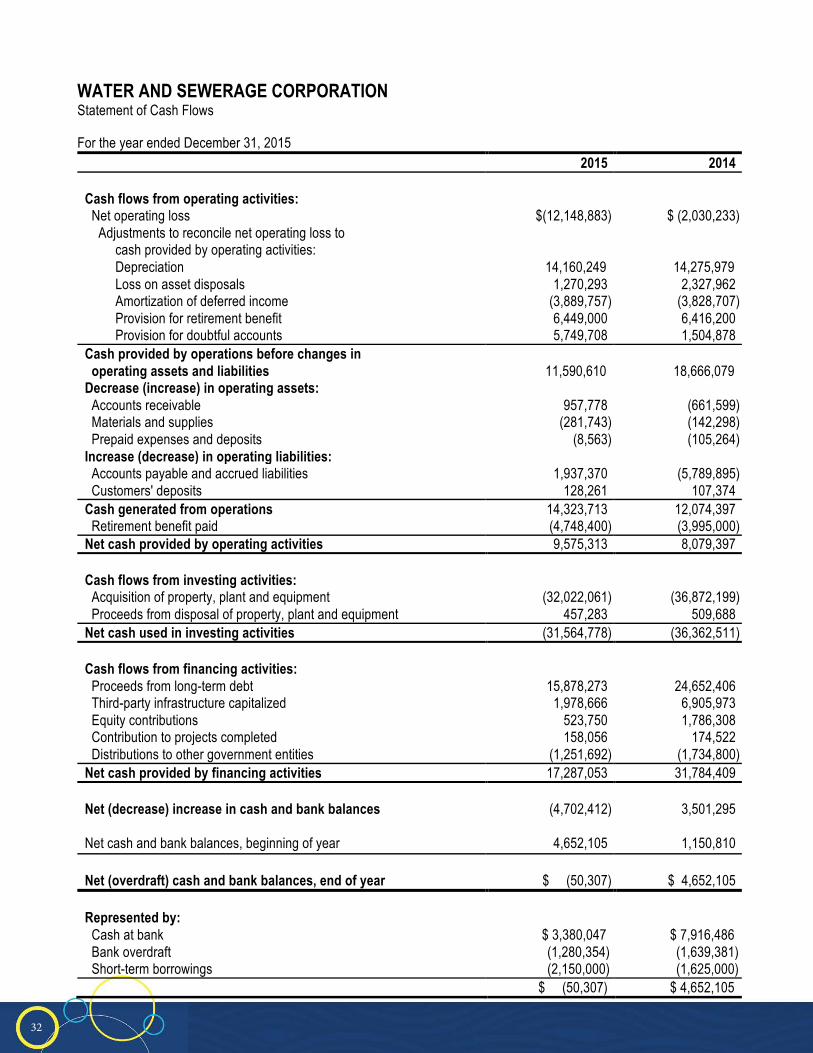
WATER AND SEWERAGE CORPORATION Statement of Cash Flows For the year ended December 31, 2015
2015 2014 Cash flows from operating activities: Net operating loss $(12,148,883) $ (2,030,233) Adjustments to reconcile net operating loss to cash provided by operating activities: Depreciation 14,160,249 14,275,979 Loss on asset disposals 1,270,293 2,327,962 Amortization of deferred income (3,889,757) (3,828,707) Provision for retirement benefit 6,449,000 6,416,200 Provision for doubtful accounts 5,749,708 1,504,878 Cash provided by operations before changes in operating assets and liabilities
11,590,610
18,666,079
Decrease (increase) in operating assets: Accounts receivable 957,778 (661,599) Materials and supplies (281,743) (142,298) Prepaid expenses and deposits (8,563) (105,264) Increase (decrease) in operating liabilities: Accounts payable and accrued liabilities 1,937,370 (5,789,895) Customers' deposits 128,261 107,374 Cash generated from operations 14,323,713 12,074,397 Retirement benefit paid (4,748,400) (3,995,000) Net cash provided by operating activities 9,575,313 8,079,397
Cash flows from investing activities: Acquisition of property, plant and equipment (32,022,061) (36,872,199) Proceeds from disposal of property, plant and equipment 457,283 509,688 Net cash used in investing activities (31,564,778) (36,362,511) Cash flows from financing activities: Proceeds from long-term debt 15,878,273 24,652,406 Third-party infrastructure capitalized 1,978,666 6,905,973 Equity contributions 523,750 1,786,308 Contribution to projects completed 158,056 174,522 Distributions to other government entities (1,251,692) (1,734,800) Net cash provided by financing activities 17,287,053 31,784,409 Net (decrease) increase in cash and bank balances (4,702,412) 3,501,295
Net cash and bank balances, beginning of year 4,652,105 1,150,810 Net (overdraft) cash and bank balances, end of year $ (50,307) $ 4,652,105 Represented by: Cash at bank $ 3,380,047 $ 7,916,486 Bank overdraft (1,280,354) (1,639,381) Short-term borrowings (2,150,000) (1,625,000) $ (50,307) $ 4,652,105
33
9
WATER AND SEWERAGE CORPORATION Notes to Financial Statements December 31, 2015 1. ORGANIZATION
The Water and Sewerage Corporation (“the Corporation”) was established under the laws of the Commonwealth of The Bahamas in accordance with the Water and Sewerage Corporation Act of 1976 (“the Act”). The Corporation is wholly-owned by the Government of The Bahamas (“the Government”). Its primary functions are to grant and control water rights; to protect water resources; to regulate the extraction, use and supply of water; to dispose of sewerage; and to perform other ancillary functions throughout New Providence and the Family Islands. The registered office of the Corporation is at 87 Thompson Boulevard, Nassau, The Bahamas. The number of employees as at December 31, 2015 was 435 (2014: 438). These financial statements were authorized to be issued by the Board of Directors on June 30, 2016.
2. ADOPTION OF NEW AND AMENDED INTERNATIONAL FINANCIAL REPORTING STANDARDS
At the date of these financial statements, the following standards and amendments to the existing standards issued by the International Accounting Standards Board (“the IASB”) have not been applied in these financial statements as they are not yet effective:
IFRS 9 - Financial Instruments - effective from January 1, 2018
IFRS 14 - Regulatory Deferral Accounts - effective from January 1, 2016
IFRS 15 - Revenue from Contracts with Customers - effective from January 1, 2017
IFRS 11 (amendments)
- Joint Arrangements - amendments to clarify the accounting for acquisitions of an interest in a joint operation when the operation constitutes a business - effective from January 1, 2016
IFRS 10, 12 and IAS 28 (amendments)
- Investment Entities - amendments to address issues that have arisen in the context of applying the consolidation exception for investment entities - effective from January 1, 2016
IAS 16, IAS 38 (amendments)
- Intangible Assets - amendments regarding the clarification of acceptable methods of depreciation and amortization - effective from January 1, 2016
The Directors have concluded that the adoption of such standards and amendments is unlikely to have a significant impact on the Company’s financial statements.
34
10
WATER AND SEWERAGE CORPORATION Notes to Financial Statements December 31, 2015 3. SUMMARY OF SIGNIFICANT ACCOUNTING POLICIES
a) Statement of compliance
The financial statements of the Corporation have been prepared in accordance with International Financial Reporting Standards (“IFRS”) as issued by the IASB. The accounting policies set out below have been consistently applied to all years presented.
b) Basis of preparation
These financial statements have been prepared on the historical cost basis except for certain property, plant and equipment. The financial statements are expressed in Bahamian dollars, which is the functional and reporting currency of the Corporation.
c) Use of estimates and judgments The preparation of the financial statements in conformity with IFRS requires management to make judgments, estimates and assumptions that affect the application of the accounting policies and the reported amounts of assets and liabilities and the disclosure of contingent assets and liabilities at the date of the financial statements and the reported amounts of revenue and expenses during the year. Actual results can differ from those estimates. The areas involving a higher degree of judgment, or areas where assumptions or estimates are significant to the financial statements are disclosed below:
Estimated useful lives of property, plant and equipment The Corporation estimates the useful lives of its property, plant and equipment based on the period over which the assets are expected to be available for use. The estimated useful lives of the property, plant and equipment are reviewed periodically or updated if expectations differ from previous estimates due to physical wear and tear, technical or commercial obsolescence and legal or other limits on the use of the assets. In addition, estimation of the useful lives of the property, plant and equipment is based on the collective assessment of industry practice, internal technical evaluations and experience with similar assets. It is possible, however, that future results of operations could be materially affected by changes in estimates brought about by changes in factors mentioned above. The amounts and timing of recorded expenses for any period would be affected by changes in these factors and circumstances. It was determined during the valuation review in 2010, as described further in Note 3(d), that the useful lives of certain assets should be shortened to reflect local conditions and replacement trends. Internally-generated assets These include apportionment of preliminary engineering costs, based upon projects completed during the year.

35
11
WATER AND SEWERAGE CORPORATION Notes to Financial Statements December 31, 2015 3. SUMMARY OF SIGNIFICANT ACCOUNTING POLICIES (continued)
c) Use of estimates and judgments (continued)
Deferred income As a part of the valuation process, management reviewed and aligned the amortization rate applied to deferred income to the estimated useful lives of privately developed infrastructure. In 2010, it was determined that the amortization period should be increased from 25 to 35 years in keeping with the weighted average useful lives of the related assets.
Allowance for obsolescence on materials and supplies The allowance for obsolescence, if any, is determined by examining stock movements on a regular basis. Changes in technology applicable to the Corporation, the age and condition of certain items are also considered in determining the allowance for obsolescence on materials and supplies. Long outstanding items are mainly retained for maintenance purposes.
Estimation of allowance for doubtful accounts Losses for impaired accounts receivable are recognized immediately when there is objective evidence that impairment has occurred. Statistical methods are used to assess losses for impairment on a collective basis, factoring historical loss experience on groups of accounts and categories of services, and management’s judgment regarding economic factors that might affect collection of the outstanding accounts receivable.
d) Property, plant and equipment and depreciation
The Act states that all water and sewer installations, within the area of control and administration of the Corporation, which were the property of the Government, or were vested for or on behalf of the Government, shall be deemed to have been transferred to, and shall vest in the Corporation. This includes substantial land holdings comprised of land owned by the Corporation, leased Crown land or others, or used by the Corporation for water supply purposes. As continued use or disposal of these land-holdings is subject to the Government’s mandates, these land-holdings have been recorded in the Corporation’s financial statements at $1. The Act states that all water and sewer installations, within the area of control and administration of the Corporation, which were the property of the Government, or were vested for or on behalf of the Government, shall be deemed to have been transferred to, and shall vest in the Corporation. This includes substantial land holdings comprised of land owned by the Corporation, leased Crown land or others, or used by the Corporation for water supply purposes. As continued use or disposal of these land-holdings is subject to the Government’s mandates, these land-holdings have been recorded in the Corporation’s financial statements at $1.

36
12
WATER AND SEWERAGE CORPORATION Notes to Financial Statements December 31, 2015
3. SUMMARY OF SIGNIFICANT ACCOUNTING POLICIES (continued)
d) Property, plant and equipment and depreciation (continued)
Prior to 2010, property, plant and equipment constructed by the Government and third parties and transferred to the Corporation were not valued. Effective December 31, 2010, an independent advisor inventoried and valued the property, plant and equipment. The approach to valuing the above ground and underground assets was to develop an estimate of the historical cost of each asset and calculate the net book value by reference to the useful life assigned to each asset class. Land, buildings, vehicles and heavy equipment were valued based on their actual cost data in the Corporation. The valuation process resulted in an increase in property, plant and equipment and a corresponding valuation adjustment of $50,646,099 included in equity that reflected the depreciated historical costs of property, plant and equipment, both estimated and actual (see Note 3(j)). Subsequent additions to property, plant and equipment are stated at cost less accumulated depreciation except for developer-constructed works transferred to the Corporation. Developer-constructed works transferred to the Corporation are stated at a value determined from design estimates less accumulated depreciation (See Note 3(i)).
Depreciation of property, plant and equipment is calculated using the straight-line method over the estimated useful lives of the respective assets as follows:
Description Life (years) Buildings 40 Transmission and distribution mains 40 Sewer collection systems and mains 40 Sewer connections 40 Storage tanks and reservoirs 30 Wellfields 25 Water pumping stations 20 Sewer lift stations 20 Sewer treatment plants 20 Water service lines 15 Water meters 10 Garage plant and equipment 10 Automotive equipment 5 Other equipment 5
Gains or losses on retirements are recorded against the valuation adjustment. Gains or losses on other disposals are included in the statement of comprehensive loss.
37
13
WATER AND SEWERAGE CORPORATION Notes to Financial Statements December 31, 2015
3. SUMMARY OF SIGNIFICANT ACCOUNTING POLICIES (continued)
d) Property, plant and equipment and depreciation (continued) Work-in-progress included in property, plant and equipment includes the following: • Materials, supplies and other expenditures, valued at cost; • Direct labor, valued at cost plus an allocated amount for labor overhead recovery; • Indirect labor, valued at an allocated amount on an equitable basis; • Interest expense, valued at cost, where incurred in relation to the financing of work-in-progress having a
construction period in excess of six (6) months. On substantial completion of 95% or more, work-in-progress is transferred to the appropriate category of property, plant and equipment.
e) Impairment of assets
Depreciable assets are reviewed for impairment on a regular basis or when events or operational changes indicate that the carrying value is higher than the asset’s recoverable amount. The asset’s recoverable amount is the higher of the asset’s fair value less costs to sell and its value in use.
f) Revenue recognition
Water and sewerage revenue is recognized when the related water and sewerage services are rendered. Water and sewerage charges are billed according to the bill cycles of the customers.
g) Materials and supplies Materials and supplies are valued at average cost and written down to replacement cost where cost of finished product or services exceeds net realizable value, as appropriate, net of allowance for obsolescence.
h) Borrowing costs Borrowing costs that are directly attributable to the acquisition, development, improvement and construction of a qualifying asset (including costs incurred in connection with rehabilitation works) that necessarily takes a substantial time to be ready for its intended use, are capitalized as part of the cost of the asset.
i) Deferred income
Deferred income represents the remaining unamortized balance relating to impact fees, third-party infrastructure and contributions transferred to the Corporation. The Corporation requires new subdivision developers to pay a proportional impact fee that is set aside to defray future infrastructural costs associated with adding new customers. Beginning January 1, 2007, the Corporation recognizes all developer-constructed works upon transfer to the Corporation at a value determined from design estimates.

38
14
WATER AND SEWERAGE CORPORATION Notes to Financial Statements December 31, 2015 3. SUMMARY OF SIGNIFICANT ACCOUNTING POLICIES (continued)
i) Deferred income (continued)
Some developers may contract the Corporation to carry out infrastructural works for the development’s specific use. These contributions in respect of incomplete projects are carried in accounts payable until the project is complete. The value of third-party infrastructure and contributions in respect of completed projects is included in property, plant and equipment with a corresponding value recorded in deferred income. Deferred income is amortized to income on a straight-line basis over the estimated average useful life of the assets, which is currently estimated at 35 years.
j) Valuation adjustment Valuation adjustment represents the remaining unamortized balance relating to the independent valuation of property, plant and equipment conducted as at December 31, 2010. Valuation adjustment is being amortized on a straight-line basis for the period of 35 years (See Note 3(d)).
k) Retirement benefit plans The Corporation maintains two retirement benefit plans covering all permanent employees. Permanent employees who engaged before January 1, 2012 are enrolled in a defined benefit plan. Permanent employees engaged on or after January 1, 2012, are enrolled in a defined contribution plan. The assets of each plan are held in separate funds that are administered by a private insurance company. Defined benefit plan The amount recognized in the statement of financial position is the present value of the defined benefit obligation at the statement of financial position date less the fair value of plan assets. The defined benefit obligation is calculated annually by independent actuaries using the projected unit credit method. The present value of the defined benefit obligation is determined by discounting the estimated future cash outflows using interest rates of high-quality Government of The Bahamas bonds. Past service costs are recognized immediately in the statement of comprehensive loss (staffing expense). Actuarial gains and losses arising from experience adjustments and changes in actuarial assumptions are recognized in other comprehensive (loss) income in the period in which they occur.
Normal retirement age is at 60 years old for all members. Pensions are payable for life and guaranteed for five (5) years at any event. Early retirement with unreduced benefits is permitted after completion of thirty (30) years of continuous service. Members may also retire early due to ill-health at any time with unreduced benefits. Vested members receive, on termination of employment, lump-sums equal to four percent (4%) and five percent (5%) of the salary for each year of service for non-management and management employees, respectively. The Corporation pays the majority of benefits from its own funds on a pay-as-you-go basis. Through its defined benefit plan, the Corporation is exposed to a number of risks; the most significant are enumerated below:
39
15
WATER AND SEWERAGE CORPORATION Notes to Financial Statements December 31, 2015 3. SUMMARY OF SIGNIFICANT ACCOUNTING POLICIES (continued)
k) Retirement benefit plans (continued) Defined benefit plan (continued) Asset volatility – The plan’s liabilities are calculated using a discount rate set with reference to the Government of The Bahamas’ bonds. If plan assets underperform this yield, this will create an additional gap between plan assets and plan liabilities. Plan assets are invested in a fund with well-diversified investments, such that the failure of any single investment would not materially impact the overall level of plan assets. Salary risk – The present value of the plan’s liabilities is calculated by reference to the future salaries of employees under the plan. Therefore, increases in the salaries of employees will increase the liability of the plan. Life expectancy – The majority of the plan’s obligations are to provide benefit for the life of its retired employees. In this case, increases in life expectancies will result in an increase in the plan’s liabilities. Defined contribution plan The Corporation pays fixed contributions to a privately administered pension plan in respect of eligible employees. The Corporation has no further payment obligations for the benefits provided under the plan once the contributions have been paid. Contributions are charged to the statement of comprehensive loss (staffing expense) in the accounting period to which they relate.
l) Financial assets – loans and receivables
The Corporation classifies its financial assets as loans and receivables. The classification depends on the nature and purpose of the financial assets. Management determines the classification at the time of initial recognition.
• Loans and receivables
Loans and receivables are non-derivative financial assets with fixed or determinable payments that are not quoted in an active market, except those that the Corporation intends to sell in the short-term, or are designated as at fair value through profit or loss or available-for-sale. Loans and receivables are initially measured at fair value plus transaction costs. Subsequent to initial recognition, loans and receivables are measured at amortized cost using the effective interest method less any impairment losses. Balances included in this classification are cash at bank and accounts receivable.
m) Impairment of financial assets
The carrying amounts of the Corporation’s assets are reviewed at the end of each reporting period to determine whether there is objective evidence of impairment. If such evidence exists, the asset’s recoverable amount is estimated. A financial asset is impaired if its carrying amount is greater than its estimated recoverable amount. The amount of impairment loss for an asset carried at amortized cost is calculated as the difference between the carrying value of the asset and the present value of the expected future cash flows discounted at the asset’s original effective interest rate and recognized in the statement of comprehensive income (loss).

40
16
WATER AND SEWERAGE CORPORATION Notes to Financial Statements December 31, 2015 3. SUMMARY OF SIGNIFICANT ACCOUNTING POLICIES (continued)
n) Recognition of financial assets and liabilities
The Corporation recognizes financial assets and financial liabilities when it becomes a party to the contractual provisions of the instrument.
o) Derecognition of financial assets and liabilities The Corporation derecognizes financial assets when the contractual rights to receive cash flows from the assets have expired or have been transferred and the Corporation has transferred substantially all the risks and rewards of ownership. A financial liability is derecognized when the contractual obligations are discharged, cancelled or expire.
p) Financial liabilities The Corporation classifies its financial liabilities as other financial liabilities.
• Other financial liabilities
Other financial liabilities, including borrowings, are initially measured at fair value, net of transaction costs. Subsequently, they are measured at amortized cost using the effective interest method. Interest expense is recognized on an effective yield basis. The effective interest method calculates the amortized cost of a financial liability and allocates interest expense over the earlier of payoff or scheduled maturity. Balances included in this classification are bank overdraft, short-term borrowings, accounts payable and accrued liabilities and long-term debt.
q) Offsetting financial instruments
Financial assets and liabilities are offset and the net amount reported in the statement of financial position when there is a legally enforceable right to offset the recognized amounts and there is an intention to settle on a net basis or realize the asset and settle the liability simultaneously.
r) Cash and bank balances
For the purpose of the statement of cash flows, bank overdraft and short-term borrowings are included as a component of cash and bank balances.
s) Customers’ deposits Cash deposits are required for new accounts prior to connection of services. Deposits may be applied against past due balances prior to collection proceedings or write-off. Upon termination of service, deposits are first applied against outstanding balances and any remaining deposit balance is refunded to the customer.

41
W
ATER
AND
SEW
ERAG
E CO
RPOR
ATIO
N N
otes
to F
inan
cial
Sta
tem
ents
D
ecem
ber 3
1, 2
015
4.
PROP
ERTY
, PLA
NT A
ND E
QUIP
MENT
Ja
nuar
y 1,
2015
Addi
tions
Disp
osals
Tran
sfer
s De
cem
ber 3
1, 20
15
Cost
/valu
e
Land
and
wel
lfiel
ds
$
5,3
76,2
10
$
-
$
-
$
-
$
5
,376
,210
Bu
ildin
gs
6,35
2,21
2 13
,523
-
248,
564
6,61
4,29
9 W
ater
pum
ping
sta
tions
3,
301,
153
99,6
21
- 21
1,95
5 3,
612,
729
Sew
er li
ft st
atio
ns
6,17
9,64
1 44
4,07
1 -
442,
470
7,06
6,18
2 St
orag
e ta
nks
and
rese
rvoi
rs
21,2
43,5
04
- -
- 21
,243
,504
Tr
ansm
issi
on a
nd d
istri
butio
n m
ains
20
8,99
8,05
5 91
,000
(5
03,0
79)
1,76
0,99
1 21
0,34
6,96
7 W
ater
ser
vice
line
s
46,8
25,7
72
7,78
4,95
9 (4
,429
,366
) 1,
939,
204
52,1
20,5
69
Sew
er c
olle
ctio
n sy
stem
s an
d m
ains
91
,957
,966
-
- -
91,9
57,9
66
Sew
er c
onne
ctio
ns
10,2
38,6
05
1,29
4,27
3 -
95,0
21
11,6
27,8
99
Sew
er tr
eatm
ent p
lant
s 12
,315
,201
7,
154
- -
12,3
22,3
55
Wat
er m
eter
s 15
,190
,924
29
,964
-
303,
081
15,5
23,9
69
Gar
age
plan
t and
equ
ipm
ent
3,97
6,61
5 36
,635
-
- 4,
013,
250
Oth
er e
quip
men
t 9,
699,
929
64,7
18
(1,3
65)
- 9,
763,
282
Auto
mot
ive
equi
pmen
t 3,
783,
870
519,
216
(296
,925
) -
4,00
6,16
1
445,
439,
657
10,3
85,1
34
(5,2
30,7
35)
5,00
1,28
6 45
5,59
5,34
2 W
ork-
in-p
rogr
ess
48,8
79,8
12
21,6
36,9
27
- (5
,001
,286
) 65
,515
,453
To
tal
$494
,319
,469
$3
2,02
2,06
1 $(
5,23
0,73
5)
$
-
$5
21,1
10,7
95
17
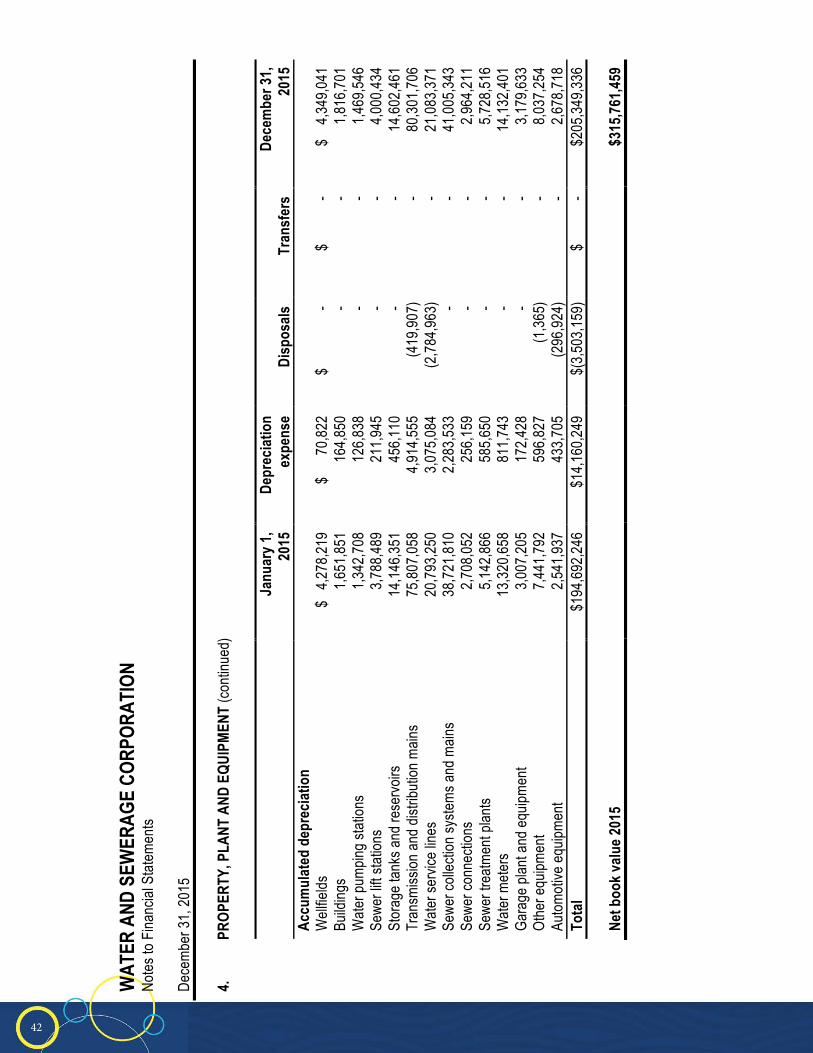
42
W
ATER
AND
SEW
ERAG
E CO
RPOR
ATIO
N N
otes
to F
inan
cial
Sta
tem
ents
D
ecem
ber 3
1, 2
015
4. PR
OPER
TY, P
LANT
AND
EQU
IPME
NT (c
ontin
ued)
18
Ja
nuar
y 1,
2015
D
epre
ciatio
n
expe
nse
D
ispos
als
Tran
sfer
s De
cem
ber 3
1,
2015
Ac
cum
ulat
ed d
epre
ciatio
n
W
ellfi
elds
$
4,2
78,2
19
$
70,
822
$
- $
-
$
4,
349,
041
Build
ings
1,
651,
851
164,
850
-
- 1,
816,
701
Wat
er p
umpi
ng s
tatio
ns
1,34
2,70
8 12
6,83
8 -
-
1,46
9,54
6 Se
wer
lift
stat
ions
3,
788,
489
211,
945
-
- 4,
000,
434
Stor
age
tank
s an
d re
serv
oirs
14
,146
,351
45
6,11
0 -
-
14,6
02,4
61
Tran
smis
sion
and
dis
tribu
tion
mai
ns
75,8
07,0
58
4,91
4,55
5 (4
19,9
07)
- 80
,301
,706
W
ater
ser
vice
line
s
20,7
93,2
50
3,07
5,08
4 (2
,784
,963
) -
21,0
83,3
71
Sew
er c
olle
ctio
n sy
stem
s an
d m
ains
38
,721
,810
2,
283,
533
- -
41,0
05,3
43
Sew
er c
onne
ctio
ns
2,70
8,05
2 25
6,15
9 -
- 2,
964,
211
Sew
er tr
eatm
ent p
lant
s 5,
142,
866
585,
650
- -
5,72
8,51
6 W
ater
met
ers
13,3
20,6
58
811,
743
- -
14,1
32,4
01
Gar
age
plan
t and
equ
ipm
ent
3,00
7,20
5 17
2,42
8 -
- 3,
179,
633
Oth
er e
quip
men
t 7,
441,
792
596,
827
(1,3
65)
- 8,
037,
254
Auto
mot
ive
equi
pmen
t 2,
541,
937
433,
705
(296
,924
) -
2,67
8,71
8 To
tal
$194
,692
,246
$1
4,16
0,24
9 $(
3,50
3,15
9)
$
-
$205
,349
,336
Ne
t boo
k valu
e 201
5
$3
15,76
1,459

43
W
ATER
AND
SEW
ERAG
E CO
RPOR
ATIO
N N
otes
to F
inan
cial
Sta
tem
ents
D
ecem
ber 3
1, 2
015
4. PR
OPER
TY, P
LANT
AND
EQU
IPME
NT (c
ontin
ued)
Janu
ary 1
, 20
14
Ad
ditio
ns
Di
spos
als
Tr
ansf
ers
Dece
mbe
r 31,
2014
Co
st/va
lue
La
nd a
nd w
ell f
ield
s $
5
,376
,210
$
-
$
-
$
-
$
5,3
76,2
10
Build
ings
6
,230
,006
-
- 12
2,20
6 6,
352,
212
Wat
er p
umpi
ng s
tatio
ns
3,0
57,6
32
138,
735
- 10
4,78
6 3,
301,
153
Sew
er li
ft st
atio
ns
6,1
79,6
41
- -
- 6,
179,
641
Stor
age
tank
s an
d re
serv
oirs
2
1,11
4,42
0
- -
129,
084
21,2
43,5
04
Tran
smis
sion
and
dis
tribu
tion
mai
ns
201
,068
,581
6,
859,
631
(5,6
31,6
64)
6,70
1,50
7 20
8,99
8,05
5 W
ater
ser
vice
line
s
45,
309,
822
69
,272
(4
04,9
35)
1,85
1,61
3 46
,825
,772
Se
wer
col
lect
ion
syst
ems
and
mai
ns
91,
957,
966
-
- -
91,9
57,9
66
Sew
er c
onne
ctio
ns
10,
056,
047
-
- 18
2,55
8 10
,238
,605
Se
wer
trea
tmen
t pla
nts
12,
130,
756
-
- 18
4,44
5 12
,315
,201
W
ater
met
ers
14,
878,
268
-
- 31
2,65
6 15
,190
,924
G
arag
e pl
ant a
nd e
quip
men
t 3
,763
,001
31
3,31
1
(9
9,69
7)
- 3,
976,
615
Oth
er e
quip
men
t 9
,657
,703
42
,226
-
- 9,
699,
929
Auto
mot
ive
equi
pmen
t 2
,922
,523
98
7,71
5 (1
26,3
68)
- 3,
783,
870
4
33,7
02,5
76
8,41
0,89
0 (6
,262
,664
) 9,
588,
855
445,
439,
657
Wor
k-in
-pro
gres
s 3
0,00
7,35
8
28,4
61,3
09
- (9
,588
,855
) 48
,879
,812
To
tal
$46
3,70
9,93
4
$36,
872,
199
$(6,
262,
664)
$
-
$494
,319
,469
19

44
W
ATER
AND
SEW
ERAG
E CO
RPOR
ATIO
N N
otes
to F
inan
cial
Sta
tem
ents
D
ecem
ber 3
1, 2
015
4. PR
OPER
TY, P
LANT
AND
EQU
IPME
NT (c
ontin
ued)
20
Ja
nuar
y 1,
2014
D
epre
ciatio
n
expe
nse
D
ispos
als
Tran
sfer
s De
cem
ber 3
1,
2014
Ac
cum
ulat
ed d
epre
ciatio
n
W
ellfi
elds
$
4,
207,
096
$
7
1,12
3 $
-
$
-
$ 4
,278
,219
Bu
ildin
gs
1,4
90,5
24
161,
327
-
- 1,
651,
851
Wat
er p
umpi
ng s
tatio
ns
1,2
23,3
52
119,
356
-
- 1,
342,
708
Sew
er li
ft st
atio
ns
3,5
77,0
22
211,
467
-
- 3,
788,
489
Stor
age
tank
s an
d re
serv
oirs
1
3,69
4,18
5
452,
166
-
- 14
,146
,351
Tr
ansm
issi
on a
nd d
istri
butio
n m
ains
7
4,07
4,44
3
4,69
9,15
0 (2
,966
,535
) -
75,8
07,0
58
Wat
er s
ervi
ce li
nes
1
8,13
3,17
1
2,90
3,49
1 (2
43,4
12)
- 20
,793
,250
Se
wer
col
lect
ion
syst
ems
and
mai
ns
36,
438,
277
2,
283,
533
- -
38,7
21,8
10
Sew
er c
onne
ctio
ns
2,4
58,9
91
249,
061
- -
2,70
8,05
2 Se
wer
trea
tmen
t pla
nts
4,5
65,8
92
576,
974
- -
5,14
2,86
6 W
ater
met
ers
11,
879,
209
1,
441,
449
- -
13,3
20,6
58
Gar
age
plan
t and
equ
ipm
ent
2,9
29,2
39
166,
663
(88,
697)
-
3,00
7,20
5 O
ther
equ
ipm
ent
6,8
25,2
59
616,
533
- -
7,44
1,79
2 Au
tom
otiv
e eq
uipm
ent
2,3
44,6
21
323,
686
(126
,370
) -
2,54
1,93
7 To
tal
$18
3,84
1,28
1
$14,
275,
979
$(3,
425,
014)
$
-
$1
94,6
92,2
46
Net b
ook v
alue 2
014
$299
,627,2
23

45
W
ATER
AND
SEW
ERAG
E CO
RPOR
ATIO
N N
otes
to F
inan
cial
Sta
tem
ents
D
ecem
ber 3
1, 2
015
4. PR
OPER
TY, P
LANT
AND
EQU
IPME
NT (c
ontin
ued)
New
Prov
iden
ce
Ja
nuar
y 1,
2015
Addi
tions
Disp
osals
Tran
sfer
s De
cem
ber 3
1, 20
15
Cost
/valu
e
Land
$
191
,200
$
-
$
- $
-
$
1
91,2
00
Build
ings
5,
953,
469
- -
226,
645
6,18
0,11
4 W
ater
pum
ping
sta
tions
1,
186,
497
40,9
05
- -
1,22
7,40
2 Se
wer
lift
stat
ions
6,
044,
835
444,
071
- 44
2,47
0 6,
931,
376
Stor
age
tank
s an
d re
serv
oirs
13
,163
,194
-
- -
13,1
63,1
94
Tran
smis
sion
and
dis
tribu
tion
mai
ns
125,
908,
961
91,0
00
(503
,079
) 1,
692,
456
127,
189,
338
Wat
er s
ervi
ce li
nes
39,1
61,3
88
7,78
4,95
9 (4
,429
,366
) 1,
868,
257
44,3
85,2
38
Sew
er c
olle
ctio
n sy
stem
s an
d m
ains
91
,341
,301
-
- -
91,3
41,3
01
Sew
er c
onne
ctio
ns
10,1
29,7
82
1,29
4,27
3 -
95,0
21
11,5
19,0
76
Sew
er tr
eatm
ent p
lant
s 11
,987
,271
7,
154
- -
11,9
94,4
25
Wat
er m
eter
s 11
,322
,833
29
,964
-
232,
496
11,5
85,2
93
Gar
age
plan
t and
equ
ipm
ent
3,02
1,84
6 -
- -
3,02
1,84
6 O
ther
equ
ipm
ent
9,52
9,64
9 64
,718
(9
45)
- 9,
593,
422
Auto
mot
ive
equi
pmen
t 2,
467,
486
316,
250
(219
,283
) -
2,56
4,45
3
331,
409,
712
10,0
73,2
94
(5,1
52,6
73)
4,55
7,34
5 34
0,88
7,67
8 W
ork-
in-p
rogr
ess
45,4
57,4
78
19,5
77,3
96
- (4
,557
,345
) 60
,477
,529
To
tal
$376
,867
,190
$2
9,65
0,69
0 $(
5,15
2,67
3)
$
-
$4
01,3
65,2
07
21
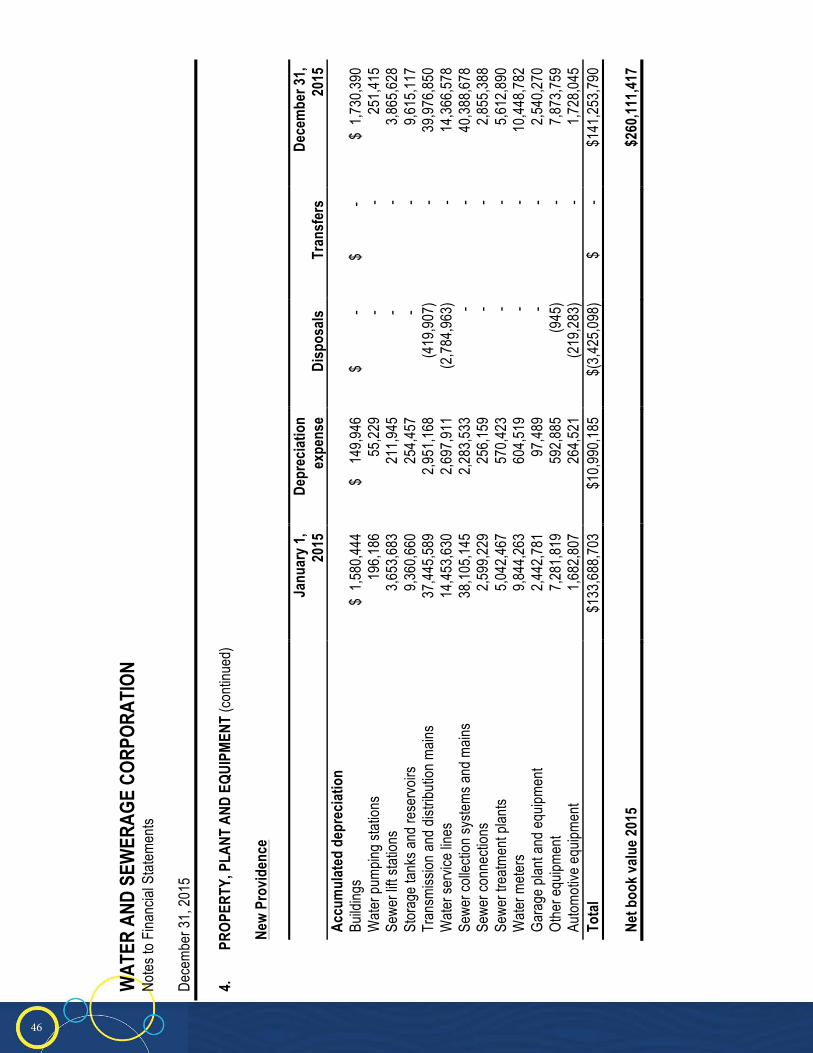
46
W
ATER
AND
SEW
ERAG
E CO
RPOR
ATIO
N N
otes
to F
inan
cial
Sta
tem
ents
D
ecem
ber 3
1, 2
015
4. PR
OPER
TY, P
LANT
AND
EQU
IPME
NT (c
ontin
ued)
New
Prov
iden
ce
Jan
uary
1,
201
5 D
epre
ciatio
n ex
pens
e Di
spos
als
Tran
sfer
s De
cem
ber 3
1, 20
15
Accu
mul
ated
dep
recia
tion
Bu
ildin
gs
$ 1
,580
,444
$
14
9,94
6
$
-
$
-
$
1,7
30,3
90
Wat
er p
umpi
ng s
tatio
ns
196,
186
55,2
29
-
-
251,
415
Sew
er li
ft st
atio
ns
3,65
3,68
3 21
1,94
5 -
-
3,86
5,62
8 St
orag
e ta
nks
and
rese
rvoi
rs
9,36
0,66
0 25
4,45
7 -
-
9,
615,
117
Tran
smis
sion
and
dis
tribu
tion
mai
ns
37,4
45,5
89
2,95
1,16
8 (4
19,9
07)
-
39,9
76,8
50
Wat
er s
ervi
ce li
nes
14,4
53,6
30
2,69
7,91
1 (2
,784
,963
) -
14
,366
,578
Se
wer
col
lect
ion
syst
ems
and
mai
ns
38,1
05,1
45
2,28
3,53
3 -
-
40,3
88,6
78
Sew
er c
onne
ctio
ns
2,59
9,22
9 25
6,15
9 -
-
2,85
5,38
8 Se
wer
trea
tmen
t pla
nts
5,04
2,46
7 57
0,42
3 -
-
5,61
2,89
0 W
ater
met
ers
9,84
4,26
3 60
4,51
9 -
-
10,4
48,7
82
Gar
age
plan
t and
equ
ipm
ent
2,44
2,78
1 97
,489
-
-
2,54
0,27
0 O
ther
equ
ipm
ent
7,28
1,81
9 59
2,88
5 (9
45)
-
7,87
3,75
9 Au
tom
otiv
e eq
uipm
ent
1,68
2,80
7 26
4,52
1 (2
19,2
83)
-
1,72
8,04
5 To
tal
$133
,688
,703
$1
0,99
0,18
5 $(
3,42
5,09
8)
$
-
$1
41,2
53,7
90
Net b
ook v
alue 2
015
$260
,111,4
17
22

47
W
ATER
AND
SEW
ERAG
E CO
RPOR
ATIO
N N
otes
to F
inan
cial
Sta
tem
ents
D
ecem
ber 3
1, 2
015
4. PR
OPER
TY, P
LANT
AND
EQU
IPME
NT (c
ontin
ued)
New
Prov
iden
ce
Ja
nuar
y 1,
2014
Addi
tions
Disp
osals
Tran
sfer
s De
cem
ber 3
1, 20
14
Cost
/valu
e
Land
and
wel
lfiel
ds
$
1
91,2
00
$
- $
-
$
-
$
191
,200
Bu
ildin
gs
5,95
3,46
9 -
- -
5,95
3,46
9 W
ater
pum
ping
sta
tions
94
6,97
6 13
4,73
5 -
104,
786
1,18
6,49
7 Se
wer
lift
stat
ions
6,
044,
835
- -
- 6,
044,
835
Stor
age
tank
s an
d re
serv
oirs
13
,163
,194
-
- -
13,1
63,1
94
Tran
smis
sion
and
dis
tribu
tion
mai
ns
117,
979,
487
6,85
9,63
1 (5
,631
,664
) 6,
701,
507
125,
908,
961
Wat
er s
ervi
ce li
nes
37,6
99,3
00
69,2
72
(404
,935
) 1,
797,
751
39,1
61,3
88
Sew
er c
olle
ctio
n sy
stem
s an
d m
ains
91
,341
,301
-
- -
91,3
41,3
01
Sew
er c
onne
ctio
ns
9,94
7,22
4 -
- 18
2,55
8 10
,129
,782
Se
wer
trea
tmen
t pla
nts
11,8
71,3
26
- -
115,
945
11,9
87,2
71
Wat
er m
eter
s 11
,030
,090
-
- 29
2,74
3 11
,322
,833
G
arag
e pl
ant a
nd e
quip
men
t 2,
842,
254
279,
289
(99,
697)
-
3,02
1,84
6 O
ther
equ
ipm
ent
9,48
7,42
3 42
,226
-
- 9,
529,
649
Auto
mot
ive
equi
pmen
t 1,
893,
662
621,
503
(47,
679)
-
2,46
7,48
6
320,
391,
741
8,00
6,65
6 (6
,183
,975
) 9,
195,
290
331,
409,
712
Wor
k-in
-pro
gres
s 27
,125
,620
27
,527
,148
-
(9,1
95,2
90)
45,4
57,4
78
Tota
l $3
47,5
17,3
61
$35,
533,
804
$(6,
183,
975)
$
-
$376
,867
,190
23

48
W
ATER
AND
SEW
ERAG
E CO
RPOR
ATIO
N N
otes
to F
inan
cial
Sta
tem
ents
D
ecem
ber 3
1, 2
015
4. PR
OPER
TY, P
LANT
AND
EQU
IPME
NT (c
ontin
ued)
New
Prov
iden
ce
Jan
uary
1,
201
4 D
epre
ciatio
n ex
pens
e Di
spos
als
Tran
sfer
s De
cem
ber 3
1, 20
14
Accu
mul
ated
dep
recia
tion
Bu
ildin
gs
$
1,43
0,97
0
$
149,
474
$
-
$
-
$ 1
,580
,444
W
ater
pum
ping
sta
tions
1
50,6
71
45,5
15
-
-
196,
186
Sew
er li
ft st
atio
ns
3,4
42,2
16
211,
467
-
-
3,65
3,68
3 St
orag
e ta
nks
and
rese
rvoi
rs
9,1
06,2
03
254,
457
-
-
9,36
0,66
0 Tr
ansm
issi
on a
nd d
istri
butio
n m
ains
3
7,68
2,18
0
2,72
9,94
4 (2
,966
,535
) -
37
,445
,589
W
ater
ser
vice
line
s 1
2,25
0,06
7
2,44
6,97
5 (2
43,4
12)
-
14,4
53,6
30
Sew
er c
olle
ctio
n sy
stem
s an
d m
ains
3
5,82
1,61
2
2,28
3,53
3 -
-
38,1
05,1
45
Sew
er c
onne
ctio
ns
2,3
50,1
68
249,
061
- -
2,
599,
229
Sew
er tr
eatm
ent p
lant
s 4
,477
,580
56
4,88
7 -
-
5,04
2,46
7 W
ater
met
ers
8,7
87,7
97
1,05
6,46
6 -
-
9,84
4,26
3 G
arag
e pl
ant a
nd e
quip
men
t 2
,450
,790
91
,688
(9
9,69
7)
-
2,44
2,78
1 O
ther
equ
ipm
ent
6,6
69,5
56
612,
263
- -
7,
281,
819
Auto
mot
ive
equi
pmen
t 1
,542
,666
18
7,82
0 (4
7,67
9)
-
1,68
2,80
7 To
tal
$12
6,16
2,47
6
$10,
883,
550
$(3,
357,
323)
$
-
$133
,688
,703
Ne
t boo
k valu
e 201
4
$2
43,17
8,487
24

49
W
ATER
AND
SEW
ERAG
E CO
RPOR
ATIO
N N
otes
to F
inan
cial
Sta
tem
ents
D
ecem
ber 3
1, 2
015
4. PR
OPER
TY, P
LANT
AND
EQU
IPME
NT (c
ontin
ued)
Fam
ily Is
lands
Ja
nuar
y 1,
2015
Add
ition
s
Disp
osals
Tran
sfer
s De
cem
ber 3
1, 20
15
Cost
/valu
e
Build
ings
$
398,
743
$
13
,523
$
-
$2
1,91
9 $
434,
185
Land
and
wel
lfiel
ds
5,18
5,01
0 -
- -
5,18
5,01
0 W
ater
pum
ping
sta
tions
2,
114,
656
58,7
16
- 21
1,95
4 2,
385,
326
Wat
er s
ervi
ce li
nes
7,66
4,38
4 -
- 70
,946
7,
735,
330
Wat
er m
eter
s 3,
868,
091
- -
70,5
85
3,93
8,67
6 Se
wer
lift
stat
ions
13
4,80
6 -
- -
134,
806
Sew
er tr
eatm
ent p
lant
s 32
7,93
0 -
- -
327,
930
Stor
age
tank
s an
d re
serv
oirs
8,
080,
310
- -
- 8,
080,
310
Sew
er c
olle
ctio
n sy
stem
s an
d m
ains
61
6,66
5 -
- -
616,
665
Sew
er c
onne
ctio
ns
108,
823
- -
- 10
8,82
3 Tr
ansm
issi
on a
nd d
istri
butio
n m
ains
83
,089
,094
-
- 68
,538
83
,157
,632
O
ther
equ
ipm
ent
170,
280
-
(4
20)
- 16
9,86
0 G
arag
e pl
ant a
nd e
quip
men
t 95
4,76
9 36
,635
-
- 99
1,40
4 Au
tom
otiv
e eq
uipm
ent
1,31
6,38
4 20
2,96
5
(7
7,64
2)
- 1,
441,
707
11
4,02
9,94
5 31
1,83
9
(7
8,06
2)
443,
942
114,
707,
664
Wor
k-in
-pro
gres
s 3,
422,
334
2,05
9,53
1 -
(443
,942
) 5,
037,
923
Tota
l $1
17,4
52,2
79
$2,3
71,3
70
$(78
,062
) $
- $1
19,7
45,5
87
25
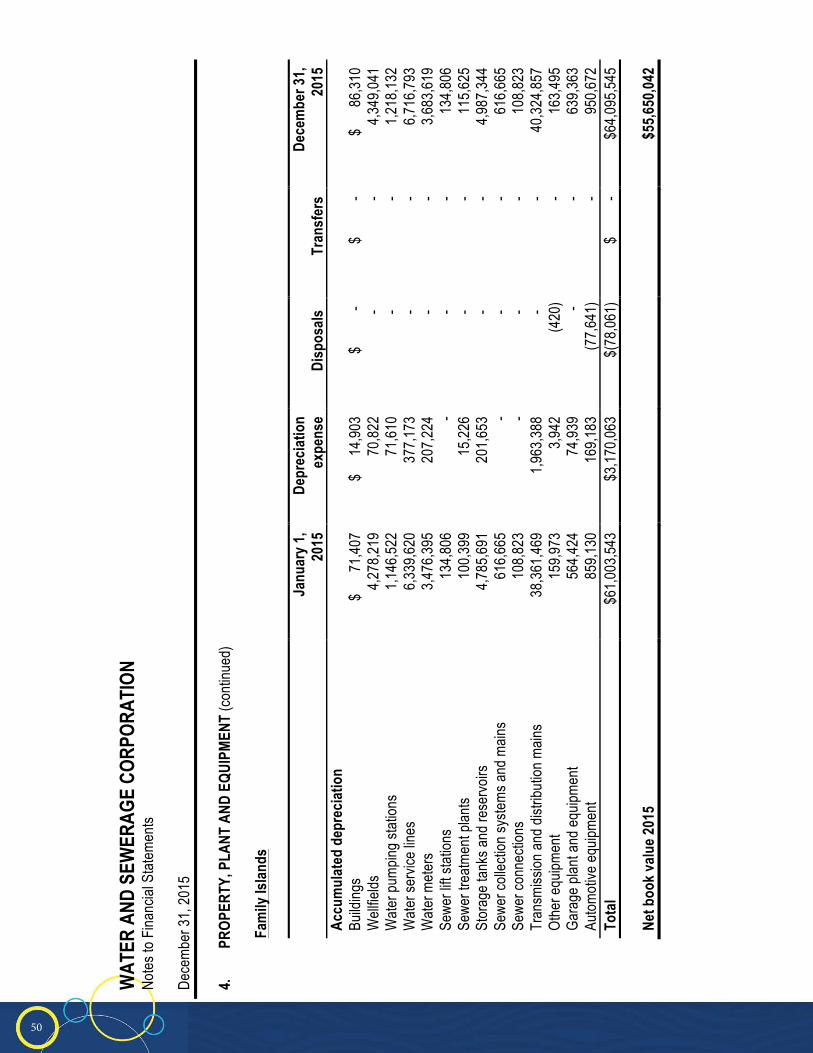
50
W
ATER
AND
SEW
ERAG
E CO
RPOR
ATIO
N N
otes
to F
inan
cial
Sta
tem
ents
D
ecem
ber 3
1, 2
015
4. PR
OPER
TY, P
LANT
AND
EQU
IPME
NT (c
ontin
ued)
Fam
ily Is
lands
Ja
nuar
y 1,
2015
D
epre
ciatio
n
expe
nse
D
ispos
als
Tr
ansf
ers
Dece
mbe
r 31,
2015
Ac
cum
ulat
ed d
epre
ciatio
n
Bu
ildin
gs
$
71,
407
$
14,
903
$
-
$
- $
8
6,31
0 W
ellfi
elds
4,
278,
219
70,8
22
-
- 4,
349,
041
Wat
er p
umpi
ng s
tatio
ns
1,14
6,52
2 71
,610
-
-
1,21
8,13
2 W
ater
ser
vice
line
s 6,
339,
620
377,
173
-
- 6,
716,
793
Wat
er m
eter
s 3,
476,
395
207,
224
-
- 3,
683,
619
Sew
er li
ft st
atio
ns
134,
806
- -
-
134,
806
Sew
er tr
eatm
ent p
lant
s 10
0,39
9 15
,226
-
-
115,
625
Stor
age
tank
s an
d re
serv
oirs
4,
785,
691
201,
653
-
- 4,
987,
344
Sew
er c
olle
ctio
n sy
stem
s an
d m
ains
61
6,66
5 -
-
- 61
6,66
5 Se
wer
con
nect
ions
10
8,82
3 -
-
- 10
8,82
3 Tr
ansm
issi
on a
nd d
istri
butio
n m
ains
38
,361
,469
1,
963,
388
-
- 40
,324
,857
O
ther
equ
ipm
ent
159,
973
3,94
2 (4
20)
- 16
3,49
5 G
arag
e pl
ant a
nd e
quip
men
t 56
4,42
4 74
,939
-
- 63
9,36
3 Au
tom
otiv
e eq
uipm
ent
859,
130
169,
183
(77,
641)
-
950,
672
Tota
l $6
1,00
3,54
3 $3
,170
,063
$(
78,0
61)
$
- $6
4,09
5,54
5
Ne
t boo
k valu
e 201
5
$5
5,650
,042
26

51
W
ATER
AND
SEW
ERAG
E CO
RPOR
ATIO
N N
otes
to F
inan
cial
Sta
tem
ents
D
ecem
ber 3
1, 2
015
4. PR
OPER
TY, P
LANT
AND
EQU
IPME
NT (c
ontin
ued)
Fam
ily Is
lands
Ja
nuar
y 1,
2014
Add
ition
s
Disp
osals
Tran
sfer
s De
cem
ber 3
1, 20
14
Cost
/valu
e
Build
ings
$
276
,537
$
-
$
-
$ 12
2,20
6 $
398,
743
Land
and
wel
lfiel
ds
5,1
85,0
10
- -
- 5,
185,
010
Wat
er p
umpi
ng s
tatio
ns
2,1
10,6
56
4,00
0 -
- 2,
114,
656
Wat
er s
ervi
ce li
nes
7,6
10,5
22
- -
53,8
62
7,66
4,38
4 W
ater
met
ers
3,8
48,1
78
- -
19,9
13
3,86
8,09
1 Se
wer
lift
stat
ions
1
34,8
06
- -
- 13
4,80
6 Se
wer
trea
tmen
t pla
nts
259
,430
-
- 68
,500
32
7,93
0 St
orag
e ta
nks
and
rese
rvoi
rs
7,9
51,2
26
- -
129,
084
8,08
0,31
0 Se
wer
col
lect
ion
syst
ems
and
mai
ns
616
,665
-
- -
616,
665
Sew
er c
onne
ctio
ns
108
,823
-
- -
108,
823
Tran
smis
sion
and
dis
tribu
tion
mai
ns
83,
089,
094
-
- -
83,0
89,0
94
Oth
er e
quip
men
t 1
70,2
80
- -
- 17
0,28
0 G
arag
e pl
ant a
nd e
quip
men
t 9
20,7
47
34,0
22
- -
954,
769
Auto
mot
ive
equi
pmen
t 1
,028
,861
36
6,21
2
(7
8,68
9)
- 1,
316,
384
1
13,3
10,8
35
404,
234
(78,
689)
39
3,56
5 11
4,02
9,94
5 W
ork-
in-p
rogr
ess
2,8
81,7
38
934,
161
- (3
93,5
65)
3,42
2,33
4 To
tal
$11
6,19
2,57
3
$1,3
38,3
95
(78,
689)
$
- $1
17,4
52,2
79
27
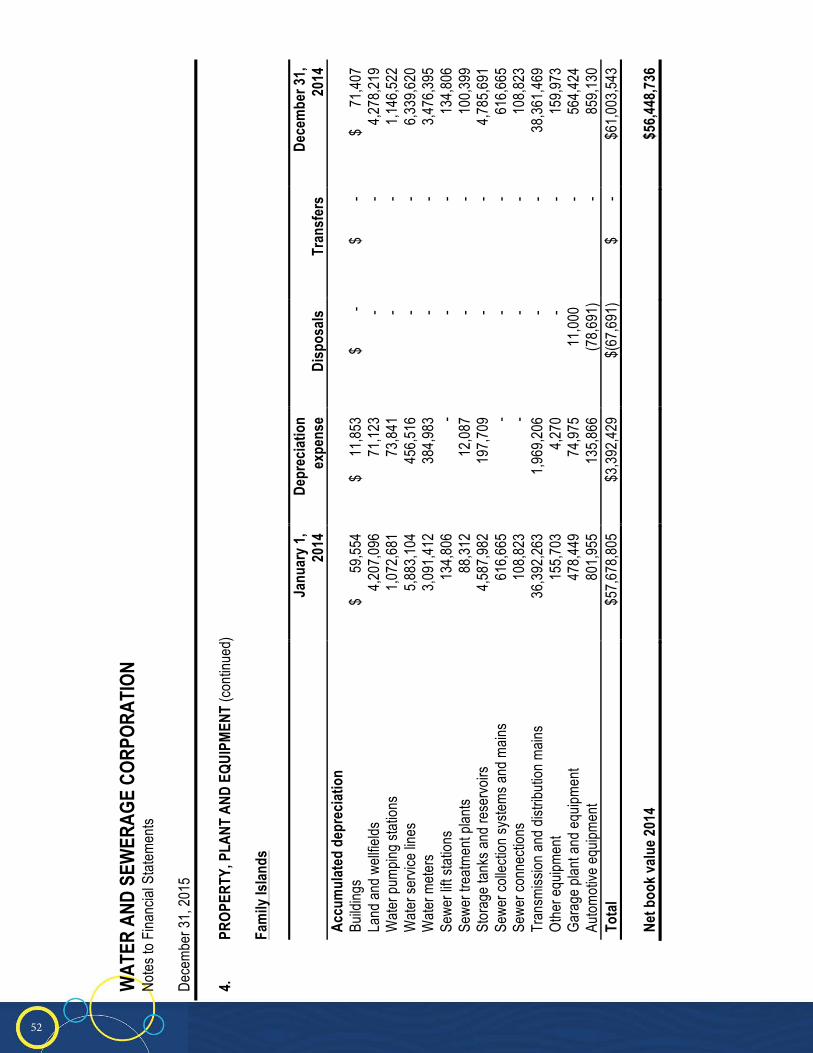
52
W
ATER
AND
SEW
ERAG
E CO
RPOR
ATIO
N N
otes
to F
inan
cial
Sta
tem
ents
D
ecem
ber 3
1, 2
015
4.
PROP
ERTY
, PLA
NT A
ND E
QUIP
MENT
(con
tinue
d)
Fa
mily
Islan
ds
Janu
ary 1
, 20
14
Dep
recia
tion
ex
pens
e
Disp
osals
Tran
sfer
s De
cem
ber 3
1, 20
14
Accu
mul
ated
dep
recia
tion
Build
ings
$
59,
554
$
1
1,85
3 $
-
$
-
$
71,
407
Land
and
wel
lfiel
ds
4,2
07,0
96
71,1
23
-
- 4,
278,
219
Wat
er p
umpi
ng s
tatio
ns
1,0
72,6
81
73,8
41
-
- 1,
146,
522
Wat
er s
ervi
ce li
nes
5,8
83,1
04
456,
516
-
- 6,
339,
620
Wat
er m
eter
s 3
,091
,412
38
4,98
3 -
-
3,47
6,39
5 Se
wer
lift
stat
ions
1
34,8
06
- -
-
134,
806
Sew
er tr
eatm
ent p
lant
s 8
8,31
2
12,0
87
-
- 10
0,39
9 St
orag
e ta
nks
and
rese
rvoi
rs
4,5
87,9
82
197,
709
-
- 4,
785,
691
Sew
er c
olle
ctio
n sy
stem
s an
d m
ains
6
16,6
65
- -
-
616,
665
Sew
er c
onne
ctio
ns
108
,823
-
-
- 10
8,82
3 Tr
ansm
issi
on a
nd d
istri
butio
n m
ains
3
6,39
2,26
3
1,96
9,20
6 -
-
38,3
61,4
69
Oth
er e
quip
men
t 1
55,7
03
4,27
0 -
-
159,
973
Gar
age
plan
t and
equ
ipm
ent
478
,449
74
,975
11
,000
-
564,
424
Auto
mot
ive
equi
pmen
t 8
01,9
55
135,
866
(78,
691)
-
859,
130
Tota
l $
57,6
78,8
05
$3,3
92,4
29
$(67
,691
) $
-
$61,
003,
543
Net b
ook v
alue 2
014
$56,4
48,73
6
28
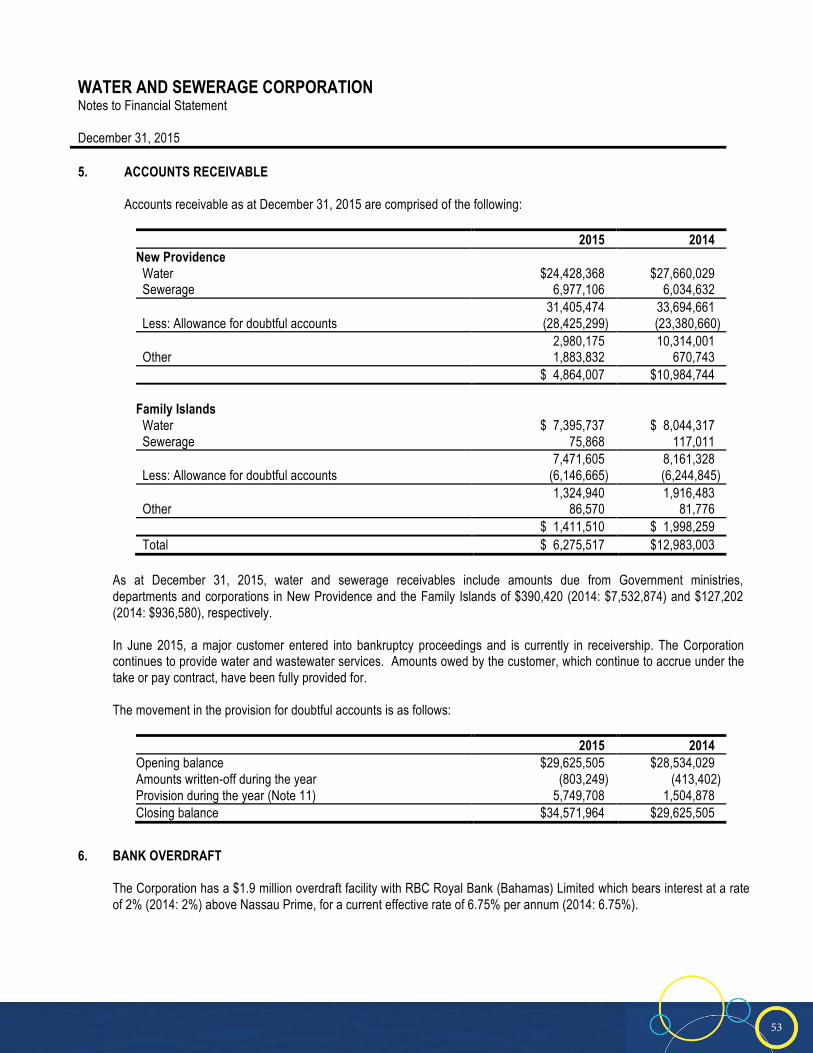
53
WATER AND SEWERAGE CORPORATION Notes to Financial Statement December 31, 2015 5. ACCOUNTS RECEIVABLE
Accounts receivable as at December 31, 2015 are comprised of the following:
2015 2014 New Providence Water $24,428,368 $27,660,029 Sewerage 6,977,106 6,034,632 31,405,474 33,694,661 Less: Allowance for doubtful accounts (28,425,299) (23,380,660) 2,980,175 10,314,001 Other 1,883,832 670,743 $ 4,864,007 $10,984,744 Family Islands Water $ 7,395,737 $ 8,044,317 Sewerage 75,868 117,011 7,471,605 8,161,328 Less: Allowance for doubtful accounts (6,146,665) (6,244,845) 1,324,940 1,916,483 Other 86,570 81,776 $ 1,411,510 $ 1,998,259 Total $ 6,275,517 $12,983,003
As at December 31, 2015, water and sewerage receivables include amounts due from Government ministries, departments and corporations in New Providence and the Family Islands of $390,420 (2014: $7,532,874) and $127,202 (2014: $936,580), respectively. In June 2015, a major customer entered into bankruptcy proceedings and is currently in receivership. The Corporation continues to provide water and wastewater services. Amounts owed by the customer, which continue to accrue under the take or pay contract, have been fully provided for. The movement in the provision for doubtful accounts is as follows:
2015 2014 Opening balance $29,625,505 $28,534,029 Amounts written-off during the year (803,249) (413,402) Provision during the year (Note 11) 5,749,708 1,504,878 Closing balance $34,571,964 $29,625,505
6. BANK OVERDRAFT
The Corporation has a $1.9 million overdraft facility with RBC Royal Bank (Bahamas) Limited which bears interest at a rate of 2% (2014: 2%) above Nassau Prime, for a current effective rate of 6.75% per annum (2014: 6.75%).
29
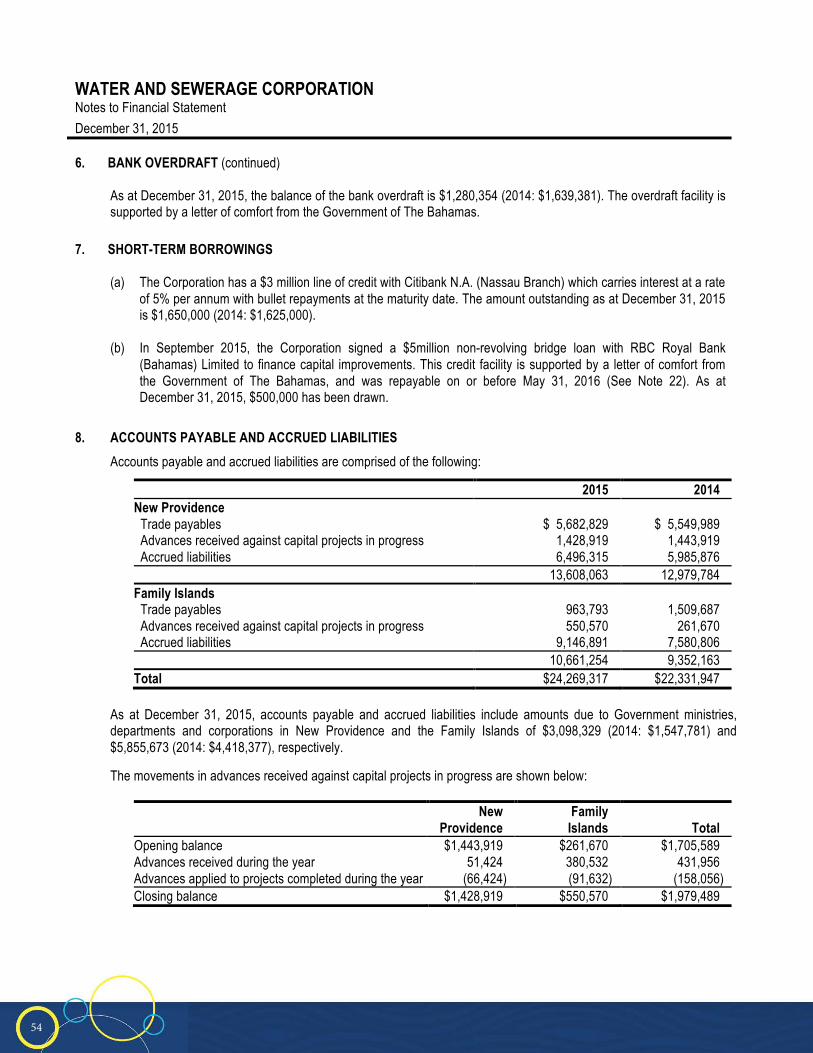
54
WATER AND SEWERAGE CORPORATION Notes to Financial Statement
December 31, 2015 6. BANK OVERDRAFT (continued)
As at December 31, 2015, the balance of the bank overdraft is $1,280,354 (2014: $1,639,381). The overdraft facility is supported by a letter of comfort from the Government of The Bahamas.
7. SHORT-TERM BORROWINGS
(a) The Corporation has a $3 million line of credit with Citibank N.A. (Nassau Branch) which carries interest at a rate of 5% per annum with bullet repayments at the maturity date. The amount outstanding as at December 31, 2015 is $1,650,000 (2014: $1,625,000).
(b) In September 2015, the Corporation signed a $5million non-revolving bridge loan with RBC Royal Bank
(Bahamas) Limited to finance capital improvements. This credit facility is supported by a letter of comfort from the Government of The Bahamas, and was repayable on or before May 31, 2016 (See Note 22). As at December 31, 2015, $500,000 has been drawn.
8. ACCOUNTS PAYABLE AND ACCRUED LIABILITIES
Accounts payable and accrued liabilities are comprised of the following:
2015 2014 New Providence Trade payables $ 5,682,829 $ 5,549,989 Advances received against capital projects in progress 1,428,919 1,443,919 Accrued liabilities 6,496,315 5,985,876 13,608,063 12,979,784 Family Islands Trade payables 963,793 1,509,687 Advances received against capital projects in progress 550,570 261,670 Accrued liabilities 9,146,891 7,580,806 10,661,254 9,352,163 Total $24,269,317 $22,331,947
As at December 31, 2015, accounts payable and accrued liabilities include amounts due to Government ministries, departments and corporations in New Providence and the Family Islands of $3,098,329 (2014: $1,547,781) and $5,855,673 (2014: $4,418,377), respectively.
The movements in advances received against capital projects in progress are shown below:
New Providence
Family Islands
Total
Opening balance $1,443,919 $261,670 $1,705,589 Advances received during the year 51,424 380,532 431,956 Advances applied to projects completed during the year (66,424) (91,632) (158,056) Closing balance $1,428,919 $550,570 $1,979,489
30

55
WATER AND SEWERAGE CORPORATION Notes to Financial Statement December 31, 2015 9. LONG-TERM DEBT
Long-term debt comprises the following:
Notes 2015 2014 Inter-American Development Bank (“IDB”) (a) $60,520,303 $50,442,030 The National Insurance Board (b) 15,000,000 9,200,000 75,520,303 59,642,030
Less: Amounts due within one year (1,361,345) (678,654) $74,158,958 $58,963,376 (a) Inter-American Development Bank
i. The Corporation was granted a loan facility of US$14 million in 1999 primarily for The Family Islands Water
Improvement Project. Only US$10,632,274 of this facility was drawn-down. The remaining amount of the facility of US$3,367,726 was subsequently cancelled. Interest accrues on the loan at a rate per annum as determined by the preceding Semester's Cost of Single Currency Qualified Borrowings. The loan is repayable in equal, bi-annual installments, which commenced on September 25, 2003, and will terminate no later than March 25, 2024. The outstanding balance as at December 31, 2015 is $4,360,411 (2014: $4,873,400).
ii. The Corporation was granted a Single Currency Facility Loan of US$81 million in December 2011. The main components to be addressed under the loan are non-revenue water reduction, wastewater infrastructure improvements and master plan, institutional strengthening and development of a new legal and regulatory framework. Interest accrues on the loan at an annual LIBOR-based interest rate for each quarter as determined on the Interest Rate Determination Date. The loan is repayable in equal bi-annual installments, commencing June 15, 2017, and will terminate no later than May 16, 2036. As at December 31, 2015, the outstanding balance is $56,159,892 (2014: $45,568,630).
(b) The National Insurance Board
In September 2013, the Corporation signed a $10 million loan to finance the design and construction of a one million imperial gallon per day wastewater treatment facility at Gladstone Road. In March 2015, the Corporation signed a supplemental loan agreement to increase the loan by $5 million to complete the construction. The facility, which is expected to be fully operational in late 2016, will provide sewage treatment and re-use water supply for a major resort and treat waste from surrounding subdivisions. The loan accrues interest on the disbursed balance at a rate of 4.75% per annum, is repayable in monthly blended installments of principal and interest of $129,062 beginning January 2016 and will terminate no later than December 31, 2028. As at December 31, 2015, the outstanding balance is $15,000,000 (2014: $9,200,000).
Long-term debt is repayable as follows:
2015 2014 Less than 1 year 1 - 5 years
$ 1,361,345 20,779,697
$ 678,654 15,792,720
More than 5 years 53,379,261 43,170,656 $75,520,303 $59,642,030
31

56
WATER AND SEWERAGE CORPORATION Notes to Financial Statement December 31, 2015 10. EQUITY CONTRIBUTIONS AND DISTRIBUTIONS
Equity contributions represent contributions by the Government to major capital projects. Distributions are payments on loans undertaken by the Government for water and sewer infrastructure projects. The movements in equity contributions during the year are as follows:
New Providence
Family Islands
2015 Total
2014 Total
Balance at January 1 $125,812,451 $45,178,500 $170,990,951 $170,939,443 Contributions - 523,750 523,750 1,786,308 Distributions - (1,251,692) (1,251,692) (1,734,800) Balance at December 31 $125,812,451 $44,450,558 $170,263,009 $170,990,951
11. OPERATING EXPENSES
For the year ended December 31, 2015, operating expenses were as follows:
2015 2014 Water Purchase of water $28,111,885 $34,016,949 Staffing expense (Note 18) 5,963,529 5,587,337 Bad debts and sundry provisions 4,274,299 1,275,494 Electricity 2,262,031 3,304,786 Repairs and maintenance 1,722,321 1,980,555 Fuel and oil 298,397 435,772 Chemicals 243,137 125,739 Office services 195,903 226,490 Outside services 188,325 223,581 Travel 134,056 164,371 Miscellaneous 109,058 119,572 Public relations 6,814 10,827 Training 5,955 14,174 Data processing - 49,496 43,515,710 47,535,143 Sewerage Bad debts and sundry provisions 1,475,409 229,384 Staffing expense (Note 18) 1,218,566 1,212,750 Electricity 577,115 771,293 Repairs and maintenance 549,490 517,051 Fuel and oil 18,506 27,998 Office services 14,242 9,082 Miscellaneous 5,456 4,526 Chemicals 4,830 1,832 3,863,614 2,773,916 Balance carried forward $47,379,324 $50,309,059
32

57
WATER AND SEWERAGE CORPORATION Notes to Financial Statement December 31, 2015 11. OPERATING EXPENSES (continued)
2015 2014 Balance brought forward $47,379,324 $50,309,059 General and administrative Staffing expense (Note 18) 14,287,258 14,685,873 Administrative overhead 1,264,068 1,231,367 Professional and consultancy fees 942,789 909,151 Repairs and maintenance 836,147 898,950 Office services 642,351 703,539 Data processing 417,248 443,834 Bank charges 351,839 298,129 Electricity 257,975 348,713 Public relations 186,629 139,021 Miscellaneous 175,013 111,799 Fuel and oil 125,240 147,721 Training 106,027 157,176 Audit fees 50,970 64,500 Travel 42,782 22,816 Chemicals 2,030 11,699 19,688,366 20,174,288 Total $67,067,690 $70,483,347
12. DEPRECIATION
Depreciation for the year ended December 31, 2015 was as follows:
2015 2014 Water $10,386,319 $10,541,530 Sewerage 3,354,878 3,341,360 General and administrative 419,052 393,089 $14,160,249 $14,275,979
13. FINANCING OF OPERATIONS
The Corporation has incurred significant operating losses in recent years and further losses are projected for the future. As at December 31, 2015, the Corporation’s current liabilities exceeded its current assets by $26,424,745 (2014: $12,260,631) and it has an accumulated deficit of $147,048,897 (2014: $134,391,914). The Corporation is dependent on funding from the Government and it is anticipated that such funding, via the Government's subsidy, will continue to be made available at a level sufficient to allow the Corporation to adequately maintain its operations. In the fiscal year 2015, the Corporation received $24,684,167 (2014: $39,989,012) from the Government of The Bahamas in the form of a subsidy to assist with the cost of operations.
33
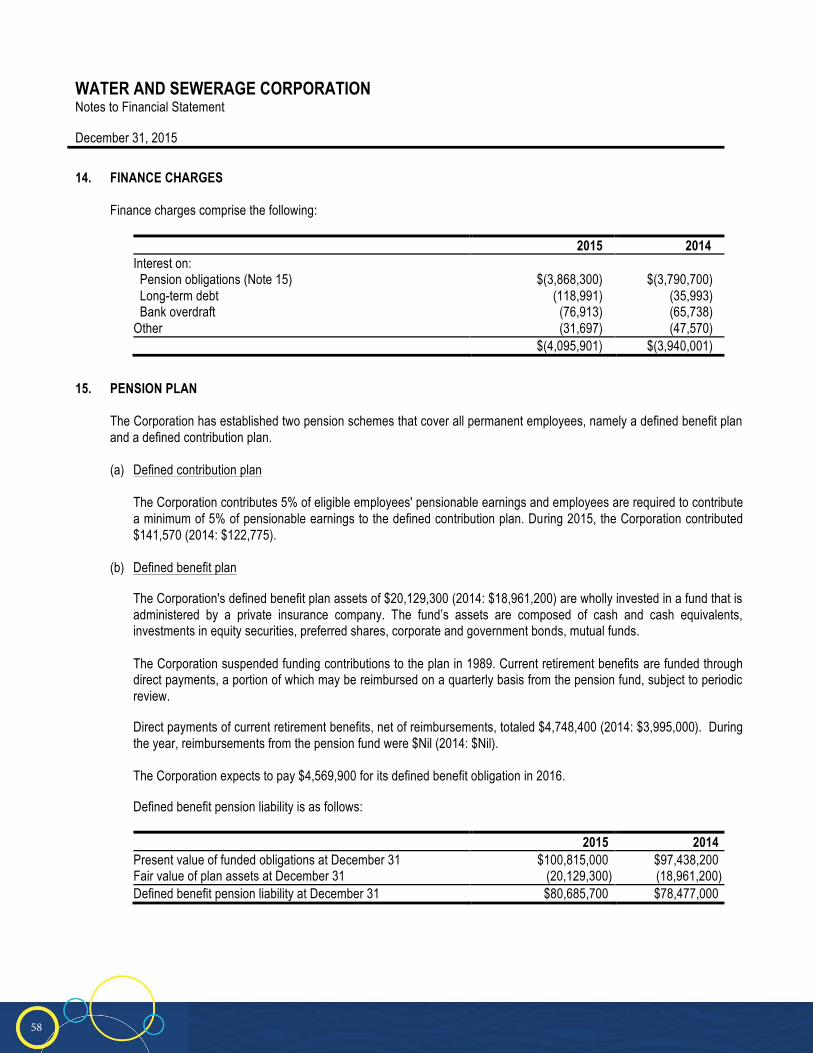
58
WATER AND SEWERAGE CORPORATION Notes to Financial Statement December 31, 2015
14. FINANCE CHARGES
Finance charges comprise the following:
2015 2014 Interest on: Pension obligations (Note 15) $(3,868,300) $(3,790,700) Long-term debt (118,991) (35,993) Bank overdraft (76,913) (65,738) Other (31,697) (47,570) $(4,095,901) $(3,940,001)
15. PENSION PLAN
The Corporation has established two pension schemes that cover all permanent employees, namely a defined benefit plan and a defined contribution plan. (a) Defined contribution plan
The Corporation contributes 5% of eligible employees' pensionable earnings and employees are required to contribute a minimum of 5% of pensionable earnings to the defined contribution plan. During 2015, the Corporation contributed $141,570 (2014: $122,775).
(b) Defined benefit plan
The Corporation's defined benefit plan assets of $20,129,300 (2014: $18,961,200) are wholly invested in a fund that is administered by a private insurance company. The fund’s assets are composed of cash and cash equivalents, investments in equity securities, preferred shares, corporate and government bonds, mutual funds. The Corporation suspended funding contributions to the plan in 1989. Current retirement benefits are funded through direct payments, a portion of which may be reimbursed on a quarterly basis from the pension fund, subject to periodic review. Direct payments of current retirement benefits, net of reimbursements, totaled $4,748,400 (2014: $3,995,000). During the year, reimbursements from the pension fund were $Nil (2014: $Nil). The Corporation expects to pay $4,569,900 for its defined benefit obligation in 2016. Defined benefit pension liability is as follows:
2015 2014 Present value of funded obligations at December 31 $100,815,000 $97,438,200 Fair value of plan assets at December 31 (20,129,300) (18,961,200) Defined benefit pension liability at December 31 $80,685,700 $78,477,000
34

59
WATER AND SEWERAGE CORPORATION Notes to Financial Statement December 31, 2015 15. PENSION PLAN (continued)
(b) Defined benefit plan (continued)
The movement in the defined benefit obligation is as follows:
2015 2014 Defined benefit obligation at January 1 $ 97,438,200 $94,907,800 Current service cost 2,527,400 2,538,200 Interest cost 4,816,400 4,709,000 Actuarial losses (gains) on obligations 781,400 (721,800) Benefits paid (4,748,400) (3,995,000) Defined benefit obligation at December 31 $100,815,000 $97,438,200
The movement in the fair value of the plan assets is as follows:
2015 2014 Fair value of plan assets at January 1 $18,961,200 $18,365,100 Administrative expenses (53,300) (87,300) Interest income 948,100 918,300 Return on plan assets, excluding interest income 273,300 (234,900) Employer's contributions 4,748,400 3,995,000 Benefits paid (4,748,400) (3,995,000) Fair value of plan assets at December 31 $20,129,300 $18,961,200
Expenses recognized in the statement of comprehensive loss under staffing expenses are:
2015 2014 Current service cost $ 2,527,400 $ 2,538,200 Net interest on net defined benefit liability 3,868,300 3,790,700 Other expenses 53,300 87,300 Net pension expense for the year $ 6,449,000 $ 6,416,200
As at December 31, 2015, the present value of the defined benefit obligation was allocated among members in the ratio of 59.0% for active members, 40.2% for pensioners and 0.8% for deferred members.
Re-measurement loss (gain) on defined benefit plan recognized in other comprehensive (loss) income is as follows:
2015 2014 Experience (gain) loss - financial assumptions $(273,300) $ 234,900 Experience loss (gain) - demographic assumptions 781,400 (721,800) Re-measurement loss (gain) $508,100 $(486,900)
35

60
WATER AND SEWERAGE CORPORATION Notes to Financial Statement December 31, 2015 15. PENSION PLAN (continued)
(b) Defined benefit plan (continued)
The movement in defined benefit pension liability is as follows:
2015 2014 Defined benefit pension liability as at January 1 $78,477,000 $76,542,700 Expenses recognized in the statement of comprehensive loss 6,449,000 6,416,200 Re-measurement loss (gain) on defined benefit plan recognized in other comprehensive loss (income) 508,100 (486,900) Benefits paid (4,748,400) (3,995,000) Defined benefit pension liability as at December 31 80,685,700 $78,477,000 Current portion of defined pension liability (4,569,900) (4,273,700) Long-term portion of defined pension liability $76,115,800 $74,203,300 The following were the principal assumptions at the reporting date:
2015 2014 Discount rate 5% p.a. 5% p.a. Expected rate of salary increases 3% p.a. 3% p.a.
Assumptions regarding future mortality are based on published mortality tables.
Sensitivity analysis The calculation of the defined benefit obligation is sensitive to the assumptions used. The following table summarizes how the defined benefit obligation at the reporting date would have changed as a result of a change in one of the assumptions used, while holding the other assumption constant.
Change in defined benefit obligation 1% per annum
increase 1% per annum
decrease Discount rate $(11,678,000) $14,374,200 Future salary increases $ 4,634,200 $(4,175,100)
16. FAIR VALUE OF FINANCIAL INSTRUMENTS
The Corporation estimates that the carrying values of the financial assets and liabilities disclosed in the statement of financial position approximate the fair values at the reporting date for one or more of the following reasons:
(i) Short-term maturities; (ii) Interest rates approximate market rates; and (iii) Carrying values equal fair values.
36

61
WATER AND SEWERAGE CORPORATION Notes to Financial Statement December 31, 2015 17. FINANCIAL RISK MANAGEMENT
The Board of Directors is mainly responsible for the overall risk management approach which includes development and approval of risk strategies, principles, frameworks, policies and limits of the Corporation. It establishes the Corporation's approach to risks and issues in order to make relevant decisions and mitigate risks. The Corporation’s operations expose it to a number of financial risks. A risk management program has been established to protect the Corporation against potential adverse effects of these financial risks. There has been no significant change in these financial risks since the prior year. The most important financial risks to which the Corporation is exposed are liquidity risk, credit risk and market risk.
(a) Liquidity risk
The Corporation is exposed to liquidity risk which is the risk that it might be unable to meet its obligations associated with its financial liabilities when they become due. This risk is mitigated by the Government’s subsidy as stated in Note 13. The Corporation has further undrawn banking facilities of $1.97 million (2014: $1.64 million) at the reporting date which can be used as an additional means of easing liquidity risks, if necessary.
The table below details the remaining contractual maturities of the Corporation’s financial assets and liabilities based on undiscounted cash flows:
2015
Less than 1 month
1 to 3 months
3 to 12 months
1 to 5 years
More than 5 years
Total
Financial assets Cash at bank $ 3,380,047 $ - $ - $ - $ - $ 3,380,047 Accounts receivable 6,275,517 - - - - 6,275,517 9,655,564 - - 9,655,564 Financial liabilities Bank overdraft 1,280,354 - - - - 1,280,354 Short-term borrowings - - 2,150,000 - - 2,150,000 Accounts payable and accrued liabilities 24,269,317 - - - - 24,269,317 Current portion of long-term debt 69,687 393,530 898,128 - - 1,361,345 Long-term debt - - - 20,779,697 53,379,261 74,158,958 $25,619,358 $393,530 $3,048,128 $20,779,697 $53,379,261 $103,219,974
37

62
WATER AND SEWERAGE CORPORATION Notes to Financial Statements December 31, 2015 17. FINANCIAL RISK MANAGEMENT (continued)
(a) Liquidity risk (continued)
2014 Less than
1 month 1 to 3
months 3 to
12 months
1 to 5 years More than
5 years
Total
Financial assets Cash at bank $ 7,916,486 $ - $ - $ - $ - $ 7,916,486 Accounts receivable 12,983,003 - - - - 12,983,003 20,899,489 - - - - 20,899,489 Financial liabilities Bank overdraft 1,639,381 - - - - 1,639,381 Short-term borrowings - - 1,625,000 - - 1,625,000 Accounts payable and accrued liabilities 22,331,947 - - - - 22,331,947 Current portion of long- term debt - 253,328 425,326 - - 678,654 Long-term debt - - - 15,792,720 43,170,656 58,963,376 $23,971,328 $ 253,328 $ 2,050,326 $15,792,720 $43,170,656 $85,238,358
(b) Credit risk
Credit risk is the risk that counterparties to a financial instrument might cause a financial loss for the Corporation by failing to discharge its obligations.
The Corporation’s exposure to credit risk on financial instruments is primarily in respect of accounts receivable and bank balances. There is also credit risk associated with counterparty operating contracts related to desalinated water production under “build-own-operate” arrangements.
Concentration of credit risk with respect to the Corporation’s customers is not significant to any single counterparty as most customers are households and local businesses and is limited to the carrying value of accounts receivable. As the Corporation has the mandate to provide water and sewer services to the residents of The Bahamas, the recorded losses on uncollectible receivables ultimately becomes the responsibility of the owners of the Corporation, which is The Commonwealth of The Bahamas. Credit risk on bank balances is not considered significant because funds are held by reputable and well-established financial institutions. Risk with respect to operating contracts is mitigated by performance and operations securities and buy-out clauses, in the event of counterparty default in respect to material contracts. By law, new premises are required to be connected to water and sewer services where they are available, for which certain minimum or fixed charges accrue, however, some customers elect to use alternative means. The Corporation asserts its right to collect statutory minimum or fixed charges, not withstanding actual usage, on the basis of readiness to serve such customers. Consequently, although significant allowances are made for past due amounts over 120 days, individual accounts are written-off only after legal remedies have been exhausted or it is determined that collection is improbable
38
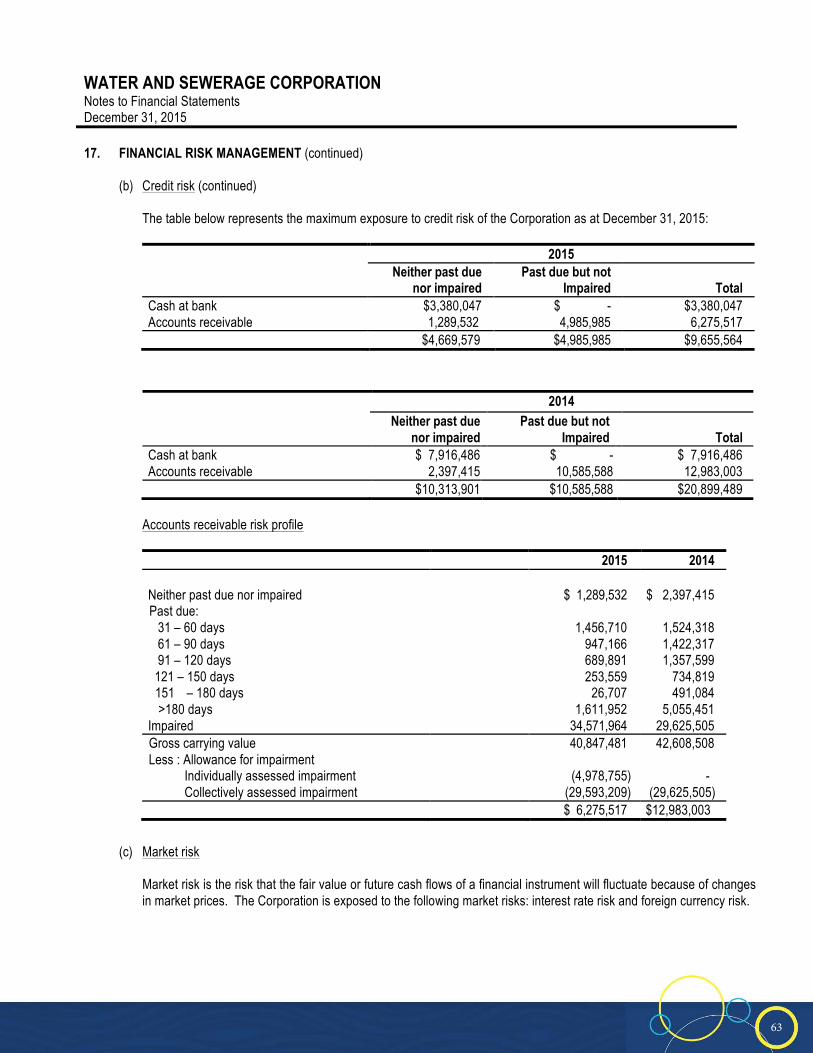
63
WATER AND SEWERAGE CORPORATION Notes to Financial Statements December 31, 2015 17. FINANCIAL RISK MANAGEMENT (continued)
(b) Credit risk (continued)
The table below represents the maximum exposure to credit risk of the Corporation as at December 31, 2015:
2014 Neither past due
nor impaired Past due but not
Impaired
Total Cash at bank $ 7,916,486 $ - $ 7,916,486 Accounts receivable 2,397,415 10,585,588 12,983,003
$10,313,901 $10,585,588 $20,899,489
Accounts receivable risk profile
(c) Market risk
Market risk is the risk that the fair value or future cash flows of a financial instrument will fluctuate because of changes in market prices. The Corporation is exposed to the following market risks: interest rate risk and foreign currency risk.
39
2015 Neither past due
nor impaired Past due but not
Impaired
Total Cash at bank $3,380,047 $ - $3,380,047 Accounts receivable 1,289,532 4,985,985 6,275,517
$4,669,579 $4,985,985 $9,655,564
2015 2014 Neither past due nor impaired Past due: 31 – 60 days 61 – 90 days 91 – 120 days 121 – 150 days
151 – 180 days >180 days
$ 1,289,532
1,456,710
947,166 689,891 253,559 26,707 1,611,952
$ 2,397,415
1,524,318
1,422,317 1,357,599 734,819 491,084 5,055,451
Impaired 34,571,964 29,625,505 Gross carrying value Less : Allowance for impairment Individually assessed impairment Collectively assessed impairment
40,847,481
(4,978,755) (29,593,209)
42,608,508
- (29,625,505)
$ 6,275,517 $12,983,003
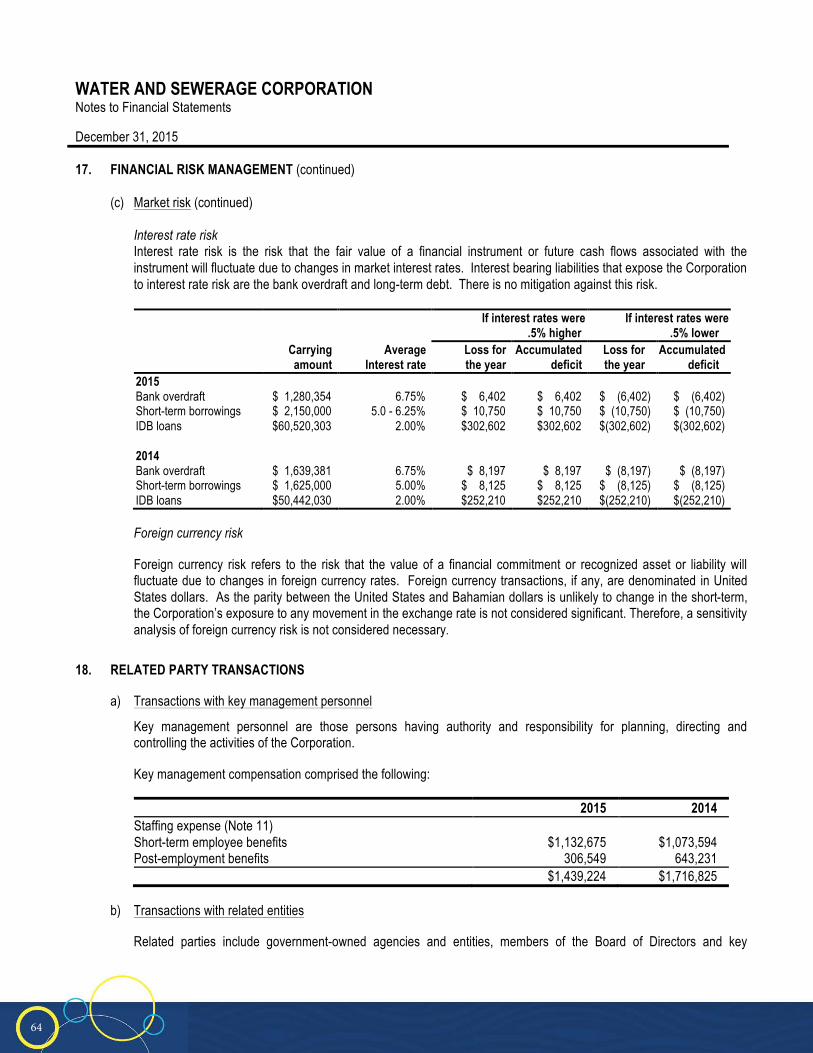
64
WATER AND SEWERAGE CORPORATION Notes to Financial Statements December 31, 2015 17. FINANCIAL RISK MANAGEMENT (continued)
(c) Market risk (continued)
Interest rate risk Interest rate risk is the risk that the fair value of a financial instrument or future cash flows associated with the instrument will fluctuate due to changes in market interest rates. Interest bearing liabilities that expose the Corporation to interest rate risk are the bank overdraft and long-term debt. There is no mitigation against this risk.
If interest rates were
.5% higher If interest rates were
.5% lower Carrying
amount Average
Interest rate Loss for the year
Accumulated deficit
Loss for the year
Accumulated deficit
2015 Bank overdraft $ 1,280,354 6.75% $ 6,402 $ 6,402 $ (6,402) $ (6,402) Short-term borrowings $ 2,150,000 5.0 - 6.25% $ 10,750 $ 10,750 $ (10,750) $ (10,750) IDB loans $60,520,303 2.00% $302,602 $302,602 $(302,602) $(302,602) 2014
Bank overdraft $ 1,639,381 6.75% $ 8,197 $ 8,197 $ (8,197) $ (8,197) Short-term borrowings $ 1,625,000 5.00% $ 8,125 $ 8,125 $ (8,125) $ (8,125) IDB loans $50,442,030 2.00% $252,210 $252,210 $(252,210) $(252,210)
Foreign currency risk
Foreign currency risk refers to the risk that the value of a financial commitment or recognized asset or liability will fluctuate due to changes in foreign currency rates. Foreign currency transactions, if any, are denominated in United States dollars. As the parity between the United States and Bahamian dollars is unlikely to change in the short-term, the Corporation’s exposure to any movement in the exchange rate is not considered significant. Therefore, a sensitivity analysis of foreign currency risk is not considered necessary.
18. RELATED PARTY TRANSACTIONS
a) Transactions with key management personnel
Key management personnel are those persons having authority and responsibility for planning, directing and controlling the activities of the Corporation. Key management compensation comprised the following:
2015 2014 Staffing expense (Note 11) Short-term employee benefits $1,132,675 $1,073,594 Post-employment benefits 306,549 643,231 $1,439,224 $1,716,825
b) Transactions with related entities
Related parties include government-owned agencies and entities, members of the Board of Directors and key management. Additional related party disclosures are included elsewhere in the notes to the financial statements.
40
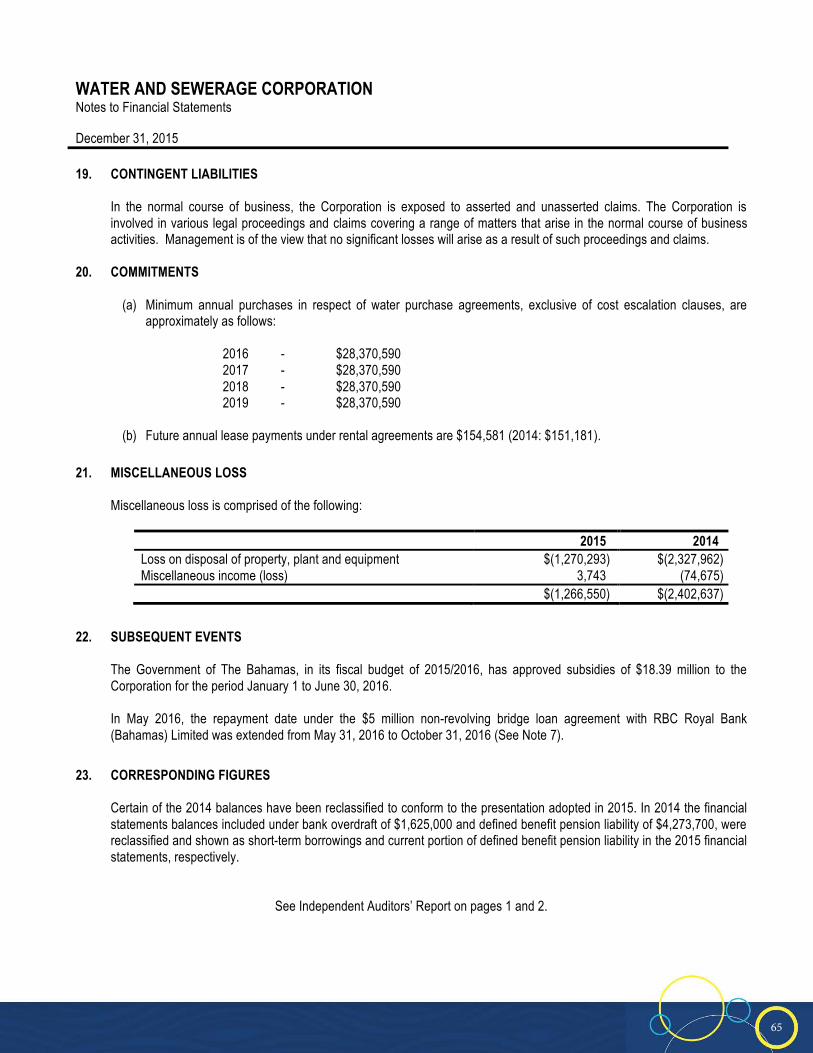
65
WATER AND SEWERAGE CORPORATION Notes to Financial Statements December 31, 2015
19. CONTINGENT LIABILITIES
In the normal course of business, the Corporation is exposed to asserted and unasserted claims. The Corporation is involved in various legal proceedings and claims covering a range of matters that arise in the normal course of business activities. Management is of the view that no significant losses will arise as a result of such proceedings and claims.
20. COMMITMENTS
(a) Minimum annual purchases in respect of water purchase agreements, exclusive of cost escalation clauses, are approximately as follows:
2016 - $28,370,590 2017 - $28,370,590 2018 - $28,370,590 2019 - $28,370,590
(b) Future annual lease payments under rental agreements are $154,581 (2014: $151,181).
21. MISCELLANEOUS LOSS
Miscellaneous loss is comprised of the following:
2015 2014 Loss on disposal of property, plant and equipment $(1,270,293) $(2,327,962) Miscellaneous income (loss) 3,743 (74,675) $(1,266,550) $(2,402,637)
22. SUBSEQUENT EVENTS
The Government of The Bahamas, in its fiscal budget of 2015/2016, has approved subsidies of $18.39 million to the Corporation for the period January 1 to June 30, 2016. In May 2016, the repayment date under the $5 million non-revolving bridge loan agreement with RBC Royal Bank (Bahamas) Limited was extended from May 31, 2016 to October 31, 2016 (See Note 7).
23. CORRESPONDING FIGURES
Certain of the 2014 balances have been reclassified to conform to the presentation adopted in 2015. In 2014 the financial statements balances included under bank overdraft of $1,625,000 and defined benefit pension liability of $4,273,700, were reclassified and shown as short-term borrowings and current portion of defined benefit pension liability in the 2015 financial statements, respectively.
See Independent Auditors’ Report on pages 1 and 2.
41


67

68