table of contents - virginia tech
TRANSCRIPT

Table of Contents Recommended Small Grain Varieties ........................................................................................................................... 1 Barley and Wheat Entries ......................................................................................................................................................... 3 Introduction and The Season ................................................................................................................................................ 5 Section 1: Barley Varieties Discussion of barley varieties and summary of barley management practices for the ............................................... 8 2018 harvest season Table 1. Summary of performance of entries in the Virginia Tech Hulless Barley Test .......................................... 12 over locations, 2018 harvest. Table 2. Two-year average summary of performance of entries in the Virginia ....................................................... 13 Tech Hulless Barley Tests, 2017 and 2018 harvests. Table 3. Three-year average summary of performance of entries in the Virginia .................................................... 14 Tech Hulless Barley Tests, 2016, 2017, and 2018 harvests. Table 4. Summary of performance of entries in the Virginia Tech Hulless Barley Test, ......................................... 15 Southern Piedmont AREC, Blackstone VA, 2018 harvest. Table 5. Summary of performance of entries in the Virginia Tech Hulless Barley Test, ......................................... 16 Tidewater AREC, Holland VA, 2018 harvest. Table 6. Summary of performance of entries in the Virginia Tech Hulless Barley Test, ......................................... 17 Eastern Virginia AREC, Warsaw, VA, 2018 harvest. Table 7. Summary of performance of entries in the Virginia Tech Hulless Barley Test, ......................................... 18 Eastern Shore AREC, Painter, VA, 2018 harvest. Table 8. Summary of performance of entries in the Virginia Tech Hulless Barley Test, ......................................... 19 Northern Piedmont Center, Orange, VA, 2018 harvest. Table 9. Summary of performance of entries in the Virginia Tech Hulless Barley Test, ......................................... 20 Kentland Farm, Blacksburg, VA, 2018 harvest. Table 10. Summary of performance of entries in the Virginia Tech Barley Test over ............................................... 21 locations, 2018 harvest. Table 11. Two-year average summary of performance of entries in the Virginia Tech ............................................ 23 Barley Tests, 2017 and 2018 harvests. Table 12. Three-year average summary of performance of entries in the Virginia Tech ......................................... 24 Barley Tests, 2016, 2017, and 2018 harvests. Table 13. Summary of performance of entries in the Virginia Tech Barley Test, ......................................................... 25 Southern Piedmont AREC, Blackstone VA, 2018 harvest. Table 14. Summary of performance of entries in the Virginia Tech Barley Test, ......................................................... 27 Tidewater AREC, Holland VA, 2018 harvest. Table 15. Summary of performance of entries in the Virginia Tech Barley Test, ......................................................... 29 Eastern Virginia AREC, Warsaw, VA, 2018 harvest. Table 16. Summary of performance of entries in the Virginia Tech Barley Test, ......................................................... 31 Eastern Shore AREC, Painter, VA, 2018 harvest. Table 17. Summary of performance of entries in the Virginia Tech Barley Test, ......................................................... 33 Northern Piedmont Center, Orange, VA, 2018 harvest. Table 18. Summary of performance of entries in the Virginia Tech Barley Test, ......................................................... 35 Kentland Farm, Blacksburg, VA, 2018 harvest. Table 19. Summary of performance of entries in the Virginia Tech Eastern Malting Barley ................................... 37 Test over locations, 2018 harvest. Table 20. Summary of performance of entries in the Virginia Tech Eastern Malting Barley ................................... 38 Test, Southern Piedmont AREC, Blackstone VA, 2018 harvest. Table 21. Summary of performance of entries in the Virginia Tech Eastern Malting Barley Test, ....................... 39 Eastern Virginia AREC, Warsaw, VA, 2018 harvest.

Table 22. Summary of performance of entries in the Virginia Tech Eastern Malting Barley Test, ....................... 40 Kentland Farm, Blacksburg, VA, 2018 harvest. Section 2: Barley Scab Research Discussion of reaction of entries in the 2017-18 Virginia Tech Hulless Barley and Barley ...................................... 41 Tests to Fusarium head blight. Table 23. Summary of reaction of entries in Virginia Tech State Hulless Barley Test to Fusarium ..................... 42 head blight (scab), 2018 harvest. Table 24. Two-year average summary of entries in the Virginia Tech State Hulless Test to Fusarium ............. 43 head blight (scab), 2017 and 2018 harvests. Table 25. Summary of reaction of entries in Virginia Tech State Barley Test to Fusarium ..................................... 44 head blight (scab), 2018 harvest. Table 26. Two-year average summary of entries in the Virginia Tech State Barley Tests to Fusarium ............ 45 head blight (scab), 2017 and 2018 harvests. Section 3: Wheat Varieties Discussion of wheat varieties and summary of wheat management practices for the 2018 harvest season ... 46 Entries in the 2017-18 Virginia Wheat Test, arranged by company .................................................................... 48 Table 27. Summary of performance of entries in the Virginia Tech Wheat Test, 2018 harvest. ............................ 52 Table 28. Two-year average summary of performance of entries in the Virginia Tech ............................................ 56 Wheat Tests, 2017 and 2018 harvests. Table 29. Three-year average summary of performance of entries in the Virginia Tech ......................................... 59 Wheat Tests, 2016, 2017, and 2018 harvests. Table 30. Summary of performance of entries in the Virginia Tech Wheat Test, ......................................................... 61 Eastern Virginia AREC, Warsaw, VA, 2018 harvest. Table 31. Summary of performance of entries in the Virginia Tech Wheat Test, Eastern Shore .......................... 65 AREC, Painter, VA, 2018 harvest. Table 32. Summary of performance of entries in the Virginia Tech Wheat Test, Southern Piedmont .............. 69 AREC, Blackstone, VA, 2018 harvest. Table 33. Summary of performance of entries in the Virginia Tech Wheat Test, Northern Piedmont, .............. 73 Center, Orange, VA, 2018 harvest. Table 34. Summary of performance of entries in the Virginia Tech Wheat Test, Kentland Farm, ........................ 77 Blacksburg, VA, 2018 harvest. Table 35. Summary of performance of entries in the Virginia Tech Wheat Test, ......................................................... 81 Tidewater AREC, Holland, VA, 2018 harvest. Table 36. Summary of performance of entries in the Virginia Tech Wheat Test, Mark Deavers’ Farm, ............ 85 Rockingham County, VA, 2018 harvest. Section 4: Milling and Baking Quality Discussion of milling and baking quality of entries in the 2016-17 Virginia Wheat Test .................................. 89 Table 37. Milling and baking quality of entries in the Virginia Tech Wheat Test based on ..................................... 91 evaluation of the 2017 harvest. Section 5: Wheat Scab Research Discussion of reaction of entries in the 2017-18 Virginia Tech Wheat Test to Fusarium head blight .................. 93 Table 38. Summary of reaction of entries in the Virginia Tech State Wheat Test to Fusarium .............................. 94 head blight (scab), 2018 harvest. Table 39. Two-year average summary of reaction of entries in the Virginia Tech State Wheat Test .................. 98 to Fusarium head blight (scab), 2017 and 2018 harvests.

Recommended Small Grain VarietiesThe following are the small grain variety recommendations for Virginia in 2018. The recommendations are based on the agronomic performancein wheat and barley variety tests conducted by the Research and Extension Divisions of Virginia Tech in the various agricultural regions of the state.All varieties listed have produced excellent yield compared to others of similar maturity.
Recommended Wheat Varieties Arranged in Order of Maturity
Cultivar Test Weight
Fusarium Head Blight Resistance
Powdery Mildew
ResistanceLeaf Rust
ResistanceStripe Rust Resistance
Leaf Blotch Resistance
Barley Yellow Dwarf
Virus Tolerance
Milling Quality Grade (A - F)
SRW Baking Quality Grade (A - F)
PGX 16-7 Very Good Moderate Excellent Good Excellent Very Good Very Good D DMAS 61 Moderate Very Good Moderate Very Good Good Very Good Very Good C DSY Viper Excellent Moderate Very Good Poor Excellent Good Good D F
AgriMAXX 474 Poor Moderate Very Good Poor Excellent Moderate Good A FDyna-Gro 9811 Very Good Good Excellent Excellent Excellent Very Good Good C D
Pioneer Brand 26R59 Good Moderate Excellent Poor Excellent Moderate Moderate B DHilliard Very Good Very Good Excellent Very Good Excellent Very Good Very Good C D
AgriMAXX 415 Excellent Very Good Moderate Good Very Good Good Good B CUSG 3895 Moderate Moderate Poor Very Good Excellent Very Good Excellent A D
Shirley Poor Moderate Excellent Excellent Poor Very Good Very Good B DCROPLAN 8550 Good Good Excellent Excellent Excellent Good Very Good A D
Pioneer Brand 26R41 Moderate Good Very Good Good Excellent Moderate Good B D
#Bullet Good Good Excellent Very Good Excellent Very Good Good A FL11550 Excellent Good Good Excellent Excellent Very Good Good C D
Pioneer 26R10 Good Good Moderate Poor Excellent Good Good B DMBX 14S-210 Good Very Good Moderate Excellent Good Good Very Good B F
MAS 7 Very Good Good Very Good Poor Very Good Good Good C DAgriMAXX 446 Good Moderate Moderate Poor Excellent Poor Good A D
USG 3404 Moderate Very Good Moderate Poor Excellent Good Very Good A FAgriMAXX 444 Moderate Very Good Moderate Poor Excellent Good Very Good A D
Early Heading Varieties (117 - 118 d, Julian)
Mid-Season Heading Varieties (119 - 120 d, Julian)
Full-Season Heading Varieties (121 d, Julian)
1
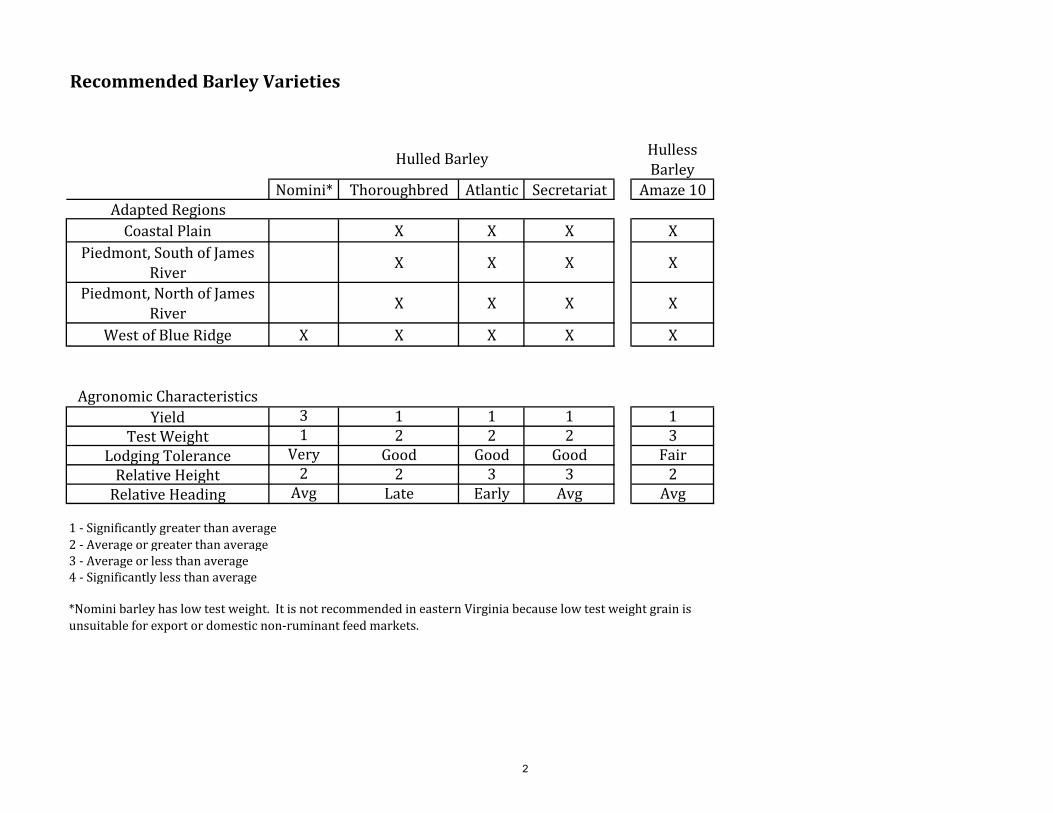
Recommended Barley Varieties
Hulless Barley
Nomini* Thoroughbred Atlantic Secretariat Amaze 10Adapted Regions
Coastal Plain X X X XPiedmont, South of James
River X X X X
Piedmont, North of James River X X X X
West of Blue Ridge X X X X X
Agronomic CharacteristicsYield 3 1 1 1 1
Test Weight 1 2 2 2 3Lodging Tolerance Very Good Good Good Fair
Relative Height 2 2 3 3 2Relative Heading Avg Late Early Avg Avg
1 - Significantly greater than average2 - Average or greater than average3 - Average or less than average4 - Significantly less than average
*Nomini barley has low test weight. It is not recommended in eastern Virginia because low test weight grain isunsuitable for export or domestic non-ruminant feed markets.
Hulled Barley
2

Barley and Wheat Entries
Commercial Barley Entries
Limagrain Cereal Seed (LCS), 7707 Jackson Pond Dr, Charlotte, NC 28273 – Calypso and Violetta. Virginia Tech and Virginia Crop Improvement Association (VT and VCIA), 9142 Atlee Station Road, Mechanicsville, VA 23116 – Amaze 10, Atlantic, Barsoy, Callao, Dan, Doyce, Eve, Nomini, Price, Secretariat, Thoroughbred, and Wysor.
Commercial and Experimental Wheat Entries
AgriMAXX Wheat Company (AgriMAXX), 7167 Highbanks Road, Mascoutah, IL 62258 – 415, 444, 446, 463, 473, 474, 480, 485, 486, Exp 1874, and Exp 1892. Armor Seed, LLC (Armor), 183 Pennsylvania Avenue, Waldenburg, AR 72475 – Mayhem, Nemesis, Riptide, ARW1716, ARW1719, ARW1762, and ARW1766. Crop Production Services (Dyna-Gro), 15277 Richmond-Tappahannock Highway, St Stephens Church, VA 23148 - 9522, 9600, 9701, 9750, 9772, 9862, Shirley, 9811, and WX17775. Dupont Pioneer (Pioneer), 425 Abbeydale Way, Columbia, SC 29229 - 26R10, 26R36, 26R41, 26R45, and 26R59. Eddie Mercer Agri-Services (Mercer Brand), Inc, 6900 Linganore Road, Frederick, MD 21702 – MBX 14-S-210, MBX 18-A-237, MBX 17-P-275, and MBX 17-M-245. Erwin-Keith, Inc. (Progeny), 1529 Highway 193, Wynne, AR 72396 – #Boss, #Bullet, #Turbo, #Warrior, PGX16-3, PGX 16-7, and PGX 17-16. Featherstone Farm Seed (Featherstone), 13941 Genito Road, Amelia, VA 23002 – Featherstone 73. University of Georgia (UGA), 1109 Experiment Street, Griffin, GA 30223 – GA061471-15LE38 and GA08535-15LE29. Limagrain Cereal Seeds (LCS), 7099 Parkbrook Lane, Cordova, TN 38018 - L11551, L11719, L11550 and LCS Ammo. University of Maryland (UMD), 1116 Research Greenhouse Complex, University of Maryland, College Park, MD 20742 –15MDX5, 15MDX18, 15MDX20, and Luisa. Meherrin Ag & Chemical (Southern Harvest), 413 Main Street, Severn, NC 27877 – SH 4300, SH 4400, SH 7200, and SH 7510. Mid Atlantic Seeds (Mid-Atlantic), 316 N. Albemarle Street #6, York, PA 17403 –MAS #7, MAS #61, MAS #65, MAS #116, MAS #316, MAS #83, MAS #84, MAS #85, MAS #86, and MAS #87. NC State University (NCSU), 840 Method Road Unit 3, Raleigh, NC 27695 – NC13-20076, NC13-21213, and NC14-23372. Syngenta Seeds, Inc. (Agri-Pro), 806 N. 2nd St, Berthoud, CO 80513 – SY 547, SY Miskin, and SY Viper. Tidewater Seed LLC (Tidewater), 29000 Information Lane Suite 302, Easton, MD 21601 – TWS2616, TWS2818, and TWS3418. UniSouth Genetics (USG), 3205 C Highway 46S, Dickson, TN 37055 – 3118, 3197, 3228, 3316, 3329, 3404, 3429, 3458, 3536, and 3895. Virginia Tech and Virginia Crop Improvement Association (VT and VCIA), 9142 Atlee Station Road, Mechanicsville, VA 23111 – Massey and all lines prefixed by VA and DH. Winfield United (CROPLAN), 1080 County Road F West, MS 5850, Shoreview, MN 55126-2910 – SRW 8415, SRW 8550, SRW 9415, and SRW 9606.
Appreciation is expressed to the Virginia Small Grains Check-Off Board, AgriMAXX, Armor Seed LLC, Crop Production Services, Dupont Pioneer, Eddie Mercer Agri-Services, Inc., Erwin-Keith, Inc., Featherstone Farm Seed, Inc., Limagrain Cereal Seeds, Meherrin Ag & Chemical, Mid-Atlantic Seeds, Syngenta Seeds, Inc., Tidewater Seed LLC, UniSouth Genetics, Inc., Winfield United, and the Virginia Crop Improvement Association for their financial support of the Small Grains Variety Testing Program at Virginia Tech. Conducted and summarized by the following Virginia Tech employees: Dr. Wade Thomason, Extension Agronomist, Grains; Dr. Carl Griffey, Small Grains Breeder; Mr. Harry Behl, Agricultural Supervisor; Ms.
3

Elizabeth Rucker, Research Associate: Dr. Bee Khim Chim, Post-Doctoral Assistant. Location Supervisors: Mr. Tom Custis (Painter); Dr. David Langston and Mr. Karl Jones (Holland); Mr. Robert Pitman, Dr. Joseph Oakes and Mr. Mark Vaughn, (Warsaw); Mr. Ned Jones (Blackstone); Dr. Carl Griffey, Mr. Wynse Brooks, Mr. Jon Light (Blacksburg); Mr. Doug Horn (Shenandoah Valley); Mr. Brad Lael (Orange).
4

Introduction
The following tables present results from barley and wheat varietal tests conducted in Virginia in 2016-2018. Small-grain cultivar performance tests are conducted each year in Virginia by the Virginia Tech Department of Crop and Soil Environmental Sciences and the Virginia Agricultural Experiment Station. The tests provide information to assist Virginia Cooperative Extension Service agents in formulating cultivar recommendations for small grain producers and to companies developing cultivars and/or marketing seed within the state. Yield data are given for individual locations and across locations and years; yield and other performance characteristics are averaged over the number of locations indicated in parenthesis near the column heading. Performance of a given variety often varies widely over locations and years which makes multiple location-year averages a more reliable indication of expected performance than data from a single year or location. Details about management practices for barley and wheat are listed for each experimental location.
The Season - 2018
Statewide temperatures and rainfall in fall 2017 were generally favorable for wheat seeding after fields dried from the soaking from Hurricane Matthew. By mid-October, wheat planting reached 20% of intentions, compared with a five year average of 25% by this date. Continued favorable weather allowed 41% and 72% of the wheat and barley crops, respectively to be planted by October 3. By mid-November, planting progress was near the five year average for all small grains reported with 53 and 60% of barley and wheat acres reported as good or excellent. Dry conditions persisted through late November results in a decline in the number of wheat and barley acres rated excellent, though this did allow successful late seeding in some areas. Rainfall in early December returned the total season precipitation to near normal, followed by mild and wet conditions through much of January. February was unseasonably warm with limited rainfall, resulting in soil moisture depletion. Barley and wheat rated were rated good or excellent on 46 and 68% of acres, respectively. March brought mostly mild temperatures with a freeze mid-month. Seventy-five % of the winter wheat crop was rated good or excellent for the week ending March 26. Statewide rains were received in mid-March, but season total rainfall continued below normal. By the end of the third week of March, 33% of the wheat crop was reported as headed, up 14% from last year and 23% from the five-year average. Dry soil conditions continued through mid-April with temperature above average through the last half of the month. At the end of April, 75% of the winter wheat crop was still rated good or excellent. Precipitation varied statewide in the first two weeks of May, with 74% of the wheat crop headed, compared with 85% in 2017, but exactly the same as the five year average for this date. Most areas received significant rainfall in the last half of May resulting in a decline in small grain crop quality and increased risk of Fusarium head blight. On June 17, 43% of barley for grain was harvested as was 30% of winter wheat. Heavy rains continued in many areas in mid-late June. Fifty-three percent of wheat was harvested by June 24, 10% behind 2017 but 7% ahead of the five-year average for this date. On July 1, 73% of the wheat crop was harvested with many producers reporting slightly lower yields and poor test weights. The USDA NASS reports that Virginia
5

farmers will harvest 11 million acres of wheat from 175,000 acres in 2018, up 15% from 2017. A yield of 63 bu/ac is expected, down 3 bushels from 2017.
6

Figure 1. 2017-18 and 30-yr mean cumulative growing season precipitation for Virginia.
Figure 2. Growing season daily average temperature, 2017-18 and 30-yr mean.
0
5
10
15
20
25
30
35
40
45
1-Oct 1-Nov 1-Dec 1-Jan 1-Feb 1-Mar 1-Apr 1-May 1-Jun
Cum
ulat
ive
rain
fall,
in
2017-18
30-yr Avg
0
10
20
30
40
50
60
70
80
90
100
Daily
Ave
rage
Tem
pera
ture
, °F
2017-18
30-yr Avg
7
Section 1: Barley Varieties The Virginia Tech barley-breeding program is the largest and, until recently, was the only remaining public program in the eastern United States. Our program is significantly diverse with breeding efforts focused on development of superior, widely adapted, high-yielding winter barley cultivars and a major focus on incorporation of value-added traits geared toward development of new markets. As a result, nine winter feed barley (5-hulled and 4-hulless) were released from the program since 1990. Meanwhile, due to the continued decline in price and production of feed barley, and increasing interest from local and regional maltsters and brewers, the Virginia Tech breeding program has shifted emphasis of the barley program to rapid development of adapted winter malting barley varieties. This goal is being accomplished via development and testing of doubled haploid (DH) lines, and the formation of a collaborative Eastern Malt Barley Trial (EMBT) in which elite lines will be evaluated in neighboring states including North Carolina and Kentucky to facilitate collaborations and enhance variety development. As interest grows in this nursery the number of cooperators will likely expand to include additional nursery in other eastern states. In addition, our program is collaborating with barley breeders in twenty three states and also with breeders in Europe on winter malt barley research. It is anticipated that several potential winter malt barley releases will be grown and tested in pilot evaluation nurseries and breeder seed developed in 2018-2019. As such, our most important work will continue to be associated with malting barley varietal development. Development of improved variety is a cooperative effort between breeding programs and the end users (malting and brewing industry). End-users dictate goals of the breeding program. Contributions are through the direct testing of germplasm, research to help improve our understanding of the genetics of quality, and screening of FHB/DON resistance lines.
Meanwhile, we have continued to make progress improving resistance to FHB (Fusarium Head Blight). We are using marker assisted selection (MAS) to incorporate unique FHB resistant Quantitative Trait Loci (QTL) into our high yielding barley varieties and breeding lines. A resistance QTL associated with scab severity, DON toxin and Fusarium Damaged kernel (FDK) was recently identified in one of our hulless barley varieties, Eve. We are also using Double Haploid (DH) breeding method in collaboration with Oregon State University. This will reduce our breeding cycle by at least 3-4 years and could have a dramatic impacton breeding progress.
As interest continues to grow in locally produced ingredients from the craft brewing industry in the mid-Atlantic and eastern U.S. finding malted barley is not easy for those located east of the Mississippi river. This has triggered significant demand for malt barley. We are trying to bridge this gap by evaluating malt barley cultivars developed by collaborators in the U.S and Europe while rapidly developing and testing our own malt barley experimental lines. Locally produced malting barley is good for Virginia’s economy and farmers can earn a $3 to $4 premium for growing malting barley. Virginia currently grows around 45,000 acres of feed barley annually which could be converted to the production of malting barley as well as fostering an expansion in total barley acreage. Winter grown malt barley is more sustainable since it is grown from October to June, providing farmers the added double crop opportunities with soybeans in the summer. According to the Brewers Association, Virginia’s 124 craft breweries currently produce over 274,000 barrels of craft beer annually and have an economic impact of over a million dollars. Our main effort is breeding winter Malt barley cultivars that have superior malt
8

quality and are well adapted to the mid-Atlantic and southeastern United States. We have a graduate student, Nicholas Meier, developing molecular markers for malting quality traits to help us select superior quality malting lines with more precision and eliminate costly testing expenses. Nick is also working on flavor analysis of commonly grown cultivars to determine how malt flavor is affected by genetics and environment. We anticipate that interest in production of malt barley will continue to grow in this region and we plan to release varieties to meet diverse market demands. Our future allotment of resources will continue to provide more resources to our winter malt barley as the industry continues to grow.
Hulless Barley
Hulless barley tests were planted in seven-inch rows at Blackstone, Orange, Holland, and Painter. They were planted in six-inch rows at Warsaw and Blacksburg. The no-till site at Holland was planted at 66 seeds per square foot. All other locations were planted at 60 seeds per square foot.
In the 2018 harvest year, grain yield for Doyce hulless barley in Virginia was 68 bushels per acre with test weight of 47.8 pounds per bushel. Average grain yield of Eve was 73 bushels per acre with test weight of 54.2 pounds per bushel. Average grain yield of Amaze 10 was 72 bushels per acre with a test weight of 52.5 pounds per bushel. Dan had the highest average grain yield (74 bushels per acre) among released cultivars (Eve, Amaze 10 and Doyce). It produced a test weight of 53.9 pounds/bushel that was similar to Eve (54.2 pounds/bushel) and 6.1 pounds per bushel higher than Doyce (47.8 pounds/bushel). The 2-row experimental line VA16H-27 (2R) had the highest overall average grain yield (85 bushels per acre) that was 11 bushels per acre higher than that of Dan, 12 bushels per acre higher than Eve (73 bushels per acre), 13 bushels per acre higher than Amaze 10 (72 bushels/acre), 17 bushels
per acre higher than Doyce, and 9 bushels per acre more than the test average.
Hulled Barley
Hulled barley tests were planted in seven-inch rows at Blackstone, Orange, Holland, and Painter. They were planted in six-inch rows at Warsaw and Blacksburg. The no-till site at Holland was planted at 48 seeds per square foot. All other locations were planted at 44 seeds per square foot.
In the 2018 harvest year, the overall grain yield of Thoroughbred was 86 bushels per acre with an average test weight of 43.2 pounds per bushel compared to the mean yield of 87 bushels per acre and a test weight of 45.4 pounds per bushel for the mean of all cultivars tested. Average grain yield of Secretariat (90 bushels per acre) was 2 bushels per acre higher than Atlantic (88 bushels per acre), 4 bushels per acre higher than Thoroughbred, 5 bushels per acre higher than Price, 17 bushels per acre higher than Nomini and 18 bushels per acre higher than Callao. However, the experimental line VA16B-217 (LA) had the highest average overall grain yield (100 bushel per acre) that was 10 bushel per acre higher than Secretariat, 14 bushel per acre more than Thoroughbred and 13 bushel per acre higher than the overall test mean. In addition, two other experimental lines (VA16B-236 LA and VA16B-263 LA) ranked 2nd and 3rd respectively in average grain yield (98 bushels per acre) that were 8 bushels per acre higher than that of Secretariat and 12 bushels per acre higher than Thoroughbred.
Malt Barley
Malt barley tests were planted in seven-inch rows at Blackstone and in six-inch rows at Warsaw and Blacksburg; at 44 seeds per square foot.
9

In the 2018 harvest year, average grain yield of Virginia malt experimental line VA16M-84 (2R) (92 Bu/ac) was similar to Flavia, 1 bushel per acre less than Calypso (93 Bu/ac), 2 bushel per acre higher than Violetta (90 Bu/ac) and significantly higher than Thoroughbred (79 Bu/ac). VA16M-84 also had test weight (49.4 Lb/bu) that was 7 pounds heavier than Calypso, Flavia and Thoroughbred (42.9, 42.9 and 42.0 Lb/bu) respectively in test weight, 5 pounds more than Violetta (44.7 Lb/bu) and 4 pounds heavier than overall test average (45.7 Lb/bu). Two other Virginia malt barley DH lines VA16M-14DH12-85 and VA16M-14DH12-69 had average grain yield 91 and 90 Bu/ac respectively that were similar to Violetta, 2 to 3 bushels per acre lower than Calypso and Flavia, and significantly higher than Thoroughbred. These new malt barley results are encouraging and indicate that significant progress is being made by the breeding program in developing barley cultivars with high yield and improved disease resistance.
10
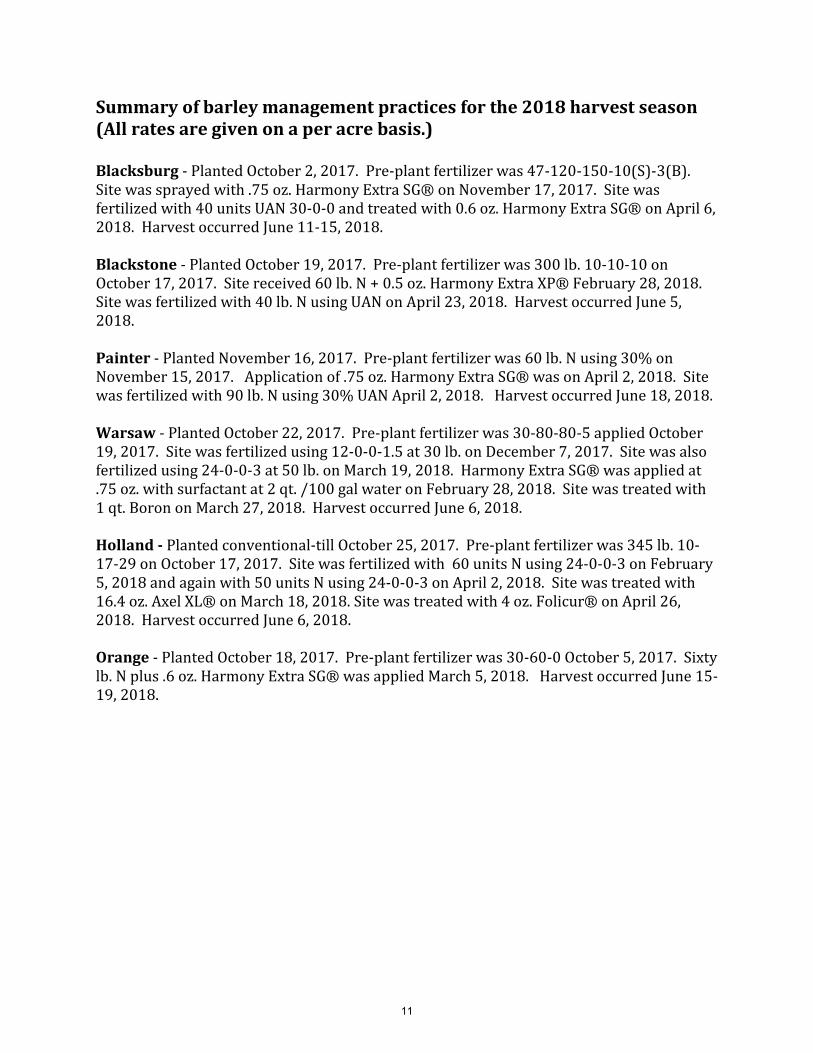
Summary of barley management practices for the 2018 harvest season (All rates are given on a per acre basis.)
Blacksburg - Planted October 2, 2017. Pre-plant fertilizer was 47-120-150-10(S)-3(B). Site was sprayed with .75 oz. Harmony Extra SG® on November 17, 2017. Site was fertilized with 40 units UAN 30-0-0 and treated with 0.6 oz. Harmony Extra SG® on April 6, 2018. Harvest occurred June 11-15, 2018.
Blackstone - Planted October 19, 2017. Pre-plant fertilizer was 300 lb. 10-10-10 on October 17, 2017. Site received 60 lb. N + 0.5 oz. Harmony Extra XP® February 28, 2018. Site was fertilized with 40 lb. N using UAN on April 23, 2018. Harvest occurred June 5, 2018.
Painter - Planted November 16, 2017. Pre-plant fertilizer was 60 lb. N using 30% on November 15, 2017. Application of .75 oz. Harmony Extra SG® was on April 2, 2018. Site was fertilized with 90 lb. N using 30% UAN April 2, 2018. Harvest occurred June 18, 2018.
Warsaw - Planted October 22, 2017. Pre-plant fertilizer was 30-80-80-5 applied October 19, 2017. Site was fertilized using 12-0-0-1.5 at 30 lb. on December 7, 2017. Site was also fertilized using 24-0-0-3 at 50 lb. on March 19, 2018. Harmony Extra SG® was applied at .75 oz. with surfactant at 2 qt. /100 gal water on February 28, 2018. Site was treated with 1 qt. Boron on March 27, 2018. Harvest occurred June 6, 2018.
Holland - Planted conventional-till October 25, 2017. Pre-plant fertilizer was 345 lb. 10-17-29 on October 17, 2017. Site was fertilized with 60 units N using 24-0-0-3 on February5, 2018 and again with 50 units N using 24-0-0-3 on April 2, 2018. Site was treated with16.4 oz. Axel XL® on March 18, 2018. Site was treated with 4 oz. Folicur® on April 26,2018. Harvest occurred June 6, 2018.
Orange - Planted October 18, 2017. Pre-plant fertilizer was 30-60-0 October 5, 2017. Sixty lb. N plus .6 oz. Harmony Extra SG® was applied March 5, 2018. Harvest occurred June 15-19, 2018.
11

Hulless Lines
VA16H-27 2R 85.4 + 53.0 123 + 38 4 0 4 2 - 28VA15H-73 2R 82.8 + 54.4 + 121 38 2 - 0 4 3 16 -VA16H-28 2R 82.2 + 53.4 123 + 38 4 0 5 + 2 31VA16H-26 2R 82.0 + 53.2 123 + 37 4 0 4 3 32VA16H-24 2R 81.6 + 53.7 123 + 38 4 0 5 2 - 23 -VA15H-79 WS 81.0 + 53.8 118 - 38 4 0 3 - 2 65VA06H-79 79.9 52.9 119 - 38 4 0 6 + 4 68VA14H-33 79.5 54.9 + 118 - 37 3 - 0 3 2 - 52VA16H-25 2R 78.7 54.4 + 120 - 38 5 0 3 2 27VA16H-160 78.6 53.4 119 - 36 4 1 3 3 67VA15H-9 77.9 53.0 119 - 37 4 1 2 - 4 57VA16H-159 77.1 52.8 121 + 34 - 4 1 4 3 47VA15H-11 76.7 53.9 119 - 38 5 0 2 - 2 - 37VA16H-276 Seg. 76.0 53.0 121 36 2 - 0 4 3 82 +VA06H-25 75.2 52.5 - 122 + 38 5 1 4 6 + 64VA15H-12 74.6 54.1 + 119 - 37 5 + 0 2 - 2 38Dan 74.3 53.9 119 - 37 4 0 5 + 4 61VA15H-119 WS 73.7 53.8 121 + 39 + 4 0 4 3 63VA16H-89 73.1 54.4 + 122 + 38 4 3 + 4 3 65VA07H-35 WS 72.9 52.5 - 122 + 36 5 + 2 + 3 5 + 68Eve 72.9 54.2 + 114 - 35 - 5 1 4 5 + 59VA15H-118 WS 72.7 54.0 + 121 + 38 5 1 3 3 60VA15H-90 WS 72.6 55.0 + 119 - 38 4 0 4 3 50Amaze 10 72.2 52.5 - 121 + 37 5 2 3 6 + 71VA08H-79 WS 72.1 51.0 - 121 + 36 5 0 8 + 4 70VA16H-218 WS 71.9 53.2 122 + 37 4 1 3 4 70VA16H-247 71.6 - 53.6 120 35 - 5 1 3 4 74VA16H-158 71.3 - 53.2 123 + 35 - 5 0 5 2 - 71VA14H-58 70.9 - 54.7 + 120 - 37 6 + 0 2 - 5 + 58Doyce 67.5 - 47.8 - 119 - 37 6 + 1 3 5 + 68Average 76.0 53.3 120 37 4 0 4 3 55LSD (0.05) 4.2 0.6 1 2 1 1 1 1 28C.V. 8.7 2.1 1 5 40 171 22 25 37Released cultivars are shown in bold print. The number in parentheses below column headings indicates the number of locations on which data are based.Varieties are ordered by descending yield averages. A plus or minus sign indicates a performance significantly above or below the test average.The 0-9 ratings indicate a genotype's response to disease or lodging where 0 = highly resistant and 9 = highly susceptible.
Mildew(0-9)
(1)(5) (6) (2) (3) (6)48 lb/bu) (Lb/bu) (Julian) (In) (0-9)(Bu/a @ Weight Headed Blotch
(1) (1)(0-9) (0-9)
(1)
FHBIndex
(0-100)
Table 1. Summary of performance of entries in the Virginia Tech Hulless Barley Test, 2018 harvest.
Yield Test Date Leaf NetPlantMature PowderyHeight Lodging Rust
12

Hulless Lines
VA14H-33 78.2 + 55.3 + 111 - 34 3 - 4 - 4 - 1VA15H-73 2R 77.6 + 55.2 + 114 + 35 2 - 5 5 0VA15H-11 76.9 + 54.8 + 112 35 4 3 - 4 - 1VA15H-79 WS 76.8 + 54.1 111 - 35 3 3 - 4 - 0VA15H-9 75.9 + 53.8 113 35 3 3 - 5 3VA14H-58 75.4 55.6 + 112 35 5 + 4 - 5 1VA15H-12 75.3 55.1 + 112 - 35 4 3 - 4 - 1VA06H-79 74.1 53.5 - 113 34 4 7 + 4 - 1VA15H-118 WS 73.0 55.2 + 114 + 36 + 4 4 4 2VA15H-119 WS 73.0 54.9 + 114 + 36 + 4 4 5 0VA15H-90 WS 72.9 56.0 + 112 35 4 4 5 1VA07H-35 WS 70.2 53.6 - 114 + 34 5 + 4 5 3VA06H-25 70.1 53.5 - 114 + 35 4 4 5 2Amaze 10 67.8 - 53.6 - 114 + 35 4 5 5 2Eve 67.0 - 54.8 + 107 - 33 - 4 4 7 + 1VA08H-79 WS 66.2 - 52.2 - 115 + 34 4 8 + 4 6 +Doyce 61.0 - 48.7 - 111 - 34 - 5 + 5 7 + 1Average 72.4 54.1 112 35 4 4 5 1LSD (0.05) 3.2 0.5 0 1 1 1 1 2C.V. 9.5 2.1 1 5 40 19 17 111Released cultivars are shown in bold print.The number in parentheses below column headings indicates the number of location-years on which data are based.Varieties are ordered by descending yield averages.A plus or minus sign indicates a performance significantly above or below the test average.The 0-9 ratings indicate a genotype's response to disease or lodging where 0 = highly resistant and 9 = highly susceptible.
(4) (3) (2)(9) (10) (4) (6) (11)
Blotch Mildew48 lb/bu) (Lb/bu) (Julian) (In) (0-9) (0-9) (0-9)(Bu/a @ Weight Headed Height Lodging Rust
(0-9)
PowderyPlantMature
Table 2. Two-year average summary of performance of entries in the Virginia Tech Hulless Barley Tests, 2017 and 2018 harvests.
Yield Test Date Leaf Net
13

Hulless Lines
VA14H-33 72.9 + 55.7 + 111 - 34 3 - 3 - 4 - 1 - 0 91VA14H-58 72.6 + 55.9 + 112 34 4 4 - 4 2 1 95VA06H-79 69.5 + 53.8 113 + 33 3 - 8 + 3 - 0 - 0 94VA07H-35 WS 66.6 54.3 114 + 33 4 4 - 5 4 + 2 94VA06H-25 66.4 54.1 114 + 34 4 4 - 5 3 2 94Amaze 10 65.0 54.4 114 + 34 4 5 5 4 + 2 95VA08H-79 WS 62.0 - 52.9 - 115 + 33 4 8 + 3 - 7 + 0 98 +Eve 60.2 - 55.0 + 107 - 32 - 4 4 - 7 + 1 - 0 90 -Doyce 57.9 - 49.6 - 110 - 33 4 + 5 7 + 1 - 0 95Average 65.9 54.0 112 33 4 5 5 3 1 94LSD (0.05) 2.7 0.5 0 1 1 1 1 1 2 3C.V. 10.5 2.4 1 5 42 18 23 45 185 2Released cultivars are shown in bold print.The number in parentheses below column headings indicates the number of location-years on which data are based.Varieties are ordered by descending yield averages.A plus or minus sign indicates a performance significantly above or below the test average.The 0-9 ratings indicate a genotype's response to disease or lodging where 0 = highly resistant and 9 = highly susceptible.1 BYD = Barley Yellow Dwarf Virus.
(1)(0-9) (0-9) (%)
(13) (14) (6) (8) (14)
WinterPlantMature BYD
(5)
Blotch Mildew Survival(In) (0-9) (0-9)
Height Lodging Rust
(6) (4)
Virus1
(0-9)(1)
Table 3. Three-year average summary of performance of entries in the Virginia Tech Hulless Barley Tests, 2016, 2017, and 2018 harvests.
Yield Test Date Leaf Net Powdery
48 lb/bu) (Lb/bu) (Julian)(Bu/a @ Weight Headed
14

Hulless LinesVA16H-28 2R --- 87.4 + 51.4 4VA14H-33 81.9 + 86.6 + 51.9 3VA16H-25 2R --- 82.6 54.4 + 5Eve 68.9 82.4 52.5 7VA16H-160 --- 81.9 52.3 3VA15H-79 WS 75.8 81.5 50.7 5VA15H-73 2R 76.9 81.1 54.2 + 3VA15H-119 WS 76.7 81.0 51.4 5VA16H-24 2R --- 80.8 51.2 5VA06H-79 75.3 80.2 53.3 3VA16H-276 Seg. --- 79.7 52.8 2VA15H-12 73.8 79.6 52.2 5VA16H-159 --- 79.5 51.4 3VA15H-118 WS 75.1 79.3 50.6 5VA06H-25 65.6 - 78.9 49.1 5VA15H-9 73.4 78.5 51.7 5VA16H-218 WS --- 78.0 49.1 5Dan --- 77.9 51.7 5VA16H-27 2R --- 77.8 50.0 7VA16H-89 --- 77.6 51.8 4VA16H-247 --- 77.3 53.1 5VA15H-11 72.7 77.3 51.5 5VA07H-35 WS 71.5 77.2 49.4 5VA08H-79 WS 69.7 77.0 46.0 - 6VA14H-58 75.2 76.8 53.8 + 7VA16H-26 2R --- 76.8 51.2 4VA15H-90 WS 75.9 76.5 52.6 4VA16H-158 --- 75.3 48.8 5Amaze 10 66.3 - 74.9 49.0 7Doyce 64.4 - 74.5 45.1 - 8 +Average 72.9 79.2 51.1 5LSD (0.05) 5.5 7.3 2.5 3C.V. 7.6 6.5 3.4 44Released cultivars are shown in bold print.Varieties are ordered by descending yield averages.A plus or minus sign indicates a performance significantly above or below the test average.The 0-9 ratings indicate a genotype's response to disease or lodging where 0 = highly resistant and 9 = highly susceptible.
Table 4. Summary of performance of entries in the Virginia Tech Hulless Barley Test, Southern Piedmont AREC, Blackstone, VA, 2018 harvest.
48 lb/bu) (Lb/bu) (0-9)
Yield Test(Bu/a @ Weight Lodging
Plant2-yearAv. Yield(Bu/a)
15
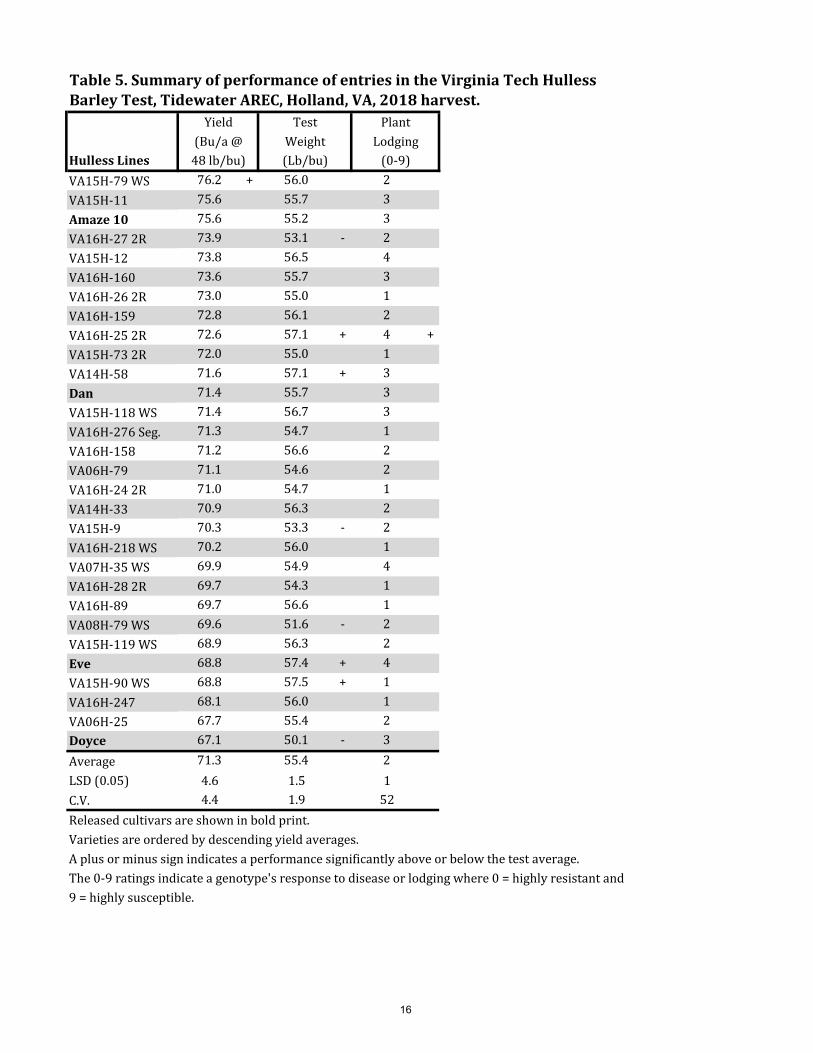
Hulless LinesVA15H-79 WS 76.2 + 56.0 2VA15H-11 75.6 55.7 3Amaze 10 75.6 55.2 3VA16H-27 2R 73.9 53.1 - 2VA15H-12 73.8 56.5 4VA16H-160 73.6 55.7 3VA16H-26 2R 73.0 55.0 1VA16H-159 72.8 56.1 2VA16H-25 2R 72.6 57.1 + 4 +VA15H-73 2R 72.0 55.0 1VA14H-58 71.6 57.1 + 3Dan 71.4 55.7 3VA15H-118 WS 71.4 56.7 3VA16H-276 Seg. 71.3 54.7 1VA16H-158 71.2 56.6 2VA06H-79 71.1 54.6 2VA16H-24 2R 71.0 54.7 1VA14H-33 70.9 56.3 2VA15H-9 70.3 53.3 - 2VA16H-218 WS 70.2 56.0 1VA07H-35 WS 69.9 54.9 4VA16H-28 2R 69.7 54.3 1VA16H-89 69.7 56.6 1VA08H-79 WS 69.6 51.6 - 2VA15H-119 WS 68.9 56.3 2Eve 68.8 57.4 + 4VA15H-90 WS 68.8 57.5 + 1VA16H-247 68.1 56.0 1VA06H-25 67.7 55.4 2Doyce 67.1 50.1 - 3Average 71.3 55.4 2LSD (0.05) 4.6 1.5 1C.V. 4.4 1.9 52Released cultivars are shown in bold print.Varieties are ordered by descending yield averages.A plus or minus sign indicates a performance significantly above or below the test average.The 0-9 ratings indicate a genotype's response to disease or lodging where 0 = highly resistant and 9 = highly susceptible.
Table 5. Summary of performance of entries in the Virginia Tech Hulless Barley Test, Tidewater AREC, Holland, VA, 2018 harvest.
Yield Test
48 lb/bu) (Lb/bu)Lodging
(0-9)(Bu/a @ Weight
Plant
16

Hulless LinesVA16H-27 2R --- --- 84.8 + 55.9 + 120 + 40 2VA16H-26 2R --- --- 82.5 + 55.0 120 + 39 4VA16H-28 2R --- --- 81.8 + 55.4 120 + 40 2VA15H-73 2R --- 71.2 + 80.9 + 56.6 + 119 + 40 + 3VA16H-160 --- --- 79.4 54.3 116 - 37 - 3VA15H-79 WS --- 71.3 + 78.7 55.9 + 114 - 42 + 2VA16H-159 --- --- 78.5 53.2 - 118 35 - 4VA16H-24 2R --- --- 78.1 55.6 120 + 39 4VA15H-12 --- 72.1 + 78.0 55.1 115 - 39 5VA06H-79 60.7 58.5 - 77.3 52.6 - 116 - 40 3VA14H-33 68.1 + 68.8 76.6 56.3 + 113 - 41 + 1 -VA15H-90 WS --- 69.1 76.3 57.3 + 116 - 40 4VA16H-25 2R --- --- 76.3 54.7 116 40 + 6 +VA16H-158 --- --- 76.0 54.5 119 + 38 3VA08H-79 WS 48.4 - 50.7 - 75.4 52.5 - 119 + 39 3Amaze 10 65.9 + 65.2 75.0 54.6 118 + 40 + 3VA16H-276 Seg. --- --- 74.5 52.7 - 117 38 1 -VA15H-9 --- 69.6 74.2 53.8 116 - 37 - 5VA06H-25 64.4 63.9 74.0 54.0 118 + 39 6VA15H-119 WS --- 69.2 73.2 55.9 + 117 41 + 3VA15H-11 --- 71.3 + 72.6 54.5 116 - 39 4VA16H-218 WS --- --- 71.7 54.5 118 + 38 5VA15H-118 WS --- 70.9 + 70.5 55.3 118 + 41 + 4VA07H-35 WS 65.3 + 63.7 70.2 54.1 118 + 38 5Dan --- --- 68.7 56.6 + 116 - 40 4VA16H-247 --- --- 67.6 - 53.5 - 117 37 - 4VA16H-89 --- --- 65.6 - 55.3 119 + 40 4VA14H-58 69.3 + 65.0 64.9 - 56.2 + 116 - 37 - 8 +Eve 54.3 - 55.8 - 61.9 - 55.0 112 - 38 3Doyce 52.0 - 47.2 - 61.9 - 49.8 - 115 - 38 8 +Average 60.9 64.9 74.2 54.7 117 39 4LSD (0.05) 3.8 4.7 6.0 1.0 1 1 2C.V. 7.6 7.2 5.6 1.3 0 3 42Released cultivars are shown in bold print.Varieties are ordered by descending yield averages.A plus or minus sign indicates a performance significantly above or below the test average.The 0-9 ratings indicate a genotype's response to disease or lodging where 0 = highly resistant and 9 = highly susceptible.
PlantMature
Table 6. Summary of performance of entries in the Virginia Tech Hulless Barley Test, Eastern Virginia AREC, Warsaw, VA, 2018 harvest.
3-year 2-year Yield Test Date
(0-9)Lodging
(In)HeightAv. Yield Av. Yield (Bu/a @ Weight Headed
(Bu/a) (Bu/a) 48 lb/bu) (Lb/bu) (Julian)
17

Hulless LinesVA16H-27 2R 92.5 + 56.2 1 -VA15H-73 2R 91.4 + 55.4 1 -VA16H-26 2R 90.2 + 56.1 3 -VA16H-28 2R 88.0 + 56.3 3 -VA16H-24 2R 85.6 56.5 3VA16H-25 2R 84.2 56.9 5VA06H-79 82.1 56.3 4VA16H-276 Seg. 79.6 55.5 1 -VA15H-9 79.0 56.0 7VA07H-35 WS 77.7 55.2 8 +VA16H-89 77.5 57.5 + 5VA15H-79 WS 77.4 56.8 4VA14H-33 77.3 57.8 + 5VA16H-160 76.3 56.3 6Eve 75.8 56.8 5VA16H-247 75.2 56.1 6VA06H-25 74.3 55.4 6VA15H-90 WS 71.4 57.6 + 7VA08H-79 WS 69.9 54.9 - 6Dan 69.9 57.0 4VA16H-159 69.5 55.7 5VA15H-11 68.9 56.5 8 +VA16H-218 WS 68.7 55.5 5Doyce 67.9 50.5 - 8 +VA15H-12 63.3 57.3 + 6VA14H-58 63.3 57.0 + 8 +Amaze 10 62.5 56.1 6VA16H-158 59.3 - 55.4 6VA15H-119 WS 56.9 - 56.5 8 +VA15H-118 WS 51.6 - 55.7 8 +Average 74.2 56.1 5LSD (0.05) 13.4 0.9 2C.V. 12.4 1.2 31Released cultivars are shown in bold print.Varieties are ordered by descending yield averages.A plus or minus sign indicates a performance significantly above or below the test average.The 0-9 ratings indicate a genotype's response to disease or lodging where 0 = highly resistant and 9 = highly susceptible.
Table 7. Summary of performance of entries in the Virginia Tech Hulless Barley Test, Eastern Shore AREC, Painter, VA, 2018 harvest.
Yield Test Leaf
48 lb/bu) (Lb/bu) (0-9)(Bu/a @ Weight Rust
18

Hulless LinesVA16H-27 2R --- 94.9 + 51.7 36 5VA15H-11 83.7 + 93.2 51.2 37 5VA15H-119 WS 79.9 93.2 50.9 38 3VA16H-24 2R --- 92.6 51.9 39 5VA15H-9 81.7 91.2 50.4 36 3VA15H-79 WS 75.2 90.1 49.7 35 5VA06H-79 82.4 + 89.6 50.4 37 4VA16H-26 2R --- 89.3 50.9 34 5VA15H-73 2R 78.7 88.6 51.9 36 3VA14H-33 79.8 85.6 52.4 + 34 3VA15H-118 WS 77.7 85.5 51.7 35 4VA16H-159 --- 85.0 49.6 32 6Dan --- 83.4 51.0 36 4VA06H-25 73.4 82.8 50.2 37 3VA16H-28 2R --- 80.8 51.5 35 5VA16H-160 --- 80.7 50.4 36 3VA14H-58 82.1 80.6 51.9 35 5VA15H-12 73.9 78.3 50.2 36 9 +VA16H-25 2R --- 77.8 50.3 34 6Eve 68.1 75.6 51.1 34 4VA16H-89 --- 74.9 51.8 38 5VA16H-276 Seg. --- 74.8 50.6 33 1VA16H-158 --- 74.7 51.2 32 6Amaze 10 64.7 - 73.2 50.5 34 5VA16H-218 WS --- 70.6 51.2 37 6VA16H-247 --- 70.5 50.8 33 4VA15H-90 WS 68.6 70.3 51.5 36 5VA07H-35 WS 64.9 - 69.6 50.5 33 6VA08H-79 WS 74.2 69.3 49.9 35 4Doyce 57.3 - 66.2 - 45.4 - 38 5Average 74.5 81.1 50.7 35 4LSD (0.05) 7.8 13.3 1.6 4 4C.V. 10.3 11.2 2.2 8 59Released cultivars are shown in bold print.Varieties are ordered by descending yield averages.A plus or minus sign indicates a performance significantly above or below the test average.The 0-9 ratings indicate a genotype's response to disease or lodging where 0 = highly resistant and 9 = highly susceptible.
Table 8. Summary of performance of entries in the Virginia Tech Hulless Barley Test, Northern Piedmont Center, Orange, VA, 2018 harvest.
Mature2-yearAv. Yield(Bu/a)
Lodging48 lb/bu) (Lb/bu) (In) (0-9)
Yield Test(Bu/a @ Weight Height
Plant
19
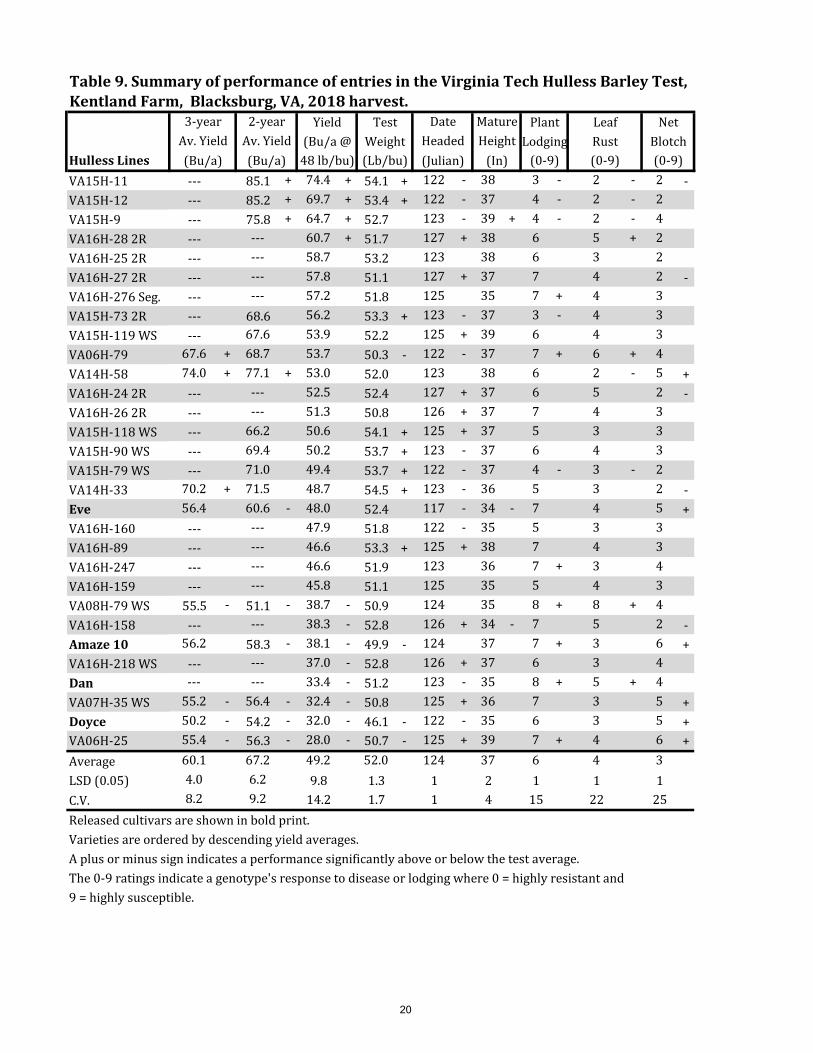
Hulless LinesVA15H-11 --- 85.1 + 74.4 + 54.1 + 122 - 38 3 - 2 - 2 -VA15H-12 --- 85.2 + 69.7 + 53.4 + 122 - 37 4 - 2 - 2VA15H-9 --- 75.8 + 64.7 + 52.7 123 - 39 + 4 - 2 - 4VA16H-28 2R --- --- 60.7 + 51.7 127 + 38 6 5 + 2VA16H-25 2R --- --- 58.7 53.2 123 38 6 3 2VA16H-27 2R --- --- 57.8 51.1 127 + 37 7 4 2 -VA16H-276 Seg. --- --- 57.2 51.8 125 35 7 + 4 3VA15H-73 2R --- 68.6 56.2 53.3 + 123 - 37 3 - 4 3VA15H-119 WS --- 67.6 53.9 52.2 125 + 39 6 4 3VA06H-79 67.6 + 68.7 53.7 50.3 - 122 - 37 7 + 6 + 4VA14H-58 74.0 + 77.1 + 53.0 52.0 123 38 6 2 - 5 +VA16H-24 2R --- --- 52.5 52.4 127 + 37 6 5 2 -VA16H-26 2R --- --- 51.3 50.8 126 + 37 7 4 3VA15H-118 WS --- 66.2 50.6 54.1 + 125 + 37 5 3 3VA15H-90 WS --- 69.4 50.2 53.7 + 123 - 37 6 4 3VA15H-79 WS --- 71.0 49.4 53.7 + 122 - 37 4 - 3 - 2VA14H-33 70.2 + 71.5 48.7 54.5 + 123 - 36 5 3 2 -Eve 56.4 60.6 - 48.0 52.4 117 - 34 - 7 4 5 +VA16H-160 --- --- 47.9 51.8 122 - 35 5 3 3VA16H-89 --- --- 46.6 53.3 + 125 + 38 7 4 3VA16H-247 --- --- 46.6 51.9 123 36 7 + 3 4VA16H-159 --- --- 45.8 51.1 125 35 5 4 3VA08H-79 WS 55.5 - 51.1 - 38.7 - 50.9 124 35 8 + 8 + 4VA16H-158 --- --- 38.3 - 52.8 126 + 34 - 7 5 2 -Amaze 10 56.2 58.3 - 38.1 - 49.9 - 124 37 7 + 3 6 +VA16H-218 WS --- --- 37.0 - 52.8 126 + 37 6 3 4Dan --- --- 33.4 - 51.2 123 - 35 8 + 5 + 4VA07H-35 WS 55.2 - 56.4 - 32.4 - 50.8 125 + 36 7 3 5 +Doyce 50.2 - 54.2 - 32.0 - 46.1 - 122 - 35 6 3 5 +VA06H-25 55.4 - 56.3 - 28.0 - 50.7 - 125 + 39 7 + 4 6 +Average 60.1 67.2 49.2 52.0 124 37 6 4 3LSD (0.05) 4.0 6.2 9.8 1.3 1 2 1 1 1C.V. 8.2 9.2 14.2 1.7 1 4 15 22 25Released cultivars are shown in bold print.Varieties are ordered by descending yield averages.A plus or minus sign indicates a performance significantly above or below the test average.The 0-9 ratings indicate a genotype's response to disease or lodging where 0 = highly resistant and 9 = highly susceptible.
Table 9. Summary of performance of entries in the Virginia Tech Hulless Barley Test, Kentland Farm, Blacksburg, VA, 2018 harvest.
3-year 2-year Yield Test Date Leaf NetPlantMature
(In) (0-9)Av. Yield Av. Yield (Bu/a @ Weight Headed Height(Bu/a) (Bu/a) 48 lb/bu) (Lb/bu) (Julian) (0-9) (0-9)
Lodging Rust Blotch
20

Awns1
Barley Lines
VA16B-217 LA 100.2 + 46.7 + 119 + 36 3 - 0 3 2 - 49 LAVA16B-236 LA 97.9 + 46.2 119 + 37 + 3 - 0 2 2 - 39 LAVA16B-263 LA 97.9 + 45.9 120 + 35 3 - 0 3 2 65 LAVA16B-254 LA 97.5 + 46.0 120 + 36 3 - 0 3 2 - 39 LAVA14B-78 97.3 + 46.3 115 - 34 6 0 2 2 49 SAVA13B-25 LA 96.6 + 46.4 115 - 34 4 - 0 3 2 40 LAVA16B-213 LA 95.3 + 46.5 + 119 + 36 4 - 0 2 2 40 LAVA16B-244 LA 95.3 + 46.4 119 + 36 4 0 2 2 42 LAVA14B-63 94.6 + 45.6 119 + 33 6 0 2 2 - 71 SAVA16B-203 LA 94.2 + 45.9 119 + 34 4 - 0 2 2 - 45 LAVA16B-108 92.9 + 45.3 117 34 4 - 0 2 2 50 SAVA16B-264 LA 92.7 + 47.1 + 116 - 36 3 - 0 2 2 - 45 LAVA14B-74 92.2 + 44.8 119 + 36 5 0 3 1 - 73 SAVA16B-238 LA 91.7 46.3 119 + 35 4 - 0 3 2 - 48 LAVA14B-79 91.5 44.9 117 32 6 + 0 2 2 66 SAVA14B-57 91.0 46.6 + 117 33 6 + 0 3 2 - 73 SASecretariat 90.1 46.4 116 - 32 - 6 + 0 1 - 2 43 SAVA12B-56 90.0 44.8 114 - 33 5 0 3 3 67 SAVA15B-79 89.6 45.6 117 35 4 - 0 2 2 - 77 + SACalypso 89.5 42.5 - 124 + 32 3 - 0 2 - 2 12 - LAVA11B-141 LA 89.0 46.6 + 119 + 36 5 1 + 3 2 - 34 LAVA14B-59 88.4 44.6 117 32 6 + 0 2 1 - 63 SAVA16B-34 88.3 46.3 115 - 32 - 6 + 0 3 2 57 SAVA15B-98 (LA) 88.1 44.2 - 117 32 - 5 1 + 3 5 + 50 LAVA16B-140 87.7 46.7 + 117 32 - 6 0 2 2 55 SAVioletta 87.7 46.3 120 + 30 - 3 - 1 + 2 3 + 30 - LAAtlantic 87.5 45.3 114 - 33 6 0 4 + 4 + 58 SAVA15B-33 86.6 46.8 + 118 + 32 5 0 2 2 47 SAVA16B-133 86.0 45.2 117 34 6 + 0 2 2 48 SAThoroughbred 85.8 43.2 - 120 + 34 4 - 0 3 6 + 45 LAVA16B-3 85.6 43.6 - 116 - 34 6 + 0 2 2 - 52 SAVA16B-131 85.4 46.6 + 118 32 - 6 0 2 2 64 SAPrice 84.7 45.0 117 33 5 0 4 + 6 + 67 SAVA14B-75 84.3 44.7 117 33 6 + 0 2 1 - 72 SAVA14BFHB-83 82.2 - 45.9 118 34 6 + 0 2 - 2 53 SAVA16B-132 81.6 - 46.2 118 34 6 + 0 2 - 2 53 SAVA16B-141 79.3 - 46.5 + 116 - 33 6 + 0 2 - 3 59 SAVA08B-95 79.2 - 44.5 115 - 33 7 + 1 + 2 2 47 SAVA16B-142 79.1 - 45.2 117 30 - 7 + 0 2 2 - 65 SABarsoy 77.6 - 45.6 115 - 34 6 + 0 6 + 5 + 48 LA
(1) (2)(6) (5) (2) (3) (6) (1)
Mature Plant
48 lb/bu) (Lb/bu) (Julian) (In) (0-9)
FHB
(0-9) (0-9)(0-9)Index
(0-100)(1)
Table 10. Summary of performance of entries in the Virginia Tech Barley Test, 2018 harvest.
(Bu/a @ Weight Headed Height Lodging Rust BlotchYield Test Date Leaf NetPowdery
Mildew
21

Awns1
Barley Lines(1) (2)(6) (5) (2) (3) (6) (1)
Mature Plant
48 lb/bu) (Lb/bu) (Julian) (In) (0-9)
FHB
(0-9) (0-9)(0-9)Index
(0-100)(1)
Table 10. Summary of performance of entries in the Virginia Tech Barley Test, 2018 harvest.
(Bu/a @ Weight Headed Height Lodging Rust BlotchYield Test Date Leaf NetPowdery
Mildew
Nomini 72.7 - 43.4 - 115 - 40 + 4 0 4 + 3 N/A ALCallao 72.4 - 44.8 114 - 33 8 + 0 4 + 3 66 SAVA92-42-46 64.2 - 42.3 - 117 39 + 6 0 1 - 7 + 48 ALWysor 60.3 - 42.6 - 117 38 + 6 + 0 6 + 5 + 59 ALAverage 87.3 45.4 117 34 5 0 2 2 52.9LSD (0.05) 4.8 1.0 1 2 1 0 1 1 22C.V. 9.4 3.5 1 8 29 469 27 27 30Released cultivars are shown in bold print. The number in parentheses below column headings indicates the number of locations on which data are based.Varieties are ordered by descending yield averages. A plus or minus sign indicates a performance significantly above or below the test average.The 0-9 ratings indicate a genotype's response to disease or lodging where 0 = highly resistant and 9 = highly susceptible.1 LA=long awned, SA=short awned, AL=awnletted or awnless.
22

Barley Lines
VA14B-63 97.9 + 44.5 + 112 + 33 4 1 3 - 2 -VA14B-79 97.0 + 43.5 110 32 5 0 3 - 3 -VA14B-78 96.6 + 44.8 + 108 - 34 4 1 4 - 2 -VA13B-25 LA 96.2 + 44.8 + 108 - 33 4 - 0 4 2 -VA14B-74 95.5 + 43.6 113 + 35 + 4 0 4 - 2 -Secretariat 93.7 + 45.0 + 109 - 32 - 5 + 0 1 - 2 -VA14B-57 93.7 + 45.0 + 110 33 5 0 4 2 -VA15B-79 93.3 + 44.6 + 110 34 3 - 0 4 - 2 -VA12B-56 91.0 43.2 107 - 32 - 4 0 6 + 3VA14B-59 90.6 43.2 110 32 - 5 0 4 - 1 -VA11B-141 LA 90.5 45.4 + 112 + 36 + 4 - 0 4 2 -VA15B-33 90.1 45.6 + 111 + 31 - 3 - 0 4 3Thoroughbred 90.0 42.2 - 113 + 34 3 - 3 + 7 + 6 +VA15B-98 (LA) 89.3 43.1 111 + 32 4 0 7 + 6 +Atlantic 89.2 43.6 108 - 32 - 5 1 6 + 4 +VA14B-75 88.7 43.4 111 + 33 5 0 3 - 2 -VA14BFHB-83 86.5 44.7 + 111 + 34 5 + 0 2 - 2 -Violetta 86.1 45.3 + 113 + 30 - 3 - 1 3 - 3Price 84.6 43.6 109 32 4 0 5 + 6 +VA08B-95 83.6 43.2 108 - 33 6 + 6 + 3 - 2 -Barsoy 76.5 - 43.2 108 - 34 5 0 8 + 5 +Callao 76.3 - 42.7 - 107 - 31 - 7 + 0 6 + 3Nomini 73.8 - 41.8 - 108 - 40 + 4 - 0 6 + 2 -VA92-42-46 66.6 - 41.3 - 110 39 + 5 0 2 - 7 +Wysor 65.6 - 41.2 - 110 39 + 5 + 0 8 + 4 +Average 87.3 43.7 110 34 4 0 4 3LSD (0.05) 4.5 0.6 1 1 1 1 0 1C.V. 11.4 2.8 1 7 33 154 18 24Released cultivars are shown in bold print.Varieties are ordered by descending yield averages.A plus or minus sign indicates a performance significantly above or below the test average.The 0-9 ratings indicate a genotype's response to disease or lodging where 0 = highly resistant and 9 = highly susceptible.The number in parentheses below column headings indicates the number of location-years on which data are based.1 BYD = Barley Yellow Dwarf Virus.
48 lb/bu) (Lb/bu) (Julian) (In) (0-9)(10) (9) (4) (5) (11) (3)(2)
(0-9)Rust
(0-9)BlotchMildew
(0-9)(4)
(Bu/a @ Weight Headed Height LodgingPowderyMature Plant
Table 11. Two-year average summary of performance of entries in the Virginia Tech Barley Tests, 2017 and 2018 harvests.
Yield Test Date Leaf Net
23

Barley Lines
VA14B-63 96.9 + 44.3 + 112 + 33 4 0 3 - 2 - 0 94VA14B-79 96.7 + 43.6 110 + 32 - 4 0 - 3 - 3 0 95VA14B-74 96.0 + 43.7 113 + 34 + 4 - 0 - 3 - 2 - 0 95VA14B-78 95.0 + 44.6 + 109 - 34 4 0 4 - 3 0 96VA13B-25 LA 94.2 + 44.9 + 108 - 33 4 0 - 4 2 - 0 98Secretariat 94.2 + 45.2 + 109 - 31 - 4 0 - 1 - 3 - 0 95VA14B-57 94.0 + 45.0 + 110 + 33 4 0 - 4 2 - 0 94VA14B-59 92.4 + 43.3 110 + 32 - 4 0 - 3 - 2 - 0 93 -VA12B-56 90.9 + 43.2 107 - 31 - 4 0 - 5 + 3 - 0 96VA14B-75 89.8 43.4 110 + 32 4 0 - 3 - 2 - 0 96VA11B-141 LA 89.6 45.4 + 112 + 35 + 4 - 0 - 4 3 - 1 + 99Atlantic 88.7 43.8 108 - 32 - 5 0 6 + 4 + 0 95Thoroughbred 88.5 42.8 - 113 + 33 3 - 4 + 7 + 6 + 0 99VA14BFHB-83 87.1 44.7 + 110 + 33 5 + 0 - 2 - 2 - 0 96VA08B-95 84.6 43.1 108 - 33 5 + 7 + 3 - 3 - 0 96Violetta 82.6 45.1 + 113 + 28 - 2 - 0 3 - 3 2 + 99Price 81.6 - 43.9 109 - 32 - 4 0 6 + 6 + 0 95Callao 77.9 - 43.3 107 - 30 - 6 + 0 - 5 + 3 0 94Barsoy 75.3 - 43.1 108 - 33 5 0 8 + 4 + 3 + 98Nomini 73.2 - 41.1 - 108 - 38 + 3 - 0 - 6 + 3 0 98VA92-42-46 63.8 - 41.3 - 109 38 + 4 0 - 2 - 8 + 0 97Wysor 63.3 - 40.4 - 110 38 + 5 0 - 7 + 4 + 0 99Average 86.2 43.6 110 33 4 1 4 3 0 96LSD (0.05) 3.9 0.6 0 1 1 0 0 1 1 3C.V. 11.4 3.7 1 6 34 100 19 27 208 3Released cultivars are shown in bold print.Varieties are ordered by descending yield averages.A plus or minus sign indicates a performance significantly above or below the test average.The 0-9 ratings indicate a genotype's response to disease or lodging where 0 = highly resistant and 9 = highly susceptible.The number in parentheses below column headings indicates the number of location-years on which data are based.1 BYD = Barley Yellow Dwarf Virus.
(1)(0-9)(0-9) (%)
(14) (13) (6) (7) (15) (5)(0-9)
(1)(6)(4)
Survival48 lb/bu) (Lb/bu) (Julian) (In) (0-9) (0-9)(Bu/a @ Weight Headed Height Lodging Rust Virus1BlotchMildew
WinterMature Plant BYD
Table 12. Three-year average summary of performance of entries in the Virginia Tech Barley Tests, 2016, 2017, and 2018 harvests.
Yield Test Date Leaf NetPowdery
24

Barley LinesVA16B-217 LA --- 95.4 + 48.8 3VA16B-203 LA --- 94.4 + 48.8 4VA16B-254 LA --- 94.1 + 48.8 3VA16B-236 LA --- 93.6 48.6 3VA16B-263 LA --- 93.6 49.2 2VA16B-238 LA --- 93.0 49.6 4VA14B-79 94.9 + 92.8 48.8 6VA16B-264 LA --- 92.1 50.4 4Atlantic 90.5 90.4 49.6 4VA14B-63 94.1 + 90.2 48.9 4VA14B-74 91.9 89.7 48.7 4VA14B-78 90.5 89.5 49.6 5VA13B-25 LA 88.5 89.3 46.8 4VA16B-132 --- 89.0 49.2 5VA12B-56 91.7 88.9 47.1 5VA92-42-46 80.8 88.8 47.6 5VA15B-79 90.7 88.5 48.8 3VA16B-141 --- 88.4 49.0 5VA16B-133 --- 88.3 49.2 4Barsoy 85.5 88.2 48.2 5Price 85.2 88.2 48.8 3VA16B-34 --- 88.0 49.0 6VA16B-244 LA --- 87.9 49.2 5VA16B-131 --- 87.8 49.6 5VA15B-98 (LA) 91.4 87.6 48.7 4Secretariat 91.8 87.1 49.8 5VA16B-213 LA --- 87.0 48.9 5VA11B-141 LA 88.7 86.8 48.5 4VA16B-140 --- 86.4 49.2 3VA14B-57 89.1 85.6 50.2 5Thoroughbred 92.8 85.4 48.5 3Violetta 81.9 85.2 48.4 3VA15B-33 87.8 84.2 49.5 4VA16B-108 --- 83.4 48.4 3VA16B-3 --- 82.9 48.1 4VA14BFHB-83 83.9 82.3 47.8 7 +VA08B-95 78.2 - 81.7 47.9 6VA14B-59 83.9 81.1 47.1 6Nomini 81.9 80.6 47.4 5Calypso --- 80.5 - 41.2 - 3VA16B-142 --- 80.3 - 46.5 6
Table 13. Summary of performance of entries in the Virginia Tech Barley Test, Southern Piedmont AREC, Blackstone, VA, 2018 harvest.
2-yearAv. Yield(Bu/a) 48 lb/bu) (Lb/bu) (0-9)
Yield Test(Bu/a @ Weight Lodging
Plant
25

Barley Lines
Table 13. Summary of performance of entries in the Virginia Tech Barley Test, Southern Piedmont AREC, Blackstone, VA, 2018 harvest.
2-yearAv. Yield(Bu/a) 48 lb/bu) (Lb/bu) (0-9)
Yield Test(Bu/a @ Weight Lodging
Plant
VA14B-75 86.1 80.3 - 48.2 5Wysor 79.0 - 77.7 - 46.6 6Callao 74.9 - 76.7 - 46.4 7 +Average 87.0 87.1 48.4 4LSD (0.05) 6.8 6.6 2.1 2C.V. 7.8 5.3 3.0 35Released cultivars are shown in bold print.Varieties are ordered by descending yield averages.A plus or minus sign indicates a performance significantly above or below the test average.The 0-9 ratings indicate a genotype's response to disease or lodging where 0 = highly resistant and 9 = highly susceptible.
26

Barley LinesThoroughbred 87.9 + 46.1 2VA16B-263 LA 82.4 + 45.8 3VA16B-244 LA 82.2 46.7 4VA16B-254 LA 79.3 45.6 2VA14B-59 79.2 45.7 4VA14B-75 79.1 44.7 3VA13B-25 LA 78.9 49.0 5VA16B-238 LA 78.6 46.2 4Secretariat 78.5 46.9 4VA14B-79 78.5 45.3 3VA14B-63 78.3 46.9 3Calypso 78.3 44.8 2VA14B-57 77.9 47.5 4VA16B-217 LA 77.8 47.3 3VA15B-98 (LA) 77.8 46.2 2VA16B-133 77.7 45.4 4VA14B-78 77.6 46.8 4VA14B-74 77.3 46.2 3VA16B-131 76.9 48.1 3VA16B-203 LA 76.6 45.9 3VA16B-236 LA 76.0 46.9 2VA16B-213 LA 75.9 46.6 3VA16B-108 75.8 46.7 3VA16B-34 75.6 48.3 5VA15B-79 75.6 46.1 3VA16B-3 75.4 39.5 - 4VA08B-95 75.1 45.5 4VA16B-142 75.0 47.5 4VA11B-141 LA 74.8 48.4 3VA14BFHB-83 74.7 47.6 3VA16B-132 74.2 47.6 4VA12B-56 73.8 46.6 5VA15B-33 73.8 46.9 3VA16B-141 73.5 48.7 4VA16B-140 73.2 48.1 3VA16B-264 LA 72.8 46.4 3Atlantic 72.5 47.0 3Price 71.8 47.5 3Callao 71.8 47.1 7 +Violetta 71.8 47.3 3Barsoy 70.7 48.7 7 +
Table 14. Summary of performance of entries in the Virginia Tech Barley Test, Tidewater AREC, Holland, VA, 2018 harvest.
Plant
48 lb/bu)(Bu/a @ Weight Lodging
Yield Test
(Lb/bu) (0-9)
27

Barley Lines
Table 14. Summary of performance of entries in the Virginia Tech Barley Test, Tidewater AREC, Holland, VA, 2018 harvest.
Plant
48 lb/bu)(Bu/a @ Weight Lodging
Yield Test
(Lb/bu) (0-9)Wysor --- --- 3Nomini --- --- 3VA92-42-46 --- --- 3Average 76.5 46.6 3LSD (0.05) 5.8 4.4 2C.V. 5.3 6.6 35Released cultivars are shown in bold print.Varieties are ordered by descending yield averages.A plus or minus sign indicates a performance significantly above or below the test average.The 0-9 ratings indicate a genotype's response to disease or lodging where 0 = highly resistant and 9 = highly susceptible.The awnless lines Wysor, Nomini, and VA92-42-46 were selectively grazed by deer.
28
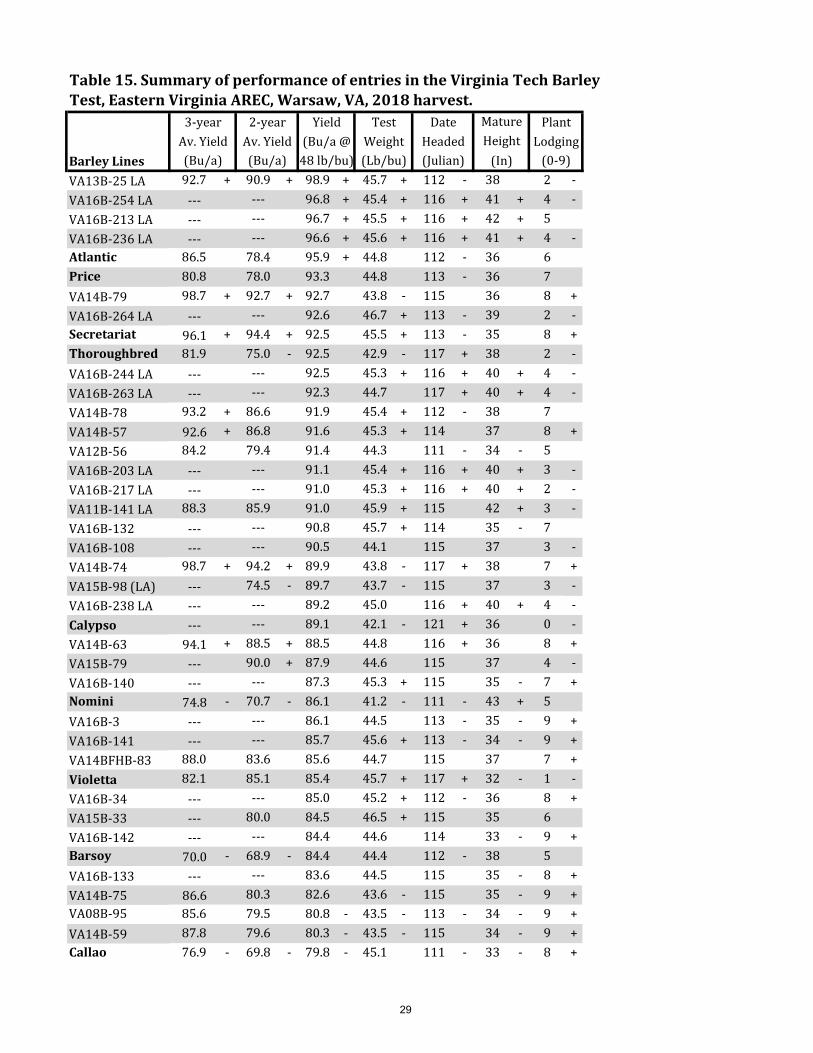
Barley LinesVA13B-25 LA 92.7 + 90.9 + 98.9 + 45.7 + 112 - 38 2 -VA16B-254 LA --- --- 96.8 + 45.4 + 116 + 41 + 4 -VA16B-213 LA --- --- 96.7 + 45.5 + 116 + 42 + 5VA16B-236 LA --- --- 96.6 + 45.6 + 116 + 41 + 4 -Atlantic 86.5 78.4 95.9 + 44.8 112 - 36 6Price 80.8 78.0 93.3 44.8 113 - 36 7VA14B-79 98.7 + 92.7 + 92.7 43.8 - 115 36 8 +VA16B-264 LA --- --- 92.6 46.7 + 113 - 39 2 -Secretariat 96.1 + 94.4 + 92.5 45.5 + 113 - 35 8 +Thoroughbred 81.9 75.0 - 92.5 42.9 - 117 + 38 2 -VA16B-244 LA --- --- 92.5 45.3 + 116 + 40 + 4 -VA16B-263 LA --- --- 92.3 44.7 117 + 40 + 4 -VA14B-78 93.2 + 86.6 91.9 45.4 + 112 - 38 7VA14B-57 92.6 + 86.8 91.6 45.3 + 114 37 8 +VA12B-56 84.2 79.4 91.4 44.3 111 - 34 - 5VA16B-203 LA --- --- 91.1 45.4 + 116 + 40 + 3 -VA16B-217 LA --- --- 91.0 45.3 + 116 + 40 + 2 -VA11B-141 LA 88.3 85.9 91.0 45.9 + 115 42 + 3 -VA16B-132 --- --- 90.8 45.7 + 114 35 - 7VA16B-108 --- --- 90.5 44.1 115 37 3 -VA14B-74 98.7 + 94.2 + 89.9 43.8 - 117 + 38 7 +VA15B-98 (LA) --- 74.5 - 89.7 43.7 - 115 37 3 -VA16B-238 LA --- --- 89.2 45.0 116 + 40 + 4 -Calypso --- --- 89.1 42.1 - 121 + 36 0 -VA14B-63 94.1 + 88.5 + 88.5 44.8 116 + 36 8 +VA15B-79 --- 90.0 + 87.9 44.6 115 37 4 -VA16B-140 --- --- 87.3 45.3 + 115 35 - 7 +Nomini 74.8 - 70.7 - 86.1 41.2 - 111 - 43 + 5VA16B-3 --- --- 86.1 44.5 113 - 35 - 9 +VA16B-141 --- --- 85.7 45.6 + 113 - 34 - 9 +VA14BFHB-83 88.0 83.6 85.6 44.7 115 37 7 +Violetta 82.1 85.1 85.4 45.7 + 117 + 32 - 1 -VA16B-34 --- --- 85.0 45.2 + 112 - 36 8 +VA15B-33 --- 80.0 84.5 46.5 + 115 35 6VA16B-142 --- --- 84.4 44.6 114 33 - 9 +Barsoy 70.0 - 68.9 - 84.4 44.4 112 - 38 5VA16B-133 --- --- 83.6 44.5 115 35 - 8 +VA14B-75 86.6 80.3 82.6 43.6 - 115 35 - 9 +VA08B-95 85.6 79.5 80.8 - 43.5 - 113 - 34 - 9 +VA14B-59 87.8 79.6 80.3 - 43.5 - 115 34 - 9 +Callao 76.9 - 69.8 - 79.8 - 45.1 111 - 33 - 8 +
Mature Plant
Table 15. Summary of performance of entries in the Virginia Tech Barley Test, Eastern Virginia AREC, Warsaw, VA, 2018 harvest.
3-year 2-year Yield Test DateHeight
(In)Lodging
(0-9)(Bu/a) (Bu/a) 48 lb/bu) (Lb/bu) (Julian)Av. Yield Av. Yield (Bu/a @ Weight Headed
29
Barley Lines
Mature Plant
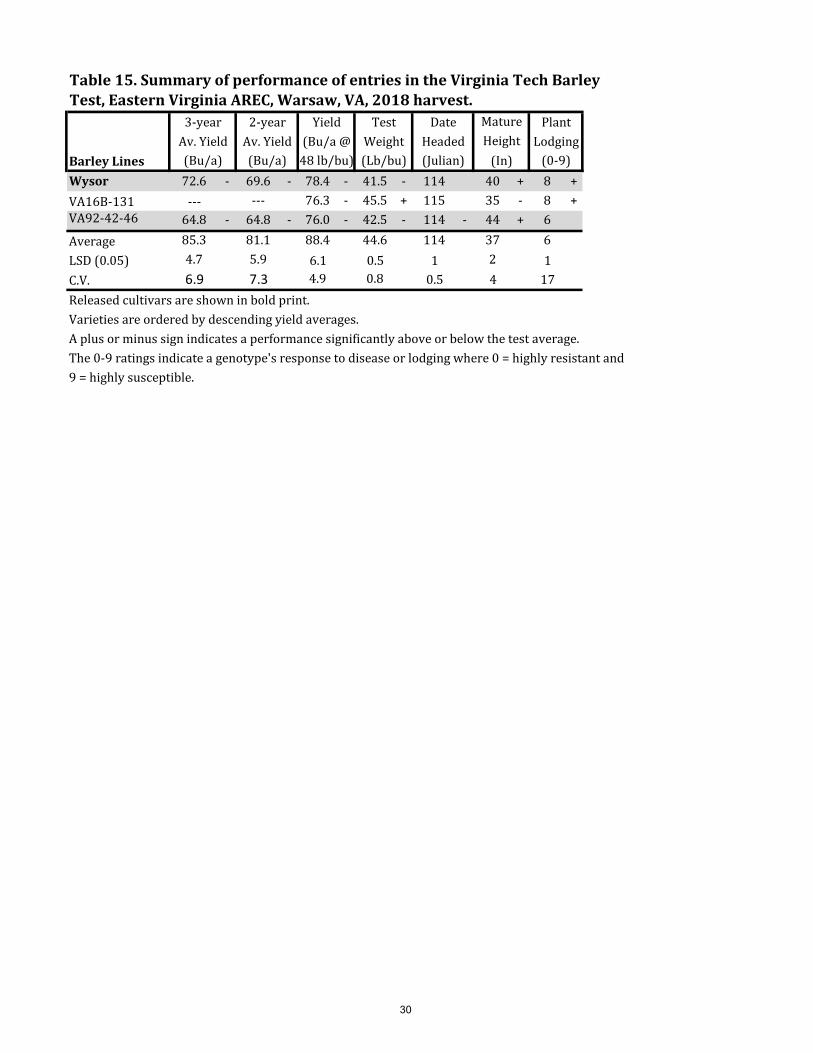
Table 15. Summary of performance of entries in the Virginia Tech Barley Test, Eastern Virginia AREC, Warsaw, VA, 2018 harvest.
3-year 2-year Yield Test DateHeight
(In)Lodging
(0-9)(Bu/a) (Bu/a) 48 lb/bu) (Lb/bu) (Julian)Av. Yield Av. Yield (Bu/a @ Weight Headed
Wysor 72.6 - 69.6 - 78.4 - 41.5 - 114 40 + 8 +VA16B-131 --- --- 76.3 - 45.5 + 115 35 - 8 +VA92-42-46 64.8 - 64.8 - 76.0 - 42.5 - 114 - 44 + 6Average 85.3 81.1 88.4 44.6 114 37 6LSD (0.05) 4.7 5.9 6.1 0.5 1 2 1C.V. 6.9 7.3 4.9 0.8 0.5 4 17Released cultivars are shown in bold print.Varieties are ordered by descending yield averages.A plus or minus sign indicates a performance significantly above or below the test average.The 0-9 ratings indicate a genotype's response to disease or lodging where 0 = highly resistant and 9 = highly susceptible.
30

Barley LinesCalypso 126.0 + 44.4 3 -VA16B-217 LA 124.6 + 48.1 + 2 -VA15B-33 121.8 + 47.7 + 5VA16B-263 LA 121.8 + 46.3 3 -VA16B-254 LA 120.1 + 46.7 + 5Violetta 119.1 + 46.1 4 -VA16B-108 118.1 + 45.5 5VA16B-244 LA 117.0 + 46.9 + 5VA16B-203 LA 115.9 + 46.3 5VA16B-236 LA 112.0 46.6 4 -VA13B-25 LA 111.4 47.3 + 5VA16B-213 LA 111.3 47.2 + 5VA14B-78 107.2 45.8 6VA11B-141 LA 107.2 46.9 + 5VA16B-238 LA 106.0 47.4 + 5VA15B-79 105.5 45.2 4 -VA16B-264 LA 104.4 47.7 + 5VA14B-57 103.5 46.0 8VA15B-98 (LA) 102.2 43.7 - 7VA12B-56 101.7 43.6 - 7Thoroughbred 100.7 41.3 - 5VA14B-79 100.1 45.6 8VA14B-63 100.1 44.3 8VA14B-59 98.4 44.9 7Price 94.1 43.7 - 7Atlantic 93.3 44.5 7VA14B-74 92.9 43.7 - 8Nomini 90.2 42.6 - 8VA14BFHB-83 88.2 45.5 8Barsoy 86.4 45.5 6VA16B-140 85.3 46.3 7Secretariat 84.8 46.4 8VA16B-131 84.8 45.8 8VA14B-75 84.0 44.7 8VA16B-133 83.9 44.3 7VA16B-3 82.9 - 44.2 8VA92-42-46 81.8 - 40.6 - 7VA16B-132 81.0 - 45.7 9 +VA16B-34 78.3 - 45.8 8VA16B-141 78.1 - 45.5 9 +Callao 74.8 - 44.0 9 +
Table 16. Summary of performance of entries in the Virginia Tech Barley Test, Eastern Shore AREC, Painter, VA, 2018 harvest.
48 lb/bu) (Lb/bu) (0-9)
Yield Test Plant(Bu/a @ Weight Lodging
31

Barley Lines
Table 16. Summary of performance of entries in the Virginia Tech Barley Test, Eastern Shore AREC, Painter, VA, 2018 harvest.
48 lb/bu) (Lb/bu) (0-9)
Yield Test Plant(Bu/a @ Weight Lodging
VA16B-142 73.8 - 45.4 9 +VA08B-95 71.1 - 43.7 - 9 +Wysor 67.1 - 40.3 - 8Average 98.0 45.2 6.4LSD (0.05) 14.5 1.4 2C.V. 9.8 2.3 22Released cultivars are shown in bold print.Varieties are ordered by descending yield averages.A plus or minus sign indicates a performance significantly above or below the test average.The 0-9 ratings indicate a genotype's response to disease or lodging where 0 = highly resistant and 9 = highly susceptible.
32

Barley LinesVA13B-25 LA 102.0 + 111.3 + 36.7 32 5 2VA16B-34 --- 110.5 + 40.2 + 28 5 2VA16B-217 LA --- 108.4 + 36.7 32 6 2VA14B-78 97.8 + 106.9 + 38.5 32 4 3VA14B-74 91.8 105.8 + 37.0 34 3 1 -VA16B-264 LA --- 104.7 + 38.4 34 4 1 -VA16B-213 LA --- 103.8 36.5 29 6 3VA16B-236 LA --- 102.0 37.4 32 4 2VA14B-63 100.3 + 101.8 38.9 30 7 1 -VA12B-56 93.8 100.3 36.7 32 2 - 1 -VA15B-98 (LA) 99.5 + 99.8 37.4 30 6 3VA16B-108 --- 97.2 35.8 33 4 2VA16B-244 LA --- 96.2 35.6 33 7 2Secretariat 91.0 95.9 38.2 28 5 2VA16B-203 LA --- 94.0 36.7 29 7 2VA16B-263 LA --- 93.5 36.4 33 5 3VA16B-131 --- 92.8 39.9 + 31 6 1 -Thoroughbred 101.3 + 91.3 35.8 31 5 4 +VA16B-140 --- 90.8 38.4 30 6 2VA16B-254 LA --- 90.2 36.0 31 4 2VA11B-141 LA 86.5 89.7 37.5 30 7 1 -Price 85.9 88.9 37.9 33 4 6 +VA15B-33 92.4 88.6 39.3 32 7 2VA16B-133 --- 88.3 36.7 33 5 2VA15B-79 92.5 88.1 38.5 35 5 1 -VA14B-59 82.7 83.1 39.8 + 30 6 1 -VA16B-238 LA --- 81.7 37.4 33 6 3Atlantic 89.2 81.4 36.2 31 7 4 +VA14B-57 90.4 80.2 37.5 31 7 2VA14BFHB-83 85.6 79.4 38.3 32 8 2Violetta 79.4 79.3 36.6 30 6 3 +Calypso --- 76.7 35.1 - 29 5 3VA08B-95 88.0 74.1 38.8 32 7 1 -VA14B-79 86.7 73.4 36.1 30 8 2VA16B-3 --- 70.9 39.0 30 8 1 -VA16B-132 --- 65.9 39.7 + 34 7 2VA14B-75 78.6 63.4 37.6 31 8 1 -Barsoy 67.2 - 59.3 - 36.6 32 9 + 5 +VA16B-142 --- 55.3 - 38.1 29 9 1 -VA16B-141 --- 51.6 - 38.9 31 6 2Callao 70.9 - 39.4 - 39.3 35 7 2
NetBlotch(0-9)
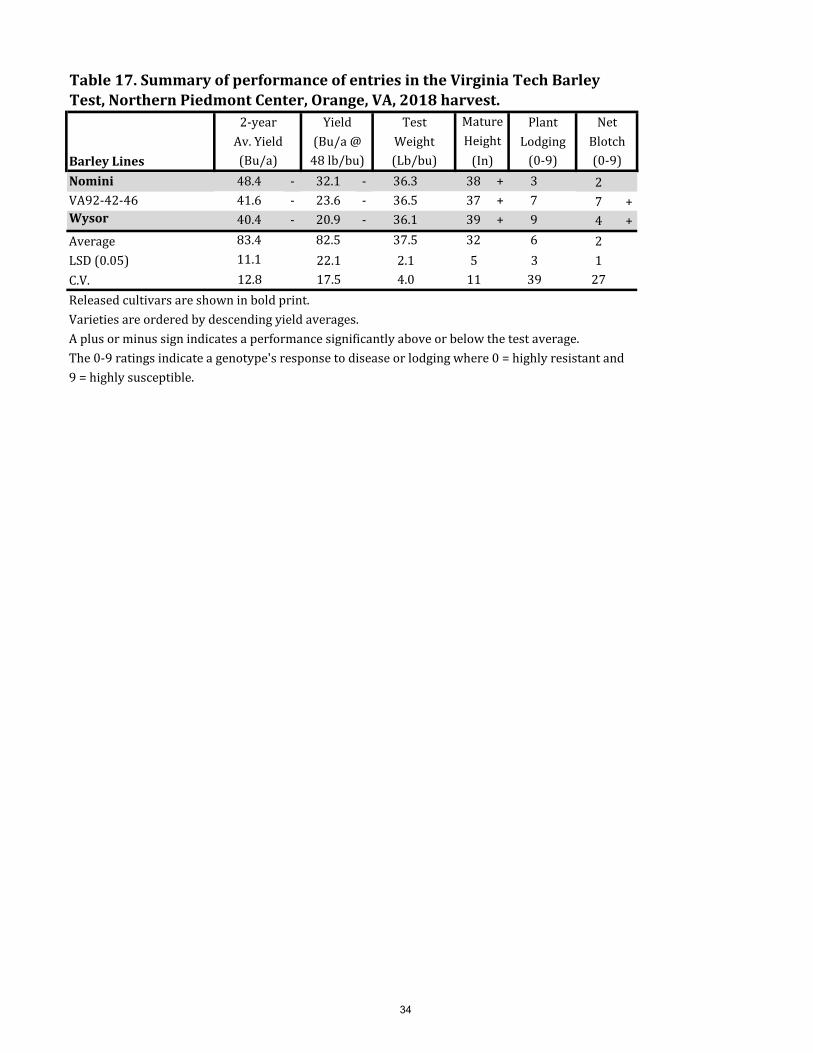
Table 17. Summary of performance of entries in the Virginia Tech Barley Test, Northern Piedmont Center, Orange, VA, 2018 harvest.
Yield Test
48 lb/bu) (Lb/bu) (0-9)(Bu/a @ Weight Lodging
Plant2-yearAv. Yield(Bu/a)
MatureHeight
(In)
33
Barley Lines
NetBlotch(0-9)
Table 17. Summary of performance of entries in the Virginia Tech Barley Test, Northern Piedmont Center, Orange, VA, 2018 harvest.
Yield Test
48 lb/bu) (Lb/bu) (0-9)(Bu/a @ Weight Lodging
Plant2-yearAv. Yield(Bu/a)
MatureHeight
(In)Nomini 48.4 - 32.1 - 36.3 38 + 3 2VA92-42-46 41.6 - 23.6 - 36.5 37 + 7 7 +Wysor 40.4 - 20.9 - 36.1 39 + 9 4 +Average 83.4 82.5 37.5 32 6 2LSD (0.05) 11.1 22.1 2.1 5 3 1C.V. 12.8 17.5 4.0 11 39 27Released cultivars are shown in bold print.Varieties are ordered by descending yield averages.A plus or minus sign indicates a performance significantly above or below the test average.The 0-9 ratings indicate a genotype's response to disease or lodging where 0 = highly resistant and 9 = highly susceptible.
34

Barley LinesVA14B-75 115.0 + 114.6 + 111.0 + 42.3 119 34 6 2 1 -VA14B-59 117.8 + 118.0 + 109.3 + 42.1 119 33 5 2 1 -VA14B-79 118.0 + 120.5 + 108.9 + 41.2 - 119 - 30 7 + 2 3VA14B-63 115.9 + 117.6 + 108.6 + 43.2 122 + 34 6 2 2VA14B-78 111.3 + 114.8 + 108.5 + 44 + 118 - 33 7 + 2 2 -VA14B-57 111.3 + 111.7 + 107.6 + 43.9 + 120 32 6 3 2VA16B-3 --- --- 107.6 + 43 118 - 36 7 + 2 2VA16B-236 LA --- --- 107.2 + 44.2 + 121 + 37 + 3 - 2 1 -VA16B-217 LA --- --- 104.2 44.2 + 122 + 36 1 - 3 1 -VA16B-263 LA --- --- 103.7 43.7 + 122 + 33 2 - 3 1 -VA16B-140 --- --- 103.5 44.5 + 119 31 6 2 2VA16B-254 LA --- --- 102.9 43.4 123 + 37 3 - 3 2 -VA16B-238 LA --- --- 102.0 43.4 122 + 34 3 - 3 1 -Secretariat 111.6 + 109.7 + 101.8 43.3 119 - 32 6 1 - 2 -VA16B-213 LA --- --- 101.5 44.1 + 122 + 37 + 2 - 2 2 -VA14B-74 116.9 + 113.7 + 101.4 41.9 122 + 36 5 3 1 -VA16B-142 --- --- 98.5 42 119 30 6 2 3VA16B-141 --- --- 98.2 43.5 119 - 33 6 2 - 4VA16B-131 --- --- 97.8 44 + 120 30 - 7 + 2 3VA16B-34 --- --- 97.7 43.4 117 - 31 7 + 3 3VA16B-244 LA --- --- 96.0 43.8 + 122 + 35 2 - 2 2 -VA16B-264 LA --- --- 95.8 44.7 + 119 34 4 - 2 2VA16B-133 --- --- 94.5 42.5 120 35 8 + 2 2VA16B-203 LA --- --- 92.9 43.3 123 + 35 2 - 2 2 -Atlantic 103.7 105.4 92.9 41.1 - 116 - 31 8 + 4 + 4 +VA16B-108 --- --- 92.1 42 120 33 4 2 2VA15B-79 --- 102.7 92.0 43.5 120 32 5 2 2VA13B-25 LA 109.3 + 104.3 91.9 43.3 117 - 33 4 3 2VA08B-95 103.0 99.2 90.4 42 117 - 34 6 2 3VA11B-141 LA 104.2 102.5 89.1 43.4 122 + 34 6 3 2VA16B-132 --- --- 88.6 43.2 121 34 6 2 - 2VA12B-56 106.3 103.0 86.2 42.5 117 - 33 4 3 4 +Violetta 88.9 - 88.1 - 85.1 43.9 + 123 + 29 - 1 - 2 3VA14BFHB-83 102.0 98.3 83.8 43.9 + 121 33 6 2 - 2Callao 95.9 92.1 83.6 41.4 - 117 - 30 9 + 4 + 4Calypso --- --- 81.5 40.2 - 126 + 32 3 - 2 - 1 -Nomini 88.0 - 88.0 - 78.7 - 41.4 - 118 - 40 + 3 - 4 + 3Barsoy 82.5 - 82.5 - 74.1 - 42.1 118 - 32 5 6 + 5 +Price 84.1 - 90.4 - 70.9 - 41.4 - 120 31 7 + 4 + 6 +VA15B-98 (LA) --- 93.4 69.6 - 40.2 - 120 28 - 7 + 3 8 +VA15B-33 --- 92.6 66.7 - 43.6 + 121 + 30 - 7 + 2 3
Leaf NetWeight Headed Height
Mature Plant3-year 2-year Yield Test Date
(0-9) (0-9)
Table 18. Summary of performance of entries in the Virginia Tech Barley Test, Kentland Farm, Blacksburg,VA, 2018 harvest.
Lodging Rust Blotch(Bu/a) (Bu/a) 48 lb/bu) (Lb/bu) (Julian) (In) (0-9)
Av. Yield Av. Yield (Bu/a @
35

Barley Lines
Leaf NetWeight Headed Height
Mature Plant3-year 2-year Yield Test Date
(0-9) (0-9)
Table 18. Summary of performance of entries in the Virginia Tech Barley Test, Kentland Farm, Blacksburg,VA, 2018 harvest.
Lodging Rust Blotch(Bu/a) (Bu/a) 48 lb/bu) (Lb/bu) (Julian) (In) (0-9)
Av. Yield Av. Yield (Bu/a @
Thoroughbred 91.8 - 87.6 - 61.5 - 37.8 - 123 + 33 7 + 3 9 +VA92-42-46 72.8 - 72.8 - 60.6 - 41.6 - 121 37 + 6 1 - 6 +Wysor 70.0 - 70.0 - 59.2 - 40.2 - 120 36 5 6 + 5 +Average 100.9 99.7 92.3 42.7 120 33 5 2 3LSD (0.05) 6.6 8.3 12.1 0.9 1 3 1 1 1C.V. 7.7 8.4 9.3 1.6 1 7 20 27 27Released cultivars are shown in bold print.Varieties are ordered by descending yield averages.A plus or minus sign indicates a performance significantly above or below the test average.The 0-9 ratings indicate a genotype's response to disease or lodging where 0 = highly resistant and 9 = highly susceptible.
36

Barley LinesYield
(Bu/A)Moist(%)
TestWeight
(Lb/Bu)
HeadDate
(Julian)
Mature Height
(In)
Plant Lodging
(0-9)
Leaf Rust(0-9)
Powdery Mildew
(0-9)FHB Index
(0-100)
Winter Survival(0-100)
(3) (3) (3) (2) (2) (2) (1) (1) (1) (1)
VA11B-141 LA 96.3 13.2 45.8 118.5 39.0 2.0 5.0 0.0 68.5 100.0Calypso (2R) 93.3 12.7 42.9 123.5 33.5 1.0 3.0 0.0 44.5 95.0KWS Scala (2R) 93.3 12.5 42.6 120.3 29.5 0.7 4.0 0.0 59.0 95.0Hirondella 93.2 12.9 41.6 122.5 34.0 1.5 3.0 0.0 82.5 95.0Flavia (2R) 92.7 13.0 42.9 123.7 28.3 0.8 3.0 0.5 52.5 90.0KWS Joy (2R) 92.6 13.1 41.6 124.0 30.5 1.3 3.0 2.0 55.3 95.0VA16M-84 (2R) 92.3 13.4 49.4 120.7 37.2 0.5 3.0 2.0 28.8 100.0VA16M-14DH1285 91.1 13.3 44.7 119.0 38.0 0.8 5.0 1.0 88.0 90.0SU-Mateo (2R) 90.4 13.3 43.6 123.8 31.7 2.0 4.0 0.0 38.8 100.0Violetta (2R) 89.7 13.0 44.7 120.7 30.8 0.7 3.0 0.5 46.3 95.0VA16M-14DH1269 89.7 12.8 46.4 115.8 30.2 1.2 5.0 0.5 82.5 100.0VA16M-14DH1271 89.3 12.9 44.0 116.3 29.7 0.8 4.0 1.5 80.5 95.0VA16M-83 (2R) 88.9 13.7 49.2 121.0 37.2 0.5 4.0 1.5 36.0 100.0ARS15B12 (2R) 88.6 13.6 45.8 119.7 37.0 0.8 4.0 2.0 35.5 95.004ARS635-4 (2R) 87.2 13.4 41.2 122.5 29.5 1.2 5.0 2.5 65.3 100.0ARS14B14 (2R) 87.1 13.2 49.2 119.7 33.3 2.3 6.0 0.0 35.3 70.0ARS15B30 86.7 13.2 44.6 115.2 30.3 2.8 4.0 0.5 66.5 95.0LCS Cassanova (2R) 86.1 13.3 45.7 123.8 30.0 1.0 3.0 0.0 45.3 70.0VA16M-81 (2R) 85.9 13.3 45.9 122.0 34.7 0.8 5.0 2.0 56.5 100.0ARS15B19 (2R) 85.5 13.9 45.8 120.2 40.0 0.3 3.0 1.5 50.0 95.0ARS14B12 (2R) 85.3 13.2 48.6 118.8 33.2 1.5 6.0 0.0 41.0 95.0VA16M-14DH1310 85.0 12.5 48.3 123.2 37.0 1.5 7.0 1.5 82.5 100.0LCS Nerea (2R) 85.0 13.2 44.6 117.8 29.3 1.0 3.0 0.0 45.8 95.0ARS15B21 84.4 15.9 45.1 121.7 36.8 0.8 5.0 1.5 64.0 95.0VA16M-14DH1308 84.1 12.4 45.8 117.3 29.8 0.5 7.0 0.5 83.3 100.0ARS15B24 (2R) 83.7 13.4 42.6 126.0 29.3 0.3 5.0 3.0 64.5 100.0ARS15B15 (2R) 83.7 13.7 46.5 119.5 40.2 0.5 3.0 3.0 45.3 95.0VA16M-14DH13-12 (2R) 83.4 13.3 46.0 120.2 33.2 0.5 6.0 0.0 48.8 80.0VA16M-14DH1294 (2R) 82.5 13.7 45.1 125.5 41.8 4.5 6.0 0.0 47.5 90.0ARS15B32 (2R) 81.5 13.5 46.4 119.5 39.3 0.5 4.0 2.5 40.5 95.0VA16M-115 (2R) 81.4 13.4 48.3 119.8 35.0 2.7 4.0 0.5 62.5 95.0ARS15B09 (2R) 80.3 13.5 47.5 119.2 35.2 0.2 4.0 0.0 40.5 80.0ARS15B10 (2R) 80.3 13.4 45.2 119.5 38.8 1.2 4.0 0.0 54.3 90.0VA16M-82 (2R) 78.8 13.4 49.5 120.2 37.0 3.0 5.0 1.5 25.5 95.0ARS14B15 (2R) 78.7 13.3 49.2 119.7 32.5 2.5 7.0 0.0 43.8 50.0Thoroughbred 78.6 13.1 42.0 120.3 33.2 4.5 8.0 2.5 77.8 100.0VA16M-14DH1272 (2R) 78.5 13.1 49.2 120.5 36.0 3.8 6.0 0.5 64.8 100.0ARS14B16 (2R) 78.4 13.3 48.3 119.5 31.8 1.5 5.0 0.0 48.5 70.0VA16M-14DH1283 76.3 11.9 39.9 119.7 36.0 5.5 5.0 0.0 87.0 100.0VA16B-123 (2R) 74.9 13.3 47.7 119.5 35.0 4.5 5.0 0.5 64.8 100.0VA16M-118 (2R) 71.7 13.0 46.4 119.3 37.7 4.0 3.0 1.0 54.0 100.0VA16M-14DH1281 (2R) 71.5 13.2 46.1 119.5 35.3 0.8 5.0 0.5 45.5 95.0ARS15B06* 60.4 13.3 46.8 116.0 35.7 0.0 5.0 0.0 33.0 10.0ARS15B34 (2R)* 52.9 13.0 46.2 115.3 34.7 1.0 5.0 0.0 42.8 20.0ARS15B08 (2R)* 59.7 14.1 46.1 114.7 39.3 0.7 4.0 0.0 18.1 5.0Average 83.1 13.3 45.7 120.3 34.3 1.6 4.6 0.8 54.8 92.7LSD (0.05) 6.0 0.8 1.7 0.8 1.7 1.2 --- 1.3 27.9 ---C.V. 7.7 6.3 3.8 0.5 4.3 62.9 --- 78.4 36.2 ---Released cultivars are shown in bold print. The number in parentheses below column headings indicates the number of locations on which data are based.Varieties are ordered by descending yield averages.The 0-9 ratings indicate a genotype's response to disease or lodging where 0 = highly resistant and 9 = highly susceptible.*These 3 lines experienced severe winterkill in Blacksburg lowering their overall yield performance.
Table 19. Summary of performance of entries in the Virginia Tech Eastern Malting Barley Test, 2018 harvest.
37

Barley LinesYield
(Bu/A)Moist(%)
TestWeight(Lb/Bu)
ARS15B06 87.3 13.3 49.7VA16M-83 (2R) 85.0 13.7 50.6VA16M-84 (2R) 84.3 12.8 51.2VA16M-14DH1294 (2R) 83.9 13.1 46.7ARS14B14 (2R) 83.5 12.6 51.704ARS635-4 (2R) 82.6 12.8 43.8VA16M-82 (2R) 82.5 12.8 51.4VA16M-14DH1285 81.9 12.7 47.8ARS14B15 (2R) 81.4 12.8 52.3ARS14B12 (2R) 81.3 12.6 50.8SU-Mateo (2R) 81.2 12.6 44.4VA16M-81 (2R) 81.0 12.9 45.0ARS15B34 (2R) 81.0 12.0 48.4VA16M-14DH13-12 (2R) 80.9 12.3 47.7VA11B-141 LA 80.8 12.5 47.9KWS Joy (2R) 80.8 12.6 42.1VA16M-14DH1269 80.6 12.0 48.7ARS14B16 (2R) 80.5 12.7 50.9ARS15B12 (2R) 80.0 12.6 45.8VA16M-14DH1271 79.9 12.6 45.5Thoroughbred 79.9 12.2 46.8ARS15B10 (2R) 79.8 11.5 46.3Flavia (2R) 79.8 12.6 42.3ARS15B15 (2R) 79.5 12.8 46.6VA16M-115 (2R) 79.5 12.9 50.1ARS15B24 (2R) 79.5 12.6 46.6LCS Cassanova (2R) 79.3 13.0 46.6ARS15B30 79.0 12.5 48.6VA16M-14DH1272 (2R) 78.5 11.7 50.8ARS15B09 (2R) 78.4 11.8 47.8ARS15B19 (2R) 78.0 12.7 44.7VA16M-14DH1308 77.9 11.1 49.4ARS15B21 77.2 13.3 46.2Violetta (2R) 76.9 11.7 43.0ARS15B32 (2R) 76.8 12.4 46.8LCS Nerea (2R) 76.3 12.6 44.7VA16M-14DH1281 (2R) 76.1 12.2 49.1VA16B-123 (2R) 75.8 12.4 48.7ARS15B08 (2R) 75.6 13.4 47.0VA16M-118 (2R) 74.3 11.4 47.8KWS Scala (2R) 73.0 10.6 41.9Hirondella 72.3 11.4 42.9VA16M-14DH1310 71.6 10.7 46.9Calypso (2R) 68.8 10.5 44.2VA16M-14DH1283 67.8 8.1 41.1Average 78.9 12.3 47.1LSD (0.05) 9.7 2.2 2.9C.V. 7.6 11.0 5.6Released cultivars are shown in bold print. Varieties are ordered by descending yield averages.
Table 20. Summary of performance of entries in the Virginia Tech Eastern Malting Barley Test, Southern Piedmont AREC, Blackstone, VA, 2018 harvest.
38

Barley LinesYield
(Bu/A)Moist(%)
TestWeight(Lb/Bu)
HeadDate
(Julian)
Mature Height
(In)
Plant Lodging
(0-9)
KWS Joy (2R) 105.9 13.3 42.9 121.3 30.7 0.0ARS15B12 (2R) 95.7 14.0 46.1 116.0 36.3 1.0KWS Scala (2R) 95.0 13.5 42.6 117.3 29.0 0.0Flavia (2R) 95.0 13.2 43.6 121.3 27.0 0.0VA11B-141 LA 94.8 13.6 43.6 115.0 40.3 2.0Calypso (2R) 94.2 13.9 41.9 121.3 34.3 0.0ARS15B06 93.5 14.8 44.9 116.0 35.7 0.0Thoroughbred 93.4 13.4 42.6 117.3 34.7 1.7VA16M-84 (2R) 92.5 13.6 48.2 118.0 38.7 1.0Hirondella 92.2 14.2 41.9 119.0 32.7 0.304ARS635-4 (2R) 90.9 13.4 39.8 118.3 29.3 1.0VA16M-14DH1285 90.2 13.6 42.0 116.0 39.0 1.0ARS15B21 90.2 17.8 44.7 118.3 38.7 1.7LCS Cassanova (2R) 88.5 13.5 46.0 122.3 29.0 0.3VA16M-83 (2R) 88.4 13.6 47.8 118.0 39.7 1.0VA16M-14DH1271 88.4 13.0 41.3 113.3 30.7 1.3ARS15B30 87.1 13.6 43.4 113.3 30.3 1.3SU-Mateo (2R) 86.8 13.8 43.6 121.0 31.0 0.7VA16M-14DH1310 85.9 13.1 47.9 120.0 37.7 2.3VA16M-14DH1308 85.8 13.2 43.5 114.0 30.7 1.0ARS14B14 (2R) 85.7 13.4 47.4 116.3 34.0 0.7ARS15B24 (2R) 83.9 14.0 41.6 123.7 28.7 0.0ARS15B19 (2R) 83.6 13.9 46.0 116.3 39.7 0.7ARS15B15 (2R) 82.8 14.1 45.8 115.7 39.7 1.0ARS15B09 (2R) 82.1 13.8 47.1 116.0 36.7 0.3ARS15B32 (2R) 82.1 13.8 45.5 115.7 39.3 0.7Violetta (2R) 81.9 13.7 44.8 118.0 30.0 0.0ARS14B12 (2R) 81.9 13.3 47.3 115.3 34.7 0.7ARS14B16 (2R) 81.8 13.4 47.2 116.7 32.3 0.0ARS15B10 (2R) 80.7 14.3 44.4 115.7 39.3 1.7VA16M-81 (2R) 80.6 13.4 45.4 119.0 36.3 1.0VA16M-14DH1269 79.9 13.0 44.6 113.0 30.0 2.0VA16M-14DH1294 (2R) 79.1 14.1 44.9 122.0 42.0 2.3LCS Nerea (2R) 78.4 13.6 45.0 114.7 27.7 1.0ARS14B15 (2R) 78.1 13.4 47.8 116.3 34.0 0.7VA16M-14DH13-12 (2R) 75.7 13.9 43.9 117.0 33.0 1.0VA16M-115 (2R) 74.7 13.6 46.7 116.7 35.0 2.0ARS15B08 (2R) 73.1 15.7 45.2 114.7 39.3 0.7ARS15B34 (2R) 71.5 13.9 44.0 115.3 34.7 1.0VA16M-82 (2R) 70.0 13.6 47.9 117.0 37.0 3.3VA16B-123 (2R) 66.6 13.7 46.3 115.7 34.7 4.7VA16M-14DH1283 65.3 14.0 36.0 116.3 37.0 4.3VA16M-14DH1272 (2R) 63.3 13.7 48.5 117.0 37.3 4.7VA16M-118 (2R) 60.6 13.7 44.9 116.0 39.3 5.0VA16M-14DH1281 (2R) 57.8 13.3 42.1 116.7 37.0 1.3Average 83.0 13.8 44.6 117.2 34.8 1.3LSD (0.05) 10.3 0.6 1.2 0.8 2.2 1.5C.V. 7.6 2.5 1.7 0.4 3.8 69.0Released cultivars are shown in bold print. Varieties are ordered by descending yield averages.The 0-9 ratings indicate a genotype's response to disease or lodging where 0 = highly resistant and 9 = highly susceptible.
Table 21. Summary of performance of entries in the Virginia Tech Eastern Malting Barley Test, Eastern Virginia AREC, Warsaw, VA, 2018 harvest.
39

Barley LinesYield
(Bu/A)Moist(%)
TestWeight
(Lb/Bu)
HeadDate
(Julian)
Mature Height
(In)
Plant Lodging
(0-9)
Leaf Rust(0-9)
Winter Survival
(%)
Calypso (2R) 116.9 13.6 42.9 125.7 32.7 2.0 3.0 95.0Hirondella 115.0 13.1 40.0 126.0 35.3 2.7 3.0 95.0VA11B-141 LA 113.2 13.6 45.9 122.0 37.7 2.0 5.0 100.0KWS Scala (2R) 111.8 13.4 43.3 123.3 30.0 1.3 4.0 95.0Violetta (2R) 110.4 13.6 46.4 123.3 31.7 1.3 3.0 95.0VA16M-14DH1269 108.4 13.4 46.0 118.7 30.3 0.3 5.0 100.0Flavia (2R) 103.5 13.4 42.8 126.0 29.7 1.7 3.0 90.0SU-Mateo (2R) 103.1 13.6 42.9 126.7 32.3 3.3 4.0 100.0VA16M-14DH1285 101.1 13.5 44.5 122.0 37.0 0.7 5.0 90.0LCS Nerea (2R) 100.3 13.5 44.1 121.0 31.0 1.0 3.0 95.0VA16M-84 (2R) 100.2 13.7 48.8 123.3 35.7 0.0 3.0 100.0VA16M-14DH1271 99.7 13.2 45.1 119.3 28.7 0.3 4.0 95.0VA16M-14DH1310 97.6 13.6 50.2 126.3 36.3 0.7 7.0 100.0VA16M-81 (2R) 96.0 13.6 47.4 125.0 33.0 0.7 5.0 100.0VA16M-14DH1283 95.9 13.7 43.0 123.0 35.0 6.7 5.0 100.0ARS15B19 (2R) 95.0 15.0 46.8 124.0 40.3 0.0 3.0 95.0ARS15B30 93.9 13.4 41.8 117.0 30.3 4.3 4.0 95.0VA16M-14DH1272 (2R) 93.7 13.8 48.2 124.0 34.7 3.0 6.0 100.0VA16M-14DH13-12 (2R) 93.6 13.6 46.4 123.3 33.3 0.0 6.0 80.0VA16M-83 (2R) 93.3 13.7 49.1 124.0 34.7 0.0 4.0 100.0ARS14B12 (2R) 92.9 13.7 47.6 122.3 31.7 2.3 6.0 95.0ARS14B14 (2R) 92.1 13.6 48.4 123.0 32.7 4.0 6.0 70.0KWS Joy (2R) 91.3 13.5 39.8 126.7 30.3 2.7 3.0 95.0LCS Cassanova (2R) 90.6 13.5 44.3 125.3 31.0 1.7 3.0 70.0VA16M-115 (2R) 90.1 13.8 48.1 123.0 35.0 3.3 4.0 95.0ARS15B12 (2R) 90.1 14.2 45.6 123.3 37.7 0.7 4.0 95.0ARS15B15 (2R) 88.8 14.2 47.0 123.3 40.7 0.0 3.0 95.0VA16M-14DH1308 88.4 12.9 44.6 120.7 29.0 0.0 7.0 100.0ARS15B24 (2R) 87.9 13.5 39.6 128.3 30.0 0.7 5.0 100.004ARS635-4 (2R) 87.9 14.0 40.1 126.7 29.7 1.3 5.0 100.0ARS15B21 85.9 16.5 44.6 125.0 35.0 0.0 5.0 95.0ARS15B32 (2R) 85.7 14.3 46.8 123.3 39.3 0.3 4.0 95.0VA16M-14DH1294 (2R) 84.6 13.9 43.6 129.0 41.7 6.7 6.0 90.0VA16M-82 (2R) 83.8 13.9 49.1 123.3 37.0 2.7 5.0 95.0VA16B-123 (2R) 82.4 13.8 48.0 123.3 35.3 4.3 5.0 100.0ARS15B09 (2R) 80.6 14.9 47.5 122.3 33.7 0.0 4.0 80.0ARS15B10 (2R) 80.5 14.5 45.0 123.3 38.3 0.7 4.0 90.0VA16M-14DH1281 (2R) 80.4 14.1 47.2 122.3 33.7 0.3 5.0 95.0VA16M-118 (2R) 80.2 13.9 46.5 122.7 36.0 3.0 3.0 100.0ARS14B15 (2R) 76.5 13.8 47.5 123.0 31.0 4.3 7.0 50.0ARS14B16 (2R) 72.9 13.7 46.9 122.3 31.3 3.0 5.0 70.0Thoroughbred 62.7 13.7 36.5 123.3 31.7 7.3 8.0 100.0ARS15B34 (2R)* 30.3 13.1 --- --- --- --- 5.0 20.0ARS15B06* 6.8 13.4 --- --- --- --- 5.0 10.0ARS15B08 (2R)* --- --- --- --- --- --- 4.0 5.0Average 89.5 13.8 45.2 123.6 33.8 1.9 4.4 94.2LSD (0.05) 11.3 0.6 2.0 1.3 2.6 1.8 --- ---C.V. 7.5 2.5 2.7 0.7 4.7 57.9 --- ---Released cultivars are shown in bold print. Varieties are ordered by descending yield averages.The 0-9 ratings indicate a genotype's response to disease or lodging where 0 = highly resistant and 9 = highly susceptible.
Table 22. Summary of performance of entries in the Virginia Tech Eastern Malting Barley Test, Kentland Farm, Blacksburg,VA, 2018 harvest.
* These lines were severely impacted by winterkill.
40

Section 2: Barley Scab Research
One of the primary research objectives of the Virginia Tech barley breeding program is to identify and develop cultivars possessing resistance to Fusarium head blight (FHB) or scab. Each year all barley and hulless barley entries in Virginia’s Official State Variety Trials are evaluated for FHB at the Virginia Crop Improvement Association (VCIA) test site in Mt. Holly, VA. Cultivars possessing complete resistance or immunity to FHB have not been identified and resistance levels in currently available cultivars vary from moderately resistant to highly susceptible.
A major goal of the breeding program is to identify and incorporate unique and complementary types of FHB resistance into cultivars to enhance the overall level of resistance. Incorporating multiple resistance genes having additive effects on FHB resistance into cultivars will enhance the overall level of resistance. Because the individual resistance genes are located on different barley chromosomes and each gene confers only partial resistance to FHB, identifying lines having multiple resistance genes is difficult using traditional breeding techniques. To overcome this limitation, our program will incorporate the available markers to help select FHB resistant cultivars.
In 2018, entries were inoculated by spreading scabby corn kernels (50g/4-rows) in plots at the booting stage. A moderately high level of FHB infection was obtained in 2018 as rising temperatures and heavy rainfall during flowering, the most critical time for scab infection.
Among 30 hulless lines and varieties tested in 2018, the FHB index ranged from 16.2 to 81.5 with FHB incidence ranging from 72.5% to 100% and FHB severity from 22.5% to 81.5% (Table 23). Eleven lines had FHB index values lower than the mean (<54.6) in 2018. Two lines, VA15H- 73 (2R) and VA16H-24 (2R) had FHB incidence, severity and index values significantly lower than the test mean.
Among 44 barley lines and varieties tested in 2018, the FHB index varied from 12.3 to 76.8 with FHB incidence ranging from 62.5% to 100% and FHB Severity from 19% to 76.8% (Table 25). Twenty-one lines and five varieties had FHB index values lower than the mean (<54.9) in 2018. Two elite malt barley varieties, Calypso and Violetta, developed in Europe, are currently being recommended for production in the mid-Atlantic and the eastern United States. They both had FHB incidence, severity and index values significantly lower than the test mean.
41
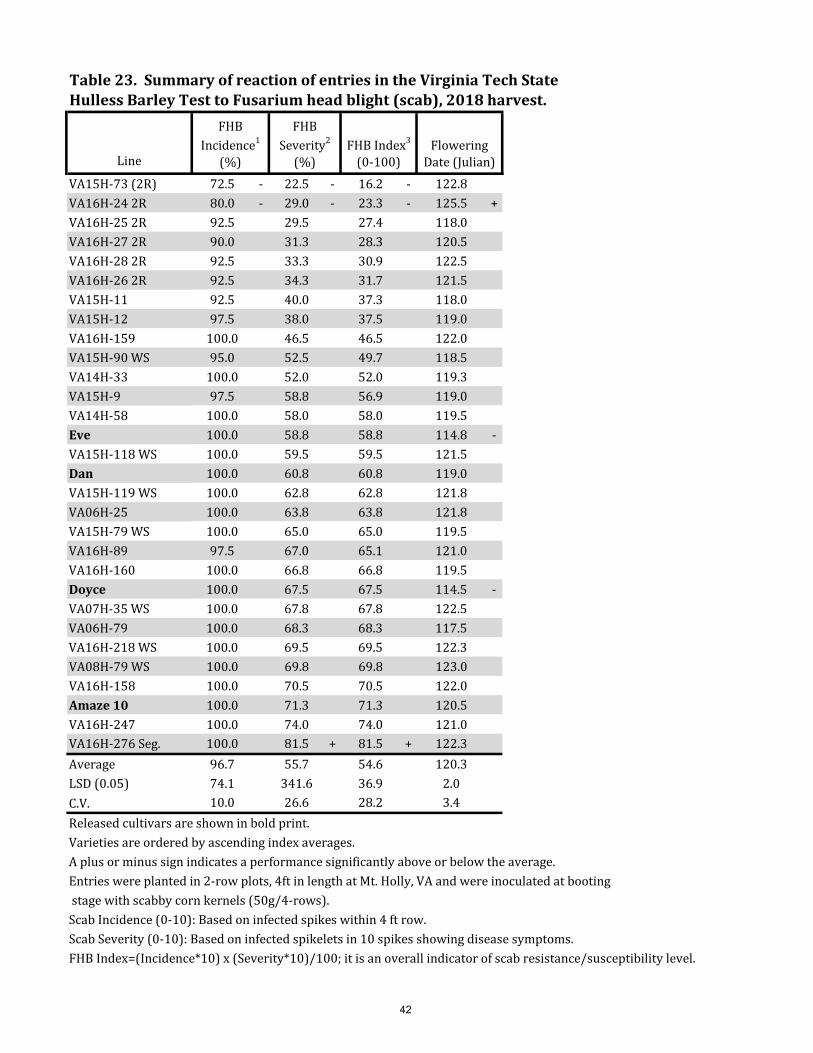
Line
VA15H-73 (2R) 72.5 - 22.5 - 16.2 - 122.8VA16H-24 2R 80.0 - 29.0 - 23.3 - 125.5 +VA16H-25 2R 92.5 29.5 27.4 118.0VA16H-27 2R 90.0 31.3 28.3 120.5VA16H-28 2R 92.5 33.3 30.9 122.5VA16H-26 2R 92.5 34.3 31.7 121.5VA15H-11 92.5 40.0 37.3 118.0VA15H-12 97.5 38.0 37.5 119.0VA16H-159 100.0 46.5 46.5 122.0VA15H-90 WS 95.0 52.5 49.7 118.5VA14H-33 100.0 52.0 52.0 119.3VA15H-9 97.5 58.8 56.9 119.0VA14H-58 100.0 58.0 58.0 119.5Eve 100.0 58.8 58.8 114.8 -VA15H-118 WS 100.0 59.5 59.5 121.5Dan 100.0 60.8 60.8 119.0VA15H-119 WS 100.0 62.8 62.8 121.8VA06H-25 100.0 63.8 63.8 121.8VA15H-79 WS 100.0 65.0 65.0 119.5VA16H-89 97.5 67.0 65.1 121.0VA16H-160 100.0 66.8 66.8 119.5Doyce 100.0 67.5 67.5 114.5 -VA07H-35 WS 100.0 67.8 67.8 122.5VA06H-79 100.0 68.3 68.3 117.5VA16H-218 WS 100.0 69.5 69.5 122.3VA08H-79 WS 100.0 69.8 69.8 123.0VA16H-158 100.0 70.5 70.5 122.0Amaze 10 100.0 71.3 71.3 120.5VA16H-247 100.0 74.0 74.0 121.0VA16H-276 Seg. 100.0 81.5 + 81.5 + 122.3Average 96.7 55.7 54.6 120.3LSD (0.05) 74.1 341.6 36.9 2.0C.V. 10.0 26.6 28.2 3.4Released cultivars are shown in bold print. Varieties are ordered by ascending index averages.A plus or minus sign indicates a performance significantly above or below the average.Entries were planted in 2-row plots, 4ft in length at Mt. Holly, VA and were inoculated at booting stage with scabby corn kernels (50g/4-rows). Scab Incidence (0-10): Based on infected spikes within 4 ft row. Scab Severity (0-10): Based on infected spikelets in 10 spikes showing disease symptoms.FHB Index=(Incidence*10) x (Severity*10)/100; it is an overall indicator of scab resistance/susceptibility level.
FHB Incidence1
(%)
FHB Severity2
(%)FHB Index3
(0-100)Flowering
Date (Julian)
Table 23. Summary of reaction of entries in the Virginia Tech State Hulless Barley Test to Fusarium head blight (scab), 2018 harvest.
42
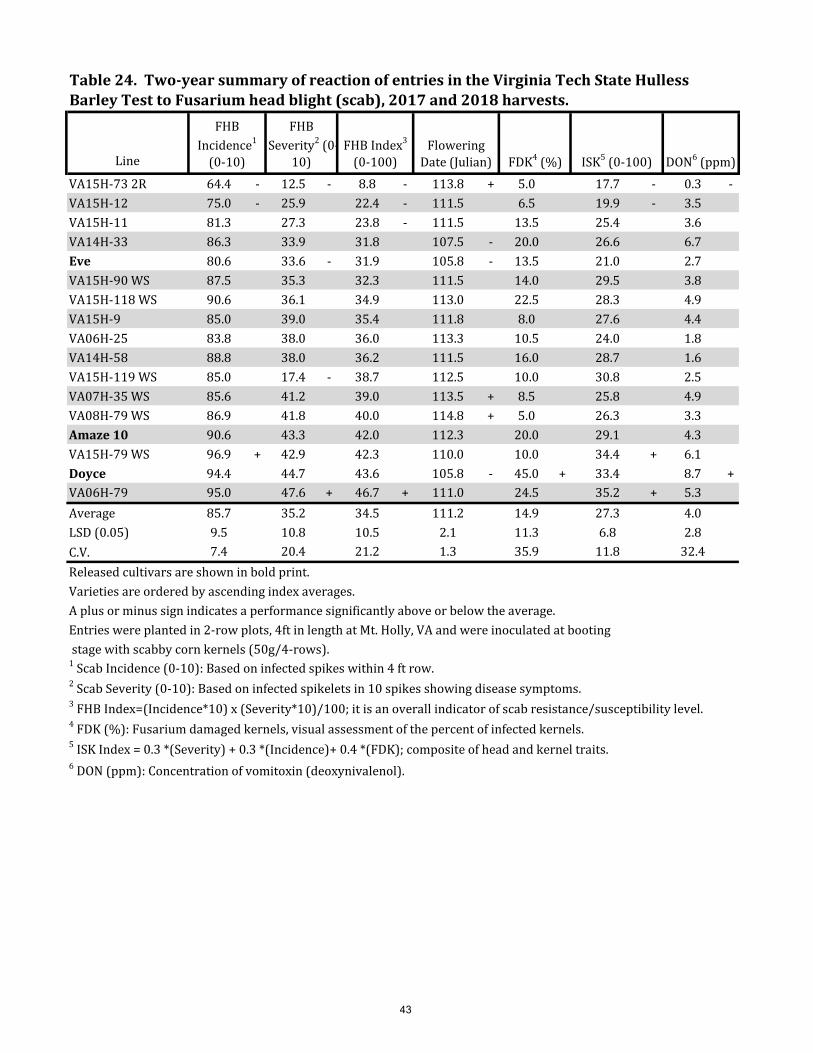
Line
VA15H-73 2R 64.4 - 12.5 - 8.8 - 113.8 + 5.0 17.7 - 0.3 -VA15H-12 75.0 - 25.9 22.4 - 111.5 6.5 19.9 - 3.5VA15H-11 81.3 27.3 23.8 - 111.5 13.5 25.4 3.6VA14H-33 86.3 33.9 31.8 107.5 - 20.0 26.6 6.7Eve 80.6 33.6 - 31.9 105.8 - 13.5 21.0 2.7VA15H-90 WS 87.5 35.3 32.3 111.5 14.0 29.5 3.8VA15H-118 WS 90.6 36.1 34.9 113.0 22.5 28.3 4.9VA15H-9 85.0 39.0 35.4 111.8 8.0 27.6 4.4VA06H-25 83.8 38.0 36.0 113.3 10.5 24.0 1.8VA14H-58 88.8 38.0 36.2 111.5 16.0 28.7 1.6VA15H-119 WS 85.0 17.4 - 38.7 112.5 10.0 30.8 2.5VA07H-35 WS 85.6 41.2 39.0 113.5 + 8.5 25.8 4.9VA08H-79 WS 86.9 41.8 40.0 114.8 + 5.0 26.3 3.3Amaze 10 90.6 43.3 42.0 112.3 20.0 29.1 4.3VA15H-79 WS 96.9 + 42.9 42.3 110.0 10.0 34.4 + 6.1Doyce 94.4 44.7 43.6 105.8 - 45.0 + 33.4 8.7 +VA06H-79 95.0 47.6 + 46.7 + 111.0 24.5 35.2 + 5.3Average 85.7 35.2 34.5 111.2 14.9 27.3 4.0LSD (0.05) 9.5 10.8 10.5 2.1 11.3 6.8 2.8C.V. 7.4 20.4 21.2 1.3 35.9 11.8 32.4Released cultivars are shown in bold print. Varieties are ordered by ascending index averages.A plus or minus sign indicates a performance significantly above or below the average.Entries were planted in 2-row plots, 4ft in length at Mt. Holly, VA and were inoculated at booting stage with scabby corn kernels (50g/4-rows). 1 Scab Incidence (0-10): Based on infected spikes within 4 ft row. 2 Scab Severity (0-10): Based on infected spikelets in 10 spikes showing disease symptoms.3 FHB Index=(Incidence*10) x (Severity*10)/100; it is an overall indicator of scab resistance/susceptibility level. 4 FDK (%): Fusarium damaged kernels, visual assessment of the percent of infected kernels. 5 ISK Index = 0.3 *(Severity) + 0.3 *(Incidence)+ 0.4 *(FDK); composite of head and kernel traits.6 DON (ppm): Concentration of vomitoxin (deoxynivalenol).
DON6 (ppm)
Table 24. Two-year summary of reaction of entries in the Virginia Tech State Hulless Barley Test to Fusarium head blight (scab), 2017 and 2018 harvests.
FHB Incidence1
(0-10)
FHB Severity2 (0-
10)FHB Index3
(0-100)Flowering
Date (Julian) FDK4 (%) ISK5 (0-100)
43

Line
Calypso 62.5 - 19.0 - 12.3 - 120.3 +Violetta 92.5 32.3 - 29.6 - 122.0 +VA11B-141 LA 95.0 35.3 34.0 117.0VA16B-236 LA 90.0 42.8 39.2 120.8 +VA16B-254 LA 92.5 42.0 39.4 120.0VA13B-25 LA 95.0 41.3 39.5 113.8VA16B-213 LA 92.5 43.0 39.6 119.8VA16B-244 LA 97.5 42.8 42.0 118.5Secretariat 100.0 43.0 43.0 116.5VA16B-264 LA 95.0 47.0 44.8 115.0VA16B-203 LA 95.0 47.5 45.1 118.0Thoroughbred 90.0 50.3 45.2 119.5VA08B-95 100.0 46.8 46.8 113.8VA15B-33 95.0 48.8 47.2 119.3VA92-42-46 97.5 49.3 48.2 119.0Barsoy 100.0 48.3 48.3 113.8 -VA16B-133 100.0 48.3 48.3 118.0VA16B-238 LA 92.5 52.3 48.4 119.3VA14B-78 100.0 48.5 48.5 114.8VA16B-217 LA 100.0 49.3 49.3 117.5VA15B-98 (LA) 97.5 51.8 49.9 116.8VA16B-108 97.5 52.0 50.3 118.0VA16B-3 97.5 53.5 52.5 115.0VA14BFHB-83 92.5 55.8 53.0 117.5VA16B-132 100.0 53.0 53.0 116.0VA16B-140 97.5 55.8 54.6 118.0VA16B-34 97.5 57.8 56.5 116.5Atlantic 100.0 58.3 58.3 114.3Wysor 100.0 58.8 58.8 117.8VA16B-141 100.0 59.0 59.0 117.0VA14B-59 100.0 62.5 62.5 117.0VA16B-131 100.0 63.5 63.5 120.0VA16B-142 95.0 68.0 64.7 116.8VA16B-263 LA 100.0 65.0 65.0 118.0VA14B-79 100.0 65.5 65.5 115.5Callao 100.0 65.8 65.8 116.5Price 95.0 70.0 66.9 117.5VA12B-56 100.0 67.0 67.0 113.3 -VA14B-63 100.0 71.0 71.0 120.0VA14B-75 100.0 72.0 72.0 117.3VA14B-57 100.0 73.3 73.3 116.5VA14B-74 100.0 73.3 73.3 118.0VA15B-79 100.0 76.8 + 76.8 + 116.5Nomini* --- --- --- ---Average 96.6 54.2 52.93 117.30LSD (0.05) 10.6 21.4 22.49 3.53C.V. 78.6 282.2 30.44 2.16Released cultivars are shown in bold print. Varieties are ordered by ascending index averages.A plus or minus sign indicates a performance significantly above or below the average.Entries were planted in 2-row plots, 4ft in length at Mt. Holly, VA and were inoculated at booting stage with scabby corn kernels (50g/4-rows). Scab Incidence (0-10): Based on infected spikes within 4 ft row. Scab Severity (0-10): Based on infected spikelets in 10 spikes showing disease symptoms.FHB Index=(Incidence*10) x (Severity*10)/100; it is an overall indicator of scab resistance/susceptibility level. *Nomini seed was determined to be mixed with another variety and data therefore is not being reported.
FHB Incidence1
(%)
FHB Severity2
(%)FHB Index3
(0-100)Flowering
Date (Julian)
Table 25. Summary of reaction of entries in the Virginia Tech State Barley Test to Fusarium head blight (scab), 2018 harvest.
44

Line
Violetta 68.8 - 17.6 - 15.4 - 114.3 + 27.5 14.5 - 1.56 -VA11B-141 LA 88.1 21.1 - 19.8 - 109.5 38.0 26.6 5.66VA13B-25 LA 82.5 - 24.5 22.4 105.3 - 39.5 23.5 - 2.93Thoroughbred 86.9 28.2 25.2 111.0 + 46.0 27.1 3.11Secretariat 88.8 26.3 25.4 108.0 34.0 22.4 - 4.78VA08B-95 94.4 27.4 27.1 106.8 50.5 29.2 10.41VA15B-98 (LA) 90.6 29.2 27.8 109.3 41.0 27.3 2.14 -Barsoy 93.1 30.3 29.4 106.8 31.5 29.7 6.62VA15B-33 96.9 30.3 29.5 109.5 46.0 33.4 5.90VA92-42-46 90.6 32.0 30.5 109.5 54.0 26.5 3.60VA14B-78 98.1 31.1 30.8 106.5 43.5 33.2 9.81Nomini 79.4 - 33.6 31.3 107.0 25.0 20.9 - 1.92 -VA14BFHB-83 90.0 35.2 33.0 108.3 60.0 30.9 5.64Atlantic 92.5 34.1 33.4 104.8 - 48.0 28.7 5.83VA12B-56 93.1 38.0 37.4 105.8 - 41.0 28.7 5.13VA14B-59 99.4 38.8 38.7 108.0 42.5 34.3 + 7.77Price 92.5 41.4 39.1 108.3 43.5 31.0 7.60Callao 96.3 40.2 39.6 107.0 48.5 32.3 9.35VA14B-79 99.4 40.0 39.9 108.5 31.5 34.1 + 12.61 +Wysor 97.5 40.6 40.2 109.3 47.5 35.4 + 2.83VA14B-57 98.8 42.0 41.9 108.3 35.0 32.6 9.15VA14B-63 100.0 + 42.2 42.2 111.3 + 38.0 34.2 + 10.07VA14B-74 100.0 + 42.8 42.8 110.0 55.5 33.9 + 11.05 +VA14B-75 98.1 43.6 43.3 108.3 60.0 33.3 10.70 +VA15B-79 97.5 46.0 45.6 108.3 42.5 33.2 6.33Average 92.53 34.26 33.26 108.36 42.8 29.5 6.50LSD (0.05) 7.46 12.44 12.83 2.57 18.9 4.3 3.94C.V. 5.67 25.55 27.13 1.67 21.4 7.1 29.35Released cultivars are shown in bold print. Varieties are ordered by ascending index averages.A plus or minus sign indicates a performance significantly above or below the average.Entries were planted in 2-row plots, 4ft in length at Mt. Holly, VA and were inoculated at booting stage with scabby corn kernels (50g/4-rows). 1 Scab Incidence (0-10): Based on infected spikes within 4 ft row. 2 Scab Severity (0-10): Based on infected spikelets in 10 spikes showing disease symptoms.3 FHB Index=(Incidence*10) x (Severity*10)/100; it is an overall indicator of scab resistance/susceptibility level.
*Nomini seed was determined to be mixed with another variety and data therefore is not being reported.
Table 26. Two-year summary of reaction of entries in the Virginia Tech State Barley Test to Fusarium head blight (scab), 2017 and 2018 harvests.
6 DON (ppm): Concentration of vomitoxin (deoxynivalenol).
4 FDK (%): Fusarium damaged kernels, visual assessment of the percent of infected kernels. 5 ISK Index = 0.3 *(Severity) + 0.3 *(Incidence)+ 0.4 *(FDK); composite of head and kernel traits.
DON6 (ppm)
FHB Incidence1
(%)
FHB Severity2
(%)FHB Index3
(0-100)Flowering
Date (Julian) FDK4 (%) ISK5 (0-100)
45

Section 4: Wheat Varieties Wheat trials were planted in seven-inch rows at Blackstone, Orange, Holland, Painter, and Shenandoah Valley. They were planted in six-inch rows at Blacksburg and Warsaw. The no-till locations (Holland and Shenandoah Valley) were planted at 48 seeds per square foot. All other locations were planted at 44 seeds per square foot.
Selecting the best wheat varieties is challenging but becomes easier with adequate information on performance over multiple environments. Past seasons across Virginia have provided the opportunity to evaluate day length sensitivity, spring freeze damage, glume blotch, scab (Fusarium head blight), and general plant health. Many newer wheat varieties and lines performed well in all environments tested. The future for wheat varieties adapted to Virginia conditions is very positive. Dr. Carl Griffey, Virginia Tech's small grains breeder, has many lines starting with "VA" shown in the by- and over-location tables that are in the top-yielding group and that display good disease resistance.
The released varieties that yielded significantly higher than the statewide mean in 2018, in descending yield order were, L11791, USG 3895, MAS #86, AgriMAXX 415, AgriMAXX 446, MAS #87, USG 3329, USG 3316, Viper, AgriMAXX 486, USG 3197, SH4300, Dyna-Gro 9772 and Pioneer 26R59. AgriMAXX 415 and Viper also had test weight that was significantly higher than the mean of all lines tested. Average yield of all lines tested in 2016-17 was 70.9 bushels per acre, up one from 2016-17.
Released lines with yields higher than the 3-year statewide mean, in descending yield order were, Pioneer Brand 26R59, Croplan 8550, AgriMAXX 474, AgriMAXX 415, Hilliard, USG 3895, #Bullet, Dyna-Gro 9811 and MAS #61. Dyna-Gro 9811, Hilliard and AgriMAXX 415 also had test weight that was significantly higher than the mean of all lines tested over the 3-years.
Producers who grow large acreages of wheat should plant two or more varieties having significantly different maturity dates in order to ensure harvest of high quality grain having high test weight and no sprouting. In Virginia it is typical for sporadic or consistent rain showers to interrupt harvest. These wetting and drying cycles and subsequent delays and significantly reduce grain test weight and quality. Growers can circumvent this problem by planting varieties that differ significantly in maturity. Early maturing varieties often can be harvested first and prior to significant rain showers, and later maturing varieties harvested 42 subsequently will suffer less damage and losses in test weight and quality due to exposure to such a rain event.
46

Summary of wheat management practices for the 2018 harvest season (All rates are given on a per acre basis.)
Blacksburg - Planted October 4, 2017. Pre-plant fertilizer was 47-120-150-10(S)-3(B). Site was sprayed with .75 oz. Harmony Extra SG® on November 17, 2017. Site was fertilized with 20 units UAN 30-0-0 on March 5, 2018 and with 60 units UAN 30-0-0 plus 0.6 oz. Harmony Extra SG® on April 6, 2018. Harvest occurred June 30, 2018.
Blackstone - Planted October 19, 2017. Pre-plant fertilizer was 300 lb. 10-10-10 on October 17, 2018. Site was top-dressed with 60 lb. N and sprayed with .5 oz. Harmony Extra SG® on February 28, 2018. Additionally, site was fertilized with 40 lb. N using UAN on April 23, 2018. Harvest occurred June 14, 2018.
Warsaw - Planted October 22, 2017. Pre-plant fertilizer was 30-80-80-5 applied October 19, 2017. Site was fertilized using 12-0-0-1.5 at 30 lb. on December 7, 2017 and again on February 9, 2018. Site was also fertilized using 24-0-0-3 at 50 lb. on March 19, 2018. Harmony Extra SG® was applied at .75 oz. with surfactant at 2 qt. /100 gal water on February 28, 2018. Site was treated with 1 qt. Boron on March 27, 2018. Harvest occurred June 14, 2018.
Painter - Planted November 17, 2017. Pre-plant fertilizer was 60 lb. N on November 15, 2017. Application of .75 oz. Harmony Extra SG® was on April 2, 2018. Site was fertilized with 120 lb. N using 30% UAN April 2, 2018. Harvest occurred June 19-20, 2018.
Holland - Planted conventional-till October 25, 2017. Pre-plant fertilizer was 345 lb. 10-17-29 on October 17, 2017. Site was fertilized with 60 units N using 24-0-0-3 plus 0.75 oz.Harmony Extra SG® on February 5, 2018. Site was again fertilized with 60 units N using24-0-0-3 on April 2, 2018. Site was treated with 16.4 oz. Axel® on March 18, 2018. Sitewas treated with 4 oz Folicur® on April 26, 2018. Harvest occurred June 13, 2018.
Orange - Planted October 18, 2017. Pre-plant fertilizer was 30-60-0 October 5, 2017. Sixty lb. N plus 0.6 oz. Harmony Extra SG® was applied March 5, 2018. Site was harvested June 28, 2018.
Shenandoah Valley - Planted on October 26, 2017. Pre-plant fertilizer was 1.5 ton broiler litter. Forty units N plus 0.6 oz. Harmony Extra SG® were applied on March 6, 2018. Seventy units N was applied on April 6, 2018. Harvest occurred on June 29, 2018.
47

Entries in 2017-18 Virginia Wheat Test, arranged by company.Company Line Seed Treatment reported by companyAgriMAXX Wheat Company AgriMAXX 415 Vibrance™ Extreme, Cruiser® 5FS, Maxim 4FS7167 Highbanks Road AgriMAXX 444 Vibrance™ Extreme, Cruiser® 5FS, Maxim 4FSMascoutah, IL 62258 AgriMAXX 446 Vibrance™ Extreme, Cruiser® 5FS, Maxim 4FS
AgriMAXX 463 Vibrance™ Extreme, Cruiser® 5FS, Maxim 4FSAgriMAXX 473 Vibrance™ Extreme, Cruiser® 5FS, Maxim 4FSAgriMAXX 474 Vibrance™ Extreme, Cruiser® 5FS, Maxim 4FSAgriMAXX 480 Vibrance™ Extreme, Cruiser® 5FS, Maxim 4FSAgriMAXX Exp 1892 Vibrance™ Extreme, Cruiser® 5FS, Maxim 4FSAgriMAXX 485 Vibrance™ Extreme, Cruiser® 5FS, Maxim 4FSAgriMAXX 486 Vibrance™ Extreme, Cruiser® 5FS, Maxim 4FSAgriMAXX Exp 1874 Vibrance™ Extreme, Cruiser® 5FS, Maxim 4FS
Armor Seed, LLC Armor Mayhem Vibrance™ Extreme 183 Pennsylvania Ave. Armor Nemesis Vibrance™ Extreme Waldenburg, AR 72475 Armor Riptide Vibrance™ Extreme
Armor ARW1716 Vibrance™ Extreme Armor ARW1719 Vibrance™ Extreme Armor ARW1762 Vibrance™ Extreme Armor ARW1766 Vibrance™ Extreme
Crop Production Services Dyna-Gro 9522 Foothold® Virock™ w/ Awaken® ST15277 Richmond-Tappahannock Hwy Dyna-Gro 9600 Foothold® Virock™ w/ Awaken® STSt Stephens Church, VA 23148 Dyna-Gro 9701 Foothold® Virock™ w/ Awaken® ST
Dyna-Gro 9750 Foothold® Virock™ w/ Awaken® STDyna-Gro 9772 Foothold® Virock™ w/ Awaken® STDyna-Gro 9811 Foothold® Virock™ w/ Awaken® STDyna-Gro 9862 Foothold® Virock™ w/ Awaken® STShirley Foothold® Virock™ w/ Awaken® STWX17775 Foothold® Virock™ w/ Awaken® ST
Dupont Pioneer Pioneer 26R10 Vibrance™ Extreme425 Abbeydale Way Pioneer 26R36 Vibrance™ ExtremeColumbia, SC 29229 Pioneer 26R41 Vibrance™ Extreme
Pioneer 26R45 Vibrance™ ExtremePioneer 26R59 Vibrance™ Extreme
Eddie Mercer Agri-Services, Inc. MBX 14-S-210 Vibrance™ Extreme, Cruiser® 5FS6900 Linganore Road MBX 17-M-245 Vibrance™ Extreme, Cruiser® 5FSFrederick, MD 21702 MBX 17-P-275 Vibrance™ Extreme, Cruiser® 5FS
MBX 18-A-237 Vibrance™ Extreme, Cruiser® 5FSErwin-Keith, Inc. (Progeny) #Boss EverGol™, Gaucho®1529 Hwy 193 #Bullet EverGol™, Gaucho®Wynne, AR 72396 #Turbo EverGol™, Gaucho®
#Warrior EverGol™, Gaucho®#Blaze EverGol™, Gaucho®PGX 16-7 EverGol™, Gaucho®PGX 17-20 EverGol™, Gaucho®PGX17-16 EverGol™, Gaucho®
Featherstone Farm Seed Featherstone 73 Vibrance™ Extreme13941 Genito RoadAmelia, VA 23002
48

Entries in 2017-18 Virginia Wheat Test, arranged by company.Company Line Seed Treatment reported by companyUniversity of Georgia GA061471-15LE38 Dividend® Extreme1109 Experiment Street GA08535-15LE29 Dividend® ExtremeGriffin, GA 30223Limagrain Cereal Seeds L11550 Raxil MD Pro MD, Imidacloprid7099 Parkbrook Lane L11551 Vibrance™ Extreme, Cruiser® 5FSCodova, TN 38018 L11719 Abaugh Cereal F & I
LCS Ammo Vibrance™ Extreme, Cruiser® 5FSUniversity of Maryland 15MDX18 Vibrance™ Extreme1116 Research Greenhouse Complex 15MDX20 Vibrance™ ExtremeCollege Park, MD 20742 15MDX5 Vibrance™ Extreme
Luisa Vibrance™ ExtremeMeherrin Ag & Chemical (Southern Harvest) SH 4300 Vibrance™ Extreme, Super Symcoat®413 Main Street SH 4400 Vibrance™ Extreme, Super Symcoat®Severn, NC 27877 SH 7200 Vibrance™ Extreme, Super Symcoat®
SH 7510 Vibrance™ Extreme, Super Symcoat®Mid-Atlantic Seeds MAS #116 MAS Pro-Shield316 Albemarle Street MAS #316 MAS Pro-ShieldYork, PA 17403 MAS #61 MAS Pro-Shield
MAS #65 MAS Pro-ShieldMAS #7 MAS Pro-ShieldMAS #83 MAS Pro-ShieldMAS #84 MAS Pro-ShieldMAS #85 MAS Pro-ShieldMAS #86 MAS Pro-ShieldMAS #87 MAS Pro-Shield
North Carolina State University NC13-20076 Dividend® Extreme840 Method Road Unit 3 NC13-21213 Dividend® ExtremeRaleigh, NC 27695-7629 NC14-23372 Dividend® ExtremeSyngenta Seeds, Inc. SY 547 Vibrance™ Extreme806 N. 2nd St SY Miskin Vibrance™ ExtremeBerthoud, CO 80513 SY Viper Vibrance™ ExtremeTidewater Seed LLC TWS2616 Vibrance™ Extreme 29000 Information Lane, Suite 302 TWS2818 Cruiser Maxx® Vibrance® CerealsEaston, MD 21601 TWS3418 Cruiser Maxx® Vibrance® CerealsUniSouth Genetics, Inc. USG 3118 Vibrance™ Extreme, Cruiser® 5FS3205-C HWY 46S USG 3197 Vibrance™ Extreme, Cruiser® 5FSDickson, TN 37055 USG 3228 Vibrance™ Extreme, Cruiser® 5FS
USG 3316 Vibrance™ Extreme, Cruiser® 5FSUSG 3329 Vibrance™ Extreme, Cruiser® 5FSUSG 3404 Vibrance™ Extreme, Cruiser® 5FSUSG 3429 Vibrance™ Extreme, Cruiser® 5FSUSG 3458 Vibrance™ Extreme, Cruiser® 5FSUSG 3536 Vibrance™ Extreme, Cruiser® 5FSUSG 3895 Vibrance™ Extreme, Cruiser® 5FS
49

Entries in 2017-18 Virginia Wheat Test, arranged by company.Company Line Seed Treatment reported by companyVirginia Tech and the Virginia 12VTK10-156 Raxil®MD Pro + Gaucho 600Crop Improvement Association 12VTK15-148 Raxil®MD Pro + Gaucho 6009142 Atlee Station Road 13VA-FHB-DH131 Raxil®MD Pro + Gaucho 600Mechanicsville, VA 23111 13VA-FHB-DH252 Raxil®MD Pro + Gaucho 600
13VTK128-75 Raxil®MD Pro + Gaucho 60013VTK429-3 Raxil®MD Pro + Gaucho 60013VTK434-89 Raxil®MD Pro + Gaucho 60013VTK59-148 Raxil®MD Pro + Gaucho 60013VTK82-51 Raxil®MD Pro + Gaucho 600DH11SRW066-153 Raxil®MD Pro + Gaucho 600DH11SRW069-70 Raxil®MD Pro + Gaucho 600DH12SRW056-058 Raxil®MD Pro + Gaucho 600DH12SRW057-006 Raxil®MD Pro + Gaucho 600DH12SRW057-081 Raxil®MD Pro + Gaucho 600DH13SRW021-70 Raxil®MD Pro + Gaucho 600DH13SRW021-80 Raxil®MD Pro + Gaucho 600DH13SRW023-201 Raxil®MD Pro + Gaucho 600DH13SRW025-14 Raxil®MD Pro + Gaucho 600Hilliard Raxil®MD Pro, Imidacloprid, Storicide IIMassey Raxil®MD Pro + Gaucho 600VA09MAS1-12-5-1-1 Raxil®MD Pro + Gaucho 600VA09MAS1-12-5-1-3 Raxil®MD Pro + Gaucho 600VA09MAS2-131-6-2 Raxil®MD Pro + Gaucho 600VA09MAS2-131-6-2-4 Raxil®MD Pro + Gaucho 600VA09MAS6-122-7-1 Raxil®MD Pro + Gaucho 600VA12W-31 Raxil®MD Pro + Gaucho 600VA12W-68 Raxil®MD Pro + Gaucho 600VA13W-174 Raxil®MD Pro + Gaucho 600VA15W-130 Raxil®MD Pro + Gaucho 600VA15W-131 Raxil®MD Pro + Gaucho 600VA15W-30 Raxil®MD Pro + Gaucho 600VA15W-63 Raxil®MD Pro + Gaucho 600VA15W-67 Raxil®MD Pro + Gaucho 600VA15W-68 Raxil®MD Pro + Gaucho 600VA15W-70 Raxil®MD Pro + Gaucho 600VA15W-91 Raxil®MD Pro + Gaucho 600VA15W-92 Raxil®MD Pro + Gaucho 600VA16W-104 Raxil®MD Pro + Gaucho 600VA16W-105 Raxil®MD Pro + Gaucho 600VA16W-124 Raxil®MD Pro + Gaucho 600VA16W-148 Raxil®MD Pro + Gaucho 600VA16W-149 Raxil®MD Pro + Gaucho 600VA16W-152 Raxil®MD Pro + Gaucho 600VA16W-196 Raxil®MD Pro + Gaucho 600VA16W-202 Raxil®MD Pro + Gaucho 600VA16W-224 Raxil®MD Pro + Gaucho 600VA16W-229 Raxil®MD Pro + Gaucho 600
50
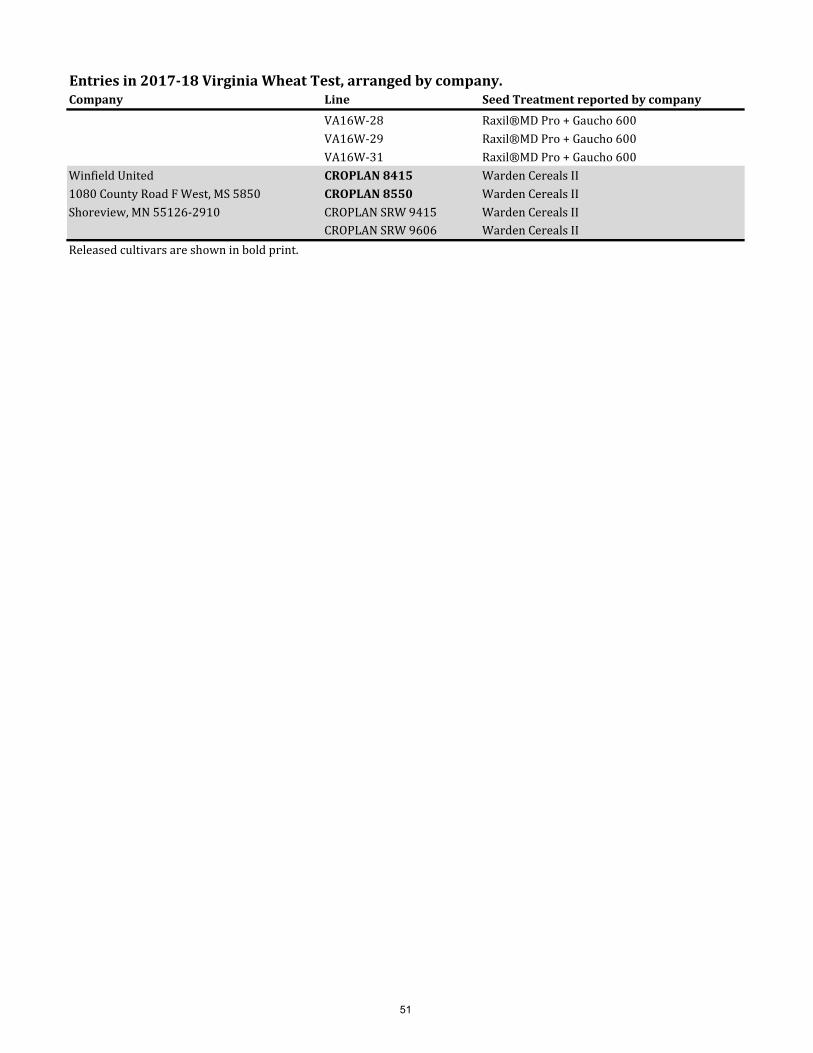
Entries in 2017-18 Virginia Wheat Test, arranged by company.Company Line Seed Treatment reported by company
VA16W-28 Raxil®MD Pro + Gaucho 600VA16W-29 Raxil®MD Pro + Gaucho 600VA16W-31 Raxil®MD Pro + Gaucho 600
Winfield United CROPLAN 8415 Warden Cereals II1080 County Road F West, MS 5850 CROPLAN 8550 Warden Cereals IIShoreview, MN 55126-2910 CROPLAN SRW 9415 Warden Cereals II
CROPLAN SRW 9606 Warden Cereals IIReleased cultivars are shown in bold print.
51
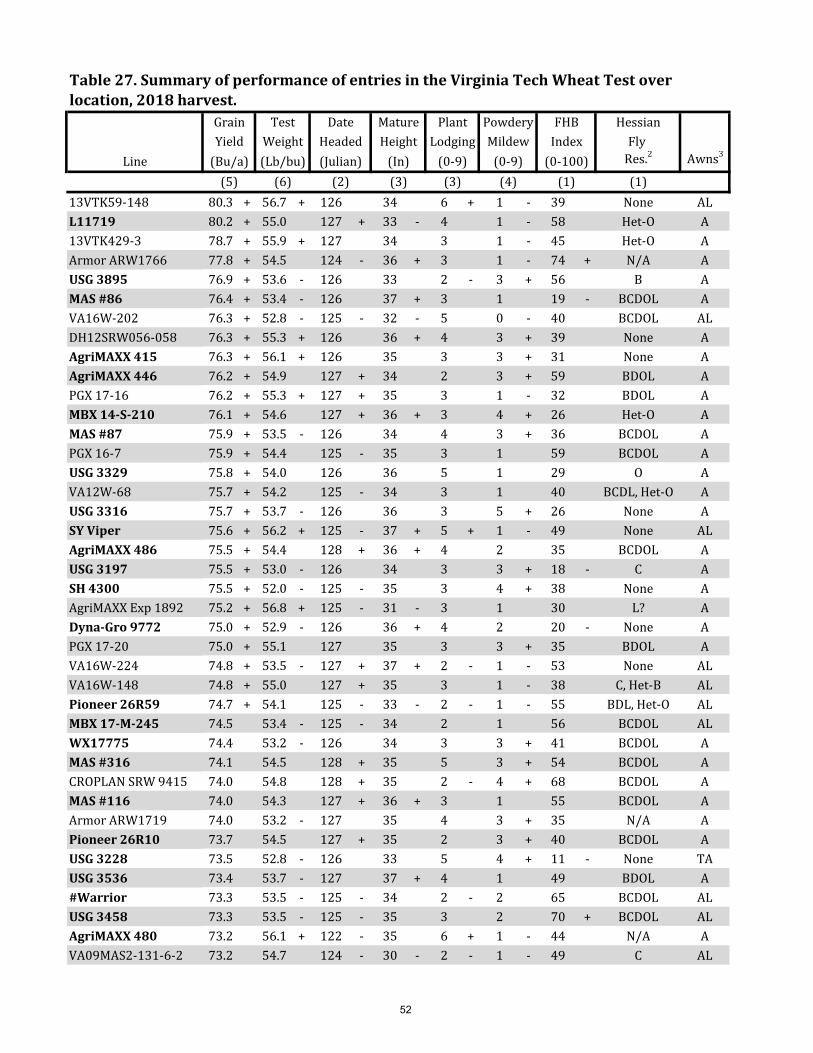
HessianFly
Line Res.2 Awns3
(1)13VTK59-148 80.3 + 56.7 + 126 34 6 + 1 - 39 None ALL11719 80.2 + 55.0 127 + 33 - 4 1 - 58 Het-O A13VTK429-3 78.7 + 55.9 + 127 34 3 1 - 45 Het-O AArmor ARW1766 77.8 + 54.5 124 - 36 + 3 1 - 74 + N/A AUSG 3895 76.9 + 53.6 - 126 33 2 - 3 + 56 B AMAS #86 76.4 + 53.4 - 126 37 + 3 1 19 - BCDOL AVA16W-202 76.3 + 52.8 - 125 - 32 - 5 0 - 40 BCDOL ALDH12SRW056-058 76.3 + 55.3 + 126 36 + 4 3 + 39 None AAgriMAXX 415 76.3 + 56.1 + 126 35 3 3 + 31 None AAgriMAXX 446 76.2 + 54.9 127 + 34 2 3 + 59 BDOL APGX 17-16 76.2 + 55.3 + 127 + 35 3 1 - 32 BDOL AMBX 14-S-210 76.1 + 54.6 127 + 36 + 3 4 + 26 Het-O AMAS #87 75.9 + 53.5 - 126 34 4 3 + 36 BCDOL APGX 16-7 75.9 + 54.4 125 - 35 3 1 59 BCDOL AUSG 3329 75.8 + 54.0 126 36 5 1 29 O AVA12W-68 75.7 + 54.2 125 - 34 3 1 40 BCDL, Het-O AUSG 3316 75.7 + 53.7 - 126 36 3 5 + 26 None ASY Viper 75.6 + 56.2 + 125 - 37 + 5 + 1 - 49 None ALAgriMAXX 486 75.5 + 54.4 128 + 36 + 4 2 35 BCDOL AUSG 3197 75.5 + 53.0 - 126 34 3 3 + 18 - C ASH 4300 75.5 + 52.0 - 125 - 35 3 4 + 38 None AAgriMAXX Exp 1892 75.2 + 56.8 + 125 - 31 - 3 1 30 L? ADyna-Gro 9772 75.0 + 52.9 - 126 36 + 4 2 20 - None APGX 17-20 75.0 + 55.1 127 35 3 3 + 35 BDOL AVA16W-224 74.8 + 53.5 - 127 + 37 + 2 - 1 - 53 None ALVA16W-148 74.8 + 55.0 127 + 35 3 1 - 38 C, Het-B ALPioneer 26R59 74.7 + 54.1 125 - 33 - 2 - 1 - 55 BDL, Het-O ALMBX 17-M-245 74.5 53.4 - 125 - 34 2 1 56 BCDOL ALWX17775 74.4 53.2 - 126 34 3 3 + 41 BCDOL AMAS #316 74.1 54.5 128 + 35 5 3 + 54 BCDOL ACROPLAN SRW 9415 74.0 54.8 128 + 35 2 - 4 + 68 BCDOL AMAS #116 74.0 54.3 127 + 36 + 3 1 55 BCDOL AArmor ARW1719 74.0 53.2 - 127 35 4 3 + 35 N/A APioneer 26R10 73.7 54.5 127 + 35 2 3 + 40 BCDOL AUSG 3228 73.5 52.8 - 126 33 5 4 + 11 - None TAUSG 3536 73.4 53.7 - 127 37 + 4 1 49 BDOL A#Warrior 73.3 53.5 - 125 - 34 2 - 2 65 BCDOL ALUSG 3458 73.3 53.5 - 125 - 35 3 2 70 + BCDOL ALAgriMAXX 480 73.2 56.1 + 122 - 35 6 + 1 - 44 N/A AVA09MAS2-131-6-2 73.2 54.7 124 - 30 - 2 - 1 - 49 C AL
(1)(5) (6) (2) (3) (3) (4)(0-9)
IndexMildew(0-100)(Bu/a) (Lb/bu) (Julian) (In) (0-9)
Yield Weight Headed Height Lodging
Table 27. Summary of performance of entries in the Virginia Tech Wheat Test over location, 2018 harvest.
PowderyGrain Test Date Mature Plant FHB
52

HessianFly
Line Res.2 Awns3
(1)(1)(5) (6) (2) (3) (3) (4)(0-9)
IndexMildew(0-100)(Bu/a) (Lb/bu) (Julian) (In) (0-9)
Yield Weight Headed Height Lodging
Table 27. Summary of performance of entries in the Virginia Tech Wheat Test over location, 2018 harvest.
PowderyGrain Test Date Mature Plant FHB
CROPLAN SRW 9606 73.1 53.5 - 125 - 35 2 3 + 52 BCDOL AShirley 72.9 53.9 - 127 + 34 2 - 0 - 59 C ALAgriMAXX Exp 1874 72.8 53.4 - 124 - 35 2 1 52 CO ASY 547 72.8 54.6 126 36 + 3 1 - 36 None TAAgriMAXX 473 72.8 53.7 - 127 + 35 4 1 - 40 BDOL AMBX 17-P-275 72.7 52.6 - 126 32 - 4 3 + 12 - None TAVA16W-124 72.7 55.0 125 - 35 5 1 55 BCDOL AAgriMAXX 474 72.6 53.0 - 124 - 34 2 - 2 64 BCDOL TAPioneer 26R41 72.5 53.9 - 127 + 33 - 2 2 43 BCDOL ALuisa 72.5 56.7 + 125 - 36 + 4 1 - 39 None A#Blaze 72.5 53.7 - 126 35 6 + 2 30 O AL11550 72.2 53.8 - 127 + 34 5 2 40 None AArmor ARW1716 72.2 56.9 + 125 - 32 - 3 1 23 N/A AAgriMAXX 463 72.1 52.7 - 126 33 5 4 + 18 - None TACROPLAN 8550 72.0 53.6 - 127 36 + 3 1 44 BCDOL AVA12W-31 72.0 55.1 126 34 6 + 1 50 None A#Boss 71.9 51.9 - 125 - 33 3 2 40 None AVA09MAS2-131-6-2-4 71.8 54.4 125 - 31 - 3 1 - 45 None ALVA15W-91 71.8 54.5 127 34 4 1 - 52 None ACROPLAN 8415 71.7 54.6 126 36 6 + 1 69 + BCDOL ALL11551 71.6 55.5 + 127 33 4 1 18 - None AArmor Riptide 71.5 53.3 - 124 - 34 2 - 2 60 BCDOL ALDH11SRW066-153 71.5 56.6 + 128 + 36 + 3 1 - 39 BDOL ADH12SRW057-081 71.4 56.4 + 126 33 - 5 3 + 45 None TA13VTK82-51 71.4 55.0 128 + 33 4 2 42 None AAgriMAXX 444 71.3 54.0 128 + 35 3 3 + 27 None ADH13SRW025-14 71.3 54.8 123 - 32 - 4 1 - 29 O AVA16W-149 71.1 53.7 - 126 34 3 1 55 None ALMAS #7 71.1 54.5 127 + 36 + 3 2 44 Het-O TAVA15W-30 71.0 53.6 - 127 34 6 + 1 56 None AVA16W-105 71.0 52.5 - 127 + 34 5 1 33 BCDOL A#Bullet 71.0 53.7 - 127 + 36 + 5 1 47 BCDOL ADH13SRW023-201 71.0 59.5 + 127 + 34 3 0 - 35 None AMBX 18-A-237 70.9 56.1 + 122 - 35 5 1 - 50 N/A AArmor Mayhem 70.8 53.7 - 127 + 37 + 4 1 49 BCDOL AFeatherstone 73 70.8 55.8 + 128 + 34 6 + 3 + 49 C TAHilliard 70.8 54.2 126 36 3 1 - 28 BCD ADyna-Gro 9811 70.8 54.4 125 - 36 3 1 40 BCD AUSG 3404 70.8 53.7 - 128 + 34 2 2 38 BCDOL ADH13SRW021-70 70.7 54.6 125 - 33 - 4 1 30 None TA
53

HessianFly
Line Res.2 Awns3
(1)(1)(5) (6) (2) (3) (3) (4)(0-9)
IndexMildew(0-100)(Bu/a) (Lb/bu) (Julian) (In) (0-9)
Yield Weight Headed Height Lodging
Table 27. Summary of performance of entries in the Virginia Tech Wheat Test over location, 2018 harvest.
PowderyGrain Test Date Mature Plant FHB
TWS3418 70.7 54.1 128 + 34 5 3 + 47 N/A ALVA16W-104 70.7 54.0 126 34 3 1 - 73 + Het-O AVA16W-229 70.7 54.1 125 - 33 - 3 1 55 BCDOL AMAS #83 70.7 53.6 - 126 35 4 2 45 BCDOL ADH11SRW069-70 70.6 52.8 - 129 + 34 5 2 69 None ADH12SRW057-006 70.4 57.4 + 127 + 31 - 2 1 - 52 None AL12VTK10-156 70.4 53.9 - 127 + 34 6 + 2 47 BCDOL AVA16W-29 70.4 54.8 127 + 36 3 0 - 63 BCDL, Het-O ALSH 7200 70.1 55.7 + 125 - 36 4 2 62 BCDOL ADyna-Gro 9701 70.1 53.9 - 127 36 + 4 1 44 BCDOL ADyna-Gro 9750 70.0 52.8 - 126 34 6 + 3 + 35 None TAPioneer 26R45 69.7 54.5 126 34 4 2 43 BDOL ALVA15W-63 69.7 54.9 126 33 - 3 1 47 BCDOL ALMAS #61 69.6 53.7 - 124 - 33 - 5 3 + 37 None ATWS2818 69.3 54.5 127 + 35 3 3 + 47 N/A TADyna-Gro 9600 69.3 52.0 - 125 - 35 3 2 41 None AVA15W-131 69.2 55.2 + 127 34 3 1 79 + None ALVA09MAS1-12-5-1-1 69.2 57.1 + 127 + 35 4 3 + 59 None A15MDX20 69.2 54.0 127 34 4 1 33 D? A13VTK128-75 69.1 54.1 127 31 - 4 2 77 + BCD ALMAS #65 69.1 53.6 - 125 - 34 2 2 55 BCDOL AL13VTK434-89 69.0 56.1 + 126 36 + 4 1 - 21 - CD ASH 7510 69.0 53.7 - 127 + 35 4 2 44 B A13VA-FHB-DH252 68.9 56.3 + 129 + 36 + 5 1 43 None A12VTK15-148 68.9 54.0 127 34 2 - 0 - 50 None LALUSG 3429 68.8 55.1 127 + 33 - 5 5 + 46 BC, Het-D TAMAS #84 68.8 54.2 125 - 33 6 + 4 + 52 None ALDH13SRW021-80 68.7 54.9 126 33 - 6 + 0 - 51 None ADyna-Gro 9522 68.7 53.8 - 127 + 35 4 3 + 39 None ASY Miskin 68.7 55.2 + 125 - 35 4 4 + 44 N/A AAgriMAXX 485 68.6 54.1 127 + 34 4 3 + 31 BCDOL TA#Turbo 68.5 54.3 124 - 33 4 1 37 D? TAVA15W-67 68.5 55.5 + 127 + 35 2 - 1 - 48 BCDOL ALVA16W-196 68.2 54.1 129 + 34 4 1 44 Het-B TA13VA-FHB-DH131 68.1 56.2 + 125 - 34 6 + 2 45 CD AVA16W-152 68.0 53.3 - 126 34 5 1 - 44 None ALGA08535-15LE29 67.8 56.3 + 126 36 + 4 3 + 61 None APioneer 26R36 67.7 54.5 127 + 34 5 6 + 38 BCDOL AVA09MAS1-12-5-1-3 67.7 56.0 + 127 + 35 6 + 1 63 None ALCS Ammo 67.6 53.9 127 + 33 - 4 1 28 BCD A
54

HessianFly
Line Res.2 Awns3
(1)(1)(5) (6) (2) (3) (3) (4)(0-9)
IndexMildew(0-100)(Bu/a) (Lb/bu) (Julian) (In) (0-9)
Yield Weight Headed Height Lodging
Table 27. Summary of performance of entries in the Virginia Tech Wheat Test over location, 2018 harvest.
PowderyGrain Test Date Mature Plant FHB
Armor Nemesis 67.5 55.5 + 127 + 33 5 4 + 56 BCD TAVA15W-130 67.5 54.8 126 34 4 1 - 54 None ALVA15W-68 67.5 55.6 + 126 34 3 1 - 51 BCDOL ALVA16W-28 67.0 - 55.9 + 128 + 33 2 - 1 - 45 None ALUSG 3118 67.0 - 55.0 124 - 32 - 4 0 - 55 BCDOL LALVA09MAS6-122-7-1 66.8 - 54.9 125 - 31 - 3 1 - 39 None ATWS2616 66.5 - 53.6 - 124 - 35 5 + 3 + 38 BCDL, Het-O ASH 4400 66.4 - 53.8 - 127 + 36 4 5 + 56 BDOL TA15MDX18 66.4 - 55.3 + 127 + 32 - 3 2 51 D? ADyna-Gro 9862 65.8 - 54.7 127 + 34 3 3 + 46 BCDL, Het-O TANC13-21213 65.3 - 55.4 + 126 34 5 1 58 BCDL, Het-O TAVA15W-70 64.9 - 55.1 126 33 - 2 0 - 49 Het-BCDL ALMAS #85 64.2 - 54.6 127 + 36 4 5 + 48 None TAVA13W-174 63.8 - 53.5 - 125 - 36 3 1 - 44 C AVA15W-92 63.6 - 52.9 - 125 - 33 - 5 1 - 69 + None AVA16W-31 63.4 - 55.6 + 126 33 - 1 - 1 54 None TAGA061471-15LE38 63.2 - 56.0 + 127 + 36 + 5 2 70 + C ANC14-23372 63.1 - 57.3 + 128 + 35 4 0 - 42 BCDOL A15MDX5 61.1 - 56.6 + 124 - 33 7 + 1 - 26 None AArmor ARW1762 61.1 - 54.5 127 36 + 2 - 3 + 30 N/A ALNC13-20076 60.8 - 56.8 + 126 35 6 + 1 22 - BCDL, Het-O AMassey 56.6 - 55.2 + 127 37 + 6 + 1 36 None ALAverage 70.9 54.5 126 34 4 2 45LSD (O.05) 3.6 0.6 1 1 2 1 23C.V. 8.3 1.9 1 5 54 43 37Released cultivars are shown in bold print.Varieties are ordered by descending yield averages.A plus or minus sign indicates a performance significantly above or below the test average.The 0-9 ratings indicate a genotype's response to disease or lodging where 0 = highly resistant and 9 = highly susceptible.The number in parentheses below column headings indicates the number of locations on which data are based.1 BYD = Barley Yellow Dwarf Virus.
either had been treated with insecticide or was otherwise unavailable for screening.3 A=awned, AL=awnletted, LAL=long awnletted, TA=tip awned.
2 Seedlings were screened for resistance to biotypes B, C, D, O, and L of Hessian Fly. Letter in column indicates
55

Line
MBX 17-M-245 78.1 + 53.7 - 118 - 33 2 - 1 - 5 + 1 0 38 9USG 3458 77.4 + 53.4 - 118 - 34 2 2 5 + 2 0 45 + 9CROPLAN 8550 76.4 + 54.6 120 + 36 + 2 1 - 1 - 1 0 25 10MAS #116 76.3 + 55.1 120 + 36 + 2 1 - 2 - 1 0 30 10AgriMAXX 473 75.9 + 54.7 120 + 35 + 3 1 - 2 - 1 1 22 10AgriMAXX 415 75.8 + 56.2 + 119 34 2 3 + 3 1 0 23 9Pioneer 26R45 75.4 + 54.6 119 34 3 2 2 2 0 25 8 -Pioneer 26R59 75.4 + 54.6 119 - 32 - 1 - 1 - 4 + 2 + 0 38 9MBX 14-S-210 75.2 + 55.0 121 + 36 + 2 3 + 1 - 1 1 19 9USG 3895 75.2 + 54.2 119 33 2 - 4 + 2 - 1 - 0 36 9USG 3536 75.1 + 54.7 120 + 37 + 3 1 - 1 - 1 0 28 9#Warrior 75.0 + 53.9 - 118 - 33 1 - 2 5 + 1 0 44 + 9#Bullet 74.9 + 54.6 120 + 36 + 3 1 - 1 - 1 0 26 9Armor Mayhem 74.8 + 54.7 120 + 36 + 3 1 - 2 1 0 28 10CROPLAN SRW 9606 74.6 54.3 119 - 34 2 2 3 1 0 35 9CROPLAN SRW 9415 74.6 55.0 121 + 35 1 - 4 + 4 + 1 0 40 9AgriMAXX 474 74.6 53.8 - 118 - 33 2 - 1 - 5 + 1 0 42 9VA15W-63 74.2 55.5 + 119 33 - 2 - 1 - 1 - 1 - 2 + 34 9Dyna-Gro 9701 74.2 54.7 120 36 + 2 1 - 1 - 2 0 25 10AgriMAXX 446 73.9 55.1 121 + 34 1 - 3 + 5 + 1 0 38 9Pioneer 26R41 73.5 54.5 120 + 32 - 2 - 2 - 2 1 0 37 10CROPLAN 8415 73.5 55.0 119 34 4 + 1 - 3 2 0 50 + 11PGX 16-7 73.5 54.6 118 - 33 2 1 - 2 1 0 32 11USG 3404 73.3 54.4 121 + 34 2 - 2 3 1 0 24 10VA09MAS2-131-6-2 73.1 54.7 116 - 28 - 1 - 1 - 1 - 1 0 35 10AgriMAXX 463 73.1 53.3 - 119 - 32 - 3 4 + 3 1 0 11 - 9SH 7510 73.0 55.2 + 120 + 34 3 + 2 1 - 1 0 32 10VA09MAS2-131-6-2-4 73.0 54.5 118 - 30 - 2 1 - 1 - 1 0 25 10
(3)
StripeRust(0-9)
EarlyHeight
(In)
FHBIndex
(0-100)(2)(11) (12) (4) (6) (8) (7) (3) (3) (2)
Rust Virus1
(0-9) (0-9) (0-9)Mildew
(Bu/a) (Lb/bu) (Julian) (In) (0-9)Yield Weight Headed Height Lodging
Table 28. Two-year average summary of performance of entries in the Virginia Tech Wheat Tests, 2017 and 2018 harvests.
Grain Test Date Mature Plant Powdery Leaf BYD
56

Line(3)
StripeRust(0-9)
EarlyHeight
(In)
FHBIndex
(0-100)(2)(11) (12) (4) (6) (8) (7) (3) (3) (2)
Rust Virus1
(0-9) (0-9) (0-9)Mildew
(Bu/a) (Lb/bu) (Julian) (In) (0-9)Yield Weight Headed Height Lodging
Table 28. Two-year average summary of performance of entries in the Virginia Tech Wheat Tests, 2017 and 2018 harvests.
Grain Test Date Mature Plant Powdery Leaf BYD
Shirley 73.0 54.1 - 120 32 - 2 0 - 1 - 1 5 + 45 + 11AgriMAXX 444 73.0 54.5 121 + 34 2 3 4 + 1 - 0 19 10VA12W-68 72.9 54.6 118 - 33 - 3 2 1 - 1 0 23 13 +Pioneer 26R10 72.8 54.5 121 + 34 2 3 + 5 + 2 0 29 10VA12W-31 72.7 55.4 + 119 33 4 + 1 - 1 - 1 1 40 9Hilliard 72.2 55.0 119 35 2 1 - 2 1 0 23 11#Blaze 72.1 54.2 119 34 4 + 2 5 + 2 + 0 19 8 -MAS #316 72.0 54.9 121 + 35 + 3 3 + 4 + 2 0 30 8 -L11550 71.9 55.3 + 121 + 34 3 2 1 - 1 0 36 9SY Viper 71.8 56.3 + 118 - 35 + 4 + 2 - 5 + 2 0 39 11MAS #7 71.7 55.2 + 121 + 35 + 2 1 - 5 + 2 0 28 8 -Dyna-Gro 9811 71.6 55.0 119 - 34 2 1 - 2 - 2 0 32 12 +USG 3316 71.6 54.0 - 120 + 35 + 2 - 6 + 7 + 1 3 + 17 - 9MAS #61 71.6 54.1 - 117 - 33 4 + 3 + 2 1 1 22 9Armor Nemesis 71.5 56.2 + 121 + 33 3 + 4 + 0 - 1 1 35 10DH11SRW069-70 71.5 53.9 - 122 + 34 3 2 2 1 0 46 + 10DH12SRW057-006 71.4 57.9 + 121 + 31 - 2 1 - 1 - 1 0 35 9MBX 17-P-275 71.4 53.2 - 119 - 32 - 3 4 + 3 + 1 0 7 - 11USG 3228 71.4 53.4 - 119 - 33 3 4 + 2 1 0 7 - 11Dyna-Gro 9750 71.3 53.4 - 119 33 3 4 + 3 1 0 20 10VA09MAS1-12-5-1-1 71.2 57.6 + 120 + 34 4 + 3 + 1 - 1 0 41 11USG 3197 71.2 52.7 - 119 - 35 + 3 3 + 1 - 1 1 11 - 10VA09MAS1-12-5-1-3 70.6 56.9 + 121 + 35 + 4 + 1 - 0 - 1 0 43 + 11Armor Riptide 70.4 53.9 - 118 - 33 1 - 2 - 4 + 3 + 0 43 + 9Dyna-Gro 9522 70.2 54.3 121 + 35 2 3 + 4 + 1 0 25 9DH12SRW056-058 70.2 55.8 + 119 35 + 2 3 1 - 2 0 27 12 +Dyna-Gro 9772 70.2 52.6 - 119 - 35 + 3 3 + 2 2 0 13 - 10Dyna-Gro 9600 69.8 52.5 - 118 - 34 2 1 - 1 - 2 + 3 + 23 10
57
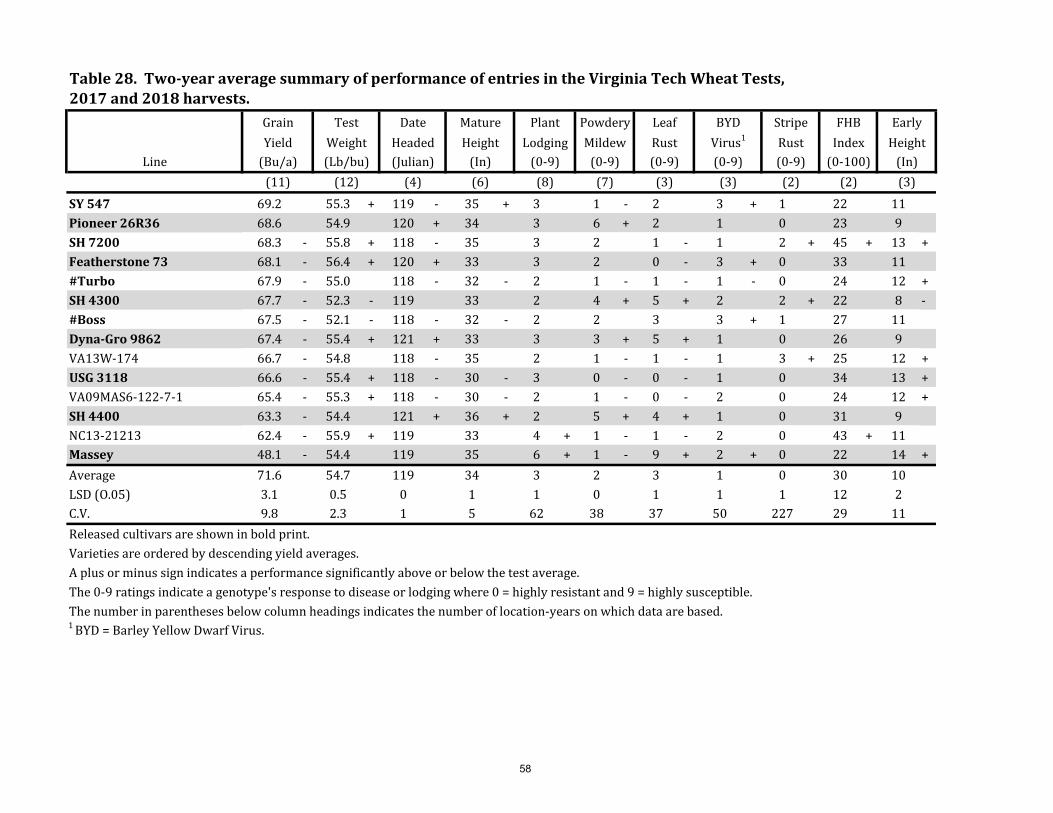
Line(3)
StripeRust(0-9)
EarlyHeight
(In)
FHBIndex
(0-100)(2)(11) (12) (4) (6) (8) (7) (3) (3) (2)
Rust Virus1
(0-9) (0-9) (0-9)Mildew
(Bu/a) (Lb/bu) (Julian) (In) (0-9)Yield Weight Headed Height Lodging
Table 28. Two-year average summary of performance of entries in the Virginia Tech Wheat Tests, 2017 and 2018 harvests.
Grain Test Date Mature Plant Powdery Leaf BYD
SY 547 69.2 55.3 + 119 - 35 + 3 1 - 2 3 + 1 22 11Pioneer 26R36 68.6 54.9 120 + 34 3 6 + 2 1 0 23 9SH 7200 68.3 - 55.8 + 118 - 35 3 2 1 - 1 2 + 45 + 13 +Featherstone 73 68.1 - 56.4 + 120 + 33 3 2 0 - 3 + 0 33 11#Turbo 67.9 - 55.0 118 - 32 - 2 1 - 1 - 1 - 0 24 12 +SH 4300 67.7 - 52.3 - 119 33 2 4 + 5 + 2 2 + 22 8 -#Boss 67.5 - 52.1 - 118 - 32 - 2 2 3 3 + 1 27 11Dyna-Gro 9862 67.4 - 55.4 + 121 + 33 3 3 + 5 + 1 0 26 9VA13W-174 66.7 - 54.8 118 - 35 2 1 - 1 - 1 3 + 25 12 +USG 3118 66.6 - 55.4 + 118 - 30 - 3 0 - 0 - 1 0 34 13 +VA09MAS6-122-7-1 65.4 - 55.3 + 118 - 30 - 2 1 - 0 - 2 0 24 12 +SH 4400 63.3 - 54.4 121 + 36 + 2 5 + 4 + 1 0 31 9NC13-21213 62.4 - 55.9 + 119 33 4 + 1 - 1 - 2 0 43 + 11Massey 48.1 - 54.4 119 35 6 + 1 - 9 + 2 + 0 22 14 +Average 71.6 54.7 119 34 3 2 3 1 0 30 10LSD (O.05) 3.1 0.5 0 1 1 0 1 1 1 12 2C.V. 9.8 2.3 1 5 62 38 37 50 227 29 11Released cultivars are shown in bold print.Varieties are ordered by descending yield averages.A plus or minus sign indicates a performance significantly above or below the test average.The 0-9 ratings indicate a genotype's response to disease or lodging where 0 = highly resistant and 9 = highly susceptible.The number in parentheses below column headings indicates the number of location-years on which data are based.1 BYD = Barley Yellow Dwarf Virus.
58
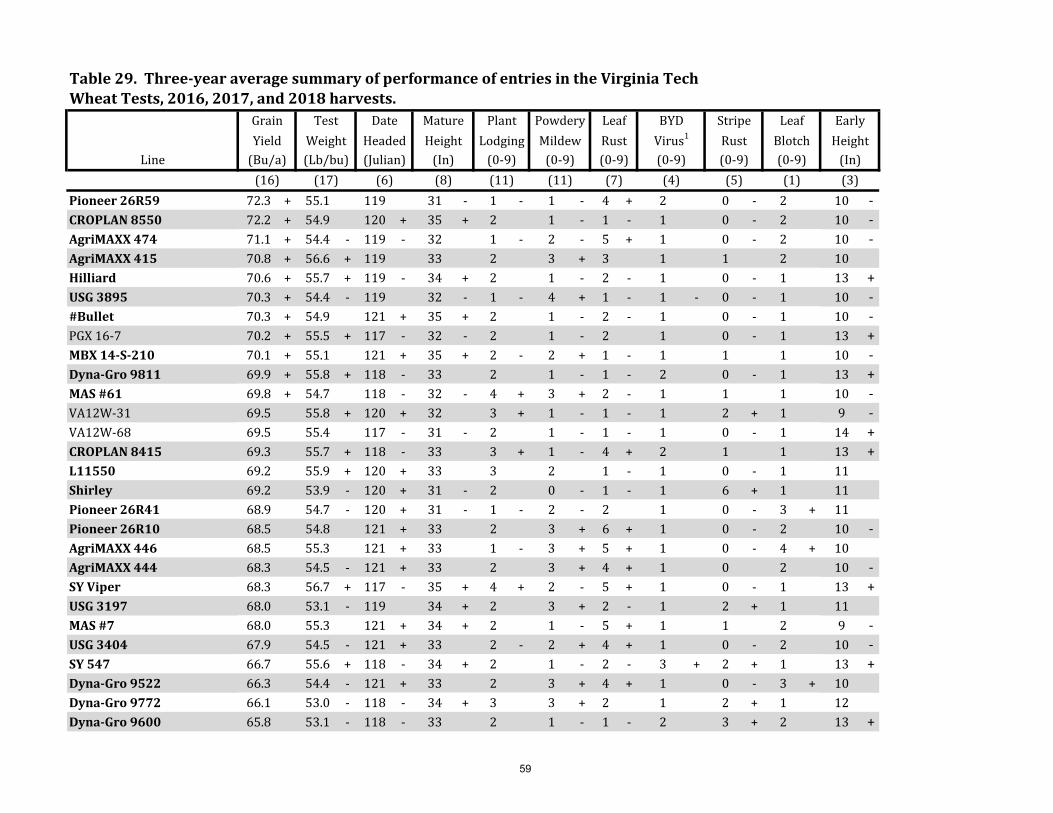
Line
Pioneer 26R59 72.3 + 55.1 119 31 - 1 - 1 - 4 + 2 0 - 2 10 -CROPLAN 8550 72.2 + 54.9 120 + 35 + 2 1 - 1 - 1 0 - 2 10 -AgriMAXX 474 71.1 + 54.4 - 119 - 32 1 - 2 - 5 + 1 0 - 2 10 -AgriMAXX 415 70.8 + 56.6 + 119 33 2 3 + 3 1 1 2 10Hilliard 70.6 + 55.7 + 119 - 34 + 2 1 - 2 - 1 0 - 1 13 +USG 3895 70.3 + 54.4 - 119 32 - 1 - 4 + 1 - 1 - 0 - 1 10 -#Bullet 70.3 + 54.9 121 + 35 + 2 1 - 2 - 1 0 - 1 10 -PGX 16-7 70.2 + 55.5 + 117 - 32 - 2 1 - 2 1 0 - 1 13 +MBX 14-S-210 70.1 + 55.1 121 + 35 + 2 - 2 + 1 - 1 1 1 10 -Dyna-Gro 9811 69.9 + 55.8 + 118 - 33 2 1 - 1 - 2 0 - 1 13 +MAS #61 69.8 + 54.7 118 - 32 - 4 + 3 + 2 - 1 1 1 10 -VA12W-31 69.5 55.8 + 120 + 32 3 + 1 - 1 - 1 2 + 1 9 -VA12W-68 69.5 55.4 117 - 31 - 2 1 - 1 - 1 0 - 1 14 +CROPLAN 8415 69.3 55.7 + 118 - 33 3 + 1 - 4 + 2 1 1 13 +L11550 69.2 55.9 + 120 + 33 3 2 1 - 1 0 - 1 11Shirley 69.2 53.9 - 120 + 31 - 2 0 - 1 - 1 6 + 1 11Pioneer 26R41 68.9 54.7 - 120 + 31 - 1 - 2 - 2 1 0 - 3 + 11Pioneer 26R10 68.5 54.8 121 + 33 2 3 + 6 + 1 0 - 2 10 -AgriMAXX 446 68.5 55.3 121 + 33 1 - 3 + 5 + 1 0 - 4 + 10AgriMAXX 444 68.3 54.5 - 121 + 33 2 3 + 4 + 1 0 2 10 -SY Viper 68.3 56.7 + 117 - 35 + 4 + 2 - 5 + 1 0 - 1 13 +USG 3197 68.0 53.1 - 119 34 + 2 3 + 2 - 1 2 + 1 11MAS #7 68.0 55.3 121 + 34 + 2 1 - 5 + 1 1 2 9 -USG 3404 67.9 54.5 - 121 + 33 2 - 2 + 4 + 1 0 - 2 10 -SY 547 66.7 55.6 + 118 - 34 + 2 1 - 2 - 3 + 2 + 1 13 +Dyna-Gro 9522 66.3 54.4 - 121 + 33 2 3 + 4 + 1 0 - 3 + 10Dyna-Gro 9772 66.1 53.0 - 118 - 34 + 3 3 + 2 1 2 + 1 12Dyna-Gro 9600 65.8 53.1 - 118 - 33 2 1 - 1 - 2 3 + 2 13 +
(16)
Table 29. Three-year average summary of performance of entries in the Virginia Tech Wheat Tests, 2016, 2017, and 2018 harvests.
BYDYield
Test Date Mature Plant Powdery Leaf
(0-9)(17) (6) (8) (11)
Grain
(Lb/bu) (Julian) (In) (0-9)(Bu/a)
StripeRust(0-9)
(5)
Weight Headed Height Lodging(0-9)(11) (7) (4)
Mildew Rust Virus1
(0-9)
EarlyHeight
(In)(3)
LeafBlotch(0-9)
(1)
59

Line(16)
Table 29. Three-year average summary of performance of entries in the Virginia Tech Wheat Tests, 2016, 2017, and 2018 harvests.
BYDYield
Test Date Mature Plant Powdery Leaf
(0-9)(17) (6) (8) (11)
Grain
(Lb/bu) (Julian) (In) (0-9)(Bu/a)
StripeRust(0-9)
(5)
Weight Headed Height Lodging(0-9)(11) (7) (4)
Mildew Rust Virus1
(0-9)
EarlyHeight
(In)(3)
LeafBlotch(0-9)
(1)Featherstone 73 65.6 57.0 + 119 32 3 2 0 - 2 + 0 - 1 13 +USG 3118 64.8 56.2 + 116 - 30 - 3 + 0 - 0 - 1 1 1 14 +VA09MAS6-122-7-1 64.5 - 56.1 + 118 - 29 - 2 1 - 1 - 1 0 - 1 12USG 3316 64.4 - 54.0 - 120 + 34 + 2 - 6 + 7 + 1 4 + 3 + 10 -SH 7200 64.4 - 56.5 + 117 - 33 3 + 2 1 - 1 3 + 1 15 +VA13W-174 64.2 - 55.7 + 116 - 33 2 1 - 1 - 1 2 + 1 14 +SH 4300 64.0 - 52.5 - 119 32 2 4 + 5 + 2 + 4 + 2 9 -Pioneer 26R36 63.3 - 55.2 120 + 33 3 6 + 2 1 0 - 3 + 9 -SH 4400 58.8 - 54.5 - 121 + 35 + 2 4 + 4 + 1 0 - 2 9 -Massey 47.5 - 55.3 118 - 34 + 5 + 1 - 8 + 2 + 2 1 17 +Average 67.3 55.1 119 33 2 2 3 1 1 2 11LSD (O.05) 2.5 0.4 0 1 1 0 1 1 1 1 1C.V. 10.0 1.9 1 5 64 40 41 54 93 32 10Released cultivars are shown in bold print.Varieties are ordered by descending yield averages.A plus or minus sign indicates a performance significantly above or below the test average.The 0-9 ratings indicate a genotype's response to disease or lodging where 0 = highly resistant and 9 = highly susceptible.The number in parentheses below column headings indicates the number of location-years on which data are based.1 BYD = Barley Yellow Dwarf Virus.
60

LineL11719 --- --- 87.1 + 57.2 122 33 3 0USG 3329 --- --- 84.5 + 57.1 121 36 + 4 0AgriMAXX 446 76.3 87.0 + 83.5 + 57.4 122 + 34 2 3 +13VTK59-148 --- --- 83.0 + 58.4 + 121 35 6 + 1VA16W-202 --- --- 82.3 + 54.8 - 121 31 - 4 0USG 3895 81.0 + 87.9 + 81.3 + 56.2 120 32 - 2 3 +CROPLAN SRW 9415 --- 85.4 81.0 + 56.8 123 + 34 2 4 +PGX 17-16 --- --- 80.9 + 58.3 + 122 + 36 + 3 0Shirley 73.8 80.0 80.2 + 55.9 122 + 33 3 0AgriMAXX Exp 1892 --- --- 79.7 + 59.1 + 120 - 31 - 3 1AgriMAXX 486 --- --- 78.8 + 57.2 124 + 35 3 2Pioneer 26R10 74.0 85.1 78.6 + 57.3 122 35 2 2Armor ARW1719 --- --- 78.5 + 55.4 - 122 + 34 3 1Dyna-Gro 9772 74.1 83.8 78.3 + 54.6 - 121 35 + 3 2AgriMAXX 415 78.4 + 86.6 + 78.0 + 57.8 + 120 - 35 + 3 2USG 3197 76.2 82.6 78.0 + 54.7 - 120 - 35 2 2USG 3228 --- 86.3 77.9 + 54.4 - 121 33 4 3 +MAS #316 --- 86.4 77.9 + 57.4 123 + 36 + 4 3 +USG 3316 64.0 - 75.2 - 77.6 + 56.8 122 35 2 5 +VA16W-224 --- --- 77.6 + 55.8 - 123 + 36 + 2 0DH11SRW066-153 --- --- 77.5 + 58.9 + 124 + 35 3 1VA15W-67 --- --- 77.5 + 56.9 122 + 33 2 0MBX 14-S-210 78.0 87.1 + 77.3 + 56.6 122 + 34 2 3 +Armor ARW1766 --- --- 77.3 + 55.7 - 120 - 36 + 3 0VA12W-68 79.6 + 83.9 77.3 + 56.7 120 - 34 3 0MBX 17-M-245 --- 87.0 + 77.2 + 56.0 120 34 2 1MAS #86 --- --- 77.1 56.1 121 36 + 3 1VA16W-29 --- --- 76.9 56.7 123 + 34 2 0WX17775 --- --- 76.9 55.3 - 122 34 3 1Dyna-Gro 9600 73.7 82.9 76.7 54.9 - 119 - 34 4 0Armor ARW1716 --- --- 76.2 59.2 + 120 31 - 3 0MAS #87 --- --- 76.1 55.4 - 122 + 33 2 1CROPLAN SRW 9606 --- 88.0 + 75.9 55.8 - 120 34 3 2Pioneer 26R41 77.8 85.8 75.9 56.5 121 32 3 2#Blaze --- 83.0 75.9 57.0 121 35 + 4 1PGX 17-20 --- --- 75.7 57.6 + 121 35 3 3 +12VTK15-148 --- --- 75.7 56.1 122 + 32 - 2 0USG 3458 --- 87.1 + 75.5 56.2 120 - 34 3 1Pioneer 26R59 80.4 + 87.6 + 75.5 56.0 121 32 - 2 - 0CROPLAN 8415 77.9 82.8 75.4 56.5 120 35 + 4 1MBX 17-P-275 --- 83.6 75.3 54.7 - 121 33 3 3 +
(In) (0-9)
Powdery
(0-9)(Bu/a) (Bu/a) (Bu/a) (Lb/bu) (Julian)
Table 30. Summary of performance of entries in the Virginia Tech Wheat Test, Eastern VAAREC in Warsaw, VA, 2018 harvest.
PlantAv. Yield Av. Yield Yield Weight Headed Height Lodging Mildew
3-year 2-year Grain Test Date
61

Line (In) (0-9)
Powdery
(0-9)(Bu/a) (Bu/a) (Bu/a) (Lb/bu) (Julian)
Table 30. Summary of performance of entries in the Virginia Tech Wheat Test, Eastern VA AREC in Warsaw, VA, 2018 harvest.
PlantAv. Yield Av. Yield Yield Weight Headed Height Lodging Mildew
3-year 2-year Grain Test Date
SH 4300 69.4 - 74.9 - 75.3 55.0 - 120 34 3 4 +Pioneer 26R45 --- 87.5 + 75.3 56.9 121 34 3 2AgriMAXX 463 --- 84.3 75.3 54.0 - 121 32 4 4 +VA09MAS2-131-6-2-4 --- 86.0 75.3 56.1 119 - 29 - 2 0VA15W-91 --- --- 75.2 55.7 - 121 33 3 0#Boss --- 79.7 75.1 54.5 - 120 - 32 2 1DH12SRW057-006 --- 82.8 75.1 59.8 + 123 + 30 - 3 0Featherstone 73 76.4 83.9 75.1 57.7 + 122 + 33 5 + 2VA16W-149 --- --- 74.9 57.2 121 33 2 0#Turbo --- 81.4 74.7 56.0 119 - 33 2 - 1DH12SRW056-058 --- 81.3 74.6 57.1 120 35 + 3 213VTK429-3 --- --- 74.6 58.9 + 122 34 3 0#Warrior --- 83.3 74.3 55.7 - 120 - 33 2 1PGX 16-7 80.1 + 85.4 74.3 56.7 119 - 33 2 1DH12SRW057-081 --- --- 73.8 58.1 + 121 31 - 3 3 +VA16W-31 --- --- 73.5 57.9 + 121 30 - 1 - 0VA16W-196 --- --- 73.4 57.2 125 + 32 2 0Armor Riptide --- 84.9 73.3 55.4 - 120 - 33 2 113VA-FHB-DH252 --- --- 73.2 59.4 + 123 + 36 + 4 0VA09MAS2-131-6-2 --- 80.4 73.2 56.7 119 - 27 - 1 - 0VA15W-68 --- --- 73.1 58.0 + 121 33 3 0L11551 --- --- 72.9 57.8 + 121 33 3 1AgriMAXX 473 --- 89.4 + 72.8 55.9 122 36 + 3 0VA15W-30 --- --- 72.6 55.0 - 121 34 5 + 1AgriMAXX 474 77.8 84.8 72.5 55.6 - 120 - 32 2 - 1SY Viper 78.9 + 84.1 72.5 58.0 + 120 - 36 + 5 + 0VA16W-229 --- --- 72.3 55.9 121 31 - 3 1Armor Mayhem --- 88.6 + 72.3 56.2 122 + 36 + 4 1AgriMAXX Exp 1874 --- --- 72.2 55.2 - 120 - 34 1 - 1DH11SRW069-70 --- 82.2 72.1 56.0 124 + 33 4 1Luisa --- --- 72.0 57.9 + 119 - 36 + 4 1Dyna-Gro 9522 74.0 82.0 71.9 56.5 123 + 33 2 3 +Dyna-Gro 9750 --- 81.1 71.8 54.3 - 121 33 4 2TWS3418 --- --- 71.7 56.7 123 + 34 3 2VA15W-63 --- 80.6 71.6 56.2 121 31 - 3 0AgriMAXX 444 73.1 79.8 71.6 56.3 123 + 34 3 2AgriMAXX 480 --- --- 71.6 57.2 117 - 35 4 1LCS Ammo --- --- 71.4 55.9 121 32 - 3 1CROPLAN 8550 83.8 + 89.0 + 71.2 56.1 122 36 + 2 1SY 547 72.1 79.0 71.1 56.1 121 36 + 3 0VA12W-31 75.0 79.6 71.0 56.9 122 32 4 0
62

Line (In) (0-9)
Powdery
(0-9)(Bu/a) (Bu/a) (Bu/a) (Lb/bu) (Julian)
Table 30. Summary of performance of entries in the Virginia Tech Wheat Test, Eastern VAAREC in Warsaw, VA, 2018 harvest.
PlantAv. Yield Av. Yield Yield Weight Headed Height Lodging Mildew
3-year 2-year Grain Test Date
Dyna-Gro 9701 --- 88.3 + 71.0 55.8 - 122 36 + 2 0USG 3536 --- 85.7 70.6 56.3 122 36 + 3 0TWS2818 --- --- 70.4 56.3 123 + 33 2 2DH13SRW023-201 --- --- 70.4 61.7 + 121 32 3 0Hilliard 77.5 79.2 70.4 57.3 120 36 + 3 0VA16W-105 --- --- 70.3 54.7 - 122 33 1 - 0MAS #116 --- 87.9 + 70.3 56.1 122 36 + 4 1DH13SRW021-80 --- --- 70.0 57.1 121 33 5 + 0MAS #83 --- --- 69.8 56.3 120 36 + 4 2SY Miskin --- --- 69.6 57.1 120 - 35 4 4 +MAS #65 --- --- 69.6 55.6 - 120 - 32 2 - 0VA16W-148 --- --- 69.4 57.7 + 123 + 35 2 1Dyna-Gro 9862 --- 81.6 69.3 56.8 122 + 33 2 - 2AgriMAXX 485 --- --- 69.2 56.4 122 + 33 2 2Dyna-Gro 9811 77.9 80.9 69.2 56.7 119 - 36 + 1 - 0#Bullet 78.6 + 86.2 68.9 56.1 122 37 + 3 1Armor Nemesis --- 78.0 68.9 58.5 + 122 32 4 3 +VA16W-104 --- --- 68.9 55.5 - 121 33 3 0GA08535-15LE29 --- --- 68.9 58.6 + 120 35 + 4 2VA16W-152 --- --- 68.8 54.3 - 121 33 4 0VA15W-130 --- --- 68.7 56.6 121 34 2 013VA-FHB-DH131 --- --- 68.7 58.4 + 121 34 4 213VTK128-75 --- --- 68.7 57.0 122 29 - 1 - 1USG 3429 --- --- 68.5 58.3 + 122 32 - 4 4 +MBX 18-A-237 --- --- 68.2 57.2 117 - 36 + 4 0VA16W-124 --- --- 68.2 57.0 120 - 35 5 + 013VTK434-89 --- --- 68.0 58.7 + 120 - 37 + 3 0USG 3404 71.9 79.9 67.7 56.6 123 + 33 3 2VA15W-131 --- --- 67.6 57.5 + 121 34 2 - 0MAS #7 77.0 80.6 67.5 56.0 123 + 35 3 1MAS #84 --- --- 67.3 56.1 120 - 32 6 + 4 +Pioneer 26R36 68.3 - 78.1 67.3 57.4 122 + 34 3 6 +L11550 76.4 77.9 67.0 55.8 - 123 + 34 4 115MDX20 --- --- 66.7 55.4 - 121 32 - 3 1SH 7200 70.8 74.9 - 66.6 57.3 120 - 35 6 + 115MDX18 --- --- 65.8 - 57.6 + 122 31 - 2 - 3 +12VTK10-156 --- --- 65.7 - 54.3 - 122 33 5 + 1TWS2616 --- --- 65.7 - 55.0 - 120 - 33 5 + 3 +USG 3118 73.3 74.6 - 65.6 - 57.7 + 119 - 31 - 3 0MAS #85 --- --- 65.5 - 57.5 + 123 + 34 3 4 +DH13SRW021-70 --- --- 65.5 - 55.6 - 121 31 - 3 0
63

Line (In) (0-9)
Powdery
(0-9)(Bu/a) (Bu/a) (Bu/a) (Lb/bu) (Julian)
Table 30. Summary of performance of entries in the Virginia Tech Wheat Test, Eastern VA AREC in Warsaw, VA, 2018 harvest.
PlantAv. Yield Av. Yield Yield Weight Headed Height Lodging Mildew
3-year 2-year Grain Test Date
VA16W-28 --- --- 65.3 - 57.2 123 + 33 2 0VA15W-70 --- --- 65.2 - 57.0 121 31 - 2 0SH 7510 --- 79.1 65.1 - 55.8 - 123 + 34 3 0VA09MAS6-122-7-1 75.0 76.9 - 65.0 - 56.3 120 28 - 3 0NC14-23372 --- --- 65.0 - 59.6 + 122 + 35 + 4 0MAS #61 75.0 77.2 64.8 - 54.7 - 120 32 6 + 1SH 4400 65.6 - 75.1 - 64.7 - 56.8 123 + 35 2 5 +DH13SRW025-14 --- --- 64.4 - 55.1 - 118 - 29 - 3 1NC13-21213 --- 71.8 - 62.2 - 56.7 120 - 34 2 113VTK82-51 --- --- 61.2 - 55.8 - 123 + 32 3 1VA15W-92 --- --- 61.2 - 54.1 - 120 - 32 - 3 1NC13-20076 --- --- 60.0 - 58.5 + 120 - 35 7 + 1VA09MAS1-12-5-1-1 --- 72.0 - 59.9 - 59.1 + 122 36 + 4 2Armor ARW1762 --- --- 59.8 - 58.0 + 122 37 + 2 - 215MDX5 --- --- 58.6 - 58.0 + 118 - 33 6 + 0VA09MAS1-12-5-1-3 --- 74.8 - 58.3 - 58.1 + 122 + 35 + 3 0Massey 51.7 - 51.2 - 55.7 - 57.9 + 121 37 + 6 + 1VA13W-174 67.8 - 68.1 - 54.4 - 53.7 - 118 - 34 1 - 0GA061471-15LE38 --- --- 52.4 - 57.4 122 + 35 4 1Average 74.5 81.7 71.7 56.6 121 33 3 1LSD (O.05) 3.9 4.7 5.5 0.8 1 1 1 1C.V. 6.1 5.5 5.5 1.0 1 3 33 82Released cultivars are shown in bold print. Varieties are ordered by descending yield averages.A plus or minus sign indicates a performance significantly above or below the test average.The 0-9 ratings indicate a genotype's response to disease or lodging where 0 = highly resistant and 9 = highly susceptible.
64

LineVA16W-224 --- --- 97.7 + 55.8 1 -Armor ARW1766 --- --- 97.3 + 57.4 2MBX 17-P-275 --- 73.8 94.3 + 53.8 - 4 +13VTK429-3 --- --- 93.8 + 59.7 + 1 -13VTK59-148 --- --- 93.2 + 60.6 + 1.5 -VA16W-202 --- --- 92.2 + 54.4 1 -CROPLAN 8415 65.0 + 74.6 92.1 + 57.3 2SY Viper 60.4 70.3 91.4 + 59.3 + 1.75Shirley 60.4 75.6 + 90.5 + 56.9 1 -VA16W-148 --- --- 89.1 + 56.2 1 -MAS #86 --- --- 88.7 + 55.7 2.5VA12W-68 66.7 + 76.9 + 88.7 + 55.6 2.5Luisa --- --- 88.5 + 58.6 1.25 -AgriMAXX 474 62.2 70.3 88.1 + 53.9 - 2.5#Blaze --- 68.7 88.0 + 56.5 2L11719 --- --- 87.7 56.7 1.25 -VA16W-29 --- --- 87.6 55.9 0.75 -USG 3118 65.9 + 74.7 87.3 57.1 0.75 -PGX 16-7 66.4 + 76.3 + 87.0 56.0 1.75AgriMAXX 463 --- 75.3 + 86.6 56.0 4.5 +WX17775 --- --- 86.5 55.8 4.75 +Featherstone 73 55.3 63.5 - 86.2 59.9 + 3.75 +DH12SRW056-058 --- 70.0 86.1 58.4 3.2513VTK434-89 --- --- 86.0 59.1 + 1.25 -DH13SRW023-201 --- --- 86.0 62.0 + 0.75 -SH 7200 62.0 72.9 85.9 58.8 2.5PGX 17-16 --- --- 85.8 57.5 1.75AgriMAXX Exp 1874 --- --- 85.5 55.4 2.5PGX 17-20 --- --- 85.4 57.0 2.75VA15W-63 --- 73.4 85.3 57.5 2.25Hilliard 66.2 + 76.5 + 85.2 57.2 1.5 -DH12SRW057-006 --- 66.8 85.1 58.7 1 -USG 3329 --- --- 85.1 57.7 2.5USG 3228 --- 72.8 85.0 55.0 4.5 +SY 547 58.8 68.7 84.9 57.2 1.25 -VA16W-105 --- --- 84.9 54.0 - 2.25AgriMAXX 480 --- --- 84.7 57.3 1 -USG 3316 48.7 - 60.9 - 84.4 53.6 - 5.25 +CROPLAN SRW 9606 --- 68.8 84.3 54.7 3.25MAS #116 --- 77.8 + 84.1 57.0 2.2512VTK15-148 --- --- 83.9 56.6 1 -
(Bu/a) (Bu/a) (Bu/a) (Lb/bu) (0-9)Av. Yield Av. Yield Yield Weight Mildew
Table 31. Summary of performance of entries in the Virginia Tech Wheat Test, Eastern Shore AREC, Painter, VA, 2018 harvest.
3-year 2-year Grain Test Powdery
65

Line (Bu/a) (Bu/a) (Bu/a) (Lb/bu) (0-9)Av. Yield Av. Yield Yield Weight Mildew
Table 31. Summary of performance of entries in the Virginia Tech Wheat Test, Eastern Shore AREC, Painter, VA, 2018 harvest.
3-year 2-year Grain Test Powdery
VA16W-104 --- --- 83.7 57.1 1.5 -Dyna-Gro 9811 67.1 + 77.0 + 83.7 56.9 2.25AgriMAXX Exp 1892 --- --- 83.6 58.3 2MAS #87 --- --- 83.5 56.6 4.25 +DH13SRW021-70 --- --- 83.4 57.7 3VA15W-30 --- --- 83.4 56.6 1.75MBX 18-A-237 --- --- 83.4 56.4 1.25 -VA15W-131 --- --- 83.3 57.3 2.75LCS Ammo --- --- 83.1 56.2 2L11550 65.0 + 75.1 + 83.0 56.3 2.75MBX 17-M-245 --- 68.5 83.0 53.6 - 1.75L11551 --- --- 82.8 57.2 1.25 -DH12SRW057-081 --- --- 82.6 58.7 4.25 +Armor ARW1719 --- --- 82.5 56.4 4.25 +VA15W-67 --- --- 82.5 59.2 + 1.5 -GA08535-15LE29 --- --- 82.4 59.6 + 3Dyna-Gro 9750 --- 72.6 82.4 55.0 4.5 +MAS #316 --- 67.0 81.8 56.3 3USG 3197 60.8 71.8 81.8 53.8 - 3.5 +MAS #7 57.9 65.2 81.6 57.0 2.2513VA-FHB-DH252 --- --- 81.5 58.6 2.2513VTK82-51 --- --- 81.4 56.3 2.75VA16W-196 --- --- 81.3 56.8 2DH13SRW021-80 --- --- 81.1 57.5 0.5 -VA15W-68 --- --- 81.1 58.2 1.25 -TWS2818 --- --- 81.1 57.1 4 +CROPLAN 8550 61.8 72.5 81.1 56.2 2.515MDX18 --- --- 81.1 57.2 2.75Armor ARW1716 --- --- 81.0 59.0 2DH13SRW025-14 --- --- 80.9 55.2 1.25 -#Warrior --- 68.1 80.8 55.6 3USG 3458 --- 68.7 80.7 55.2 2.75VA09MAS2-131-6-2 --- 75.1 + 80.6 56.5 1.5 -MAS #83 --- --- 80.6 56.2 3.25USG 3895 61.3 72.9 80.6 55.1 3.75 +13VTK128-75 --- --- 80.1 56.4 3.25#Boss --- 62.7 - 80.0 54.3 2.75VA16W-31 --- --- 80.0 59.0 2MBX 14-S-210 59.2 70.0 79.7 56.7 5 +VA15W-91 --- --- 79.6 57.5 1.25 -VA16W-124 --- --- 79.4 57.1 2.25
66

Line (Bu/a) (Bu/a) (Bu/a) (Lb/bu) (0-9)Av. Yield Av. Yield Yield Weight Mildew
Table 31. Summary of performance of entries in the Virginia Tech Wheat Test, Eastern Shore AREC, Painter, VA, 2018 harvest.
3-year 2-year Grain Test Powdery
Pioneer 26R59 63.7 + 70.8 79.4 55.4 1.5 -VA16W-229 --- --- 79.4 56.0 1.75MAS #65 --- --- 79.4 55.5 2.75VA16W-149 --- --- 79.4 55.2 2.5DH11SRW066-153 --- --- 79.3 59.0 1.75AgriMAXX 415 57.6 66.9 79.2 58.7 3.75 +AgriMAXX 473 --- 77.4 + 78.9 55.9 1.75USG 3536 --- 77.0 + 78.9 55.6 2.5#Turbo --- 63.5 - 78.7 57.0 1.75SH 4300 48.8 - 58.4 - 78.6 51.2 - 4.5 +Dyna-Gro 9772 59.1 71.3 78.5 54.6 313VA-FHB-DH131 --- --- 78.2 58.1 3.25SH 7510 --- 71.7 77.9 54.7 3VA09MAS2-131-6-2-4 --- 74.9 + 77.9 56.0 1.5 -VA16W-152 --- --- 77.7 55.2 2Armor Mayhem --- 74.4 77.4 56.6 212VTK10-156 --- --- 77.3 56.8 2.25TWS2616 --- --- 77.2 56.2 4.25 +VA16W-28 --- --- 77.0 57.5 1.25 -VA15W-130 --- --- 77.0 57.9 1.5 -VA09MAS1-12-5-1-3 --- 70.7 76.9 57.7 3Armor Riptide --- 63.5 - 76.8 55.3 2.515MDX20 --- --- 76.4 56.7 2.5Pioneer 26R45 --- 70.9 76.4 56.2 3.25USG 3404 55.1 64.7 76.3 55.1 3.25MAS #84 --- --- 76.0 57.0 3.75 +NC14-23372 --- --- 75.9 60.9 + 0.75 -AgriMAXX 444 53.7 - 63.6 - 75.8 54.9 3.5 +MAS #61 63.0 + 72.0 75.8 56.3 4 +#Bullet 61.5 72.6 75.6 54.7 2.5AgriMAXX 486 --- --- 75.4 56.0 2.75USG 3429 --- --- 75.3 57.2 5.75 +CROPLAN SRW 9415 --- 64.5 75.3 56.0 4 +AgriMAXX 446 51.9 - 59.9 - 75.2 56.0 3.5 +VA15W-70 --- --- 75.2 56.1 0.75 -Pioneer 26R41 57.6 69.0 75.2 54.5 2.25AgriMAXX 485 --- --- 75.2 55.9 4 +VA09MAS1-12-5-1-1 --- 70.8 75.0 57.6 3.5 +GA061471-15LE38 --- --- 74.9 58.3 3.25Pioneer 26R10 51.9 - 59.1 - 74.8 56.7 3.5 +Dyna-Gro 9600 56.7 66.6 74.5 54.7 3
67

Line (Bu/a) (Bu/a) (Bu/a) (Lb/bu) (0-9)Av. Yield Av. Yield Yield Weight Mildew
Table 31. Summary of performance of entries in the Virginia Tech Wheat Test, Eastern Shore AREC, Painter, VA, 2018 harvest.
3-year 2-year Grain Test Powdery
VA09MAS6-122-7-1 64.3 + 73.9 74.3 57.1 1.25 -NC13-21213 --- 65.0 74.2 56.7 1.5 -Dyna-Gro 9522 53.1 - 62.3 - 73.9 55.8 3.25DH11SRW069-70 --- 71.5 73.4 53.8 - 2.75VA15W-92 --- --- 73.1 - 54.4 1.25 -Dyna-Gro 9701 --- 74.6 73.1 - 57.2 2.75VA12W-31 58.4 68.9 72.8 - 54.9 2Dyna-Gro 9862 --- 60.0 - 71.9 - 57.8 4.25 +TWS3418 --- --- 71.9 - 57.8 3.5 +VA13W-174 58.7 69.0 71.8 - 53.4 - 1 -15MDX5 --- --- 71.4 - 59.9 + 1.25 -SY Miskin --- --- 70.8 - 56.7 4.25 +Armor Nemesis --- 67.6 67.9 - 57.2 6 +Pioneer 26R36 52.4 - 61.7 - 67.8 - 54.2 - 6.25 +NC13-20076 --- --- 67.6 - 59.7 + 2SH 4400 44.8 - 53.0 - 67.6 - 53.8 - 5.5 +Armor ARW1762 --- --- 66.7 - 54.5 3.75 +Massey 40.2 - 44.8 - 64.4 - 57.7 1.5 -MAS #85 --- --- 64.3 - 57.0 6.75 +Average 58.5 69.2 80.6 56.6 2.6LSD (O.05) 4.2 5.5 7.3 2.4 0.8C.V. 8.8 8.1 6.5 3.1 23.5Released cultivars are shown in bold print.Varieties are ordered by descending yield averages.A plus or minus sign indicates a performance significantly above or below the test average.The 0-9 ratings indicate a genotype's response to disease or lodging where 0 = highly resistant and 9 = highly susceptible.
68

Line13VTK59-148 --- 78.4 + 56.8 + 1AgriMAXX 480 --- 77.0 + 56.7 + 0SY Viper 70.2 + 75.7 + 55.6 + 2MBX 18-A-237 --- 73.7 + 56.3 + 1#Blaze 69.8 + 73.4 + 53.4 2VA16W-202 --- 73.3 + 53.1 0L11719 --- 73.2 + 55.7 + 1USG 3429 --- 72.5 + 55.7 + 5MAS #116 66.7 71.9 53.2 1VA16W-224 --- 71.6 53.9 1USG 3458 71.1 + 71.4 52.3 - 3VA09MAS1-12-5-1-3 71.7 + 70.8 55.1 113VTK429-3 --- 70.7 54.5 1L11551 --- 70.5 55.5 + 1VA16W-148 --- 70.4 53.6 1Dyna-Gro 9811 67.1 70.2 53.7 1USG 3118 64.9 69.8 55.2 0VA09MAS2-131-6-2-4 66.0 69.6 53.9 0USG 3197 64.2 69.5 54.5 3VA09MAS1-12-5-1-1 69.2 + 69.5 57.5 + 2DH11SRW069-70 64.5 69.0 53.7 4USG 3895 63.8 68.9 52.3 - 4MAS #86 --- 68.8 52.2 - 113VTK128-75 --- 68.5 53.3 2VA12W-68 61.7 68.4 55.1 1AgriMAXX Exp 1892 --- 68.4 57.2 + 1VA16W-124 --- 68.3 55.2 1SH 7200 64.2 68.3 55.0 2Pioneer 26R41 63.1 68.1 53.3 1SY Miskin --- 68.0 55.1 3AgriMAXX 486 --- 68.0 53.3 2SH 4300 64.6 68.0 52.8 - 3VA16W-152 --- 67.9 52.8 1Armor ARW1716 --- 67.8 57.1 + 1Pioneer 26R10 65.7 67.7 53.3 3VA09MAS2-131-6-2 62.2 67.5 54.7 1NC13-21213 56.9 - 67.5 55.9 + 0MAS #87 --- 67.4 52.1 - 212VTK10-156 --- 67.4 53.2 1CROPLAN SRW 9415 69.2 + 67.4 53.2 3VA16W-104 --- 67.2 53.6 1
Table 32. Summary of performance of entries in the Virginia Tech Wheat Test, Southern Piedmont AREC, Blackstone, VA, 2018 harvest.
(Bu/a) (Lb/bu) (0-9)
2-yearAv. Yield(Bu/a)
Grain Test PowderyYield Weight Mildew
69

Line
Table 32. Summary of performance of entries in the Virginia Tech Wheat Test, Southern Piedmont AREC, Blackstone, VA, 2018 harvest.
(Bu/a) (Lb/bu) (0-9)
2-yearAv. Yield(Bu/a)
Grain Test PowderyYield Weight Mildew
VA16W-149 --- 67.0 53.6 1DH12SRW057-081 --- 66.9 56.2 + 1Pioneer 26R59 66.5 66.8 52.9 1MAS #316 66.7 66.7 52.8 3MBX 14-S-210 67.1 66.7 53.6 3Dyna-Gro 9750 63.3 66.7 51.8 - 3DH13SRW025-14 --- 66.6 54.1 1VA12W-31 64.8 66.6 55.5 + 1AgriMAXX 444 66.7 66.6 53.5 2USG 3329 --- 66.5 52.9 2Armor ARW1766 --- 66.4 54.0 1NC13-20076 --- 66.3 57.2 + 0Armor ARW1719 --- 66.3 51.9 - 2SH 7510 67.6 66.2 52.5 - 3SY 547 60.8 66.1 53.2 1CROPLAN SRW 9606 67.2 66.1 53.0 3USG 3316 64.5 65.9 53.4 6AgriMAXX 473 64.6 65.6 53.4 1DH12SRW057-006 64.0 65.3 57.6 + 1AgriMAXX 463 62.2 65.3 51.0 - 4VA16W-229 --- 65.3 55.0 2TWS3418 --- 65.2 52.8 2Luisa --- 65.2 57.1 + 1CROPLAN 8415 65.2 65.2 55.0 0VA15W-91 --- 64.9 54.7 1MAS #83 --- 64.6 53.2 3AgriMAXX 446 66.4 64.4 53.9 2PGX 16-7 60.8 64.3 55.7 + 0Featherstone 73 59.3 64.2 54.9 1VA16W-196 --- 64.2 53.0 2USG 3536 60.9 64.0 53.0 1VA15W-63 63.8 63.9 54.8 2Hilliard 63.9 63.7 53.7 0VA15W-68 --- 63.4 56.1 + 0VA15W-131 --- 63.3 53.9 0Pioneer 26R45 65.7 63.3 54.3 1DH13SRW021-80 --- 63.3 55.2 1PGX 17-20 --- 63.3 53.9 113VA-FHB-DH252 --- 63.3 53.7 213VA-FHB-DH131 --- 63.3 55.2 1Dyna-Gro 9522 61.8 63.1 53.1 3
70

Line
Table 32. Summary of performance of entries in the Virginia Tech Wheat Test, Southern Piedmont AREC, Blackstone, VA, 2018 harvest.
(Bu/a) (Lb/bu) (0-9)
2-yearAv. Yield(Bu/a)
Grain Test PowderyYield Weight Mildew
DH11SRW066-153 --- 63.1 56.7 + 0NC14-23372 --- 62.9 56.8 + 0VA15W-67 --- 62.9 56.2 + 2AgriMAXX 474 66.9 62.7 51.7 - 2Dyna-Gro 9862 63.5 62.7 53.1 3TWS2616 --- 62.7 53.0 2DH13SRW023-201 --- 62.5 59.3 + 0Dyna-Gro 9772 58.4 62.5 52.1 - 2Armor Nemesis 66.3 62.5 54.7 4WX17775 --- 62.4 52.0 - 2VA15W-30 --- 62.3 52.8 1DH12SRW056-058 58.1 62.3 54.4 2MAS #61 63.7 62.2 52.7 - 2GA08535-15LE29 --- 62.2 55.3 + 3MAS #84 --- 62.0 53.3 3VA15W-130 --- 62.0 55.1 2VA15W-70 --- 61.9 56.0 + 1#Turbo 60.1 61.9 53.0 3LCS Ammo --- 61.7 53.7 0#Boss 59.3 61.7 52.3 - 3MAS #7 64.5 61.7 52.3 - 115MDX20 --- 61.6 54.4 0MBX 17-P-275 59.2 61.6 51.7 - 3Dyna-Gro 9701 62.4 61.4 53.0 1VA16W-29 --- 61.4 54.6 0MAS #65 --- 61.0 52.7 - 2PGX 17-16 --- 60.9 54.7 1Shirley 63.9 60.9 53.7 012VTK15-148 --- 60.7 54.2 0Armor Riptide 61.4 60.5 51.3 - 2GA061471-15LE38 --- 60.4 55.4 + 215MDX18 --- 60.4 55.8 + 0AgriMAXX Exp 1874 --- 60.1 51.3 - 1USG 3228 59.1 60.1 51.9 - 2MBX 17-M-245 68.2 59.8 52.4 - 213VTK434-89 --- 59.8 56.1 + 1VA09MAS6-122-7-1 53.1 - 59.8 55.7 + 1VA16W-105 --- 59.6 52.0 - 1TWS2818 --- 59.5 52.7 - 2L11550 62.1 59.4 51.7 - 1#Bullet 61.3 59.3 52.7 - 0
71

Line
Table 32. Summary of performance of entries in the Virginia Tech Wheat Test, Southern Piedmont AREC, Blackstone, VA, 2018 harvest.
(Bu/a) (Lb/bu) (0-9)
2-yearAv. Yield(Bu/a)
Grain Test PowderyYield Weight Mildew
SH 4400 58.4 58.5 53.0 4DH13SRW021-70 --- 58.4 53.0 1AgriMAXX 415 62.2 58.3 55.7 + 3MAS #85 --- 58.3 53.8 6CROPLAN 8550 61.4 58.2 52.6 - 113VTK82-51 --- 58.2 55.6 + 2VA13W-174 61.2 58.1 54.9 0VA15W-92 --- 57.9 53.6 0USG 3404 60.5 57.7 53.3 1AgriMAXX 485 --- 57.7 52.4 - 3VA16W-28 --- 57.5 56.1 + 015MDX5 --- 56.4 55.6 + 0Pioneer 26R36 53.1 - 56.3 54.7 5Dyna-Gro 9600 58.2 56.2 - 51.7 - 2#Warrior 65.5 56.1 - 51.0 - 2Armor Mayhem 59.0 55.6 - 52.2 - 0Armor ARW1762 --- 54.0 - 53.4 2VA16W-31 --- 52.8 - 55.5 + 1Massey 45.9 - 48.5 - 53.6 1Average 63.2 64.3 54.0 2LSD (O.05) 5.4 8.0 1.2 ---C.V. 8.3 8.6 1.6 ---Released cultivars are shown in bold print.Varieties are ordered by descending yield averages.A plus or minus sign indicates a performance significantly above or below the test average.The 0-9 ratings indicate a genotype's response to disease or lodging where 0 = highly resistant and 9 = highly susceptible.
72

LineAgriMAXX 415 94.2 + 86.2 + 52.1 + 36 5Armor Riptide 83.9 85.9 + 50.6 35 2MBX 17-M-245 91.7 + 85.3 + 50.4 35 4#Warrior 88.8 84.5 + 50.1 36 1 -MAS #7 84.4 81.5 + 50.7 37 4Pioneer 26R36 92.5 + 80.8 + 51.4 34 6USG 3316 91.2 + 79.2 51.4 37 6Shirley 83.6 79.0 49.8 35 2USG 3404 92.7 + 78.8 50.1 36 1 -Pioneer 26R59 83.0 77.9 52.4 + 34 1 -SH 4300 80.1 77.8 49.0 36 2CROPLAN 8550 89.3 77.7 48.9 36 7AgriMAXX 444 89.8 77.4 50.2 35 4USG 3895 89.2 77.4 50.0 35 4SY 547 77.1 77.2 50.6 37 5L11719 --- 77.1 50.8 32 7CROPLAN SRW 9415 92.7 + 76.9 52.1 + 37 3AgriMAXX 446 85.2 76.7 52.0 35 4VA09MAS2-131-6-2 83.4 76.6 50.4 34 3SH 4400 76.5 76.5 50.0 36 6MAS #65 --- 76.5 50.1 34 5USG 3228 79.4 76.3 49.7 35 6DH13SRW021-70 --- 76.3 50.6 35 4PGX 17-16 --- 76.2 50.7 33 5#Bullet 88.6 75.7 49.4 35 6AgriMAXX 474 87.1 75.7 49.8 36 213VTK82-51 --- 75.5 52.2 + 35 5USG 3536 86.5 75.3 49.5 41 + 7PGX 16-7 84.6 75.2 50.4 36 613VTK429-3 --- 74.8 51.5 35 4Pioneer 26R41 81.5 74.7 50.3 33 3VA16W-148 --- 74.5 50.8 35 6SY Viper 77.5 74.5 52.7 + 39 5VA16W-29 --- 74.2 50.5 38 5Armor ARW1766 --- 74.2 50.9 36 5MBX 14-S-210 81.2 74.1 50.2 38 5Dyna-Gro 9701 82.6 73.7 50.1 37 5VA09MAS2-131-6-2-4 80.3 73.4 50.4 34 4VA15W-130 --- 73.1 50.1 35 6WX17775 --- 72.8 49.2 35 5CROPLAN SRW 9606 86.8 72.6 50.1 36 3
Table 33. Summary of performance of entries in the Virginia Tech Wheat Test, Northern Piedmont Center, Orange, VA, 2018 harvest.
(Bu/a) (Lb/bu) (In)
PlantLodging
(0-9)
TestYield Weight Height
2-yearAv. Yield(Bu/a)
73

Line
Table 33. Summary of performance of entries in the Virginia Tech Wheat Test, Northern Piedmont Center, Orange, VA, 2018 harvest.
(Bu/a) (Lb/bu) (In)
PlantLodging
(0-9)
TestYield Weight Height
2-yearAv. Yield(Bu/a)
Dyna-Gro 9600 80.9 72.6 46.3 - 36 5#Turbo 80.5 72.4 51.4 35 7Pioneer 26R45 81.3 72.3 51.6 35 5MAS #86 --- 72.2 48.8 39 3VA15W-131 --- 72.0 50.7 34 7AgriMAXX 486 --- 71.8 50.4 38 4#Boss 74.1 71.7 47.5 - 35 5Armor ARW1719 --- 71.7 49.2 37 5Dyna-Gro 9772 79.2 71.5 48.5 - 38 7MAS #116 85.2 71.5 49.4 36 5AgriMAXX 485 --- 71.4 50.4 34 613VTK59-148 --- 71.4 51.5 34 7VA16W-28 --- 71.4 50.1 34 4VA13W-174 82.7 71.1 49.9 38 5TWS3418 --- 71.1 48.4 - 34 6Pioneer 26R10 84.4 71.0 50.3 36 3MAS #85 --- 71.0 51.1 37 5VA15W-63 78.8 70.8 50.8 35 4VA12W-68 83.3 70.8 50.6 34 3DH12SRW056-058 77.5 70.8 50.6 36 6USG 3329 --- 70.8 48.1 - 36 5Dyna-Gro 9862 82.0 70.7 50.7 34 4Armor Nemesis 76.9 70.7 51.0 36 7Armor ARW1762 --- 70.7 50.9 37 3VA16W-202 --- 70.5 49.1 33 6USG 3197 80.3 70.5 48.2 - 34 4AgriMAXX Exp 1874 --- 70.4 49.3 35 5VA16W-105 --- 70.4 49.3 36 7MAS #87 --- 70.3 49.1 35 6DH11SRW066-153 --- 69.9 51.4 38 615MDX20 --- 69.8 50.4 36 6USG 3458 84.5 69.5 49.3 36 5AgriMAXX 473 80.8 69.5 49.5 33 7Dyna-Gro 9522 77.4 68.2 49.5 37 7L11550 79.1 68.2 50.6 35 712VTK15-148 --- 67.8 48.7 - 35 4VA15W-68 --- 67.6 50.1 36 6TWS2818 --- 67.5 50.3 37 4SY Miskin --- 67.2 50.7 37 6CROPLAN 8415 78.6 67.0 50.8 36 713VA-FHB-DH252 --- 66.9 52.6 + 37 4
74

Line
Table 33. Summary of performance of entries in the Virginia Tech Wheat Test, Northern Piedmont Center, Orange, VA, 2018 harvest.
(Bu/a) (Lb/bu) (In)
PlantLodging
(0-9)
TestYield Weight Height
2-yearAv. Yield(Bu/a)
Featherstone 73 70.7 - 66.8 51.2 36 8SH 7510 86.2 66.7 50.9 37 6DH13SRW025-14 --- 66.6 51.9 35 8AgriMAXX 463 80.2 66.3 49.2 35 7VA16W-224 --- 66.2 48.8 39 + 2VA16W-104 --- 65.7 48.8 35 6AgriMAXX Exp 1892 --- 65.7 52.5 + 31 - 4Armor Mayhem 78.6 65.6 49.2 39 7DH12SRW057-006 79.6 64.9 53.3 + 33 3NC13-21213 73.3 64.8 51.6 34 8MAS #61 81.2 64.8 49.2 33 4PGX 17-20 --- 64.6 51.3 37 4DH12SRW057-081 --- 64.6 52.0 36 8VA15W-30 --- 64.3 49.5 37 7VA16W-149 --- 64.2 49.0 36 4VA15W-91 --- 63.9 49.2 35 5Armor ARW1716 --- 63.9 51.8 33 4VA09MAS1-12-5-1-3 78.6 63.7 52.3 + 35 7VA16W-196 --- 63.5 49.5 37 5#Blaze 76.1 63.5 48.6 - 36 8MAS #83 --- 63.5 48.7 - 34 5L11551 --- 63.1 51.6 35 5MAS #84 --- 62.8 50.7 34 7DH11SRW069-70 76.3 62.7 46.6 - 35 6Dyna-Gro 9811 77.3 62.6 50.3 35 513VTK128-75 --- 62.5 48.3 - 36 6VA16W-152 --- 62.2 49.5 35 5Hilliard 75.4 62.2 50.3 35 4VA16W-31 --- 62.2 50.5 37 212VTK10-156 --- 62.1 50.2 35 4VA16W-124 --- 62.1 50.6 34 7VA16W-229 --- 62.0 50.0 35 5Luisa --- 61.6 52.8 + 35 4GA08535-15LE29 --- 61.6 51.9 38 6VA15W-70 --- 61.6 50.6 34 3VA12W-31 84.9 61.6 52.2 + 37 7MAS #316 75.8 60.6 50.5 36 6DH13SRW023-201 --- 60.6 55.5 + 37 6VA15W-92 --- 60.6 49.4 34 7Dyna-Gro 9750 79.3 60.5 49.2 36 8VA09MAS1-12-5-1-1 83.9 60.5 53.2 + 36 5
75

Line
Table 33. Summary of performance of entries in the Virginia Tech Wheat Test, Northern Piedmont Center, Orange, VA, 2018 harvest.
(Bu/a) (Lb/bu) (In)
PlantLodging
(0-9)
TestYield Weight Height
2-yearAv. Yield(Bu/a)
MBX 17-P-275 78.0 60.4 48.7 - 32 - 715MDX18 --- 60.3 50.7 35 413VTK434-89 --- 59.1 50.9 35 5VA09MAS6-122-7-1 69.1 - 58.5 50.2 35 4NC13-20076 --- 58.5 51.7 35 513VA-FHB-DH131 --- 58.3 52.8 + 36 6VA15W-67 --- 58.0 50.0 36 3SH 7200 67.4 - 57.9 51.3 37 3USG 3429 --- 57.8 46.9 - 33 6MBX 18-A-237 --- 57.4 51.9 34 7AgriMAXX 480 --- 57.0 52.2 + 36 815MDX5 --- 56.8 52.0 34 7TWS2616 --- 56.2 - 49.4 36 5GA061471-15LE38 --- 55.6 - 51.4 38 6USG 3118 65.1 - 53.0 - 50.6 31 - 6LCS Ammo --- 52.5 - 50.5 33 4Massey 56.7 - 51.6 - 49.9 38 7NC14-23372 --- 50.8 - 52.0 + 37 5DH13SRW021-80 --- 50.3 - 51.0 33 6Average 81.2 68.4 50.4 35.4 5.0LSD (O.05) 8.8 11.9 1.6 3 4C.V. 10.5 11.6 2.1 7 53Released cultivars are shown in bold print.Varieties are ordered by descending yield averages.A plus or minus sign indicates a performance significantly above or below the test average.The 0-9 ratings indicate a genotype's response to disease or lodging where 0 = highly resistant and 9 = highly susceptible.
76

LineDH12SRW056-058 --- 87.6 93.2 + 56.3 131 37 + 3PGX 17-20 --- --- 92.9 + 55.6 132 35 3L11719 --- --- 92.7 + 57.2 + 132 33 3Dyna-Gro 9772 88.3 90.5 92.6 + 54.1 - 131 36 2PGX 17-16 --- --- 91.7 + 56.1 132 37 + 1AgriMAXX Exp 1892 --- --- 91.5 + 58.0 + 130 - 32 - 213VTK429-3 --- --- 90.6 + 56.5 + 131 34 4PGX 16-7 89.4 89.7 90.5 + 53.8 - 130 34 1AgriMAXX Exp 1874 --- --- 90.1 + 55.8 129 - 35 1USG 3197 84.5 84.4 89.4 + 54.2 - 131 35 3AgriMAXX 486 --- --- 88.7 + 56.1 133 + 36 5VA09MAS1-12-5-1-1 --- 87.0 88.1 + 58.1 + 132 35 5MAS #87 --- --- 88.1 + 54.6 131 34 3MBX 14-S-210 92.0 + 91.8 87.9 55.8 132 36 2MAS #316 --- 88.3 87.4 55.6 133 + 34 6MAS #86 --- --- 87.4 54.3 - 132 36 3VA12W-68 85.9 85.0 87.1 54.4 - 130 - 34 2USG 3536 --- 89.9 87.0 54.9 131 36 4DH13SRW025-14 --- --- 86.8 56.7 + 128 - 32 - 2AgriMAXX 473 --- 92.1 86.7 54.9 132 36 4AgriMAXX 446 85.5 87.3 86.4 56.2 132 34 1Armor ARW1766 --- --- 86.4 55.9 129 - 37 + 1CROPLAN SRW 9415 --- 88.8 86.2 56.0 133 + 35 1DH13SRW023-201 --- --- 86.1 60.8 + 133 + 35 113VTK82-51 --- --- 85.6 55.6 133 + 33 6USG 3895 84.6 84.2 85.3 55.0 132 34 1VA12W-31 90.4 + 91.0 85.3 54.9 131 34 5VA16W-105 --- --- 84.8 52.5 - 132 35 6AgriMAXX 415 87.8 88.8 84.7 56.9 + 131 35 2Armor Mayhem --- 91.8 84.7 54.5 132 37 + 1VA15W-91 --- --- 84.5 55.7 132 33 3WX17775 --- --- 84.5 54.1 - 131 34 2VA09MAS1-12-5-1-3 --- 84.1 83.8 57.2 + 132 36 7 +MAS #61 88.4 86.5 83.4 55.2 129 - 33 5CROPLAN 8550 91.4 + 92.3 83.1 55.2 132 37 + 1MAS #116 --- 90.0 82.9 55.0 132 36 2Armor ARW1719 --- --- 82.7 54.1 - 131 34 5VA16W-124 --- --- 82.1 56.4 + 131 36 + 5Armor ARW1716 --- --- 82.1 57.4 + 130 - 33 3AgriMAXX 480 --- --- 82.0 56.6 + 127 - 34 6VA16W-229 --- --- 81.9 53.6 - 130 - 32 - 3
LodgingMature Plant
Table 34. Summary of performance of entries in the Virginia Tech Wheat Test, Kentland farm, Blacksburg, VA, 2018 harvest.
(Bu/a) (Bu/a) (Bu/a) (Lb/bu) (Julian) (In) (0-9)Av. Yield Av. Yield Yield Weight Headed Height
3-year 2-year Grain Test Date
77

LineLodging
Mature Plant
Table 34. Summary of performance of entries in the Virginia Tech Wheat Test, Kentland farm, Blacksburg, VA, 2018 harvest.
(Bu/a) (Bu/a) (Bu/a) (Lb/bu) (Julian) (In) (0-9)Av. Yield Av. Yield Yield Weight Headed Height
3-year 2-year Grain Test Date
Pioneer 26R10 85.5 86.6 81.6 54.5 132 + 35 2VA09MAS6-122-7-1 83.3 81.2 81.6 55.2 130 - 31 - 4#Bullet 87.9 90.6 81.4 54.0 - 133 + 36 7 +SH 4300 75.9 - 75.2 - 81.2 52.1 - 130 35 513VTK434-89 --- --- 80.5 57.5 + 132 37 + 5L11550 83.5 81.3 80.3 54.7 132 34 313VA-FHB-DH131 --- --- 80.1 57.8 + 129 - 33 7 +DH13SRW021-80 --- --- 79.9 56.1 132 32 - 7 +12VTK10-156 --- --- 79.6 54.3 - 132 34 8 +Luisa --- --- 79.3 57.3 + 131 36 + 4SH 7200 80.7 80.6 79.2 56.6 + 131 35 315MDX20 --- --- 79.1 54.3 - 133 + 34 4SH 7510 --- 83.2 79.0 54.9 132 34 3Hilliard 87.5 84.9 78.9 54.9 132 36 1USG 3316 73.7 - 76.0 - 78.6 56.1 131 35 1DH11SRW066-153 --- --- 78.6 58.9 + 132 + 36 2TWS2616 --- --- 78.5 55.0 128 - 35 7 +Dyna-Gro 9701 --- 85.2 78.5 54.2 - 132 36 5Dyna-Gro 9811 83.7 81.4 78.3 54.3 - 131 36 3VA15W-92 --- --- 78.2 54.0 - 130 33 6AgriMAXX 444 82.4 83.3 78.1 54.6 132 35 2LCS Ammo --- --- 78.1 53.9 - 133 + 34 5DH11SRW069-70 --- 84.4 78.0 53.6 - 133 + 34 5Dyna-Gro 9600 84.0 83.7 77.7 51.8 - 131 35 0 -USG 3329 --- --- 77.4 54.7 131 35 7 +CROPLAN SRW 9606 --- 84.6 77.4 54.6 130 35 2Pioneer 26R41 84.2 84.3 77.4 55.0 133 + 34 1L11551 --- --- 76.9 55.1 133 + 32 - 5USG 3404 80.2 80.1 76.6 54.1 - 133 + 34 3MBX 18-A-237 --- --- 76.6 56.9 + 127 - 34 3#Blaze --- 79.8 76.0 53.4 - 131 35 8 +#Boss --- 78.9 75.9 51.2 - 130 - 33 1MAS #83 --- --- 75.9 53.9 - 132 35 3Dyna-Gro 9522 77.7 - 79.1 74.3 54.3 - 132 36 3SY Miskin --- --- 73.4 - 55.1 130 - 35 3VA13W-174 73.6 - 74.5 - 73.2 - 54.7 131 36 4VA16W-104 --- --- 73.0 - 54.1 - 131 35 1VA15W-30 --- --- 72.2 - 53.7 - 132 + 34 7 +15MDX18 --- --- 70.0 - 55.9 133 + 32 - 4GA08535-15LE29 --- --- 69.5 - 57.0 + 133 + 36 + 2Pioneer 26R36 69.5 - 67.4 - 69.1 - 54.6 132 36 5
78

LineLodging
Mature Plant
Table 34. Summary of performance of entries in the Virginia Tech Wheat Test, Kentland farm, Blacksburg, VA, 2018 harvest.
(Bu/a) (Bu/a) (Bu/a) (Lb/bu) (Julian) (In) (0-9)Av. Yield Av. Yield Yield Weight Headed Height
3-year 2-year Grain Test Date
GA061471-15LE38 --- --- 68.5 - 57.4 + 133 + 37 + 613VA-FHB-DH252 --- --- 66.2 - 57.4 + 133 + 37 + 7 +NC14-23372 --- --- 66.1 - 58.0 + 133 + 35 315MDX5 --- --- 59.2 - 56.8 + 130 - 33 7 +NC13-20076 --- --- 57.4 - 55.8 132 34 6#Turbo * * * 55.4 129 - 32 - 3#Warrior * * * 54.6 129 - 34 212VTK15-148 * * * 56.0 131 35 0 -13VTK128-75 * * * 54.9 131 32 - 613VTK59-148 * * * 56.1 131 34 6AgriMAXX 463 * * * 53.9 - 131 33 5AgriMAXX 474 * * * 54.7 129 - 33 2AgriMAXX 485 * * * 56.6 + 132 35 5Armor ARW1762 * * * 56.4 + 132 34 2Armor Nemesis * * * 55.8 132 32 - 5Armor Riptide * * * 54.8 129 - 35 1CROPLAN 8415 * * * 53.1 - 131 36 7 +DH12SRW057-006 * * * 58.9 + 132 30 - 2DH12SRW057-081 * * * 56.6 + 131 32 - 6DH13SRW021-70 * * * 56.3 130 - 33 5Dyna-Gro 9750 * * * 53.5 - 132 34 6Dyna-Gro 9862 * * * 56.5 + 132 34 4Featherstone 73 * * * 56.0 133 + 33 5MAS #65 * * * 55.0 129 - 36 1MAS #7 * * * 55.6 132 36 3MAS #84 * * * 53.8 - 129 - 34 6MAS #85 * * * 55.1 132 36 5Massey * * * 55.2 132 + 37 + 6MBX 17-M-245 * * * 55.7 129 - 32 - 1MBX 17-P-275 * * * 53.7 - 131 33 3NC13-21213 * * * 54.7 132 35 5Pioneer 26R45 * * * 54.9 132 33 4Pioneer 26R59 * * * 55.6 130 - 32 - 2SH 4400 * * * 55.6 132 36 3Shirley * * * 53.1 - 132 34 1SY 547 * * * 55.9 131 35 1SY Viper * * * 56.5 + 130 - 38 + 6TWS2818 * * * 56.7 + 132 34 4TWS3418 * * * 56.2 133 + 34 7 +USG 3118 * * * 55.1 129 - 33 4USG 3228 * * * 53.6 - 131 32 - 4
79

LineLodging
Mature Plant
Table 34. Summary of performance of entries in the Virginia Tech Wheat Test, Kentland farm, Blacksburg, VA, 2018 harvest.
(Bu/a) (Bu/a) (Bu/a) (Lb/bu) (Julian) (In) (0-9)Av. Yield Av. Yield Yield Weight Headed Height
3-year 2-year Grain Test Date
USG 3429 * * * 55.6 132 34 4USG 3458 * * * 54.7 129 - 34 2VA09MAS2-131-6-2 * * * 55.5 129 - 29 - 1VA09MAS2-131-6-2-4 * * * 54.6 131 30 - 2VA15W-130 * * * 54.9 132 34 3VA15W-131 * * * 55.5 132 35 2VA15W-63 * * * 56.2 131 33 1VA15W-67 * * * 57.0 + 132 35 2VA15W-68 * * * 57.1 + 131 34 1VA15W-70 * * * 56.7 + 130 33 2VA16W-148 * * * 56.9 + 132 + 35 2VA16W-149 * * * 53.4 - 132 34 4VA16W-152 * * * 54.5 131 35 6VA16W-196 * * * 55.3 133 + 32 - 4VA16W-202 * * * 53.5 - 130 - 33 6VA16W-224 * * * 53.7 - 132 36 + 1VA16W-28 * * * 56.9 + 132 34 1VA16W-29 * * * 56.3 132 36 2VA16W-31 * * * 57.0 + 131 32 - 1Average 87.6 88.7 88.0 55.7 131 35 3LSD (O.05) 5.9 8.2 6.9 1.0 1 2 3C.V. 8.2 10.2 6.1 1.3 1 4 62Released cultivars are shown in bold print.Varieties are ordered by descending yield averages.A plus or minus sign indicates a performance significantly above or below the test average.The 0-9 ratings indicate a genotype's response to disease or lodging where 0 = highly resistant and9 = highly susceptible.*Varieties were fed upon by deer and their yields significantly reduced.
80

LineVA16W-124 --- --- 77.3 + 53.4MAS #84 --- --- 76.3 + 53.5Pioneer 26R59 61.5 + 62.5 + 73.7 + 52.3TWS3418 --- --- 72.3 52.7DH13SRW021-70 --- --- 72.0 53.0SH 4300 57.9 60.6 71.8 52.1 -L11550 58.1 58.9 71.3 51.8 -VA16W-149 --- --- 69.9 53.7USG 3329 --- --- 69.7 52.2 -VA15W-30 --- --- 69.7 52.8AgriMAXX 446 57.6 62.7 + 69.5 53.8MAS #83 --- --- 69.5 53.1DH12SRW056-058 --- 58.1 69.2 55.1 +Luisa --- --- 68.7 56.4 +USG 3316 58.1 65.0 + 68.5 51.0 -MBX 17-P-275 --- 56.1 68.4 51.8 -#Warrior --- 51.2 68.3 52.0 -AgriMAXX 486 --- --- 68.1 53.0VA12W-31 56.4 54.8 68.0 54.5DH11SRW069-70 --- 52.0 67.8 53.5MBX 14-S-210 57.7 61.7 67.8 53.113VTK429-3 --- --- 67.6 54.3USG 3429 --- --- 67.6 55.1 +VA09MAS2-131-6-2 --- 57.3 67.6 53.2USG 3404 57.4 62.7 + 67.5 53.3AgriMAXX 480 --- --- 67.4 56.6 +VA16W-148 --- --- 67.3 54.2#Boss --- 55.3 67.3 52.1 -DH13SRW021-80 --- --- 67.2 51.9 -MAS #316 --- 57.7 67.0 53.7MBX 17-M-245 --- 57.9 67.0 52.1 -USG 3458 --- 57.5 66.7 52.5DH12SRW057-081 --- --- 66.3 55.7 +VA16W-28 --- --- 66.2 54.313VTK59-148 --- --- 66.2 54.2USG 3228 --- 48.6 66.1 52.4Pioneer 26R10 59.3 62.0 + 65.9 53.6Dyna-Gro 9772 56.8 56.0 65.8 52.2 -#Bullet 55.0 55.6 65.6 53.1AgriMAXX 485 --- --- 65.5 52.0 -PGX 17-20 --- --- 65.4 54.5
Grain Test3-year 2-year
Table 35. Summary of performance of entries in the Virginia Tech Wheat Test, planted No-Till at Tidewater AREC, Holland, VA, 2018 harvest.
Av. Yield Av. Yield Yield Weight(Bu/a) (Bu/a) (Bu/a) (Lb/bu)
81

Line
Grain Test3-year 2-year
Table 35. Summary of performance of entries in the Virginia Tech Wheat Test, planted No-Till at Tidewater AREC, Holland, VA, 2018 harvest.
Av. Yield Av. Yield Yield Weight(Bu/a) (Bu/a) (Bu/a) (Lb/bu)
MAS #61 58.4 56.5 65.4 53.1Armor Nemesis --- 54.2 65.4 55.7 +12VTK10-156 --- --- 65.3 53.1TWS2818 --- --- 65.2 52.8Armor ARW1766 --- --- 65.1 53.3USG 3895 57.6 58.9 65.1 51.9 -Dyna-Gro 9750 --- 50.1 65.0 51.8 -Pioneer 26R41 58.8 60.2 64.8 53.0MAS #87 --- --- 64.7 52.6Armor Mayhem --- 59.3 64.7 52.6GA061471-15LE38 --- --- 64.7 54.8Hilliard 57.1 57.5 64.5 52.1 -SH 4400 53.4 59.3 64.2 53.3USG 3197 53.4 54.4 64.0 52.8AgriMAXX 474 50.9 49.0 64.0 52.5SY Viper 50.1 52.8 63.8 54.913VTK82-51 --- --- 63.8 54.5VA16W-202 --- --- 63.4 52.1 -Massey 47.0 - 49.7 63.3 56.1 +L11719 --- --- 63.3 52.5VA16W-229 --- --- 63.3 54.0WX17775 --- --- 63.1 51.8 -AgriMAXX 415 56.0 58.0 63.0 55.1 +SH 7200 54.8 56.4 62.7 55.2 +13VTK128-75 --- --- 62.6 52.6MAS #86 --- --- 62.5 52.1 -SY 547 56.1 54.6 62.5 54.1MAS #116 --- 54.7 62.5 53.5VA16W-104 --- --- 62.5 55.0 +CROPLAN SRW 9606 --- 56.9 62.4 53.1VA15W-91 --- --- 62.4 54.0VA12W-68 56.3 56.3 62.2 53.0AgriMAXX 463 --- 50.4 62.2 51.7 -MAS #85 --- --- 62.1 53.3Armor ARW1719 --- --- 62.1 52.1 -SY Miskin --- --- 62.1 55.2 +PGX 17-16 --- --- 61.9 54.315MDX5 --- --- 61.9 56.0 +DH12SRW057-006 --- 49.8 61.8 56.4 +Armor Riptide --- 47.9 - 61.8 51.6 -USG 3536 --- 55.9 61.8 52.8
82

Line
Grain Test3-year 2-year
Table 35. Summary of performance of entries in the Virginia Tech Wheat Test, planted No-Till at Tidewater AREC, Holland, VA, 2018 harvest.
Av. Yield Av. Yield Yield Weight(Bu/a) (Bu/a) (Bu/a) (Lb/bu)
Pioneer 26R45 --- 55.5 61.4 53.415MDX20 --- --- 61.4 52.6VA16W-224 --- --- 61.2 53.0Featherstone 73 55.4 54.2 61.0 53.9VA09MAS1-12-5-1-1 --- 54.0 61.0 56.6 +MAS #65 --- --- 60.9 51.7 -AgriMAXX 473 --- 56.8 60.9 52.8CROPLAN 8550 55.5 56.2 60.8 52.5MBX 18-A-237 --- --- 60.7 57.3 +L11551 --- --- 60.7 54.913VTK434-89 --- --- 60.6 54.4PGX 16-7 55.0 53.8 60.6 53.1DH13SRW025-14 --- --- 60.6 55.3 +DH11SRW066-153 --- --- 60.4 54.9DH13SRW023-201 --- --- 60.4 57.7 +Dyna-Gro 9701 --- 53.4 60.2 53.1AgriMAXX Exp 1892 --- --- 60.2 55.013VA-FHB-DH131 --- --- 60.2 54.8VA09MAS2-131-6-2-4 --- 51.8 60.1 53.1GA08535-15LE29 --- --- 59.9 54.3Pioneer 26R36 53.3 56.9 59.8 54.9VA09MAS6-122-7-1 50.6 49.2 59.7 55.2 +13VA-FHB-DH252 --- --- 59.6 54.9VA16W-152 --- --- 59.5 52.2 -Armor ARW1716 --- --- 59.5 56.0 +MAS #7 46.3 - 50.6 59.5 53.7USG 3118 52.7 51.9 59.4 54.1#Blaze --- 58.1 59.3 53.4LCS Ammo --- --- 58.9 53.6CROPLAN 8415 55.3 54.1 58.7 54.9VA15W-70 --- --- 58.6 53.5AgriMAXX Exp 1874 --- --- 58.6 53.515MDX18 --- --- 58.6 54.2VA15W-130 --- --- 58.3 53.4CROPLAN SRW 9415 --- 59.7 58.3 54.2SH 7510 --- 55.8 58.1 52.4Dyna-Gro 9600 53.7 54.0 58.1 52.6NC13-21213 --- 44.5 - 58.0 55.7 +Dyna-Gro 9522 59.0 61.1 58.0 53.2AgriMAXX 444 56.9 59.4 57.9 53.5VA15W-131 --- --- 57.8 54.9
83

Line
Grain Test3-year 2-year
Table 35. Summary of performance of entries in the Virginia Tech Wheat Test, planted No-Till at Tidewater AREC, Holland, VA, 2018 harvest.
Av. Yield Av. Yield Yield Weight(Bu/a) (Bu/a) (Bu/a) (Lb/bu)
TWS2616 --- --- 57.7 52.7Dyna-Gro 9811 55.1 52.0 57.0 52.6VA09MAS1-12-5-1-3 --- 50.8 56.8 55.7 +VA15W-67 --- --- 56.6 53.7VA15W-63 --- 53.7 56.5 53.012VTK15-148 --- --- 56.3 52.6VA16W-105 --- --- 56.1 52.8Dyna-Gro 9862 --- 43.2 - 55.9 52.7Shirley 52.2 52.0 55.4 53.2VA16W-196 --- --- 55.4 52.6#Turbo --- 45.0 - 54.9 52.8NC13-20076 --- --- 54.7 56.7 +Armor ARW1762 --- --- 54.4 54.0NC14-23372 --- --- 54.3 55.3 +VA13W-174 53.0 50.0 53.3 53.9VA16W-29 --- --- 52.9 53.6VA15W-68 --- --- 52.1 - 54.0VA15W-92 --- --- 48.7 - 52.1 -VA16W-31 --- --- 48.6 - 54.0Average 55.3 55.1 62.6 53.6LSD (O.05) 5.6 6.8 10.5 1.3C.V. 11.6 11.8 11.4 1.7Released cultivars are shown in bold print.Varieties are ordered by descending yield averages.A plus or minus sign indicates a performance significantly above or below the test average.The 0-9 ratings indicate a genotype's response to disease or lodging where 0 = highly resistant and 9 = highly susceptible.
84

LineUSG 3228 42.9 + 48.4 93MBX 17-P-275 41.6 + 48.5 86USG 3197 41.0 + 46.0 88Dyna-Gro 9750 37.3 + 48.7 84DH12SRW057-081 34.6 + 50.3 + 86VA09MAS2-131-6-2 33.6 + 48.0 94MAS #7 32.5 + 46.1 93AgriMAXX 463 31.7 + 49.0 + 85MBX 14-S-210 31.4 49.0 + 85AgriMAXX 480 31.3 48.9 + 89Pioneer 26R36 31.0 48.4 88MAS #116 30.9 50.5 + 67AgriMAXX Exp 1892 30.7 51.5 + 88SY Viper 30.3 46.2 85USG 3316 30.3 50.0 + 69AgriMAXX Exp 1874 30.1 45.4 87Dyna-Gro 9772 30.0 46.6 80DH13SRW025-14 29.9 49.3 + 85Dyna-Gro 9862 29.5 46.5 79MAS #86 29.4 47.3 83Armor ARW1719 29.4 46.2 74AgriMAXX 474 29.3 45.5 91WX17775 28.8 48.0 86AgriMAXX 485 28.7 47.4 90VA16W-31 28.5 46.8 89AgriMAXX 473 28.5 48.3 78MAS #316 28.3 47.8 91Dyna-Gro 9701 28.3 50.0 + 83Luisa 28.3 48.8 90Dyna-Gro 9600 28.2 45.2 85DH12SRW056-058 27.7 48.6 81#Turbo 27.7 47.5 79USG 3458 27.5 43.7 - 88Armor ARW1716 27.5 50.3 + 7513VTK434-89 27.3 47.5 89VA13W-174 27.1 48.2 83MAS #84 27.1 48.1 95MAS #65 27.0 45.2 86MAS #61 26.8 45.9 81TWS2818 26.8 47.7 83Armor Riptide 26.8 45.5 65
(Bu/a) (Lb/bu) (%)
Table 36. Summary of performance of entries in the Virginia Tech Wheat Test, Shenandoah Valley in Rockingham County, VA, 2018 harvest.
Grain TestYield Weight Cover
85
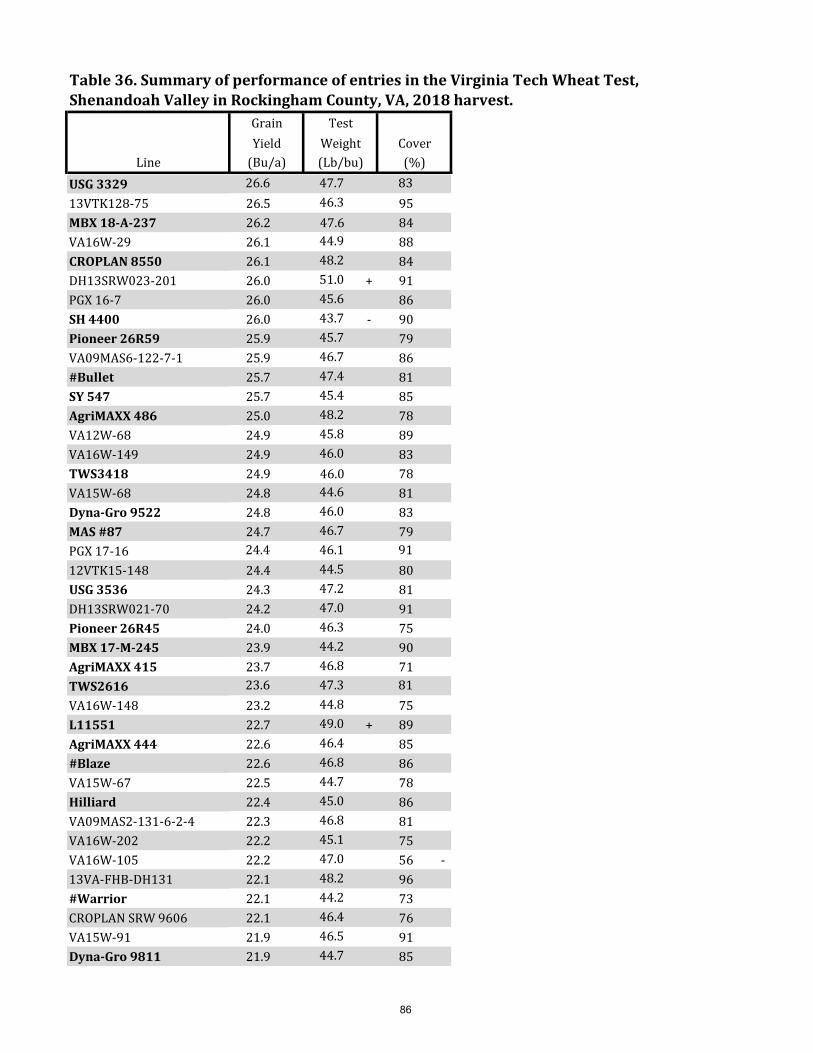
Line (Bu/a) (Lb/bu) (%)
Table 36. Summary of performance of entries in the Virginia Tech Wheat Test, Shenandoah Valley in Rockingham County, VA, 2018 harvest.
Grain TestYield Weight Cover
USG 3329 26.6 47.7 8313VTK128-75 26.5 46.3 95MBX 18-A-237 26.2 47.6 84VA16W-29 26.1 44.9 88CROPLAN 8550 26.1 48.2 84DH13SRW023-201 26.0 51.0 + 91PGX 16-7 26.0 45.6 86SH 4400 26.0 43.7 - 90Pioneer 26R59 25.9 45.7 79VA09MAS6-122-7-1 25.9 46.7 86#Bullet 25.7 47.4 81SY 547 25.7 45.4 85AgriMAXX 486 25.0 48.2 78VA12W-68 24.9 45.8 89VA16W-149 24.9 46.0 83TWS3418 24.9 46.0 78VA15W-68 24.8 44.6 81Dyna-Gro 9522 24.8 46.0 83MAS #87 24.7 46.7 79PGX 17-16 24.4 46.1 9112VTK15-148 24.4 44.5 80USG 3536 24.3 47.2 81DH13SRW021-70 24.2 47.0 91Pioneer 26R45 24.0 46.3 75MBX 17-M-245 23.9 44.2 90AgriMAXX 415 23.7 46.8 71TWS2616 23.6 47.3 81VA16W-148 23.2 44.8 75L11551 22.7 49.0 + 89AgriMAXX 444 22.6 46.4 85#Blaze 22.6 46.8 86VA15W-67 22.5 44.7 78Hilliard 22.4 45.0 86VA09MAS2-131-6-2-4 22.3 46.8 81VA16W-202 22.2 45.1 75VA16W-105 22.2 47.0 56 -13VA-FHB-DH131 22.1 48.2 96#Warrior 22.1 44.2 73CROPLAN SRW 9606 22.1 46.4 76VA15W-91 21.9 46.5 91Dyna-Gro 9811 21.9 44.7 85
86

Line (Bu/a) (Lb/bu) (%)
Table 36. Summary of performance of entries in the Virginia Tech Wheat Test, Shenandoah Valley in Rockingham County, VA, 2018 harvest.
Grain TestYield Weight Cover
SH 4300 21.7 46.1 84Armor Mayhem 21.4 47.8 68DH13SRW021-80 20.9 46.5 80PGX 17-20 20.5 48.7 70USG 3118 20.5 44.7 84SH 7200 20.4 43.9 - 9613VTK59-148 20.4 46.9 76VA16W-124 20.1 48.2 81Featherstone 73 20.1 46.1 8615MDX20 20.1 46.3 79VA15W-130 19.9 43.2 - 89CROPLAN SRW 9415 19.8 46.1 83NC13-21213 19.7 46.1 84#Boss 19.6 44.1 89VA16W-28 19.3 44.1 88VA15W-63 19.1 45.5 79USG 3429 19.0 49.2 + 89VA09MAS1-12-5-1-1 18.8 47.2 85VA15W-70 18.8 44.9 74Shirley 18.7 42.4 - 85VA16W-224 18.7 41.8 - 64USG 3404 18.6 45.2 76Armor ARW1762 18.6 44.2 7513VTK429-3 18.6 48.2 70L11719 17.9 46.5 90DH12SRW057-006 17.8 46.6 83Armor ARW1766 17.7 44.6 89VA09MAS1-12-5-1-3 17.6 48.0 91MAS #85 17.3 45.1 84VA16W-152 17.3 44.5 79NC14-23372 17.3 45.8 89Pioneer 26R41 17.3 44.7 73Pioneer 26R10 17.2 46.2 8513VTK82-51 17.1 45.4 8015MDX5 17.1 48.2 84USG 3895 16.9 44.9 79LCS Ammo 16.5 47.3 77VA15W-30 16.3 44.3 79VA12W-31 16.2 45.7 84AgriMAXX 446 16.2 45.7 80VA16W-196 15.9 45.7 68
87
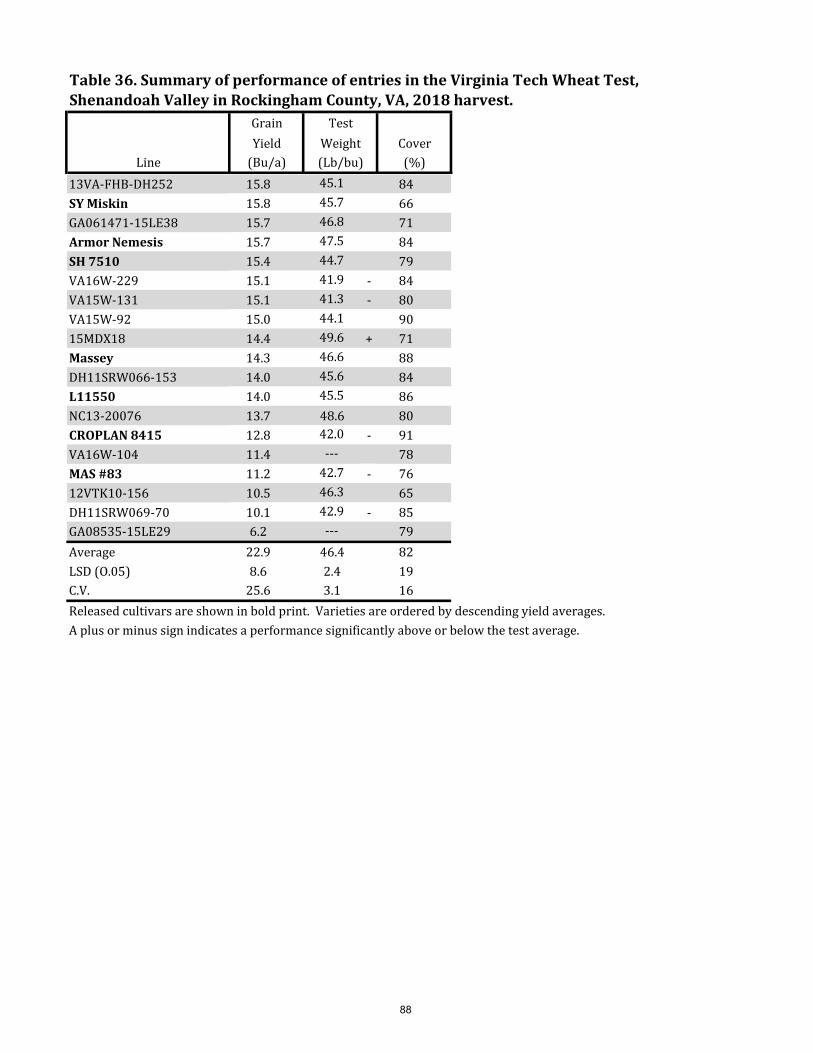
Line (Bu/a) (Lb/bu) (%)
Table 36. Summary of performance of entries in the Virginia Tech Wheat Test, Shenandoah Valley in Rockingham County, VA, 2018 harvest.
Grain TestYield Weight Cover
13VA-FHB-DH252 15.8 45.1 84SY Miskin 15.8 45.7 66GA061471-15LE38 15.7 46.8 71Armor Nemesis 15.7 47.5 84SH 7510 15.4 44.7 79VA16W-229 15.1 41.9 - 84VA15W-131 15.1 41.3 - 80VA15W-92 15.0 44.1 9015MDX18 14.4 49.6 + 71Massey 14.3 46.6 88DH11SRW066-153 14.0 45.6 84L11550 14.0 45.5 86NC13-20076 13.7 48.6 80CROPLAN 8415 12.8 42.0 - 91VA16W-104 11.4 --- 78MAS #83 11.2 42.7 - 7612VTK10-156 10.5 46.3 65DH11SRW069-70 10.1 42.9 - 85GA08535-15LE29 6.2 --- 79Average 22.9 46.4 82LSD (O.05) 8.6 2.4 19C.V. 25.6 3.1 16Released cultivars are shown in bold print. Varieties are ordered by descending yield averages.A plus or minus sign indicates a performance significantly above or below the test average.
88

Section 4: Milling and Baking Quality
Grain samples of 54 entries in Virginia’s 2017 State Wheat Test grown at Warsaw, VA were submitted to the USDA-ARS Soft Wheat Quality Lab in Wooster, OH for advanced milling and baking quality evaluations. Wheat cultivars and experimental lines (collectively referred to as “varieties” herein) are listed in Table 37 from highest to lowest T-scores for overall milling and baking quality. The soft red winter cultivar Shirley that has historically had good milling and pastry baking quality was used as the quality standard check and has an overall quality T-score of zero. Wheat cultivars or experimental lines with T-scores greater than zero have overall quality that is similar to or exceed that of Shirley, while those with T-scores less than zero have overall quality that is similar to or less than that of Shirley. Quality grades (A-F) were also assigned (see Tables below) for flour yield (a key indicator of milling quality) and cookie diameter (a key indicator of pastry baking quality) as varieties having good milling quality may or may not have good baking quality and vice versa.
Adjusted Flour Yield Grade (Based on Samples between 2009 and 2016)
Grade Range Percent A >70.78 15 B 69.64 to 70.78 20 C 68.15 to 69.63 30 D 66.75 to 68.14 20 F <66.75 15
Cookie Diameter (Based on Samples Between 2009 and 2016)
Grade Range Percent A >19.24 15 B 18.82 to 19.24 20 C 18.32 to 18.82 30 D 17.87 to 18.32 20 F <17.87 15
89
Additional Information on Quality Analysis
Of the quality characteristics measured at the Soft Wheat Quality Laboratory, flour milling yield is the most reproducible and perhaps most important because it is genetically and environmentally associated with good soft wheat flour quality. Flour yields of the 54 varieties ranged from 66.5% to 72.7% and 32 varieties had flour yields and grades (A-B) that were similar to or higher than that of Shirley (70.3%) the quality standard check (Table 30).
After flour yield, the second quality trait that we recommend for use in selection is softness equivalent. It tends to have high heritability and is an important predictor of milling break flour yield. Overall varieties had higher softness equivalence scores in 2017 (49.1 to 62.5) than in 2016 (43.6% to 60.0%). Higher values are preferred for most soft wheat manufactured goods, particularly cakes and other high sugar baked products. Softness equivalence scores of 26 varieties were similar to or higher than that of Shirley (55.5%).
Flour protein concentration of Shirley was 8.8% and the 54 varieties ranged from 7.6% to 10.2%. Gluten strength is measured as lactic acid Solvent Retention Capacity (SRC) and is also correlated to flour protein concentration, but the effect is dependent on variety and growing conditions. Weaker gluten strength is desired for most pastry products, such as cookies and cakes, while stronger gluten strength is desired in production of crackers and some bread type products. Lactic acid SRC values of seven varieties including Shirley (96.5%) were less than 100%, while the remaining 47 varieties had values ranging from 100% to 154% with a test average of 114%.
Pastry baking quality was assessed via measurement of sugar cookie spread diameter, which ranged from 17.4 to 18.9 cm with a test average of 18.0 cm that was 0.5 cm larger than that of varieties evaluated in 2016. Twenty-four of the 54 varieties had cookie spread diameters similar to or higher than that of Shirley (18.1 cm). Twenty-eight varieties had overall quality T-scores (0.04 to 1.31) that were similar to or higher than that of Shirley.
90
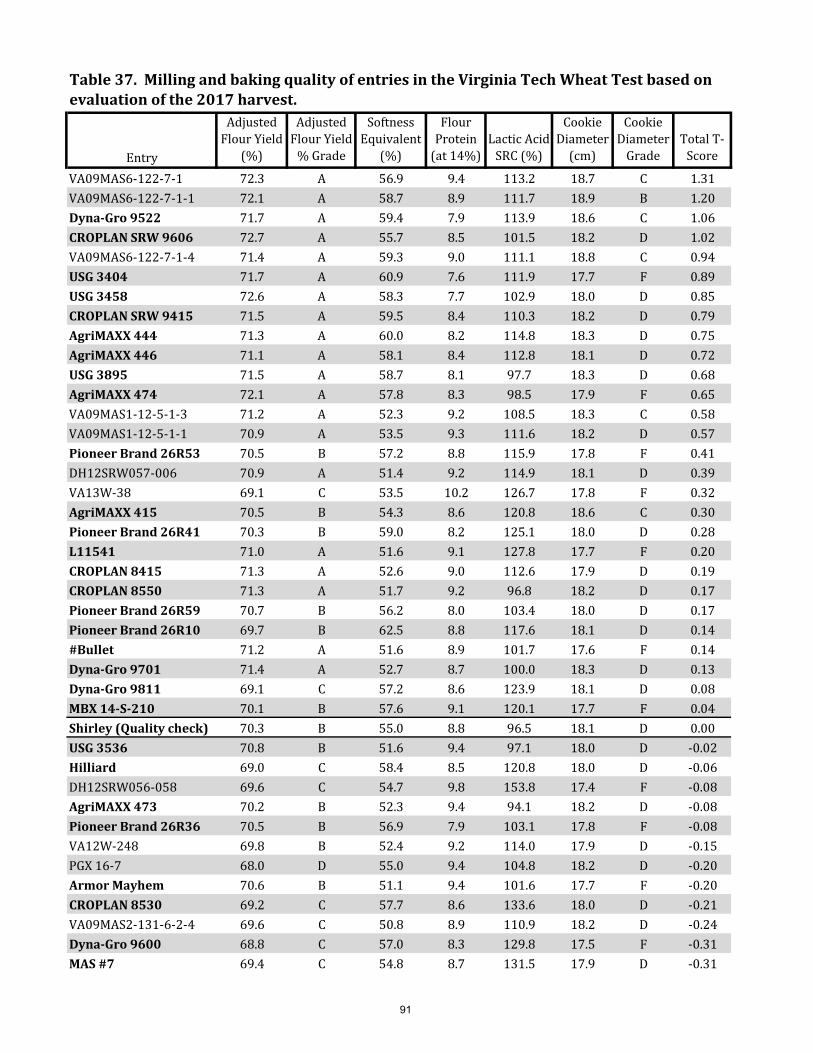
Entry
Adjusted Flour Yield
(%)
Adjusted Flour Yield
% Grade
SoftnessEquivalent
(%)
FlourProtein
(at 14%)Lactic Acid
SRC (%)
CookieDiameter
(cm)
CookieDiameter
GradeTotal T-
Score
VA09MAS6-122-7-1 72.3 A 56.9 9.4 113.2 18.7 C 1.31VA09MAS6-122-7-1-1 72.1 A 58.7 8.9 111.7 18.9 B 1.20Dyna-Gro 9522 71.7 A 59.4 7.9 113.9 18.6 C 1.06CROPLAN SRW 9606 72.7 A 55.7 8.5 101.5 18.2 D 1.02VA09MAS6-122-7-1-4 71.4 A 59.3 9.0 111.1 18.8 C 0.94USG 3404 71.7 A 60.9 7.6 111.9 17.7 F 0.89USG 3458 72.6 A 58.3 7.7 102.9 18.0 D 0.85CROPLAN SRW 9415 71.5 A 59.5 8.4 110.3 18.2 D 0.79AgriMAXX 444 71.3 A 60.0 8.2 114.8 18.3 D 0.75AgriMAXX 446 71.1 A 58.1 8.4 112.8 18.1 D 0.72USG 3895 71.5 A 58.7 8.1 97.7 18.3 D 0.68AgriMAXX 474 72.1 A 57.8 8.3 98.5 17.9 F 0.65VA09MAS1-12-5-1-3 71.2 A 52.3 9.2 108.5 18.3 C 0.58VA09MAS1-12-5-1-1 70.9 A 53.5 9.3 111.6 18.2 D 0.57Pioneer Brand 26R53 70.5 B 57.2 8.8 115.9 17.8 F 0.41DH12SRW057-006 70.9 A 51.4 9.2 114.9 18.1 D 0.39VA13W-38 69.1 C 53.5 10.2 126.7 17.8 F 0.32AgriMAXX 415 70.5 B 54.3 8.6 120.8 18.6 C 0.30Pioneer Brand 26R41 70.3 B 59.0 8.2 125.1 18.0 D 0.28L11541 71.0 A 51.6 9.1 127.8 17.7 F 0.20CROPLAN 8415 71.3 A 52.6 9.0 112.6 17.9 D 0.19CROPLAN 8550 71.3 A 51.7 9.2 96.8 18.2 D 0.17Pioneer Brand 26R59 70.7 B 56.2 8.0 103.4 18.0 D 0.17Pioneer Brand 26R10 69.7 B 62.5 8.8 117.6 18.1 D 0.14#Bullet 71.2 A 51.6 8.9 101.7 17.6 F 0.14Dyna-Gro 9701 71.4 A 52.7 8.7 100.0 18.3 D 0.13Dyna-Gro 9811 69.1 C 57.2 8.6 123.9 18.1 D 0.08MBX 14-S-210 70.1 B 57.6 9.1 120.1 17.7 F 0.04Shirley (Quality check) 70.3 B 55.0 8.8 96.5 18.1 D 0.00USG 3536 70.8 B 51.6 9.4 97.1 18.0 D -0.02Hilliard 69.0 C 58.4 8.5 120.8 18.0 D -0.06DH12SRW056-058 69.6 C 54.7 9.8 153.8 17.4 F -0.08AgriMAXX 473 70.2 B 52.3 9.4 94.1 18.2 D -0.08Pioneer Brand 26R36 70.5 B 56.9 7.9 103.1 17.8 F -0.08VA12W-248 69.8 B 52.4 9.2 114.0 17.9 D -0.15PGX 16-7 68.0 D 55.0 9.4 104.8 18.2 D -0.20Armor Mayhem 70.6 B 51.1 9.4 101.6 17.7 F -0.20CROPLAN 8530 69.2 C 57.7 8.6 133.6 18.0 D -0.21VA09MAS2-131-6-2-4 69.6 C 50.8 8.9 110.9 18.2 D -0.24Dyna-Gro 9600 68.8 C 57.0 8.3 129.8 17.5 F -0.31MAS #7 69.4 C 54.8 8.7 131.5 17.9 D -0.31
Table 37. Milling and baking quality of entries in the Virginia Tech Wheat Test based on evaluation of the 2017 harvest.
91

Entry
Adjusted Flour Yield
(%)
Adjusted Flour Yield
% Grade
SoftnessEquivalent
(%)
FlourProtein
(at 14%)Lactic Acid
SRC (%)
CookieDiameter
(cm)
CookieDiameter
GradeTotal T-
Score
Table 37. Milling and baking quality of entries in the Virginia Tech Wheat Test based on evaluation of the 2017 harvest.
L11550 68.5 C 55.5 8.9 109.0 18.0 D -0.32DH11SRW069-70 68.1 D 59.3 8.5 107.2 17.7 F -0.35VA15W-63 69.8 B 49.1 8.8 91.6 18.4 C -0.38VA09MAS2-131-6-2 68.5 C 51.0 9.4 116.1 18.0 D -0.52USG 3118 68.6 C 51.6 10.2 125.6 17.6 F -0.53VA12W-68 66.9 D 54.6 10.2 105.3 17.9 D -0.63VA13W-174 67.8 D 52.6 10.0 121.3 17.5 F -0.64VA12W-31 67.5 D 53.8 8.7 129.7 18.4 C -0.68SY Viper 67.6 D 56.8 8.6 104.4 17.7 F -0.78MAS #61 68.3 C 53.6 8.2 126.1 17.9 D -0.88USG 3197 67.1 D 54.1 8.2 129.7 17.5 F -1.48AgriMAXX 464 66.5 F 54.4 8.2 129.7 17.6 F -1.75Dyna-Gro 9772 66.6 F 53.8 7.8 119.9 18.4 C -2.05Mean (N=54) 70.0 55.3 8.8 113.6 18.0Standard Deviation 1.6 3.1 0.6 12.3 0.3
Varieties are ordered by descending Total T-Score.* Total T-Score = Sum of (0.15 x Test Weight), (-0.1 x SKCS Kernel Hardness), (0.4 x Flour Yield),(0.15 x Softness Equivalent) and (-0.2 x Sodium Carbonate SRC)
92

Section 5: Wheat Scab Research
One of the primary research objectives of the Virginia Tech wheat breeding program is to identify and develop cultivars possessing resistance to Fusarium Head Blight (FHB) or scab. In 2018, all wheat entries in Virginia’s Official State Variety Trials were evaluated for FHB resistance in an inoculated, irrigated nursery at the Virginia Crop Improvement Association (VCIA) test site in Mt. Holly, VA. Data from this test for the current crop year and two-year average for FHB incidence, FHB severity and FHB Index (incidence x severity/100) are included in this bulletin (Tables 38-39) to aid producers in selection of cultivars on the basis of FHB resistance. Cultivars possessing complete resistance or immunity to FHB have not been identified and resistance levels in currently available cultivars vary from moderately resistant to highly susceptible.
A major goal of the breeding program is to identify and incorporate unique and complementary types of FHB resistance into cultivars to enhance the overall level of resistance. Genes controlling FHB resistance have been identified on more than six chromosomes in wheat and some of these genes are complementary in nature and effect different disease resistance components such as FHB incidence, severity, and DON toxin content. Incorporating such multiple resistance genes having additive effects on FHB resistance into cultivars will enhance the overall level of resistance. Because the individual resistance genes are located on different wheat chromosomes and each gene confers only partial resistance to FHB, identifying wheat lines having multiple resistance genes is difficult using traditional breeding techniques. To overcome this limitation, our program is currently identifying and using DNA markers located close to these resistance genes on the same chromosome as “tags” for selecting wheat lines possessing different combinations of these complementary resistance genes.
In 2018, entries were inoculated by spreading scabby corn kernels (50g/4-rows) in plots at the booting stage. A moderately high level of FHB infection was obtained in 2018 as rising temperatures and heavy rainfall during flowering, the most critical time for scab infection.
Among 142 lines and varieties tested in 2018, the FHB index varied from 10.9% to 79% while FHB incidence ranged from 67.5% to 100% and FHB severity ranged from 16.3% to 79% (Table 38). Seventy-six lines and varieties had FHB index values lower than the mean (<45.3) and expressed moderate resistance to FHB in 2018. Based on two-year mean data for 2017 and 2018 (Table 39), four lines and 31 varieties had FHB index values lower than the test mean (<29.5).
93

Line
USG 3228 67.5 - 16.3 - 10.9 - 125.5 6.5 +MBX 17-P-275 60.0 - 19.8 - 12.0 - 126.0 7.0 +USG 3197 72.5 - 24.3 - 17.6 - 127.0 3.5AgriMAXX 463 67.5 - 26.5 - 18.1 - 126.5 6.5 +L11551 75.0 - 24.0 - 18.1 - 126.5 4.5MAS #86 77.5 - 24.8 - 18.8 - 127.5 3.5Dyna-Gro 9772 75.0 - 27.3 - 20.4 - 126.3 5.013VTK434-89 70.0 - 30.5 20.7 - 126.5 1.0 -NC13-20076 85.0 25.8 - 21.9 - 127.0 3.0Armor ARW1716 82.5 27.3 - 23.2 127.3 4.0MBX 14-S-210 97.5 26.3 - 25.5 128.5 7.5 +USG 3316 82.5 30.8 25.5 128.0 7.5 +15MDX5 82.5 31.8 26.4 125.3 2.5AgriMAXX 444 90.0 29.8 26.6 129.0 4.0LCS Ammo 92.5 29.5 27.5 127.8 4.5Hilliard 82.5 34.3 28.2 126.0 2.0DH13SRW025-14 90.0 32.0 28.7 124.0 - 3.0USG 3329 85.0 33.5 29.1 126.5 3.0Armor ARW1762 87.5 33.5 29.5 128.5 5.5AgriMAXX Exp 1892 85.0 35.0 29.9 127.3 3.5#Blaze 95.0 31.5 30.0 127.5 4.0DH13SRW021-70 85.0 35.5 30.2 126.0 4.5AgriMAXX 485 90.0 34.5 31.1 129.0 6.0AgriMAXX 415 92.5 33.8 31.4 126.0 4.5PGX 17-16 85.0 37.5 31.8 128.8 2.0VA16W-105 80.0 - 41.3 32.9 127.0 3.015MDX20 87.5 38.0 33.3 127.0 4.0DH13SRW023-201 90.0 38.3 34.5 128.0 0.0 -Dyna-Gro 9750 85.0 41.0 34.5 126.5 6.5 +Armor ARW1719 100.0 34.8 34.8 128.3 5.5PGX 17-20 90.0 38.8 34.9 128.0 4.5AgriMAXX 486 95.0 36.5 35.1 128.5 4.0Massey 92.5 38.5 35.5 128.5 2.5SY 547 87.5 40.8 35.9 125.0 2.5MAS #87 100.0 36.0 36.0 129.0 4.5#Turbo 92.5 40.5 37.3 127.5 3.0MAS #61 90.0 41.3 37.5 126.5 4.5USG 3404 90.0 41.8 37.6 128.3 4.5TWS2616 92.5 40.8 37.7 125.0 5.5SH 4300 90.0 42.3 38.1 126.3 6.0VA16W-148 92.5 41.3 38.2 127.8 2.5
Powdery Mildew
(0-9)
Table 38. Summary of reaction of entries in the Virginia Tech State Wheat Test to Fusarium head blight (scab) and glume blotch resistance, 2018 harvest.
FHB Incidence1
(%)
FHB Severity2
(%)
FHB Index3
(0-100)Flowering Date
(Julian)
94

Line
Powdery Mildew
(0-9)
Table 38. Summary of reaction of entries in the Virginia Tech State Wheat Test to Fusarium head blight (scab) and glume blotch resistance, 2018 harvest.
FHB Incidence1
(%)
FHB Severity2
(%)
FHB Index3
(0-100)Flowering Date
(Julian)
Pioneer 26R36 87.5 42.3 38.2 126.5 7.0 +13VTK59-148 92.5 41.8 38.5 127.0 4.0VA09MAS6-122-7-1 85.0 45.0 38.7 127.0 2.5DH11SRW066-153 92.5 42.5 39.2 127.0 2.5Dyna-Gro 9522 90.0 41.8 39.3 128.5 5.5Luisa 90.0 43.8 39.3 126.5 1.0 -DH12SRW056-058 87.5 44.8 39.5 127.0 4.0Dyna-Gro 9811 95.0 42.3 39.7 124.0 - 2.0AgriMAXX 473 97.5 41.0 39.9 129.0 2.5L11550 95.0 41.5 39.9 128.0 4.5VA16W-202 90.0 44.0 40.0 126.0 1.0 -#Boss 95.0 41.8 40.1 126.3 5.0VA12W-68 95.0 42.0 40.2 124.5 - 3.0Pioneer 26R10 92.5 43.3 40.3 127.0 7.0 +Dyna-Gro 9600 92.5 43.8 41.1 126.0 2.0WX17775 100.0 41.3 41.3 129.0 5.0NC14-23372 95.0 44.3 42.1 129.0 0.0 -13VTK82-51 95.0 44.8 42.2 127.0 3.013VA-FHB-DH252 87.5 49.0 42.6 129.5 4.0Pioneer 26R45 97.5 43.5 42.7 127.5 4.5Pioneer 26R41 95.0 45.3 42.8 127.0 3.5SY Miskin 87.5 49.8 43.5 125.0 6.0VA16W-152 95.0 46.3 43.7 125.8 4.0Dyna-Gro 9701 95.0 45.5 43.7 127.5 2.5AgriMAXX 480 95.0 45.8 43.9 123.0 - 2.5SH 7510 87.5 49.3 43.9 129.0 5.0VA13W-174 92.5 47.5 44.0 124.3 - 1.5CROPLAN 8550 95.0 46.0 44.0 129.0 2.0MAS #7 92.5 48.0 44.0 129.3 3.0VA16W-196 97.5 45.3 44.1 127.3 4.0VA09MAS2-131-6-2-4 95.0 46.5 44.5 126.0 3.0VA16W-28 92.5 48.5 44.7 128.5 1.5DH12SRW057-081 90.0 49.8 44.8 127.3 6.013VTK429-3 92.5 48.5 45.2 127.5 2.0MAS #83 97.5 46.3 45.2 127.5 4.513VA-FHB-DH131 97.5 46.5 45.4 128.3 6.0Dyna-Gro 9862 95.0 48.0 46.0 130.0 + 5.5USG 3429 97.5 46.8 46.0 127.8 7.0 +12VTK10-156 92.5 50.5 46.8 127.0 5.0TWS3418 95.0 48.8 46.8 129.5 5.0#Bullet 97.5 48.0 46.8 129.8 + 2.0
95
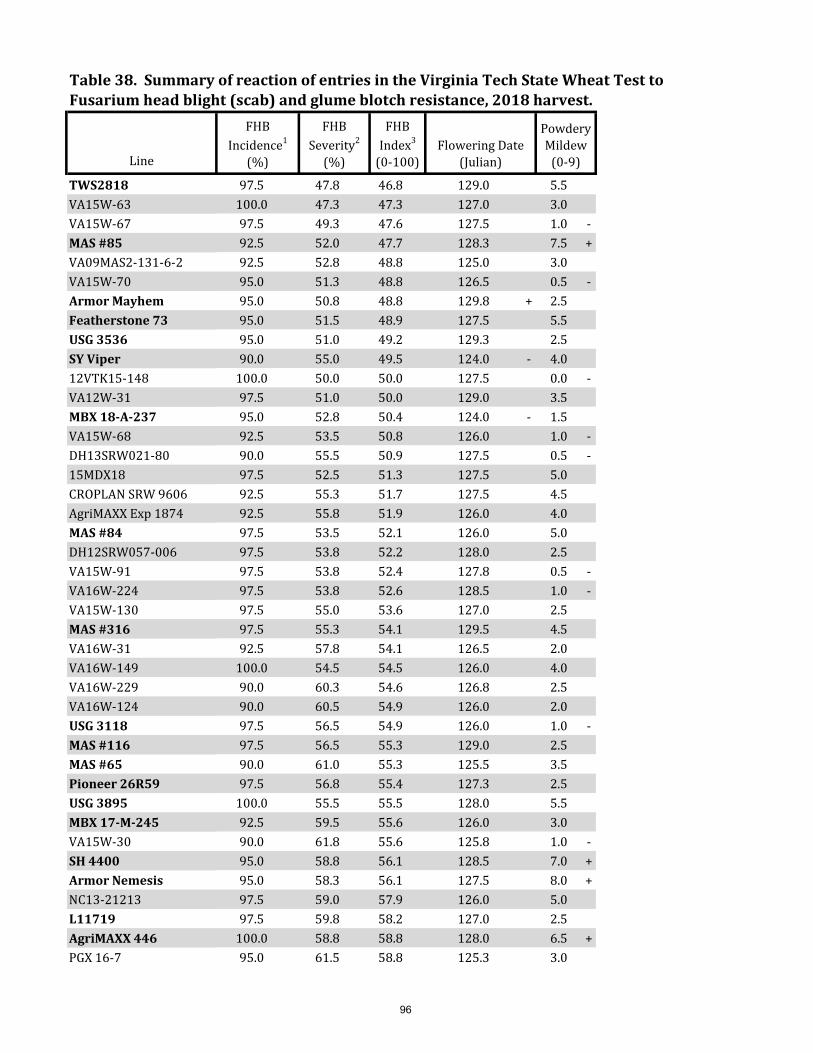
Line
Powdery Mildew
(0-9)
Table 38. Summary of reaction of entries in the Virginia Tech State Wheat Test to Fusarium head blight (scab) and glume blotch resistance, 2018 harvest.
FHB Incidence1
(%)
FHB Severity2
(%)
FHB Index3
(0-100)Flowering Date
(Julian)
TWS2818 97.5 47.8 46.8 129.0 5.5VA15W-63 100.0 47.3 47.3 127.0 3.0VA15W-67 97.5 49.3 47.6 127.5 1.0 -MAS #85 92.5 52.0 47.7 128.3 7.5 +VA09MAS2-131-6-2 92.5 52.8 48.8 125.0 3.0VA15W-70 95.0 51.3 48.8 126.5 0.5 -Armor Mayhem 95.0 50.8 48.8 129.8 + 2.5Featherstone 73 95.0 51.5 48.9 127.5 5.5USG 3536 95.0 51.0 49.2 129.3 2.5SY Viper 90.0 55.0 49.5 124.0 - 4.012VTK15-148 100.0 50.0 50.0 127.5 0.0 -VA12W-31 97.5 51.0 50.0 129.0 3.5MBX 18-A-237 95.0 52.8 50.4 124.0 - 1.5VA15W-68 92.5 53.5 50.8 126.0 1.0 -DH13SRW021-80 90.0 55.5 50.9 127.5 0.5 -15MDX18 97.5 52.5 51.3 127.5 5.0CROPLAN SRW 9606 92.5 55.3 51.7 127.5 4.5AgriMAXX Exp 1874 92.5 55.8 51.9 126.0 4.0MAS #84 97.5 53.5 52.1 126.0 5.0DH12SRW057-006 97.5 53.8 52.2 128.0 2.5VA15W-91 97.5 53.8 52.4 127.8 0.5 -VA16W-224 97.5 53.8 52.6 128.5 1.0 -VA15W-130 97.5 55.0 53.6 127.0 2.5MAS #316 97.5 55.3 54.1 129.5 4.5VA16W-31 92.5 57.8 54.1 126.5 2.0VA16W-149 100.0 54.5 54.5 126.0 4.0VA16W-229 90.0 60.3 54.6 126.8 2.5VA16W-124 90.0 60.5 54.9 126.0 2.0USG 3118 97.5 56.5 54.9 126.0 1.0 -MAS #116 97.5 56.5 55.3 129.0 2.5MAS #65 90.0 61.0 55.3 125.5 3.5Pioneer 26R59 97.5 56.8 55.4 127.3 2.5USG 3895 100.0 55.5 55.5 128.0 5.5MBX 17-M-245 92.5 59.5 55.6 126.0 3.0VA15W-30 90.0 61.8 55.6 125.8 1.0 -SH 4400 95.0 58.8 56.1 128.5 7.0 +Armor Nemesis 95.0 58.3 56.1 127.5 8.0 +NC13-21213 97.5 59.0 57.9 126.0 5.0L11719 97.5 59.8 58.2 127.0 2.5AgriMAXX 446 100.0 58.8 58.8 128.0 6.5 +PGX 16-7 95.0 61.5 58.8 125.3 3.0
96

Line
Powdery Mildew
(0-9)
Table 38. Summary of reaction of entries in the Virginia Tech State Wheat Test to Fusarium head blight (scab) and glume blotch resistance, 2018 harvest.
FHB Incidence1
(%)
FHB Severity2
(%)
FHB Index3
(0-100)Flowering Date
(Julian)
Shirley 95.0 61.8 58.9 127.0 0.0 -VA09MAS1-12-5-1-1 100.0 59.3 59.3 127.0 6.0Armor Riptide 95.0 62.5 59.6 127.8 3.0GA08535-15LE29 100.0 61.0 61.0 128.5 2.0SH 7200 97.5 63.5 62.1 125.3 3.5VA09MAS1-12-5-1-3 100.0 62.5 62.5 127.0 2.5VA16W-29 100.0 63.3 63.3 128.0 0.5 -AgriMAXX 474 100.0 63.5 63.5 127.3 3.5#Warrior 95.0 68.3 65.0 126.0 2.5CROPLAN SRW 9415 100.0 68.3 68.3 129.0 6.0DH11SRW069-70 100.0 68.5 68.5 129.8 + 3.0VA15W-92 100.0 69.3 69.3 + 127.5 2.0CROPLAN 8415 100.0 69.3 69.3 + 126.3 5.0USG 3458 97.5 72.0 + 70.2 + 125.5 3.5GA061471-15LE38 100.0 70.3 + 70.3 + 128.0 3.5VA16W-104 100.0 73.3 + 73.3 + 128.8 2.0Armor ARW1766 100.0 73.8 + 73.8 + 126.5 2.513VTK128-75 100.0 76.5 + 76.5 + 126.5 5.5VA15W-131 100.0 79.0 + 79.0 + 127.8 4.5Average 92.5 48.1 45.3 127.1 3.7LSD (O.05) 100.7 322.3 37.4 1.3 50.0C.V. 12.9 21.5 23.5 2.2 2.5Released cultivars are shown in bold print. Varieties are ordered by ascending index averages.A plus or minus sign indicates a performance significantly above or below the average.Entries were planted in 2-row plots, 4ft in length at Mt. Holly, VA and were inoculated at booting stage with scabby corn kernels (50g/4-rows). Scab Incidence (0-10): Based on infected spikes within 4 ft row. Scab Severity (0-10): Based on infected spikelets in 10 spikes showing disease symptoms.FHB Index=(Incidence*10) x (Severity*10)/100; it is an overall indicator of scab resistance/susceptibility level.
97

Line
USG 3228 52.5 - 11.8 - 6.9 - 116.5 24.0 23.0 -MBX 17-P-275 51.3 - 13.3 - 7.5 - 116.5 25.5 25.0 -AgriMAXX 463 57.5 - 16.8 - 10.8 - 116.5 20.5 24.6 -USG 3197 58.8 - 17.4 - 11.3 - 117.3 36.5 31.3Dyna-Gro 9772 51.3 - 22.1 - 12.6 - 116.3 21.5 21.9 -USG 3316 68.8 24.0 17.4 - 118.3 18.5 29.1#Blaze 78.8 21.9 - 18.8 117.8 27.5 33.4MBX 14-S-210 73.1 24.9 19.0 119.5 + 26.5 32.3AgriMAXX 444 68.8 26.8 19.0 120.0 + 27.5 32.4Dyna-Gro 9750 70.0 25.0 19.7 116.5 25.5 29.4Massey 68.8 28.4 21.6 117.5 36.5 33.6MAS #61 63.8 - 28.0 21.6 117.0 23.5 25.1 -SY 547 68.8 28.4 21.9 116.5 28.5 31.2AgriMAXX 473 75.0 24.9 22.3 118.5 25.0 28.4SH 4300 66.9 28.5 22.3 117.8 27.0 28.4VA12W-68 68.8 27.2 22.7 113.8 - 20.0 24.5 -Dyna-Gro 9600 70.0 27.5 22.9 116.3 28.5 29.0Pioneer 26R36 72.5 28.0 23.2 118.0 31.0 33.8Hilliard 66.3 35.0 23.2 116.5 30.5 37.9AgriMAXX 415 75.6 29.7 23.5 117.0 25.5 35.5VA09MAS6-122-7-1 66.3 31.3 23.6 115.0 - 18.0 26.7USG 3404 70.6 31.2 23.9 120.0 + 24.0 31.2#Turbo 71.9 31.4 24.3 116.3 24.5 31.8VA13W-174 71.3 28.9 24.6 114.5 - 23.5 27.5Dyna-Gro 9522 69.4 31.2 24.8 119.8 + 24.5 30.6Dyna-Gro 9701 76.3 28.6 25.2 117.8 27.0 31.6CROPLAN 8550 76.3 28.7 25.3 119.8 + 21.0 29.1Pioneer 26R45 73.1 29.8 25.3 117.8 24.5 29.3VA09MAS2-131-6-2-4 71.3 29.7 25.4 115.3 - 27.0 28.9#Bullet 74.4 28.4 25.7 119.3 + 31.0 30.4Dyna-Gro 9862 69.4 30.7 25.8 120.5 + 23.0 26.3DH12SRW056-058 70.6 34.7 26.6 117.5 26.5 34.1#Boss 71.3 35.1 26.8 116.5 25.5 33.0USG 3536 75.0 31.0 27.5 119.5 + 24.0 29.4Armor Mayhem 77.5 30.6 27.6 119.5 + 19.0 28.7MAS #7 76.3 33.9 27.9 120.3 + 23.0 33.1Pioneer 26R10 73.1 38.0 29.0 118.3 25.5 36.2MAS #316 78.1 32.5 29.9 120.3 + 20.5 28.7MAS #116 74.4 33.3 30.2 118.5 23.5 27.8SH 4400 84.4 + 33.0 30.8 112.3 - 30.0 36.3SH 7510 73.1 41.2 31.5 118.8 27.0 38.3Dyna-Gro 9811 73.8 44.7 32.0 115.5 - 27.0 40.7
Table 39. Summary of reaction of entries in the Virginia Tech State Wheat Test to Fusarium head blight (scab) and glume blotch resistance, 2018 harvest.
ISK5 (0-100)
FHB Incidence1
(%)
FHB Severity2
(%)
FHB Index3
(0-100)
Flowering Date
(Julian) FDK4 (%)
98

Line
Table 39. Summary of reaction of entries in the Virginia Tech State Wheat Test to Fusarium head blight (scab) and glume blotch resistance, 2018 harvest.
ISK5 (0-100)
FHB Incidence1
(%)
FHB Severity2
(%)
FHB Index3
(0-100)
Flowering Date
(Julian) FDK4 (%)
PGX 16-7 66.3 38.9 32.5 114.5 - 24.0 25.8Featherstone 73 76.9 41.1 33.5 118.3 16.0 33.2USG 3118 76.3 40.4 34.1 113.3 - 32.5 36.8VA15W-63 85.6 + 38.6 34.3 117.3 30.5 42.6Armor Nemesis 80.0 39.4 34.7 117.8 28.5 37.1VA09MAS2-131-6-2 76.9 42.9 35.1 115.3 - 19.5 36.1CROPLAN SRW 9606 78.8 41.8 35.1 118.0 26.0 38.4DH12SRW057-006 78.8 42.6 35.4 117.8 29.5 39.3USG 3895 79.4 42.2 36.1 117.5 38.0 41.5L11550 80.6 45.3 36.3 118.0 26.0 45.0 +Pioneer 26R41 78.1 48.4 37.3 118.0 27.0 44.6 +AgriMAXX 446 77.5 44.0 37.8 119.0 + 33.5 38.7Pioneer 26R59 78.8 45.8 37.9 117.3 29.5 40.3MBX 17-M-245 81.3 44.6 38.0 117.0 23.5 39.3SY Viper 70.6 56.0 + 39.3 115.3 - 18.5 39.9VA12W-31 85.6 + 46.0 40.1 118.3 36.0 48.8 +CROPLAN SRW 9415 80.0 43.8 40.2 119.8 + 26.0 34.2VA09MAS1-12-5-1-1 80.0 49.2 + 41.3 118.3 26.0 40.1AgriMAXX 474 85.6 + 45.5 41.7 118.0 29.5 41.5VA09MAS1-12-5-1-3 81.3 50.0 + 43.0 + 118.0 24.5 39.8NC13-21213 80.6 51.3 + 43.3 + 116.8 34.5 46.0 +Armor Riptide 80.6 52.2 + 43.5 + 117.8 16.0 38.8#Warrior 82.5 51.0 + 44.4 + 116.8 27.0 41.9USG 3458 80.6 50.8 + 44.6 + 117.0 21.5 36.6SH 7200 80.6 54.1 + 45.3 + 115.5 - 37.5 47.6 +Shirley 78.1 57.3 + 45.4 + 117.3 49.5 + 54.0 +DH11SRW069-70 75.0 57.1 + 45.8 + 120.3 + 28.0 39.9CROPLAN 8415 83.1 57.0 + 50.4 + 116.5 37.5 48.3 +Average 73.8 36.1 29.5 117.4 26.6 34.5LSD (O.05) 9.9 12.6 12.1 1.4 12.3 8.8C.V. 9.6 24.9 29.4 0.9 23.1 12.7Released cultivars are shown in bold print. Varieties are ordered by ascending index averages.A plus or minus sign indicates a performance significantly above or below the average.Entries were planted in 2-row plots, 4ft in length at Mt. Holly, VA and were inoculated at booting stage with scabby corn kernels (50g/4-rows). 1 Scab Incidence (0-10): Based on infected spikes within 4 ft row. 2 Scab Severity (0-10): Based on infected spikelets in 10 spikes showing disease symptoms.3 FHB Index=(Incidence*10) x (Severity*10)/100; it is an overall indicator of scab resistance/susceptibility level. 4 FDK (%): Fusarium damaged kernels, visual assessment of the percent of infected kernels. 5 ISK Index = 0.3 *(Severity) + 0.3 *(Incidence)+ 0.4 *(FDK); composite of head and kernel traits.6 DON (ppm): Concentration of vomitoxin (deoxynivalenol).
99