table of contents - lgnz · table of contents preface 2 ... your feedback to ensure we have...
TRANSCRIPT


Table of contents
Preface 2
Foreword 4
Key themes 6
Part 1 The funding discussion 9
Part 2 Local government functions, revenue and expenditure 13
Part 3 The diversity of local government 27
Part 4 A partnership approach 36
Part 5 Funding as a system 42
Part 6 Improving the current rating system 54
Part 7 Options for change: available tax bases 64
Part 8 Summary 76
Appendices
Appendix 1 Other areas where LGNZ is active 79
Appendix 2 LGFA 80

Local Government Funding Review 2
Preface
This Discussion Paper on the funding of local government in New Zealand was initiated, and is released for discussion, by the National Council of Local Government New Zealand.
A Working Group, drawn from a broad spectrum of sector interests, guided the development of this Discussion Paper. The members of the Working Group contributed their time generously, and the paper has benefited from their wisdom and experience. The views expressed in the paper are not necessarily the views of the individual members of the Working Group nor of their employing organisations.
The Working Group is:
Penny Webster (Chair) – Auckland Council
Michael Barnett – Auckland Regional Chamber of Commerce
Peter Bodeker – Otago Regional Council
Mark Butcher – New Zealand Local Government Funding Agency
Rob Cameron – Cameron Partners Ltd
Nick Clark – Federated Farmers of New Zealand
Adam Feeley – Queenstown Lakes District Council
Dr Oliver Hartwich – The New Zealand Initiative
Raf Manji – Christchurch City Council
Chris Ryan – Waitomo District Council
Professor Claudia Scott – Victoria University of Wellington
Stephen Selwood – New Zealand Council for Infrastructure Development
Phil Wilson – Auckland Council
The Working Group was supported by a secretariat from Local Government New Zealand, led by Malcolm Alexander and comprising Helen Mexted, Dr Mike Reid and Tom Simonson, with assistance from Kieran Murray and Anna Livesey of Sapere Research Group.
Feedback
Local Government New Zealand is seeking comment and feedback from individuals, groups and organisations across New Zealand, including central and local governments and the business and community sectors. We are keen to hear whether the key issues have been captured and we are highlighting the right options for further analysis.
Feedback should be sent to [email protected] before close of business, 27 March 2015.

3

Local Government Funding Review 4
Foreword
Local government is an important contributor to local economic success, but the right incentives and resources must be in place to enable local government to drive growth. The sustainability of local government funding has equally become a major question, as New Zealand faces rapid demographic and economic change.
In response, Local Government New Zealand (LGNZ) is undertaking this review of local government funding. This paper is intended to stimulate discussion about various funding opportunities and constraints in New Zealand, and is the first of a two step process. This stage outlines the extent of the demographic, economic and infrastructure challenges facing councils, and considers options and alternatives that can complement councils’ available funding tools and provide incentives to stimulate economic growth. It is important to note that the funding challenge is not limited to operational expenditure. There are also pressures on long term capital expenditure, where Auckland alone is anticipated to spend $10 to $15 billion over the next 30 years. The second stage of review will be to accumulate responses and incorporate the best ideas into a final paper that proposes a strategy and long-term, sustainable funding model.
The major difference in this paper compared to previous studies is that it has been commissioned by local government utilising a multi-sector Working Group. It is not a centrally imposed study. However, we do need a partnership with central government to deliver change.
This first paper identifies the key pressures which directly impact councils around New Zealand, make the cost of doing business more expensive and influence the sustainability of the local government funding system. These include:
Changing demographic and economic growth resulting in some councils being required to invest heavily in infrastructure to accommodate growth, while others are forced to maintain and renew infrastructure with declining populations and funding bases;
Increasing community and central government expectations; and
Increasing impacts from natural hazards and environmental challenges.
LGNZ is committed to delivering its vision where local government contributes to strong local economies and national success. Achieving excellence is not just a case of ensuring councils possess funding mechanisms that correspond appropriately to their functions. A broader approach is required, which involves increasing public understanding of local government services; a strong community mandate; efficient and effective performance of services; and strong partnerships with central government.
While funding is only part of the equation to strengthen quality of services, it is a fundamental element. We need your feedback to ensure we have captured the key issues and options before we consider the range of strategies to address those issues.
I look forward to your feedback.
Lawrence Yule President Local Government New Zealand

5

Local Government Funding Review 6
Key themes
This paper took shape over six working group meetings between July and December 2014. As the Working Group’s discussions evolved, it became clear that there were several key themes around which the conversations focussed. These themes arose from the robust discussion between the Working Group members on the current state of play, issues of concern and the potential opportunities arising from a change in the status quo. The themes are:
1. A need to develop an effective partnership between local government and central government around shared goals and strategies for the activities pursued by local government, and how those activities can be prudently funded over time.
In the Working Group’s view, a “principles-based” partnership between central and local government is essential in order to enhance and strengthen New Zealand’s democratic model. Such an approach would allow both arms of government to engage intelligently on the issues confronting New Zealand and, in turn, make joint decisions for the benefit of the country as a whole. This will provide an opportunity to move away from a regime that sees frequent tweaking of local government policy settings to a practice that incentivises, in the medium to long-term, the right outcomes sought by all.
2. Before pursuing fundamental changes to the funding regime, the local government sector needs to assure
communities that it is open to innovation in service delivery so as to build confidence over time in the quality of the spending decisions that it makes.
There is no free lunch. All activities and resources must be paid for, but the manner in which we address those needs must be fair, transparent and appropriate. Solutions to funding issues must be specific and must work within different environments, demographics and economies.
3. The diverse nature of New Zealand’s communities raises different challenges.
Communities in New Zealand face quite different economic and demographic pressures. Many of our cities are experiencing growth - and in some cases substantial growth - which places pressure on the provision of infrastructure and services. In contrast, some areas have no growth or have projected retrenchment. In those circumstances the issue is how to maintain infrastructure and services previously funded by a larger funding base. Funding solutions need to take account of these differences and, in considering solutions, an investment approach that ensures that funding contributes to the long-term sustainability of communities is warranted.
4. An appropriate funding mix that includes greater use of tools already available to local government, in particular
the use of prices (user charges) where appropriate and a prudent use of debt, especially for assets that have an inter-generational benefit.
There are 78 local governments in New Zealand and all prioritise and value resources differently. Where choices are made to fund services from a general rates pool rather than user charges, that should be transparent to ratepayers. Similarly, not using debt for inter-generational asset investment means that the current generation of ratepayers is assuming that cost – a choice that should be transparent to ratepayers. Growing the understanding of these choices will require central government to contribute to lifting the quality of the funding debate. Sound bites criticising debt or rate levels that deter needed infrastructure investment is unhelpful both to the local authority and to the country. Local government, in return, needs to ensure that it is performing to best practice levels, is open to finding the most efficient organisational forms through which to deliver services and be able to demonstrate this in a transparent manner.

7
Readers should recognise that there is no easy answer or silver bullet to the funding debate that lies ahead. Instead, a mix of old and new tools are more likely to offer a more rounded and credible solution than the present status quo outlined in Part 6. Options for discussion should include changing views on organisational form, perhaps reviewing where and how public-private partnerships may be more effectively utilized as well as how and where a regional perspective on infrastructure may assist in lowering management and cost burdens. Therefore a key consideration will be openness to investigating different ways of doing things. Without that nothing is likely to change for the betterment of New Zealand’s communities.

Local Government Funding Review 8

9
Part 1 The funding discussion
1.1 Strong local communities power national success
“The national economy is of course the sum of its regional parts, and we need all our regions doing well to really lift our economic growth rate and provide jobs for Kiwi families.” [Hon Steven Joyce, Minister of Economic Development]
Local government sustains our communities and supports our regional economies. Councils provide important infrastructure including roads, public transport and water supplies; they plan for and respond to civil emergencies; provide recreation facilities such as parks and swimming pools; administer regulation from building consents to marine safety; work to protect the environment; and support cultural activities and facilities like libraries, museums and festivals.
Good local government, however, is more than a provider of community services; it co-ordinates and leads changes in our communities, including economic development. On one level this is a paper about local government funding but, on another level, this is a paper about the contribution that local government could make to New Zealand, with the proper funding levers and incentives in place.
Community expectations change over time. For example, people expect increasingly timely, responsive service from councils and to be able to interact with councils online. In some communities, unsealed roads are increasingly unacceptable (though other communities are willing to revert to unsealed roads to reduce costs). Public amenities and other council facilities are generally expected to be maintained and operated at a higher level than in the past, which has implications for staffing and capital investment. However, the willingness of communities to pay for the increased costs does not always match the rise in expectations.
No means of funding is costless. All forms of funding influence the incentives on the council raising revenue and the behaviour of the individuals who bear the burden of the payment; often behaviour is influenced in unhelpful ways. The challenge is to provide the means of funding to achieve the social and economic objectives of local government, and the aspirations of their communities, while limiting welfare-reducing side effects. This paper considers whether the current ‘tool kit’ for funding local government lives up to this challenge or whether the limited set of funding tools is a factor in holding back our communities.
Central and local government share a vision of strong local economies and vibrant communities. Making sustained progress toward this vision will require a resilient and principled partnership between local and central government.
Councils need confidence in the rules that govern their decision-making, a clear sense of their own purpose and the flexibility to respond to local circumstances, rather than finding themselves wrapped in red tape imposed by central government. No one gains when local communities incur costs unnecessarily in complying with centrally mandated rules or limits which do not account for local conditions.
Equally, to achieve our economic, social, cultural and environmental goals, the local government sector must be open to innovation in seeking efficiency gains and to the challenge of best practice. While this is not a review of what activities should be undertaken by local government or how much should be spent on those activities, decisions on funding cannot be divorced from accountability for spending.
Our communities are facing quite different pressures, particularly in relation to meeting infrastructure needs. Some communities are experiencing increasing population and relatively strong economic growth; as a result, these communities will face strong demand for more and better infrastructure and services. Other communities

Local Government Funding Review 10
do not have the quantity of people they used to and face challenges in ‘right sizing’ community facilities while remaining vital parts of our national economy and identity.
Although there is great diversity in the challenges facing local communities, the existing approaches to funding local government assume that the same funding instruments are suitable for all circumstances – property rates are the primary funding means for small rural communities, busy tourist centres and our major metropolitan centres alike. This paper questions whether a one size fits all approach is the best we can do in seeking a more productive, competitive New Zealand.
1.2 This paper
This review asks what, as a society, we want to achieve with local government funding and how best to accomplish that. The structure of the paper is:
Part 2 outlines the current functions of local government and how activities are funded.
Part 3 considers the characteristics of the local and regional communities for which the system of local government funding operates and the different pressures arising from population and economic trends.
Part 4 outlines the relationship between central and local government and proposes a principles-based partnership.
Part 5 addresses factors that influence funding as a system - with particular focus on infrastructure.
Part 6 considers improvements to the current rating system.
Part 7 reports proposed options for change, looking at tax rates and tax bases, and how vulnerable communities and councils could be supported.
Part 8 concludes the report by highlighting the history and complexity of funding local government and challenges the reader to provide informed, timely ideas to help better address local government funding challenges.

11
1.3 This review fits with other initiatives to lift the contribution of local government
This review of funding is one of several initiatives LGNZ has embarked upon with councils and other stakeholders to lift local government’s contribution to New Zealand’s overall economic development. These initiatives seek improvements in four broad areas:
a strong community mandate, built through strengthening local democracy and ensuring effective community engagement;
an effective partnership with central government, in which local government is a valued contributor to designing and assessing policies that affect communities, as well as an implementation partner;
effective and efficient council practices, exhibited through the sharing of expertise, best practice and knowledge, and working together as appropriate to provide successful outcomes for communities in a cost-effective way; and
effective funding and financing – local government’s funding and financing tools and strategies should encourage councils to be leaders of economic growth and community development, as well as providing an adequate, fair and affordable source of funding for councils to undertake the activities required of them.
These areas support and reinforce each other. An effective and efficient council, with a strong community mandate for its activities, will have the support of its community in raising funds to invest in projects to support economic and community development. Further, an effective and efficient local government sector, which has the support of its community, can be a strong advocate for the interests of local communities to central government. These linkages are illustrated in Figure 1.
Figure 1: Initiatives to strengthen local government

Local Government Funding Review 12
13
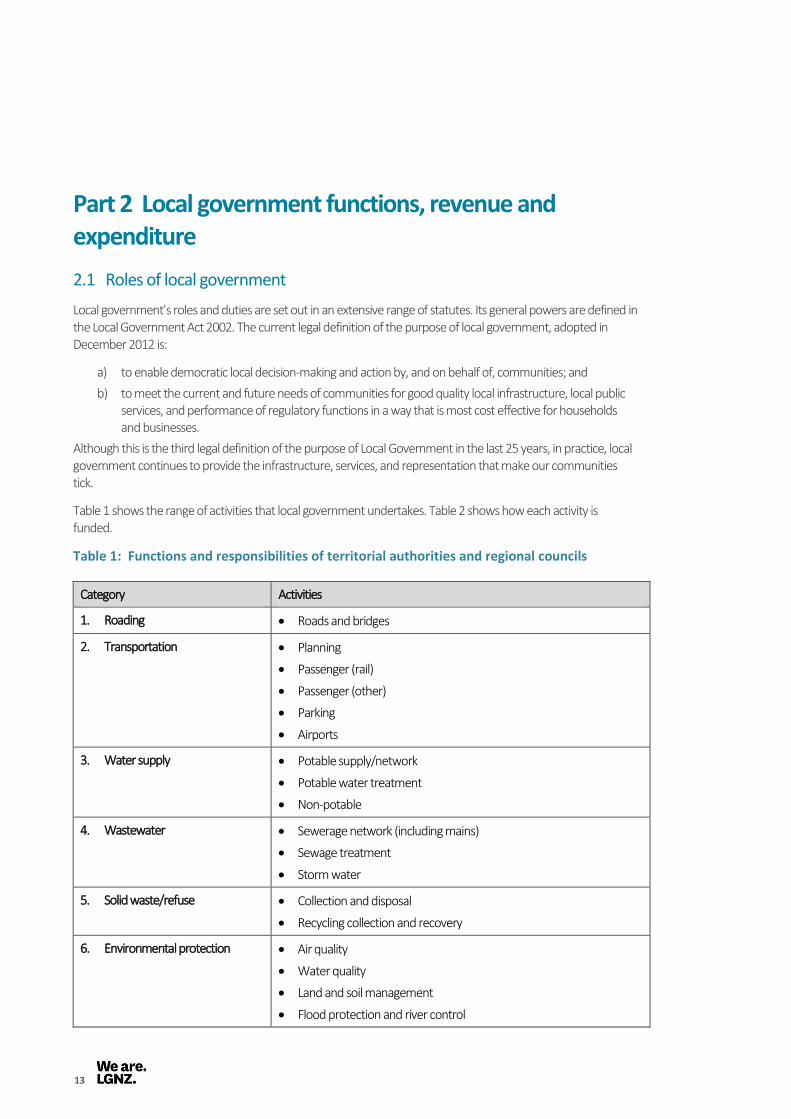
Part 2 Local government functions, revenue and expenditure
2.1 Roles of local government
Local government’s roles and duties are set out in an extensive range of statutes. Its general powers are defined in the Local Government Act 2002. The current legal definition of the purpose of local government, adopted in December 2012 is:
a) to enable democratic local decision-making and action by, and on behalf of, communities; and
b) to meet the current and future needs of communities for good quality local infrastructure, local public services, and performance of regulatory functions in a way that is most cost effective for households and businesses.
Although this is the third legal definition of the purpose of Local Government in the last 25 years, in practice, local government continues to provide the infrastructure, services, and representation that make our communities tick.
Table 1 shows the range of activities that local government undertakes. Table 2 shows how each activity is funded.
Table 1: Functions and responsibilities of territorial authorities and regional councils
Category Activities
1. Roading Roads and bridges
2. Transportation Planning
Passenger (rail)
Passenger (other)
Parking
Airports
3. Water supply Potable supply/network
Potable water treatment
Non-potable
4. Wastewater Sewerage network (including mains)
Sewage treatment
Storm water
5. Solid waste/refuse Collection and disposal
Recycling collection and recovery
6. Environmental protection Air quality
Water quality
Land and soil management
Flood protection and river control

Local Government Funding Review 14
Category Activities
7. Emergency management Emergency and disaster management
8. Planning and regulation Building control
Resource planning and consents
Animal control
Environmental health and alcohol licensing
Marine safety
Local alcohol policies
Regulation of gaming machines
Regulation of the location of brothels
Dog control
Local Approved Products policies
Pest management strategies
Marine regulations
Environmental protection
Biodiversity
9. Culture Libraries
Museums and galleries
Festivals and events
Community arts
10. Recreation and sport Aquatic facilities
Sports facilities, eg stadiums
Zoological and botanical gardens
Local and regional parks and reserves
11. Community development Community development, support and other
Community safety
12. Economic development Business and tourism promotion
13. Property Social housing
Councils and community property
Commercial property and other, eg non sporting stadia, public conveniences
14. Governance Council, committees, community and local boards
Citizenship ceremonies
15. Support services Overheads, council support services, accountability and information costs
16. Other Activities not covered by the categories
Source: Statistics New Zealand

15
Councils use different funding sources for different activities. Table 2 below, shows the percentage of each council activity funded by various sources, with activities with the highest percentage of funding from rates at the top. 1
Table 2: Council activity funding sources (by percentage), 2013
Source: Statistics New Zealand Local Authority Funding Statistics
Local government also takes a co-ordinating, facilitating and leadership role, enabling partners to achieve goals that they would not be able to meet on their own. Local government frequently partners with the private sector, and/or non-governmental organisations or central government to deliver transformative local projects. Examples of local government involvement in transformative projects around the country include:
The Hauraki cycleway: local government and central government have partnered to create a project that is estimated to be returning between $1.8 – 2.8 million to the Hauraki regional economy every month.2
The Waitaki irrigation scheme. Kick-started in the mid-2000s with a $10 million loan from Waitaki Council, this scheme is now being extended with further Council financial support. The irrigation provided by the scheme is estimated to have increased Waitaki’s Gross Domestic Product by $48 million a year or 4.8 per cent annually.3
Social Sector Trials in regions around the country. As an example, Waitomo District Council has been a
1 Rates includes all property taxes including targeted rates and uniform annual general charges; regulatory refers to income from fines;
penalties, fees and petrol tax; grants generally refers to co-payments from the NZ Transport Agency, subsidies and donations; sales includes user fees, rents and other operating income. 2 Waikato University study, reported in the Waikato Times, 7/6/2013.
3 Social and Economic Benefits Study, commissioned by the North Otago Irrigation Company and Waitaki District Council. Available at
www.waitaki.govt.nz.
RatesRegulatory
Income
User fees &
charges
Interest &
DividendsGrants
Roading 61 4.5 4.5 30
Transportation 16 10 28 46
Water supply 64 36
Waste water 85 15
Solid waste/refuse 45 1 51 3
Environmental protection 74 4 19 3
Emergency management 63 17 20
Planning and regulation 38 47 13 2
Culture 65 1 16 18
Recreation & sport 66 32 2
Community development 78 13 9
Economic development 56 16 28
Property 21 1 77 1
Governance 94 6
Support services 76 3 4 17
Other 28 14 58

Local Government Funding Review 16
key partner in the Waitomo Social Sector Trial, including supporting the Waitomo Youth Council, and providing “Number Twelve,” a safe community space for youth, and the base for the very successful driving license support programme. The Waitomo Social Sector Trial has substantially reduced truancy and youth offending in the District, and increased achievement at Te Kuiti High School.4
2.2 Expenditure
Councils’ expenditure reflects the diverse roles and situations of councils around the country. Figure 2 presents a snapshot of total council expenditure across the whole country in 2013.
Figure 2: Local government operating expenditure by activity, 2013
Source: Statistics New Zealand Local Authority Financial Statistics
As Figure 2 shows, nationally, a significant proportion of local government’s operational expenditure is on infrastructure maintenance and renewals. The largest single expenditure item is roading, at 17 per cent of total expenditure. Roading and public transport together account for nearly 30 per cent of council operational expenditure. Transport and the three waters together make up around 45 per cent of local government operating expenditure.
Expenditure patterns, however, differ considerably by type of council, reflecting the different circumstances of rural and urban local authorities. For example, a comparison of Clutha District Council with Wellington Ciity Council highlights the diversity of community resources and funding requirements. Clutha is a rural local authority with a population of roughly 17,500, and a large roading network covering nearly 6,400 square kilometres. Figure 3 shows it spends roughly $14 million, or nearly 44 per cent of its expenditure, on roading and transport. Further, it spends significantly less than the sector average on culture, recreation and sport and economic development.
4 Waitomo Action Plan 2014-15, http://www.waitomo.govt.nz/Documents/Documents/Community per
cent20Development/Youth/MSD140801-Action-Plan-Waitomo-FA2.pdf?epslanguage=en-NZ
0.5% 1.6% 2.3% 3.0% 3.3% 3.5% 3.8% 3.9% 5.3% 6.4%
8.5%
14.0% 14.9%
29.1%
0
500
1000
1500
2000
2500
3000
$ M
illio
ns

17
Figure 3: Clutha District Council, 2013
Source: Statistics New Zealand Local Authority Financial Statistics
By contrast Wellington City Council, has a population of more than 10 times that of Clutha and has less than 5 percent of the land area. Figure 4 shows that Wellington City Council also spends $14 million for roading. However, this amount represents just over ten per cent of its budget, which is also close to the amount it spends on recreation and sport. The difference reflects the diverse role of an urban local authority and the broader range of services provided.
Figure 4: Wellington City Council, 2013
Source: Statistics New Zealand Local Authority Financial Statistics
02468
10121416
$ M
ilio
ns
0
5
10
15
20
25
$ M
illio
ns

Local Government Funding Review 18
The majority of expenditure by regional councils is on environmental protection, although Greater Wellington Regional Council is an outlier, with substantial spending on public transport and bulk water supply.
2.2.1 Infrastructure costs
The ongoing cost of operating and maintaining services and infrastructure is a significant driver of councils’ expenditure. Councils are required to run “balanced budgets.” Part of meeting this requirement is ensuring that councils’ long term plans include funding to renew and replace assets as they wear out over time.
A considerable proportion of council revenue is committed to ensure the effective maintenance and renewal of existing services. Infrastructure has taken up between 40 and 45 per cent of councils’ operational spending during the 2003 - 2012 period, as shown by Figure 5.
Figure 5: Operational spending on infrastructure as a percentage of total operating expenditure
Source: Statistics New Zealand Local Authority Financial Statistics
2.2.2 Capital expenditure
The timing of capital expenditure tends to reflect the nature of the infrastructure and capital investment demands placed on councils. Looking at projections made in councils’ 2012 – 2022 Long-Term Plans, overall capital expenditure shows an initial rise, largely due to investment in transport, and then a levelling off to the end of the planning period.
0%
5%
10%
15%
20%
25%
30%
35%
40%
45%
50%
2003 2004 2005 2006 2007 2008 2009 2010 2011 2012
Roading
Transportation
Water supply
Wastewater
Total Opex on Infrastructure

19
Figure 6: Local government self-reported capital expenditure plans
2012$m, estimated from intentions ]Source: NZIER Local Government Finances, a historical perspective 10 July 2014
2.3 Revenue
In 2013, total local government revenue from all sources was $11.02 billion. Of this, $1.36 billion was from revaluation of council assets (valuation changes), rather than cash receipts or additions to council assets. Excluding this non cash income, local government revenue was $9.49 billion. Rates, at $4.60 billion, made up 49 per cent of this total.
Figure 7 shows the sources of income for 2013. This figure presents operating income (interest and dividends, regulatory income and petrol tax, NZ Transport Agency (Transport Agency) contribution to opex, user fees and charges and rates) and non-operating income (development and financial contributions, vested assets and Transport Agency contribution to capex and government water grants) for all councils in New Zealand. It excludes valuation changes.

Local Government Funding Review 20
Figure 7: Summary of local government funding sources, 2013*
* excludes valuation changes **mostly NZTA capital contribution to transport ***mostly NZTA operational contribution to transport Source: Local Government Financial Statistics
Rates on property are the primary source of income for all local authorities. However, the percentage of income from rates can vary substantially between councils, depending upon the extent of other forms of income a council may receive, such as dividends from investments or user fees and charges. See Figure 8 overleaf.
2% 4% 5% 7% 8% 11%
15%
49%
0500
1,0001,5002,0002,5003,0003,5004,0004,5005,000
$ M
illio
ns

21
Figure 8 - Rates as a percentage of total income for territorial authorities, 2013
2.3.1 User fees and charges
User fees and charges are the second largest source of income for councils nationally. The extent to which councils use fees and charges varies significantly, as we discuss further in Part 5.
2.3.2 New Zealand Transport Agency contribution
New Zealand roads are divided into two types: national roads, which are funded by central government, and local roads, which are jointly funded by local government and central government through the NZ Transport Agency. The Transport Agency’s Funding Assistance Rates framework states that “funding assistance is not a subsidy, but part of a co-investment system that recognises there are both national and local benefits from investing in the land transport system”5
5
Transport Agency, http://www.nzta.govt.nz/about/media/releases/3734/news.html

Local Government Funding Review 22
The overall National Land Transport Fund co-investment rate is 53 per cent. This means the Fund will cover an average of 53 per cent of the cost of all local transport programmes. Councils with greater need and less ability to pay, as determined by the funding assistance rate, may receive co-funding of up to 75 per cent of the costs of a given project.
2.3.3 Development contributions
Development contributions are contributions that councils require from developers as part of granting consents for development. The cost of development contributions is commonly passed onto the purchasers of new houses or commercial premises as part of the sale price. Development contributions can also include a transfer of land, eg for reserves.6
Development contributions allow councils to recoup some of the capital costs of building new infrastructure, or expanding existing infrastructure to service a new development. Income from development contributions can reduce the pressure on other territorial authority revenue sources, such as rates, transferring the cost to those responsible for development.
Nationally, development contributions compose, on average, approximately two per cent of a council’s revenue. However, there is considerable variation in the amount of development contributions collected, depending on the growth profile of the council (see Section 5.6 for more detail).
2.3.4 Other sources of income
Regulatory income, petrol tax, and interest and dividends are other sources of local government revenue. Regulatory income includes fees collected to cover the cost of supplying regulatory services, for example, building consent and liquor licencing fees. Local authority fuel tax is levied on petrol and other fuels, at between 0.33 and 0.66 cents in the dollar, and distributed to local authorities by central government.7
Interest and dividends are an important source of income for some councils, especially regional councils, which may have significant profitable assets, such as ports.
2.4 International comparison
Internationally there is wide variation in local government’s roles, and in the ways in which local government is funded. We look at whether the funding for local government is raised centrally or locally; the extent to which funding comes from taxes rather than, for example, fees and charges; and what taxes local governments have access to.
2.4.1 Is the funding for local government raised locally or centrally?
Almost all systems include some aspect of local funding, and some aspect of funding provided from central government. Figure 9, below, compares local government’s share of public expenditure (ie the percentage of total central and local government spending that is spent by local government) to local government’s share of total public revenue (ie the percentage of total central and local government revenue that is collected by local government).
6 Local Government Act 2002 Amendment Act 2014, Changes to development contributions provisions, DIA Factsheet, July 2014
7 http://www.med.govt.nz/sectors-industries/energy/liquid-fuel-market/duties-taxes-and-direct-levies-on-motor-fuels-in-new-zealand

23
Figure 9: Local government expenditure and revenue as a percentage of total public expenditure and revenue, international examples, 2011
Source: World Bank 2014, Treasury Economic and Fiscal Updates, Statistics NZ
The difference between local government expenditure and revenue is usually funded through transfers from central government. This is the case in New Zealand, where the difference between revenue and expenditure is filled by NZ Transport Agency co-funding and some other central government transfers. In New Zealand the share of local government operating revenue funded by transfers has fallen significantly over time. In 1985 transfers, including contributions for roading and transportation, amounted to 18 per cent of councils’ operating revenue. Today that figure is approximately 13 per cent. In today’s currency the reduction in funding is equivalent to approximately $400 million per annum.
2.4.2 How is the funding raised?
The proportion of local government spending that is funded through taxes (that is, local taxes of all types, plus central government transfers, which we assume are mainly funded through taxes) ranges from less than 50 per cent in South Africa, to over 90 per cent in Denmark. New Zealand local government is mainly tax-funded (Figure 10), with over 60 per cent of total funding for local government coming from local taxes.
0 5 10 15 20 25 30 35 40
Spain
Denmark
France
NZ
United Kingdom
Germany
Canada
Norway
Expenditure Revenue

Local Government Funding Review 24
Figure 10: Sources of local government revenue, international comparisons, 2006
Source: World Bank 2014, Local Councils 2014
2.4.3 What kinds of taxes does local government use to raise revenue?
Local government in New Zealand, Australia and the United Kingdom relies entirely on property taxes to raise that part of their revenue that is funded by local taxes. Other countries in the OECD have a different mix, with Belgium for example, not using property tax at all to fund local government.
Figure 11: Per cent of local government tax raised by tax type, international comparison, 2010
Source: World Bank 2014, Statistics NZ
0%10%20%30%40%50%60%70%80%90%
100%
Sweden NZ CzechRepublic
Denmark Finland France Germany Australia Canada SouthAfrica
Other (e.g., fees and charges, dividends)
Transfers from central or regional government
Local Taxes

25
2.5 Conclusion
The tax base used by a local government system is likely to reflect the range of activities undertaken by that system. Local government systems, like the New Zealand one, which have a small role in the provision of social services, are more likely to rely on a property tax as this tax base is stable and immobile and thus ideal for funding long life infrastructure. It is also well suited to a regulatory regime that requires a balanced budget.
Local government systems that provide a wide range of social services, such as those in Europe and Scandinavia, are more likely to include income and consumption taxes as part of their tax mix, as well as government transfers from general taxation. This reflects the re-distributional nature of many of these services.
One of the challenges facing local government is finding a funding system that meets the needs of very diverse communities. Revenue sources that are suitable for a small rural community might not be sufficient to meet the needs of a fast growing urban area. The challenge of meeting the revenue needs of a diverse local government system is discussed in Part 3.

Local Government Funding Review 26

27
Part 3 The diversity of local government
3.1 Changing demographics
In common with many other countries around the world, New Zealand is seeing more people being born, moving into, and living, in cities, along with fewer people living in many rural and regional areas. Population is important because it drives demand for local government services, and, all other things being equal, a large population will be able to provide more funding for those services than a smaller population.
There are two broad stories around New Zealand today: one is a story of an increasing population, relatively strong economic growth and, as a result, strong demand for more and better infrastructure and services. The other is a story of rural and regional communities that continue to be vital parts of our national economy and identity, but that do not have the numbers of people they used to.
3.2 Supporting growth
Auckland is the obvious example of a council experiencing rapid growth, but Queenstown-Lakes, Selwyn, Western Bay of Plenty, Kapiti Coast, Waimakariri, Waikato, Tauranga, Hamilton, Christchurch and Wellington are also expected to see above average population growth. For these areas, the challenge is managing and funding the costs of growth to make sure the opportunities are not blocked or slowed down through lack of vital enabling factors, such as transport and water infrastructure, affordable housing or social services. There are also demand management issues for many of these councils, for example, congestion in Auckland and water on the Kapiti Coast.
Case Study – Infrastructure spending projections for the Bay of Plenty
Three councils – Western Bay of Plenty District Council, Tauranga City Council and the Bay of Plenty Regional Council – have created a joint approach to growth management, known as ‘Smart Growth.’ Their combined ‘Settlement Plan’ is at the core of their approach. The Settlement Plan looks forward thirty years and attempts to promote staged development and logical and sequential public investment in infrastructure. The settlement plan has identified two key challenges:
the quantum of investment required to deliver the infrastructure needed for the settlement pattern; and
ensuring financing (and the underlying funding) is in place for individual pieces of infrastructure that “unlock” designated areas for development.
The high-level estimates for infrastructure spending over the next 30 years for the three councils are:
$700 million for the three waters, including a new water treatment station, upgrades to mains and reservoirs, completing a wastewater pipeline and upgrading existing water treatment plants; and
$950 million for roading, including State Highway upgrades and local roading improvements required to “unlock” designated areas for development.

Local Government Funding Review 28
3.3 Big City Issues
3.3.1 What is different about large metropolitan centres?
Apart from large populations, metropolitan cities differ from other local authorities because:
the population is more highly concentrated;
the population is more heterogeneous in terms of social and economic circumstances;
they are major generators of employment and economic growth;
they provide an environment which is supportive to innovation and knowledge based industries; and
they can act as regional hubs for residents from neighbouring districts and for employment and consumption.
As a result, metropolitan councils tend to provide a broader range of services. International research supports the perception that per capita expenditure is generally higher in large metropolitan councils, although this doesn’t apply to the same degree in New Zealand due to the varied nature of rural and urban councils.
3.3.2 Urban centres in New Zealand
New Zealand continues to grow, but mostly in urban areas. Currently 67 per cent of the country’s population lives within the Auckland, Canterbury, Wellington and Waikato regions. These centres are home to more than 2.1 million people and, as such, represent a disproportionate amount of the total population. But special attention has to be paid to Auckland and Christchurch. Not only are they the country’s largest population centres (Auckland has 34 per cent of the country’s population and Canterbury has 13 per cent), but they are unique with analysis on funding due to their challenges with infrastructure development and future growth. Roughly 60 per cent of estimated population growth for the next three decades is anticipated to occur in Auckland, and the re-build following the earthquakes in Canterbury creates an even greater chasm between comparative infrastructure funding needs from that of the rest of the country.8
3.3.3 The case of Auckland
The New Zealand local government system is relatively unique in the way it provides a single legislative framework that governs all types of local government, with the recent exception of Auckland Council. The Local Government (Auckland) Act 2009, enacted to recognise Auckland’s unique circumstances as a major metropolitan centre, is the only variation to the legislative framework.
Despite its unique circumstances, Auckland Council still operates with the same funding and financing tools as other local authorities, except for its ability to borrow directly off-shore. These funding and financing tools are insufficient if Auckland is to address the issues that all large metropolitan centres facing growth must deal with. It is not uncommon for major metropolitan centres to have additional taxing powers. Toronto, for example, has a heavy reliance on property taxes, but also has the ability to levy other taxes which smaller local authorities in Ontario do not have; for example, vehicle registration fees, a land transfer tax and a billboard tax.
3.3.4 Auckland’s challenges
As the fastest growing region in New Zealand, Auckland Council is planning for a significant increase in population over the next two decades and a total population likely to be more than two million people by 2030. Providing critical infrastructure to cater for this increase in population is a major focus of The Auckland Plan, especially with regard to transport.
8 (Statistics New Zealand, http://nzdotstat.stats.govt.nz/wbos/Index.aspx?DataSetCode=TABLECODE7501)

29
Auckland is grappling with an incomplete roading system and an under-developed passenger transport system. As a result:
roads are heavily congested, particularly at peak times;
significant and ongoing investment in maintenance of existing infrastructure is needed;
the passenger transport system is unreliable and uncompetitive with private vehicles; and
the ability to move freight across the city is restricted.
The Consensus Building Group, which was established by Auckland Council to investigate revenue raising tools for meeting the city’s transport funding gap, estimates that an additional investment of $300 million per annum is required for the next 30 years and that the funding gap is approximately $12 billion. In late October 2014 the Consensus Building Group recommended two options for filling the gap, namely, higher levels of rates and a fuel tax, or the introduction of a motorway user charge:
The rates and fuel tax option uses all existing funding tools (rates, development contributions, petrol excise duty, road user charges, public transport fare revenue, tolls on new roads and general government revenue).
The motorway user charge involves a charge on motorists each time they use the motorway network, the amount of which may vary by time of day or day of the week.
The options are currently subject to consultation. Both options involve revenue tools for which councils lack the legal authority to implement and which may require legislative change before becoming available.
Without a more effective suite of funding and financing tools, the purpose behind the creation of Auckland Council, which involves enabling the city to fulfil its economic potential, is likely to remain unrealised.
3.3.5 The case of Christchurch
Local government needs a mix of revenue sources to undertake its general and ongoing duties and responsibilities. Such sources, however, may be insufficient to enable a community to deal with the aftermath and reconstruction demands of a massive destructive event, such as the Canterbury earthquakes.
The earthquakes of September 2010 and February 2011 had a severe impact on Christchurch City and the surrounding districts. In addition to the loss of life, injury and the dislocation of people from their homes and communities, the region is now faced with the challenge of rebuilding amenities and infrastructure, including how the rebuilds will be funded.
To meet its share of the rebuild costs, Christchurch City Council has a number of choices. Which choices it makes will depend upon a more definitive assessment of the actual costs and the Council’s risk appetite in relation to its own debt levels and debt capacity, and that of Christchurch City Holdings.
In its report, Funding Requirements and Options, Cameron Partners note that the council has four material funding options, each with its own trade-offs:
debt, although under current prediction prudent debt levels, will be met by 2019;
increased rates, fees and charges – increasing rates can provide “significant funding capacity over time” – it can also increase debt capacity;
renegotiation of earthquake recoveries; and
asset optimisation, especially partial sale of assets, and aligning the Council’s commercial assets and activities with its vision and strategy for rebuilding the city.

Local Government Funding Review 30
The Report notes that options are inter-related; increasing rates will increase the Council’s debt capacity, but actions that lead to reduced dividends from asset returns will reduce debt capacity over time. While household rates are at the lower end of the scale, compared to other large and neighbouring councils, many residents are still grappling with the cost of repairs and recovery which will inevitably provide some constraints on this option.
Additional revenue options, such as additional mechanisms for capturing some of the economic growth created by the rebuild, could provide the council with a level of flexibility that is not currently present with the existing options.
3.4 Right-sizing for the future
3.4.1 Population decline
Thirty-two territorial authorities can expect an absolute decline in their populations between now and 2031. For areas where the population is projected to decline, the challenge is right-sizing the infrastructure and services to fit the current and future population, while finding innovative ways to continue to thrive economically, environmentally, socially and culturally.
3.4.2 Aging population
In many cases, areas with declining populations also have a higher than average proportion of elderly people. Older people tend to be on more limited and fixed incomes, and are not as likely to be part of activities that create economic growth in the region. The changing face of communities’ age structure also means that the profile of required services provided by councils will change. For example, the demand for road construction may stagnate or even decrease, while demand for passenger transport and total mobility services may increase.

31
Figure 12: New Zealand’s aging population
KEY: per cent of the population over 65:
1996 2013 2031
Hashed areas show where total population has decreased since 1996.
Hashed areas show where total population is predicted to decrease between 2013 and 2031.
Source: Statistics New Zealand Subnational population projections, medium projection, October 2014

Local Government Funding Review 32
Population decline also tends to correlate with lower household incomes. This makes sense when one considers the relative “hollowing out” of the higher-earning, younger demographic.
Figure 13: Annual population growth 2006-13 and median household income 2013, by territorial authority. 9
Source: NZIER, Regional Economies: Shape, Performance and Drivers, July 2014
3.4.3 Higher per person costs for infrastructure
A small and shrinking population means that there is a smaller base to pay for fixed or semi-fixed costs, which is especially difficult when infrastructure needs to be renewed. Small rural areas with spread out populations also tend to face higher per-person costs for infrastructure, as fewer people can be served by each part of the network. This is supported by the data from LGNZ’s recent 3 Waters project, which shows that that rural and provincial councils tend to have higher per-person infrastructure renewal and replacement costs than metropolitan councils (see Figures 14 and 15 overleaf).
9 NZIER, Regional Economies: Shape, Performance and Drivers, July 2014, p.ii, arrows added.
Areas with declining populations also tend to have low household
incomes.

33
Figure 14: Annual renewal costs per person for water infrastructure
Source: Exploring the issues facing New Zealand’s water, wastewater and storm water sector
Figure 15: Replacement value per person for water infrastructure
Source: Exploring the issues facing New Zealand’s water, wastewater and storm water sector
3.4.4 Some communities may not be able to manage these challenges on their own
There are some councils and communities that face challenges across a number of fronts, and may simply not have the resources locally to fund necessary services and infrastructure. It doesn’t matter what type of tax is used to gather revenue – property rates, income tax, payroll tax, share of GST – all draw on the same set of local resources. For these councils and communities, there may not be enough to go around, no matter how they try to gather it. NZIER, in a recent report looking at regional economies, noted that some regions “tend to rank worryingly low on many metrics”10, including household income, economic growth and human capital (a measure of the skills in the economy). We address this question in Section 7.12, “Options for vulnerable communities and councils.”
10 NZIER, Regional Economies: Shape, Performance and Drivers, July 2014, p.i.

Local Government Funding Review 34
3.5 Facing increasing natural hazards and environmental challenges
Natural hazards, such as earthquakes and extreme weather events, are relatively common in New Zealand. The impact and cost of natural disasters has increased in recent years, partly because of the increasing frequency of extreme weather events. Also, our population density and overall wealth are increasing over time. Further, climate change induced sea level rise is likely to create major costs for many local authorities as settlement shifts away from vulnerable areas and infrastructure is relocated. Therefore, more people are in danger and more property at risk of damage, with clean-up and recovery tending to be more complicated and expensive. This means councils face increasing financial risks related to potential costs caused by natural hazards and environmental challenges.11
As well as natural hazards, councils are also exposed to human-created environmental challenges. Accidents such as oil spills or ship stranding create significant clean-up costs, and it can be difficult for councils to recover their costs from the companies involved. Further, commercial activities, past and present, can leave hazardous sites and if the company no longer exists, or is bankrupt, the council incurs the costs of the clean-up.
3.6 Conclusion
This section has considered the diversity of local government in New Zealand, ranging from metropolitan centres like Auckland, faced with meeting infrastructure needs for a growing population, to districts in other parts of the country which have declining populations. It also highlighted the lack of horizontal equity within the sector, whereby some cities and districts are more able to afford good quality infrastructure and services, while others simply lack a sufficient economic base. Similarly, different parts of the country are facing different environmental challenges.
Many of these issues fall outside the capability of some councils to resolve by themselves, as they lack the necessary funding or policy tools, or because their community doesn’t hold the fiscal capacity to meet the cost. In many cases, successfully addressing the challenges will require a closer relationship with central government and potentially a funding partnership. The next section of this report considers what a partnership approach might look like.
11
In 2013 alone, earthquakes in Cook Strait, major weather events in Nelson, Bay of Plenty and Canterbury and volcanic eruptions at White Island created about $200 million of insured losses. Events like these, and the 2011 Christchurch earthquake, have focused attention on natural hazard reduction, readiness, response and recovery.
Case Study: Tasman District Council
In Tasman, as throughout much of New Zealand, what was previously considered extreme weather is becoming common, with multiple major events happening in the district over the last four years. Tasman District Council has responded to these changes by increasing its capital, operations and maintenance budget for vulnerable infrastructure; creating a clear policy on coastal erosion to guide future investment; and including the relevant findings from the International Panel on Climate Change in its asset management plans.
Infrastructure changes include relocating Waimea bores further inland and considering whether the Motueka waste water treatment plant may need to be moved in the future. Maintenance and management activities have also been adjusted to account for changes in weather. For example, storm water planning and analysis services now take into account the impact of climate change. These activities have been funded by reprioritising budgets away from other activities and by raising rates.

35

Local Government Funding Review 36
Part 4 A partnership approach
The first “key theme” of this paper is the need to develop an effective partnership between local government and central government. Central and local government need to create shared goals and strategies for the activities pursued by local government, and have a two-way discussion about how those activities can be prudently funded over time. This section addresses various themes involved in a central and local government relationship, including shared principles and incentives.
4.1 The current relationship with central government
4.1.1 Increasing cost burden on local government from central government
Over time, local government in New Zealand has faced an increasing cost burden from increasing central government expectations and requirements. Local communities therefore have to either pay more in rates, fees and charges or see reductions in other council activities as a result of these imposed costs. Generally speaking, local councillors, rather than ministers, then have to justify increases in rates and charges or decreases in services, despite often having had little real input into the process that generated the requirements.
Many of the activities that central government requires of local government are not unreasonable in outline, and would have been undertaken by councils to some extent for their own purposes. However, there is a consistent message from local government that central government’s expectations are often disproportionately high or unreasonably costly. For example, in 2009, PricewaterhouseCoopers undertook a study for LGNZ which showed that implementing the administrative requirements of the Local Government Act 2007, the Public Transport Management 2008, the Health (Drinking Water) Amendment Act 200712 and the Land Transport Management Amendment Act 2008 took 720,000 hours of council staff time, and cost $25 million in external consulting fees.13 The bulk of this cost was in preparing Long Term Plans (LTPs).
In its review of local regulations, the Productivity Commission noted a lack of coordination by government departments when developing new regulations for councils to implement. It also noted a lack of consultation with councils when regulations were being developed. Improvements in the quality of regulation – achieving the same outcome at lower cost by recognising local circumstances – could provide big cost savings to local communities.
Even with effective consultation and cost-benefit analysis, there will still be some cases where central government sets national standards that local government must meet because it believes that the standard will create a national benefit. The centrally-set standards will almost always be higher than what some local communities would have chosen on their own – otherwise there would be no need for the standard to be set.
4.1.2 Lack of understanding and engagement
Many central government policy makers suffer from a lack of understanding about local government in general, about the diversity of councils around the country, and about the likely costs and benefits of a specific policy, regulation or measure for councils. The Productivity Commission, in its 2013 report,
12
PwC looked at the inspection, monitoring and planning costs, not at the cost of actually upgrading the infrastructure to meet the new standards. 13
Costs of Regulation on Local Government, PricewaterhouseCoopers for LGNZ, 2009.

37
Towards Better Local Regulation, stated that “central government agencies with oversight responsibility for regulations do not have knowledge of the local government sector commensurate with the importance of the sector in implementing these regulations.”14
Consistent, effective and productive engagement with local government would go a long way towards filling these knowledge gaps. However, this is not the case at present. According to the Productivity Commission, 68 per cent of councils ‘tend to disagree,’ or ‘strongly disagree,’ with the statement that ‘local government feedback during the engagement process was taken into account when drafting new regulations.’15
4.1.3 Lack of incentives for central government policy makers to consider effects of policy on local government
Central government policy makers do not always have the appropriate economic context and understanding of local effects to ensure that policies, regulations or measures are genuinely required and as cost-effective as possible. With very few exceptions, central government in New Zealand does not bear any share of the costs it imposes on local government. Further, local politicians, rather than national politicians, will tend to be held responsible for rises in rates and fees and charges, or for reductions in council services. It is important that local government is largely funded by local taxes, to provide local communities with an incentive to prioritise their wish lists and make reasonable trade-offs. The same principle applies to central government – where central government doesn’t contribute to the costs that it imposes, there will be a tendency for central government to make inefficient decisions, knowing that someone else (in this case, local government) will bear the fiscal and political costs. Efficiency is enhanced where the decision-makers are required to address the full costs of their decision.
The Productivity Commission noted this issue in its report, stating that “current institutional arrangements can shield central government from the full fiscal and political cost of assigning regulatory functions to local government. This can have the effect of reducing the quality of regulations”16 and “while difficult to prove empirically, it is likely that weak incentives on central government during the policy-making process are contributing to insufficient implementation analysis and a lack of quality engagement with the local government sector around regulatory design.”17
14
ibid, p.71 15
ibid., p.72 16
Towards Better Local Regulation, Productivity Commission 2013, p.69 17
Ibid., p.68.
Example: Councils’ views on consultation regarding the National Policy Statement on Freshwater Management
…Territorial Local Authorities consider that they are not sufficiently engaged with nor listened to. The National Policy Statement for freshwater is an example of this, as it required significant water infrastructure investment by councils, with little warning, for something they did not understand and which they considered the Ministry for the Environment (MfE) had not thought through. TLA views were sought late in the process. The stakeholder survey identified that MfE needs to work harder at understanding how policy is operationalised and where national policies need to take into account local differences. (SSC, Treasury and DPMC, 2012b, p. 46)
Source: Performance Improvement Framework review of MfE, 2012, quoted in Towards Better Local Regulation.

Local Government Funding Review 38
4.2 A new, principles-based partnership
To address the issues of understanding, engagement and incentives, LGNZ proposes that central government decision-making in areas that will have cost implications for local government should be guided by two principles:
Local government will be consulted on all proposals with cost implications for local government, and the cost benefit analysis for these proposals will include costs and benefits for local government.
Where a policy is intended to generate national as well as local benefits (or generates only national benefits and no local benefits) central government will provide a proportionate amount of co-funding to councils to meet the implementation costs.
Effective consultation and cost-benefit analysis would result in better regulation making and co-operation between local government and central government, which would reduce the unnecessary costs created by standards and regulations that are inappropriate or too inflexible.
Requiring that central government co-fund standards or activities with national benefits would more fairly reflect the distribution of benefits, reduce the cost that local government has to bear in implementing such standards, and provide central government policy makers with a fiscal incentive to ensure that any standards or requirements were appropriate and cost-effective. This funding would be not a “subsidy” – rather, it would be a co-investment, recognising that a share of the benefits are national, and therefore a share of the costs should also be national.
All central government proposals that have cost impacts for local government would need to be assessed to establish an estimate of what proportion of the benefits were expected to be enjoyed locally (and should
Example: The costs of current drinking water standards outweigh the benefits for smaller communities
In October 2007, the Health Act 1956 was amended to make compliance with certain drinking water standards compulsory. This Act requires councils to take all practicable steps to comply with the (previously voluntary) drinking water standards and to implement a public health management plan for drinking water supply.
In 2010, a cost-benefit analysis of the proposed Drinking Water Standards showed that while the benefits of higher standards outweighed the costs for larger populations, higher standards were not justified by the benefits they would provide in communities with fewer than 10,000 residents. It can be argued that this national standard is not appropriate for smaller communities.
Councils have little flexibility in making decisions on drinking water standards. The Local Government Infrastructure Efficiency Expert Advisory Group noted that Clutha District Council spent $3.5 million on water supply plant upgrades and, as of 2010, had $2.5 million of work planned. The Council has stated to the Productivity Commission that:
“This was an absolute requirement on Council, despite the fact that independent analysis showed a negative cost-benefit ratio for small-medium schemes such as ours. If Council had been able to make its own choices there could have been much better uses of $6 million (eg road safety, where a similar investment would save many lives instead of simply reducing the incidence of stomach upsets). It is also quite possible that ratepayers themselves would have had other priorities for that money.”
* Source: LECG. (2010). Cost benefit analysis of raising the quality of New Zealand networked drinking water

39
therefore be funded by local government) and what proportion were expected to be enjoyed nationally (and should therefore be funded by central government). This should not be an onerous requirement, given that cost/benefit analyses and regulatory impact statements should be completed anyway, both of which require the costs and benefits of a given proposal to be assessed.
The principle that central government should co-fund activities with national benefits is already recognised in land transport funding. Central government recognises that a functional transport network, including local roads, contributes to national economic growth (and therefore national benefit). On this basis, central government, through the Transport Agency, contributes an average of 53 per cent of the capital cost of local roads across the country. This funding comes from road charges and levies. The Transport Agency co-funding model could provide a blueprint for sharing costs between central and local government in other areas with national and local benefits, for example water infrastructure.
Co-funding Case Study: The National Land Transport Fund
Central government funding for local and national roads comes from the National Land Transport Fund, which is funded through the fuel excise duty, road user charges, motor vehicle registration and licensing fees and income from state highway property. This is distributed to councils using a two-step process:
a) Councils must submit a business case. These will be ranked and some selected for funding in any given round.
b) The Transport Agency then applies the funding assistance rate to determine how much of the approved costs of project will be paid from the Fund.
Source: NZTA: http://www.nzta.govt.nz/planning/nltp-2015-2018/index.html
The overall National Land Transport Fund co-investment rate is 53 per cent. This means the Fund will cover an average of 53 per cent of the cost of all local transport programmes. Councils with greater need and less ability to pay, as determined by the funding assistance rate, may receive co-funding of up to 75 per cent of the costs of a given project.

Local Government Funding Review 40
However, central government does not co-fund all activities with national benefits. It is widely understood that a national standard for freshwater is beneficial at the local and national level. Water infrastructure has lifespans measured in decades; often beyond 50 years. But the costs to meet new standards, particularly for those councils that have timed infrastructure upgrades and replacement after 2025 are substantial, and at the very least, difficult to reach.
4.3 Conclusion
This section describes the current relationship with central government. At present, central government policy makers do not have strong incentives to fully consider the effect of government policy changes on local government. This results in central government imposing costs on local government with inadequate consideration of the costs and benefits.
To improve this situation, LGNZ proposes a principles-based partnership model with central government, where central government would be required to fully consider the costs and benefits of decisions for local government, and to co-fund costs where policy proposals have significant national as well as local benefit.
Example: Upgrading water infrastructure to meet national freshwater standards
The amended National Policy Statement for Freshwater Management sets new “National Bottom Lines” which regional and unitary councils are required to implement by 2025 in their regional policy statements and plans. Communities and stakeholders, through the RMA planning process, are able to set standards that are higher than these “National Bottom Lines.”
Many city and district councils will need to upgrade their three waters infrastructure to meet these standards, especially waste and storm water networks.
The standard setting has occurred at national level, with some input from regional and unitary councils, but late and inadequate consultation with city and district councils. Councils are not able to adjust the standards downwards to meet the preferences of their communities.
The benefits of cleaner water will be experienced by local communities, but also at a national level, as clean water, like effective roads, supports major drivers of New Zealand’s national economy, such as agriculture, horticulture and tourism.
The shared benefits of this initiative have been recognised to some extent by central government, which has provided a $1.1 million contestable fund for regional and unitary councils to assist with regional planning and community participation.1 However, city and district councils will have to bear the full cost of the required infrastructure upgrades, which will be significant and are not yet fully understood. Tasman District Council has indicated that implementing the New Zealand Coastal Policy Statement and the National Policy Statement (NPS) for Freshwater Management would cost around $2 million over ten years. The Central Otago District Council expects the NPS to cost $10 million over seven years.2
Central government co-funding of the required infrastructure upgrades would recognise the national benefits that will accrue from improved water quality, as well as the local benefits.
1 http://www.beehive.govt.nz/release/clear-robust-national-standards-water-quality, accessed 9 October 2014.
2 LGNZ report, The Impact of Government Policy and Regulations on the Cost of Local Government, 2012

41

Local Government Funding Review 42
Part 5 Funding as a system
In the previous sections we discussed the characteristics of our communities as they relate to funding, and how the relationship with central government affects council’s costs and funding needs. In this section we discuss some of the factors which influence funding when viewed as a system.
5.1 Prices and charges as a means of funding
Where the cost of services provided by local government (either directly or through council owned corporations) can be recovered through prices, rather than taxes, the economic contribution of local government is more effective. This is because in a modern economy, prices collate and convey information in a way that taxes do not.
There are at least two major advantages of using prices rather than taxes as a means of funding, where user pays is feasible and acceptable to the community. First, a price allows consumers to decide what they want to buy. Consumers choose to buy or not to buy a given product or service at a given price. This gives individuals the greatest control over their economic lives. By returning control to consumers, prices help manage the demand for scarce resources. For example, Tauranga Council introduced water metering in 1999, leading to a 25 per cent reduction per household in average water use. This not only conserves the water resource for other uses, but also means that the capacity of the existing system will be enough to meet the city's needs for longer than would have otherwise been the case.
The second major advantage of using prices is that prices allocate resources efficiently. Prices send strong signals about what is wanted and what is not. Suppliers, including suppliers of substitutes, respond to these prices. This information – individual preferences and the costs of alternatives – remains largely hidden when services are funded by taxes.18 Services which would benefit consumers, and for which they are willing and able to pay, may not be provided if they must wait for political processes to determine funding. As Stephen Bailey, writing on Strategic Issues for Local Public Finance, says:
"It is a general economic prescription for efficiency in the allocation of resources that the most efficient means of financing the provision of goods and services is to charge individual consumers and users directly at the point of consumption. In this way, willingness to pay can be matched directly with the provision and use of goods and services whether by organisations in the public or private sectors."
Figure 16 overleaf, shows the variation between councils in the ratio of user charges to general rates. At one end of the scale, the Far North collects $2.00 in fees and charges for every $10.00 it collects in general rates.19 At the other end of the scale, Hurunui collects $9.00 in fees and charges for every $10.00 it collects in rates. Napier collects nearly $5.00 in user charges for every $10.00 it collects in general rates. Auckland collects $6.00 in user charges for every $10.00 it collects in rates.
18
To provide a simple example, metered water charges allow consumers to determine whether they would prefer to install a rainwater feed tank to water their garden, or meet their share of the cost of capacity upgrades through water charges. Where the cost of water is met through general rates (or a dedicated tax), consumer preferences and the costs of alternatives for that consumer remain hidden. 19
Note that, to get an accurate picture of the value of user fees and charges for councils, we have included the user fees and charges collected by relevant Council Controlled Organisations (CCOs), as well as those collected by the Council. This is a reasonably time-consuming manual process, which is why we have shown a sample of councils to demonstrate the range, rather than figures for all councils.

43
Figure 16: User fees and charges as a percentage of rates, sample of four councils 20
Source: Auckland City Council Annual Report 2013/14, 2013/14 financial reports from ATEED, Auckland Transport, Auckland Waterfront Development Agency, Regional Facilities Auckland and Watercare Services Limited. Napier City Council Annual Report 2013/14. Far North District Council Annual Report 2013/14, 2013/14 financial reports from Far North Holdings Limited and Te Ahu Trust. Hurunui District Council Annual Report 2013/14.
This would suggest that, for some communities, the pressure from rates could be relieved if prices were set for more services.
There is also a wide divergence between the sorts of activities which are funded, or part funded, by charges for use. For example, on average 51 per cent of solid waste management is met by user charges whereas only 36 per cent of the cost of water supply is paid for by user charges, and just 15 per cent of the cost of waste water is met through user charges. Only 4.5 per cent of the cost of roads is met by user charges (though about 30 per cent is met from grants which are funded through petrol taxes as a proxy for charging for the use of a road). These divergences would suggest that for most councils there is scope for additional revenue to be raised through user charges for services currently funded through taxes.
Greater application of user charges to replace targeted and general rates for services such as water, waste management, sewage disposal schemes and the like would enhance economic welfare. However, there are legislative constraints which limit local government in making greater use of prices to fund local services, eg library services.
Not all services provided by local government can be funded by user charges as, for many services, it is not possible to identify the individual consuming the service, eg council governance or preparations for civil defence. For other services, communities will judge it unfair to provide the service only to those who can afford to pay, eg access to libraries or community parks, or that, if priced fully, some people will consume too little of the service. In these cases, the community may decide to use local taxes to either provide the service at no charge or to supplement the price charged through a subsidy.
20
The numerator for this graph is (relevant CCO users fees and charges, plus council user fees) divided by general rates (ie, rates excluding targeted rates) as the denominator.
0%
10%
20%
30%
40%
50%
60%
70%
80%
90%
100%
Far North Hurunui Auckland Napier

Local Government Funding Review 44
5.2 Effective financing can reduce pressure on funding
In thinking about how to pay for the services provided by local government, it is helpful to distinguish between funding issues and financing issues. In this report we refer to “funding” as meaning the sources of money available to pay for a project or service. We refer to “financing” as meaning the arrangements put in place to ensure money is available for the project or service at the time it is needed. A funding source or sources must be present to support financing arrangements.21
Financing options allow the cost to the community to be spread over time, which may make funding needs in any period more manageable and the costs to be matched to the stream of benefits. By matching the funding to benefits, financing options may reduce transfers from current generations to future generations.
In summary form, the financing options available to councils include:
cash flow – taxes, fees and charges, cost savings, and government transfers (transfers are generally project specific); and
balance sheet – debt, commercial operations (dividends), commercial capital (divestments), surplus assets, equity partnerships.
The following table provides an overview of the financing options available to councils.
21
User charges are usually adopted with a corporate form of delivery, but not always. Wellington Water, for example, was created in September 2014 through the merger of Greater Wellington Regional Council’s water supply group and Capacity Infrastructure Services (which was owned by Hutt, Porirua, Upper Hutt and Wellington city councils); however Wellington residents are not metered on water use nor charged on the basis of usage.

45
5.3 Financing Infrastructure
Table 3 – Financing infrastructure: Mechanism, variations, description and applicability
Mechanism Variations Description Applicability
Borrowing Commercial banks
Regional infrastructure bank
LGFA
Allows the cost to be spread over the lifetime of the
asset. Could be funded by a general rate, targeted rate or
development contribution. External ratings can reduce
borrowing costs.
Since 1996 NZ councils have had broad discretion over
borrowing with risk managed by lenders. New fiscal
benchmarks with debt servicing thresholds (despite
being non-binding) may limit use of this mechanism for
some councils.
Specific purpose bonds Designed to fund specific projects
May be repaid by a targeted rate or hypothecated charge, eg development contributions
Similar to borrowing but the link between financing and
infrastructure project is more visible and transparent
Limited use so far by NZ councils. May also be affected
by the debt servicing threshold.
Public Private
Partnerships (PPPs)
Design, Build, Finance, Maintain (UK PFI)
Design, Build, Own, Operate, Transfer (BOOT)
Design, Build, Operate, Transfer (DBOT)
Build, Operate, Transfer (BOT)
Design Build
Private Contract Fee Service (Operate and Maintain)
Capital costs can be met by private sector and can
improve efficiency and effectiveness with risks carried by
the private sector or shared. However public agencies
wishing to use PPPs must be able to specify outcomes
and desired levels of service and be confident that these
will apply for the length of the partnership – usually
around 25 years.
Historically PPPs have been used by a few councils to
finance waste water projects, however, between 2002
and 2010 this was essentially ruled out due to
legislative change. Also used for development of
stadia.
Private infrastructure
provision
Full Privatisation
Contracting out the operation of a facility etc
Changes in technology and community value mean that
over time some forms of infrastructure may not need to
be publicly owned and operated, eg Wellington City
Council privatised its parking buildings after a review
examining the rationale for undertaking the service.
The case for local public ownership tends to be
stronger for services which are natural monopolies.
S.17A of the Local Government Act 2002 (LGA) now
requires that councils regularly review the cost
effectiveness of arrangements for providing services.

Local Government Funding Review 46
Franchising/
concessions
Capped charges
Fee for service
Regulatory agency
Private sector leases right to operate, maintain and
charge for an infrastructure network.
Possibly the only example of franchising so far used by
NZ local authorities has been the former Papakura
District’s franchising of its water services. This was
ruled out between 2002 and 2012 due to legislative
changes.

47
There are inter-relationships between these funding sources as shown in Figure 17 below.22
Figure 17: Inter-relationship of funding and financing
5.4 Infrastructure renewals and upgrades
Councils are responsible for the key infrastructure that supports economic and social life in New Zealand – roads, drinking water, waste water, storm water and flood control, as well as many community assets such as parks, community centres and libraries. This infrastructure needs to be maintained during its life, and (depending on demand) renewed when it comes to the end of its life. Infrastructure also often needs to be upgraded, for example to meet a new national standard, or the increased expectations of the community. In growth areas, new infrastructure may need to be built.
To date there has been a lack of complete and comparable information about the state of infrastructure across the country, and therefore, about the likely cost of infrastructure maintenance and renewals across the country. As a step toward closing this gap, LGNZ has commissioned and recently released a paper, Exploring the issues facing New Zealand’s water, wastewater and storm water sector, which provides some information about the state of council water infrastructure.
As of June 2015, all councils will be required to have a 30 year infrastructure plan. This requirement for longer-term planning means that councils and communities are now more aware than ever of the future costs they will need to fund to maintain or improve their current levels of infrastructure and services.
While current information is not perfect, there is sufficient information to suggest that councils around the country are likely to face additional infrastructure renewals, and that the full cost of these renewals has not yet been included in all councils’ forward planning.
The Office of the Auditor General (OAG) released a report in November 2014, Water and Roads: Funding and Management Challenges. This report looked at projected expenditure by councils on renewals for the period of
22
This diagram is adapted from Cameron Partners, ‘Review of (A) Funding Requirements and Options and (B) Organisational Architecture, report prepared for Christchurch City Council, 28 July 2014.
Rates, fees, and cost savings etc
Central government transfers
Total council revenue
Net debt
Asset optimisation
Rate increases/cost savings directly increase debt capacity
Increases (decreases) in council revenues increase (decrease) council debt capacity
Asset sale proceeds reduce net debt
Potentially improve value and strategic outcomes
Asset sales reduce future dividend flow
Government transfers reduce net debt

Local Government Funding Review 48
the 2012-2022 Long Term Plans as a percentage of projected depreciation expenditure. Depreciation expenditure is a rough financial measure of the value of assets that have “worn out” or been “used up” in a given year. Renewals expenditure is the money that has been spent on replacing used up assets. Thus, if renewals expenditure is lower than depreciation, this may be an indication that councils’ useful asset bases may be declining, and that a quantity of renewal work that may be done is building up.23
The graph below shows the OAG’s findings: renewals as a percentage of depreciation trends down for the next ten years, from around 80 per cent to about 65 per cent. This suggests that there may well be an increasing amount of assets that will need to be renewed, but for which councils have not yet budgeted.
Figure 18: Forecast annual renewal expenditure as a percentage of depreciation expenditure
Source: OAG 2014
The OAG states that if councils’ 2012-22 Long Term Plans (LTPs) are accurate in their projections, the gap between depreciation and renewals spending across the country as a whole will be $6-7 billion by 2022.24
In addition to the renewals to maintain infrastructure at existing standards, national and regional standards for drinking water and water quality have increased, meaning that many councils will need to not just maintain, but upgrade, their water infrastructure in the future.
With a gap this size, it is likely that councils will need to consider increasing their budgets for renewals. However, in some cases, especially in areas with declining populations, the assets may not need to be replaced to the full extent. There are also substantial opportunities for reducing the overall cost of renewals by improving asset and facilities management practices.
23
There are other reasons why these figures might diverge, for example, it may reflect that the accounting rates of depreciation do not accurately reflect the reduction in the economic life of the asset and the fact that expenditure is by nature lumpy, or that better asset management is extending the life of existing assets. 24
In calculating these figures "sales and other operating income" has been included in the total of "user fees and charges”.

49
5.5 Managing and funding network infrastructure at the best scale and with the best model
5.5.1 Regional funding and management of network infrastructure may be more efficient and effective
Recent analysis suggests that there are some activities that can be most cost effectively carried out at a scale that is larger than almost all local councils in New Zealand.25 Capital-intensive network infrastructure activities such as roading and other transport and the three waters, have economies of scale which mean that, in many cases, the same or better results could be obtained for less money if they were managed at a regional, rather than a local scale. Specialised regional organisations for land transport and the three waters would allow these infrastructure assets to be managed as “a network”. Costs and benefits would be spread across the network, and trade-offs could be made based on the best choices for the network as a whole, rather than being separated by political boundaries. Regional service delivery approaches, however, may not be suitable in those cases which require very local knowledge or where preferences vary between local communities as they may result in some communities paying for a level of services greater than they would otherwise choose.
As noted in the earlier example, meeting new freshwater quality standards will require upgrades to water infrastructure in many communities, especially storm water infrastructure. A possible scenario in managing and funding these upgrades may be on a regional, rather than a local or community-by-community level. This could mean that the cost profile for each council and community may be smoothed over time, and the most important and urgent work could be done first. Costs would also be likely to be reduced overall due to economies of scale. It should be noted, however, that managing water infrastructure on a regional basis is not necessarily appropriate for all communities or resources.
5.5.2 “Public utility” models should be considered
There may be advantages to managing and funding network infrastructure through a corporate model, for example, Watercare in Auckland. Electricity network services are required to be delivered under a corporate model, and this form of service delivery is the favoured model for many forms of public transport, including bus companies and airports. There are examples in New Zealand of water, waste water and waste management being provided under corporate structures, but these institutional structures have not been adopted uniformly across councils.
The public utility model means that there is a clear separation between policy and regulatory functions and service delivery, and is usually implemented with some level of user charges. This model contrasts with the more traditional models of service delivery within local authorities which tend to compromise effective service delivery through insufficient charges, soft budget constraints, weak efficiency incentives and low accountability.
Clearer accountability for service delivery and performance of the utility drives cost savings and improvements in service quality. These gains have been extensively documented following the corporatisation of the former municipal electricity departments and electricity power boards.
The utility model also tends to open up a wider range of implementation and financing options, from the council building and owning the infrastructure itself using debt funding with the user charges dedicated to paying off the debt, to creating a public private partnership to build and own.
25
Barry, Philip, Governance Options for the Wellington and Wairarapa Regions: An Economic and Financial Assessment, TDB Advisory Ltd, August 2013.

Local Government Funding Review 50
Visitor levies, usually collected through accommodation providers, are a way for areas with tourism-based economies to directly tax visitors, in order to fund the cost of providing infrastructure and services to meet their needs.
The 2012 report of the Local Government Infrastructure Advisory Expert Advisory Group discussed the challenge of smaller councils managing infrastructure costs better. One of its recommendations encourages councils to ensure their long-term plans reflect projected numerical and age-related structural population changes and explicitly provide for these changes in their infrastructure and financial planning. By following this advice, councils should have a more accurate picture of the ability of their communities to meet the cost of new infrastructure and renewals. The Advisory Group also encouraged councils to look at mechanisms for sharing costs such as shared services, jointly owned council controlled trading organisations and, in some cases, re-organisation.
We note also that councils that invest in improving their asset management data and practices can reduce the cost of infrastructure maintenance and renewals. Wellington City Council, for example, projects that it will save $60 million over the next ten years as a result of its improved data about the status and capacity of its infrastructure.
Case Study - Thames Coromandel District Council
Presently, there are 27,000 permanent residents and rateable assessments in the district and 55 per cent of all rateable assessments are absentee ratepayers. However, there can be as many as 120,000 people on the Peninsula in any one given day at peak times. There are also up to 2,000 caravans per day in summer. It is projected that Coromandel will eclipse Taupo in event popularity in the near future. With empowerment of Community Boards, new user-pays methods are emerging locally to fund visitor infrastructure which can be models for the rest of the Peninsula to learn from:
Hot Water Beach uses revenue from paid car parking to support a fund to manage tourism infrastructure development in that area.
Capital expenditure for Whitianga Boat Ramp facilities are being paid for by boat ramp fees which will then be used to pay for other harbour/boating facilities.
Case Study: Queenstown Lakes District Council (QLDC) and recovering the costs imposed by tourism
Tourism and related expenditure is approximately 60 per cent of QLDC’s regional GDP. QLDC hosts about 2.5 million visitors each year, with a population of 23,000 ratepayers. Visitors stay an average of two nights, meaning there are five million “visitor nights” each year, versus 8.4 million “ratepayer nights” (23,000 x 365). This suggests that visitors could account for as much as 35-40 per cent of QLDC’s infrastructure costs in regard to things like water, roads and waste.
In 2012, QLDC introduced targeted rates to indirectly (and approximately) recover the cost impact of visitors through higher differentials on Visitor Accommodation and Commercial Ratepayers. However the rates taken from this are only partial cost recovery, and recent economic analysis has shown that more benefit is derived from visitors for the wider commercial sector than the accommodation sector.
A Queenstown visitor levy, payable by non-residents staying in the district, would be one form of supplementary revenue that would closely match the tax to the cost driver (number of visitors). A visitor levy scheme is already in place for Stewart Island, and the rationale for that legislation (providing facilities and amenities to visitors) is equally applicable to Queenstown and other local authorities with tourism-based economies.

51
5.6 Development contributions
Development contributions are a charge imposed on a developer by a council to recover some of the capital costs incurred by the council when providing infrastructure services for the development and for upgrading existing infrastructure where this is caused by additional demand resulting from the development. Development contributions can also include a transfer of land (for example, for reserves). Development contributions are an important source of funding for infrastructure in growing areas.
In 2012, 12 councils had no revenue from development contributions. In the same year, 18 councils received more than two per cent of their revenue from development contributions, with Selwyn District receiving 12 per cent of its revenue from development contributions. Represented in 2012 dollars, Figure 19, below shows the percentage of income each of these councils received from development contributions in 2012. The actual dollar amount of development contributions for each council is noted at the top of each bar.
Figure 19: Development contributions as percentage of council revenue for selected councils, 2012
Source: Local Government Financial Statistics
According to analysis by the Office of the Auditor General, local authorities have forecast that they will collect more than $3.4 billion in development and financial contributions between 2012 and 2022. This is about half of the forecast spending of $7.0 billion to create assets to meet additional demand.26
Changes to the LGA narrow the scope of what can be funded through development contributions. Development contributions can now only be charged for infrastructure that is directly related to the development in question. Councils cannot charge a contribution towards “community infrastructure” such as cemeteries or swimming pools, but can charge for community centres/halls, public toilets and play equipment. Councils will still be able to collect development contributions for network infrastructure: roading, water, wastewater and storm water systems. Developers and councils are encouraged to enter into “development agreements” whereby the developer provides a portion of the infrastructure for the development, and then vests that with the council, rather than paying development contributions towards the cost of the council providing that infrastructure.
26
OAG, Using Development Contributions and Financial Contributions to Fund Local Authorities’ Growth-Related Assets. August 2013

Local Government Funding Review 52
Auckland Council estimated, in its submission on those changes, that the changes will result in an additional impost on rates of $160 million over the next ten years.
LGNZ is monitoring the impact of these changes.
5.7 Conclusion
This section of the report has looked at different aspects of the overall local government funding system. Regardless of the means by which a project is financed, ultimately it must be funded by the community, whether the local, regional or national community, through some type of user fees and charges, or through taxes. This is true whether the project or service is built and run by private providers (for example, a new movie theatre, which will be funded by ticket revenues, revenues from the candy bar and advertising) or by local government (for example, an upgrade to a public swimming pool, which will be funded by some combination of rates and user charges).
The willingness of the community overall to commit funds determines the level of services and investment that is possible. Where the community, at the local, regional, or national level is not willing to pay through some means for a given project or service, then that project or service cannot be delivered.
Communities will vary in their preferences for services to be funded collectively or paid for by those who use the service. As communities change, these preferences will also change and technological progress continually expands the range of services where it may be practical to implement user charges. There appears to be scope for most councils to raise additional revenue through user charges for services currently funded through taxes.
However, taxation will remain an essential and substantial element of funding for the services provided by local government. Taxes, like death, are unavoidable. But as a society we can design our taxes.
Part 6 looks at different ways in which the current rating system can be improved.

53

Local Government Funding Review 54
Part 6 Improving the current rating system
6.1 Property rates
Local authorities already have New Zealand’s land tax base by way of rates; central government does not tax this base, having abolished land taxes in the 1990s. By comparison with other OECD countries, New Zealand does not tax real property highly. The OECD calculates that taxes on property as a percentage of all taxes is about five per cent in New Zealand. This places New Zealand 13th of 31 in terms of property taxation as a percentage of total tax revenues (central and local government) – Australia, Canada, USA and the UK all tax real property more highly than New Zealand.27
The amounts paid by ratepayers have risen over time, reflecting both increases in the scope and number of services delivered by councils, and increases in the cost of providing those services. However, as a percentage of Gross Domestic Product (GDP), rates have remained around two per cent for over 100 years; that is, rates take broadly the same share of aggregate income now as was taken at any time over the past century.
As property values have risen in line with GDP,28 the rates burden on property owners is, in aggregate, approximately the same as it has always been when assessed against property values. NZIER estimate that household incomes have risen at the same rate as GDP, which implies that rates have remained approximately constant as a proportion of household income.29
The longevity of property rates suggests property based taxes have a degree of intuitive sense and reasonableness to retain general public support. From an administrative perspective, land has the attribute of being immobile, which makes it easy both to assess liability and to collect taxes on it.
There is also a link between council activities and property values, at least in urban areas. In built up areas residential and commercial property values tend, in some part, to reflect the benefits of local council amenities and services available in the area. There is some alignment therefore between the revenue mechanism and the activities for which local authorities are accountable to their communities. However, there is a less direct connection between the value of land-based industry (such as farming and horticulture) and council activities, or the value of capital intensive industry and council activities.
General rates are roughly progressive - those with higher-value properties pay more. However, property taxes are, by definition, based on property wealth, rather than on income or total wealth. People with high-value properties, but lower incomes or total wealth can find it difficult to find the cash flow to pay their rates. People with valuable landholdings and business which are land based, such as farming, are potentially disproportionately affected by rates, as are retired people whose primary residences are, on average, higher value than for other households with equivalent incomes.30
Auckland’s experience with a substantial gap emerging between expected funding needs and current revenue sources is common with many other large metropolitan centres. Such cities tend to rely more on property taxes than many other localities. This is due to the fact that they have a larger per-capita tax base than smaller cities or rural areas and usually have higher property values and because of their larger high proportion of commercial and
27
OECD Revenue Database, cited in Policy Advice Division of the Inland Revenue Department and the New Zealand Treasury, Land Tax, Background paper for Session 3 of the Victoria University of Wellington Tax Working Group, September 2009, page 18 28
Phil Briggs, Tim Ng, Trends and cycles in New Zealand house prices, Reserve Bank of New Zealand, 9 July 2009. 29
NZIER quoted in OAG 2014 30
Policy Advice Division of the Inland Revenue Department and the New Zealand Treasury, Land Tax, Background paper for Session 3 of the Victoria University of Wellington Tax Working Group, September 2009, page 11.

55
industrial properties, which are almost always taxed at a higher rate than residential properties.31
However, the potential of property taxes to fund the costs of infrastructure and services required for a major metropolitan city to operate is constrained, partly because of limited flexibility and the fact that increases in the property tax burden are shared unevenly. The OECD notes that no country has managed to raise more than ten per cent of its total tax from property taxes. In New Zealand property tax constitutes currently about 7.2 per cent of total taxation (the long run average is 5.8 per cent but, due to the Global Financial Crisis, government revenue is proportionally lower).
Another issue for using property tax revenues to fund the cost of infrastructure expansion is that such taxes respond less quickly to changes in the economy than taxes on income or sales, because economic growth is not capitalised fully into real estate investment and land ownership.
Enid Slack, from the Institute for Municipal Finance and Governance in Toronto, explains the issue in the following terms: Large cities and metropolitan areas are often not treated any differently from smaller cities and towns - but they should be. Metropolitan regions can, and should be, essentially self-financing through user fees and taxes. The property tax is a suitable tax for local government, but, given that it is relatively inelastic, highly visible and politically contentious, it is insufficient to fund the complex and increasing demands on governments in metropolitan areas. Access to a portfolio of taxes would provide stability (through the property tax) and elasticity (through income, sales or business taxes).32
6.2 Differentials
Many councils have a diverse set of communities in their area, from urban dwellers who catch the bus every day and use the library, to farmers who come into town once a week. Many councils with diverse communities within their areas use rural differentials to reduce the proportion of the rates paid by rural properties. New Plymouth District Council, for example, applies four differentials to its general rate levied on land value, namely residential, farmland (larger than four hectares), commercial land and small holdings (one to four hectares). Farm land pays 15.8 per cent of the general rates; residential pays 54 per cent, commercial 27.2 per cent and small holdings three per cent.
New Plymouth also makes use of a uniform annual general charge (UAGC) which is applied to all properties. UAGCs diminish the impact of property values on the rates paid as they are unrelated to property value. Councils tend to use UAGCs to pay for those costs that are deemed to have community-wide benefits, such as the cost of democracy or governance.
Many councils apply targeted rates as a way of creating a match between those who benefit from a service and those who pay. This might include, for example, targeted rates on urban properties to pay for community amenities and targeted rates on rural properties to pay for flood protection schemes. Targeted rates can also be adjusted to reflect the different distances away from services that people live.
To ensure rural residents, which tend to be a minority within combined districts, have a voice around the decision-making table, some councils, such as Hastings District Council, have established rural community boards and given
31
Bird and Slack (2004) Taxing Land and Property in Emerging Countries IMFG accessed from: http://www.munkschool.utoronto.ca/imfg/uploads/101/taxing_land_and_property_in_emerging_economies_july_2006.pdf 32
Slack (2013) Financing Large Cities and Metropolitan Areas, Institute on Municipal Finance and Governance (IMFG) Munk School of Global Affairs, University of Toronto (Pg. 14), http://munkschool.utoronto.ca/imfg/uploads/174/enidslack_imfg_no._3_online_.pdf

Local Government Funding Review 56
them the right to make decisions or recommendations on matters affecting rural residents. This is a way of ensuring that services provided to rural residents are more closely matched with their needs and preferences.
Councils can choose to apply a rating differential to groups of ratepayers, in order to control the proportion of rates paid by different groups of ratepayers. The urban residential rate is often used as the “base” rate, and differentials are applied to, for example, businesses and rural residents. For example, if general rates for urban residential properties are set at 0.4 per cent of the capital value of the property, and the business differential is twice the residential rate, businesses will be charged 0.8 per cent of the capital value of their property as their general rates charge. Rating differentials only apply to general rates, not to uniform annual general charges or to targeted rates.
The rationale behind rating differentials is not always transparent. However, differentials are a helpful tool by which councils can target rates to those sectors in their communities which benefit from them.
6.3 Statutory rating exemptions
The Local Government (Rating) Act 2002 (LGRA 2002) sets out various categories of non-rateable land. Councils can levy targeted rates for water, sewerage and refuse collection on non-rateable land, but cannot levy any other type of rate.
According to Quotable Value, the current total capital value for all land in New Zealand is $1,087 billion, of which about $40 billon – approximately 3.7 per cent – is non-rateable, or only partially rateable. At an estimated national average rating percentage of 0.45 per cent of capital value,33 that represents about $180 million of rates revenue annually.
Non-rateable land falls into five main categories:
a) conservation, health and education land, including Crown land that is used broadly for conservation and recreational purposes and land owned or used by District Health Boards or not-for-profit educational institutions, from early childhood to schools, to tertiary institutions;
b) land used for religious worship and religious education, or for charitable purposes;
c) land that is used for transport infrastructure (roads, wharves, railways and airports);
d) land used by a local authority for conservation and recreational purpose; and
e) Maori land of various types.
Land used for education and health purposes makes up nearly 45 per cent of non-rateable land by value (see Figure 20). Forest and passive reserves (conservation land) makes up 97 per cent of non-rateable land by land area (Figure 21) but only 20 per cent of non-rateable land by capital value.
33
This estimate is derived by dividing the 2013 national rate take by the national capital value.

57
Figure 20: Non-rateable land by capital value
Source: Quotable Value
Figure 21: Non-rateable land by area, 2013
Source: Quotable Value

Local Government Funding Review 58
Non-rateable land is not evenly distributed among jurisdictions, affecting some jurisdictions much more heavily than others. This is especially the case for conservation land and Maori land, which tend to be clustered in some parts of the country. Other types of rating exemptions tend to be spread more evenly between councils.
With the possible exception of exemptions on Maori land, LGNZ does not see a coherent, principles-based argument to support statutory rates exemptions. Central government should take responsibility for the full cost of providing conservation, health and education services, rather than requiring a “back-door” contribution from local government. Transport services should pay their way as part of the community. Further, local communities should have the autonomy to decide if they wish to subsidise religious and charitable groups.
6.3.1 Are these exemptions justified?
Throughout this paper, we have focused on the principle that decision-making authority, and the responsibility for funding the cost of those decisions should, where possible, be aligned, in order to ensure that the decision-makers have a fiscal incentive to make reasonable trade-offs between service levels or scope, and cost. Statutory provisions that exempt certain types of land from rates very clearly breach this principle. Central government sets the exemptions, but local communities pay for them, as the rates burden in each area is spread over a narrower base than would otherwise be the case.
6.3.2 Conservation, health and education exemptions
Central government is responsible for maintaining and managing the conservation estate, and for providing a level of health and education services to the population. Central government makes decisions about the level of public provision of these activities and New Zealanders fund central government’s contribution to these activities through general taxes. There does not seem to be any coherent, principle-based reason why local government should be required to contribute to these services through a rating exemption, especially as local government has no control over the level of the contribution it makes, or how that contribution is spent.
6.3.3 Religious and charitable exemptions
Local communities may well wish to subsidise local activities such as religion and charity. This could be done through a given local authority’s rates exemption or rates rebate policies. It is difficult to see a sound justification for imposing this subsidy on communities, rather than leaving them the freedom to make their own choices about which community activities should receive council subsidies.
6.3.4 Transport exemptions
Transport infrastructure covered by this rating exemption may be run on a commercial basis (airports, many wharves), commercially with some subsidy from central government (railways) or as a public good funded by central and local government (most roads). On the face of it, there is no reason why commercial entities such as airports, ports and railways should not pay rates just as other businesses do. Determining the value of the roading
Case Study: DOC land in Westland
In Westland, Department of Conservation (DOC) land makes up approximately 20 per cent of the total capital value: $0.5 billion worth of DOC land compared to $2.3 billion of rateable land, according to figures provided by the council.
Rated at the rural property rate, the half a billion dollars’ worth of DOC land would generate around $730,000 annually (18.5 per cent of the general rates Westland collected in 2014/15). This would reduce
rates on every other property by $53.00 per year for each $100,000 of land value.

59
network would probably be difficult and expensive. However, this could be done if it were considered important enough. Alternatively, central and local government (who, between them, own all public roads) could come to an agreement about a payment in lieu of rates in respect of the roading network.
6.3.5 Local authority conservation and recreational land exemptions
This exemption is less onerous than the examples above, as, if this land were not exempt, local authorities would be paying rates to themselves, which would not actually increase the rating base in their area. However, this is a decision that each community could make for itself, rather than having a statutory requirement that these areas are exempt from rates.
6.3.6 Maori land exemptions
Under the Local Government (Rating) Act 2002 Maori land is liable for rates in the same manner as general land, unless otherwise stated within the Act. Land which is not rateable includes:
Maori customary land;
reservations under S. 338 of Te Ture Whenua Maori Act 1993 that are used for the purposes of a Marae or meeting place and are under two hectares or is a Maori reservation under S. 340 of that Act;
Maori freehold land that does not exceed two hectares and on which a Maori meeting house is erected; and
Maori freehold land that is non-rateable by virtue of an Order in Council34.
A total of 1.5 million hectares, or six per cent of New Zealand’s land mass, is in Maori freehold title, with proportions for individual councils ranging from 14 per cent of land area in the Far North District to only 0.5 per cent in Kaikoura District. Much of this land is unproductive for various reasons – for example, 33 per cent is inaccessible except through other properties. Councils are required to have a remission policy on Maori land to provide options for dealing with unproductive Maori land. This can include remitting rates where councils deem this to be appropriate.
The historic issues underlying Maori land make rating Maori land an especially sensitive topic. The statutory exemptions cover only a small proportion of total Maori land. A larger concern for councils with substantial amounts of Maori land in their districts is the non-payment of rates on Maori land that is, in theory, rateable. The current level of rates arrears on Māori land is more than $65 million, and has almost doubled in the past six years. Maori land cannot be sold (without approval from the Maori Land Court) or taken in compensation for unpaid rates. Unpaid rates are written off every six years.
A considerable amount of Maori land is multiple-owned and the average number of owners is 73. This can make it difficult for a council to collect rates, particularly if the land is unproductive. Councils can approach the Maori Land Court for advice on which one of the owners or an agent of the owners should receive the rates invoice and if the entire area is leased, then the lessee is liable for the rates (unless the contract provides that they are not liable).
Where land is unproductive due to an inability of the owners to agree to the economic use of the land, councils are increasingly working with representatives of the owners to put in place governance and management structures that enable land to be turned into economically viable farming operations. This benefits the councils (which receive rates from the land) and the owners. Some councils, such as the Far North District Council, work with the owners of multiple owned Maori land to establish a trust or some legal entity to take over the day to day decision-making about the use of the land. The entity will then take responsibility for employing a farm manager to operate the property as commercial entity.
34
This is a seldom used provision.

Local Government Funding Review 60
6.4 Addressing affordability for individual ratepayers facing hardship
Basing rates on the value of property means that, for some individuals with reasonably valuable property but limited income, paying rates can cause financial strain. All councils will have some ratepayers in this situation, even if all the issues outlined above are addressed, and rates are set at a level that is reasonable and affordable for the majority of the community.
The government provides a rates rebate scheme for low-income ratepayers. A rebate is a payment from the government to cover part of the cost of the rates paid by a low-income ratepayer. When the scheme was reviewed in 2005 it was estimated that 300,000 household were eligible, however take-up is well below this level with the Department of Internal Affairs estimating that in 2007 the take-up rate was 46 per cent. Anecdotal evidence suggests that there has not been a significant increase since then.

61
Increasing the take-up rate of the Rates Rebate Scheme will assist with addressing the rates affordability issue for a substantial number of households which are currently not benefiting from the scheme. Reasons for the low take-up rate are generally regarded as a combination of insufficient promotion, complex administrative processes and a sense that it is a state hand-out.
Many councils encourage agencies, such as GreyPower and Age Concern, to promote the Rates Rebate Scheme amongst their membership and, in some cases, may contract the agencies to assist applicants apply for the scheme. Some form of national promotion might be justified to inform households that the option exists. LGNZ has argued in the past that the process would be administratively less complex if it was managed nationally by Inland Revenue Department (IRD), rather than by each council separately. Using the IRD could remove any personal embarrassment individuals might feel about applying for the assistance.
Case Study: Horowhenua District Council rates rebates
As of December 2014, 1,658 people in Horowhenua District Council have applied for rebates totalling nearly $902,000; and the Council believes many more are eligible. In Horowhenua, the rebate is based on a total income for the year ending 31 March 2014 and charged rates (both Horowhenua District Council and Horizons). Qualification includes living on the property at 1 July 2014 and being named as a property owner. Residential ratepayers with a combined income of up to $24,250 may be eligible for a rates rebate of up to $605.
Those earning over the income threshold may still qualify for a lower rebate, depending on the rates amount and number of dependants. The income threshold is increased by $500 for each dependant in the household. Further, those who collect Superannuation or own a business may also qualify.
If a couple collects Superannuation, their ability to qualify for a rebate will depend on the amount of rates charged, and if they have any income in addition to Superannuation. For example, if a couple where both partners qualify for New Zealand Superannuation (estimated income of $32,275 in 2013/14) - and received no other income in 2013/14 - they would be eligible for a rebate as shown below:
Level of rates Estimated rebate
$1,700 $0 $2,000 $223 $2,200 $357 $2,400 $490 $2,600 $605
Those who own a business may qualify for rates, but this will depend on the level of income and the amount of charged rates. A business owner would need to bring in their business accounts for the year ending 31 March 2014 for review. For example, a household with an income of $30,000 and one or two dependents would be eligible for the following rebate:
Level of rates Estimated rebate Estimated rebate (one dependant) (two dependents)
$1,100 $0 $33 $1,350 $137 $200 $1,600 $304 $367 $1,850 $470 $533 $2,100 $605 $605

Local Government Funding Review 62
Councils have the authority to set their own rates remission policies. A rates remission policy means that the council decides that the ratepayer does not have to pay all or part of their rates. Many councils have rates remission policies for ratepayers facing financial hardship.
A number of councils are part of a rates postponement scheme for ratepayers over 65. Rates postponement allows ratepayers to accrue the annual cost of their rates against the value of their house. Under the scheme the rates, and all interest charged on the unpaid rates, is paid to the council when the house is sold. Interest rates are generally set at the council’s rate of interest plus one per cent. The scheme provides a useful mechanism for a specific group of ratepayers - older people with significant equity in their homes that enables them to stay in their homes even though household income may be insufficient to meet the cost of property taxes.
Overall, the current system for dealing with affordability issues for individual ratepayers seems sound but could possibly benefit from increased promotion. Central government makes a contribution to this issue through the rates rebate scheme. Where that is not considered sufficient, councils have appropriate tools to remit or postpone rates for those in severe financial hardship, or where ratepayers are asset rich but cash poor.
6.5 Conclusion
In this Part we examined specific issues with the rating system and how these might be addressed. Problems identified include the lack of any rational basis for the current exemptions which are set in legislation, the difficulties faced by the owners of multiple owned Maori land in receiving a commercial return from that land and policies designed to encourage that process, and the issue of affordability for residents facing hardship.
A number of the issues discussed are a direct result of local government’s reliance on a single tax base; property. If councils had access to a broader tax base they would possess additional funding tools that would enable them to address such issues. This is the subject of the next section of the report. Part 7 looks at other taxing options and comments on the degree to which they might be suitable to assist with the funding of council services.
Case Study: Postponement scheme – Western Bay of Plenty
The Western Bay of Plenty District Council’s rates postponement scheme gives home-owners aged 65 and over the opportunity to stop paying rates for the rest of their lives.
Councils throughout New Zealand can choose how flexible they are in setting a rates postponement policy because the Local Government (Rating) Act 2002 and the Local Government Act 2002 changed the law to allow councils to postpone the payments of rates for residential ratepayers. Before these laws were enacted rates could only be postponed if the ratepayer proved they were suffering hardship.
In the case of the Western Bay of Plenty, the council has elected to offer a scheme that will be available to residential ratepayers aged 65 and over. The aim is to give these ratepayers a choice of paying their rates now or later.
Under the scheme, people have the option to postpone payment of all, or a portion of their rates, for a fixed or indefinite period. This is subject to the full cost of postponement being met by the ratepayer (ie interest charges and administrative costs) and Council being satisfied that the risk of loss in any case is minimal.

63

Local Government Funding Review 64
Part 7 Options for change: available tax bases
7.1 Tax by design
In designing taxes to fund local government, choices must be made in relation to:
how the tax rate is set in relation to the tax base – whether the rate is set for a period of time with revenue changing in line with the tax base or reset annually to achieve a specified amount of revenue; and
the tax base - the activity or thing that is taxed.
7.1.1 Setting a tax rate or the amount of tax
Local authority taxes are currently set to raise a quantum of money which is determined annually. Total rates revenue is determined by the council in advance and this amount is allocated among ratepayers according to the values of their properties. Hence, the share of general rates paid by an individual ratepayer depends upon the value of that ratepayer’s property relative to the value of the properties of other ratepayers which are subject to the same rate. However, the total amount of revenue raised does not change as property values change.
All other taxes levied in New Zealand are set at a specified rate, which is then levied against a defined tax base.35 As the value of the tax base changes over time, the amount of revenue raised for a given tax rate also changes. For example, the revenue central government receives from GST increases as economic activity, and in particular household consumption, increases.
This aspect of the current rating regime is not a consequence of the tax base. A tax based on property values can be set as a percentage of the property value - the land tax previously levied in New Zealand was applied as a set percentage of land value with the amount of tax collected rising in line with land values.
The requirement to set rates to recover a defined quantum of money is an aspect of the requirement that councils balance their books and may only borrow for infrastructure spending.
7.2 Setting the tax base
The normal criteria governments use for assessing tax options are economic efficiency, fairness and simplicity.
7.2.1 Recognising incentives on tax payers and those levying the tax
Prices play a central role in the modern market economy, as signals that reflect and guide what we decide to consume, our choices between work and leisure, where we live and work, and decisions by producers. Taxes disrupt these signals by driving a wedge between the price paid by the buyer and the price received by the seller. For example, income tax means that an employer pays more for an hour of work than the employee receives for it, while GST means that a retailer receives less for a product they sell than the customer pays for it.
By increasing prices and reducing quantities bought and sold, taxes impose losses on consumers and producers alike. The sum of these costs almost always exceeds the revenue that the taxes raise - and the extent to which they do so is a loss to society (economists refer to this loss as a deadweight loss as no one benefits from the cost). A key goal for tax design is to reduce the deadweight loss of the system as a whole as far as possible.
To minimise these social costs, successive New Zealand governments for the past 30 years have adopted a
35
For constitutional reasons, income tax rates are confirmed by Parliament each year. However, for practical purposes the tax rates are the subject of explicit, well publicised adjustments, rather than re-set each year to achieve a pre-determined amount of revenue.

65
strategy of levying taxes in as comprehensive a manner as possible at rates as low as possible. This is the “Broad Base Low Rate” strategy. The economic argument for this strategy is that, provided a sensible tax base is chosen, taxing it comprehensively rather that selectively is the least distortionary way of raising revenue. Taxing some aspects of the base (such as some forms of income or some forms of expenditure) distorts economic decisions by artificially encouraging people to earn income or spend money in non-taxable ways.
Selective taxation is generally justified where there is a public policy reason for encouraging or discouraging some activity – examples are excises on alcohol and tobacco and environmental taxes. Selective taxation is also used where there is a reasonably close relationship between the expenditure being taxed and the activity being funded by the tax, such as petrol taxes and road funding.
The ability to tax also changes the incentives on the entity with the power to tax. Policy makers make better decisions when they also bear the cost and quality of their decisions. Local taxes mean elected representatives must account to their communities for local government expenditure and revenue. Clear links between tax revenue and expenditure create fewer opportunities for waste and maladministration.
Councils which compete for new inhabitants or new businesses – and benefit from an expanded tax base in doing so – face incentives to keep taxes low. These councils also face incentives to make conditions conducive to the activity they wish to encourage; for example, this might be to ensure local planning allows the right kind of housing or zoning that releases land for higher valued uses or policies that are business friendly.36 Local decision-making across a greater range of the attributes of our tax system would allow tax decisions to more effectively reflect the opportunities and needs of the private sector in different parts of the country. Devolved decision-making of this nature would be consistent with the concept of subsidiarity – the principle that political power should be exercised by the smallest possible unit of local government.
To be welfare enhancing at a national level, these incentives should stimulate actions which improve outcomes for society as a whole and not simply encourage activities to shift from regions in which they are most productive to regions in which taxes are lower. A tax incentive which shifts activity from productive to less productive areas may lift activity in one region but would reduce national welfare. As it is easier to shift activities between local authority areas, as compared to national territories, there are higher potential adverse incentives from the revenue raising mechanisms of local authorities than between nation states.37
Hence, a funding system concerned about economic efficiency would align the incentives, on the local authority and those that pay the tax, with the national welfare, the interests of the local community and with the accountability of the local authority to its local community.
36
See for example chapter 3 on tax competition by local government in Switzerland, a country which builds bigger and better houses while keeping house prices stable, in Evans, A, O Hartwhich, Bigger-better-faster-more---why-some-countries-plan-better-than-others’: http://www.oliver-marc-hartwich.com/publications/bigger-better-faster-more---why-some-countries-plan-better-than-others. In Switzerland a large portion of the expenditure which is funded through income tax (health, welfare) is funded through compulsory insurance. 37
Oliver Hartwich describes the potential for tax competition to become a vicious circle: the people remaining in the cities with higher taxes are likely to be those paying less taxes but demanding more public services whereas communities on the fringes attract, through lower taxes, a population that is wealthier, in need of less services and still using public goods provided by the core cities, op cit, p 34.

Local Government Funding Review 66
7.3 Fairness
Any modern and efficient tax system relies upon a high degree of voluntary compliance. If a tax is to retain general public support, tax must be viewed - by the community asked to bear the burden of the tax38 - as intuitively sensible, fair and reasonable. Communities, and individuals, will differ as to the characteristics of a fair and reasonable tax. For example, people have different views as to the extent to which a tax should redistribute wealth or income by taxing wealthier individuals more. These preferences may change over time along with other community values. However, changing a tax system is very costly and therefore the tax system should be aligned as much as possible with enduring values.
Whether a tax is viewed as fair and reasonable may also change with the population and economic activities over which the tax is levied. A tax might be viewed as fair and reasonable when levied across a community with similar preferences and values but might be perceived as unfair if the boundaries of the community, or its economic activities, change. Local government amalgamations that combine rural and urban communities, for example, may necessitate a changed approach to share costs equitably.
7.4 Simplicity
Revenue raised by a tax system is a transfer from the taxpayer to the tax collector; this transfer is not a cost to society as the money is used for other purposes. The costs of administering and complying with the tax are however a cost to society as these costs reduce the resources available for other purposes. Hence, the costs to taxpayers in complying with the tax, and the cost to the tax collector, should be kept as small as possible, commensurate with the amount of revenue raised.
There are significant economies of scale in tax collection. These economies of scale result from processing efficiencies as some forms of tax require computer systems and databases to maintain taxpayer accounts. There are also only a few individuals with the skills and experience to apply the judgements required to apply the complex tax rules inherent in some forms of tax (for example, to apply transfer pricing rules to cross-border transactions).
Taxes which are comparatively simple to understand and apply are less costly to administer and comply.
7.5 Available tax bases
Although the world is replete with numerous forms of taxation, there are only a limited number of potential tax bases from which to raise revenue. A tax base is the activity or thing that is subject to tax. The available tax bases are as follows:
income;
expenditure;
land;
poll; and
transactions.
38
The imposition of a 20 per cent sales tax on boats and caravans in 1979 illustrates the difference between the economic burden of a tax and its legal incidence. The tax was imposed because these items were viewed as luxuries consumed by the wealthy. The effect of the tax was to contract both industries and the impact was mostly felt by the workers who lost their jobs; the truly wealthy could holiday overseas or shift consumption to non-taxed items.

67
The multitudes of taxes in place around the world are largely variations in the means used to raise tax from this set of possible tax bases, including selectively taxing only part of a given base. For example, death duties or estate taxes for example are a tax on wealth (thus a tax on the income base) combined with a transactional element – death.
7.6 Income tax base
All forms of income are potentially subject to tax – labour (income earned from personal exertion) and capital (income earned from investing) income. The New Zealand income tax is a relatively comprehensive tax on this base. The most noted exception is that capital gains are not taxed comprehensively – individuals do not pay income tax on the increase in the value of their home, for example.
A tax on wealth or capital is merely a variant of an income tax. Under our ‘fair dividend rate’ rules we tax overseas equity portfolio income at a deemed rate of return - five per cent of the value of the portfolio. This deemed rate of return is taxed as income. A wealth tax would apply this idea more broadly so that the wealth tax rate is the deemed rate of return from capital held by taxpayers multiplied by the tax rate on that income.
7.7 Expenditure tax base
All forms of expenditure or consumption are potentially subject to tax. If all income was spent, then an expenditure tax would be the same as an income tax. An expenditure tax excludes from the tax base all income that is saved and invested and hence not spent. This means an expenditure tax excludes capital income.
Taxes on expenditure can take various forms:
a retail sales tax, levied on consumption at the retail level;
a wholesale sales tax, levied on consumption at the wholesale level;
a VAT/GST, levied at each stage of the supply line; and
economists have also designed various direct expenditure taxes that tax total income less investments.
Our GST is a comprehensive expenditure tax. Expenditure taxes are also often applied selectively to a tax some forms of expenditure more than other forms of expenditure – excises on alcohol, tobacco, gambling and petrol are examples.
7.8 Transaction tax base
Transaction taxes, where specific types of transactions are taxed, used to be common in New Zealand and are still common overseas. Stamp duties on property transfers are a form of transaction tax.
Economists generally regard transaction taxes as highly distortionary and inefficient because the tax discourages the transaction subject to tax. Transaction taxes cause costly changes in behaviour and are often avoided. Hence, transaction taxes tend to be economically expensive while raising little revenue relative to that cost. For example, in New Zealand stamp duties on share trades carried out in New Zealand resulted in trades being made offshore, raising costs to those that trade in shares with no revenue to the government.
7.9 Poll tax base
A poll tax is a tax calculated as a lump sum tax levied on each person without regard to the person’s income or expenditure. A poll tax could be levied on households, or properties, with much the same effect. A poll tax it is favoured by many economists on the basis that levying the tax does not significantly affect behaviour, and hence would have little economic distortions or cost. However, poll taxes have proved to be very unpopular when utilised as the primary

Local Government Funding Review 68
source of revenue; raising most of a council’s revenue by a poll tax is viewed as being very unfair.39
Local authorities currently have the power to levy a form of poll tax via the uniform annual general charge; this is a flat dollar charge per property or separately used/inhabited part of a property.
7.10 Land tax base
Land is one form of capital, but a peculiar form in that the supply of land is for all practical purposes constant – the quantity of land does not change with price or by the extent to which it is taxed. Because land is in fixed supply, a tax on the unimproved value of land is borne by the owner of the land through changes in asset value.
When a pure land tax is introduced, the owners of the land subject to a land tax suffer an immediate loss in the value of the land and hence their wealth and this would likely impact on their future decisions, but the land would remain in its best use.40 This compares with say an income tax that discourages work and saving, both of which react to the higher tax and lower post-tax return from working or saving. This means that a pure land tax has little economic efficiency cost – no change in behaviour results from taxing land. A pure land tax base is thus a favoured tax base of many economists.41
However, a land tax is rarely introduced or maintained in its pure form, and if only some forms of land are taxed the tax loses its economic efficiency characteristics.42 Rates levied on improved values do not share the economic efficiency characteristics of a pure land tax, and may discourage investment in improvements and thus come with an efficiency cost.
7.11 Options for New Zealand local authorities
7.11.1 Local income tax
There would be a number of hurdles to overcome to enable local authorities in New Zealand to levy their own income taxes. The administrative economies of scale of administering our income tax are large. A true local income tax – where the tax was determined and collected locally – would require local authorities to replicate IRD resources and hence would be prohibitively expensive.
A local authority income tax could be implemented as a surcharge on the existing income tax with the surcharge set by each region. However this form of tax would require complex rules to allocate the revenue to each local authority – an internal web equivalent to our international tax treaties (complex transfer pricing rules, anti-arbitrage rules, tax resident rules etc). These rules would need to decide, for instance, where to allocate the tax on a company with a Christchurch head office, owned by shareholders in Dunedin, manufacturing in Wellington and selling in Auckland.
In some overseas jurisdictions, local government is funded through payroll tax; this is a partial income tax that is levied on wage and salary earners. These forms of tax are less costly to administer than a comprehensive income tax, but are subject to avoidance by groups in the community that can convert their income to non-wage forms (self-employed for example, who might pay themselves a dividend out of profits rather than a salary). Payroll taxes
39
The Margaret Thatcher led government introduced a poll tax to replace rates in the United Kingdom from the 1989/90 financial year. The tax was unpopular and led to riots. John Major, who replaced Margaret Thatcher, announced in his first parliamentary speech as Prime Minister that the poll tax was to be replaced by a ‘Council Tax’ based on property values. 40
As an indication of the effect on land values, a 1 per cent land tax is estimated to reduce land values by 16.7 per cent, see Andrew Coleman, Arthur Grimes, Fiscal, Distributional and Efficiency Impacts of Land and Property Taxes, paper presented to Tax Session, New Zealand Association of Economists conference, July 2009. 41
See for example, Policy Advice Division of the Inland Revenue Department and the New Zealand Treasury, Land Tax, Background paper for Session 3 of the Victoria University of Wellington Tax Working Group, September 2009, page 11 42
A land tax was introduced in New Zealand in 1878 and abolished in 1990.

69
also distort economic activity by encouraging investment in capital intensive activities over labour intensive activities, as the tax is only paid on the labour component.
7.11.2 Sharing revenue to align incentives
There appear to be opportunities to better align aspects of our current income tax regime with the incentives on local government and the economic growth objectives of central government.
An example might be to strengthen current income law which taxes (at the national level) profits from land sales where land has been re-zoned. In theory, these profits from increases in land value are taxable now under our income tax laws when the activity is undertaken by developers, but the revenue does not go to local government.
Perhaps all of the income tax revenue raised from existing taxes on profits from land sales should be allocated to local authorities. This would recognise that much of the increase in land value is made possible by local authority infrastructure investment and encourage local authorities to reconsider the economic effects on land supply from zoning decisions.
Similarly, local communities should benefit from the income tax paid by extractive industries – oil, gas, coal and mineral mining. These activities are currently taxed by a royalty, all of which is paid to central government.
In many cases the activity is made possible by the regions which provide much of the infrastructure and housing needed to support these industries. Local government develops roads, provides services and amenities that enable extraction, yet these regions do not currently receive any direct benefit from the hundreds of millions of dollars in royalty payments paid each year. Local communities are also left bearing a substantial portion of the ‘clean- up’ risk in the event something goes wrong. Sometimes these events occur many years after the activity has ceased production, such as land subsidence in areas previously mined or the discovery of contaminated sites.
A ‘local share’ would help build the partnership that is needed between investors, local communities and central government to maximise the benefit of our mineral estate. There are examples overseas, including Western Australia’s Royalties for Regions, which recognise the importance of reinvesting royalties directly into the local communities where extraction is taking place.
Similarly, rules of thumb could be adopted to allocate income tax revenue received by the central government, such as on a measure of regional activity. Mechanisms similar to this exist overseas – for example in Germany – and recognise the role of local government in supporting regional economic activity.
7.11.3 Local expenditure tax
Another form of local authority tax base common overseas is expenditure tax. These taxes may take the form of regional sales taxes, or taxes on specific types of expenditure, for example, hotel room taxes.
Introducing a comprehensive local expenditure tax would face significant hurdles as local expenditure taxes could undermine the existing policy of a broad based consumption tax such as our internationally acclaimed and comprehensive GST.43
A local authority supplement could be added to the existing GST rate. However, the revenue would have to be geographically allocated. Calculating the amount of net GST tax (output tax less input tax credits) attributable to a particular geographic area would be very problematic. Even if this were possible it would result in tax revenue being allocated to areas that consumed a lot (for example, Auckland and Wellington) to the detriment of those
43
Ian Dickson, David White, Tax Design Insights from the New Zealand Goods & Services Tax (GST) Model, Centre for Accounting, Governance and Taxation Research, Victoria University of Wellington.

Local Government Funding Review 70
that produced - especially rural areas where a lot of economic activity is zero rated exports44 - and to the detriment of areas making substantial capital investments (which would be eligible for input credit deductions).
There is potential for a GST sharing arrangement in which some part of the revenue collected by central government from GST is shared with local government to recognise local government support of regional economic activity. A mechanism similar to this exists in Australia in which some of the GST collected nationally is shared with the state governments according to a formula determined by the Federal Government.
7.11.4 Selective taxes
There may be value in exploring taxes that are selective where there is a reasonably close relationship between the expenditure being taxed and the activity being funded, or where, for policy purposes, it is considered desirable to alter incentives.
The central government imposes excise taxes where the market price does reflect the social cost – tobacco and alcohol are taxed, for example, in part because of the social costs associated with consumption of goods. The central government recovers some of the additional national health and social welfare costs through the national excise taxes.
There are other activities in which the costs are largely incurred locally. Taxes on consumption or activities seen as environmentally damaging could be explored. Many of these seem to directly relate to local government responsibilities – refuse disposal, clean water etc. Revenue raised could be used to support restoration or regional policy processes. For example, NZIER estimates that a tax of one cent per cubic metre of water allocated through consenting processes would raise $39 million in revenue.45 Designed well, these forms of taxes may contribute to other national objectives, such as encouraging more effective use of natural resources.46 Care would be needed that this did not result in environmentally damaging activities relocating to areas where such taxes were kept low when the problem is a national one.
Selective taxation can also be justified in situations where there is a reasonably close relationship between the expenditure being taxed and the activity being funded by the tax. Important examples of supplementary funding sources that may meet this criterion include bed taxes or visitor levies, road pricing, regional fuel taxes and development contributions.
The term “road pricing” covers a range of ways of charging users for roads. In the past, tolling has been the main form of road pricing. Modern technology enables more sophisticated versions of road pricing, including variable charges depending on how far a user has driven, in what type of vehicle, at what time, and over which roads. Like other costs, road pricing can help manage demand and reduces the pressure on other funding sources.
Auckland Council is currently proposing a motorway charge, which would involve a charge on motorists each time they use the motorway network, which may vary by time of day or day of the week. Allowing Auckland Council to implement this option will require changes to legislation.
44
This was the experience in Papua New Guinea which introduced a regional GST, with the net effect of raising revenue for Port Moresby rather than the regions as intended. 45
NZIER, 2014, Implications of party policies on water regulation, Report to Federated Farmers, September 2014. Available at
http://www.fedfarm.org.nz 46
In many regions less than 50 per cent of the consented allocation of water is used and a tax may encourage the unused water to be made available for other purposes. The Ministry for the Environment estimates that a 1 per cent increase in the availability of water (through improved efficiency) would result in an economic benefit to New Zealand of $389 million per annum: http://mfe.govt.nz/rma/central/nps/regulatory-impact-statement.html

71
7.11.5 Regional fuel taxes
A regional fuel tax is a way for a region to tax drivers in order to fund transport projects. Regional fuel taxes have been the subject of much debate in New Zealand in recent years, with the ability for councils to request that government allow them to institute a regional fuel tax being repealed in 2013. Any regional fuel tax would therefore require a change to the Land Transport Management Act.
Concerns around regional fuel taxes have included price spreading (where petrol companies raise the price of petrol around the country to compensate for the tax, potential for avoidance and administration costs. However, a 2012 report by BERL found that price spreading could be effectively addressed with monitoring and penalties, the avoidance was likely to be a minor issue and that administration costs for a tax imposed at the retail level were likely to be low.47
7.11.6 Transaction taxes
Overseas there are many precedents for transaction taxes at the sub-central government level. Australia’s stamp duties are an example. Many of the potential revenue options suggested for local authorities, when analysed, amount to transaction taxes. However, the New Zealand government has, as a matter of policy, removed such taxes because of their high economic cost relative to the amount of revenue raised. Transaction taxes imposed by local authorities would suffer from the same problems.
7.12 Options for vulnerable communities and councils
As outlined earlier, for some smaller, older or poorer communities, the need for services and infrastructure to maintain liveability and sustain economic activity is likely to outstrip their combined resources and ability to pay. It is unlikely that private capital can be attracted to help finance projects and services in these areas, as the problem is an underlying gap between the ability of the community to pay for projects or services, and the needs of the community. In this case, the community would not be able to provide an adequate income stream to create appropriate returns for any private capital.
The answer, therefore, has to lie in a combination of reducing the costs faced by these communities and increasing the resources (funding) available to them, which may include some form of equalisation funding.
7.12.1 Reducing network infrastructure costs
Part 4 describes how many councils could reduce costs by managing and funding network infrastructure at a regional level and by improving the information and management of infrastructure. It is especially important that vulnerable councils move to take full advantage of these opportunities to reduce costs for their community. If done well, councils have the opportunity to reduce costs without reducing services – the mythical “free lunch”.
7.12.2 Making choices about what to provide – “right-sizing” and reducing the scope of council activities
Even once councils are as efficient and effective as possible, councils with declining populations and changing needs need to recognise this situation and right size their infrastructure and services for the future.
47
BERL REPORT. Presentation to Industrial & Transport Relations Select Committee Re: Land Transport Management Amendment Bill. http://www.parliament.nz/resource/mi- nz/50SCTIR_EVI_00DBHOH_BILL11552_1_A310873/f5110efbf97dfc9a762fc7147e7f5f2e21e1d600

Local Government Funding Review 72
7.12.3 Government transfers
If the options to reduce expenditure have been exhausted, and the council is still faced with a gap between its expenditure requirements and its ability to raise revenues (a “fiscal gap”), there would potentially be an argument for central government transfers to support the council and community. Any such transfers would need to be calculated in some way that reflected the need of the community, and the ability of the community to pay. The incentives created for communities and councils by transfer would also need to be considered.
7.12.4 Contestable subsidies for specific projects
One option to provide support to communities where needs outstrip resources is targeted contestable subsidies for specific costs, such as upgrading drinking water schemes for small and deprived communities. Central government has provided a contestable fund to support drinking water upgrades (see following case study). However, this approach is somewhat ad-hoc, and does not address the on-going challenges that vulnerable communities have in paying for their infrastructure.
Case Study: Rangitikei
An excellent example of where a district council has addressed the issue of population reduction head-on is Rangitikei District Council. The dependence of this rural population on services provided by local towns is potentially far less than it used to be, with modern lifestyles enabling people to access better services in the nearby cities of Whanganui and Palmerston North (and even Fielding). However, it will continue to be dependent on upon a good roading and transportation network.
The most recent strategy discussion with the Council identified the following as likely changes to the Council’s infrastructure by 2046:
A smaller urban water and wastewater reticulation network;
Increasing alternative water and wastewater provision;
A larger rural water supply network (but not necessarily Council owned/managed);
A larger network of roads, but more varying condition, and some in private ownership; and
A smaller number of Council-managed community facilities, with some transferred to community ownership.
The Council has begun to respond to population and subsequent revenue reductions through, among other measures, reducing community and leisure assets which have for many years been experiencing deferred maintenance and insufficient renewal programmes. Investment to address de-population has been made in several areas, including commissioning a piece of research in 2011 called Making Rangitikei Home – strategies on how to keep families, retirees and indigenous populations. This was a desk survey to identify successful projects from around the world addressing these issues.

73
A more long-term option for helping vulnerable communities would be to replicate the Transport Agency model for other types of infrastructure, for example, the three waters.
Under a Transport Agency-like model, central government would agree to co-fund the three waters infrastructure. The level of co-funding would be determined by a formula that provided more funding to vulnerable councils facing high costs. The Transport Agency currently uses the following formula to calculate central government’s contribution to local roading projects:
This formula gives each council a “score”, which is then used to calculate the level of funding assistance for approved projects from that council.48
For the three waters, the projected cost of water infrastructure renewals and upgrades over a given time horizon could be substituted for kilometres of road:
Such a formula would mean that communities could be ranked according to need, and communities with greater need and fewer resources to meet that need would be eligible for higher rates of government co-funding.
This approach would need to be supported by good data about the state of the three waters infrastructure, and communities’ needs over time, to make sure that decisions about co-funding were based on robust information.
48
“Kilometres of road/total capital value of the TA” shows the size of the network (kilometres of road), which will help predict how much needs to spent to maintain and renew it, relative to the rating base (capital value) that can be used to raise the local share. The index of deprivation and an inverse of the number of rating units ensure that the least wealthy and smallest communities receive a higher score.
Case Study: Contestable Subsidy to upgrade Drinking Water Infrastructure
In 2005, after a request from LGNZ at the Central Government Local Government Forum, central government agreed to establish two funds to assist smaller communities invest in upgrading water and wastewater treatment plants. The subsidy for drinking water was approximately $150 million and the waste water fund slightly larger. Criteria for both funds were weighted in favour of low socio economic communities and eligibility for the drinking water scheme extended beyond local authorities. Once the initial allocation was exhausted, neither fund was extended.
However in 2011 the Government re-established the drinking water scheme with an annual allocation of $20 million until 2015. Eligibility is open to all water providers and is for schemes servicing fewer than 5,000 people.
Given that the allocation is capped, and this is a contestable process, not all councils who would like a subsidy will receive one.

Local Government Funding Review 74
7.12.5 Equalisation payments
Another option to support communities where need outstrips resources is for central government to provide untagged, general grants to vulnerable councils. These types of payments are often known as “equalisation payments”. In countries that use equalisation payments, there is usually a formula to assess the overall needs and resources of each local area.
Equalisation payments are complicated, with plenty of opportunities for perceived inequity, gaming of the system, perverse incentives etc. Grants may come from either central government out of general taxes or take the form of a levy on councils representing well-off communities, as occurs in Sweden.
There are some downsides of equalisation grants. For example, any council seeking equalisation payments could expect detailed scrutiny of its activities, finances and structure from central government, in order for central government to assure itself that the gap between revenue and expenditure could not be closed in any other way. Assessing “required expenditure” (needs) as compared to “desired expenditure” (wants) is very difficult. Providing grants from central government to local government may incentivise local government to increase overall spending, decreasing both local autonomy and accountability.
Despite these difficulties, LGNZ believes that equalisation grants should be investigated further.
7.13 Conclusion
This section of the Report has discussed a range of revenue sources and discussed each in relation to their practicability and suitability for local government in New Zealand. Councils’ right to levy and set the rate of their property taxes is essential to ensure fiscal autonomy and accountability to local residents and must not be diminished. However, it is clear that there are some challenges for which property taxes are not well suited, particularly challenges related to community affordability and the need to incentivise councils to stimulate growth and development.

75

Local Government Funding Review 76
Part 8 Summary
LGNZ has undertaken this paper to review local government funding. As noted in the Foreword, this paper is intended to stimulate discussion about various funding opportunities and constraints in New Zealand, and is the first of a two step process. This paper is intended to initiate debate about the issues and to help to identify options and alternatives that can complement councils’ available funding tools and provide incentives to stimulate economic growth. This task is difficult, but New Zealand is not unlike many other countries that face changing demographic and economic growth, increasing public expectations as well as evolving and new environmental challenges.
Ever since its establishment in 1842, the funding of local government has been a problematic issue. It has become a matter of such concern that a considerable number of funding reviews have been undertaken over the past 65 years, with all reviews highlighting the need for councils to have additional funding sources to complement rates. As our discussion has noted, New Zealand has an unusual reliance on property rates, even when compared to other local government systems that undertake similar functions. The difficulties created by reliance on this single taxing instrument include:
horizontal inequality resulting in some communities struggling to afford services and infrastructure that others take for granted;
a lack of resilience, given that comparable local government systems tend to have access to at least two different types of taxes providing additional protection against risk should a tax base fail;
affordability, with some households, particularly those on fixed incomes, facing economic hardship as a result of the share of household expenditure spent on rates; and
failure of the local tax system to adequately reward councils for investing in growth.
Noting the constraints on councils created by the sector’s reliance on property rates, this discussion paper highlights a challenging future for many parts of the local government sector. Economic and demographic change will result in continued population loss for many of our towns and some of our cities, building the challenge of how future infrastructure maintenance and renewal will be funded. Ageing populations create a similar issue, with an increasing proportion of residents likely to be on fixed incomes.
Exacerbating these trends is an external environment that appears to be driving noticeable increases in the cost of local government. Critical trends identified in our report include:
increased expectations from central government expressed through requirements to enhance service levels with the cost met locally and regionally;
climate change and more frequent extreme weather events which are causing the need for significant infrastructure improvements; and
community expectations for better quality services.
As this discussion paper highlights, it is difficult to speak of a singular “local government.” Councils vary considerably and the economic, demographic and environmental circumstances of each council are diverse. Some councils struggle to finance the cost of building infrastructure to meet the demands of current and future population growth. Other councils lack either the population, scale or community wealth to provide basic services at a level that most New Zealanders would consider necessary for community and individual well-being. These points are highlighted in the themes advanced at the start of this discussion.
The first theme highlights the importance of an effective partnership with central government so that both spheres of government are aligned in promoting the well-being of our communities. New Zealand, after all, is simply a collection of individual places and our national well-being is the sum of the nation’s parts. If New Zealand

77
is to fully prosper, local government must have the appropriate tools to do its job well.
Another theme concerns the reality that different parts of New Zealand are experiencing diverse economic and demographic projections. As a result, issues and solutions will be different across the country.
The third theme notes the importance of councils being prepared and having the capability to take an innovative approach to service delivery. It asks if we are undertaking the right services and in the optimal manner.
The final theme highlights the degree to which local authorities are making full use of their existing funding tools, such as prices and debt. Affordability issues can be created, for example, if councils rely too heavily on general rates to fund services that might have inter-generational benefits.
This discussion paper is an example of the local government sector taking the lead and raising challenging and difficult issues facing the sector, as well as problems that are likely to emerge. If councils are to provide strong social and economic outcomes for their districts, cities and regions, they require appropriate funding tools to address their future challenges and they must also be prepared to ask the hard questions of themselves. Do we deliver services that communities need? Do we deliver services in the most efficient and effective manner, and are we involving our communities in making some of the hard choices about what we do and how we pay for it?
There is also a larger discussion that needs to occur in conjunction with this paper. This discussion concerns local government’s ability to contribute to regional economies to provide the range and level of services and infrastructure necessary to sustainably build for capacity and growth.
It is important to note that underpinning a strong national economy is a strong local democracy which has its basis in a local government system that has the resources to deliver the public services that communities and New Zealand need to prosper. This review provides an opportunity for a new dialogue between local and central government and other parties to address the funding issues facing councils, consider additional funding options to address these, and provide the New Zealand local government system with a resilient revenue base that supports sustainable national economic growth.
Next Steps
As mentioned in the Preface, LGNZ is seeking feedback prior to close of business on 27 March 2015. Please send comments and suggestions to [email protected]. In addition to a call for feedback from central and local government, businesses, community, and other interested stakeholders, LGNZ will hold “Major Issues” seminars in Auckland and Wellington in March. Following the consultation period, LGNZ will analyse and incorporate comments into a final local government funding review document, intended for release around mid-2015.
This task follows LGNZ’s policy priorities to develop a sustainable funding model for local government and to lead effective infrastructure development and funding policies. To those ends, LGNZ is creating a vetted reference document and tool in an effort to cooperatively work with central government to improve communication and develop solutions for the existing gap in local government funding and expenditure.

Local Government Funding Review 78

79
Appendix 1 Other areas where LGNZ is active
Insurance and risk management
The aftermath of the Canterbury earthquakes has focused attention on the insurance market and the challenge and cost of insuring for events of such scale. However, managing and mitigating the risks of natural hazards and environmental challenges is a broader issue than just insurance. LGNZ has recently undertaken a review of the local government insurance market, which made it very clear that the bigger issue for local authorities is access to skills and expertise to consider and manage risk.
The New Zealand Local Government Insurance Market Review 49 prepared for LGNZ has recommended that councils more actively embrace, understand and manage assets and risk, including; spending more resources on risk profiling, risk management and risk mitigation to improve self-reliance and resilience. Further investigation is underway into the feasibility of a stand-alone agency to advise councils on these issues.
Better Regulation
As the Productivity Commission’s recent report, Toward Better Local Regulation, noted: “current institutional arrangements can shield central government from the full fiscal and political cost of assigning regulatory functions to local government. This can have the effect of reducing the quality of regulations.”50 The Productivity Commission further noted that “central government agencies with oversight responsibility for regulations do not have knowledge of the local government sector.”51
The first step in addressing the costs imposed on local government by central government is to build a better partnership with central government, to ensure that requirements are reasonable and practical. Costs to local government should be explicitly considered as part of the policy-making-making process, with the objective of ensuring local authorities are provided with the ability to carry out the policy objectives flexibly and efficiently. These gains cannot be achieved without true engagement with local government, as central government and its advisers are too removed from local conditions. The Productivity Commission recommended a ‘Partners in Regulation’ protocol to address this very concern; this has not (yet) eventuated. As well as working with central government in its Rules Reduction Taskforce, LGNZ will be establishing a Regulatory Reform project in 2015 to identify current laws and regulations that can and should be changed.
49
New Zealand Local Government Insurance Market Review, Craig Stobo, 2013 50
Towards Better Local Regulation, Productivity Commission 2009, p.69 51
ibid, p.71

Local Government Funding Review 80
Appendix 2 LGFA
The New Zealand Local Government Funding Agency (LGFA) was established in December 2011 with the primary objective of improving debt funding terms and conditions for participating local authorities. The aim was to reduce the cost of borrowing by councils, make available longer term borrowings and reduce the historical reliance that councils had on banks for borrowing. LGFA is a CCO operating under Local Government Act 2002.
LGFA was established to:
assist councils with the financing of capital investments once the investment decision has been made by council; and
the refinancing of existing council debt on better terms than they have achieved previously.
LGFA is a good example of a partnership between central and local government to address a significant issue faced by the sector. The largest individual LGFA shareholder is the Government at 20 per cent and the remaining 80 per cent is owned by 30 council shareholders. The Debt Management Office of the NZ Treasury provides support services to LGFA including a standby facility should LGFA require short term funding.
LGFA borrows by issuing retail bonds that are held by domestic and offshore banks, institutional investors and retail investors. LGFA then on-lends the proceeds to individual councils. LGFA provides an opportunity for ratepayers to invest into the debt of the local government sector and help finance the infrastructure investment undertaken by councils.
Currently there are 44 councils who have the ability to borrow from LGFA and since borrowing commenced in February 2012, LGFA has issued $4.41 billion of debt on behalf of the local government sector. LGFA now provides lending to councils that comprise over 90 per cent of the sector debt.
LGFA has credit ratings from two global credit rating entities that rate the organization as “AA+” which is the same rating as the New Zealand Government. This is the second highest rating available and reflects the strong underlying asset quality of the council sector and strong links to the New Zealand Government.
LGFA has estimated that it provided cost savings to the sector of $14 million over the past year and these savings will increase to $30 million per annum going forward. LGFA has also reduced the risk faced by councils with regard to their debt management by providing longer borrowing terms (currently out to nine years) that better match the long dated infrastructure assets of councils.
LGFA does not provide a solution to the funding issue faced by councils but has made a significant contribution to councils overcoming financing issues and reducing the cost of borrowing.

81

Local Government Funding Review 82

83