table of contents - kutztown university - kutztown university research/pdf... · table of contents...
TRANSCRIPT


Table o
f Co
nten
ts
3
Section 1. Overview
University Administration Officers........................................................................................ 5 Affirmative Action Policy ....................................................................................................... 5 Fee Schedule ......................................................................................................................... 6 Profile: Admissions, Enrollment, Ethnicity, Gender, Age ...................................................... 7 Degree Programs Offered ..................................................................................................... 8 Most Popular Majors ............................................................................................................ 9 Enrollment Credit Hours and Full‐time Equivalent (FTE) ...................................................... 9 Physical Facilities ................................................................................................................... 10 Degrees Awarded .................................................................................................................. 12 Employee Statistics ............................................................................................................... 12 Official Fall Freeze Dates ....................................................................................................... 12 Housing ................................................................................................................................. 12 Operating Budget .................................................................................................................. 13 Rohrbach Library ................................................................................................................... 13 Accreditations and Approvals ............................................................................................... 13
Section 2. Admissions
First‐time Degree Seeking Freshmen by College .................................................................. 14 First‐time Degree Seeking Freshmen by Ethnicity ................................................................ 15 First‐time Degree Seeking Transfers by Ethnicity ................................................................. 16 First‐time Freshmen and Transfer Applicants by College and Major ................................... 17 Profile of Enrolled First‐time, Full‐time Degree Seeking Freshmen (SATs) .......................... 21
Section 3. Enrollment
Fall Enrollment Credit Hours and FTE ................................................................................... 22 Spring Enrollment Credit Hours and FTE .............................................................................. 23 Fall Undergraduate Enrollment by Status ............................................................................. 24 Spring Undergraduate Enrollment by Status ........................................................................ 25 Fall Enrollment by Class ........................................................................................................ 26 Spring Enrollment by Class .................................................................................................... 27 Fall Enrollment by College and Major ................................................................................... 28 Fall Enrollment by Ethnicity—Females ................................................................................. 35 Fall Enrollment by Ethnicity—Males ..................................................................................... 36 Fall Enrollment by Ethnicity—All Students ........................................................................... 37 Fall Undergraduate Enrollment by Age and Gender ............................................................ 38 Fall Graduate and Instructional Certificate Enrollment by Age and Gender ........................ 39 Fall Enrollment—Mean and Median Age .............................................................................. 40 Fall Undergraduate Enrollment by County ........................................................................... 41 Fall Undergraduate Enrollment by State .............................................................................. 43 Fall Undergraduate Enrollment by Country .......................................................................... 44 Fall Instructional Certificate Enrollment by County/State/Country ..................................... 46 Fall Graduate Enrollment by County ..................................................................................... 47 Fall Graduate Enrollment by State ........................................................................................ 48 Fall Graduate Enrollment by Country ................................................................................... 49

Tab
le o
f C
on
ten
ts
4
Section 4. Degrees Awarded
Degrees Awarded by College and Major ............................................................................... 50 Degrees Awarded by Ethnicity—Females ............................................................................. 55 Degrees Awarded by Ethnicity—Males ................................................................................. 56 Degrees Awarded by Ethnicity—All Students ....................................................................... 57
Section 5. Staff Statistics
FTE of Active Staff by EEO6 Code within Division/Department ............................................ 58 Staff Ethnicity within Division/Department .......................................................................... 62 Staff by Gender and Ethnicity within EEO6 Code .................................................................. 66 Staff by Gender and Highest Degree within EEO6 Code ....................................................... 67 Faculty by Gender and Tenure Track within Rank................................................................. 68 Faculty by Gender and Tenure Track within Highest Degree ................................................ 68 Faculty by Gender and Ethnicity within Tenure Track Status ............................................... 69
Section 6. Financial Information
Revenue and Expenditures .................................................................................................... 70

Overview
5
Mission Statement
Kutztown University’s mission is to provide a high quality educa on at the undergraduate and graduate levels in order to prepare students to meet lifelong intellectual, ethical, social, and career challenges.
Vision Statement
Kutztown University aspires to be a regional center of excellence providing opportuni es for advanced academic, cultural, and public service experiences, within a caring community,
University History
Kutztown University of Pennsylvania began as Keystone State Normal School on September 7, 1866. Since then the school has changed names with its changing responsibili es. On May 29, 1928 the name changed to Kutztown State Teachers College to celebrate its status as a leading trainer of teachers, and in January of 1960 when its curriculum was updated to include wider liberal arts programs, its name was changed to Kutztown State College. On July 1, 1983 the State System of Higher Educa on was formed with the thirteen other state colleges, and the school's name changed to Kutztown University of Pennsylvania.
Location
The borough of Kutztown is located in Berks County in southeastern Pennsylvania. Kutztown is midway between Reading and Allentown. The town is approximately 2 hours from New York City, 1.5 hours from Philadelphia and Harrisburg, and 3 hours from Bal more/ Washington, DC.
Kutztown University of Pennsylvania—Officers of Administration
Cabinet
Kenneth Hawkinson, Ph.D., President
Anne Zayaitz, Ph.D., Provost and Vice President for Academic Affairs
Gerald Silberman, Vice President for Administra on and Finance
John Green, Associate Vice President for Communica on, Marke ng and External Affairs
Tracey Thompson, Execu ve Director, Kutztown University Founda on and Alumni Rela ons
Affirmative Action Policy
Kutztown University is commi ed to providing equal educa on and employment opportuni es for all persons without regard to race, ethnicity, gender, age, na onal origin, religion, sexual orienta on, disability, and veteran status. The University is commi ed to a policy of affirma‐
ve ac on as an affirma on of the role of higher educa on in bringing about posi ve social change, enhancing diversity, and inclusivity.
Warren Hilton, Ed.D., Vice President for Enrollment Management and Student Affairs
Jesús Peña, Esq., Deputy to the President for Compliance, Equity and Legal Affairs

Fee
Sch
edu
le
6
Tui on and Fees – Academic Year 2016‐17
In‐state,
Full‐ me per Academic Year
In‐state, Part‐ me per Credit Hour
Out‐of‐state, Full‐ me per
Academic Year
Out‐of‐state, Part‐ me per Credit Hour
UNDERGRADUATE
Tui on $7,238.00 $302.00 $18,096.00 $754.00
Health Services Fee 270.00 11.25 270.00 11.25
Student Center Maintenance 340.00 14.17 340.00 14.17
Student Ac vity Fee 262.00 10.92 262.00 10.92
Academic Support Fee 723.80 30.20 723.80 75.40
Technology Fee 448.00 19.00 682.00 29.00
Recrea on Center Fee 266.00 266.00
Transporta on Services Fee 70.00 2.92 70.00 2.92
GRADUATE
Tui on $483.00 $725.00
Student Center Maintenance 14.17 14.17
Academic Support Fee 48.30 72.50
Technology Fee 26.00 38.00
Room rates range from $5,720 to $8,900
Board rates range from $2,790 to $3,718
Stud
ent P
rofi
le
7
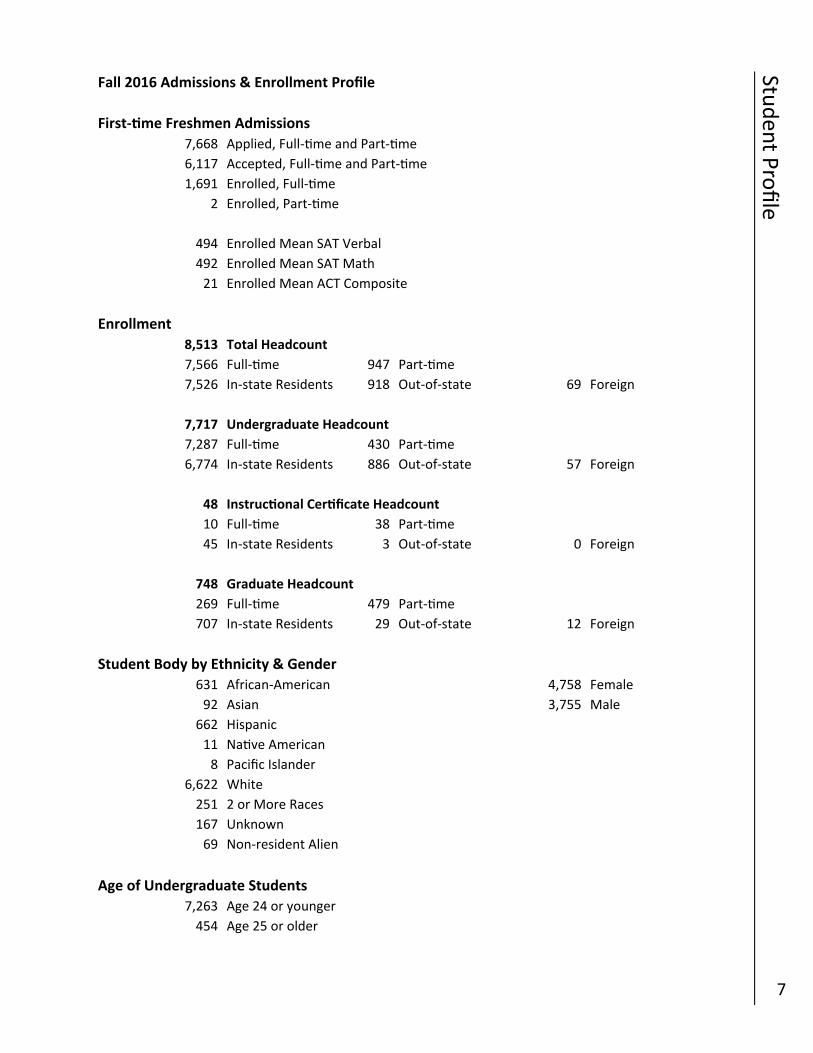
Fall 2016 Admissions & Enrollment Profile
First‐ me Freshmen Admissions
7,668 Applied, Full‐ me and Part‐ me
6,117 Accepted, Full‐ me and Part‐ me
1,691 Enrolled, Full‐ me
2 Enrolled, Part‐ me
494 Enrolled Mean SAT Verbal
492 Enrolled Mean SAT Math
21 Enrolled Mean ACT Composite
Enrollment
8,513 Total Headcount
7,566 Full‐ me 947 Part‐ me
7,526 In‐state Residents 918 Out‐of‐state 69 Foreign
7,717 Undergraduate Headcount
7,287 Full‐ me 430 Part‐ me
6,774 In‐state Residents 886 Out‐of‐state 57 Foreign
48 Instruc onal Cer ficate Headcount
10 Full‐ me 38 Part‐ me
45 In‐state Residents 3 Out‐of‐state 0 Foreign
748 Graduate Headcount
269 Full‐ me 479 Part‐ me
707 In‐state Residents 29 Out‐of‐state 12 Foreign
Student Body by Ethnicity & Gender
631 African‐American 4,758 Female
92 Asian 3,755 Male
662 Hispanic
11 Na ve American
8 Pacific Islander
6,622 White
251 2 or More Races
167 Unknown
69 Non‐resident Alien
7,263 Age 24 or younger
454 Age 25 or older
Age of Undergraduate Students

Deg
ree
Pro
gram
s
8
College of Business ‐ Bachelor of Science/Business Administra on
Accoun ng Leisure and Sports Studies Marke ng
Finance Management
College of Educa on ‐ Bachelor of Science/Educa on
Elementary Educa on Secondary Educa on
Library Science Special Educa on
College of Liberal Arts and Sciences ‐ Bachelor of Arts/Bachelor of Science
Anthropology General Studies Philosophy
Biochemistry Geography Physics
Biology Geology Poli cal Science
Chemistry German Studies Psychology
Computer Science History Public Administra on
Criminal Jus ce Informa on Technology Social Work
English Marine Science Sociology
Environmental Science Mathema cs Spanish
College of Visual and Performing Arts ‐ Bachelor of Arts/Bachelor of Fine Arts/Bachelor of Science
Applied Digital Arts Communica on Studies Music
Art Educa on Cra s Music Educa on
Art History Electronic Media Studio Art
Graduate Studies and Extended Learning
Master of Arts
Arts Administra on Counseling English
Master of Business Administra on
Master of Educa on
Art Educa on Music Educa on
Counseling ‐ Higher Educa on Reading Specialist
Elementary Educa on Secondary Educa on
Instruc onal Technology Student Affairs in Higher Educa on ‐ Administra on
Master of Fine Arts
Communica on Design
Master of Library Science
Master of Public Administra on
Master of Science
Computer Science/Informa on Technology School Counseling
Master of Social Work
Doctorate of Social Work
KU also offers con nuing educa on and cer ficate programs and exchange and study abroad opportuni es
Communica on Design

Pop
ular M
ajors
9
Ten Most Popular Undergraduate Majors
Major Enrollment
BS Criminal Jus ce 448
BA Communica on Studies 420
BSBA Business Administra on 410
BS Leisure and Sport Studies 376
BSBA Business Administra on/Management 322
BS Psychology/General 292
BSBA Business Administra on/Marke ng 278
BSW Social Work 272
BFA Communica on Design 264
BS Electronic Media 246
Note: Undeclared (600 students) not included
Ten Most Popular Graduate Majors
Major Enrollment
MA Counseling (Mental Health) 90
MSW Social Work 79
MED IT / Digital Classroom Technology 60
MED Reading Specialist 54
MED Student Affairs / Administra on 46
MA Counseling (Couples, Marital, Family) 36
MBA Business Administra on 34
MED Secondary Educa on 33
MED Art Educa on 32
MED Cert PreK‐4 32
Enrollment Credit Hours and Full‐ me Equivalent (FTE)
Level Credit Hours FTE
Undergraduate 110,759 7,383.93
Non‐degree 170 11.33
TOTAL UNDERGRADUATE 110,929 7,395.27
INSTRUCTIONAL CERTIFICATE 242 19.97
GRADUATE 4,934 411.17
TOTAL 116,105 7,826.40

Ph
ysic
al F
acili
es
10
Campus Buildings and Facili es Descrip ons
Code Building/Facility Purpose Year Acquired/ Constructed/
Renovated
Square Footage
AF Academic Forum Instruc on/Dining 2006 65,969
AC Admissions Offices 1850/1998 6,039
DG Admissions Garage Facili es Support 1997 980
AU Auxiliary Barn Demonstra on 1900 1,716
BT Ballfield Toilets/Storage Athle cs 1991 871
BA Barn Demonstra on 1870 7,340
BC Beck Hall Student Housing/Services 1965/2010 45,434
BK Beekey Instruc on 1971 51,808
BR Berks Hall Student Housing 1964/2015 56,954
BH Boehm Science Instruc on 1962/2004 107,551
BN Bonner Hall Student Housing 1973 65,729
BX Boxwood House Offices 1869 4,412
CC Corn Crib Demonstra on 1945 1,915
DT Deatrick Hall Student Housing 1967 74,074
DF deFrancesco Instruc on 1968/1998 62,360
DI Dixon Hall Student Housing 2008 271,740
EH Educa on House Offices 1986 6,469
FH Farm House Demonstra on 1800 3,871
GC Graduate Center Instruc on 1915/2000 18,034
GR Grim‐Knedler Instruc on 1968/2004 12,045
HP Hea ng Plant Facili es Support 2007 7,775
RR Heritage Center Office Demonstra on 1996 739
JW JB White Mul ‐cultural Center Student Service 1909/2002 9,910
JH Johnson Hall Student Housing 1966 72,019
KM Kemp Building Offices 1959 4,777
KY Keystone Fieldhouse Athle cs 1989 59,522
KY Keystone Hall Athle cs 1970 79,037
LH Lehigh Hall Student Housing 1964/2012 55,515
LG Log Cabin 1 Demonstra on 1876 432
LG Log Cabin 2 Demonstra on 564
LY Lytle Hall Instruc on 1976 33,247
MN Facili es Building Facili es Administra on 1972/2012 14,488
MN Maintenance Building Facili es Support 2012 20,130
MN Maintenance Building Facili es Support 2002 8,634
NS McFarland Student Union Assembly 1968/1993/2001/2014/
2016 102,648
WT North Water Tower Facili es Support 1987 6,042

Ph
ysical Facilies
11
Campus Buildings and Facili es Descrip ons
Code Building/Facility Purpose Year Acquired/ Constructed/
Renovated
Square Footage
PR Official Residence Residence 1929/2004 7,492
OM Old Main Cooling Tower Facili es Support 1995 873
OM Old Main, Wing A Housing/Instruct/Offices 1891/1995 43,231
OM Old Main, Wing B Offices 1894/1995 69,112
OM Old Main, Wing C Offices/Instruc on 1888/1995 29,377
OM Old Main, Wing D Offices/Instruc on 1881/1995 32,767
OM Old Main, Wing E Offices/Instruc on 1902/1995 49,321
OM Old Main, Wing F Offices/Instruc on 1902/1995 20,617
OM Old Main, Wing I Offices 1897/1995 19,945
PL Pole Barn #1 Facili es Support 1991 5,383
PL Pole Barn #2 Facili es Support 1993 5,864
PH Poplar House Off‐Line 1893 4,176
PB Professional Building Offices 10,787
LC Rickenbach Learning Center Instruc on 1968 48,796
RS Risley Athle cs 1908 24,793
RL Rohrbach Library Library 1968/1998 122,669
RT Rothermel Hall Student Housing 1961 58,631
SA Schaeffer Auditorium Assembly 1938/2012 61,991
SU School House Demonstra on 1860 1,894
SC Schuylkill Hall Student Housing 1964/2014 58,199
SH Sharadin Art Instruc on/Exhibit 1961/2008 111,344
DN South Dining Hall Student Dining 1966/2003 92,508
ST Stadium Concession Stand Athle cs 1988 536
ST Stadium Pressbox Athle cs 1988 1,224
TO Stadium Toilets Athle cs 1988 440
AD Stra on Administra on Center Offices 1929/1977/2012 64,640
RC Student Recrea on Center Recrea on 2006 53,957
SK Summer Kitchen Demonstra on 1800 800
UP University Place Student Housing 1992 114,531
The campus is spread across 289 acres and encompasses 65 buildings and structures
Total exterior gross square footage: 2,456,688
Data as of 11/21/2016

Ove
rvie
w
12
Degrees Awarded 2015 – 2016
1,909 Bachelors
255 Masters
2,164 Total Degrees Awarded
KU Employees – Fall 2016
Faculty
107 Professors 372 Tenured / Tenure Track
156 Associate Professors 98 Non‐tenure Track
141 Assistant Professors
66 Instructors
470 Total Faculty
Administra on
34 Execu ves / Administra ve / Managerial
212 Professional / Non‐faculty
246 Total Administra on
Staff
116 Secretarial / Clerical
22 Technical / Paraprofessional
28 Skilled Cra s
109 Service / Maintenance
275 Total Staff
991 Total Employees
Official Fall Freeze Dates
• Fall 2010 Freeze File: September 21, 2010
• Fall 2011 Freeze File: September 19, 2011
• Fall 2012 Freeze File: September 17, 2012
• Fall 2013 Freeze File: September 16, 2013
• Fall 2014 Freeze File: September 15, 2014
• Fall 2015 Freeze File: September 14, 2015
Housing Informa on
• The University currently has 8 tradi onal residence halls, 2 suite‐style residence halls,
honors apartments, and the Golden Bear Village apartments
• Approximately 4,000 students reside in on‐campus buildings
• The following halls at the University are accessible to handicapped individuals: Berks,
Dixon, Golden Bear Village South and West, Lehigh, Schuylkill, and University Place
• Fall 2016 Freeze File: September 19, 2016

Overview
13
Opera ng Budget 2016 – 2017
$ 79,842,850 Tui on and fees
35,631,702 State appropria ons
0 Federal appropria ons
13,656,327 Federal grants and contracts
9,518,552 State and local grants and contracts
237,287 Private gi s, grants, and contracts
9,299 Endowment income
2,134,957 Ac vi es of educa onal departments
44,225,008 Auxiliary enterprises
2,837,620 Other sources
$ 188,093,602 Total Revenue
Rohrbach Library
379,570 Books, serial back files, and government publica ons
1,322,660 Microforms
385,501 Ebooks
119 Databases
5,277 Audiovisual materials
6,803 Interlibrary loans provided/received
14,354 Typical weekly gate count
92 Weekly public service hours
221 Classes taught to 5,302 students
Accredita ons
MSCHE ‐ Middle States Commission on Higher Educa on
AACSB ‐ Associa on to Advance Collegiate Schools of Business
CACREP ‐ Council for Accredita on of Counseling and Related Educa onal Programs
CAEP ‐ Council for the Accredita on of Educator Prepara on
COSMA ‐ Commission of Sport Management Accredita on
CSWE ‐ Council on Social Work Educa on
NASAD ‐ Na onal Associa on of Schools of Art and Design
NASM ‐ Na onal Associa on of Schools of Music
NCACE ‐ Na onal Commi ee for Accredita on of Coaching Educa on
Approvals
• Pennsylvania Department of Educa on (PDE)
• State System of Higher Educa on

Ad
mis
sio
ns
14
Admissions Trends by College – First‐ me Degree Seeking Freshmen
Visual & Performing Arts Fall 2011 Fall 2012 Fall 2013 Fall 2014 Fall 2015 Fall 2016
Applied 712 645 509 609 815 816
Accepted 332 306 410 514 687 688
Enrolled Full‐ me 180 158 194 237 248 257
Enrolled Part‐ me 0 1 0 0 1 1
Liberal Arts & Sciences
Applied 3058 3436 2802 2978 3359 2956
Accepted 1965 2174 1950 2229 2656 2222
Enrolled Full‐ me 656 695 599 578 715 541
Enrolled Part‐ me 1 2 0 2 2 0
Educa on
Applied 2193 1489 1154 972 1035 820
Accepted 1622 1108 927 848 903 673
Enrolled Full‐ me 433 327 258 275 252 216
Enrolled Part‐ me 2 0 0 0 0 0
Business
Applied 1443 1651 1601 1319 1357 1280
Accepted 1011 1152 1202 1053 1121 1050
Enrolled Full‐ me 297 369 367 330 373 318
Enrolled Part‐ me 1 1 1 0 0 0
Undeclared
Applied 2681 2593 2467 2183 1570 1796
Accepted 1830 1849 1917 1744 1232 1484
Enrolled Full‐ me 464 441 394 359 271 359
Enrolled Part‐ me 3 3 1 0 1 1
Total
Applied 10087 9814 8533 8061 8136 7668
Accepted 6760 6589 6406 6388 6599 6117
Enrolled Full‐ me 2030 1990 1812 1779 1859 1691
Enrolled Part‐ me 7 7 2 2 4 2

Ad
missio
ns
15
Admissions Trends by Ethnicity – First‐ me Degree Seeking Freshmen
Fall 2011 Fall 2012 Fall 2013 Fall 2014 Fall 2015 Fall 2016
AP
PLIC
ATIO
NS
Non‐resident Alien 95 69 61 67 43
African‐American 2024 2156 1572 1517 1601 1233
Asian 161 161 134 136 144 138
Hawaiian/Pacific Islander 7 12 6 11 6
Hispanic 759 841 705 774 826 781
Na ve American 22 13 9 16 17 17
White 6640 6112 5754 5151 5048 5046
Mul ‐racial 196 241 251 245 282 301
Unknown 285 188 27 155 140 103
Total 10087 9814 8533 8061 8136 7668
AC
CEP
TAN
CES
Non‐resident Alien 28 46 47 59 38
African‐American 822 861 714 750 892 608
Asian 112 114 98 120 120 108
Hawaiian/Pacific Islander 4 6 4 7 4
Hispanic 415 452 428 529 584 537
Na ve American 11 6 5 10 11 10
White 5098 4847 4916 4628 4590 4495
Mul ‐racial 125 143 184 181 221 235
Unknown 177 134 9 119 115 82
Total 6760 6589 6406 6388 6599 6117
ENR
OLLED
FULL‐TIM
E
Non‐resident Alien 5 10 22 18 12 8
African‐American 194 205 148 158 185 106
Asian 14 27 21 12 24 15
Hawaiian/Pacific Islander 2 3 3 2
Hispanic 125 116 100 157 133 142
Na ve American 7 1 2 4 5 4
White 1595 1548 1479 1359 1391 1333
Mul ‐racial 90 42 36 45 70 58
Unknown 39 1 23 37 25
Total 2030 1990 1812 1779 1859 1691
ENR
OLLED
PA
RT‐TIM
E
Non‐resident Alien 1
African‐American 4 1
Asian
Hawaiian/Pacific Islander
Hispanic
Na ve American
White 2 7 2 2 2 2
Mul ‐racial 1
Unknown
Total 7 7 2 2 4 2

Ad
mis
sio
ns
16
Admissions Trends by Ethnicity – First‐ me Degree Seeking Transfers
Fall 2011 Fall 2012 Fall 2013 Fall 2014 Fall 2015 Fall 2016
AP
PLIC
ATIO
NS
Non‐resident Alien 19 10 6 8 14
African‐American 149 179 141 122 112 88
Asian 35 27 25 27 24 26
Hawaiian/Pacific Islander 1 3 4 1 1
Hispanic 175 186 187 124 126 120
Na ve American 5 2 1 1
White 1453 1232 1202 868 823 706
Mul ‐racial 51 51 48 38 59 41
Unknown 92 12 11 42 21 13
Total 1960 1709 1628 1231 1174 1010
AC
CEP
TAN
CES
Non‐resident Alien 10 9 6 8 14
African‐American 87 100 78 102 93 72
Asian 23 18 14 22 23 22
Hawaiian/Pacific Islander 1 3 4 1 1
Hispanic 93 120 116 101 106 100
Na ve American 1 2 1 1
White 919 928 887 775 734 641
Mul ‐racial 31 38 29 29 51 31
Unknown 57 7 9 37 20 13
Total 1211 1224 1146 1076 1036 895
ENR
OLLED
FULL‐TIM
E
Non‐resident Alien 1 1 1 3 3 4
African‐American 50 49 40 49 43 33
Asian 10 6 9 6 11 12
Hawaiian/Pacific Islander 1 2 1 1
Hispanic 38 68 62 56 52 58
Na ve American 2 1
White 414 561 514 414 397 364
Mul ‐racial 32 24 13 19 30 22
Unknown 4 7 24 14 9
Total 545 716 649 571 551 503
ENR
OLLED
PA
RT‐TIM
E
Non‐resident Alien 1
African‐American 4 4 5 4 1 4
Asian 4 3 1 1
Hispanic 4 4 3 4 7 8
Na ve American
White 29 24 37 37 31 31
Mul ‐racial 2 1 2 1
Unknown 1 1 1
Total 43 36 47 49 42 44
Hawaiian/Pacific Islander 1

Ad
missio
ns
17
Admissions Trends in Applica ons by College and Major
First‐ me Freshmen and Transfer Applicants
CIP Code Degree Major Fall
2011 Fall
2012 Fall
2013 Fall
2014 Fall
2015 Fall
2016
COLLEGE OF VISUAL & PERFORMING ARTS
500102 BFA Applied Digital Arts 31
131302 BS Art Educa on 184 104 67 65 94 84
500703 BA Art History 12
500402 BFA Communica on Design 256 227 116 86 214 173
090100 BA Communica on Studies 68 105 259 309 302 270
500201 BFA Cra s 17 16 11 7 7 12
090702 BS Electronic Media 177 156 133 120 136 106
500901 BA Music 61 52 37 36 62 81
131312 BS Music Educa on 67 77 38 52 54 52
500702 Studio Art (Core) 196 173 96 73 90 116
College of Visual & Performing Arts Total 1028 910 757 748 959 937
COLLEGE OF LIBERAL ARTS & SCIENCES
450201 BA Anthropology 41 42 43 24 37 31
260202 BS Biochemistry 79 91 69 87 80 75
260101 BS Bio/Allied Health 9
260101 BS Bio/Molecular/Micro/Cell 118 99 114 169 168 276
260101 BS Bio/Organismal/Ecology 73 72 51 65 58 65
260101 BS Biology/Pre‐Med & Health 292 385 346 387 548 424
260101 BS Biology/Pre‐professional 6
400501 BS Chemistry 90 87 86 77 79 54
110101 BS CSC/Info Technology 140 165 126 163 201 154
110101 BS CSC/So ware Development 115 121 102 140 183 158
430104 BS Criminal Jus ce 565 661 488 675 750 565
430104 BS CJ/Paralegal Studies 73 89 63 47 47 37
230101 BA English 61 58 50 53 58 62
230101 BA English/Cult & Media 36 20 5 10 7 10
230101 BA English/Paralegal Studies 13 11 8 1 4 7
231303 BA Eng/Professional Wri ng 122 94 65 59 72 64
230101 BA Eng/Pro Wri/Cult & Media 69 77 48 17 21 17
030104 BS Environmental Sci/Biology 78 81 69 60 59 62
030104 BS Environmental Sci/Chemistry 5 5 7 6 8 9
030104 BS Environmental Sci/Geography 16 19 19 18 12 9
030104 BS Environmental Sci/Geology 27 16 20 16 22 22
240102 BS General Studies 1
240102 BA General Studies 4
450701 BA Geography/Applied 4 2 2 4 1
450701 BA Geography/Environmental 13 7 7 5 4 2
450701 BA Geography/General 4 3 1 2 2
450701 BA Geography/Globaliza on 1 1 2 1
450701 BA Geography/Planning 2 3 1 1
400601 BS Geology 26 18 14 28 33 13

Ad
mis
sio
ns
18
Admissions Trends in Applica ons by College and Major
First‐ me Freshmen and Transfer Applicants
CIP Code Degree Major Fall
2011 Fall
2012 Fall
2013 Fall
2014 Fall
2015 Fall
2016
COLLEGE OF LIBERAL ARTS & SCIENCES
050125 BA Ger Study/Comm & Culture 11 7 7 2 5 4
050125 BA Ger Study/Interdisciplinary 1 2 2 2
540101 BA History 115 95 79 72 67 88
540101 BA History/Paralegal Studies 13 11 12 6 7 4
400607 BS Marine Science/Biology 83 66 56 57 51 41
400607 BS Marine Science/Chemistry 1
400607 BS Marine Science/Geology 7
400607 BS Marine Science/Oceanography 21 16 23 28 15
400607 BS Marine Science/Physics 1
270101 BS Mathema cs 64 60 48 62 76 55
511005 BS Medical Technology 3
511601 BSN Nursing 2
380101 BA Philosophy 15 20 13 17 12 17
380101 BA Philosophy/Religious Studies 4 5 6 1 4 5
400801 BS Physics 37 50 35 25 31 13
400801 BS Physics/Astronomy 9 18 12 13 21
400801 BS Physics Engineering Physics 11 50 50 54 39
451001 BA Poli cal Science 76 92 86 73 71 92
451001 BA Poli cal Sci/Paralegal Studies 28 32 30 15 20 27
420101 BS Psychology 3 5
420101 BS Psych/Clinical Counseling 358 435 335 251 283 242
420101 BS Psychology/General 391 439 389 399 427 326
420101 BS Psych/Industrial‐Organiza on 20 22 14 12 21 9
420101 BS Psych/Paralegal Studies 41 49 29 24 26 13
440401 BS Public Administra on 16 10 11 4 7 5
440401 BS Pub Admin/Paralegal Studies 5 4 3 1 5 2
440701 BSW Social Work 233 252 252 247 225 230
451101 BA Sociology 79 63 54 67 42 39
451101 BA Soc/Diversity & Inequality 5 2 4 3 1
451101 BA Sociology/Family 18 11 14 12 9
451101 BA Soc/Social Order & Dev Behav 37 21 9 17 15
451101 BA Sociology/Paralegal Studies 12
160905 BA Spanish 24 25 20 19 11 15
College of Liberal Arts & Sciences Total 3711 4063 3404 3584 3976 3463
COLLEGE OF EDUCATION
LIB SC
I
250101 BS Library Science 20 10 5 6 2
250101 BSED Library Science 25 11 25 10 11 2
250101 BSED Lib Sci w/El Ed Cer ficate 1
45 22 25 15 17 4 Subtotal

Ad
missio
ns
19
Admissions Trends in Applica ons by College and Major
First‐ me Freshmen and Transfer Applicants
CIP Code Degree Major Fall
2011 Fall
2012 Fall
2013 Fall
2014 Fall
2015 Fall
2016
COLLEGE OF EDUCATION
ELEMEN
TAR
Y EDU
CA
TION
131203 BSED El Ed/4‐8 Math & English 59 54 40 43 29 23
131203 BSED El Ed/4‐8 Math & Science 30 34 16 14 18 11
131203 BSED El Ed/4‐8 Math & Soc Stud 40 27 22 15 11 9
131203 BSED El Ed/4‐8 Sci & English 32 26 13 4 12 5
131203 BSED El Ed/4‐8 Sci & Soc Stud 31 16 11 15 17 13
131202 BSED El Ed/Early Childhood Ed 1
131210 BSED El Ed/Pre K‐4 872 661 511 467 547 445
131202 Elementary Ed/Undecided 2 1
Subtotal 1067 819 613 558 634 506
SECO
ND
AR
Y EDU
CA
TION
131205 BSED Sec Ed/Biology Science 28 40 30 10 19 15
131205 BSED Sec Ed/Chemistry 32 18 12 10 6 3
231001 BSED Sec Ed/Communica on 4
131205 BSED Sec Ed/Earth Space Sci 11 9 4 2 4 6
131205 BSED Sec Ed/ESS/Astronomy 1
131205 BSED Secondary Ed/English 144 93 98 74 58 45
160901 BSED Secondary Ed/French 3
131205 BSED Sec Ed/General Science 54 6 11 6 7 6
300101 BSED Sec Ed/Gen Sci/Biology 8
300101 BSED Sec Ed/Gen Sci/Chemistry 1
300101 BSED Sec Ed/GS/Earth‐Space 1
300101 BSED Sec Ed/Gen Sci/Physics 1
131205 BSED Secondary Ed/German 10 4 4 1 6
131205 BSED Sec Ed/Mathema cs 115 82 66 50 69 46
131205 BSED Sec Ed/Physics 7 2 1 5 4 3
131205 BSED Sec Ed/Physics & Math 13 8 10 4 2 4
131205 BSED Sec Ed/Social Studies 276 153 121 103 121 67
400801 BSED Sec Ed/SS/Anthropology 3
450101 BSED Sec Ed/SS/Civics & Gov 3
450101 BSED Sec Ed/Soc Stud/History 48
450101 BSED Sec Ed/SS/Psychology 78
450101 BSED Sec Ed/Soc Stud/Sociology 11
450101 BSED Sec Ed/Soc Sci/Anthroplgy 1
450101 BSED Sec Ed/Soc Sci/Psychology 4
450101 BSED Sec Ed/Soc Sci/Sociology 1
131205 BSED Secondary Ed/Spanish 24 20 22 14 11 8
450101 Secondary Ed/Undecided 115 80 7
Subtotal 997 515 386 278 302 209

Ad
mis
sio
ns
20
Admissions Trends in Applica ons by College and Major
First‐ me Freshmen and Transfer Applicants
CIP Code Degree Major Fall
2011 Fall
2012 Fall
2013 Fall
2014 Fall
2015 Fall
2016
COLLEGE OF EDUCATION
SEC ED
/SPEC
ED
131205 BSED Sec Ed/Spec Ed Biology 3
131001 BSED Sec Ed/Spec Ed Earth Space Sci 1
131205 BSED Sec Ed/Spec Ed English 10
131205 BSED Sec Ed/Spec Ed German 1
131205 BSED Sec Ed/Spec Ed Mathema cs 16
131205 BSED Sec Ed/Spec Ed Social Studies 26
57
SPEC
IAL ED
UC
ATIO
N
131001 BSED Spec Ed/Mntl&Phys Hdcp 2
131001 BSED SpEd/MPH PK‐8/ElEd PK‐4 225 204 158 127 120 90
131001 BSED SpEd/MPH ElEd4‐8/Mt&En 33 31 24 10 11 3
131203 BSED SpEd/MPH ElEd4‐8/Mt&Sci 4 5 6 5 2 6
131203 BSED SpEd/MPH ElEd4‐8/Mt&SS 8 4 5 4 6 3
131001 BSED SpEd/MPH ElEd4‐8/Sc&En 12 7 7 5 8 4
131001 BSED SpEd/MPH ElEd4‐8/Sc&SS 5 8 6 9 1 2
131009 BSED Spec Ed/Visual Impairmnt 1 2
131001 BSED Spec Ed/VI/El Ed Pre K‐4 20 10 14 9 16 10
131001 BSED SpEd/VI/ElEd 4‐8 Mat&Eng 2 3 5 2 3 3
131009 BSED SpEd/VI/ElEd 4‐8 Mat&Sci 2 1
131009 BSED SpEd/VI/ElEd 4‐8 Mat&SS 1 1
131009 BSED SpEd/VI/ElEd 4‐8 Sci&Eng 2 2 1
131009 BSED SpEd/VI/ElEd 4‐8 Sci&SS 2 1 3
Subtotal 316 278 227 176 168 121
College of Educa on Total 2425 1634 1251 1027 1121 897
COLLEGE OF BUSINESS
520201 Business Admin (Core) 1590 1693 1588 1339 1405 20
520201 BSBA Business Admin/Accoun ng 1 299
520201 BSBA Business Admin/Management 1 1 424
310101 BS Leisure and Sport Studies 225 328 375 270 214 225
College of Business Total 1815 2022 1963 1609 1621 1519
UNDECLARED / OTHER
240102 Undeclared 3068 2839 2786 2324 1633 1862
999999 Exchange Student to KU 8
999999 ESL 47
Undeclared / Other Total 3068 2894 2786 2324 1633 1862
UNIVERSITY TOTALS 12047 11523 10161 9292 9310 8678
Subtotal
520201 BSBA Business Admin/Finance 154
520201 BSBA Business Admin/Marke ng 397

Ad
missio
ns
21
Admissions Profile of Enrolled First‐ me, Full‐ me Degree Seeking Freshmen*
Score Range Fall 2011 Fall 2012 Fall 2013 Fall 2014 Fall 2015 Fall 2016
VER
BA
L SAT
700‐800 18 10 3 8 12 15
650‐699 31 27 24 31 26 35
600‐649 97 84 63 76 91 111
550‐599 217 187 202 205 223 179
500‐549 416 400 401 368 367 328
450‐499 538 550 522 504 477 508
400‐449 495 491 425 396 432 351
350‐399 157 151 107 102 110 65
300‐349 13 10 4 8 10 4
Below 300 6 2 0 0 4 0
Total 1988 1912 1751 1698 1752 1596
Mean Average 482 479 483 486 486 494
MA
TH SA
T
700‐800 3 7 10 3 5 10
650‐699 23 31 25 24 36 35
600‐649 108 98 93 68 85 91
550‐599 226 205 216 202 191 204
500‐549 416 397 375 402 387 346
450‐499 608 545 505 472 510 483
400‐449 390 471 406 426 415 335
350‐399 182 147 107 95 104 86
300‐349 30 11 14 4 17 5
Below 300 2 0 0 2 2 1
Total 1988 1912 1751 1698 1752 1596
Mean Average 482 482 486 484 483 492
AC
T
30‐36 3 4 2 7
24‐29 34 33 29 29 39 53
18‐23 154 138 139 165 182 203
12‐17 65 68 49 65 84 64
Below 12 1 1
Total 253 242 221 260 307 328
Mean Average 20 20 20 20 20 21
*Students submi ng SAT/ACT scores

Enro
llmen
t
22
Trends in Fall Enrollment Credit Hours and FTE
Undergraduate Fall 2011 Fall 2012 Fall 2013 Fall 2014 Fall 2015 Fall 2016
Full‐ me Credit Hours 130250.0 127655.5 122334.5 118724.0 115789.0 108056.0
Average Full‐ me Credit Hours 14.8 14.8 14.8 14.8 14.8 14.8
Part‐ me Credit Hours 3910.5 3133.0 3573.0 3460.0 3250.0 2873.0
Average Part‐ me Credit Hours 6.6 6.4 6.7 6.6 6.7 6.7
Total Credit Hours 134160.5 130788.5 125907.5 122184.0 119039.0 110929.0
Instruc onal Cer fica on
Full‐ me Credit Hours 774.0 341.0 65.0 111.0 49.0 104.0
Average Full‐ me Credit Hours 13.8 13.1 13.0 11.1 9.8 10.4
Part‐ me Credit Hours 246.0 36.0 60.0 62.0 76.0 138.0
Average Part‐ me Credit Hours 6.2 3.6 4.0 3.9 4.8 3.6
Total Credit Hours 1020.0 377.0 125.0 173.0 125.0 242.0
Graduate
Full‐ me Credit Hours 2945.0 2583.0 2776.0 2712.0 2887.0 2762.0
Average Full‐ me Credit Hours 11.2 10.4 10.4 10.0 10.2 10.3
Part‐ me Credit Hours 2182.0 1793.0 1776.0 1588.0 1836.0 2172.0
Average Part‐ me Credit Hours 4.1 4.3 4.3 4.4 4.5 4.5
Total Credit Hours 5127.0 4376.0 4552.0 4300.0 4723.0 4934.0
Total Credit Hours
Full‐ me 133969.0 130579.5 125175.5 121547.0 118725.0 110922.0
Part‐ me 6338.5 4962.0 5409.0 5110.0 5162.0 5183.0
Total 140307.5 135541.5 130584.5 126657.0 123887.0 116105.0
FTE
Undergraduate 8944.2 8719.2 8393.8 8145.6 7935.9 7395.3
Instruc onal Cer ficate 68.0 25.5 9.9 13.4 10.2 20.0
Graduate 427.3 364.7 379.3 358.3 393.6 411.2
Total 9439.5 9109.4 8783.0 8517.3 8339.7 7826.4

Enro
llmen
t
23
Trends in Spring Enrollment Credit Hours and FTE
Undergraduate Spring 2011
Spring 2012
Spring 2013
Spring 2014
Spring 2015
Spring 2016
Full‐ me Credit Hours 121486.5 117088 115030.5 111797.5 118724.0 103143.0
Average Full‐ me Credit Hours 15.0 14.8 14.7 14.7 14.8 14.7
Part‐ me Credit Hours 4396.5 3708.0 3417.0 3596.0 3460 3331.0
Average Part‐ me Credit Hours 5.8 6.4 6.6 6.7 6.6 6.9
Total Credit Hours 125883.0 120796.0 118447.5 115393.5 122184.0 106474.0
Instruc onal Cer ficate
Full‐ me Credit Hours 1134.0 619.0 116.0 75.0 111.0 38.0
Average Full‐ me Credit Hours 13.7 13.8 11.6 12.5 11.1 9.5
Part‐ me Credit Hours 161.0 117.0 62.0 91.0 62.0 75.0
Average Part‐ me Credit Hours 4.0 5.3 4.8 4.3 3.9 3.3
Total Credit Hours 1295.0 736.0 178.0 166.0 173.0 113.0
Graduate
Full‐ me Credit Hours 3040.0 2256.0 2404.0 2496.0 2712.0 2770.0
Average Full‐ me Credit Hours 11.3 10.7 10.5 10.7 10.0 10.4
Part‐ me Credit Hours 2413.0 2171.0 1875.0 1806.0 1588.0 1959.0
Average Part‐ me Credit Hours 4.2 4.3 4.3 4.3 4.4 4.3
Total Credit Hours 5453.0 4427.0 4279.0 4302.0 4300.0 4729.0
Total Credit Hours
Full‐ me 125660.5 119963.0 117550.5 114368.5 121547.0 105951.0
Part‐ me 6970.5 5996.0 5354.0 5493.0 5110.0 5365.0
Total 132631.0 125959.0 122904.5 119861.5 126657.0 111316.0
FTE
Undergraduate 8392.2 8053.1 7896.5 7692.9 8145.6 7098.3
Instruc onal Cer ficate 107.9 49.1 12.8 13.0 13.4 9.3
Graduate 454.4 368.9 356.5 358.5 358.3 394.1
Total 8954.5 8471.1 8265.8 8064.4 8517.3 7501.7

Enro
llmen
t
24
Trends in Fall Undergraduate Enrollment by Status
Fall 2011 Fall 2012 Fall 2013 Fall 2014 Fall 2015 Fall 2016
First‐ me Freshmen
Full‐ me 2038 1990 1812 1779 1859 1691
Part‐ me 12 16 2 6 4 2
Total 2050 2006 1814 1785 1863 1693
First‐ me Transfers
Full‐ me 547 716 653 571 558 507
Part‐ me 45 38 55 49 44 46
Total 592 754 708 620 602 553
Con nuing Freshmen
Full‐ me 817 608 649 646 628 653
Part‐ me 80 46 67 43 52 44
Total 897 654 716 689 680 697
Con nuing Sophomores
Full‐ me 1823 1794 1634 1577 1494 1466
Part‐ me 36 41 44 43 43 35
Total 1859 1835 1678 1620 1537 1501
Con nuing Juniors
Full‐ me 1747 1737 1769 1622 1557 1480
Part‐ me 113 85 101 86 69 69
Total 1860 1822 1870 1708 1626 1549
Con nuing Seniors
Full‐ me 1825 1772 1760 1844 1712 1490
Part‐ me 308 260 266 297 271 234
Total 2133 2032 2026 2141 1983 1724
Con nuing Total
Full‐ me 6212 5911 5812 5689 5391 5089
Part‐ me 537 432 478 469 435 382
Total 6749 6343 6290 6158 5826 5471
Total Undergrads
Full‐ me 8797 8617 8277 8039 7808 7287
Part‐ me 594 486 535 524 483 430
Total 9391 9103 8812 8563 8291 7717

Enro
llmen
t
25
Trends in Spring Undergraduate Enrollment by Status
Spring 2011
Spring 2012
Spring 2013
Spring 2014
Spring 2015
Spring 2016
First‐ me Freshmen
Full‐ me 59 47 45 50 43 34
Part‐ me 44 21 0 3 1
Total 103 68 45 53 43 35
First‐ me Transfers
Full‐ me 208 177 219 222 233 169
Part‐ me 25 20 27 34 26 29
Total 233 197 246 256 259 198
Returning Undergrads
Full‐ me 77 45
Part‐ me 43 22
Total 120 67 0 0 0 0
Con nuing Freshmen
Full‐ me 1919 1946 1884 1739 1670 1699
Part‐ me 250 67 65 57 44 51
Total 2169 2013 1949 1796 1714 1750
Con nuing Sophomores
Full‐ me 1864 1858 1786 1681 1603 1536
Part‐ me 53 48 43 48 53 47
Total 1917 1906 1829 1729 1656 1583
Con nuing Juniors
Full‐ me 1947 1883 1885 1838 1725 1649
Part‐ me 100 93 95 100 79 79
Total 2047 1976 1980 1938 1804 1728
Con nuing Seniors
Full‐ me 2038 2009 2009 2064 2043 1908
Part‐ me 244 334 289 294 309 280
Total 2282 2343 2298 2358 2352 2188
Con nuing Total
Full‐ me 7768 7696 7564 7322 7041 6792
Part‐ me 647 542 492 499 485 457
Total 8415 8238 8056 7821 7526 7249
Total Undergrads
Full‐ me 8112 7965 7828 7594 7317 6995
Part‐ me 759 605 519 536 511 487
Total 8871 8570 8347 8130 7828 7482

Enro
llmen
t
26
Trends in Fall Enrollment by Class
Fall 2011 Fall 2012 Fall 2013 Fall 2014 Fall 2015 Fall 2016
Freshmen
Full‐ me 3038 2799 2681 2593 2636 2479
Part‐ me 100 67 87 56 68 56
Total 3138 2866 2768 2649 2704 2535
Sophomores
Full‐ me 2040 2108 1887 1813 1725 1654
Part‐ me 48 54 61 62 58 49
Total 2088 2162 1948 1875 1783 1703
Juniors
Full‐ me 1876 1923 1927 1774 1709 1633
Part‐ me 133 102 116 101 83 87
Total 2009 2025 2043 1875 1792 1720
Seniors
Full‐ me 1843 1787 1782 1859 1738 1521
Part‐ me 313 263 271 305 274 238
Total 2156 2050 2053 2164 2012 1759
Total Undergrads
Full‐ me 8797 8617 8277 8039 7808 7287
Part‐ me 594 486 535 524 483 430
Total 9391 9103 8812 8563 8291 7717
Instruc onal Cer ficate
Full‐ me 56 26 5 10 5 10
Part‐ me 40 10 15 16 16 38
Total 96 36 20 26 21 48
Graduate Students
Full‐ me 264 248 266 270 283 269
Part‐ me 532 417 415 359 405 479
Total 796 665 681 629 688 748
Total Enrollment
Full‐ me 9117 8891 8548 8319 8096 7566
Part‐ me 1166 913 965 899 904 947
Total 10283 9804 9513 9218 9000 8513

Enro
llmen
t
27
Trends in Spring Enrollment by Class
Spring 2011
Spring 2012
Spring 2013
Spring 2014
Spring 2015
Spring 2016
Freshmen
Full‐ me 2056 2055 2000 1871 1792 1780
Part‐ me 312 91 70 71 55 59
Total 2368 2146 2070 1942 1847 1839
Sophomores
Full‐ me 1975 1917 1867 1758 1688 1603
Part‐ me 65 57 49 54 66 56
Total 2040 1974 1916 1812 1754 1659
Juniors
Full‐ me 2015 1935 1942 1898 1782 1699
Part‐ me 123 99 107 112 86 88
Total 2138 2034 2049 2010 1868 1787
Seniors
Full‐ me 2066 2013 2019 2067 2056 1913
Part‐ me 259 336 293 299 313 283
Total 2325 2349 2312 2366 2369 2196
Total Undergrads
Full‐ me 8112 7920 7828 7594 7318 6995
Part‐ me 759 583 519 536 520 486
Total 8871 8503 8347 8130 7838 7481
Instruc onal Cer ficate
Full‐ me 83 45 10 6 5 4
Part‐ me 40 22 13 21 20 23
Total 123 67 23 27 25 27
Graduate Students
Full‐ me 268 211 229 234 224 266
Part‐ me 578 508 435 417 415 452
Total 846 719 664 651 639 718
Total Enrollment
Full‐ me 8463 8176 8067 7834 7547 7265
Part‐ me 1377 1113 967 974 955 961
Total 9840 9289 9034 8808 8502 8226

Enro
llmen
t
28
Trends in Fall Enrollment by College and Major – Undergraduate
CIP Plan Deg Major 2011 2012 2013 2014 2015 2016
CO
LLEGE O
F BU
SINESS
520201 UCOBACC BSBA BUS ADMIN/ACCOUNTING 110 112 122 149 135 225
520201 UCOBCRBUS ‐ BUS ADMIN/CORE 1047 1133 1184 1093 1059 410
520201 UCOBFIN BSBA BUS ADMIN/FINANCE 44 46 58 67 78 154
520201 UCOBINT BSBA BUS ADMIN/INT BUS 3
520201 UCOBMGM BSBA BUS ADMIN/MGMT 141 133 131 183 159 322
520201 UCOBMKT BSBA BUS ADMIN/MARKETING 129 108 94 82 105 278
310101 UCOBLSS BS LEISURE AND SPORT ST 339 375 422 415 406 376
College of Business Total 1813 1907 2011 1989 1942 1765
CO
LLEGE O
F EDU
CA
TION
131203 UCOEELUME BSED ELU/4‐8 MAT & ENG 34 34 32 29 18 8
131203 UCOEELUMC BSED ELU/4‐8 MAT & SCI 19 23 28 30 26 25
131203 UCOEELUMS BSED ELU/4‐8 MAT & SS 26 36 32 26 21 10
131203 UCOEELUSE BSED ELU/4‐8 SCI & ENG 13 11 14 9 7 4
131203 UCOEELUSI BSED ELU/4‐8 SCI & SS 23 15 10 8 6 5
131202 UCOEELUCE BSED ELU/COACHING ED 1
131209 UCOEELUEC BSED ELU/EARLY CHILD ED 93 17
131202 UCOEELUEN BSED ELU/ENGLISH 13 4
131202 UCOEELUIT BSED ELU/INSTRUC. TECH 1 1
131202 UCOEELUMA BSED ELU/MATHEMATICS 48 9
131210 UCOEELUPK BSED ELU/PRE K‐4 356 383 321 277 276 217
131202 UCOEELUPS BSED ELU/PSYCHOLOGY 15 5
131202 UCOEELURE BSED ELU/READING 40 2
131202 UCOEELUSC BSED ELU/SCIENCE 5 2
131202 UCOEELUSS BSED ELU/SOC STUDIES 16 7
131202 UCOEELUS BSED ELU/SPANISH 7 1
131202 UCOEELUUN ‐ ELU/UNDECIDED 1
131202 UCOEELUUE BSED ELU/URBAN EDUCATION 2
250101 UCOELIBIT BSED LIB SCI W/INST TECHC 1
250101 UCOELIBS BS LIBRARY SCIENCE 26 22 28 19 17 15
250101 UCOELIBSE BSED LIBRARY SCIENCE 38 30 15 16 12 10
131205 UCOESEUBS BSED SEU/BIO SCI 19 11 11 10 8 7
131205 UCOESEUCM BSED SEU/CHEMISTRY 5 5 1 6 4 2
450101 UCOESEUCH BSED SEU/CIT ED/HISTORY 2
231001 UCOESEUCO BSED SEU/COMMUNICATIONS
231304 UCOESEUCO BSED SEU/COMMUNICATIONS 1 1
400601 UCOESEUES BSED SEU/EARTH SPACE SCI 2 3 1 1 5
230101 UCOESEUEG BSED SEU/ENGLISH 8
131205 UCOESEUEN BSED SEU/ENGLISH 107 95 91 68 66 48
300101 UCOESEUGB BSED SEU/GEN SCI/BIOLOGY 3
400601 UCOESEUEA BSED SEU/ESS/ASTRONOMY 2 2
160901 UCOESEUFR BSED SEU/FRENCH 4 1

Enro
llmen
t
29
Trends in Fall Enrollment by College and Major – Undergraduate
CIP Plan Deg Major 2011 2012 2013 2014 2015 2016
CO
LLEGE O
F EDU
CA
TION
300101 UCOESEUGS BSED SEU/GEN SCI/ESS 1
300101 UCOESEUG BSED SEU/GENERAL SCIENCE 9 7 3 5 2 1
131205 UCOESEUGE BSED SEU/GERMAN 6 5 7 3 1 3
450101 UCOESEUHI BSED SEU/HISTORY 1
131205 UCOESEUMA BSED SEU/MATHEMATICS 93 77 45 40 37 31
131205 UCOESEUPY BSED SEU/PHYSICS 3 2 1 1 2 4
131205 UCOESEUPM BSED SEU/PHYSICS & MATH 13 8 14 7 5 2
450101 UCOESEUSY BSED SEU/SOC SCI/PSYCH 1
450101 UCOESEUSS BSED SEU/SOCIAL STUDIES 117 138 88 93 77 62
131205 UCOESEUSA BSED SEU/SPANISH 21 19 18 20 13 9
131001 UCOESEUBI BSED SEU/SPU BIO 1 1
131001 UCOESEUSEN BSED SEU/SPU ENG 3 6 3 6
131001 UCOESEUSGS BSED SEU/SPU GENERAL SCIENCE 2
131001 UCOESEUSGR BSED SEU/SPU GERMAN 1 1
131001 UCOESEUSMT BSED SEU/SPU MATH 1 1 2 8
131001 UCOESEUSSS BSED SEU/SPU SOC STU 3 7 10 15
131001 UCOESEUSSP BSED SEU/SPU SPA 1 2 3 3
450101 UCOESEUSV BSED SEU/SS/CIVICS & GOV 1
450101 UCOESEUSH BSED SEU/SS/HISTORY 31 3
450101 UCOESEUPS BSED SEU/SS/PSYCHOLOGY 2
450101 UCOESEUSI BSED SEU/SS/SOCIOLOGY 1
450101 UCOESEUUN ‐ SEU/UNDECIDED 21 11 1
131001 UCOESPUEDS BSED SPU EDU STUDIES TRACK 14 14 11
131001 UCOESPUMP BSED SPU/MNTL‐PHYS HAND 95 16
131001 UCOESPUPK BSED SPU/MPHPK‐8/ELEDPK‐4 183 289 232 230 221 199
131009 UCOESPUVE BSED SPU/VI/ELED PREK‐4 22 36 36 43 44 49
131009 UCOESPUVM BSED SPU/VIS IMPAIRMENT 12 3 1
131001 UCOESPUVIS BSED SPU/VIS IMPRMNT ED STU 5 2 1
131001 UCOESPUME BSED SPUMPH/ELU4‐8MT&ENG 22 22 14 10 12 8
131001 UCOESPUMM BSED SPUMPH/ELED4‐8MT&SCI 9 12 14 10 5 4
131001 UCOESPUMT BSED SPUMPH/ELED4‐8MT&SS 4 13 9 10 8
131001 UCOESPUSC BSED SPUMPH/ELED4‐8SC&ENG 2 4 5 5 4 2
131001 UCOESPUSI BSED SPUMPH/ELED4‐8SCI&SS 5 8 3 3 2 3
131001 UCOESPUEM BSED SPUVI/ELED4‐8MAT&ENG 2 3 4 5 4 2
131001 UCOESPUES BSED SPUVI/ELED4‐8MAT&SCI 1
131001 UCOESPUMS BSED SPUVI/ELED4‐8MAT&SS 1 2 1 1
131001 UCOESPUSE BSED SPUVI/ELED4‐8SCI&ENG 2 1 1 2 1
131001 UCOESPUSS BSED SPUVI/ELED4‐8SCI&SS 2 2 1 1 1
College of Educa on Total 1612 1401 1090 1026 937 781

Enro
llmen
t
30
Trends in Fall Enrollment by College and Major – Undergraduate
CIP Plan Deg Major 2011 2012 2013 2014 2015 2016
CO
LLEGE O
F LIBER
AL A
RTS &
SCIEN
CES
450201 ULASANT BA ANTHROPOLOGY 68 79 71 49 43 51
260101 ULASBIOAH BS BIO/ALLIED HEALTH 20
260101 ULASBIOCB BS BIO/CELL BIO‐MICRO 1
260101 ULASBIOMM BS BIO/MOLEC/MICRO/CELL 119 136 156 172 172 171
260101 ULASBIOOE BS BIO/ORGANISMAL/ECO 44 58 66 59 59 44
260101 ULASBIOMH BS BIO/PRE‐MED & HEALTH 57 99 98 114 168 145
260101 ULASBIOPP BS BIO/PRE‐PROFESSIONAL 29 9 3 2
260202 ULASBIOCH BS BIOCHEMISTRY 41 47 56 63 58 57
400501 ULASCHES BS CHEMISTRY 63 57 67 56 50 40
430104 ULASCRJ BS CRIMINAL JUSTICE 472 432 395 451 495 448
430104 ULASCRIMJ2 BS CRIMINAL JUSTICE 1
430104 ULASCRJPL BS CRJ/PARALEGAL STUD 36 31 31 32 31 30
110103 ULASCSCMS BS CSC (COMBINED MS) 1 1 1 1
110101 ULASCSCIT BS CSC/INFO TECHNOLOGY 98 107 102 101 139 151
110101 ULASCSCIC BS CSC/IT (COMBINED MS) 1 2 1 2 1
110101 ULASCSCSD BS CSC/SOFTWARE DEVEL 85 83 102 112 139 137
231303 ULASENGPC BA ENG/PROWRI/CULT&MEDI 33 31 29 17 10 13
230101 ULASENG BA ENGLISH 82 77 67 78 68 64
230101 ULASENGCM BA ENGLISH/CULT & MEDIA 14 10 12 11 7 7
230101 ULASENGPL BA ENGLISH/PARALEGAL ST 6 16 16 8 6 4
230101 ULASENGPW BA ENGLISH/PROF WRITING 244 198 165 140 150 114
30104 ULASENVBI BS ENV SCI/BIOLOGY 89 86 72 78 68 74
30104 ULASENVCH BS ENV SCI/CHEMISTRY 9 8 6 5 6 6
30104 ULASENVGE BS ENV SCI/GEOGRAPHY 9 8 10 11 15 19
30104 ULASENVGO BS ENV SCI/GEOLOGY 23 18 19 17 21 24
160901 ULASFRE BA FRENCH 2 3 1
240102 ULASGENPR BS GEN ST/PROFESSIONAL 4 1 3 3
240102 ULASGENA BA GENERAL STUDIES 2 1
240102 ULASGENS BS GENERAL STUDIES 5 2 6 1
450701 ULASGEOAP BA GEOGRAPHY/APPLIED 6 5 4 6 5 5
450701 ULASGEOEN BA GEOGRAPHY/ENVIRON 30 30 34 22 23 14
450701 ULASGEOGE BA GEOGRAPHY/GENERAL 2 10 9 14 16 7
450701 ULASGEOGL BA GEOGRAPHY/GLOBALIZA 10 8 4 4 2 3
450701 ULASGEOPL BA GEOGRAPHY/PLANNING 3 7 6 1 3 3
400601 ULASGEOA BA GEOLOGY 1
400601 ULASGEOS BS GEOLOGY 52 44 47 56 55 39
50125 ULASGERCO BA GER STUD/COMM&CULTR 11 7 10 10 10 11
50125 ULASGERIN BA GER STUD/INTERDISCP 1 1 1
540101 ULASHIS BA HISTORY 150 137 120 110 75 76
540101 ULASHISPL BA HISTORY/PARALEGAL ST 14 7 11 10 7 9
400607 ULASMARBI BS MAR SCIENCE/BIOLOGY 68 54 42 41 32 29
400607 ULASMARCH BS MAR SCIENCE/CHEM 1 1 1
400607 ULASMARGE BS MAR SCIENCE/GEOLOGY 1 2 1 1
400607 ULASMAROC BS MAR SC/OCEANOGRAPHY 2 11 10 11 12 6
400607 ULASMARPH BS MAR SCIENCE/PHYSICS 4 1
270101 ULASMATA BA MATHEMATICS 3

Enro
llmen
t
31
Trends in Fall Enrollment by College and Major – Undergraduate
CIP Plan Deg Major 2011 2012 2013 2014 2015 2016
CO
LLEGE O
F LIBER
AL A
RTS &
SCIEN
CES
270101 ULASMATS BS MATHEMATICS 63 57 58 52 55 49
511005 ULASMEDTE BS MEDICAL TECH 9 3 1
513801 ULASNUR BSN NURSING 80 39
380101 ULASPHI BA PHILOSOPHY 17 25 19 22 19 15
380101 ULASPHIR BA PHILOSOPHY/RELIG STD 3 3 1 1 2 5
400801 ULASPHYS BS PHYSICS 62 57 40 25 23 25
400801 ULASPHYAP BS PHYSICS ASTRONOMY 9 14 15 20 17
400801 ULASPHYEP BS PHYSICS ENGINEER PHYSIC 7 22 26 29 30
451001 ULASPOLPL BA POL SCI/PARALEGAL ST 11 11 18 21 19 19
451001 ULASPOL BA POLITICAL SCIENCE 93 102 89 90 86 87
400801 ULASPENGR ‐ PRE‐ENGINEERING 5 3
420101 ULASPSYCC BS PSYCH/CLIN‐COUNSELNG 332 317 318 288 256 222
420101 ULASPSYIO BS PSYCH/INDUSTRL‐ORGNZ 35 32 34 38 39 29
420101 ULASPSYPL BS PSYCH/PARALEGAL ST 29 19 14 17 16 14
420101 ULASPSYS BS PSYCHOLOGY/GENERAL 1
420101 ULASPSYGE BS PSYCHOLOGY/GENERAL 339 359 351 357 343 292
440401 ULASPUBPL BS PUB ADM/PARALEGAL ST 6 5 8 6 10 6
440401 ULASPUB BS PUBLIC ADMIN 23 24 24 15 10 9
451101 ULASSOCDI BA SOC/DIV & INEQUALITY 2 4 5 5 3 4
451101 ULASSOCPL BA SOC/PARALEGAL ST 4 1
451101 ULASSOCDB BA SOC/SOC ORD&DEV BEH 3 9 22 24 15 6
440701 ULASSWKA BA SOCIAL WORK 5 4
440701 ULASSWKW BSW SOCIAL WORK 214 312 360 359 314 272
451101 ULASSOC BA SOCIOLOGY 135 128 100 103 70 70
451101 ULASSOCFA BA SOCIOLOGY/FAMILY 7 13 9 12 3
160905 ULASSPA BA SPANISH 21 34 29 27 27 17
College of Liberal Arts & Sciences Total 3483 3498 3391 3372 3317 3014
CO
LLEGE O
F VISU
AL &
PER
FOR
MIN
G A
RTS
500701 UVPAARTED BS ART ED 215 177 149 133 110 117
500701 UVPAARTEDA BS ART ED ALT SETTINGS TRK 2 5 5
500703 UVPAARTHIS BA ART HISTORY 11
500402 UVPACOMDE BFA COMM DESIGN 271 268 263 259 272 264
500402 UVPACOMIL BFA COMM DESIGN/ILLUSTR 11 2 1
231304 UVPASPECO BA COMMUNICATION STUDIES 148 194 292 386 407 420
500201 UVPACFT BFA CRAFTS 29 27 26 30 20 15
90702 ULASTVR BS ELECTRONIC MEDIA 109 184 228 254 246
90702 ULASTVRBU BS ELEC MEDIA/BUSINESS 18 11 6 3 2
90702 ULASCRTVR ‐ ELEC MEDIA/CORE 102 41 7
90702 ULASTVRCS BS ELEC MEDIA/CSC 6 7 3
90702 ULASTVRJP BS ELEC MEDIA/JOURN‐PR 39 29 16 4 1
90702 ULASTVRME BS ELEC MEDIA/METEOROL 5 4 3 1
90702 ULASTVRMD BS ELEC MEDIA/MULTI‐DIS 36 31 18 9 1
90702 ULASTVRMU BS ELEC MEDIA/MUSIC 10 2 2 1
500102 UVPAAPD BFA APPLIED DIGITAL ARTS 16

Enro
llmen
t
32
Trends in Fall Enrollment by College and Major – Undergraduate
CIP Plan Deg Major 2011 2012 2013 2014 2015 2016
CO
LLEGE O
F VISU
AL &
PER
FOR
MIN
G A
RTS
90702 ULASTVRPS BS ELEC MEDIA/PSYCH 6 2 1 1
90702 ULASTVRPU BS ELEC MEDIA/PUB ADMIN 5 3 1
90702 ULASTVRSO BS ELEC MEDIA/SOCIOLOGY 5 2
90702 ULASTVRSP BS ELEC MEDIA/SPE & THE 15 12 3
500901 UVPAMUSIC BA MUSIC 8 2 21 47 46
500901 UVPAMUSCM BA MUSIC COMMERCIAL TRACK 19
500901 UVPAMUSED BS MUSIC EDUCATION 42 47 51 45 48 39
500901 UVPAMUSBU BA MUSIC/BUSINESS 2
500901 UVPAMUSCO BA MUSIC/CORE 40 34 45 9 7 1
500901 UVPAMUSEM BA MUSIC/ELEC MEDIA 1
500901 UVPAMUSGE BA MUSIC/GENERALSTUDIES 2 6 5 24 10 4
500702 UVPACRSTD ‐ STUDIO ART/CORE 132 130 122 106 77 95
500702 UVPASTDDG BFA STUDIO ART/DGTLMEDIA 8 10 13 14 10 8
500702 UVPASTDD BFA STUDIO ART/DRAWING 10 6 9 8 12 7
500702 UVPASTDP BFA STUDIO ART/PAINTING 15 18 24 15 23 15
500702 UVPASTDPH BFA STUDIO ART/PHOTOGRAP 23 23 26 21 22 15
500702 UVPASTDPR BFA STUDIO ART/PRINTMAK 6 5 4 3 13 4
500702 UVPASTDS BFA STUDIO ART/SCULPTURE 3 4 7 3 6 4
500501 UVPATHE BA THEATRE 22 9 4
500501 UVPATHEACT BA THEATRE/ACTING 2 2
500501 UVPATHECO BA THEATRE/COMBINATION 2 2 2
College of Visual & Performing Arts Total 1234 1222 1289 1325 1348 1351
OTH
ER U
ND
ERG
RA
DU
ATE STU
DEN
TS
999998 UACAESL ‐ ESL STUDENT 12 13 13
999998 UACAEXCH ‐ EXCHGE STUDENT TO KU 6 5 4 5 6 3
999998 UACALLL ‐ LIFELONG LEARNING 55 34 35 19 15 21
999998 UACANSE ‐ NAT’L STDNT EXCHANGE 1 5 2 1
999998 UACAPCAND ‐ PRE CANDIDACY C.O.E. 154 132 208 158 150 167
999998 UACATRANS ‐ TRANSIENT 12
999998 UACATRGTU ‐ TRANSIENT/UNDERGRAD ST 1 3
999998 UACATRALB ‐ TRANSIENT/ALBRIGHT 1 1 1
999998 UACATRALV ‐ TRANSIENT/ALVERNIA 1 1 4 1 2
999998 UACATRPSU ‐ TRANSIENT/PSU BERKS‐LEH 5 4 4 3
999998 UACATRRAC ‐ TRANS/READING AREA CC 2 3 3 3
240102 UACAGRCP ‐ UG COLLEGE PREP PROG 5
999998 UACACSCCP ‐ UG CSC COLL PREP PROG 1
999998 UACAGRCP ‐ UG AA COLLEGE PREP 8 1
999998 UACAUNDEC ‐ UNDECLARED 1005 888 757 646 554 600
999998 UACAVISBLO ‐ VISIT/STDNT/BLOOMSBURG 2 8
999998 UACAVSCAL ‐ VISIT/STDNT/CALIFORNIA 1
999998 UACAVSLOC ‐ VISIT/STDNT/LOCK HAVEN 1
999998 UACAVSMIL ‐ VISIT/STDNT/MILLERSVILL 1
999998 UACAVISSHI ‐ VISIT/STDNT/SHIPPENSBURG 1 1
Other Total 1249 1075 1031 851 747 806
Undergraduate Totals 9391 9103 8812 8563 8291 7717

Enro
llmen
t
33
Trends in Fall Enrollment by College and Major – Graduate
CIP Plan Deg Major 2011 2012 2013 2014 2015 2016
BUS 520201 GCOBMBA MBA BUSINESS ADMIN 57 48 43 23 34 34
EDU
CA
TION
131202 GCOEMEDC48 MED CERTIFICATION 4‐8 1 3 5
1312‐2 GCOEMEDCK4 MED CERTIFICATION PRE K‐4 5 16 9 32
422803 GCOECOUPS MA COUNSELING PSYCH 1 1 1
131101 GCOECOUEE MED COUNSELING/ELEM ED
131102 GCOECOUHE MED COUNSELING/HIGHER ED 1
131101 GCOECOUSE MED COUNSELING/SEC ED
422803 GCOECOUCA MA CSLG (CHILD/ADOLESC) 8 12 25 7 1
422803 GCOECOUMH MA CSLG (MENTAL HEALTH) 22 36 58 82 93 90
422803 GCOECOUAG MA CSLG PSYCH (AGENCY) 9 3 1
422803 GCOECOUMF MA CSLG PSYCH (MAR&FAM) 2 3 1 1
422803 GCOECOUCM MA CSLG(CPLS,MAR & FAM) 15 19 27 31 38 36
999999 GCOEEDW ‐ EDW SUMMER WRKSHOP
131101 GCOECOUESC MED DUAL CERT SCHOOL CSL 4 1
131101 GCOEELUCC MED ELEM SCH CSLG/CERT 7 4 4
131101 GCOEELECL MED ELEM SCH CSLG/LICENS 22 20 21 1 1 1
131202 GCOEELEED MED ELEMENTARY ED 16 12 12 7 7 6
130501 GCOEINST MED INSTRUCTIONAL TECH 2
130501 GCOEITD MED IT/DIGITL CLASS TECH 17 17 24 26 44 60
250101 GCOELIB MLS LIBRARY SCIENCE 24 18 16 17 20 30
131315 GCOEREDSP MED READING SPECIALIST 95 67 58 67 50 54
131101 GCOECSLGC MS SCHOOL COUNSELING CERT 23 26 18
131101 GCOECSLGL MS SCHOOL CSLG LICENSURE 42 38 30
131101 GCOESEUCC MED SEC SCH CSLG/CERT 29 24 16 1 1
131101 GCOESEUCL MED SEC SCH CSLG/LICENSE 30 28 28 1 1
131205 GCOESEUTEA MED SEC ED TEACH 18 30 26 31 33
131205 GCOESEUB MED SEU/BIOLOGY 3 4 1 1 1 1
131205 GCOESEUCI MED SEU/CURR & INSTR 40 31 25 19 25 28
131205 GCOESEUEN MED SEU/ENGLISH 19 10 9 4 2 4
131205 GCOESEUM MED SEU/MATHEMATICS 22 9 3 4 2
131205 GCOESEUML MED SEU/MIDDLE LEVEL 2 2 1 1 2 2
131205 GCOESEUSS MED SEU/SOCIAL STUDIES 16 10 5 1 3
131102 GCOESTUAD MED STU AFF/ADMIN 23 27 32 34 46 46
131102 GCOESTUCL MED STU AFF/CSLG/LICENSE 3 4 9 2
LIBER
AL A
RTS &
SCIEN
CES
110103 GLASCIS MS COMPUTER & INFO SCI 1
110701 GLASCSC MS COMPUTER SCIENCE 12 9 11 11 8 5
110701 GLASCSCPSM MS COMP SCI PSM TRACK 5 3 5 4 3
110701 GLASCSCBS MS CSC (COMBINED BS) 2 5 3 2 1 6
110701 GLASCSCIT MS CSC/INFO TECHNOLOGY 7 4 5 2 3 1
110701 GLASCSCIB MS CSC/IT (COMBINED BS) 1 1 1 2
440701 GLASDSW DSW SOCIAL WORK 8 16
230101 GLASENG MA ENGLISH 23 19 29 19 17 24
513899 GLASMSN MSN NURSING 17 8
440401 GLASPUB MPA PUBLIC ADMIN 45 28 30 26 31 29
440701 GLASMSW MSW SOCIAL WORK 63 57 71 68 73 79

Enro
llmen
t
34
Trends in Fall Enrollment by College and Major – Graduate and Instruc onal Cer ficate
CIP Plan Deg Major 2011 2012 2013 2014 2015 2016
500701 GVPAART MED ART EDUCATION 59 44 34 30 34 32
500402 GVPACDE MFA COMMUNICATN DESIGN 4 11 11
90702 GVPATVR MS ELECTRONIC MEDIA 17 17 6 1
AC
A
999998 GACAEXCH ‐ EXCHANGE STU TO KU 1 2 2 2 1 2
999998 GACAPIC ‐ PRE I.C. C.O.E. 1
999998 GACAPROCR ‐ PROF CREDITS STUDENT 65 36 29 21 20 24
Graduate Studies Total 796 665 681 629 688 748
INSTR
UC
TION
AL C
ERTIFIC
ATE
131401 CCOEESL ‐ COR ENGLISH‐2ND LANG 1 3 1 2
131202 CCOEELU IC ELEMENTARY ED 18 5
131101 CCOEESC IC ELU/SCHOOL COUNS 2 1
250101 CCOELIB IC LIBRARY SCIENCE 1 1 1 1
130409 CCOEPRIN IC PRINCIPAL CERT 2 10
131315 CCOEREA IC READING SPECIALIST 2 3 3 2 1 1
260101 CCOESEUB IC SEU/BIOLOGY 2 1 1
400501 CCOESEUC IC SEU/CHEMISTRY
450101 CCOESEUCI IC SEU/CIT ED/HISTORY 1
130404 CCOESEUCU IC SEU/CURR & INSTR 5 1 5 8 7 10
400601 CCOESEUES IC SEU/EARTH SPACE SCI 1
230101 CCOESEUEN IC SEU/ENGLISH 10 5
160901 CCOESEUFR IC SEU/FRENCH
300101 CCOESEUGN IC SEU/GEN SCI/ESS 1
270101 CCOESEUM IC SEU/MATHEMATICS 5 1
400801 CCOESEUPY IC SEU/PHYSICS 1
131101 CCOEESCSC IC SEU/SCHOOL COUNS 2 4 1 1
450101 CCOESEUSO IC SEU/SOC SCI/SOC
450101 CCOESEUST IC SEU/SOCIAL STUDIES 14 2
160905 CCOESEUAS IC SEU/SPANISH 1 1
450101 CCOESEUAN IC SEU/SS/ANTHROPOLOGY
450101 CCOESEUSH IC SEU/SS/HISTORY
450101 CCOESEUPS IC SEU/SS/POLITICAL SCI
131001 CCOESPUMP IC SPU/MNTL/PHYS HAND 5 2
131001 CCOESPUHK8 IC SPU/MNTL/PH PREK‐8 3 2 1
131009 CCOESPUVI IC SPU/VIS IMPAIRED 4
511699 CLASESC IC SCHOOL NURSE
513899 CLASESC IC SCHOOL NURSE 1
500701 CVPAART IC ART EDUCATION 18 6 7 8 7 11
500901 CVPAMUS IC MUSIC EDUCATION 3 3 1
Instruc onal Cer ficate Total 96 36 20 26 21 48
University Totals 10283 9804 9513 9218 9000 8513
VP
A
130501 CCOEITE IC INSTRUCTIONAL TECH 1 1
131009 CCOESPUVIG IC VISUAL IMPAIRMT CERT 11

Enro
llmen
t
35
Trends in Fall Enrollment by Ethnicity – Females
Fall 2011 Fall 2012 Fall 2013 Fall 2014 Fall 2015 Fall 2016
UN
DER
GR
AD
UA
TE
Non‐resident Alien 27 32 41 42 38 26
African‐American 342 345 303 331 319 244
Asian 64 64 57 49 52 48
Hawaiian/Pacific Islander 1 3 4 5 6 3
Hispanic 299 308 294 339 324 339
Na ve American 16 11 8 8 4 6
White 4463 4260 4120 3846 3574 3301
Mul ‐racial 68 91 88 100 129 128
Unknown 91 83 69 62 63 52
Total 5371 5197 4984 4782 4509 4147
INSTR
UC
TION
AL C
ERTIFIC
ATE
Non‐resident Alien 1
African‐American 1 1
Asian
Hawaiian/Pacific Islander
Hispanic 1 1 1
Na ve American
White 48 20 17 21 16 33
Mul ‐racial 1 6
Unknown 4 1
Total 55 23 18 21 17 39
GR
AD
UA
TE
Non‐resident Alien 9 6 9 12 9 7
African‐American 25 16 17 18 25 28
Asian 4 3 2 6 5 7
Hawaiian/Pacific Islander
Hispanic 17 20 26 29 35 31
Na ve American 2 2 1
White 483 398 417 400 426 462
Mul ‐racial 4 1 1 2 2 4
Unknown 25 27 29 22 34 33
Total 569 473 502 489 536 572
CO
MB
INED
Non‐resident Alien 37 38 50 54 47 33
African‐American 368 362 320 349 344 272
Asian 68 67 59 55 57 55
Hawaiian/Pacific Islander 1 3 4 5 6 3
Hispanic 317 329 321 368 359 370
Na ve American 18 13 9 8 4 6
White 4994 4678 4554 4267 4016 3796
Mul ‐racial 72 92 89 102 132 133
Unknown 120 111 98 84 97 90
Total 5995 5693 5504 5292 5062 4758

Enro
llmen
t
36
Trends in Fall Enrollment by Ethnicity – Males
Fall 2011 Fall 2012 Fall 2013 Fall 2014 Fall 2015 Fall 2016
UN
DER
GR
AD
UA
TE
Non‐resident Alien 49 46 49 45 44 31
African‐American 309 303 304 348 379 347
Asian 44 55 51 42 42 35
Hawaiian/Pacific Islander 1 2 6 10 9 5
Hispanic 230 237 236 282 275 287
Na ve American 12 6 6 6 6 5
White 3218 3097 3036 2878 2827 2679
Mul ‐racial 49 68 72 92 110 115
Total 4020 3906 3828 3781 3782 3570
INSTR
UC
TION
AL C
ERTIFIC
ATE
Non‐resident Alien
African‐American 2
Asian
Hawaiian/Pacific Islander
Hispanic 1 1
Na ve American
White 36 11 2 5 4 9
Mul ‐racial
Total 41 13 2 5 4 9
GR
AD
UA
TE
Non‐resident Alien 6 3 5 2 2 5
African‐American 10 7 6 5 9 12
Asian 4 3 3 1 3 2
Hawaiian/Pacific Islander
Hispanic 12 12 9 11 6 5
Na ve American
White 188 162 147 111 121 138
Mul ‐racial 2 3 3
Total 227 192 179 140 152 176
CO
MB
INED
Non‐resident Alien 55 49 54 47 46 36
African‐American 321 310 310 353 388 359
Asian 48 58 54 43 45 37
Hawaiian/Pacific Islander 1 2 6 10 9 5
Hispanic 243 250 245 293 281 292
Na ve American 12 6 6 6 6 5
White 3442 3270 3185 2994 2952 2826
Mul ‐racial 49 68 72 94 113 118
Total 4288 4111 4009 3926 3938 3755
Unknown 108 92 68 78 90 66
Unknown 2 1
Unknown 7 5 9 8 8 11
Unknown 117 98 77 86 98 77

Enro
llmen
t
37
Trends in Fall Enrollment by Ethnicity – All Students
Fall 2011 Fall 2012 Fall 2013 Fall 2014 Fall 2015 Fall 2016
UN
DER
GR
AD
UA
TE
Non‐resident Alien 76 78 90 87 82 57
African‐American 651 648 607 679 698 591
Asian 108 119 108 91 94 83
Hawaiian/Pacific Islander 2 5 10 15 15 8
Hispanic 529 545 530 621 599 626
Na ve American 28 17 14 14 10 11
White 7681 7357 7156 6724 6401 5980
Mul ‐racial 117 159 160 192 239 243
Unknown 199 175 137 140 153 118
Total 9391 9103 8812 8563 8291 7717
INSTR
UC
TION
AL C
ERTIFIC
ATE
Non‐resident Alien 1 0 0 0 0 0
African‐American 3 1 0 0 0 0
Asian 0 0 0 0 0 0
Hawaiian/Pacific Islander 0 0 0 0 0 0
Hispanic 2 2 1 0 0 0
Na ve American 0 0 0 0 0 0
White 84 31 19 26 20 42
Mul ‐racial 0 0 0 0 1 1
Unknown 6 2 0 0 0 5
Total 96 36 20 26 21 48
GR
AD
UA
TE
Non‐resident Alien 15 9 14 14 11 12
African‐American 35 23 23 23 34 40
Asian 8 6 5 7 8 9
Hawaiian/Pacific Islander 0 0 0 0 0 0
Hispanic 29 32 35 40 41 36
Na ve American 2 2 1 0 0 0
White 671 560 564 511 547 600
Mul ‐racial 4 1 1 4 5 7
Unknown 32 32 38 30 42 44
Total 796 665 681 629 688 748
CO
MB
INED
Non‐resident Alien 92 87 104 101 93 69
African‐American 689 672 630 702 732 631
Asian 116 125 113 98 102 92
Hawaiian/Pacific Islander 2 5 10 15 15 8
Hispanic 560 579 566 661 640 662
Na ve American 30 19 15 14 10 11
White 8436 7948 7739 7261 6968 6622
Mul ‐racial 121 160 161 196 245 251
Total 10283 9804 9513 9218 9000 8513
Unknown 237 209 175 170 195 167

Enro
llmen
t
38
Trends in Fall Undergraduate Enrollment by Age
Age Group Fall 2011 Fall 2012 Fall 2013 Fall 2014 Fall 2015 Fall 2016
FT PT FT PT FT PT FT PT FT PT FT PT
FEMA
LE
15‐16 2 1 1 1 1 1
17‐18 1203 9 1105 10 1023 9 927 2 960 5 840 4
19‐20 2064 30 2103 29 1951 27 1825 22 1707 27 1637 28
21‐22 1379 80 1327 57 1405 77 1416 88 1262 67 1181 51
23‐24 202 60 220 40 194 54 206 55 206 49 167 43
25‐29 92 55 116 47 88 53 80 45 91 42 74 31
30‐34 31 29 26 18 20 13 27 13 19 13 16 19
35‐39 11 18 10 16 10 7 11 11 11 11 10 11
40‐49 31 39 20 33 16 20 14 23 10 15 9 11
50‐59 7 24 4 11 2 8 7 5 8 4 5 4
60 & Over 5 2 3 2 4 1 3 1 1 5
Unknown
Total 5022 349 4934 265 4711 273 4514 268 4275 234 2940 207
MA
LE
15‐16 1
17‐18 647 10 708 4 617 6 649 6 706 7 655 5
19‐20 1787 28 1375 14 1343 26 1337 24 1301 21 1297 24
21‐22 1142 64 1106 73 1145 73 1090 72 1085 57 980 55
23‐24 289 61 282 62 273 60 278 63 276 69 240 56
25‐29 153 43 147 38 127 51 110 44 113 57 122 48
30‐34 28 13 33 9 34 17 35 16 25 17 29 19
35‐39 13 9 17 8 16 5 15 5 13 3 9 3
40‐49 15 7 12 9 8 13 10 11 13 11 11 6
50‐59 2 6 4 4 3 8 8 1 2 4 3
60 & Over 2 1 3 1 6 2 4
Unknown 1 3
Total 4076 244 3684 222 3566 262 3525 256 3533 249 3347 223
CO
MB
INED
15‐16 2 1 1 1 0 1 0 1 1
17‐18 1850 19 1813 14 1640 15 1576 8 1666 12 1495 9
19‐20 3851 58 3478 43 3294 53 3162 46 3008 48 2934 52
21‐22 2521 144 2433 130 2550 150 2506 160 2347 124 2161 106
23‐24 491 121 502 102 467 114 484 118 482 118 407 99
25‐29 245 98 263 85 215 104 190 89 204 99 196 79
30‐34 59 42 59 27 54 30 62 29 44 30 45 38
35‐39 24 27 27 24 26 12 26 16 24 14 19 14
40‐49 46 46 32 42 24 33 24 34 23 26 20 17
50‐59 9 30 8 15 5 16 7 13 9 6 9 7
60 & Over 0 7 2 4 2 7 2 9 3 1 9
Unknown 0 0 0 0 0 0 0 1 3
Total 9098 593 8618 487 8277 535 8039 524 7808 483 7287 430

Enro
llmen
t
39
Trends in Fall Graduate & Instruc onal Cer ficate Enrollment by Age
Age Group Fall 2011 Fall 2012 Fall 2013 Fall 2014 Fall 2015 Fall 2016
FT PT FT PT FT PT FT PT FT PT FT PT
FEMA
LE
Under 18
19‐20
21‐22 19 9 33 4 23 11 30 6 35 3 34 9
23‐24 73 62 57 40 65 40 67 43 83 35 92 55
25‐29 74 181 56 136 59 129 67 123 58 143 53 143
30‐34 5 63 13 48 18 50 24 42 18 50 12 57
35‐39 12 23 10 21 9 27 12 22 10 33 9 42
40‐49 14 49 11 39 13 43 17 33 18 39 7 61
50‐59 10 29 2 25 6 23 5 16 4 21 6 27
60 & Over 1 1 1 3 1 2 1 2 4
Total 207 417 182 314 194 326 223 287 227 326 213 398
MA
LE
Under 18
19‐20
21‐22 11 1 10 1 7 1 3 1 15 2 6 2
23‐24 32 20 28 10 26 12 22 10 15 15 29 14
25‐29 38 60 37 40 23 28 13 28 19 35 18 43
30‐34 16 32 10 25 7 29 8 21 6 13 7 20
35‐39 10 18 4 12 6 14 4 12 1 10 1 13
40‐49 3 14 20 6 13 7 11 5 13 2 19
50‐59 3 8 3 3 2 6 5 6 2 7
60 & Over 2 2 1 1 1 1
Total 113 155 92 113 77 104 57 88 61 95 66 119
CO
MB
INED
Under 18 0 0 0 0 0 0 0 0 0 0 0 0
19‐20 0 0 0 0 0 0 0 0 0 0 0 0
21‐22 30 10 43 5 30 12 33 7 50 5 40 11
23‐24 105 82 85 50 91 52 89 53 98 50 121 69
25‐29 112 241 93 176 82 157 80 151 77 178 71 186
30‐34 21 95 23 73 25 79 32 63 24 63 19 77
35‐39 22 41 14 33 15 41 16 34 11 43 10 55
40‐49 17 63 11 59 19 56 24 44 23 52 9 80
50‐59 13 37 5 28 8 29 5 21 4 27 8 34
60 & Over 0 3 0 3 1 4 1 2 1 3 1 5
Total 320 572 274 427 271 430 280 375 288 421 279 517

Enro
llmen
t
40
Trends in Fall Enrollment – Mean and Median Age
Female Male Combined
FT PT Total FT PT Total FT PT Total
FALL 2
01
1
UG Mean Age 20 20 21 21 25 21 20 29 21
UG Median Age 20 24 20 20 23 20 20 23 20
IC Mean Age 27 36 31 31 35 32 29 36 32
IC Median Age 25 33 27 29 32 30 27 33 28
GR Mean Age 28 31 30 27 32 30 28 31 30
GR Median Age 25 27 27 25 29 27 25 28 27
FALL 2
01
2
UG Mean Age 20 29 21 21 25 21 20 27 21
UG Median Age 20 24 20 20 23 20 20 23 20
IC Mean Age 28 34 30 32 38 34 30 35 31
IC Median Age 26 34 28 31 41 32 28 34 26
GR Mean Age 27 32 30 26 33 30 27 32 30
GR Median Age 24 28 27 25 30 27 24 29 27
FALL 2
01
3
UG Mean Age 20 27 21 21 26 21 20 26 21
UG Median Age 20 23 20 20 23 20 20 23 20
IC Mean Age 33 35 35 42 35 39 35 35 35
IC Median Age 33 35 35 42 35 39 38 35 35
GR Mean Age 28 32 30 28 34 31 28 32 31
GR Median Age 25 28 27 25 31 28 25 29 27
FALL 2
01
4
UG Mean Age 21 27 21 21 27 21 21 27 21
UG Median Age 20 23 20 20 23 20 20 23 20
IC Mean Age 31 37 35 30 34 33 31 36 34
IC Median Age 28 32 29 30 27 27 28 31 29
GR Mean Age 29 32 30 29 33 32 29 32 31
GR Median Age 25 27 27 26 31 29 25 28 27
FA
LL 20
15
UG Mean Age 21 27 21 21 26 21 21 26 21
UG Median Age 20 23 20 20 23 20 20 23 20
IC Mean Age 28 41 37 29 29 28 38 35
IC Median Age 25 42 36 28 28 25 35 31
GR Mean Age 28 32 31 27 33 31 28 33 31
GR Median Age 24 28 26 25 29 27 24 28 27
FALL 2
01
6
UG Mean Age 21 28 21 21 26 21 21 27 21
UG Median Age 20 23 20 20 23 20 20 23 20
IC Mean Age 31 36 35 26 38 35 30 36 35
IC Median Age 27 35 32 27 37 32 26 35 33
GR Mean Age 27 33 31 28 33 31 27 33 31
GR Median Age 24 28 27 24 29 28 24 29 27

Enro
llmen
t
41
Trends in Fall Undergraduate Enrollment by County
Fall 2011 Fall 2012 Fall 2013 Fall 2014 Fall 2015 Fall 2016
Adams 44 39 34 33 32 27
Allegheny 9 7 5 4 4 9
Armstrong 1 2 1 2 1 3
Beaver 1 1 1 2
Bedford 3 3 1 3 2
Berks 1656 1579 1527 1438 1319 1201
Blair 7 5 6 6 5 4
Bradford 12 19 19 15 16 19
Bucks 717 665 643 622 607 502
Butler 1 1 1 1 4 3
Cambria 3 1 2 4 3
Cameron 1 1 1
Carbon 125 94 98 110 108 100
Centre 8 8 8 7 7 3
Chester 482 466 459 433 375 364
Clarion
Clearfield 1 4 4 3 2
Clinton 8 5 6 5 4 3
Columbia 26 24 22 19 11 8
Crawford 1 1 1
Cumberland 136 147 133 129 117 108
Dauphin 115 119 107 120 136 128
Delaware 286 297 288 298 317 302
Elk
Erie 1
Faye e 1
Forest 1 1 1
Franklin 21 23 27 22 22 29
Fulton
Greene
Hun ngton 2 1 2 1 4 3
Indiana 1
Jefferson
Juniata 1 1 1 1
Lackawanna 122 121 118 123 126 118

Enro
llmen
t
42
Trends in Fall Undergraduate Enrollment by County
Fall 2011 Fall 2012 Fall 2013 Fall 2014 Fall 2015 Fall 2016
Lancaster 321 318 328 314 303 308
Lawrence 1
Lebanon 96 107 114 114 106 87
Lehigh 1026 946 935 896 893 844
Luzerne 159 135 127 121 128 120
Lycoming 34 32 24 23 22 24
McKean 1 1 1
Mercer 2 1 1 1
Mifflin 6 1 2 3 3 5
Monroe 187 192 187 181 173 166
Montgomery 820 786 725 735 735 716
Montour 5 4 5 3 4 5
Northampton 560 597 589 548 477 462
Northumberland 41 50 53 38 37 34
Perry 22 23 26 22 19 14
Philadelphia 535 517 491 514 537 461
Pike 69 63 64 71 63 72
Po er 1 1
Schuylkill 326 310 271 260 250 236
Snyder 13 11 8 8 7 12
Somerset 1
Sullivan 2 1 1 1
Susquehanna 41 39 31 28 23 22
Tioga 6 6 6 9 5 4
Union 9 5 3 6 5 3
Venango 1 1
Warren 1
Washington 1 1 2 3
Wayne 52 44 39 32 49 43
Westmoreland 3 3 4 3 3 2
Wyoming 10 15 16 17 12 9
York 215 223 216 209 214 175
Unknown 4 1 2 1 1
In‐state Total 8355 8060 7782 7560 7300 6774

Enro
llmen
t
43
Trends in Fall Undergraduate Enrollment by State
Fall 2011 Fall 2012 Fall 2013 Fall 2014 Fall 2015 Fall 2016
Arizona 1 1
California 3 1 3 3 3 4
Colorado 1 1
Connec cut 7 8 5 10 12 12
Delaware 31 37 30 37 39 40
District of Columbia 2 2 2 2 3 2
Florida 2 3 2 1 3 4
Georgia 1 2 2
Hawaii 1 1 1
Illinois 1 1
Indiana 1 2 2
Iowa 1 1 1 1
Kansas 1
Maine 3 2 4 3 2
Maryland 33 31 31 31 36 40
Massachuse s 3 4 2 3 1 2
Michigan 1 2
Minnesota 1 1 1
Mississippi 1
Missouri 1 1 2 1
Nevada 1 1 1 1 1
New Hampshire 1 1
New Jersey 763 755 763 727 686 660
New Mexico 1
New York 61 72 59 59 52 53
North Carolina 2 1 1 4 5 5
North Dakota 2 2
Ohio 4 2 6 4 3 4
Oklahoma 1
Oregon 1 1 1 1
Rhode Island 1 1 1 3 2 1
South Carolina 2
South Dakota 1 1
Texas 1 1 1 1
Vermont 2 2 2 3 1
Virginia 5 7 2 2 2
Washington 2 1
West Virginia 1 1
Unknown 32 32 18 17 39 39
Out‐of‐state Total 960 965 940 916 909 886
Montana 1

Enro
llmen
t
44
Trends in Fall Undergraduate Enrollment by Country
Fall 2011 Fall 2012 Fall 2013 Fall 2014 Fall 2015 Fall 2016
Albania 1 1 1
Australia 1
Azerbaijan 1 1
Belgium 1 1 1
Brazil 1 1 1
Bulgaria 1
Canada 1 1 1 3 3 1
China 23 24 28 21 15 8
Dominican Republic 1
Ecuador 1 2
Egypt 1 1 1 1 1
El Salvador 1 1 2 2 1 1
Ethiopia 1 1 1
France 1 2 1 1
Germany 2 4 4 4 6 3
Greece 1
Hai 2 2 2
Hungary 1 1
India 12 10 5 5 4 2
Israel 1
Italy 1 1
Jamaica 1 1 1
Kenya 1 3
Malaysia 1 2 2 2 1
Mali 1 1
Mexico 1 1 1 1
Morocco 1

Enro
llmen
t
45
Trends in Fall Undergraduate Enrollment by Country
Fall 2011 Fall 2012 Fall 2013 Fall 2014 Fall 2015 Fall 2016
Nepal 2 2 4 3 4 5
Netherlands 4 4 4 4 4 2
Nigeria 2 3 2 2 1
Pakistan 1 1 1 1 1
Peru 1 2
Saudi Arabia 3 1 1 1
Senegal 1
Singapore 1 1
South Africa 4 6 8 8 10 10
Spain 3 3 4
Sri Lanka 1 2 1 2
Sweden 2 2
Turkey 1 1 1 1 1
Turkmenistan 1 1
Ukraine 1
United Kingdom 2 1 2 3 3 4
Uzbekistan 2 2 2 2
Venezuela 1
Vietnam 3 4 6 5 2
Zambia 1 1
Zimbabwe 6 2 1 2
Unknown 3 2 2 1
Non‐resident Alien Total 76 78 90 87 82 57
United States 9315 9025 8722 8476 8209 7660
Total Undergraduate 9391 9103 8812 8563 8291 7717

Ove
rvie
w
46
Trends in Fall Instruc onal Cer ficate Enrollment by County / State / Country
Fall 2011 Fall 2012 Fall 2013 Fall 2014 Fall 2015 Fall 2016
Berks 33 12 11 11 9 19
Bradford 1
Bucks 3 1
Carbon 3 2 1
Chester 6 2 1 3
Clinton 1
Columbia 1
Cumberland 1 1 1
Delaware 2
Lancaster 1 1 1
Lebanon 1 1 2
Lehigh 18 6 4 4 3 9
Luzerne 1
Monroe 2 1 1 1
Montgomery 7 2 2 4 2 1
Montour 1 1
Northampton 9 2 1 5 1 2
Philadelphia 1 1
Pike 1 1
Schuylkill 4 2 2 3 1
Pennsylvania Total 93 34 20 26 20 45
Georgia 1
New Hampshire 1 1
New Jersey 1 1 1
Out‐of‐State Total 2 2 0 0 1 3
Ghana 1
Non‐resident Alien Total 1 0 0 0 0 0
Total Instruc onal Cer ficate 96 36 20 26 21 48
Maryland 2

Overview
47
Trends in Fall Graduate Enrollment by County
Fall 2011 Fall 2012 Fall 2013 Fall 2014 Fall 2015 Fall 2016
Adams 1
Allegheny 1 1 1
Beaver 1 1
Berks 277 216 234 207 225 226
Blair 1
Bradford 1 1
Bucks 20 23 23 20 19 31
Butler 1 1
Carbon 16 13 12 10 10 11
Centre 1 1 1 1
Chester 13 10 8 12 14 23
Clinton 1 1
Columbia 1 2 2 2 1
Crawford 1 1 1
Cumberland 4 3 3 2 6 9
Dauphin 3 2 1 2 4 9
Delaware 4 2 3 5 1
Erie 1 2
Faye e 1 1 1
Franklin 1 1
Indiana 1 2
Jefferson 1 1
Juniata 1 1
Lackawanna 1 3 3 2 4 1
Lancaster 15 15 17 14 9 18
Lebanon 8 10 11 8 9 6
Lehigh 206 144 140 137 168 180
Luzerne 6 3 6 5 8 4
Lycoming 1 1 1 1
Mifflin 1 1 1 1 1
Monroe 8 8 7 6 11 7
Montgomery 41 30 42 42 40 55
Montour 2 1
Northampton 62 86 81 79 65 64
Northumberland 4 5 4 3 3 4
Perry 2 2 1
Philadelphia 5 6 5 3 8 9

Enro
llmen
t
48
Trends in Fall Graduate Enrollment by County
Fall 2011 Fall 2012 Fall 2013 Fall 2014 Fall 2015 Fall 2016
Pike 3 4 3 4 4 3
Schuylkill 39 38 27 21 19 27
Susquehanna 1
Tioga 1 1
Union 1 1 1
Warren 1 1 1 1 1
Wayne 5 2
Westmoreland 1 1 1
Wyoming 1 1 1 1 1
York 6 5 5 2 4 4
In‐state Total 756 637 649 596 649 707
Trends in Fall Graduate Enrollment by State
Fall 2011 Fall 2012 Fall 2013 Fall 2014 Fall 2015 Fall 2016
California 1
Connec cut 1
Florida 1 1 1
Kansas 1 1 1
Maryland 2 2 3
Massachuse s 1
New Jersey 9 8 7 9 15 12
New Mexico 1 1 1
New York 2 2 2 3 5 3
North Carolina 2 1 1 1
Virginia 1 2 2
Unknown 6 5 5 3 5 7
Out‐of‐state Total 25 19 18 19 28 29
Delaware 1

Enro
llmen
t
49
Trends in Fall Graduate Enrollment by Country
Fall 2011 Fall 2012 Fall 2013 Fall 2014 Fall 2015 Fall 2016
Bulgaria 1
Cameroon 1 1 2 1
China 6 2 1
Colombia 1 1
Denmark 1
Dominica 1 1
Egypt 1
France 1 1
Germany 2 2 1
Ghana 1 1
India 2 2 5 4 3
Iran 1 1
Japan 1 1
Kenya 1 1 1
Lebanon 1 1
Mali 1 1
Nepal 1
Nigeria 2 1 1 1
Romania 1
Russia 1
Senegal 1
Tanzania 1 1
Turkey 1 1
Turkmenistan 1
Unknown 1 1
Non‐resident Alien Total 15 9 14 14 11 12
United States 781 656 667 615 677 736
Total Graduate 796 665 681 629 688 748
Undergraduate 9391 9103 8812 8563 8291 7717
Cer ficate 95 37 20 26 21 48
Graduate 796 665 681 629 688 748
Total 10283 9804 9513 9218 9000 8513
Hungary 1
Syria 1

Deg
rees
Aw
ard
ed
50
Trends in Degrees Awarded by College and Major ‐ Undergraduate
Major CIP Code 2010‐ 2011
2011‐ 2012
2012‐ 2013
2013‐ 2014
2014‐ 2015
2015‐ 2016
CLG
OF B
USIN
ESS
BS LEISURE AND SPORT ST 31.0101 74 82 68 103 109
BSBA BUS ADMIN/ACCOUNTING 52.0201 56 71 63 67 62 78
BSBA BUS ADMIN/FINANCE 52.0201 32 34 29 40 41 63
BSBA BUS ADMIN/INT BUS 52.1101 15 4
BSBA BUS ADMIN/MANAGEMENT 52.0201 115 129 148 139 163 147
BSBA BUS ADMIN/MARKETING 52.0201 105 108 126 109 112 108
College of Business Total 323 420 448 423 481 505
CO
LLEGE O
F EDU
CA
TION
BS LEISURE AND SPORT ST 31.0101 74
BS LIBRARY SCIENCE 25.0101 7 10 7 10 8 3
BSED ELU/4‐8 MAT & ENG 13.1203 1 10 10 7
BSED ELU/4‐8 MAT & SCI 13.1203 4 9 7 5
BSED ELU/4‐8 MAT & SS 13.1203 8 10 8 13
BSED ELU/4‐8 SCI & ENG 13.1203 2 3 4 2
BSED ELU/4‐8 SCI & SS 13.1203 6 6 2 1
BSED ELU/COACHING ED 13.1202 3 1
BSED ELU/COACHING ED/TRK2 13.1202 2
BSED ELU/EARLY CHILD ED 13.1209 67 74 17
BSED ELU/ENGLISH 13.1202 10 9 4
BSED ELU/INSTRUC. TECH 13.1202 1 1
BSED ELU/MATHEMATICS 13.1202 27 46 10
BSED ELU/PRE K‐4 13.1210 72 104 62 80
BSED ELU/PSYCHOLOGY 13.1202 13 16 5
BSED ELU/READING 13.1202 40 46 5
BSED ELU/SCIENCE 13.1202 9 5 2
BSED ELU/SOC STUDIES 13.1202 9 9 7
BSED ELU/SPANISH 13.1202 4 7 1
BSED ELU/URBAN EDUCATION 13.1202 3 3
BSED LIB SCI W/ELU CERT 25.0101 1
BSED LIB SCI W/INST TECHC 25.0101 1 1
BSED LIBRARY SCIENCE 25.0101 10 11 12 6 6 3
BSED SEU/BIO SCI 26.0101 1 6 4 4 1 1
BSED SEU/CHEMISTRY 13.1205 1 2 1
BSED SEU/CIT ED/HISTORY 45.0101 6 2
BSED SEU/COMMUNICATIONS 23.1304 1 1
BSED SEU/EARTH SPACE SCIENCE 40.0601 1
BSED SEU/ENGLISH 23.0101 27 23 33 22 19 17
BSED SEU/ESS/ASTRONOMY 40.0601 1 2
BSED SEU/ESS/GEOLOGY 40.0601 2
BSED SEU/FRENCH 16.0901 2 1 1
BSED SEU/GEN SCI/BIOLOGY 30.0101 1
BSED SEU/GEN SCI/ESS 30.0101 1 1
BSED SEU/GENERAL SCIENCE 30.0101 3 3 1
BSED SEU/GERMAN 16.0501 1 1 2
BSED SEU/MATHEMATICS 27.0101 24 16 28 17 11 8
BSED SEU/PHYSICS 13.1205 1 1
BSED SEU/PHYSICS & MATH 40.0801 4 1 3 1
BSED SEU/SOCIAL STUDIES 45.0101 1 26 20 26 15

Degrees A
ward
ed
51
Trends in Degrees Awarded by College and Major ‐ Undergraduate
Major CIP Code 2010‐ 2011
2011‐ 2012
2012‐ 2013
2013‐ 2014
2014‐ 2015
2015‐ 2016
CO
LLEGE O
F EDU
CA
TION
BSED SEU/SPANISH 16.0905 7 7 5 2 9 7
BSED SEU/SPU ENGLISH 13.1009 1 2 1
BSED SEU/SPU SOC STU 13.1019 3 4
BSED SEU/SS/CIVICS & GOV 45.0101 3
BSED SEU/SS/HISTORY 45.0101 25 25 3
BSED SEU/SS/PSYCHOLOGY 45.0101 2 1
BSED SEU/SS/SOCIOLOGY 45.0101 1 1
BSED SEU/SPU GER 13.1001 1
BSED SPU EDU STUDIES TRACK 13.1001 9 11
BSED SPU/MNTL‐PHYS HAND 13.1001 74 82 17
BSED SPU/MPHPK‐8/ELEDPK‐4 13.1001 40 66 54 69
BSED SPU/VI/ELED PREK‐4 13.1001 4 10 10 14
BSED SPU/VIS IMPAIRMENT 13.1001 11 9 3
BSED SPU/VIS IMPAIRMENT ED STU 13.1001 3 1
BSED SPUMPH/ELED4‐8MT&ENG 13.1001 4 1 2 4
BSED SPUMPH/ELED4‐8MT&SCI 13.1001 1 3 4 1
BSED SPUMPH/ELED4‐8MT&SS 13.1001 3 3 5
BSED SPUMPH/ELED4‐8SC&ENG 13.1001 1 1 1
BSED SPUMPH/ELED4‐8SCI&SS 13.1001 1 1
BSED SPUVI/ELED4‐8MAT&ENG 13.1001 1 1
BSED SPUVI/ELED4‐8MAT&SS 13.1001 1
BSED SPUVI/ELED4‐8SCI&ENG 13.1001 1
BSED SPUVI/ELED4‐8SCI&SS 13.1001 1
College of Educa on Total 470 418 344 314 273 280
CO
LLEGE O
F LIBER
AL A
RTS &
SCIEN
CES
BA ANTHROPOLOGY 45.0201 18 12 14 22 13 14
BA ENG/PROWRI/CULT&MEDI 23.0101 1 4 3 7 4 4
BA ENGLISH 23.0101 23 17 22 18 21 16
BA ENGLISH/CULT & MEDIA 23.0101 2 1 1 1 3
BA ENGLISH/PARALEGAL ST 23.0101 2 2 5 4 4
BA ENGLISH/PROF WRITING 23.0101 45 58 59 52 42 41
BA FRENCH 16.0901 1
BA GENERAL STUDIES 24.0102 3 1 1 2 1
BA GEOGRAPHY/APPLIED 45.0701 1 1 2 2
BA GEOGRAPHY/ENVIRON 45.0701 3 3 3 11 6 5
BA GEOGRAPHY/GENERAL 45.0701 6 5 9 6 7 7
BA GEOGRAPHY/GLOBALIZA 45.0701 1 1 3 1 1
BA GEOGRAPHY/PLANNING 45.0701 2 1
BA GER STUD/COMM&CULTR 05.0125 2 1 2 4 2
BA HISTORY 54.0101 32 33 39 32 35 23
BA HISTORY/PARALEGAL ST 54.0101 2 2 3 2 3 1
BA PHILOSOPHY 38.0101 3 3 7 7 1
BA PHILOSOPHY/RELIG STD 38.0101 1
BA POL SCI/PARALEGAL ST 45.1001 1 2 1 2 7
BA POLITICAL SCIENCE 45.1001 15 22 26 15 20 20
BA SOC/DIVERSITY & INEQUALITY 45.1101 2 2 1
BA SOC/PARALEGAL ST 45.1101 1 1
BA SOC/SOCIAL ORDER & DEV BEHAV 45.1101 3 10 8

Deg
rees
Aw
ard
ed
52
Trends in Degrees Awarded by College and Major ‐ Undergraduate
Major CIP Code 2010‐ 2011
2011‐ 2012
2012‐ 2013
2013‐ 2014
2014‐ 2015
2015‐ 2016
CO
LLEGE O
F LIBER
AL A
RTS &
SCIEN
CES
BA SOCIOLOGY 45.1101 39 33 47 28 25 28
BA SOCIOLOGY/FAMILY 45.1101 2 1 6
BA SPANISH 16.0905 7 7 9 6 12 10
BS BIO/MOLEC/MICRO/CELL 26.0101 13 19 19 9 15 20
BS BIO/ORGANISMAL/ECOLO 26.0101 10 11 7 10 9 10
BS BIO/PRE‐MED & HEALTH 26.0101 1 3 9 19 18 18
BS BIO/PRE‐PROFESSIONAL 26.0101 21 10 4 1 1
BS BIOCHEMISTRY 26.0202 5 8 6 11 9 9
BS CHEMISTRY 40.0501 3 11 9 10 13 11
BS CIS/SOFTWARE DEVEL 11.0103 1
BS CRIMINAL JUSTICE 43.0104 104 98 111 122 119 116
BS CRJ/PARALEGAL STUD 43.0104 6 9 8 7 8 12
BS CSC (COMBINED MS) 11.0101 1 3 1 1 3 5
BS CSC/INFO TECHNOLOGY 11.0101 14 13 24 13 23 14
BS CSC/IT (COMBINED MS) 11.0101 1 1 1 2 2 2
BS CSC/SOFTWARE DEVEL 11.0101 10 10 11 10 13 18
BS ELEC MEDIA/BUSINESS 09.0702 5 7 5 2
BS ELEC MEDIA/CSC 09.0702 1 3 3
BS ELEC MEDIA/JOURN‐PR 09.0702 17 5 17 13 2
BS ELEC MEDIA/METEOROL 09.0702 1 2 1 1 1
BS ELEC MEDIA/MULTI‐DIS 09.0702 7 13 22 17 2
BS ELEC MEDIA/MUSIC 09.0702 1 2
BS ELEC MEDIA/PSYCH 09.0702 3 5 1
BS ELEC MEDIA/PUB ADMIN 09.0702 1 2 1 1
BS ELEC MEDIA/SOCIOLOGY 09.0702 1 1 1
BS ELEC MEDIA/SPE & THE 09.0702 5 5 7 2
BS ELECTRONIC MEDIA 09.0702 1 1
BS ENV SCI/BIOLOGY 03.0104 6 17 16 11 17 6
BS ENV SCI/CHEMISTRY 03.0104 1 1 3 1 1
BS ENV SCI/GEOGRAPHY 03.0104 1 1 2 1
BS ENV SCI/GEOLOGY 03.0104 2 3 3 4 2 2
BS GEN ST/PROFESSIONAL 24.0101 12 5 2 3 2 9
BS GENERAL STUDIES 24.0101 14 5 4 3 12 2
BS GEOLOGY 40.0601 9 12 13 12 16 12
BS MAR SCIENCE/BIOLOGY 40.0607 5 9 5 7 6 4
BS MAR SCIENCE/GEOLOGY 40.0607 1 1
BS MAR SCIENCE/OCEANOGRAPHY 40.0607 2 1 1
BS MAR SCIENCE/PHYSICS 40.0607 1
BS MATHEMATICS 27.0101 14 19 12 17 15 13
BS MEDICAL TECH 51.1005 2 3 1 1 1
BS PHYSICS 40.0801 14 14 14 12 6 3
BS PHYSICS ASTRONOMY 40.0801 1 1 5
BS PHYSICS ENGINEERING PHYSICS 40.0801 5 4 7
BS PSYCH/CLIN‐COUNSELNG 42.0101 69 79 70 60 74 71
BS PSYCH/INDUSTRL‐ORGNZ 42.0101 11 11 11 10 21 15
BS PSYCHOLOGY/GENERAL 42.0101 81 77 77 96 106 98
BS PSYCH/PARALEGAL ST 42.0101 2 5 1 3 4 1

Degrees A
ward
ed
53
Trends in Degrees Awarded by College and Major ‐ Undergraduate
Major CIP Code 2010‐ 2011
2011‐ 2012
2012‐ 2013
2013‐ 2014
2014‐ 2015
2015‐ 2016
CLG
LIB A
RTS &
SCI
BS PUB ADM/PARALEGAL ST 44.0401 2 3 3 1 2
BS PUBLIC ADMIN 44.0401 7 9 8 8 8 3
BSN NURSING 51.3801 35 39 51
BSW SOCIAL WORK 44.0701 33 39 43 60 100 97
ESC SCHOOL NURSE 51.3899 2
College of Liberal Arts & Sciences Total 752 798 858 797 861 792
CO
LLEGE O
F VISU
AL &
PER
FOR
MIN
G A
RTS
BA COMMUNICATION STUDIES 23.0101 37 75 107 105
BA MUSIC 50.0901 7 4 2 2 5
BA MUSIC/BUSINESS 50.0901 1
BA MUSIC/CORE 50.0901 1
BA MUSIC/GENERALSTUDIES 50.0901 1 4 3 7 7 7
BA SPEECH COMMUNICATION 23.1304 55 37
BA THEATRE 50.0501 11 9 4 6 2
BA THEATRE/ACTING 50.0501 1 2
BA THEATRE/COMBINATION 50.0501 1
BA THEATRE/DESIGN 50.0501 1
BA THEATRE/DIRECTING 50.0501 1 1
BA THEATRE/MUSICAL 50.0501 1
BA THEATRE/PLAYWRITING 50.0501 1
BA THEATRE/PRODUCTION 50.0501 1
BFA COMM DESIGN 50.0402 58 62 70 66 62 69
BFA COMM DESIGN/ILLUSTR 50.0402 4 9 1 1
BFA CRAFTS 50.0201 5 7 11 8 12 10
BFA STUDIO ART/DGTLMEDIA 50.0702 3 4 8 6 11 6
BFA STUDIO ART/DRAWING 50.0702 6 8 5 5 4 3
BFA STUDIO ART/PAINTING 50.0702 12 13 13 23 15 18
BFA STUDIO ART/PHOTOGRAP 50.0702 16 12 15 12 21 16
BFA STUDIO ART/PRINTMAK 50.0702 5 6 7 5 2 8
BFA STUDIO ART/SCULPTURE 50.0702 3 3 5 5 4 2
BS ART ED 13.1302 46 58 42 31 36 20
BS ART ED ALT SETTINGS TRACK 13.1302 2
BS ELEC MEDIA/BUSINESS 09.0702 1 2
BS ELEC MEDIA/JOURN‐PR 09.0702 3 1
BS ELEC MEDIA/METEOROL 09.0702 1
BS ELEC MEDIA/MULTI‐DIS 09.0702 9 1
BS ELEC MEDIA/PSYCH 09.0702 1
BS ELEC MEDIA/SPE & THE 09.0702 2
BS ELECTRONIC MEDIA 09.0702 30 43
BS MUSIC EDUCATION 13.1312 12 7 7 13 5 12
College of Visual & Performing Arts Total 246 247 231 266 337 332
UNDERGRADUATE TOTALS 1791 1883 1881 1800 1952 1909

Deg
rees
Aw
ard
ed
54
Trends in Degrees Awarded by College and Major ‐ Graduate
Major CIP Code 2010‐ 2011
2011‐ 2012
2012‐ 2013
2013‐ 2014
2014‐ 2015
2015‐ 2016
BUS MBA BUSINESS ADMIN 52.0201 36 34 21 20 15 16
EDU
CA
TION
MA CLINICAL MENTAL HEALTH CSLG 42.2803 26
MA COUNSELING PSYCH 42.2803 1
MA CSLG (CHILD/ADOLESC) 42.2803 7
MA CSLG (MENTAL HEALTH) 42.2803 1 12 7 14 20 1
MA CSLG PSYCH (AGENCY) 42.2803 7 1
MA CSLG PSYCH(MARR&FAM) 42.2803 5 1 1
MA MAR, CPL, & FAM CSLG 42.2803 4 3 4 5 10
MED CERTIFICATION PRE K‐4 13.1202 5 16 9
MED ELEM SCH CSLG/CERT 13.1101 4 2 1 1
MED ELEM SCH CSLG/LICENS 13.1101 3 5 7 2
MED ELEMENTARY EDUCATION 13.1202 4 9 5 9 2 2
MED INSTRUCTIONAL TECH 13.0501 1
MED IT/DIGITL CLASS TECH 13.0501 7 8 8 6 8 9
MED READING SPECIALIST 13.1315 31 45 41 19 24 25
MED SEC SCH CSLG/CERT 13.1101 8 12 10 4
MED SEC SCH CSLG/LICENSE 13.1101 8 13 9 1
MED SECONDARY EDUCATION TEACH 13.1205 1 14 9 12
MED SEU/BIOLOGY 13.1205 1 1 1 2
MED SEU/CURR & INSTR 13.1205 31 12 20 21 15 19
MED SEU/ENGLISH 13.1205 5 4 3 3 2
MED SEU/MATHEMATICS 13.1205 2 4 3 2 2 2
MED SEU/MIDDLE LEVEL 13.1205 1 1
MED SEU/SOCIAL STUDIES 13.1205 2 4 3 5
MED STU AFF/ADMIN 13.1102 7 12 7 10 11 12
MED STU AFF/CSLG/LICENSE 13.1102 3 2 3 2
MLS LIBRARY SCIENCE 25.0101 17 16 9 3 5 4
MS SCHOOL COUNSELING CERT 13.1101 4 7 9
MS SCHOOL COUNSELING LICENSURE 13.1101 11 13 18
LIBER
AL A
RTS &
SCIEN
CES
MA ENGLISH 23.0101 7 9 5 6 10 5
MPA PUBLIC ADMIN 44.0401 4 18 5 15 14 12
MS COMPUTER & INFO SCI 11.0103 1
MS COMPUTER SCIENCE 11.0701 5 4 4 2 3 6
MS COMPUTER SCIENCE PSM TRACK 11.0701 1 4 1
MS CSC (COMBINED BS) 11.0701 3 2 1 1
MS CSC/INFO TECHNOLOGY 11.0701 2 1
MS CSC/IT (COMBINED BS) 11.0701 1 1 1
MS ELECTRONIC MEDIA 09.0702 7 3 9 4 2 1
MSN NURSING 51.3899 2 7 10
MSW SOCIAL WORK 44.0701 21 33 22 29 32 34
MED ART EDUCATION 13.1302 11 15 12 14 26 14
MFA COMMUNICATION DESIGN 50.0402 2
GRADUATE TOTALS 239 292 231 241 253 255
UNIVERSITY TOTALS 2030 2175 2112 2041 2205 2164
VP
A

Degrees A
ward
ed
55
Degrees Awarded by Ethnicity – Females
2010‐2011 2011‐2012 2012‐2013 2013‐2014 2014‐2015 2015‐2016
UN
DER
GR
AD
UA
TE
African‐American 56 38 48 43 64 70
Asian 11 15 15 19 10 19
Hispanic 46 59 63 40 84 65
Na ve American 2 4 3 3 3
White 964 988 965 902 982 912
Mul ‐racial 5 4 11 16 14 28
Unknown 10 20 14 20 21 30
Total 1094 1128 1119 1043 1178 1125
GR
AD
UA
TE
African‐American 4 9 9 4 4 12
Asian 5 5 2 4
Hispanic 3 4 6 7 13 9
Na ve American 1 2
White 150 180 149 146 157 163
Mul ‐racial 3 1 1 1
Unknown 6 8 7 8 13 12
Total 169 209 171 168 190 201
CO
MB
INED
African‐American 60 47 57 47 68 82
Asian 16 20 15 19 12 23
Hispanic 49 63 69 47 97 74
Na ve American 3 4 3 5 3
White 1114 1168 1114 1048 1139 1075
Mul ‐racial 5 7 11 17 15 29
Unknown 16 28 21 28 34 42
Total 1263 1337 1290 1211 1368 1326
Hawaiian/Pacific Islander 1
Hawaiian/Pacific Islander
Hawaiian/Pacific Islander 1

Deg
rees
Aw
ard
ed
56
Degrees Awarded by Ethnicity – Males
2010‐2011 2011‐2012 2012‐2013 2013‐2014 2014‐2015 2015‐2016
UN
DER
GR
AD
UA
TE
African‐American 38 32 35 32 42 53
Asian 5 10 9 9 12 11
Hispanic 32 45 30 35 55 53
Na ve American 2 4 1 3 2 1
White 606 643 658 638 627 616
Mul ‐racial 4 3 9 13 16
Unknown 10 21 26 31 22 32
Total 697 755 762 757 774 784
GR
AD
UA
TE
African‐American 1 7 2 2 3 1
Asian 2 6 2 2 1
Hispanic 2 1 7 2 5
Na ve American
White 58 68 48 66 51 50
Mul ‐racial 1 2
Unknown 6 1 1 1 4
Total 70 83 60 73 63 54
CO
MB
INED
African‐American 39 39 37 34 45 54
Asian 7 16 11 11 13 12
Hispanic 34 46 37 37 60 53
Na ve American 2 4 1 3 2 1
White 664 711 706 704 678 667
Mul ‐racial 5 0 3 9 13 17
Unknown 16 22 27 32 26 32
Total 767 838 822 830 837 838
Hawaiian/Pacific Islander 1 2
Hawaiian/Pacific Islander
Hawaiian/Pacific Islander 2

Degrees A
ward
ed
57
Degrees Awarded by Ethnicity – All Students
2010‐2011 2011‐2012 2012‐2013 2013‐2014 2014‐2015 2015‐2016
UN
DER
GR
AD
UA
TE
African‐American 94 70 83 75 106 123
Asian 16 25 24 28 23 30
Hispanic 78 104 93 75 139 118
Na ve American 4 8 4 6 5 1
White 1570 1631 1623 1540 1609 1529
Mul ‐racial 9 4 14 25 27 43
Unknown 20 41 40 51 43 62
Total 1791 1883 1881 1800 1952 1909
GR
AD
UA
TE
African‐American 5 16 11 6 7 13
Asian 7 11 2 2 2 5
Hispanic 5 5 13 9 18 9
Na ve American 1 0 0 2
White 208 248 197 212 208 213
Mul ‐racial 1 3 0 1 1 3
Unknown 12 9 8 9 17 12
Total 239 292 231 241 253 255
CO
MB
INED
African‐American 99 86 94 81 113 136
Asian 23 36 26 30 25 35
Hispanic 83 109 106 84 157 127
Na ve American 5 8 4 8 5 1
White 1778 1879 1820 1752 1817 1742
Mul ‐racial 10 7 14 26 28 46
Unknown 32 50 48 60 60 74
Total 2030 2175 2112 2041 2205 2164
Hawaiian/Pacific Islander 3
Hawaiian/Pacific Islander
Hawaiian/Pacific Islander 3

Staff
Sta
scs
58
Fall 2016 Ac ve Staff – FTE Reported by EEO Code within Division/Department
Division / Department
Execu
ve /
Ad
min
(H1
0)
Faculty (H
20
)
Pro
f / No
n‐facu
lty (H
30
)
Sec / C
lerical
(H4
0)
Tech
/ Para (H
50
)
Skilled
Cra
s (H
60
)
Service
/ Main
t (H
70
)
Totals
President
Ins tu onal Research 1.00 1.00 2.00
President's Office 1.00 2.00 1.00 4.00
President Total 2.00 0.00 3.00 1.00 0.00 0.00 0.00 6.00
Academic & Student Affairs
Administra ve Offices
Academic & Student Affairs 3.00 3.00 2.00 8.00
Academic Enrichment 2.00 1.00 1.00 4.00
Assessment Office 1.00 1.00 2.00
Assoc Dean for Inclusion & Outreach 1.00 1.00
Assoc Dean of Students 1.00 1.00 2.00
Asst Provost—Fac & Acad Admin 1.00 1.00
Career Development Center 2.00 1.00 3.00
College Readiness Programs 4.00 1.00 5.00
Counseling & Psychological Svcs 7.00 1.00 8.00
Ctr for Academic Success & Achievement 4.00 4.00
Distance Educa on 3.00 3.00
Grants & Special Projects 2.00 1.00 3.00
Health & Wellness Center 10.20 3.50 1.00 14.70
Informa on Technology 4.00 24.00 1.00 2.00 31.00
Mul cultural Center 1.00 1.00 2.00
Registrar's Office 1.00 5.00 8.00 14.00
Reten on & Student Success 1.00 1.00 2.00
Rohrbach Library 1.00 10.00 2.00 6.00 19.00
Student Involvement Svcs 3.00 1.00 4.00
Student Support Services Prgm 1.00 1.00 2.00
Women's Center 1.00 1.00 2.00
Administra ve Offices Total 11.00 20.00 67.20 27.50 9.00 0.00 0.00 134.70
College of Educa on
College of Educa on 1.00 2.00 3.00
Counselor Educa on 9.00 1.00 10.00
Elementary Educa on 19.00 1.00 20.00
Field Experience & Outreach 1.00 1.00 2.00
Library & Learning Technology 4.85 .50 5.35
Secondary Educa on 5.95 1.00 6.95
Special Educa on 11.00 1.00 12.00
Student Affairs in Higher Ed 1.00 1.00
College of Educa on Total 1.00 50.80 1.00 7.50 0.00 0.00 0.00 60.30

Staff Sta
scs
59
Fall 2016 Ac ve Staff – FTE Reported by EEO Code within Division/Department
Division / Department
Execu
ve /
Ad
min
(H1
0)
Faculty (H
20
)
Pro
f / No
n‐facu
lty (H
30
)
Sec / C
lerical
(H4
0)
Tech
/ Para (H
50
)
Skilled
Cra
s (H
60
)
Service
/ Main
t (H
70
)
Totals
Academic & Student Affairs
College of Business
Business Administra on 37.00 2.00 39.00
College of Business 1.00 2.00 3.00
SBDC 1.00 6.40 1.00 8.40
Sport Mgmt & Leadership Studies 14.75 1.00 15.75
College of Business Total 2.00 51.75 6.40 6.00 0.00 0.00 0.00 66.15
College of Liberal Arts & Sciences
Anthropology/Sociology 12.00 1.00 13.00
Biological Sciences 20.00 1.00 21.00
Biology/Physical Sciences Storeroom 1.00 1.00
College of Liberal Arts & Sciences 1.00 2.00 1.00 4.00
Computer Science & Informa on Tech 13.00 1.00 14.00
Criminal Jus ce 12.00 1.00 13.00
English 38.00 1.00 39.00
Geography 7.33 1.00 8.33
History 13.00 1.00 14.00
Mathema cs 22.00 1.00 23.00
Modern Languages 14.75 1.00 15.75
Philosophy 6.00 0.50 6.50
Physical Sciences 25.00 1.00 26.00
Poli cal Science & Public Administra on 7.00 1.00 8.00
Psychology 18.00 1.00 19.00
Social Work 18.50 2.00 20.50
College of Liberal Arts & Sciences Total 1.00 226.58 2.00 15.50 1.00 0.00 0.00 246.08
College of Visual & Performing Arts
Art & Art History 18.00 1.00 19.00
Art Educa on & Cra s 16.00 1.00 17.00
College of Visual & Performing Arts 2.00 1.00 1.64 1.00 1.00 6.64
Communica on Design 13.17 1.00 14.17
Communica on Studies 22.75 1.00 23.75
Electronic Media 6.00 1.00 7.00
Music 19.32 1.00 20.32
College of Visual & Performing Arts Total 2.00 95.24 1.00 7.64 1.00 1.00 0.00 107.88
Academic & Student Affairs Total 17.00 444.37 77.60 64.14 11.00 1.00 0.00 615.11
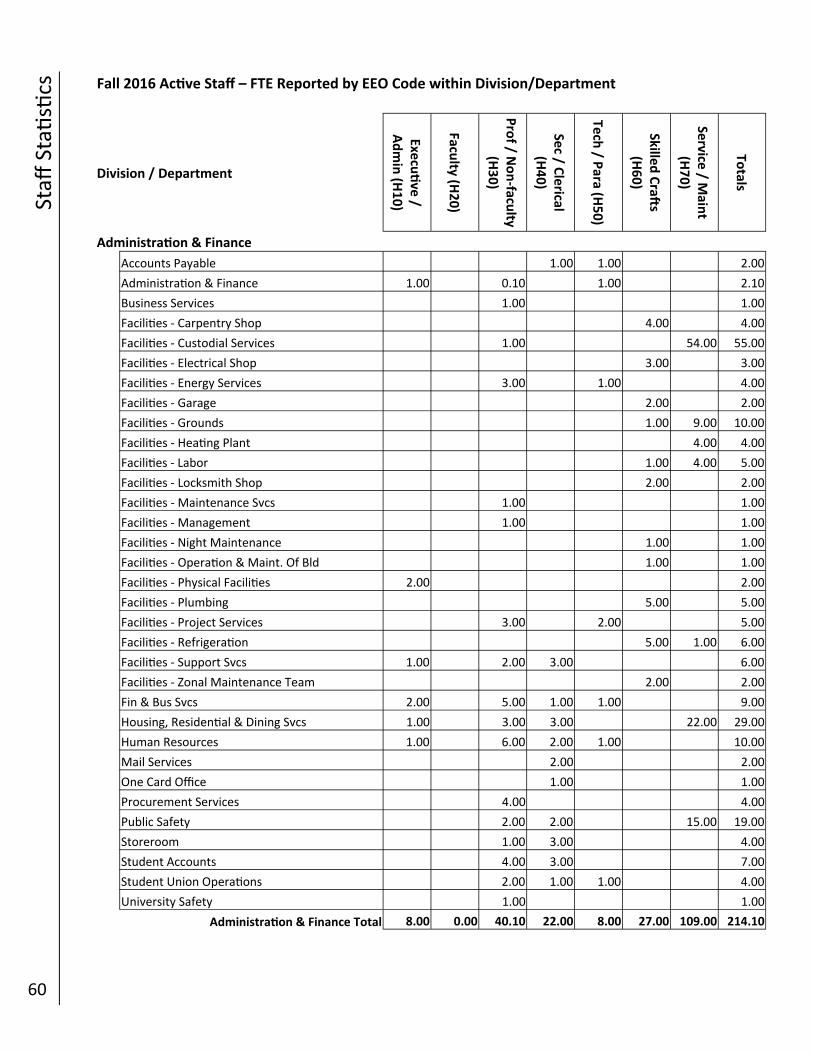
Staff
Sta
scs
60
Fall 2016 Ac ve Staff – FTE Reported by EEO Code within Division/Department
Division / Department
Execu
ve /
Ad
min
(H1
0)
Faculty (H
20
)
Pro
f / No
n‐facu
lty (H
30
)
Sec / C
lerical
(H4
0)
Tech
/ Para (H
50
)
Skilled
Cra
s (H
60
)
Service
/ Main
t (H
70
)
Totals
Administra on & Finance
Accounts Payable 1.00 1.00 2.00
Administra on & Finance 1.00 0.10 1.00 2.10
Business Services 1.00 1.00
Facili es ‐ Carpentry Shop 4.00 4.00
Facili es ‐ Custodial Services 1.00 54.00 55.00
Facili es ‐ Electrical Shop 3.00 3.00
Facili es ‐ Energy Services 3.00 1.00 4.00
Facili es ‐ Garage 2.00 2.00
Facili es ‐ Grounds 1.00 9.00 10.00
Facili es ‐ Hea ng Plant 4.00 4.00
Facili es ‐ Labor 1.00 4.00 5.00
Facili es ‐ Locksmith Shop 2.00 2.00
Facili es ‐ Maintenance Svcs 1.00 1.00
Facili es ‐ Management 1.00 1.00
Facili es ‐ Night Maintenance 1.00 1.00
Facili es ‐ Opera on & Maint. Of Bld 1.00 1.00
Facili es ‐ Physical Facili es 2.00 2.00
Facili es ‐ Plumbing 5.00 5.00
Facili es ‐ Project Services 3.00 2.00 5.00
Facili es ‐ Refrigera on 5.00 1.00 6.00
Facili es ‐ Support Svcs 1.00 2.00 3.00 6.00
Facili es ‐ Zonal Maintenance Team 2.00 2.00
Fin & Bus Svcs 2.00 5.00 1.00 1.00 9.00
Housing, Residen al & Dining Svcs 1.00 3.00 3.00 22.00 29.00
Human Resources 1.00 6.00 2.00 1.00 10.00
Mail Services 2.00 2.00
One Card Office 1.00 1.00
Procurement Services 4.00 4.00
Public Safety 2.00 2.00 15.00 19.00
Storeroom 1.00 3.00 4.00
Student Accounts 4.00 3.00 7.00
Student Union Opera ons 2.00 1.00 1.00 4.00
University Safety 1.00 1.00
Administra on & Finance Total 8.00 0.00 40.10 22.00 8.00 27.00 109.00 214.10

Staff Sta
scs
61
Fall 2016 Ac ve Staff – FTE Reported by EEO Code within Division/Department
Division / Department
Execu
ve /
Ad
min
(H1
0)
Faculty (H
20
)
Pro
f / No
n‐facu
lty (H
30
)
Sec / C
lerical
(H4
0)
Tech
/ Para (H
50
)
Skilled
Cra
s (H
60
)
Service
/ Main
t (H7
0)
Totals
Communica ons, Marke ng & External Affairs
Communica ons, Marke ng & Ext Affairs 1.00 2.13 3.13
Conference Services 1.00 2.00 3.00
Intercollegiate Athle c Svcs 2.00 29.81 2.00 33.81
KU Presents! 2.00 1.00 0.40 3.40
Marke ng 2.00 2.00
PA German Cultural Heritage Ctr 1.00 1.00
Sports Medicine 4.00 4.00
University Rela ons 1.00 6.48 7.48
Commuunica ons, Marke ng & Ext Affrs Total 2.00 6.00 41.29 7.13 1.40 0.00 0.00 57.82
Enrollment Management & Student Affairs
Admissions 1.00 13.00 9.00 23.00
Assoc Vice President & Dean of Students 1.00 2.00 1.00 4.00
Enrollment Mgmt & Student Affairs 1.00 1.00 2.00
Financial Aid Services 1.00 7.00 5.00 13.00
Recrea onal Services 2.00 1.00 3.00
Residence Life 6.00 1.00 7.00
Enrollment Mgmt & Student Affairs Total 4.00 0.00 30.00 17.00 1.00 0.00 0.00 52.00
Equity & Compliance
Disability Services 2.00 1.00 3.00
Equity & Compliance 1.00 1.00 1.00 3.00
Equity & Compliance Total 1.00 0.00 3.00 2.00 0.00 0.00 0.00 6.00
Total FTE 34.00 450.37 194.99 113.27 21.40 28.00 109.00 951.03

Staff
Sta
scs
62
Fall 2016 Ac ve Staff – Reported by Ethnicity within Division/Department
Division / Department
African
A
me
rican
Asian
/ Pacifi
c Islan
de
r
Hisp
anic
Na
ve
Am
erican
Wh
ite
Mu
l‐racial
Un
kno
wn
Total
F M F M F M F M F M F M F M F M Ttl
President
Ins tu onal Research 2 2 0 2
President's Office 1 2 1 3 1 4
President Total 1 0 0 0 0 0 0 0 4 1 0 0 0 0 5 1 6
Academic & Student Affairs
Administra ve Offices
Academic & Student Affairs 6 2 6 2 8
Academic Enrichment 1 1 2 1 3 4
Assessment Office 2 2 2
Assoc Dean for Inclusion & Outreach 1 0 1 1
Assoc Dean of Students 1 1 1 1 2
Asst Provost—Fac & Acad Admin 1 1 1
Career Development Center 3 3 0 3
College Readiness Programs 2 1 1 1 4 1 5
Counseling & Psychological Svcs 1 5 2 6 2 8
Ctr for Academic Success & Achievement 2 1 1 2 2 4
Distance Educa on 3 0 3 3
Grants & Special Projects 1 1 1 2 1 3
Health & Wellness Center 1 15 1 16 1 17
Informa on Technology 1 5 25 5 26 31
Mul cultural Center 1 1 2 0 2
Registrar's Office 1 1 10 2 12 2 14
Reten on & Student Success 2 2 0 2
Rohrbach Library 1 1 1 11 5 13 6 19
Student Involvement Svcs 4 4 0 4
Student Support Services Prgm 2 2 0 2
Women's Center 1 1 2 0 2
Administra ve Offices Total 8 1 0 0 6 3 0 0 71 48 0 0 0 0 85 52 137
College of Educa on
College of Educa on 2 1 2 1 3
Counselor Educa on 5 4 1 6 4 10
Elementary Educa on 1 18 1 19 1 20
Field Experience & Outreach 2 2 0 2
Library Science & Learning Technology 5 1 5 1 6
Secondary Educa on 4 4 4 4 8
Special Educa on 1 1 8 2 10 2 12
College of Educa on Total 3 0 0 0 1 0 0 0 44 13 0 0 1 0 49 13 62
Student Affairs in Higher Educa on 1 1 0 1

Staff Sta
scs
63
Fall 2016 Ac ve Staff – Reported by Ethnicity within Division/Department
Division / Department
African
A
me
rican
Asian
/ Pacifi
c Islan
de
r
Hisp
anic
Na
ve
Am
erican
Wh
ite
Mu
l‐racial
Un
kno
wn
Total
F M F M F M F M F M F M F M F M Ttl
Academic & Student Affairs
College of Business
Business Administra on 1 7 4 2 10 20 1 17 28 45
College of Business 3 3 0 3
SBDC 1 3 5 4 5 9
Sport Management & Leadership Stds 1 1 1 8 5 10 6 16
College of Business Total 2 1 8 5 0 2 0 0 24 30 0 0 0 1 34 39 73
College of Liberal Arts & Sciences
Anthropology/Sociology 1 1 5 6 6 7 13
Biological Sciences 1 1 9 10 10 11 21
Biology/Physical Sciences Storeroom 1 1 0 1
College of Liberal Arts & Sciences 3 1 3 1 4
Computer Science 5 3 6 3 11 14
Criminal Jus ce 1 2 1 1 3 5 5 8 13
English 1 18 18 1 1 20 19 39
Geography 1 2 6 2 7 9
History 1 5 8 5 9 14
Mathema cs 1 1 2 4 1 5 9 9 14 23
Modern Languages 1 3 3 8 2 12 5 17
Philosophy 1 1 5 1 6 7
Physical Sciences 2 1 9 14 10 16 26
Poli cal Science & Public Administra on 1 1 1 3 2 4 4 8
Psychology 3 6 10 6 13 19
Social Work 1 4 1 8 7 13 8 21
College of Liberal Arts & Sciences Total 3 7 11 15 5 7 1 0 89 109 1 1 0 0 110 139 249
College of Visual & Performing Arts
Art & Art History 1 1 9 8 10 9 19
Art Educa on & Cra s 2 11 4 13 4 17
College of Visual & Performing Arts 1 3 3 4 3 7
Communica on Design 1 9 4 1 11 4 15
Communica on Studies 1 1 16 6 17 7 24
Electronic Media 1 3 3 3 4 7
Music 1 1 1 9 15 2 10 19 29
College of Visual & Performing Arts Total 1 1 3 1 3 2 0 1 60 43 0 0 1 2 68 50 118
Academic & Student Affairs Total 17 10 22 21 15 14 1 1 288 243 1 1 2 3 369 293 639

Staff
Sta
scs
64
Fall 2016 Ac ve Staff – Reported by Ethnicity within Division/Department
Division / Department
African
A
me
rican
Asian
/ Pacifi
c Islan
de
r
Hisp
anic
Na
ve
Am
erican
Wh
ite
Mu
l‐racial
Un
kno
wn
Total
F M F M F M F M F M F M F M F M Ttl
Administra on & Finance
Accounts Payable 1 1 2 0 2
Administra on & Finance 1 1 1 2 1 3
Business Services 1 1 0 1
Facili es ‐ Carpentry Shop 4 0 4 4
Facili es ‐ Custodial Services 1 2 2 1 3 26 19 1 31 24 55
Facili es ‐ Electrical Shop 3 0 3 3
Facili es ‐ Energy Services 4 0 4 4
Facili es ‐ Garage 2 0 2 2
Facili es ‐ Grounds 9 1 0 10 10
Facili es ‐ Hea ng Plant 4 0 4 4
Facili es ‐ Labor 1 4 0 5 5
Facili es ‐ Locksmith Shop 2 0 2 2
Facili es ‐ Maintenance Svcs 1 0 1 1
Facili es ‐ Management 1 0 1 1
Facili es ‐ Night Maintenance 1 0 1 1
Facili es ‐ Opera on & Maint. Of Bld 1 0 1 1
Facili es ‐ Physical Facili es 1 1 1 1 2
Facili es ‐ Plumbing 2 3 0 5 5
Facili es ‐ Project Services 1 4 1 4 5
Facili es ‐ Refrigera on 6 0 6 6
Facili es ‐ Support Svcs 1 5 6 0 6
Facili es ‐ Zonal Maintenance Team 2 0 2 2
Fin & Bus Svcs 1 4 4 5 4 9
Housing, Residen al & Dining Svcs 1 1 1 16 10 17 12 29
Human Resources 1 1 1 6 1 9 1 10
Mail Services 2 2 0 2
One Card Office 1 1 0 1
Procurement 1 3 4 0 4
Public Safety 1 5 12 1 6 13 19
Storeroom 1 3 0 4 4
Student Accounts 1 1 5 6 1 7
Student Union Opera ons 3 1 3 1 4
University Safety 1 0 1 1
Administra on & Finance Total 4 3 4 1 8 8 0 1 80 103 1 0 0 2 97 118 215

Staff Sta
scs
65
Fall 2016 Ac ve Staff – Reported by Ethnicity within Division/Department
Division / Department
African
Am
erican
Asian
/ Pacifi
c Islan
de
r
Hisp
anic
Na
ve
Am
erican
Wh
ite
Mu
l‐racial
Un
kno
wn
Total
F M F M F M F M F M F M F M F M Ttl
Communica ons, Marke ng & External Affairs
Comm, Marke ng & Ext Affairs 3 1 3 1 4
Conference Services 2 1 2 1 3
Intercollegiate Athle c Svcs 1 3 15 27 1 16 31 47
KU Presents! 3 1 3 1 4
Marke ng 2 2 0 2
PA German Cultural Heritage Ctr 1 0 1 1
Sports Medicine 1 3 1 3 4
University Rela ons 1 7 1 7 8
Comm, Marke ng & Ext Affairs Total 1 3 0 0 0 0 0 0 27 41 0 1 0 0 28 45 73
Enrollment Management & Student Affairs
Admissions 2 1 2 14 4 17 6 23
Assoc Vice President & Dean of Students 2 2 2 2 4
Enrollment Mgmt & Student Affairs 1 1 1 1 2
Financial Aid Services 1 1 8 2 1 10 3 13
Recrea onal Services 2 1 2 1 3
Residence Life 6 1 7 0 7
1 4 1 0 2 0 0 0 33 9 2 0 0 0 39 13 52
Equity & Compliance
Disability Services 3 3 0 3
Equity & Compliance 1 2 2 1 3
Equity & Compliance Total 0 0 0 0 0 1 0 0 5 0 0 0 0 0 5 1 6
University Totals 24 20 27 22 25 23 1 2 437 397 4 2 2 5 520 471 991
Enrollment Mgmt & Student Affairs Total

Staff
Sta
scs
66
Fall 2016 Kutztown University Personnel by EEO6 Category and Ethnicity
Category
African
‐A
me
rican
Asian
/Pacifi
c Islan
de
r
Hisp
anic
Na
ve
Am
erican
Wh
ite
Mu
l‐racial
Un
kno
wn
Total
FEMA
LE
Exec/Admin/Managerial (H10) 12 12
Faculty (H20) 7 22 9 1 184 1 2 226
Professional Non‐faculty (H30) 11 2 8 88 1 110
Secretarial/Clerical (H40) 4 5 101 1 111
Tech/Paraprofessional (H50) 1 1 2 11 15
Skilled Cra s (H60) 0
Service/Maintenance (H70) 1 2 1 41 1 46
Total 24 27 25 1 437 4 2 520
MA
LE
Exec/Admin/Managerial (H10) 2 1 19 22
Faculty (H20) 9 21 12 1 197 1 3 244
Professional Non‐faculty (H30) 6 2 93 1 102
Secretarial/Clerical (H40) 1 1 3 5
Tech/Paraprofessional (H50) 1 6 7
Skilled Cra s (H60) 3 25 28
Service/Maintenance (H70) 3 4 54 2 63
Total 20 22 23 2 397 2 5 471
CO
MB
INED
Exec/Admin/Managerial (H10) 2 0 1 0 31 0 0 34
Faculty (H20) 16 43 21 2 381 2 5 470
Professional Non‐faculty (H30) 17 2 10 0 181 2 0 212
Secretarial/Clerical (H40) 4 1 5 1 104 1 0 116
Tech/Paraprofessional (H50) 1 1 3 0 17 0 0 22
Skilled Cra s (H60) 0 0 3 0 25 0 0 28
Service/Maintenance (H70) 4 2 5 0 95 1 2 109
Total 44 49 48 3 834 6 7 991

Staff Sta
scs
67
Fall 2016 Kutztown University Personnel by EEO6 Category and Highest Degree
Category Doctorate Masters Bachelors RN Associates Non‐degree Total
FEMA
LE
Exec/Admin/Managerial (H10) 5 5 2 12
Faculty (H20) 157 67 2 226
Professional Non‐faculty (H30) 4 37 53 3 3 10 110
Secretarial/Clerical (H40) 1 20 17 73 111
Tech/Paraprofessional (H50) 5 2 8 15
Skilled Cra s (H60) 0
Service/Maintenance (H70) 4 1 41 46
Total 166 110 86 3 23 132 520
MA
LE
Exec/Admin/Managerial (H10) 7 9 6 22
Faculty (H20) 174 68 2 244
Professional Non‐faculty (H30) 1 28 52 1 20 102
Secretarial/Clerical (H40) 1 1 3 5
Tech/Paraprofessional (H50) 1 4 2 7
Skilled Cra s (H60) 28 28
Service/Maintenance (H70) 4 3 56 63
Total 182 107 69 0 4 109 471
CO
MB
INED
Exec/Admin/Managerial (H10) 12 14 8 0 0 0 34
Faculty (H20) 331 135 4 0 0 0 470
Professional Non‐faculty (H30) 5 65 105 3 4 30 212
Secretarial/Clerical (H40) 0 2 21 0 17 76 116
Tech/Paraprofessional (H50) 0 1 9 0 2 10 22
Skilled Cra s (H60) 0 0 0 0 0 28 28
Service/Maintenance (H70) 0 0 8 0 4 97 109
Total 348 217 155 3 27 241 991

Staff
Sta
scs
68
Fall 2016 Kutztown University Faculty by Rank and Tenure Track
Rank Tenured On‐tenure
Track Non‐tenure
Track Total
FEMA
LE
Professor 40 1 41
Associate Professor 67 4 1 72
Assistant Professor 26 38 19 83
Instructor 1 29 30
Total 133 44 49 226
MA
LE
Professor 66 66
Associate Professor 78 6 84
Assistant Professor 13 31 14 58
Instructor 1 35 36
Total 157 38 49 244
CO
MB
INED
Professor 106 1 0 107
Associate Professor 145 10 1 156
Assistant Professor 39 69 33 141
Instructor 0 2 64 66
Total 290 82 98 470
Fall 2016 Kutztown University Faculty by Highest Degree and Tenure Track
Highest Degree Tenured On‐tenure
Track Non‐tenure
Track Total
FEMA
LE
Doctorate 106 32 19 157
Masters 27 12 28 67
Bachelors 2 2
Total 133 44 49 226
MA
LE
Doctorate 125 29 20 174
Masters 32 9 27 68
Bachelors 2 2
Total 157 38 49 244
CO
MB
INED
Doctorate 231 61 39 331
Masters 59 21 55 135
Bachelors 0 0 4 4
Total 290 82 98 470

Staff Sta
scs
69
Fall 2016 Kutztown University Faculty by Tenure Track and Ethnicity
Tenure Track Status
African
‐A
me
rican
Asian
/ Pacifi
c Islan
de
r
Hisp
anic
Na
ve
Am
erican
Wh
ite
Mu
l‐racial
Un
kno
wn
Total
FEMA
LE
Tenured 4 9 3 116 1 133
On‐tenure Track 3 9 2 30 44
Non‐tenure Track 4 4 1 38 2 49
Total 7 22 9 1 184 1 2 226
MA
LE
Tenured 8 17 8 1 123 157
On‐tenure Track 1 3 2 31 1 38
Non‐tenure Track 1 2 43 1 2 49
Total 9 21 12 1 197 1 3 244
CO
MB
INED
Tenured 12 26 11 1 239 1 0 290
On‐tenure Track 4 12 4 0 61 0 1 82
Non‐tenure Track 0 5 6 1 81 1 4 98
Total 16 43 21 2 381 2 5 470

Fin
anci
al In
form
ao
n
70
Trends in Revenue and Expenditures
REVENUE 2010‐11 2011‐12 2012‐13 2013‐14 2014‐15 2015‐16
Tui on and fees 79,831,639 83,563,420 84,194,947 84,160,075 84,378,294 85,309,943
State appropria ons 37,977,801 35,529,651 35,744,865 34,606,218 34,003,064 36,248,956
Federal grants, contracts 17,332,673 13,206,792 13,422,038 13,495,600 14,120,563 13,656,327
State and local grants, contracts 8,028,645 9,679,677 8,975,968 9,774,166 9,579,945 9,518,552
Private gi s, grants, contracts 396,805 185,619 220,684 158,112 141,431 237,287
Endowment income 41,674 8,692 6,689 9,691 8,635 9,299
Ac vi es of educa onal depts. 4,115,850 3,289,596 2,551,398 2,785,600 2,235,310 2,134,957
Auxiliary enterprises 43,267,019 44,132,238 44,856,851 42,055,783 40,928,946 40,385,002
Other income 2,240,493 2,381,422 6,322,635 2,620,579 2,459,346 2,837,620
Total Revenue 193,232,599 191,977,107 196,296,075 189,665,824 187,855,534 190,337,943
EXPENDITURES & TRANSFERS
EDU
CA
TION
& G
ENER
AL
Instruc on 59,070,967 59,545,420 58,262,385 59,327,576 60,984,349 64,739,127
Research 515,233 488,467 444,425 385,286 401,537 422,453
Public service 2,594,842 2,759,637 2,634,830 3,015,283 2,990,891 3,014,145
Academic support 11,160,741 10,057,288 9,924,935 9,241,164 10,173,835 10,691,359
Student services 13,804,001 13,790,702 13,971,143 14,666,940 15,620,282 15,859,407
Gen’l ins tu onal support 18,852,766 19,120,616 20,256,795 21,004,571 20,015,301 23,780,155
Opera ons/maintenance 25,674,007 25,997,257 28,533,315 30,730,216 30,431,414 31,596,858
Student aid 21,600,904 22,674,546 22,517,395 23,503,189 24,423,226 24,567,459
Educa on & General Total 153,273,461 154,433,933 156,545,223 161,874,225 165,040,835 174,670,963
Auxiliary enterprises 31,307,339 29,801,944 29,730,962 30,497,045 29,552,544 27,673,158
Total Expenditures & Transfers 184,580,800 184,235,877 186,276,185 192,371,270 194,593,379 202,344,121
Educa on and General Personnel Compensa on and Benefits
94,093,261 92,002,550 93,175,598 96,089,004 98,486,714 100,993,943
Percentage of Educa on and General Personnel Compensa on and Benefits to Total Educa on and General Expenditures less Transfers
61.4% 59.6% 59.5% 59.4% 59.7% 57.8%
Financial Statements are presented in accordance with Government Accoun ng Standards Board (GASB)