table of contents - home | food and agriculture centre...
TRANSCRIPT

© Confederation of Indian Industry (CII), 2012
All rights reserved. No part of this document may be reproduced, stored, adapted, or transmitted, in any form or by any means, electronic, mechanical, photocopying, recording, or otherwise, or translated in any language or performed or communicated to the public in any manner whatsoever, or any cinematographic film or sound recording made therefrom without the prior written permission of the copyright holders.
The information presented in this publication has been compiled from various published and electronically available primary and secondary sources. CII makes every effort to ensure the accuracy of information presented in this document. However, neither CII nor any of its office bearers or analysts or employees can be held responsible for any financial consequences arising out of the use of information provided herein.
Published by Confederation of Indian Industry (CII)The Mantosh Sondhi Centre, 23, Institutional Area,Lodi Road, New Delhi – 110003 (India)

3 Feasibility Report for Setting-up Integrated Cold Chain for Banana in Tamil Nadu
Table of Contents
1. Introduction 5
2. Banana Production: Global, India, TN State 8
3. Banana Trade: Global, India, TN State 25
4. SWOT Analysis for TN Banana Business 42
5. Banana Cold Chain in Tamil Nadu: An Overview 46
5.1 Present Chain 46
5.2 Ideal Chain and Temperature Control Intervention 49
5.3 Gap Analysis for Banana Cold Chain Intervention 52
6. Project Report for Setting Up of an Integrated Cold Chain for 53 Banana in Tamil Nadu
7. Project Cost and Financial Analysis 66
8. Governement Interventions Required 74
9. Recommendations 76
Annexures1. Project Cost for One Module of 1,00,000 Mt/Annum 77
2. Means of Finance for One Module of 1,00,000 Mt/Annum 77
3. Projected Balance Sheet for the First Ten Years 78
4. Profit and Loss Projections for the First Ten Years of Operation 79
5. Projected Cash Flow Statement for the First Ten Years of Operation 81
6. Discounted Cash Flow for the First Ten Years of Operation and NPV 82
7. Break Even Analysis 82
8. Return on Investment Analysis 83

5 Feasibility Report for Setting-up Integrated Cold Chain for Banana in Tamil Nadu
1. Introduction
Banana is the common name for the fruit produced by herbaceous plants of genus: Musa. It was native to South East Asia, over a period these have been domesticated worldwide and today they are grown in 130 countries world wide, more than any other fruit crop. Bananas are the fourth most widely consumed food for humans after rice, wheat, and corn.
The global production of banana is around 93,716 thousand tons of which India contributed 28% in the year 2009. Besides India, other major banana producing countries are Philippines, China, Brazil, Ecuador, Indonesia, Tanzania, Mexico, Thailand and Costa Rica.
During last five years, production of banana in India and China has substantially increased where as the traditional major producing countries like Ecuador, Costa Rica, have shown stagnation and marginal decline in the production.
In India, South and West zones are major banana producing belts comprising of Tamil Nadu, Maharashtra, Karnataka and Gujarat. Tamil Nadu accounts for 25% of India’s Banana production. The productivity level of banana varies depending on varieties. In Tamil Nadu, areas around Theni, Tirichurapally, Coimabattore are the major producing districts contributing to most of the state’s production.
It was proposed to develop an Integrated Chain for Banana in Tamil Nadu in the Cold Chain Summit 2009, a CII cold chain initiative as part of “ Making Cold Chain Development a reality in India: Infrastructure for Value Creation in Horticulture” and accordingly engaged M/s Ahara Technology Group for carrying out a feasibility study.
1.1. Study Objective and Scope of Work The broad objective of the study is to ascertain techno – economic feasibility of setting up of an Integrated Cold Chain for Banana in the state of Tamil Nadu.
1.2. Scope of the Worka) To assess the quantities of Banana produced annually and to provide data (variety wise and area
wise) covering Tamil Nadu state

6 Confederation of Indian Industry
b) To study prevailing value chain for the banana in the state of Tamil Nadu
c) To study the existing marketing arrangements, processing facilities and their performance from post harvest stage to product stage and assess value addition at each stage
d) To assess deficiencies in backward integration, harvesting, post harvest handling and banana packing and processing infrastructure
e) To Bench mark, against relevant countries and states, in terms of productivity, wastage and price realization.
f) To suggest required measures to improve backward integration to ensure quality during harvesting and post harvest handling and required processing infrastructure for better value addition, marketability, reducing post harvest losses and meeting the export requirements by an appropriate Banana Processing Infrastructure including the following
Identifying key collection centers��
Mapping locations and suggesting where ripening and storage facilities can be set up��
Forward linkage to mandis, wholesalers and food processing units��
Cost of setting of chain��
Funding details through various Government schemes��
Economic feasibility��
1.3. Approach and MethodologyA multidisciplinary team of in house and external consultants of Ahara Technology Group have carried out the study. The requirements of the information were listed down and sources were identified. The information collected was counter verified with those of checklists developed for this purpose.
The list of organizations contacted is:
Department of Horticulture, Govt. of Tamil Nadu.��
District offices of Department of Horticulture in Madurai, Tiruchy.��
National Research centre for Banana��
National Horticulture Board��
APEDA��
MFPI��
Tissue culture labs supplying banana platelets.��
Farmers growing banana plantlets.��
Banana farmers association in Theni.��

7 Feasibility Report for Setting-up Integrated Cold Chain for Banana in Tamil Nadu
Traders of Banana.��
Exporters of banana.��
Owners of Pack houses.��
Suppliers of equipment.��
A few focused group discussions were also held with the farmers growing banana.
The information thus collected was analyzed and forms the basis of recommendations in this report. For fixed cost estimates, quotation were invited from the leading suppliers of Pack house and refrigeration equipment suppliers and for operating expenses, the information from the pack houses currently operational was obtained.
The list of organizations outside country could not be contacted due to time and budgetary constraints.
1.4. Structure of the Study and ReportThe techno economic feasibility report deals with different aspects related to Banana and establishment of Integrated Chain in the state of Tamil Nadu.
The report comprises of 9 chapters, which deal with different aspects of report.
Chapter 1: is the introduction,
Chapter 2: deals with production of banana in the World, India and Tamil Nadu.
Chapter 3: deals with trade of Banana in World, in India and in Tamil Nadu. India’s export of fresh banana, constraints in export of banana and potential target market for Indian banana exports.
Chapter 4: deals with SWOT Analysis with separate sections for Varieties, Pre harvest practices, Post harvest practices and practices that need to be followed for producing export quality banana.
Chapter 5: comprises of Banana cold chain scenario in Tamil Nadu, with details of Present Chain, Ideal Chain and Gap analysis.
Chapter 6: contains Project concept and configuration along with Technical aspects.
Chapter 7: deals with project cost and financial analysis.
Chapter 8: Government Interventions required
Chapter 9: Recommendations from the study

8 Confederation of Indian Industry
2 Banana Production: Global, India, TN State
2.1. Banana BasicsBanana is the common name for herbaceous plants of the genus Musa and for the fruit they produce. Bananas come in a variety of sizes and colors when ripe, including yellow, purple, and red (See Fig-2.1). In popular culture and commerce, “banana” usually refers to soft, sweet “dessert” bananas. By contrast, Musa cultivars with firmer, starchier fruit are called plantains. Many varieties of bananas are perennial.
Fig 2.1: Different colour and shapes of Bananas
The banana plant is one of the largest herbaceous flowering plant. Plants are normally tall and fairly sturdy and are often mistaken for trees, but their main or upright stem is actually a pseudo stem that grows 6 to 7.6 meters (20 to 24.9 ft) tall, growing from a corm. Each pseudo stem can produce a single bunch of bananas. After fruiting, the pseudo stem dies, but offshoots may develop from the base of the plant.
Leaves are spirally arranged and may grow 2.7 meters (8.9 ft) long and 60 cm (2.0 ft) wide. They are easily torn by the wind, resulting in the familiar frond look.

9 Feasibility Report for Setting-up Integrated Cold Chain for Banana in Tamil Nadu
Each pseudo stem normally produces a single inflorescence, also known as the banana heart. Banana fruit develop from the banana heart, in a large hanging cluster, made up of tiers (called hands) with up to 20 fruit to a tier. The hanging cluster is known as a bunch, comprising 3–20 tiers, or commercially as a “banana stem”, and can weigh from 30–50 kilograms (66–110 lb). In common usage, bunch applies to part of a tier containing 3-10 adjacent fruits.
Individual banana fruits (commonly known as a banana or ‘finger’), weigh on an average 125 grams (0.28 lb), of which approximately 75% is water and 25% dry matter. There is a protective outer layer (a peel or skin) with numerous long, thin strings (the phloem bundles), which run lengthwise between the skin and the edible inner portion. The inner part of the common yellow dessert variety splits easily lengthwise into three sections that correspond to the inner portions of the three carpels.
Banana fruit is of very high nutritional value (Table 2.1) and supplies daily requirement of many vitamins to an extent of 1to20% of an average individual. Further it is highly palatable across the globe.
Table 2.1: Nutritional Value of Banana
Banana : Nutritional value per 100 g of raw edible partsEnergy 371 kJ (89 kcal)Carbohydrates 22.84 gSugars 12.23 gDietary fiber 2.6 gFat 0.33 gProtein 1.09 gVitamin A equiv. 3 μgThiamine (Vit. B1) 0.031 mgRiboflavin (Vit. B2) 0.073 mgNiacin (Vit. B3) 0.665 mgPantothenic acid (B5) 0.334 mgVitamin B6 0.367 mgFolate (Vit. B9) 20 μgVitamin C 8.7 mgCalcium 5 mgIron 0.26 mgMagnesium 27 mgPhosphorus 22 mgPotassium 358 mgZinc 0.15 mgOne banana is 100–150 g. Source: USDA Nutrient database

10 Confederation of Indian Industry
2.2. Commercial Banana VarietiesIndia is endowed with diverse agro climatic conditions, which have encouraged the development and sustenance of large number of varieties catering to local needs. More than 20 varieties are commercially grown in different parts of India. However, ‘Cavendish clones’ dominate the production and forms the main stay of Indian banana industry, owing to its high yield, wide market acceptability, short crop duration and high economic returns per unit area. The important Cavendish clones are Basrai (Dwarf Cavendish), Robusta, Harichal, Grand Naine, Shrimanthi, Bhusaval and Pedda Pachha Arati. Cavendish group of banana has larger area and production and contribution is more than 50% to the production. But it is not available in the coastal region due to high susceptibility to Sigatoka leaf spot disease. Some of the important varieties are as follows:
2.2.1. Grand Naine It is most accepted international variety. It is a tall statured plant and a heavy yielder with long cylindrical bunch. On an average it produces a bunch weighing 25 kg and may go up to 32-35 kg, with 8-10 hands with 200-220 fruits/bunch. The length of the fruit is 15-21 cm and girth is 12-13 cm.
2.2.2. RobustaIt is normal statured with black brown blotches on the stem, bunches weigh around 20 kg having 8-10 hands/bunch. The length of the fruit is 15-20 cm and girth is 12 cm with thick fruit skin
2.2.3. Dwarf CavendishThe plant stature is dwarf. Dark black brown blotches appear all along the stem. Bunches are large with compactly arranged 8-10 hands weighing about 20kg. Length of fruit is 13-14 cm and girth 8-10 cm. Skin is thick and the fruit tapers gradually towards the tip. It is not fit for export.
2.2.4. Red BananaThe plant is tall and robust statured. The colour of the fruit, pseudo tem, petiole and midrib is purplish red. The bunch weight is 20-25 kg with 6-7 hands and 80 fruits/bunch. The length of the fruit is 16-18 cm.
2.2.5. NendranThere is considerable diversity in plant stature. Bunch has 5-6 hands weighing about 6-12 kg. Fruits have a distinct neck with thick green skin turning buff yellow on ripening. Fruits remain starchy even on ripening.
2.3. Global ProductionBanana and Plantain is the 4th important food crop in terms of gross value. It is produced in 130 countries in tropical and sub-tropical regions of the world of mostly developing economies. Globally,

11 Feasibility Report for Setting-up Integrated Cold Chain for Banana in Tamil Nadu
banana and plantain are cultivated 4.879 million hectares with a total production of 93.7 million tones.
Bananas, due to the special climatic conditions required, are mainly produced in developing countries. About 98% of world productions are grown in these countries. Developed countries are the usual destination for export of bananas. The crop is grown by millions of small-scale farmers in Africa, South Asia and Northern Latin America for household consumption and or /local markets. Most of this production achieved with few or no external inputs.
In most of the banana and plantain growing countries, it is grown perennially with single or two cultivars dominating the whole economy. Due to the tropical nature, these countries are receiving plenty of rains with good soil; the perennial system of cultivation is followed in large areas. Due to the non- availability of labour, mechanization is commonly adapted with aerial spraying for plant protection measures.
In the banana republic countries, Cavendish group of bananas are grown commercially for export to USA and UK markets. In South American countries like Brazil etc., Pome group of fruits are the most important type grown commercially in large areas. In the Western African countries, Plantain is the most preferred variety grown for local and export trade. In the eastern African countries, high land AAA bananas are commonly grown with Cavendish and cooking bananas.
In the South East Asian countries, like India, polyclonal system of cultivation is adopted for local and export market. In this region, Philippines, Indonesia and Malaysia are the major banana growing countries while Australia, Cavendish banana are grown in a larger extent.
Production of banana is concentrated in few countries and not equitably and widely spread. The ten major banana producing countries accounted for more than 3/4th of total banana production in 2010. A significant change from 2002 to present times is the substantial production increase in Philippines pushing Ecuador to fourth position from 2nd position. Thus the concentration of banana production has increased over time although different regional distribution has changed.
The top 20 banana producing countries is mentioned in Table 2.2.
Table 2.2: Top 20 countries in Banana Production in World (2010) (Source: FAO Stat)
Rank Area Production (Int $1000)
Production (MT)
1 India 8386971 297800002 China 2773754 98488953 Philippines 2306897 91013404 Ecuador 2233632 79310605 Brazil 1960937 69627906 Indonesia 1620806 57550707 United Republic of Tanzania 823686 29247008 Guatemala 714658 26375709 Mexico 592371 2103360

12 Confederation of Indian Industry
The table 2.3 given below shows the 10 major banana producing countries in the world and percentage share in world production.
Table 2.3: International Status: Production & share (2010) of top ten producers
Rank Area Production (Int $1000)
Production (MT)
10 Colombia 572933 203434011 Burundi 538664 191266012 Costa Rica 493963 180394013 Thailand 446357 158490014 Viet Nam 417208 148140015 Egypt 289784 102895016 Cameroon 267605 95020017 Papua New Guinea 266141 105000018 Bangladesh 230445 81825419 Kenya 222930 79157020 Dominican Republic 207011 735045
Sr No. Country Production Share (%)1 India 2,97,80,000.00 32.062 China P Rp 98,48,895.00 10.603 Philippines 91,01,340.00 9.804 Ecuador 79,31,060.00 8.545 Brazil 69,62,790.00 7.506 Indonesia 57,55,070.00 6.207 Guatemala 26,37,570.00 2.848 Mexico 21,03,360.00 2.269 Colombia 20,34,340.00 2.1910 Burundi 19,12,660.00 2.06 Page Total 7,80,67,085.00
The factors such as the system of cultivation and the varieties grown, affects the biotic stresses influencing the production and productivity in the different regions of world. In ‘banana republics’ and South American countries, due to the monoculture system of Cavendish group of varieties cultivation undertaken, leaf spot disease is highly prevalent requiring 25-30 rounds of aerial spraying of fungicides. But in Asian and South East Asian countries, many biotic stresses like Fusarium wilt, weevil, nematodes and viruses are the main factors affecting the production. In the African countries,

13 Feasibility Report for Setting-up Integrated Cold Chain for Banana in Tamil Nadu
the Moko disease is becoming more serious concern in the production of high land and plantain and cooking bananas which form the main staple food in the region.
Internationally, the research activities in different regions of the world are undertaken by well established institutions and these are further well coordinated and facilitated by the International Network for the Improvement of Banana and Plantain (INIBAP) located in France. With in Asia, the Banana and Plantain Network (BAPNET) located in Philippines is undertaking the coordination of the banana research activities carried out by the National Agricultural Research System (NARS) of Asia and South East Asian countries.
Some of the important features of international Banana production scenario are:
Grown in more than 130 countries worldwide.��
Banana production is taken up in back yard cultivation, small farm cultivation and large automated ��
farm corporate cultivation.
Top 4 countries i.e. India, China, Philippines, and Ecuador account for 60% of world’s ��
production.
Top 10 countries account for more than 80% of world’ production.��
The productivity in 2009 varied substantially amongst countries varying from 5.4Mt/ha in Burundi ��
to 54.3 Mt/ha in Indonesia.
The countries with large, mechanized system of cultivation normally are able to achieve better ��
productivity.
Per capita production varies substantially amongst different countries as well as exportable ��
surpluses.
2.4. Production in India
2.4.1. Banana Importance in Indian AgricultureIndian economy is still largely dependent on agriculture and Industrial system based on the raw material produced by rural production systems. Banana is 10th in importance in terms of value of production in the year 2009 and the value is put at US$ 3.736 billions as per the FAO estimate. If live stock based products are not considered, then it is 8th most important commodity for Indian agriculture. But in terms of investments made by private capital, it is negligible in comparison to Paddy/Rice, Wheat, Sugarcane, Cotton and potatoes. Probably, the vegetables are the only other agricultural commodity which has not attracted the required investments especially in post harvest processing systems.

14 Confederation of Indian Industry
From table 2.4 below Banana comes in top 10 products monetary value wise.
Table 2.4: Importance of Banana in Indian Agriculture Based on 2010 production (Source: FAO)
2.4.2. Growth pattern of Banana in IndiaIndia with its rich bio–diversity of banana and plantain is the largest producer and consumer with estimated production of 29.78 million tones annually. Within the country, banana ranks first in production and third in area, after Mango and Citrus group, among the fruit crops. It occupies about 13% area among the fruit crops and constitutes 31% of the production of all fruit crops. There has been a spectacular increase in production of bananas during the last 20 years due to
Increased acreage:�� Area under cultivation of banana has increased from 2 lakh hectares to 6.2 lakh hectares by 2002 and estimated to be around 7 lakh hectares in 2008-09
Improved productivity:�� The productivity has also increased from 9.0 tones/ha to 33.5 tones/ha, with some states reporting the productivity up to 53 tones/ha
R&D: �� concerted efforts in banana research and development.
Rank Commodity Production (MT)1 Rice, paddy 1439630002 Wheat 808000003 Potatoes 365773004 Bananas 297800005 Onions, dry 151180006 Mangoes, Mangosteens, Guavas 150267007 Maize 140600008 Millet 132900009 Tomatoes 1243320010 Eggplants (aubergines) 1056300011 Chick peas 748000012 Cabbages and other brassicas 728140013 Sorghum 670000014 Cauliflowers and broccoli 656900015 Oranges 596640016 Groundnuts, with shell 564000017 Papayas 419600018 Hen eggs, in shell 337810019 Peas, green 302940020 Lemons and limes 262920021 Chicken meat 219300022 Apples 177720023 Buffalo meat 148943024 Pineapples 138680025 Barley 1350000

15 Feasibility Report for Setting-up Integrated Cold Chain for Banana in Tamil Nadu
Table 2.5: Area, Production and Productivity of Banana in India
Year Area (In 000’’Ha)
% Of Total Frt.Area
Production (In 000’’ Mt)
% Of Total Frt.Production
Productivity (In Mt/Ha)
1991- 92 383.9 13.4 7790.0 27.2 20.32001- 02 466.2 11.6 14209.9 33.0 30.52002 -03 475.3 12.5 13304.4 29.4 28.02003 -04 498.6 10.7 13856.6 30.4 27.82004 -05 589.6 11.9 16744.5 34.0 28.42005 -06 569.5 10.7 18887.8 34.1 33.22006 -07 604.0 10.9 20998.0 35.3 34.82007- 08 658.0 11.2 23823.0 36.3 36.22008- 09 709.0 11.6 26217.0 38.3 37.02009-10 770.4 - 26469.5 - 34.4
Banana primacy in overall horticulture production by quantity is growing and has increased from 27.2% in 19991-92 to 33% in 2001-02 and now reached 38.3% in 2008-9. The importance of banana amongst horticulture produce is only going to increase because of its advantages such as universal acceptance, less seasonality compared to other fruits and vegetables, availability of well developed technologies for storage/transport internationally and better returns to farmers.
2.4.3. Distribution Pattern of Banana in India
2.4.3.1. Among States:
Availability of wide genetic diversity, varying production systems and its suitability to wide range of agro climatic conditions are the reasons for wide range adaptability of Banana in India. It is grown as homestead garden as well as on commercial plantation. Commercial production system is well irrigated, while subsistence cultivation is under rain fed farming. It is mainly grown along the riverside but drip based cultivation among non river irrigations have also been increasing and most of Grand Naine variety is coming up in these areas.
Major growing states are Tamil Nadu, Maharashtra, Gujarat, Andhra Pradesh and Karnataka. These account for 68.67% of India’s production in the year 2008-09. Other states have limited area and production. The state wise details of production and percent share in total is given in Table 2.6.
Table 2-6: Production of Banana in India State wise in 2010-11 (Source: APEDA AgriExchange)
Sr No. State Production (000 Tonnes)
Share (%)
1 Tamil Nadu 8,253.00 27.71
2 Maharashtra 4,303.00 14.45
3 Gujarat 3,978.02 13.36

16 Confederation of Indian Industry
Sr No. State Production (000 Tonnes)
Share (%)
4 Andhra Pradesh 2,774.76 9.32
5 Karnataka 2,281.58 7.66
6 Madhya Pradesh 1,719.58 5.77
7 Bihar 1,517.11 5.09
8 Uttar Pradesh 1,346.05 4.52
9 West Bengal 1,010.15 3.39
10 Assam 723.57 2.43
Page Total 27,906.82
Among the states, the area and production of Banana is largest in Tamil Nadu, while the productivity is highest for Maharashtra state followed by Gujarat state. Maharashtra excels in productivity owing to monoculture of high – yielding Cavendish clones, coupled with adoption of improved technologies, i.e. micro irrigation, fertigation and use of tissue cultured plants besides targeted management. Strategically, adoption of improved technologies in other states has potential to improve productivity. The area and productivity of banana in the year 2008-09 is given at Table 2.7.
Table 2.7: State wise area and productivity of Banana in 2009-10 (Source: NHB)
S.No. State Area ('000'HA.)
Production ('000'MT.)
Percentage Of Total
Production
Productivity
1 Maharastra 85.000 5,200.000 19.645 61.176
2 Tamil Nadu 113.680 4,980.860 18.817 43.815
3 Gujarat 61.920 3,779.810 14.280 61.043
4 Andhra Pradesh 80.600 2,819.600 10.652 34.983
5 Karnataka 104.400 2,132.300 8.056 20.424
6 Madhya Pradesh 33.000 1,459.800 5.515 44.236
7 Bihar 31.500 1,435.300 5.422 45.565
8 Uttar Pradesh 30.430 1,138.580 4.301 37.416
9 West Bengal 40.978 982.228 3.711 23.970
10 Assam 53.390 805.240 3.042 15.082
Total 770.421 26,469.540 100.000 34.357

17 Feasibility Report for Setting-up Integrated Cold Chain for Banana in Tamil Nadu
2.4.3.2. Banana production and Varieties:
The variety wise distribution of banana in the country is shown at figure 2.1 and 2.2.
Fig 2.1: Variety wise area distribution
2.2 Variety wise production distribution
As can be seen, Cavendish variety account for 49% of area and 69% of production in the country followed by Poovan which account for 18% area and 17% production. Among the varieties which have presence at 4% are Pome, Nendran, Rasthali, Bluggoe. There are many other local and non local varieties contributing to about 17% production and 18% area.

18 Confederation of Indian Industry
Variety wise yield varies substantially. The average yields of different varieties are shown at table 2.8 Grand naine, Shrimanti also an equivalent variety show maximum yields per ha. There are reports of even 105 mt/ha that have been achieved by farmers especially in some parts of Andhra Pradesh and Tamilnadu.
Table 2.8 : Variety-wise average yield of banana (tonnes/ha.)
Varieties Average yield (tones/ha.)Basrai, Rasthali 40-50Shrimanti 70Grand Naine 65Ardhapuri , Meanyham 55Hirsal, Safed Velchi, Red banana, Lal Velchi 45Poovan 40-50Monthan 30-40Dwarf Cavendish , Robusta Champa & Chini desi 50-60Nendran 30-35
2.5. Production of Banana in Tamil Nadu
2.5.1. Geography and agro-climateTamil Nadu covers an area of 130,058 square kilometres (50,216 sq mi), and is the eleventh largest state in India. The bordering states are Kerala to the west, Karnataka to the northwest and Andhra Pradesh to the north. To the east are the Bay of Bengal and the union territory of Puducherry. The southernmost tip of the Indian Peninsula is located in Tamil Nadu.
The western, southern and the north-western parts are hilly and rich in vegetation. Tamil Nadu is the only state in India which has both the Western Ghats and the Eastern Ghats and they both meet at the Nilgiri hills. The Western Ghats dominate the entire western border with Kerala, effectively blocking much of the rain bearing clouds of the South West Monsoon from entering the state. The eastern parts are fertile coastal plains and the northern parts are a mix of hills and plains. The central and the south central regions are arid plains and receive less rainfall than the other regions.
Tamil Nadu has a coastline of about 910 kilometres (600 mi) which is the country’s third longest coastline. Tamil Nadu’s coastline bore the brunt of the 2004 Indian Ocean Tsunami when it hit India, which caused 7,793 direct deaths in the state. Tamil Nadu falls mostly in a region of low seismic hazard with the exception of the western border areas that lie in a low to moderate hazard zone; as per the 2002 Bureau of Indian Standards (BIS) map, Tamil Nadu falls in Zones II & III. Historically, parts of this region have experienced seismic activity in the M5.0 range.
Tamil Nadu state comprises 31 districts (including Chennai) as shown in Figure 2.3

19 Feasibility Report for Setting-up Integrated Cold Chain for Banana in Tamil Nadu
Figure 2.3: Tamil Nadu map with districts
Tamil Nadu is heavily dependent on monsoon rains, and thereby is prone to droughts when the monsoons fail. The climate of the state ranges from dry sub-humid to semi-arid. The state has three distinct periods of rainfall:
advancing monsoon period, South West monsoon from June to September, with strong southwest ��
winds;
North East monsoon from October to December, with dominant northeast winds;��
dry season from January to May.��
The normal annual rainfall of the state is about 945 mm (37.2 in) of which 48% is through the North East monsoon, and 32% through the South West monsoon. Since the state is entirely dependent on rains for recharging its water resources, monsoon failures lead to acute water scarcity and severe drought.
Tamil Nadu is classified into seven agro-climatic zones: north-east, north-west, west, southern, high rainfall, high altitude hilly, and Cauvery Delta (the most fertile agricultural zone). The maximum and minimum temperatures range from 43˚C and 13.1˚C in the plains and 32.3˚C and 3.0˚C in hills.
Mango and Banana are the leading fruit crops in Tamil Nadu accounting for over 84% of the area under fruit and over 87% of the total fruit production.

20 Confederation of Indian Industry
The main fruits and their production areas in Tamilnadu are as follows:
Fruit Main Production AreasBanana Thiruchirapalli, Thoothukudi, Thirunelveli, Pudukottai, ThanjavurMango Krishnagiri, Vellore, Dindigul, Theni, Dharmapuri, MaduraiSapota Thirunelveli, Erode, KarurGrapes Theni, CoimbatoreGuava Madurai, Dindigul, Vellore, VirudhunagarAonla Thirunelveli, Sivagangai, Thoothukudi, Coimbatore, Dindigul, Erode
2.5.2. Promotional Bodies in TNHorticulture development is planned, organised and supervised by Horticulture department. A separate mission approach, as part of national policy is being implemented in Tamilnadu also as State Horticulture Mission.
The National horticulture Mission is following cluster approach for development of horticulture sector. The plan for 2009-10 under Mission approach is as follows:
Table 2.9 Cluster and crop matrix in Tamil Nadu (2009-10)
S.No Cluster Districts Crops1 Cluster I Krishnagiri, Dharmapuri and Pudukottai Aonla
Dharmpuri, Krishnagir and Vellore Banana & Mango FloricultureDharmpuri and Vellore Spices (Chilli and Turmeric),
Medicinal & Aromatic Plants.2 Cluster 2 Salem, Tiruchirapalli and Villipuram Aonla
Salem, Tangore, Tiruchirapalli and Villipuram BananaPerambalur, Pudukottai, Salem, Tirukirapalli and Villipuram
Mango
Cudalore, Perambalur, Pudukottai, Tangore and Villipuram
Cashew and cocoa
Salem Floriculture, spicesPerambelukr, Pudukotai, Salem and Villipuram Medicinal & aromatic plants
3 Cluster 3 Kanyakumari, Tirunalveli Aonla, Banana , Mango , Medicinal & Aromatic plants.
Shivagangai Cashew and ChilliKanyakumari, RamaldhapuramTirunalveli Cashew, cocoa, Floriculutre,
spices.4 Cluster 4 Oimbatore, Dindigul, Madurai, and Theni Aonla, Banana, Mango
Coimbatore, Dindigul and Erode Spice (Chilli and Turmeric)Coimbatore, Dindigul, Erode and The Nilgiris FloricultureDindigul and Madurai Medicinal & Aromatic plantsDistricts=20 Crops=10

21 Feasibility Report for Setting-up Integrated Cold Chain for Banana in Tamil Nadu
As can be seen from the cluster crop matrix, Banana is an important component in all the four clusters.
2.5.3. District-wise ProductionDistrict wise banana production in the sate of Tamilnadu in the year 2009 is shown at Table 2.10. Banana is grown in all 31 districts of Tamilnadu.
Table 2.10: District wise Area, production and productivity of Banana in the state of Tamilnadu
S.No District
AREA, PRODUCTION AND PRODUCTIVITY OF HORTICULTURE CROPSArea: Ha., Prod.: Tonnes & Proty : Tonnes /Ha
2012-13Area Prodn Productivity
1 Ariyalur 369 24934 66.112 Coimbatore 12353 751016 60.803 Cuddalore 5427 245893 45.314 Dharmapuri 1804 95956 53.195 Dindigul 6105 246205 40.336 Erode 13841 935056 67.567 Kancheepuram 348 18392 52.858 Kanyakumari 7747 409749 52.899 karur 6682 352646 52.7810 Krishnagiri 2836 150000 52.8911 Madurai 3376 201493 59.6812 Nagapattinam 728 38517 52.9113 Namakkal 3408 180253 52.8914 Perambalur 247 25722 104.1315 Pudukottai 4557 248686 54.5716 Ramanathapuram 484 25589 52.8717 Salem 4573 241892 52.8918 Sivagangai 926 48979 52.8919 Thanjavur 5265 275572 52.3420 Theni 6105 629209 266.8621 The Nilgiris 1155 61106 55.2922 Thiruvallur 1688 89293 52.8923 Thiruvannamalai 3965 348553 87.9124 Thiruvarur 506 26788 52.9425 Thoothukudi 12408 723983 58.3526 Tirupur 4963 293728 59.1827 Thiruchirapalli 10665 463101 43.4228 Thirunelveli 11992 448389 37.3929 Vellore 8716 288176 33.0630 Villupuram 1698 89827 52.9031 Virudhunagar 1087 57508 52.90 TOTAL 146024 8036211 54.90

22 Confederation of Indian Industry
2.5.4. Disrict-Wise AcreageCultivated area distribution amongst districts in 2009 is shown at Figure 2.4. As can be seen top 10 district account for 66% area while remaining 21 districts account for only 34% area.
Fig 2.4: Banana cultivation area distribution amongst Districts in 2012-13
2.5.5. Disrict-Wise QuantityDistribution of Quantity of banana produced amongst districts follows area pattern excepting Theni district. Theni accounts for 8.1% production even though it accounts for only 4% area. Pl see fig 2.5.
The
ka
Dindigul, 4.1
eni, 4.18%
O
rur, 4.58%
8%
Others, 34%
Kany5
Erode, 9.4
akumari, 5.31%
48%,
Thiru8.2
Vellore, 5.97
Thoothukudi8.50%
Coim8.4
nelveli, 21%
Thiruchirapa7.30%
7%
i,
batore, 46%,
alli,

23 Feasibility Report for Setting-up Integrated Cold Chain for Banana in Tamil Nadu
Fig 2.5: Banana Production distribution amongst Districts in 2012-13
The reason is mainly the productivity levels. Amongst top 10 banana producing districts, the productivity varies from high of 89.3 Mt/ha in Theni to only 27.8 Mt/ha in Vellore district. Only four out of top 10 banana producing districts have higher productivity than state average of 46.5 mt/ha. The details are depicted in fig 2.6.
Fig 2.6 : Productivity of Districts in 2012-13
Th
Tir
K
iruvannamalai4%
upur, 4%,
anyakumari, 5
Karur, 4%,,
Others, 33%
T%
%,
Ero
Thirunelveli, 6%
ode, 12%
Co
T
Thiruchir6%%
imbatore, 9%,
Thoothuku9%
Theni, 8%
rapalli, %
udi,
24 Confederation of Indian Industry
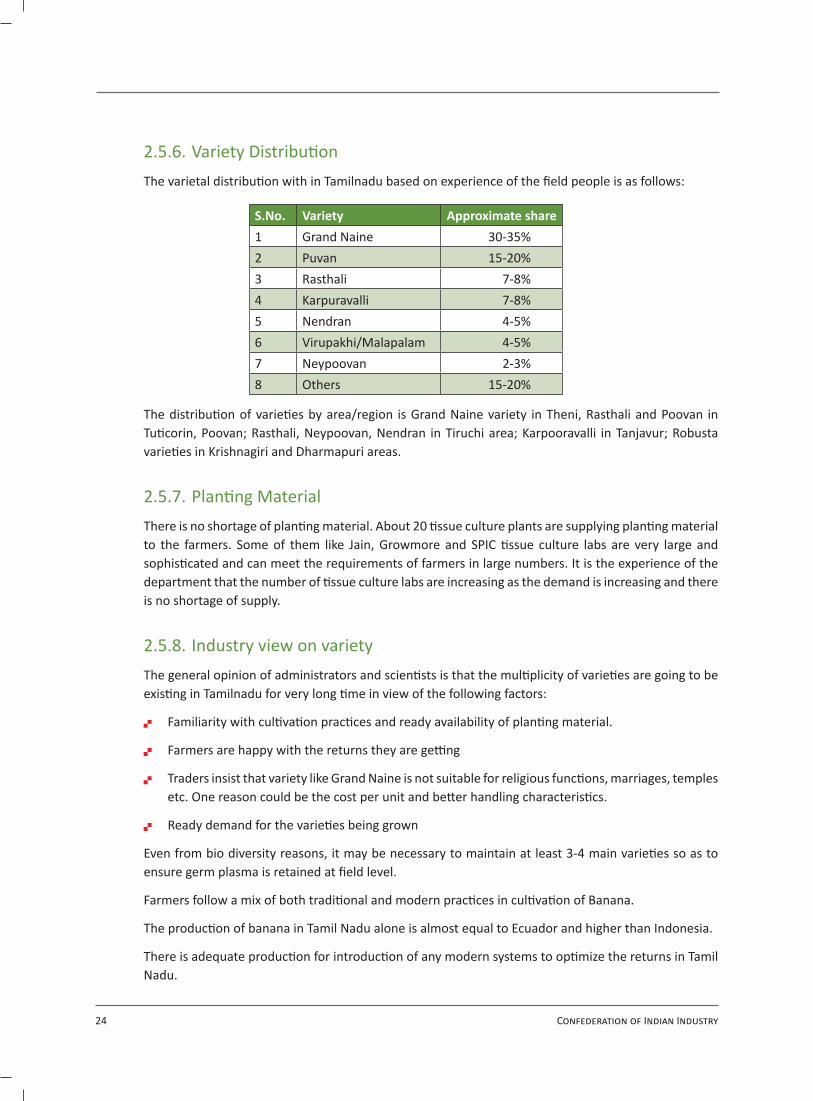
2.5.6. Variety DistributionThe varietal distribution with in Tamilnadu based on experience of the field people is as follows:
S.No. Variety Approximate share1 Grand Naine 30-35%2 Puvan 15-20%3 Rasthali 7-8%4 Karpuravalli 7-8%5 Nendran 4-5%6 Virupakhi/Malapalam 4-5%7 Neypoovan 2-3%8 Others 15-20%
The distribution of varieties by area/region is Grand Naine variety in Theni, Rasthali and Poovan in Tuticorin, Poovan; Rasthali, Neypoovan, Nendran in Tiruchi area; Karpooravalli in Tanjavur; Robusta varieties in Krishnagiri and Dharmapuri areas.
2.5.7. Planting MaterialThere is no shortage of planting material. About 20 tissue culture plants are supplying planting material to the farmers. Some of them like Jain, Growmore and SPIC tissue culture labs are very large and sophisticated and can meet the requirements of farmers in large numbers. It is the experience of the department that the number of tissue culture labs are increasing as the demand is increasing and there is no shortage of supply.
2.5.8. Industry view on varietyThe general opinion of administrators and scientists is that the multiplicity of varieties are going to be existing in Tamilnadu for very long time in view of the following factors:
Familiarity with cultivation practices and ready availability of planting material.��
Farmers are happy with the returns they are getting��
Traders insist that variety like Grand Naine is not suitable for religious functions, marriages, temples ��
etc. One reason could be the cost per unit and better handling characteristics.
Ready demand for the varieties being grown��
Even from bio diversity reasons, it may be necessary to maintain at least 3-4 main varieties so as to ensure germ plasma is retained at field level.
Farmers follow a mix of both traditional and modern practices in cultivation of Banana.
The production of banana in Tamil Nadu alone is almost equal to Ecuador and higher than Indonesia.
There is adequate production for introduction of any modern systems to optimize the returns in Tamil Nadu.

25 Feasibility Report for Setting-up Integrated Cold Chain for Banana in Tamil Nadu
3. Banana Trade
3.1. Basics of Trading
3.1.1. HarvestingBanana fruit trading life starts from the time it is cut from mother plant. Thus the start of post harvest life is also start of trading life of a banana. This ends when the fruit is consumed/sold for consumption. Since supply of water, photosynthesis and nutrients is cut off after separation of the fruit from the plant, fruit enters ‘perishable phase’. Banana is highly perishable and has got short shelf life being a climacteric fruit.
Post harvest storage life and quality of banana depends on two factors:
Stage of maturity at which it is harvested��
Post harvest handling system��
3.1.2. MaturityThe stage of maturity is of prime importance in banana trade. Minor modifications are made in harvesting in relation to maturity depending on the market and time it takes to reach market.
Several parameters are used for determining the maturity of banana fruits. These are either based on external appearance or chemical constituents. These are not universally applicable and differ depending on varieties and even strains and locations. Some of these indices are
Age after emergence of flower.��
Angularity of the fingers��
Diameter and length of fruit��
Heat units��

26 Confederation of Indian Industry
An indicative maturity at harvesting stage vis-à-vis market and consumption time from the time of harvest is indicated at table 3.1 below:
Table 3.1: Maturity stage of harvest and markets
S.No. Market and Consumption time from harvest Maturity stage at the time of harvesting
1 Domestic market and consumption with in 7 days Fully matured bunches i.e. 90-95%2 Regional markets and consumption with in 15
days 85 to 90% maturity with fairly defined angles
3 Long distance transportation and export 75% maturity and fruit with well defined angles.
3.1.3. Stages of Banana In trade, banana’s post harvest life/trading life is divided into seven stages as indicated table 3.2.
Table 3.2: Banana Colour Stage ChartStage 1 Dark Green, Stage at which fruit should be shipped from fields
Stage 2 Light Green, as ripening begins either through natural process or through application of Ethylene
Stage 3 More Green than Yellow, starches turning to sugar, as the fruit start producing it’s own ethylene. Sale in Summer and hot weather recommended at this stage
Stage 4 More Yellow than Green, continuing the ripening process, ideal for retail display. Sale in Winters periods can start at this stage.
Stage 5 Yellow with Green tips, ideal for purchase by customers and to finish ripening at home
Stage 6 All Yellow firm fruit, with good flavour, ready for eating, especially those who want their fruit firm
Stage 7 Yellow with spots, perfect flavour and softness for eating

27 Feasibility Report for Setting-up Integrated Cold Chain for Banana in Tamil Nadu
3.1.4. Grades and Criteria According to Codex and Agmark standards banana is classified into following classes:
Table 3.3: Showing grade designation of banana as per AGMARK standards
Grade designation Grade requirements Grade tolerancesExtra class Bananas shall be of superior quality. They
must be characteristic of the variety and/or commercial type. The fingers must be free of defects, with the exception of very slight superficial defects, provided these do not affect the general appearance of the produce, quality, the keeping quality and presentation in the package.
5% by number or weight of bananas not satisfying the requirements of the class
Class I Bananas shall be of good quality. They must be characteristic of the variety and/or commercial type.
The following slight defects of the fingers, however, may be allowed, provided these do not affect the general appearance of the produce, quality, the keeping quality and presentation in the package.
- slight defects in shape and colour;
- slight defects due to rubbing and other superficial defects not exceeding 2 sq.cm. of the total surface area
10% by number or weight of bananas not satisfying the requirements of the class
Class II The defects must not affect the flesh of the fruit.
This includes bananas which do not qualify for inclusion in the higher classes, but satisfy the minimum requirements.
The following defects may be there, provided the bananas retain their essential characteristics as regards the quality, the keeping quality and presentation.
- defects in shape and colour provided the product remains the normal characteristics of bananas;
- skin defects due to scrapping, scabs, rubbing, blemishes or other causes not exceeding 4 sq.cm. of the total surface area; The defects must not affect the flesh of the fruit
10% by number or weight of bananas not satisfying the requirements of the class, nor the minimum requirements. With the exception of produce affected by rotting, major imperfections or any other deterioration rendering it unfit for human consumption

28 Confederation of Indian Industry
3.1.5. Size of Banana Size of banana is an important aspect in the trade. Size of banana varies depending on the variety.
According to codex standard, normally applicable to Cavendish groups
For the purposes of sizing bananas, the length of the fingers is determined along the outside curve ��
from the blossom end to the base of the pedicel where the edible pulp ends and the diameter is defined as the thickness of a transverse section between the lateral faces. The reference fruit for measurement of the length and grade is:
for hands, the median finger on the outer row of the hand,��
for clusters, the finger next to the cut section of the hand, on the outer row of the cluster.��
The minimum length should not be less than 14.0 cm and the minimum grade not less than ��
2.7 cm.
For all classes, a tolerance limit of 10% by number or weight of bananas not satisfying the sizing ��
characteristics, up to a limit of 1 cm for the minimum length of 14 cm is allowed.
3.2. World TradeBanana is the fourth most important staple crop in the world. It is critical for food security in many tropical countries. Globally, it ranks first in terms of volume and second after citrus in terms of value. It is consumed in almost all the countries of the world even though production is skewed and few countries account for bulk of the world’s production. Cavendish variety of banana is a crucial source of export income for many small countries. Since the 1900s, banana has played a central role in the economies of a number of countries especially in Central and Latin America. For at least 15 Latin American and Caribbean producer countries, several million people depend on the banana trade for their livelihood. About 20% of the 70 million tones of bananas produced each year enter world trade. Ironically, Brazil and India, the two biggest banana producing countries hardly have any significant share in the international banana trade.
Banana and plantain consumptions were maximum in African countries with 40-45kg/year/ individual as against 10.5 kg/year in India. Banana and plantain are the main staple food in East and West African countries. Most of the plantains grown in West Africa is exported to France and European markets. Thus banana and plantain cultivation forms the food security of the millions of people and also sustenance of the small and marginal farmers in African and Asian countries.
Out of the total world production of Banana of 90.7 million tons in 2009, only 14.6 million tons i.e. 16.1% of the banana was traded across countries. The world buyers of banana purchased a total volume of 13.92 million tones valued at US $ 9.888 billion in 2008. The industrialized countries are the major markets for banana and import about 80-85% of the banana, traded worldwide, with USA being the major buyer of banana with total import of 2.53 million tones or about 19.3% of total imports. In terms of value, Belgium is top importer of Bananas valued at 1.946 Billion Dollars even though quantity wise it is only 11.52% of total imports. The Latin American countries dominate the US market for banana. Other major importing countries of banana are Belgium, Japan, United Kingdom and Russia. Among Asian countries Japan and Russian Federation are the major importers. In parts of Europe and Middle East the banana market is growing, as increasing consumption trend is noted during the last few years.

29 Feasibility Report for Setting-up Integrated Cold Chain for Banana in Tamil Nadu
The world trade and top ten importing countries are mentioned in table 3.4.
Table 3.4: Top 20 importers of Banana in the World in 2010
Rank Area Quantity (tonnes) Value (1000 $) Unit value ($/tonne)1 United States of America 4114891 1974545 4802 Belgium 1351242 1532190 11343 Germany 1233712 873434 7084 Japan 1109068 842900 7605 United Kingdom 979397 732720 7486 Russian Federation 1068179 703536 6597 Italy 658391 494719 7518 France 549809 414634 7549 Iran (Islamic Republic of) 661390 392402 59310 Canada 495939 353877 71411 China 665230 246819 37112 Republic of Korea 337910 210269 62213 Poland 245476 198150 80714 Sweden 183496 178738 97415 Saudi Arabia 307420 176394 57416 Netherlands 222327 161689 72717 Austria 126151 127936 101418 Ukraine 151899 116162 76519 Argentina 351094 114365 32620 Czech Republic 161505 106319 658
The imports of Banana in the last three years both in Quantity and Value is shown at table 3.5. Banana imports seem to have stagnated around 13 to 14 million tons but in value terms there is an increase of 10% per annum. Year 2008 appears to be particularly high in value terms but part of it could be explained by weak US$ value in relation to other currencies.
Table 3.5: Trend in World Banana Imports Year 2006 2007 2008
Qty in Mts Value US$ 000’s
Qty in Mts Value US$ 000’s
Qty in Mts Value US$ 000’s
Total Imports 1,41,52,853 76,17,798 1,44,63,059 84,55,114 1,31,19,969 98,88,476Source: UNCOMTRADE
The top exporting countries are Ecuador, Belgium, Columbia, Costa Rica, USA, Germany, Guatemala, Philippines, and Dominican Republic. Out of these, Belgium, Germany, USA are re-exporters of Banana as they are not producing countries, excepting USA.
World exports of bananas also show a high level of concentration, with developing countries accounting for the bulk of exports. Although a number of African and Caribbean producers such as Cote d’lvoire, Cameroon and Martinique – have come to rely on banana exports, the largest exporters are the Latin American countries. The largest banana exporters’ bow includes Ecuador (18% of world trade), Costa Rica (12%), Colombia (12%), Honduras (11%), Philippines (11%) and Panama (9%). These six countries account for 73% of the world banana trade. Most of this trade is controlled by just a handful of firms for example,

30 Confederation of Indian Industry
United Brands (also Known as Chiquita) and Del Monte control nearly 40% of world banana trade. The Asian countries have a meager share of approximately 0.04%, with Philippines having the biggest share. The details of the world banana export and top ten exporting countries are given in Figure 3.1
Figure 3.1: Top exporters of Banana in World in 2010
The USA and European Union are the major consumers with consumption being on rise in USA. However, in European Union very little increase is noticed during the decade. Other parts of Europe and Middle East have growing market for Banana. World export of banana has shown increase during the last decade, which was largely contributed by Latin America and Caribbean.
Banana Imports 2011, Source: UNCOMTRADE
Country Trade Value NetWeight (kg) Trade Quantity
Afghanistan $3,335,876 27,692,268 27,692,268
Albania $12,933,916 17,395,939 17,395,939
Algeria $188,732,034 245,285,019 245,285,019
Argentina $143,695,584 394,881,395 394,881,395
Armenia $15,441,397 11,025,713 11,025,713
Aruba $1,933,781 2,839,365 2,839,365
Australia $700,591 243,068 243,068
Austria $133,088,577 127,007,757 127,007,757
Azerbaijan $23,556,353 23,089,947 23,089,947
Bahamas $5,213,129 1,014,136 1,014,136
Bahrain $12,464,909 15,651,092 15,651,092

31 Feasibility Report for Setting-up Integrated Cold Chain for Banana in Tamil Nadu
Country Trade Value NetWeight (kg) Trade Quantity
Barbados $1,494,115 3,573,825 3,573,825
Belarus $29,420,500 40,073,760 40,073,760
Belgium $1,623,210,791 1,403,156,926 1,403,156,926
Bermuda $513,323 647,664 647,664
Bhutan $78,891 438,247 438,247
Bolivia (Plurinational State of) $1,690 353 353
Bosnia Herzegovina $21,504,598 38,033,632 38,033,632
Botswana $5,043,775 6,618,626 6,618,626
Brazil $35,824 5,488 5,488
Bulgaria $42,412,338 49,652,546 49,652,546
Burkina Faso $89,901 2,920,000 2,920,000
Canada $388,632,959 506,659,506 506,659,506
Cape Verde $140 35 35
Chile $54,856,221 380,691,736 380,691,736
China $401,728,003 818,674,659 818,674,659
China, Hong Kong SAR $42,504,887 88,295,882 88,295,882
China, Macao SAR $1,520,273 2,538,752 2,538,752
Colombia $4,049,278 45,249,233 45,249,233
Costa Rica $12,807,378 24,804,352 24,804,352
Côte d'Ivoire $120 18 18
Croatia $38,691,586 48,650,751 48,650,751
Cyprus $6,476,759 4,964,629 4,964,629
Czech Rep. $126,457,959 148,934,990 148,934,990
Denmark $83,685,819 81,280,045 81,280,045
Dominican Rep. $781 985 985
Ecuador $8,721 19,327 19,327
Egypt $13,792,149 17,401,676 17,401,676
El Salvador $12,668,307 107,023,094 107,023,094
Estonia $11,481,833 11,490,020 11,490,020
Ethiopia $808 788 788
Finland $90,354,233 74,320,918 74,320,918
France $458,676,489 582,221,600 582,221,600
French Polynesia $5,047 761 761
Gambia $1,712 1,800 1,800

32 Confederation of Indian Industry
Country Trade Value NetWeight (kg) Trade Quantity
Germany $987,104,925 1,295,136,950 1,295,136,950
Ghana $9,752 20,737 20,737
Greece $121,151,157 139,584,220 139,584,220
Greenland $97,829 43,545 43,545
Guatemala $508,824 5,327,288 5,327,288
Guyana $86 10 10
Hungary $56,492,000 61,272,100 61,272,100
Iceland $6,266,130 5,889,856 5,889,856
India $625 820 820
Indonesia $849,998 1,631,045 1,631,045
Iran $409,672,474 615,879,444 615,879,444
Ireland $68,216,698 87,521,892 87,521,892
Israel $51,000 10,571 10,571
Italy $550,939,321 668,061,079 668,061,079
Japan $905,705,379 1,064,745,781 1,064,745,781
Jordan $35,688,213 48,263,193 48,263,193
Kazakhstan $27,504,675 44,832,040 44,832,040
Kyrgyzstan $7,410,480 11,528,372 11,528,372
Latvia $22,244,581 24,069,840 24,069,840
Lebanon $74,878 185,062 185,062
Lithuania $27,825,147 33,162,129 33,162,129
Luxembourg $8,802,115 4,963,688 4,963,688
Malawi $3,018 1,941 1,941
Malaysia $837,481 2,084,125 2,084,125
Maldives $565,647 990,508 990,508
Malta $7,395,959 5,845,418 5,845,418
Mauritania $307,612 2,542,649 2,542,649
Mauritius $39 5 5
Mexico $223,188 114,932 114,932
Montenegro $4,434,103 7,460,407 7,460,407
Mozambique $55,000 591,396 591,396
Namibia $4,441,315 4,576,808 4,576,808
Nepal $508,168 16,722,410 16,722,410
Netherlands $244,056,958 308,799,189 308,799,189

33 Feasibility Report for Setting-up Integrated Cold Chain for Banana in Tamil Nadu
Country Trade Value NetWeight (kg) Trade Quantity
New Caledonia $12,903 1,725 1,725
New Zealand $62,039,978 86,798,914 86,798,914
Nicaragua $291,068 6,713,620 6,713,620
Niger $261,187 3,699,871 3,699,871
Nigeria $2,247,053 1,096,051 1,096,051
Norway $90,274,243 78,221,439 78,221,439
Oman $6,325,649 13,740,002 13,740,002
Pakistan $277 251 251
Panama $23,168 7,792 7,792
Paraguay $78,022 388,301 388,301
Poland $181,395,698 231,053,549 231,053,549
Portugal $106,468,087 144,904,629 144,904,629
Qatar $16,476,845 24,779,358 N/A
Rep. of Korea $245,521,571 352,670,762 352,670,762
Rep. of Moldova $8,446,555 12,192,613 12,192,613
Romania $44,577,352 54,249,485 54,249,485
Russian Federation $950,432,729 1,307,599,929 1,307,599,929
Rwanda $174,368 1,916,068 1,916,068
Saint Kitts and Nevis $15,377 35,052 35,052
Senegal $7,586,888 14,318,126 14,318,126
Serbia $39,273,375 52,435,092 52,435,092
Singapore $19,753,519 41,584,668 41,584,668
Slovakia $53,089,572 54,810,881 54,810,881
Slovenia $47,187,564 67,476,361 67,476,361
South Africa $12,559,283 52,266,519 52,266,519
Spain $152,547,571 212,202,881 212,202,881
Sri Lanka $20,492 55,268 55,268
Sweden $168,865,796 174,734,903 174,734,903
Switzerland $107,769,497 79,394,798 79,394,798
TFYR of Macedonia $12,523,748 19,086,918 19,086,918
Thailand $2,345,888 10,568,330 10,568,330
Tunisia $11,865,960 41,338,077 41,338,077
Turkey $110,436,179 234,632,778 234,632,778

34 Confederation of Indian Industry
Country Trade Value NetWeight (kg) Trade Quantity
Turks and Caicos Isds $791,948 1,067,452 1,067,452
Uganda $425 172 172
Ukraine $152,617,460 247,824,961 247,824,961
United Kingdom $836,574,079 1,073,126,090 1,073,126,090
United Rep. of Tanzania $57 81 81
USA $2,326,686,875 4,397,475,105 4,397,475,105
Vanuatu $118 31 31
Zambia $174,678 377,641 377,641
3.3. Banana Trade in India
3.3.1. Export MarketIndia while being the largest producer of Banana at about 28% of world production does not account as one of the Banana trading nations of the world. The total exports of Banana from India are about 0.03 million tons out of the total world exports of 14.58 million tons. i.e. 0.2% of World trade.
Indian exports of banana in the last three years are shown at table 3.6.
Table 3.6: Indian Exports of Banana in 2011-12
Sr No. Country Qty Value
1 U Arab Emts 1,51,33,609.00 37,94,20,734.00
2 Saudi Arab 50,13,961.00 12,46,03,406.00
3 Iran 41,26,123.00 9,50,94,209.00
4 Kuwait 31,95,585.00 7,17,65,328.00
5 Baharain Is 24,36,678.00 5,83,61,689.00
6 Nepal 97,65,991.00 5,14,38,613.00
7 Qatar 20,53,138.00 4,93,40,210.00
8 Oman 22,28,150.00 4,85,05,499.00
9 Maldives 9,12,546.00 1,77,98,040.00
10 Korea Rp 1,47,000.00 46,64,546.00
Total 4,50,12,781.00 90,09,92,274.00
Source: NHB

35 Feasibility Report for Setting-up Integrated Cold Chain for Banana in Tamil Nadu
The share of Banana in fresh fruit exports has declined in 2011-12, perhaps because of low pricing in the International Markets (table 3.7). The banana share was only 1.93% by quantity and 2.09% by value in 2009-10 but has gone up to 8.38% by quantity and 3.99% by value in the year 2011-12.
Table 3.7 : Share of Banana in fresh fruit exports from India
Description 2009-2010 2010-2011 2011-2012Qty in Mts Value Rs
LakhsQty in Mts Value Rs
LakhsQty in Mts Value Rs
LakhsAll Fresh fruits 2,60,678 52,278 2,54,900 49,598 2,56,767 73,583Bananas 5,049 1,093 34,711 8,119 21,525 2,939Banana % 1.93 2.09 13.62 16.37 8.38 3.99
There is good export market for banana particularly to the countries/places like U.A.E., Dubai, Sharjah and Abu Dhabi, Sultanate of Oman, Kuwait, Saudi Arabia, Qatar, Bahrain and other gulf countries; also Singapore, Nepal, Sri Lanka, Malaysia and so on.
3.3.2. Domestic TradeMost of the trade of Banana is domestic in nature as 99.8% of banana produced in the country is consumed locally. Banana has wide acceptance across the regions and religions in India.
Banana trade is highly unorganized and mostly undertaken by traders who do not invest in any infrastructure.
The data of arrivals recorded in important markets across India in the year 2009 is shown at table 3.8.
Table 3.8: All India market arrivals of fresh Banana in 2009 (Source: Ag Market)
S.NO Center Name ARRIVALS1 ABOHAR 8902 AGRA 11,8903 AHMEDABAD 13,7084 AMRITSAR 12,4755 BANGALORE 82,2186 BARAUT 2,7637 BHOPAL 12,7358 BHUBANESHWAR 14,0239 CHANDIGARH 16,42410 CHENNAI 1,26,36111 DEHRADUN 4,22712 DELHI 1,58,02413 GANGATOK 90914 GUWAHATI 10,164

36 Confederation of Indian Industry
S.NO Center Name ARRIVALS15 HYDERABAD 44,20216 JAIPUR 32,84717 JAMMU 23,23718 KANPUR 34,65219 KOLKATA 48,56020 LUCKNOW 15,90021 MUMBAI 1,77,08822 NAGPUR 17,17023 NASIK 10,72724 PATNA 21,07525 PUNE 13,14026 RAIPUR 9,87527 RANCHI 12,21028 SHIMLA 2,03029 SRINAGAR 28,06530 SURAT 13,11531 TRIVENDRUM 5,807 Total 9,76,511
In the year 2009, total arrivals in all 31 markets are less than 1 million Mt, as compared to total banana production in the country at 26.17 million tonnes. It shows that about 95% of the produce is getting traded either in unregulated markets or in unorganized sector.
Within the 31 markets, Mumbai, Delhi, Chennai and Bangalore are the 4 markets showing maximum arrivals and accounting for more than 60% of total arrivals.
Intra year arrival distribution is shown at Table 3.9. Variation among the months exists, with lowest in the month of April at 58,089 Mts and highest in the month of September at 1,07,712 Mts. The ratio of highest to lowest is almost 1:2. But in most of the months there is no significant variation and shows that uniform demand exists.
Monthly prices at whole sale level and retail level recorded can be seen at Table 3.9. the price data indicates that on an average the whole sale prices recorded are at about 63% of the retail prices. Maximum prices recorded are in Chennai market. Prices are related to the variety and quality and as the data recorded are with out break up of variety and quality, no analysis can be made from the data.
There is a need to improve the arrivals of banana produced to regulated markets and in order to achieve these regulated markets need to be strengthened with suitable infrastructure.

37 Feasibility Report for Setting-up Integrated Cold Chain for Banana in Tamil Nadu
Table 3.9: Table showing Month wise arrivals at all 31 markets in the year 2009
MONTH Total Arrivals in all Centres
in MT
Max Arrival in any
centre in MT
Max Av Whole
sale price in any
centre Rs/MT
Max Av Retail price in any
centre in Rs/MT
Average Whole
sale price of all
centres Rs/MT
Average retail price in all
centres Rs/MT
Average arrival Per
Centre
January 78616 15218 2178 2739 869 1399 2536February 76611 15580 2239 2896 910 1456 2471March 86198 16777 2204 2939 958 1507 2781April 58098 9670 1938 3295 989 1587 1874May 73414 16485 2074 3333 1033 1706 2368June 81853 18527 2435 3335 1014 1579 2640July 94374 19500 2957 3874 1107 1729 3044August 91170 19100 2204 3621 1123 1788 2941September 107712 17535 2283 3567 1181 1902 3475October 87929 14340 2226 3608 1151 1857 2836November 71745 14100 2237 3555 1097 1779 2314December 68791 9594 2195 3506 1112 1753 2219TOTAL 976511
Source: AGNET
The main markets and their collection and supply blocks in India are shown at Table 3.10. Thus in each of the important states like Tamil Nadu, Maharashtra, Andhra Pradesh, Madhya Pradesh, Karnataka, only 3 to 4 main markets are prevalent even though the production is more wide spread.
3.10: Main Markets and feeding blocks for Banana in India
States Market BlocksMaharashtra Jalgaon Chopda, Yaval, Raver, Edalbad, Bhusawal, Jamner, Pachora,
Bhadgaon, Chalisgaon, Parola, Amainer, BoradiDhule Shirpur, Sindhkheda, Sakri, Nardana, Boradi, SangviBuldhana Malkapur, Khamgaon, Mehekar, Chikhli
Tamil Nadu Thiruchirapalli Turaiyur, Thottiyam, Musiri, Manachanallur, Lalgudi, SrirangamCoimbatore Muttuppalaiyam, Avinashi, Tiruppur, Palladam, Udumallaip
pettai, Pollachi, ValparaiTheni Periyakulam, Andipatti, Uttammapalayam, Bodimayakkanur,
Kamban, Megamali, Vadugapatti

38 Confederation of Indian Industry
States Market BlocksMadhya Pradesh
Khandwa Harsud, Pandhana, Nepanagar, BurhanpurDhar Badnawar, Sardarpur, Gandhqwani, Manaawr, Kukshi,
DharmapuriBadwani Thikri, Rajpur, Newali, Pansemal, Sendwa
Andhra Pradesh Guntur Tangeda, Dachepalle, Piduguralla, Sattenapalie, Vinkoda, Ponnuru, Bapatia, Narasaraopet, Purti, Prattipadu, Pallapatla.
Vijayanagaram Parvatipuram, Bobblli, Gajapatinagaram, Chipurupalla, SalurPrakasham Erragondapalem, Markapur, Giddalur, Tarlupadu, Podile, Darsai,
Baulipali, ChundiGujarat Surat Mangrol, Umarwada, Mandvi, Vyara, Valod, Mahuva, Palsana,
Kamrej, Olpad, Nizer, Vadoli, UnalAnand Sojitra, Sarsa, Sunav, Undel, Lunej, Ras, Kantha, Morai, Vadtal,
Bochasan, Dhuwaean, Khambhat, Rohoni, WadgamKarnataka Uttar Kannad Maliyal, Mundgod, Yellapur, Sirsi, Siddapur, Bhatkal, Ankol
Udupi Kundapura, Kokkaroni, Karkal, Goligudelej, Chittur, Harmanu, Kokkaroni, Shivapura, Kodlamale, Yermal
In most of the places the trade follows the pattern as shown in Fig 3.3. The channel mainly consists of farmer, village level/Block level accumulator, Whole sale seller, Local resellers, Consumer. Some times, there could be more than one accumulator at block level and a semi wholesale distributor between reseller and whole sale seller. The channel is characterized by negligible or nil infrastructure, no value addition other than facilitation services and unscientific handling/logistics. The mark up is usually actual costs of handling, loss of produce in quantity/quality and profit margin. Since, the chain partner is able to pass on the loss of produce in quantity and quality at each level to next higher level or pass down to next lower level, all the burden of inefficiencies are carried by either farmers or consumers.
There are very few exceptions to this and these are in Bharuch in Gujarat, Jalgaon in Maharashtra, Theni in Tamil Nadu and few other places where export or retail revolution led infrastructure is created and available. The amount of Banana passing through such infrastructure will be less than 1% in quantity and 2% in value.
Fig 3.3: Banana Trade Channel

39 Feasibility Report for Setting-up Integrated Cold Chain for Banana in Tamil Nadu
3.3.3. Domestic Consumption:Average banana consumption as per NSS survey is shown in Figure 3.4. As can be seen the banana consumption varied at 2-3 nos per capita in Rural areas and 4-5 Nos per capita in Urban areas.
Fig 3.4: Per Capita Banana Consumption in 30 Days
Source: NSS Survey
Assuming that the consumption numbers are still holding well, the total market for banana in urban areas for population of 35 Crores at 50 nos per year is 1750 Crore numbers and in Rural areas for a population of 65 Crores at 27 Nos per year is 1755 Crore numbers. The demand is almost equal in both areas in terms of numbers. It may vary in terms of quantity to some extent and value to a large extent because of the unit sizes and unit values will be higher in urban areas.
Table 3.11: Per capita Consumer Expenditure on Fruits and Food in 30 days
Year URBAN RURALFruits Exp in
Rs in 30 Days
Total Food Exp in Rs in 30 days
Fruits & Nuts as %
of Total Exp
Food Exp as % of Total
Exp
Fruits Exp in
Rs in 30 Days
Total Food Exp in Rs in 30 days
Fruits & Nuts as % of
Total Exp
Food Exp as % of Total
Exp1987-88 6.27 139.73 2.51 55.91 2.57 100.82 1.63 63.771993-94 12.2 250.3 2.63 53.91 4.90 177.80 1.71 62.151999-00 20.68 410.84 2.42 48.06 8.36 288.80 1.72 59.402004-05 23.65 447.41 2.14 40.50 10.42 307.60 1.80 53.11

40 Confederation of Indian Industry
Year URBAN RURALFruits Exp in
Rs in 30 Days
Total Food Exp in Rs in 30 days
Fruits & Nuts as %
of Total Exp
Food Exp as % of Total
Exp
Fruits Exp in
Rs in 30 Days
Total Food Exp in Rs in 30 days
Fruits & Nuts as % of
Total Exp
Food Exp as % of Total
Exp2005-06 25.52 467.82 2.18 39.96 11.75 333.15 1.88 53.342006-07 28.00 517.25 2.13 39.41 12.47 363.42 1.79 52.282007-08 31.02 582.43 2.11 39.58 13.56 404.33 1.76 52.35
Source: NSS surveys
The trend in per capita consumer expenditures as per National Sample Surveys is shown at Table 3.11. While the share of expenditure on food is falling continuously both in rural areas and urban areas, the expenditure on fruits is increasing with in the food expenditure and maintaining its share in overall expenditure. This shows that the Banana market will increase at the same rate of growth in incomes and GDP in future.
With consumers becoming more demanding in terms of presentation, quality, the market for ��
banana in India will be a growing market requiring matching infrastructure to process and distribute with in the country.
3.4. Banana Trade in Tamil NaduBanana trade in Tamil Nadu is similar to all India situation in all aspects, be it trade channels, arrivals at markets, availability of the processing facilities etc.
The banana produced in Tamil Nadu is consumed substantially in the local areas and limited quantities get transported to other states such as Kerala, Karnataka and to a small extent to Andhra Pradesh. Mostly the production in southern districts of Tamil Nadu goes to Kerala; production from North western districts goes to Karnataka state.
The arrivals in markets are very less compared to the actual production. For example the arrivals reported in Theni market are as follows:
Table 3.10 Arrival Particulars of Banana in Theni Market (Source: Web site of TNAMB)
S.No. Particulars Quantity1 Production 70880 Mt2 Unit of measurement in market One Bunch3 Averege price per unit Rs 604 Arrivals
4.1 Max Arrivals per day 404.2 Min Arrival per day 04.2 Average per day 204.4 Arrivals in 2002-03 60,0004.5 Arrivals in 2003-04 500004.6 Arrivals in 2004-05 45000

41 Feasibility Report for Setting-up Integrated Cold Chain for Banana in Tamil Nadu
Similarly the banana growers associations (12 in Tamil Nadu) have formed a federation to link the banana production to the export market. The farmer associations are planning to brand the produce as TAN MANGO / TAN BANANA and market the same in the domestic and international markets (on the lines of Mahagrape and Mahabanana in Maharashtra)
According to the discussions with Banana traders in Koyambedu fruit market in Chennai, the Koyambedu market receives on an average 40 to 60 truckloads of banana fruit per day. This can go as high as 150-160 truckloads during festival seasons like Vijayadashmi and Pongal at worst 20-30 truck loads even in the lean/dry periods. Each truckload contains 450 to 500 bunches. The arrivals are from a specific region in specific months. For example more arrivals in September are seen from Cuddalore region, in October from Vellore region, in January from Tiruchi. The unloading and loading charges are at Rs.750 per truck.
Processing infrastructure available in Tamil Nadu is negligible. Only notable infrastructure available is Farm fresh unit in Theni district. There are also some multi produce pack houses in Tamil Nadu. Unlike in other states, setting up small ripening chambers at producing centers has not picked up in Tamil Nadu, in spite of having largest production in the country. In the banana processing sector, only 3-4% of the total production is processed. The banana processed products mainly consists of banana chips which is produced to a tune of over one lakh tons a year. Majority of the chips are produced from Nendran banana, however, Robusta and Monthan banana fruits are also being processed as chips to some extent. There are no units producing other banana products popular in the market such as banana puree and powder.
The main issues regarding lack of exports from the state are:
Lack of market intelligence��
Information of production estimates is required at a block and district level variety wise at a quarterly level.
Lack of a transparent price discovery mechanism��
The price discovery is very arbitrary and Electronic or mannual Auction markets exist at present.
Lack of adequate post harvest infrastructure��
There is inadequate post harvest infrastructure, especially pack houses, cold stores, refrigerated vans and market infrastructure

42 Confederation of Indian Industry
4 SWOT Analysis for TN Banana Business
Strength, weaknesses, opportunities and threats analysis is undertaken to understand the situation in Tamil Nadu so as to arrive at the required infrastructure and systems to develop the sector. In order to have more detailed analysis the banana sector SWOT analysis is undertaken at the following aspects:
Policy frame work��
Varieties��
Pre harvest practices��
Post harvest practices��
Infrastructure and ��
marketing aspects��
4.1. Strengths1. Well established Institutional network in Tamil Nadu: Presence of leading institutions like Tamil
Nadu agricultural University (TNAU), Tamil Nadu Horticulture Department, Tamil Nadu State Horticulture Mission and National Research Centre for Banana and other Institutions.
2. Central and State Government policies facilitating growth of the sector such as Micro Irrigation subsidies, Subsidies for Tissue culture seedlings, Crop Loans and other agriculture credit, regulated market yards etc. (TANFLORA, AEZs).
3. Tamil Nadu has one of the largest numbers of varieties being produced in the country. India being one of the centre of diversity and one of the hot spot for the wild Musa species and gives wide choices for farmers to grow.
4. Adequate supply of quality plantlets and seedlings both from Government and private sources
5. Favorable Agro climatic conditions to grow different varieties of banana.
6. Enthusiastic and progressive farmers and farming community well versed in farming techniques and receptive to the newer ideas and cultivation practices, improved or newer varieties.
43 Feasibility Report for Setting-up Integrated Cold Chain for Banana in Tamil Nadu
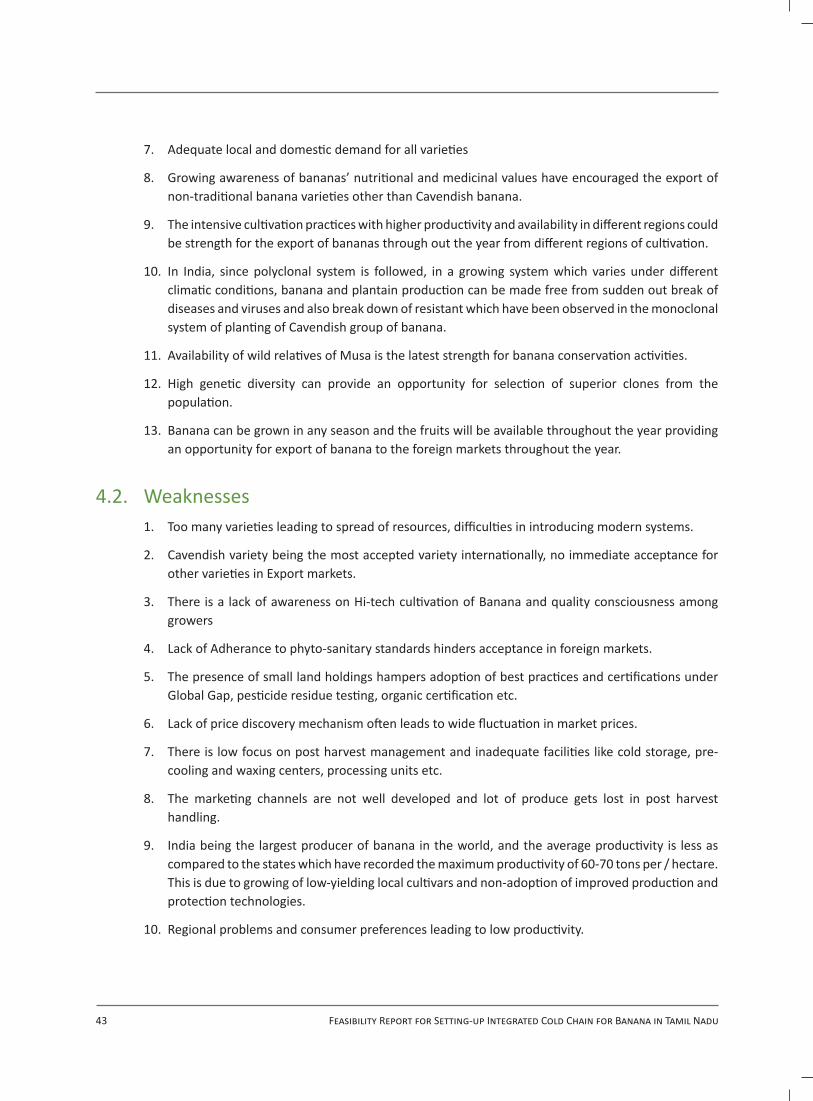
7. Adequate local and domestic demand for all varieties
8. Growing awareness of bananas’ nutritional and medicinal values have encouraged the export of non-traditional banana varieties other than Cavendish banana.
9. The intensive cultivation practices with higher productivity and availability in different regions could be strength for the export of bananas through out the year from different regions of cultivation.
10. In India, since polyclonal system is followed, in a growing system which varies under different climatic conditions, banana and plantain production can be made free from sudden out break of diseases and viruses and also break down of resistant which have been observed in the monoclonal system of planting of Cavendish group of banana.
11. Availability of wild relatives of Musa is the latest strength for banana conservation activities.
12. High genetic diversity can provide an opportunity for selection of superior clones from the population.
13. Banana can be grown in any season and the fruits will be available throughout the year providing an opportunity for export of banana to the foreign markets throughout the year.
4.2. Weaknesses1. Too many varieties leading to spread of resources, difficulties in introducing modern systems.
2. Cavendish variety being the most accepted variety internationally, no immediate acceptance for other varieties in Export markets.
3. There is a lack of awareness on Hi-tech cultivation of Banana and quality consciousness among growers
4. Lack of Adherance to phyto-sanitary standards hinders acceptance in foreign markets.
5. The presence of small land holdings hampers adoption of best practices and certifications under Global Gap, pesticide residue testing, organic certification etc.
6. Lack of price discovery mechanism often leads to wide fluctuation in market prices.
7. There is low focus on post harvest management and inadequate facilities like cold storage, pre-cooling and waxing centers, processing units etc.
8. The marketing channels are not well developed and lot of produce gets lost in post harvest handling.
9. India being the largest producer of banana in the world, and the average productivity is less as compared to the states which have recorded the maximum productivity of 60-70 tons per / hectare. This is due to growing of low-yielding local cultivars and non-adoption of improved production and protection technologies.
10. Regional problems and consumer preferences leading to low productivity.

44 Confederation of Indian Industry
11. Non availability of high yielding cultivars other than Cavendish group with resistance to wilt is one of the major constraints of production. In addition, biotic stresses like wilt and leaf spot diseases, nematode and viruses for the major threats in reducing the productivity and also sustainability.
12. No concerted efforts have been made to evolve improved varieties which are resistance to these biotic stresses so that the productivity can be improved with minimum cost.
13. The land holdings being small, the farmers could not adopt better post harvest handling methods so that these losses could be minimized.
14. Lack of infrastructure facilities like cold storage, reefer van facility for transportation and better marketing facilities required to minimize the losses.
15. Not having well developed banana marketing, resulting in farmers not getting remunerative prices during the glut seasons. The farmers are forced to sell at throw away prices due to its perishable nature and not having infrastructure to balance the peaks and lows of supply with peaks and lows of demand.
16. Development of value addition is one of the weak areas which need further strengthening and commercial exploitation.
17. Commodity specific markets are not available which is one of the weaknesses in the marketing links.
4.3. Opportunities1. Growing per capita incomes and changing production patterns of other main food crops like rice,
wheat is an opportunity to increase the production significantly
2. Changing consumer patterns by the upcoming retail chain stores is creating a premium segment that is willing to pay extra for quality, both physical and chemical.
3. Development of disease resistant varieties:
4. The field gene bank which could be further exploited in the breeding program.
5. Large tracts of dry lands / rain fed areas / waste lands can be utilized for promotion of horticulture.
6. Scope for removal of production constraints due to the varying production systems and cultivation of bananas from coastal region to hill region.
7. Availability of ethnic Indian population in many countries with ready market for non Cavendish varieties and ability of Tamil Nadu to produce different varieties of banana due to poly clonal cultivation.
8. Availability of business opportunity to create a niche market for a variety having huge differentiation to Cavendish variety in colour, size, taste and properties such as red Banana internationally similar to New Zealand efforts for Kiwi fruit.
9. Large potential to set up processing industries, specially that give value to the whole fruit and plantation like waste and discarded fruit based flour product.

45 Feasibility Report for Setting-up Integrated Cold Chain for Banana in Tamil Nadu
10. Strategic location to tap export opportunities to the Far East.
11. Well poised to capture the increasing demand in developed countries for Green foods/Organic foods as traditional low use of pesticides, fertilizers and traditional and non chemical methods of disease control and use of organic fertigation.
12. Exploiting the contract farming legal frame work to avoid uncertainties of market price besides getting right quality inputs.
13. After the WTO regime and opening up of the banana trade, there are enhanced opportunities for export of banana to UK and US markets due to cheap production cost and availability of organic bananas.
4.4. Threats1. High post harvest losses, estimated to be 20-30%. The resulting monetary loss is borne by the
farmers who are at bottom of pyramid.
2. Valuable genetic resources in the form of wild Musa species and other related species are being lost due to the de-forestation, Jhum cultivation and urbanization in the centre of diversity viz., North Eastern region.
3. Spreading of new virus diseases, insect pests, nematodes and diseases like Erwinia are becoming major threats in banana production due to the indiscriminate use of infected planting materials resulting in drastic reduction in productivity and has threatened the sustainability of banana cultivation in some areas.
4. Import of new varieties by the tissue culture companies without proper quarantine measures at the entry point may lead to introduction of new diseases, races and viruses to India which may threaten the cultivation of bananas and banana industry.
5. Inadequate extension efforts in transfer of the technology related to improved varieties, Cultivation practices, pre and post harvest practices etc.
6. Non-availability of work force for agriculture during season due to more attractive opportunities for work force from competing schemes like NREGA etc.
7. The dwindling water resources could pose a serious issue in the coming years especially as Banana requires large quantities of water.
8. Many farmers in non-traditional areas in North India especially in east Uttar Pradesh, Uttaranchal and Punjab started growing bananas as it is a short duration fruit crop and highly remunerative.
9. Farmers of Tamil Nadu coming under price and supply pressures in future from these newer areas, as they use only tissue culture plants in large quantity which is free from pests and diseases and viruses and the productivity of these plants are very high.
10. Lack of Industry led or export led institutional backing leading to non cohesive efforts in improving the efficiency of the sector.
11. Not having farmer centric focus but middlemen centric domination

46 Confederation of Indian Industry
5. Banana Cold Chain in Tamil Nadu: An Overview
5.1. Present ChainMost of the present production of banana in Tamil Nadu is going through the chain consisting of farmer, local aggregator/semi wholesaler, Wholesaler, Semi whole sale distributor, retailer, Consumer.
The present post harvest losses are 20-25% of the produce. The losses at each stage as a percentage of total losses are as follows:
Farm gate: 7-8%��
Farm gate to Wholesaler: 15 – 20%��
Transportation: 30-40%��
Retailer: 20-25%��
The major lacunae in the present system of handling are:
5.1.1. Poor Harvesting TechniqueHarvesting of banana in field is to be done carefully and in a systematic manner so that optimum quality is retained while keeping the costs low. The aspects to be taken care of while harvesting are stage of fruit development at the time of harvesting, tools used to cut the bunch, not placing on soil to avoid damage to lower fruits.
Harvesting is normally done in early morning hours between 5-7 am. Before harvesting it should be checked that fruits are fresh, clean, firm and free from observable disease, dirt, latex, malformations or other detracting characteristics. The age of the fruit varies should be between 11-13 weeks.
Bunch should be checked for grade and age combination, before harvesting. The stem for bunch to be harvested is identified by the cutter, the grade checking is undertaken by checking the middle finger on the outer whorl. The leaves running against the bunch is removed so as to avoid any mechanical injury. The cutter should make a shallow cut with a cut glass partially severing the pseudo stem at the upper section and should bring down the bunch to a suitable height. Another person should support

47 Feasibility Report for Setting-up Integrated Cold Chain for Banana in Tamil Nadu
the bunch on to his shoulder above foam beds so that fruits may not get damaged at the time of harvesting. Normally a single person brings the harvested bunch but two persons should support the bunch and bring it to the loading point or cableway.
5.1.2. Unhygienic Field HandlingHandling of the bunch after harvesting is to be done carefully. At present the handling is done in very crude manner often resulting in the injury or damage to the fruit.
Many a time the fruits are carried on baskets as shown in the picture below. But the fruit bunch should be carried on shoulder with sponge pack to avoid damage or carried by two person’s tying the top of bunch to a wooden pole or should be carried on cable way as is done by well developed farms.
The fruit bunches are put on open soils after cutting as shown in the figure before loading or waiting for loading. This will damage the fruit and bring down the value as damage will occur to those fruits touching the soil with physical damage as well as bacterial and fungal contamination. The most ideal position is to hang them on the stem with bottom not touching the floor.
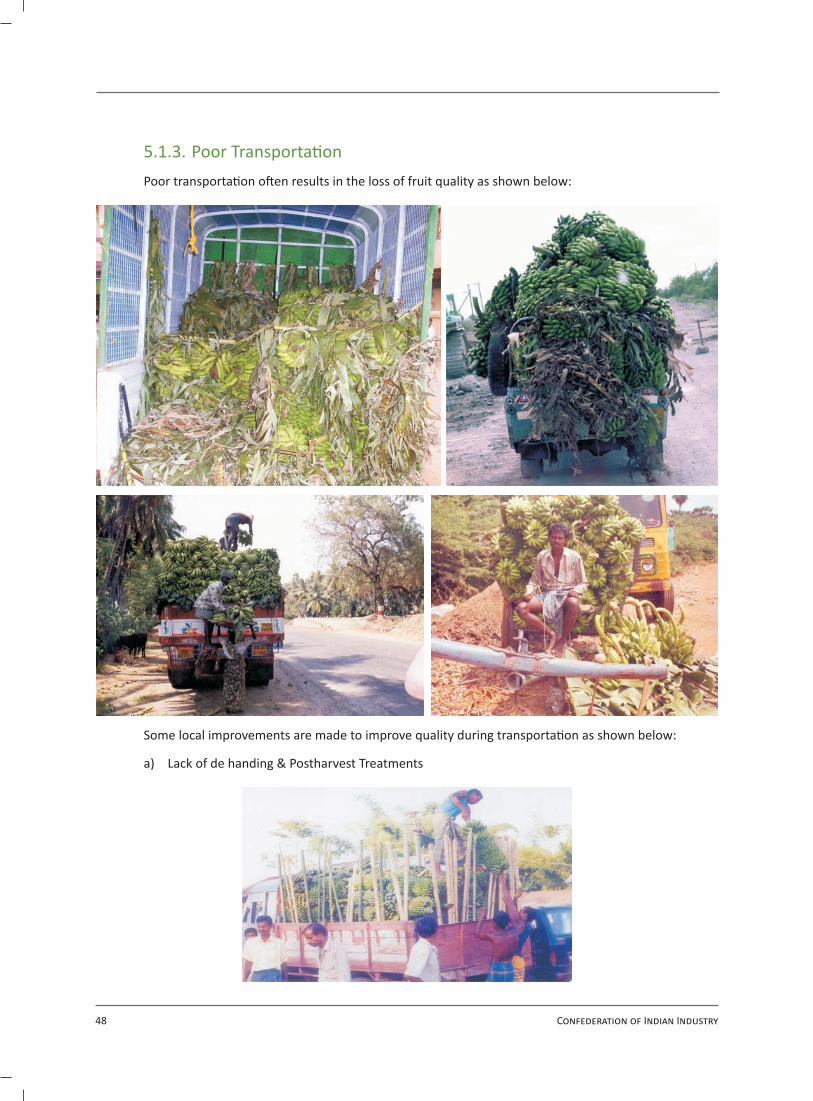
48 Confederation of Indian Industry
5.1.3. Poor TransportationPoor transportation often results in the loss of fruit quality as shown below:
Some local improvements are made to improve quality during transportation as shown below:
a) Lack of de handing & Postharvest Treatments
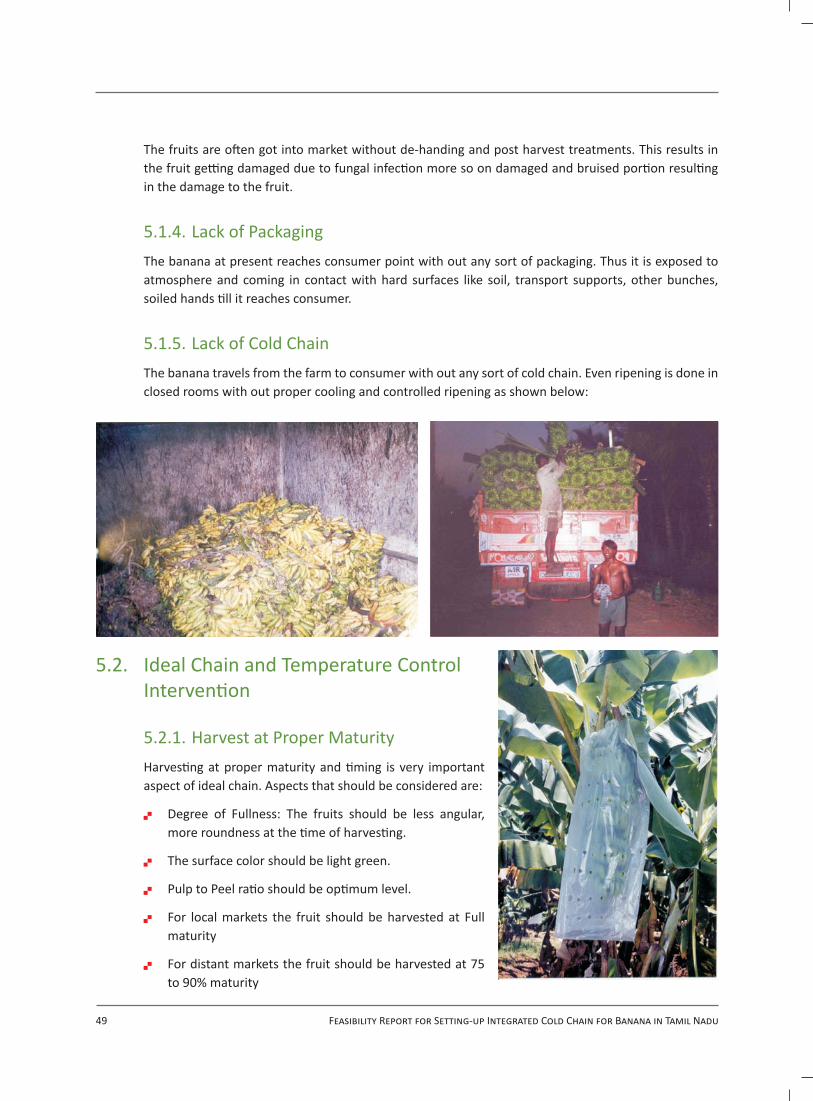
49 Feasibility Report for Setting-up Integrated Cold Chain for Banana in Tamil Nadu
The fruits are often got into market without de-handing and post harvest treatments. This results in the fruit getting damaged due to fungal infection more so on damaged and bruised portion resulting in the damage to the fruit.
5.1.4. Lack of PackagingThe banana at present reaches consumer point with out any sort of packaging. Thus it is exposed to atmosphere and coming in contact with hard surfaces like soil, transport supports, other bunches, soiled hands till it reaches consumer.
5.1.5. Lack of Cold ChainThe banana travels from the farm to consumer with out any sort of cold chain. Even ripening is done in closed rooms with out proper cooling and controlled ripening as shown below:
5.2. Ideal Chain and Temperature Control Intervention
5.2.1. Harvest at Proper MaturityHarvesting at proper maturity and timing is very important aspect of ideal chain. Aspects that should be considered are:
Degree of Fullness: The fruits should be less angular, ��
more roundness at the time of harvesting.
The surface color should be light green.��
Pulp to Peel ratio should be optimum level.��
For local markets the fruit should be harvested at Full ��
maturity
For distant markets the fruit should be harvested at 75 ��
to 90% maturity

50 Confederation of Indian Industry
Harvest at early hours to ensure the temperatures are low and the fruit is not exposed to high ��
temperatures.
The fruit bunch should be cut and handled with care ��
Adequate care should be taken in handling in the field after harvest ��
5.2.2. Conveying Carefully Without Causing Bruises and Damage Bunches from field are temporarily held in a shaded holding area till transport arrives. The banana bunch should be carried either on shoulder with sponge sheet or hanged from wooden pole perpendicularly for carrying up to transport vehicle. After that the bunches should be transported in small vehicles carefully to avoid damage to the fruit. Some of the local methods followed to ensure the fruit quality till it reaches the pack house is shown in the picture.
The sleeves covering bunches are removed during the holding period. Bunches or hands arriving in the collection center/Pack house must never be allowed to remain un-shaded and the time between reception and processing must be kept to a minimum. This is to prevent high pulp temperature and fruit dehydration.
Fruits should be checked for
Finger fullness or grade with a caliper and length with a tape.��
Blemished from leaf or finger rub or scarring, insect activity, pathogens, handling bruised and any ��
quality defect those not meeting the fresh quality norms are rejected.
5.2.3. Careful De-Handing, Washing, Postharvest Treatments with Fungicide and Drying of Surface Moisture
The de-handing of fruits can be done after or before treatment depending on convenience. If however, it is done after treatments before packing, then it is preferable to maintain hygiene and give one more treatment and drying before packing. Normally it is done before latex drainage and treatments to maintain hygiene. This should be done using a sharp, clean “banana” knife.
Next process is Latex drainage. The clusters are immersed in de-latexing tank containing clean flowing water for 10-15 minutes to allow further washing of excluding latex and also gradual decrease of field heat and temperature of the fruit. Alum is included in de-latexing tank, which acts as an antioxidant.
Bananas are treated to ensure that the quality is retained and no infection takes place. In this, the clusters of banana after removal of excess water are sprayed with fungicide. For fungicide treatment benzimidazzole is used. The crowns of the clusters should be properly sprayed with fungicide for at least 10 seconds.
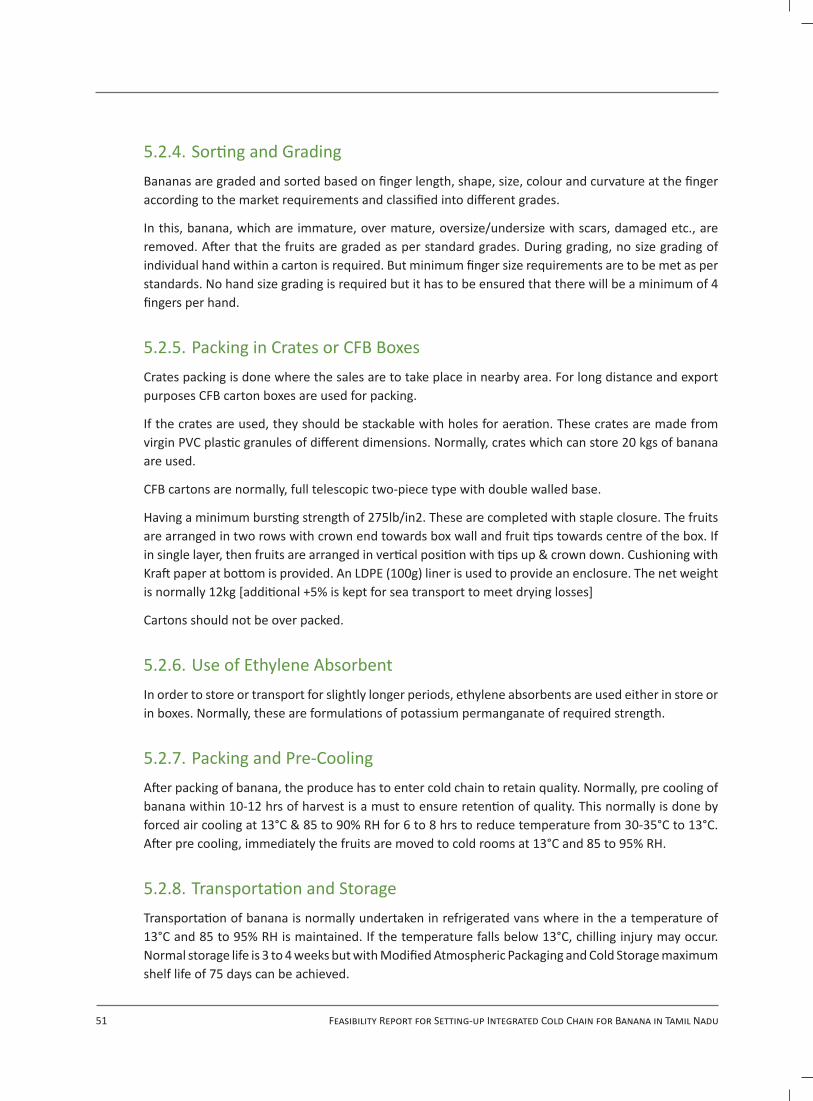
51 Feasibility Report for Setting-up Integrated Cold Chain for Banana in Tamil Nadu
5.2.4. Sorting and GradingBananas are graded and sorted based on finger length, shape, size, colour and curvature at the finger according to the market requirements and classified into different grades.
In this, banana, which are immature, over mature, oversize/undersize with scars, damaged etc., are removed. After that the fruits are graded as per standard grades. During grading, no size grading of individual hand within a carton is required. But minimum finger size requirements are to be met as per standards. No hand size grading is required but it has to be ensured that there will be a minimum of 4 fingers per hand.
5.2.5. Packing in Crates or CFB BoxesCrates packing is done where the sales are to take place in nearby area. For long distance and export purposes CFB carton boxes are used for packing.
If the crates are used, they should be stackable with holes for aeration. These crates are made from virgin PVC plastic granules of different dimensions. Normally, crates which can store 20 kgs of banana are used.
CFB cartons are normally, full telescopic two-piece type with double walled base.
Having a minimum bursting strength of 275lb/in2. These are completed with staple closure. The fruits are arranged in two rows with crown end towards box wall and fruit tips towards centre of the box. If in single layer, then fruits are arranged in vertical position with tips up & crown down. Cushioning with Kraft paper at bottom is provided. An LDPE (100g) liner is used to provide an enclosure. The net weight is normally 12kg [additional +5% is kept for sea transport to meet drying losses]
Cartons should not be over packed.
5.2.6. Use of Ethylene AbsorbentIn order to store or transport for slightly longer periods, ethylene absorbents are used either in store or in boxes. Normally, these are formulations of potassium permanganate of required strength.
5.2.7. Packing and Pre-CoolingAfter packing of banana, the produce has to enter cold chain to retain quality. Normally, pre cooling of banana within 10-12 hrs of harvest is a must to ensure retention of quality. This normally is done by forced air cooling at 13°C & 85 to 90% RH for 6 to 8 hrs to reduce temperature from 30-35°C to 13°C. After pre cooling, immediately the fruits are moved to cold rooms at 13°C and 85 to 95% RH.
5.2.8. Transportation and StorageTransportation of banana is normally undertaken in refrigerated vans where in the a temperature of 13°C and 85 to 95% RH is maintained. If the temperature falls below 13°C, chilling injury may occur. Normal storage life is 3 to 4 weeks but with Modified Atmospheric Packaging and Cold Storage maximum shelf life of 75 days can be achieved.
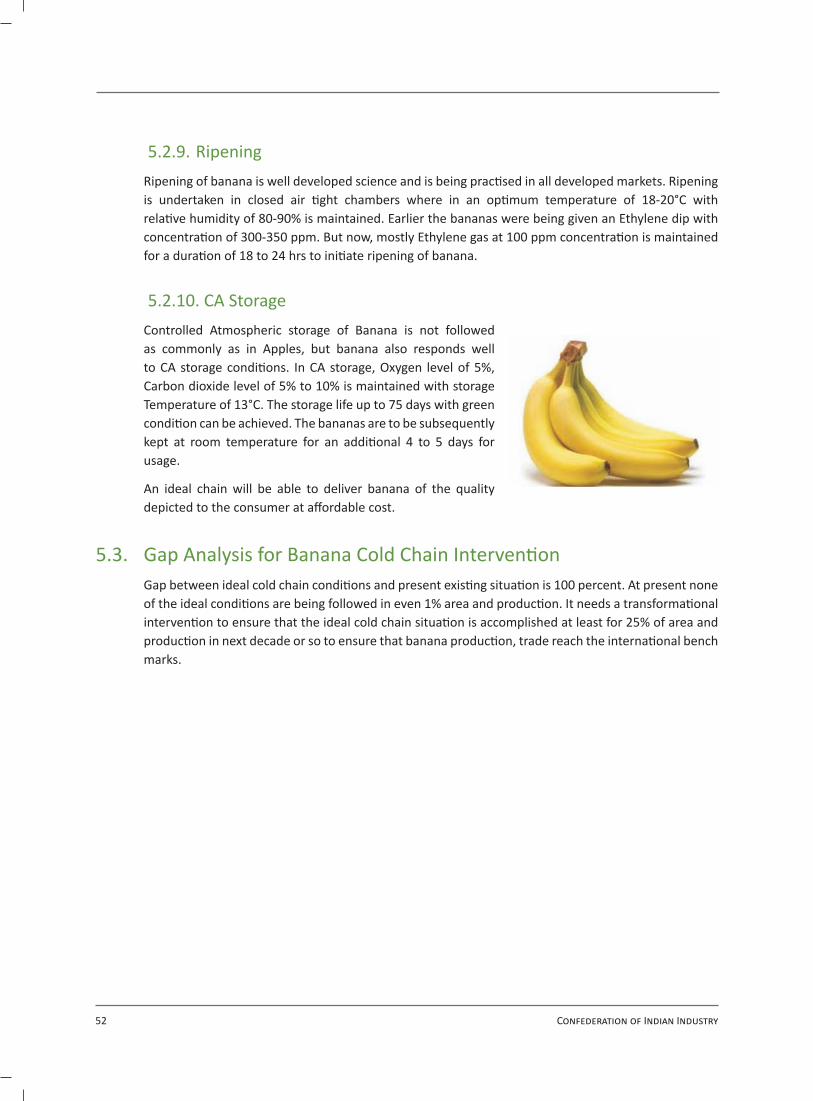
52 Confederation of Indian Industry
5.2.9. Ripening Ripening of banana is well developed science and is being practised in all developed markets. Ripening is undertaken in closed air tight chambers where in an optimum temperature of 18-20°C with relative humidity of 80-90% is maintained. Earlier the bananas were being given an Ethylene dip with concentration of 300-350 ppm. But now, mostly Ethylene gas at 100 ppm concentration is maintained for a duration of 18 to 24 hrs to initiate ripening of banana.
5.2.10. CA StorageControlled Atmospheric storage of Banana is not followed as commonly as in Apples, but banana also responds well to CA storage conditions. In CA storage, Oxygen level of 5%, Carbon dioxide level of 5% to 10% is maintained with storage Temperature of 13°C. The storage life up to 75 days with green condition can be achieved. The bananas are to be subsequently kept at room temperature for an additional 4 to 5 days for usage.
An ideal chain will be able to deliver banana of the quality depicted to the consumer at affordable cost.
5.3. Gap Analysis for Banana Cold Chain InterventionGap between ideal cold chain conditions and present existing situation is 100 percent. At present none of the ideal conditions are being followed in even 1% area and production. It needs a transformational intervention to ensure that the ideal cold chain situation is accomplished at least for 25% of area and production in next decade or so to ensure that banana production, trade reach the international bench marks.
53 Feasibility Report for Setting-up Integrated Cold Chain for Banana in Tamil Nadu
6. Project Report for Setting up of an Integrated Cold Chain for Banana in Tamil Nadu
6.1. ConceptCold chain initiatives are undertaken by CII to introduce demonstrable projects in India to act as catalyst in further development of cold chain projects.
Tamil Nadu state being the largest producer of Banana in India has been chosen to develop a demonstrable cold chain project on Banana trade.
Tamil Nadu has very high mix of banana varieties and many districts whose production will justify an integrated chain just to cover the district or even just a part of the district. The varietal variations are very high and the present project shall show it’s utility for not only internationally accepted varieties but even for local varieties also.
This project report does not include in its scope production related activities and marketing and branding expenses, even though they are very important because of the following reasons:
There are existing institutions and departments with related activities already.��
The gestation period is only one year unlike plantations or orchards.��
So only coordination is required and no infrastructural costs are required as part of the project.��
Marketing and Branding are critical to the last mile delivery yet fall under the private domain��
Accordingly, it was proposed to have a model to give fillip for development of banana cold chain in the state which meets the following criteria.
A project which has:
demonstration effect��
viable size��
scalable model��
the ability to be replicated��

54 Confederation of Indian Industry
6.2. ConfigurationA typical configuration for a well developed Banana process chain is as follows
The bananas will be collected from farms and brought to collection centers(CC). A minimal processing happens in the collection centers. Thereafter the bananas are shipped to the central pack house where more processing and shelf life extension is done. The details of processes in each of these centers is given below:
6.2.1. Collection Centers (CC)Collection centers are those places where produce is received from the farms, orchards or plantations to ensure that preliminary processing/treatment are undertaken.
The configuration of the collection centers depends on the distance from the central pack house.
Collection centers are necessary to:
Maintain the quality till it reaches a pack house��
Reduce transportation cost by removing the unwanted material transportation up to the pack ��
house.
Prepare the produce that meets the local and low end markets.��
It is proposed to have three types of collection centers:
1) Collection center covering farms located more than 75 KMs radius:
• These need to have additionally pre cooling facility besides reception docks,
2) Collection centre covering farms located in 25 to 50 KM radius:
3) Collection centre as part of Central pack House covering farms in less than 25 kms radius.
6.2.2. Central Pack House (CPH)A pack house is a place where products are brought after harvesting, to prepare them as per the market requirements in terms of washing, brushing, waxing, any other chemical treatment grading, packing, cooling, storage and transportation. Pack house has facilities for performing these functions in such a manner that products are prepared with utmost care and perfection to avoid injury or bruising of the products. At this place, value addition is done without modifying the ultimate shape and utility of the product. Not only is the cosmetic appearance of the produce enhanced considerably, but also packaging is done which is safe for the produce to be transported over long distance and to attract the consumer. Packaging also helps in branding the commodity, which gives long term benefits.

55 Feasibility Report for Setting-up Integrated Cold Chain for Banana in Tamil Nadu
6.3. Technical Aspects
6.3.1. Capacity of the PlantThe capacity of the cold chain unit is an important aspect in developing the model for Banana Cold Chain unit. In India, the important districts growing banana has a production of about 2 lakh to 5 lakh tons per year. The proposed units are being developed not only for High value and export markets but should also cater to the domestic consumers of medium to high price market and local markets. The local markets will be covered with supply of treated Banana bunches and crates as against the high end markets which will be supplied in CFB boxes in reefer vans and containers. The ratio will be initially 1/3rd to 2/3rd and will gradually reach 50:50. Keeping all these factors the capacity for an acceptable pilot is 1,00,000 Mts per annum. The break up of capacity at various places is as follows:
a. Central Pack House: 400 Mts/Day
b. Collection centers 3 Nos: each of 200 Mts/Day.
Since collection centers are of 200 Mts per day and are expected to operate 200 days in a year and for all three centers put together, the annual capacity is 1,20,000 Mts (200 Mtx200 Daysx3Nos). Assuming that about 10% losses will be there, the actual quantity will be 1,10,000 Mts and at an average 90% capacity they will be able to handle 1,00,000 Mts per annum comfortably.
6.3.2. Location, Site and LandThe location of the plant is tentatively decided as Tiruchurapally subject to further discussions with Tamil Nadu Government, and implementing authorities.
Actual site is to be identified by the project implementing authorities in the location suggested.
Actual land requirement for the proposed capacity is 5 acres for the Central pack house cum collection centre and for each collection centre 3 acres. The land requirement for the central pack house has been kept at bare minimum assuming that it will be near major city and cost will be high and similarly, the collection centre requirement has been projected bit liberally assuming that cost of land will be lower in interior areas.
6.3.3. Collection Centers:Collection centers are the intermediate places between the farms and the pack house. The main purpose of the collection centers are:
1. To provide a convenient delivery center to the farmers.
2. To reduce the time lag between the farm and the first process required to improve quality.
3. To avoid unnecessary produce travel to the main pack house.
4. To supply to the local and those markets that requires only minimal processing.
5. To provide economies of scale at main processing centers such as pack houses.

56 Confederation of Indian Industry
Keeping above factors in mind the collection centers are classified based on the distance from the Central Pack house and their infrastructure decided accordingly. For example the Collection centers with more than 75 Kms distance have been provided with Pre cooler as well as Water cooling system. While units with in 25-75 Km distance are provided only with Water cooling system and those with in 25 Kms distance and normally part of Pack house are not provided any as they will be using the Pack house infrastructure. An area of 750 Sq Mtrs is felt to be sufficient for all locating all the facilities.
In our present system, the collection centers are also proposed to have cable wires, basic treatments in bunches and working tables to ensure that they are prepared for domestic markets from collection centers itself directly.
6.3.4. Central Pack HouseA Central pack house is a place where products are brought after harvesting, to prepare them as per the market requirements in terms of washing, brushing, waxing, any other chemical treatment grading, packing, cooling, storage and transportation. Central pack house has facilities for performing these functions in such a manner that products are prepared with utmost care and perfection to avoid injury or bruising of the products. At this place, value addition is done without modifying the ultimate shape and utility of the product. Not only is the cosmetic appearance of the produce enhanced considerably. Similarly, packaging is also done which is safe for the produce to be transported over long distance and to attract the consumer. Packaging also helps in branding the commodity, which gives long term benefits.
6.3.5. Operations Performed in Central Pack HouseThe major operations to be performed are receipt from nearby farms in form of bunches inspection, delatexing, washing & application of fungicide and dispatch to central pack house in an insulated truck. The bunches are first cut into smaller clusters (8-10 hands), cleaned and washed with water, after which the delatexing is done followed by fungicide application and transport to the central pack house through insulated trucks. The details of the operation to be performed are given below.
6.4 Work and Capacity FlowThe flow diagram in figure 6.1 illustrates the workflow process of the six lakh tones (post harvest management practices for banana).
There are three broad streams through which the produce flows and the flow chart shows the flow in percentages.
All produce is expected to go through the management practices. Most of the stages of processing are common with deviation suited for different market segments and realization. However, not all of the produce is expected to go through cold storage.
The management practices that all the produce goes through
a. inspection
b. deflowering

57 Feasibility Report for Setting-up Integrated Cold Chain for Banana in Tamil Nadu
c. chilled water cooling
d. de-latexing
e. chemical treatment
f. sorting and grading
Figure 6.1: Process flow diagram of the proposed system
The process requirement of banana is determined by the markets where the Banana is expected to be sold. This is because markets determine the affordability vis-à-vis quality/size/taste. The process steps decide the cost of Banana with reference to meeting the market requirements in terms of Quality/size/taste.

58 Confederation of Indian Industry
The expected markets are:
I. Local markets within the catchment area or less than 75km.
II. Short distance markets which are less than 200km including budget consumers in nearby metro markets like Chennai, Bengaluru.
III. Premium segments in Short distance market
IV. Premium segments which are long distance and even markets to countries where ethnic migrants exist or can compete on quality/cost with present competition.
Table 6.1: Work Flow and Tonnage Expected of 6,00,000mt Infrastructure
1 Type Markets each module covers and caters to
Local Direct Consumption
Short Distance Direct Consumption
Short Distance Premium Segment
Long distance Premium Segment and Export
1.1 Produce sold as Bunches Dehanded and in crates
Dehanded and in cartons
Dehanded and in cartons but export specifications
2 Processes that are required to meet the market requirements
Fill indicates that Banana will undergo through the process described
2.1 Harvest-pack house in bunches2.2 Inspection deflowering2.3 Dehanding2.4 Direct Bunches2.5 Delatexing2.6 Chemical treatment2.7 Chilled water treatment2.8 Grading and Sorting2.9 Packing2.1O Cold storage2.11 Cold dispatch2.12 Ripening2.13 CA Store3 Qty expected out of total one
lakh to reach the market in %40% 30% 20% 10%
4 Actual Qty at full capacity of 100000by in Tons
240000 180000 120000 60000
As can be seen in the table 6.1, 40% of the produce is processed as full bunch received from harvesting while majority i.e. 60% is de-handed and processed as above and then sent through appropriate packing. Out of the 60% de-handed and processed produce in packs, it is expected that nearly half will go through normal transport to short distance premium segment and the balance half would require

59 Feasibility Report for Setting-up Integrated Cold Chain for Banana in Tamil Nadu
cold storage as they are sent to short distance premium segment and long distance markets. All the packed product goes through pre-cooling and cold storage, controlled atmosphere storing (if required), and dispatched through appropriate route. Long distance premium produce is normally dispatched through cold containers.
The Table 6.2 gives the percentage of produce that will be processed at any given stage. Since 40% would be directly dispatched to market only 60% goes through de-handing and subsequently only 60% goes through grading and sorting. A nominal amount, less than 5%, of direct bunches is stored in cold storage but around 20% is expected to be dispatched in cold-refer vans to the local markets to preserve the quality. Hence cold dispatch is around 50% of the total produce, both bunches and de-handed. Around 40% of the total produce is expected to go through some kind of ripening process. All the produce i.e. both bunches and de-handed will go through rest of the treatment process.
Table 6.2: Process Wise Division of 6,00,000 MT
Process Quantity /Year MTHarvest to-Pack House/collection center transportation
6,00,000
Inspection-Deflowering 6,00,000De-latexing 6,00,000Chemical Treatment 6,00,000Chilled water-Treatment 6,00,000De-handing 3,60,000Grading and Sorting 3,60,000Packing 3,60,000Cold Storage (Till dispatch) 1,80,000CA Store 30,000Cold Dispatch 300,000Ripening 2,40,000
These quantities are taken as basis for arriving the operational cost in financial projections.
6.4.1. InspectionBunches from field are temporarily held in a shaded holding area. Bunches should then be carefully brought and hung on rather than being dumped on floor to avoid injury. The sleeves covering bunches are removed during the holding period. Fruits should be checked for
Finger fullness or grade with a caliper and length with a tape.��
Blemished from leaf or finger rub or scarring insect activity, pathogens, handling bruised and ��
any quality defect those not meeting the fresh quality norms are rejected.

60 Confederation of Indian Industry
6.4.2. DelatexingThe clusters are immersed in delatexing tank containing clean flowing water for 10-15 minutes to allow further washing of excluding latex and also gradual decrease of field heat and temperature of the fruit. Alum is included in delatexing tank, which acts as and antioxidant.
The clusters of banana after removal of excess water are sprayed with fungicide. For fungicide treatment benzimidazzole is used. The crowns of the clusters should be properly sprayed with fungicide for at least 10 seconds
Banana are graded and sorted based on finger length, shape, size, colour and curvature at the finger according to the market requirements and classified into different grades as indicated in previous chapter.
6.4.3. Quality Checking and WeighingBunches of banana after inspection are weighed on a scale before labeling. The weight and carton size would depend upon the requirement in a particular market
6.4.4. LabelingThe scalloped trays with the clusters are moved on rollers by conveyers or pushed manually to an area where fruits are labeled manually.
Labeling is necessary to identify fruits in the market and also secure customer loyalty.
6.4.5. Packing in PolybagThe bananas are packed in a polythene bag, which helps in the protection and also helps in delaying the ripening. The bag is checked for tears and faulty seams and clusters of banana are put in it. In fact it is better to put the bag in carton and then put bananas. This helps in avoiding injury to the bananas as banana can be arranged as per the shape of the cartons.
6.4.6. De VaccumingThe air in the bag is removed through normal vacuum machines. This step is very important as it helps in checking the respiration by banana thereby controlling ripening and weight loss. After vacuuming, the bag is closed tightly by a clip or can be sealed by other means.
6.4.7. Packing in CartonsAfter devaccuming polybags are packed in the cartons. The cartons are closed by adhesive tape. Markings for Batch no. etc can be done. The cartons can be strapped, if required depending upon its weight and design
6.4.8. Storage in a Cold RoomThe banana after packing in a cold room between 12- 15 C and humidity of 85-90% can be stored in a cold room for a period of 8-10 days.

61 Feasibility Report for Setting-up Integrated Cold Chain for Banana in Tamil Nadu
6.4.9. Dispatch Through Reefer ContainersPacked boxes are taken out with the help of conveyor belts or trollies to a loading bay. At the loading bay boxes are palletized if required. Packed or palletized boxes are loaded in a reefer container where the storage temperature is maintained between 12-15 C.
6.5 Extent of Intervention & Initial Size of ProjectCold chain infrastructure is very modular and as such capacities are flexible and incrementally scalable. However the logistics and transport cost demand a certain critical volume for viability. The third factor on size is that farmers accept a technology based on certain minimum investment in other words size of investment becomes a proxy for commitment of investor. Hence too many fragmented capacities are not advisable. It also needs to be seen in physical form on a regular basis hence a single unit covering too large area is also not advisable. Hence there should be a balance between economies of scale and distributed network.
Hence, the study proposes to have optimal module size which will be large enough to make an impact but small enough to be taken up conveniently. Each module will have One central pack house, a local pack house/collection centre, whose infrastructure varies depending on the distance from the central pack house and supporting infrastructure like refrigerated vans and other supporting systems.
Each module can cover a zone of banana producing area with a production size of about 6 lakh tones with collection centre’s as close to the farmer as possible and local-pack houses as first level of aggregation and Central Pack house with cold storage and Controlled atmosphere stores as second level aggregation with reefer vans to support transport.
After analyzing the geographical distribution of production in the state we recommend grouping into 6 zones as follows and establishing a unit in each zone as shown below:
District wise break-up of Zones with Suggested FacilityDistrict Name Acreage
in HAProduction
in MTProductivity Zonal
ProductionFacility
Zone 1 1 Erode 10986 623763 56.78 CPH+CC*Erode 20 Dharmapuri 1432 64011 44.7 CC
16 Salem 3630 161363 44.45 CCSub-Total 849137Zone 2 2 Coimbatore 9805 487742 49.74 CPH+CCCoimbatore 23 The Niligiris 917 40763 44.45 CC
14 Dindigul 4846 164240 33.89 CCSub-Total 692745Zone 3 3 Thoothukudi 9849 482959 49.04 CPH+CCT Kudi 6 Thirunelveli 9519 299114 31.4 CC
7 Kanyakumari 6149 273338 44.45 CCSub-Total 1055411

62 Confederation of Indian Industry
District wise break-up of Zones with Suggested FacilityDistrict Name Acreage
in HAProduction
in MTProductivity Zonal
ProductionFacility
Zone 4 4 Theni 4846 432852 89.3 CPH+CCTheni 24 Viridhunagar 863 38363 44.45
17 Madurai 2680 134413 50.15 CC29 Ramanathapuram 384 17070 44.45 CC
Sub-Total 622698Zone 5 5 Thiruchirapalli 8465 308928 36.49 CPH+CCTiruchy 8 Karur 5304 235245 44.35 CC
10 Tirupur 3939 195942 49.74 CC13 Pudukottai 3617 165895 45.8612 Thanjavur 4179 183830 43.9915 Cuddalore 4308 164032 38.0818 Namakkai 2705 120244 44.45
Sub-Total 1374116Zone 6 9 Thiruvannamalai 3147 232515 73.88 CPH+CCThiruvanmalai 22 Thiruvallur 1340 59566 44.45
11 Vellore 6918 192238 27.79 CC31 Kancheepuram 276 12269 44.4521 Villupuram 1348 59922 44.4519 Krishnagiri 2251 100063 44.45 CC
Sub-Total 656573
* CPH (Central Processing House) CC (Collection Center)
6.5.1. Infrastructure Facilities Required for the Above Project. This Super Project Comprises of Six Zones as Given Above.
Based on the above, the Infrastructure facilities required for the cold chain are estimated as follows for all the 6 zones put together:
S.No. Facility/Infrastructure Details Qty1 Civil Works1.1 Collection Center: (Three
acre area)- 750 Sq Mtrs.
These CCs are independently located in the zones as mentioned in table 6.5
Geo Technical investigation, Contour survey, site preparation, Designing and construction of Collection centre of 750 sq Mtrs area for reception, cleaning, cutting, packing, finished goods store, dispatch dock including Compound wall, security gate,, bore well, water tank, toilets, plumbing complete in all respects with loading, unloading block either PEB/Proflex/RCC
12 Nos

63 Feasibility Report for Setting-up Integrated Cold Chain for Banana in Tamil Nadu
S.No. Facility/Infrastructure Details Qty1.2 Central Pack House with
Collection center
(5 Acre site)
These CPH will also have one collection center within their premises and will use the CPH facilities for minimal processing
Geo Technical investigation, Contour survey, site preparation, Designing of Collection centre of about 2,750 sq Mtrs area including Compound wall, security gate,, Administrative block, rest house of 100 Sq Mtrs, toilets, internal roads, complete in all respects with loading, unloading block PEB/Proflex/RCC
6 Nos
2 Refrgeration SectionCentral Pack House
2.1 Pre cooler 10 Mts capacity 12 Nos2.2 Cold stores 300 Mt Capacity 6No
150 Mt Capacity 12No2.3 CA store 50 Mt Capacity 6 No2.4 Ripening Chamber 10 Mt Capacity including Ethylene gassing and
controlling system, Gas tight PUF panelling, Gas tight sliding door, Humidification system, Air evacuation system
48 Nos
2.5 Air conditioning Pack house area of 750 Sq MtrsCollection Centre - (Beyond 75 Kms to Central Pack House)
16 No
2.4 Chilled Water Generation System
5000 Ltrs Per Hour 6 No
2.5 Pre cooler 5 Mts Capacity 6 No2.6 Cold Store 20 Mts capacity 6 No
Including, Collection Centre (With in 75 Kms to Pack House)
6 No
2.7 Chilled Water Generation system
5000 Ltrs per hour 6 No
3 EquipmentPack House
3.1 Over head Conveyor Carrying system capable of carrying Crate or Bunch with automatic stoppage in the treatment tanks
1200 Mtrs length for Bunches, 200 Mtrs for Crates
3.2 Cutting tables3.3 Packing tables 4’X6’ stainless steel 36 Nos

64 Confederation of Indian Industry
S.No. Facility/Infrastructure Details Qty3.4 Trolleys For internal transportation of Banana each
capable of taking 100-150 Kgs120 Nos including requirement for collection centres
3.5 Fork lift truck 6 No3.6 Pallets 6000 Nos 3.7 Crates 60000 Nos4 Electrical4.1 HT Pole and related cables4.2 Generators 200 KVA 1 No, 75 KVA 1 No, 25 KVA 1 No.4.3 Internal Lighting with
fixtures 4.4 Exhaust fans, ceiling fans,
swithches, internal Cabling4.5 Lightening arrestors4.6 PCC4.6 MCC panels5 Water System5.1 Borewells At Pack House (2), Collection centres (1 each) 24 Nos5.1 Water tank One tank in RCC 1,00,000 Ltrs capacity at Pack
House, 25,000 Ltrs each at Collection centres5.2 Water pipelines Quantum
sufficient5.3 Water filtration system, with
treatmentAt Pack house for re-utilization as well as treatment of bore water if required
6 No
6 Miscellaneous Assets6.1 Office equipment Five computers with printers, fax, telephones,
office furniture both at Pack house and collection centers
6 lot
6.2 VehiclesOffice vehicles Scorpio or any MUV/SUV 6 NoRefrigerated vans 12 Nos
6.3 Laboratory equipment Brix meter etc.
This infrastructure is subject to detail engineering to be undertaken as part of project management consultancy services and based on the discussions with project implementation authority at the time of project implementation.
65 Feasibility Report for Setting-up Integrated Cold Chain for Banana in Tamil Nadu
6.4. Operating and Management of Cold Chain and Pack HouseIt is recommended that the pack house should be established by T.N. Government and/or Public Undertaking of T.N.Government, preferably T.N.Agriculture Marketing Board. The funding pattern suggested is with 50% subsidy from MoFPI, Govt of India and balance from the RKVY funds, T.N.Government, Term Loan.
The central Pack house should be operated as a common facility for the Farmers, farmer associations, domestic traders and exporters of Banana. The unit would be owned by TNAMB(Tamil Nadu Agriculture Marketing Board).
There are different options available for managing the pack house like:
Own management of Cold chain and Pack house by TNAMB through a team of professionals hired ��
specially for the project.
With marketing of facility and service completely by the management.��
To have an anchor user.��
To give Operation and Management to third party on revenue sharing basis��
On guaranteed fixed revenue share basis irrespective of actual usage��
On actual revenue share basis��
Leasing out the facility to a third party service provider.��
Leasing out the facility to the association of Banana cooperatives of the area preferably the ones ��
owning the collection centers.
It must be kept in mind that, in any of the above options, care must be taken to ensure that
1. the unit is run as a common facility
2. Farmers to be given preference
3. It should be available for training, exposure visits
4. Service charges should be reasonable.

66 Confederation of Indian Industry
7. Project Cost and Financial Analysis
It is suggested that cold chain project can be taken up in modules covering one or more districts as explained in previous chapter.
Each module is designed keeping an average catchment area producing 4.00 lakh MT of Banana per year; which is considered a viable quantity. This viable catchment area also coincides with a district in most part of the Tamil Nadu state.
7.1 Capacity of the System ProposedIn spite of the apparent benefits, introduction of new system along with required infrastructure will not lead to a situation, where everyone will follow the system in the immediate future. Any new system being introduced will not be in a vacuum but into a current system, which is already operating and giving margins to all the key players in the supply chain. Thus new system will require a certain time to become fully operational and stabilize before it can reach the peak benefit.
It is expected that, progressive traders, who take a long term view, and those who look at better realization through quality and new markets; would opt for this system before others join.
The project infrastructure is designed initially to handle/receive/process 6,00,000 MT of Banana.
The suggested module will have the following infrastructure:
Six central Pack Houses with cold storage capacity of 300-450 MT per Each CPH��
Additional collection centre for every 75 km distance from the central pack house.��
All direct and especially indirect cost estimation are based on the throughput of 6,00,000 MT/Annum quantity and related infrastructure created.
This capacity can be later expanded with incremental investment.
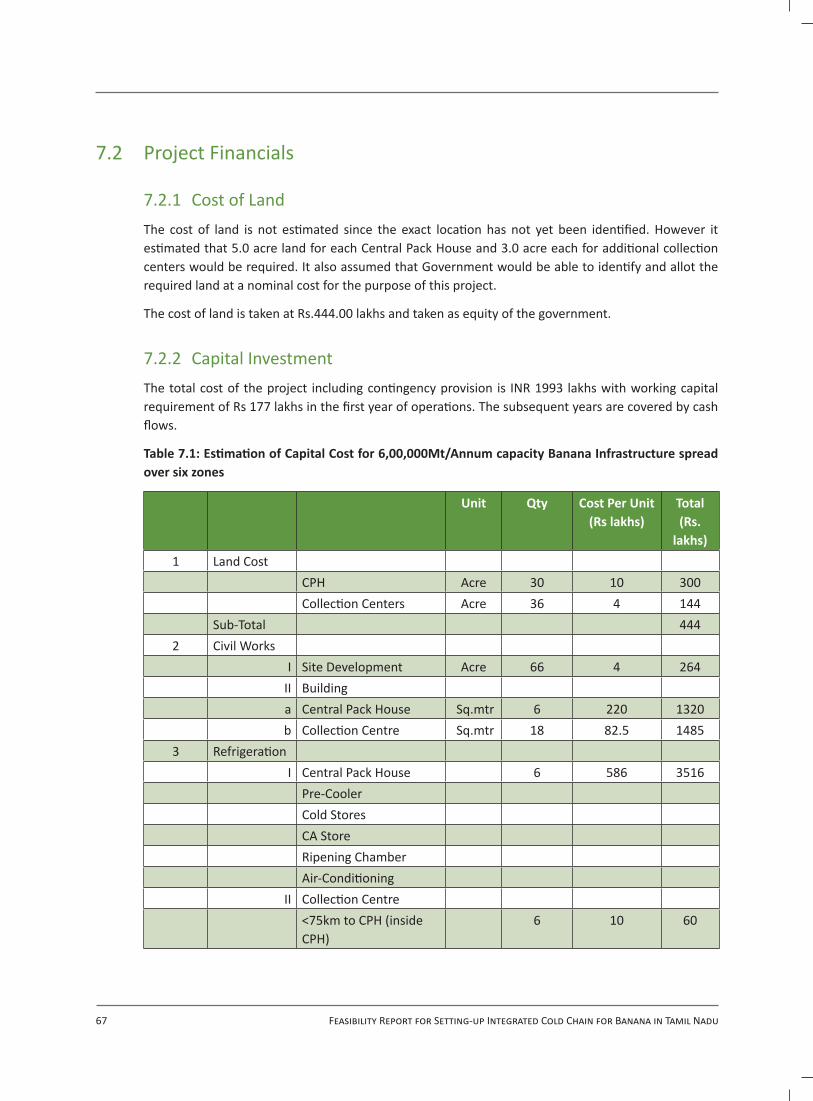
67 Feasibility Report for Setting-up Integrated Cold Chain for Banana in Tamil Nadu
7.2 Project Financials
7.2.1 Cost of LandThe cost of land is not estimated since the exact location has not yet been identified. However it estimated that 5.0 acre land for each Central Pack House and 3.0 acre each for additional collection centers would be required. It also assumed that Government would be able to identify and allot the required land at a nominal cost for the purpose of this project.
The cost of land is taken at Rs.444.00 lakhs and taken as equity of the government.
7.2.2 Capital InvestmentThe total cost of the project including contingency provision is INR 1993 lakhs with working capital requirement of Rs 177 lakhs in the first year of operations. The subsequent years are covered by cash flows.
Table 7.1: Estimation of Capital Cost for 6,00,000Mt/Annum capacity Banana Infrastructure spread over six zones
Unit Qty Cost Per Unit (Rs lakhs)
Total (Rs.
lakhs)1 Land Cost
CPH Acre 30 10 300Collection Centers Acre 36 4 144
Sub-Total 4442 Civil Works
I Site Development Acre 66 4 264II Buildinga Central Pack House Sq.mtr 6 220 1320b Collection Centre Sq.mtr 18 82.5 1485
3 RefrigerationI Central Pack House 6 586 3516
Pre-CoolerCold StoresCA StoreRipening ChamberAir-Conditioning
II Collection Centre<75km to CPH (inside CPH)
6 10 60

68 Confederation of Indian Industry
Unit Qty Cost Per Unit (Rs lakhs)
Total (Rs.
lakhs) chilled water generation
system
>75km to CPH 12 37 444 chilled water generation
system
Pre-Cooler Cold Stores 4 Equipment CPH 6 181 1086 OH Conveyor Cutting tables Packing tables Trolleys Fork lift Truck Pallets Crates dock leveller
(3no * 10lakh)
5 Electrical 6 129 774 HT Pole Cables Generators Internal lighting fixtures FANS Misc 6 Water
Systems 12 62 744
Borewells Water Tank Water Pipeline Filteration Syetm 7 Micellaneous
Assets 6 94 564
I Office Equipment II Vehicles Office Cars III Laboratory Equipment 8 Pre-op Expenditure
capitalized 60

69 Feasibility Report for Setting-up Integrated Cold Chain for Banana in Tamil Nadu
Unit Qty Cost Per Unit (Rs lakhs)
Total (Rs.
lakhs)9 PMC 300
10 Expenses during construction
120
Sub-Total 1118111 security deposit 12012 margin money for term
loan 138
13 contingencies 516Total 11955
The detailed explanation regarding the infrastructure is discussed in technical aspects.
7.2.3 Working CapitalThe project’s working capital is projected only for operational cost as service fee model is assumed for revenue. The same is shown at Figure 7.2. If the project has to purchase banana, the working capital requirement will increase substantially but corresponding return would come in terms of additional returns which will include finance cost, speculative gain from fluctuations in prices. This additional income will be more than sufficient to compensate the cost of funds.
Figure 7.2: Estimation of Annual Working Capital for all modules with 6,00,000Mt/annum Banana Infrastructure
Item of Operating Cost Duration in months Amount(in INR lakhs)
Salary and wages 6 477Electricity & utilities 6 72Chemical Consumables 6 202admin costs 6 309Total 1060
7.3 Source and Means of FundsIt is expected that government will be the driver of the pilot and the source of funds is suggested accordingly. It is also expected that state Government would utilize all the available schemes of central and State Government to reduce the debt burden. There are existing schemes of MOFPI and RKVY and it is assumed that this project will be taken under these schemes and relevant grants are obtained. The government may choose to go for PPP model without changing the structure significantly to ensure that Private capital as well as professional management is brought to the project.
The suggested mode of finance is indicated in table 7.3.

70 Confederation of Indian Industry
Table 7.3: Means of Finance for all Modules with 6,00,000 MT/Annum Banana Processing Infrastructure
Source of Finance Rs Lakhs Rs Lakhs1 Share CapitalA T.N.Govt undertaking/Under PPP by Private Promoter 2306B T.N.Government- Land cost 444
27502 GrantsA MOFPI @ 40% 5501B RKVY Funds 954
64553 Term Loans 2750
Total 11955Debt Equity Ratio 1.00:1.00
The cost of land has been converted into equity of the government.
There is a term loan from a regular bank of Rs.2750 lakhs which is repaid over 8 years with an interest moratorium in the first year. This is necessary for bank appraisal of project and would help if the allotment of grant is back ended.
7.4 Revenue EstimationRevenue estimation has been projected with infrastructure to handle 6,00,000 Mt of banana per annum.
The revenue estimation and all subsequent financials assume that the operations are under taken on service charge mode with a small economic profit to account for any unforeseen events. The charges are paid by the users on actual basis and no credit is assumed. This also does not assume any price arbitrage benefit i.e. it does not act either as a buyer or seller.
However there is a huge advantage if this could be operated by one of the players at either end of the supply chain i.e. either banana farmers as a co-operative or ‘anchor user’ such as fresh retail chain, as they could reap the benefit of price arbitrage also.
The optimal charge or fee keeping the long term sustainability of the initiative is Rs 2550 per ton of produce at the estimated traffic. The quantity of produce and the benefit accruing from this unit will guarantee the expected load factor.
The total revenue estimated in the third year when the operations stabilize is estimated Rs 15300 Lakhs as can be seen at Projected profit and loss statement at Annexure-4
The break even capacity is 3 lakh tons of banana produce annually.

71 Feasibility Report for Setting-up Integrated Cold Chain for Banana in Tamil Nadu
7.5 Cost of OperationsCosts of operations include all direct and indirect costs, besides financial costs such as depreciation and interest. The estimated costs are shown at Table 7.4
The direct cost of operation of handling the produce per MT is Rs.1755 per MT. The indirect cost is INR 156 per MT for the given one lakh MT Capacity.
The Finance costs as per the assumed with grants being received from eligible schemes as shown in the means of finance (at Table 7.1) and is estimated at Rs 200 per MT.
The total operating cost is Rs 2551/Mt of Banana after keeping 10% safety factor in operating cost to meet some unforeseen expenditure and also for unforeseen increases.
Table 7.4 Estimated Operating Cost per Ton of Banana of all modules with 6,00,000 MT per annum capacity Infrastructure
1 Direct Cost Both at Collection center & Central Pack House 1755.002 Indirect Cost 2.1 Collection Centre 34.002.2 Central Pack House 122.00
Sub-Total of Cost of operations 1911.003 Finance Cost Per Ton3.1 Depreciation 200.003.2 Term Loan including interest 200.00
Sub-Total Finance Cost 400.004 Margin for stabilization @10% 240.00
Total Cost per Ton 2551.00Details of Pack House costs are given in annexure
The following assumptions are made in estimating operational cost:
1. Only the relevant costs that are affected by introducing the system are taken into consideration.
2. Hence the current system costs like transportation costs are not reflected in the financials. Only the incremental costs incurred inward and outward at CPH are taken.
3. Inflation effects are not taken into account and are adjusted by improved efficiencies and increased volumes
4. Since bore well, storage cost and power costs are taken care of there is no cost to the water required for the plant. Any contingency purchases can be adjusted without significant change in the cost structure.
5. As discussed the cost of operations deals from the moment the product enters collection center, either at the central pack house or outside, up to the point of dispatch and the cost of transportation inward and outward is not taken into consideration and should be charged separately. The transportation cost shown above is only for the produce moving from collection center to central pack house.

72 Confederation of Indian Industry
7.6 Profit and LossThe detailed Financial Projections like Project Cost, Profit and loss, Balance Sheet, Cash Flow, etc are shown in the annexures 1 to 8.
After careful analysis it is observed that
1. The project is viable over a 10 year horizon and earns an economic profit.
2. Like all agri-related projects, this project also has good IRR @14-15% but the pay back is 5 years. Hence the grant component is required to reduce the payback to expected levels. Subsidization will not reduce the risk of liquidity but it surely will reduce burden on the investors and bankers. The benefit may be passed on to the users of the facility in the later years of the project.
3. There is a high cash burden in the first 3 years of the project. Hence any investor has to take a long term view. All loans need to consider a moratorium of 3 years on payments to reduce liquidity risks. However only one year moratorium is assumed in the projections.
4. Since this is agri-related area interest rates are not expected to be more than IRR.
7.7 Cost Benefit AnalysisThe following are the benefits expected to accrue from the intervention.
Benefit 1: Reduction in waste or increase in saleable product ‘@15%
Because of implementing this system the loss of produce due to shelf life, handling and other incidentals will be reduced. It is estimated as per accepted norms that this benefit would be 15% of total produce i.e. saleable produce will increase from 75% currently to of 85% of total produce.
Benefit 2: Increase in overall price realization of 10%
Because of the system the quality of all fruits reaching the customer will be better than current scenario and can convert into a better price of more than 10% of current prices for the entire saleable produce i.e. 85% of total produce.
Benefit 3: Increase in price for premium segmentation
The benefit is estimated ‘@10% of total produce getting 25% or more additional price realization. The practice of grading and packaging good quality products can lead to new market segmentation of “premium quality” in uptown areas of the markets fetching a premium of 25% on normal price.
The benefit estimation for a module and for all six modules if taken together is shown below at Table7.5

73 Feasibility Report for Setting-up Integrated Cold Chain for Banana in Tamil Nadu
7.5 Benefit estimation per year
I. Benefit estimation for all Modules with 6,00,000 Mt per annum capacity Banana cold chain Infrastructure at full capcity
Banana Qty in MT
Banana Qty in MT
Selling Price/Kg
Amount in Rs Lakhs
Baseline scenario 6,00,000 420,000 40Benefit 1: 15% Wastage reduction 6,00,000 90,000 40 36000.00Benefit 2: 10% higher price realization on total saleable qty
6,00,000 510,000 4 20400.00
Benefit 3: 10% premium selections fetching Rs10/Kg extra
6,00,000 60,000 10 6000.00
Total Benefit per Year 62400.00Less: cost of operations including CAPEX depreciation and fin cost
14700.00
Net Benefit 47700.00II: Benefit transfers to stakeholders from Net Benefit above - an Assumption1. Farmers @ 15% 7155.002. Consumers in reduction of prices @20% 9540.003. Available for further appropriation 31005.00
As can be seen from the above table, the Net benefit due to this intervention is RS 477 Crore annually after recovering the infrastructure investment and operating cost for the same year totaling Rs 147 Crore.
If all the 52 lakh Mt of banana produced in the state are covered by the intervention, then the total benefit to the state could be approximately Rs. 4000 Crores in an year. This is the magnitude of the potential that exists to be realized and farmers share of the benefit could be as much as Rs 600 Crores annually on a recurring basis.

74 Confederation of Indian Industry
8. Government Interventions Required
8.1 Though banana farmers have been considerably progressive in adapting planting techniques like tissue-cultured plants, farming techniques they have not been exposed to post harvesting techniques. Any introduction of technology is received with a pinch of salt and even the adventurous farmers will want a proof of benefit to shift from long practiced traditional methods. Hence government’s intervention in moulding and changing the attitudes is a must.
8.2 CII has taken initial steps in this direction by commissioning the feasibility reports for initiating the Cold chain infrastructure for different produce and rightly has selected Banana for the state of Tamil Nadu. Tamil Nadu produces more banana than many countries of the world but the post production systems do not follow any cold chain systems as in the developed banana economies. Any intervention will act as model for the rest of the areas with in Tamil Nadu and even in the larger context of the country itself. Accordingly Tamil Nadu Government should commit itself to implement modern Cold Chain infrastructure project by extending all possible assistance.
8.3 These projects are to be considered as infrastructure developmental projects as they provide the necessary exposure, confidence, practical experience, training to various sections connected in Banana production, transportation, processing and trading. It also demonstrates the financial viability for replication. At the same time, these projects should not be exposed to commercial risks. Accordingly, they should be structured very conservatively as far as financials are considered. This is because in pilot projects of this nature, time delays that occur cannot be incorporated into financial calculations and the capacity utilization which depends on early acceptability might affect adversely. Hence it is always advisable that the government take these pilot projects under its banner.
8.4 It is suggested that the following programs can be considered for accessing the funds required for the project.
8.4.1 Ministry of Food Processing Industries (MoFPI) gives grants / subsidies for Cold chain projects funding up to 40% of eligible project costs.

75 Feasibility Report for Setting-up Integrated Cold Chain for Banana in Tamil Nadu
8.4.2 Rashtriya Krishi Vigyan Yozana (RKVY) provides funds to the state Government with flexibility to use the funds as deemed necessary by the local requirement. These fund can be used for the balance cost or at least for those elements not considered by MoFPI.
8.4.3 State Government can give the land free of cost for setting up Central Pack House as well as collection centers by either giving its surplus land or by acquiring the same.
8.5 The actions that may be required from State Government are as follows:
8.5.1 Accepting to implement the project and giving necessary administrative sanction.
8.5.2 Identifying the Project implementing Agency/organization (PIA) preferably a T.N. State Government undertaking. TNAMB or any other similar organization will be appropriate.
8.5.3 Approving the locations for Central Pack House and collection centers.
8.5.4 PIA taking up immediate action with regard to
8.5.4.1 Approval of funding organizations such as MOFPI, RKVY etc.
8.5.4.2 Appointing Project Management Consultants for further implementation.

76 Confederation of Indian Industry
9. Recommendations
In Conclusion1. It is imperative that a cold chain for banana supply chain be started in the state of Tamil Nadu.
2. Though the requirement is for whole of the produce, a pilot project in one of the high density zones be taken up immediately and consider Tirichirapally as a pilot location for this initiative.
3. It should preferably be under government’s initiative and be accommodated under RKVY or Ministry of Food Processing. PPP model can effectively be used for balance funding and efficient operation.
4. The ownership could be with government undertaking, a farmers co-operative or association or a professionally experienced private enterprise. An anchor user to give minimum guaranteed load factor and stabilize the operations over long run can be considered if it is owned and operated by Government.
5. A catchment area or a moratorium period for any other competing unit could be provided to ensure that the project succeeds and provide sufficient produce to pass through the chain.
6. A detailed study for selecting of the location/site should be done to maximize the operational efficiency.

77 Feasibility Report for Setting-up Integrated Cold Chain for Banana in Tamil Nadu
Annexure 1: Project Cost for One Module of 1,00,000 Mt/Annum
S.No Name of Cost Item Amount in Rs Lakhs1 Land Cost 444.002 Civil Works (site development and building) 3069.003 Equipment 6624.004 Miscellaneous Fixed Assets 564.005 Project Management Consultancy 300.006 Preliminary Expenses 60.007 Expenses during construction 120.008 Security Deposits 120.009 Margin Money for working capital 138.0010 Contingencies @ 5% 516.00
Total Capital Investment 11955.00
Annexure 2: Means of Finance for One Module of 1,00,000 Mt/Annum
(All amounts in Rs Lakhs)1 SHARE CAPITAL 2750.00a T.N.Govt undertaking/Under PPP by
Private Promoter2306.00
b T.N.Government- Land cost 444.002 Grants 6455.00a MOFPI @ 50% 4400.40b RKVY Funds 2054.603 TERM Loans 2750.00
Total Capital Required 11955.00

78 Confederation of Indian Industry
y0y1
y2y3
y4y5
y6y7
y8y9
y10
Liab
ilitie
s
Equi
ty27
5027
5027
5027
5027
5027
5027
5027
5027
5027
5027
50Su
bsid
y/Gr
ant
6455
6455
6455
6455
6455
6455
6455
6455
6455
6455
6455
Term
Loa
n27
5023
5719
6415
7211
7978
639
30
00
0w
.c. L
oans
1061
955
849
743
636
530
424
318
212
106
0Re
serv
es a
nd S
urpl
us0
-201
3-2
612
-131
513
117
0733
9951
9570
8590
2811
016
Curr
ent L
iabi
lities
00
055
661
967
572
577
081
083
385
2To
tal
1301
610
504
9406
1076
011
770
1290
314
146
1548
717
312
1917
121
073
Asse
tsFi
xed
Asse
ts11
955
1195
510
561
9384
8387
7537
6810
6184
5643
5173
4763
Less
Dep
reci
ation
013
9411
7799
785
072
762
654
147
041
036
0N
et B
lock
1195
510
561
9384
8387
7537
6810
6184
5643
5173
4763
4403
Curr
ent A
sset
s0
00
00
00
00
00
Prel
im e
xpen
se n
ot w
/oCa
sh a
nd b
ank
bala
nce
1061
-57
2223
7342
3360
9379
6198
4412
139
1440
816
669
Tota
l13
016
1050
494
0610
760
1177
012
903
1414
615
487
1731
219
171
2107
3
Anne
xure
3 :
Proj
ecte
d Ba
lanc
e Sh
eet f
or th
e Fi
rst T
en Y
ears
(All
Figu
res i
n Rs
Lak
hs)

79 Feasibility Report for Setting-up Integrated Cold Chain for Banana in Tamil Nadu
Anne
xure
4: P
rofit
and
Los
s Pro
jecti
ons f
or th
e Fi
rst T
en Y
ears
of O
pera
tion
y1
y2y3
y4y5
y6y7
y8y9
y10
Volu
me
trad
ed in
lakh
tone
s1.
53
66
66
66
66
Reve
nue
in la
khs
3825
.00
7650
.00
1530
0.00
1530
0.00
1530
0.00
1530
0.00
1530
0.00
1530
0.00
1530
0.00
1530
0.00
Expe
nditu
real
l figu
res i
n IN
R la
kh’s
Varia
ble
Chem
ical
s & o
ther
con
sum
able
s40
5.00
450.
0054
0.00
540.
0054
0.00
540.
0054
0.00
540.
0054
0.00
540.
00Po
wer
& e
lect
ricity
144.
0014
4.00
144.
0014
4.00
144.
0014
4.00
144.
0014
4.00
144.
0014
4.00
Wat
er30
.00
60.0
012
0.00
120.
0012
0.00
120.
0012
0.00
120.
0012
0.00
120.
00Pa
ckin
g30
.00
60.0
012
0.00
120.
0012
0.00
120.
0012
0.00
120.
0012
0.00
120.
00Tr
ansp
orta
tion
562.
5011
25.0
022
50.0
022
50.0
022
50.0
022
50.0
022
50.0
022
50.0
022
50.0
022
50.0
0La
bour
2025
.00
4050
.00
8100
.00
8100
.00
8100
.00
8100
.00
8100
.00
8100
.00
8100
.00
8100
.00
Sub-
Tota
l31
96.5
058
89.0
011
274.
0011
274.
0011
274.
0011
274.
0011
274.
0011
274.
0011
274.
0011
274.
00Fi
xed
Sala
ry a
nd W
ages
441.
3644
1.36
441.
3644
1.36
441.
3644
1.36
441.
3644
1.36
441.
3644
1.36
Adm
inist
rativ
e24
6.60
246.
6024
6.60
246.
6024
6.60
246.
6024
6.60
246.
6024
6.60
246.
60Re
pair
and
Mai
nten
ance
55.9
155
.91
111.
8111
1.81
111.
8111
1.81
111.
8111
1.81
111.
8111
1.81
Insu
ranc
e11
.18
11.1
811
.18
11.1
811
.18
11.1
811
.18
11.1
811
.18
11.1
8In
tere
st-W
C0.
000.
000.
000.
000.
000.
000.
000.
000.
000.
00Su
b-To
tal
755.
0575
5.05
810.
9581
0.95
810.
9581
0.95
810.
9581
0.95
810.
9581
0.95
Tota
l Exp
endi
ture
3951
.55
6644
.05
1208
4.95
1208
4.95
1208
4.95
1208
4.95
1208
4.95
1208
4.95
1208
4.95
1208
4.95
Gro
ss P
rofit
-126
.55
1005
.95
3215
.05
3215
.05
3215
.05
3215
.05
3215
.05
3215
.05
3215
.05
3215
.05
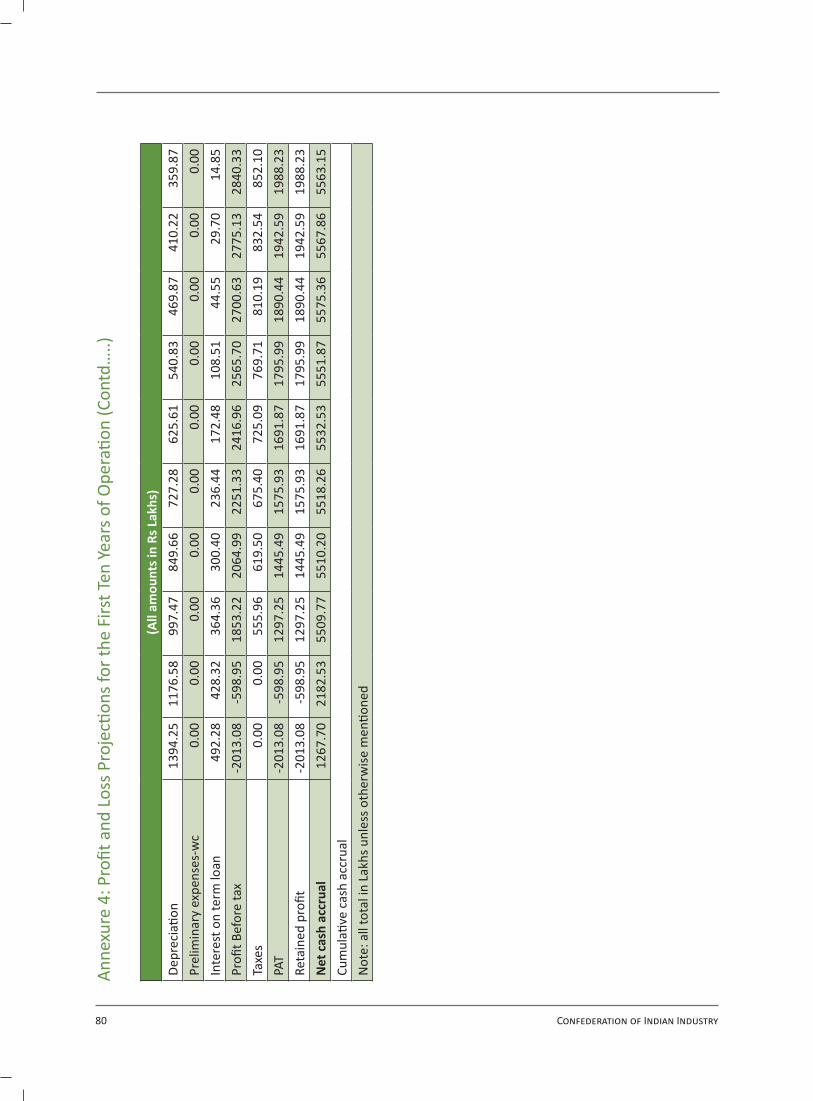
80 Confederation of Indian Industry
(All
amou
nts i
n Rs
Lak
hs)
Depr
ecia
tion
1394
.25
1176
.58
997.
4784
9.66
727.
2862
5.61
540.
8346
9.87
410.
2235
9.87
Prel
imin
ary
expe
nses
-wc
0.00
0.00
0.00
0.00
0.00
0.00
0.00
0.00
0.00
0.00
Inte
rest
on
term
loan
492.
2842
8.32
364.
3630
0.40
236.
4417
2.48
108.
5144
.55
29.7
014
.85
Profi
t Bef
ore
tax
-201
3.08
-598
.95
1853
.22
2064
.99
2251
.33
2416
.96
2565
.70
2700
.63
2775
.13
2840
.33
Taxe
s0.
000.
0055
5.96
619.
5067
5.40
725.
0976
9.71
810.
1983
2.54
852.
10PA
T-2
013.
08-5
98.9
512
97.2
514
45.4
915
75.9
316
91.8
717
95.9
918
90.4
419
42.5
919
88.2
3Re
tain
ed p
rofit
-201
3.08
-598
.95
1297
.25
1445
.49
1575
.93
1691
.87
1795
.99
1890
.44
1942
.59
1988
.23
Net
cas
h ac
crua
l12
67.7
021
82.5
355
09.7
755
10.2
055
18.2
655
32.5
355
51.8
755
75.3
655
67.8
655
63.1
5Cu
mul
ative
cas
h ac
crua
lN
ote:
all
tota
l in
Lakh
s unl
ess o
ther
wise
men
tione
d
Anne
xure
4: P
rofit
and
Los
s Pro
jecti
ons f
or th
e Fi
rst T
en Y
ears
of O
pera
tion
(Con
td…
..)

81 Feasibility Report for Setting-up Integrated Cold Chain for Banana in Tamil Nadu
Sour
ces
y0
y1y2
y3y4
y5y6
y7y8
y9y1
0In
crea
se in
shar
e ca
pita
l11
955
Equi
ty27
50Su
bsid
y/Gr
ant
6455
Term
Loa
n27
50Su
bsid
yN
et P
rofit
(+in
tere
st)
-152
1-1
7122
1823
6524
8825
8926
7427
4528
0528
55De
prec
iatio
n13
9411
7799
785
072
762
654
147
041
036
0Pr
elim
exp
w/o
00
00
00
00
00
Incr
ease
in b
ank
borr
owin
gs10
610
00
00
00
00
0To
tal
1301
6-1
2710
0632
1532
1532
1532
1532
1532
1532
1532
15De
ploy
men
tin
crea
se in
fixe
d as
sets
1195
5pr
elim
inar
y ex
pens
ein
crea
se in
cur
rent
ass
et0
00
00
00
00
00
inte
rest
pay
men
t
49
242
836
430
023
617
210
945
3015
term
loan
repa
ymen
t
49
949
949
949
949
949
949
910
610
610
6ta
xes p
aid
00
055
661
967
572
577
081
083
3To
tal
11
955
991
927
863
1355
1355
1347
1333
920
946
953
0
00
00
00
00
0O
peni
ng B
alan
ce
10
61-5
722
2373
4233
6093
7961
9844
1213
914
408
Surp
lus (
Defic
it)
1061
-111
879
2352
1860
1860
1868
1882
2295
2269
2262
Clos
ing
Bala
nce
10
61-5
722
2373
4233
6093
7961
9844
1213
914
408
1666
9
Anne
xure
:5 P
roje
cted
Cas
h Fl
ow S
tate
men
t for
the
Firs
t Ten
Yea
rs o
f Ope
ratio
n (A
ll Fi
gure
s in
INR
Lakh
s)

82 Confederation of Indian Industry
y0
y1y2
y3y4
y5y6
y7y8
y9y1
0Ca
pita
l Cos
t-1
1955
Reve
nue
3825
7650
1530
015
300
1530
015
300
1530
015
300
1530
015
300
Expe
nditu
re
3952
6644
1208
512
085
1208
512
085
1208
512
085
1208
512
085
Gros
s Pro
fit-1
1955
-127
1006
3215
3215
3215
3215
3215
3215
3215
3215
Disc
ount
Fac
tor @
11%
11
11
12
22
22
3Pr
esen
t Val
ue-1
1955
-115
831
2416
2196
1996
1815
1650
1500
1363
1240
NPV
2937
IRR
in %
14Pa
y Ba
ck4.
5 yr
Anne
xure
:6 D
iscou
nted
Cas
h Fl
ow fo
r the
Firs
t Ten
Yea
rs o
f Ope
ratio
n an
d N
PV (A
ll Fi
gure
s in
Rs L
akhs
)
y0
y1y2
y3y4
y5y6
y7y8
y9y1
0Gr
oss S
ales
0.00
3825
.00
7650
.00
1530
0.00
1530
0.00
1530
0.00
1530
0.00
1530
0.00
1530
0.00
1530
0.00
1530
0.00
Fixe
d Co
st (i
ncud
ing
dep
& in
t)
2149
.30
1931
.62
1808
.42
1660
.61
1538
.23
1436
.56
1351
.78
1280
.82
1221
.17
1170
.82
Varia
ble
cost
3196
.50
5889
.00
1127
4.00
1127
4.00
1127
4.00
1127
4.00
1127
4.00
1127
4.00
1127
4.00
1127
4.00
Cont
ributi
on62
8.50
1761
.00
4026
.00
4026
.00
4026
.00
4026
.00
4026
.00
4026
.00
4026
.00
4026
.00
Brea
k ev
en3.
421.
100.
450.
410.
380.
360.
340.
320.
300.
29CA
SH B
EP1.
200.
430.
200.
200.
200.
200.
200.
200.
200.
20hi
gh d
epre
ciati
on is
cre
ating
diffi
culty
in b
reak
eve
n he
nce
a su
bsid
y or
mor
ator
ium
on
inte
rest
wou
ld st
abili
ze th
e op
erati
on sm
ooth
ly
Anne
xure
7: B
reak
Eve
n An
alys
is (A
ll Fi
gure
s in
Rs L
akhs
)

83 Feasibility Report for Setting-up Integrated Cold Chain for Banana in Tamil Nadu
y0
y1y2
y3y4
y5y6
y7y8
y9y1
0Gr
oss s
ales
3825
.00
7650
.00
1530
0.00
1530
0.00
1530
0.00
1530
0.00
1530
0.00
1530
0.00
1530
0.00
1530
0.00
PBT
-201
3.08
-598
.95
1853
.22
2064
.99
2251
.33
2416
.96
2565
.70
2700
.63
2775
.13
2840
.33
Proj
ect C
ost
1195
5.00
1195
5.00
1195
5.00
1195
5.00
1195
5.00
1195
5.00
1195
5.00
1195
5.00
1195
5.00
1195
5.00
equi
ty in
vest
men
t27
50.2
527
50.2
527
50.2
527
50.2
527
50.2
527
50.2
527
50.2
527
50.2
527
50.2
527
50.2
5Ro
tatio
n0.
320.
641.
281.
281.
281.
281.
281.
281.
281.
28GP
Mar
gin
-3.3
113
.15
21.0
121
.01
21.0
121
.01
21.0
121
.01
21.0
121
.01
NP
Mar
gin
-52.
63-7
.83
12.1
113
.50
14.7
115
.80
16.7
717
.65
18.1
418
.56
Retu
rn o
n In
vest
men
t-0
.73
-0.2
20.
670.
750.
820.
880.
930.
981.
011.
03
Anne
xure
8: R
etur
n on
Inve
stm
ent A
naly
sis (A
ll Fi
gure
s in
Rs L
akhs
)


Confederation of Indian IndustryThe Mantosh Sondhi Centre
23, Institutional Area, Lodi Road, New Delhi – 110 003 (India)T: 91 11 24629994-7 • F: 91 11 24626149
E: [email protected] • W: www.cii.in
The Confederation of Indian Industry (CII) works to create and sustain an environment conducive to the growth of industry in India, partnering industry and government alike through advisory and consultative processes.
CII is a non-government, not-for-profit, industry led and industry managed organisation, playing a proactive role in India's development process. Founded over 117 years ago, it is India's premier business association, with a direct membership of over 7000 organisations from the private as well as public sectors, including SMEs and MNCs, and an indirect membership of over 90,000 companies from around 400 national and regional sectoral associations.
CII catalyses change by working closely with government on policy issues, enhancing efficiency, competitiveness and expanding business opportunities for industry through a range of specialised services and global linkages. It also provides a platform for sectoral consensus building and networking. Major emphasis is laid on projecting a positive image of business, assisting industry to identify and execute corporate citizenship programmes. Partnerships with over 120 NGOs across the country carry forward our initiatives in integrated and inclusive development, which include health, education, livelihood, diversity management, skill development and water, to name a few.
CII has taken up the agenda of “Business for Livelihood” for the year 2011-12. This converges the fundamental themes of spreading growth to disadvantaged sections of society, building skills for meeting emerging economic compulsions, and fostering a climate of good governance. In line with this, CII is placing increased focus on Affirmative Action, Skills Development and Governance during the year.
With 63 offices including 10 Centres of Excellence in India, and 7 overseas offices in Australia, China, France, Singapore, South Africa, UK, and USA, as well as institutional partnerships with 223 counterpart organisations in 90 countries, CII serves as a reference point for Indian industry and the international business community.
Reach us via our Membership Helpline: 00-91-11-435 46244 / 00-91-99104 46244CII Helpline Toll free No: 1800-103-1244