table of contents bottled water - market research · table of contents bottled water ... global new...
TRANSCRIPT

Table of Contents Bottled Water U.S. consumer intelligence, December 2003
TABLE OF CONTENTS INTRODUCTION & ABBREVIATIONS
INTRODUCTION DATE OF LAST REPORT DEFINITION ABBREVIATIONS & TERMS
Abbreviations Terms
EXECUTIVE SUMMARY
A SWIFTLY GROWING MARKET SEGMENTS SHOW VARYING RATES OF GROWTH HEALTH CONCERNS & YOUNG ADULTS DRIVE THE MARKET
Health, diet, and nutrition The younger consumer
SOFT DRINK MANUFACTURERS LEAD THE MARKET EXPANDING DISTRIBUTION THE BOTTLED WATER CONSUMER
Bottled water habits Reasons for not buying bottled water
THE FUTURE
MARKET DRIVERS
THE IMPORTANCE OF HYDRATION Figure 1 Reasons for not drinking daily recommended amount of water, February 2000 Figure 2 Consumption of bottled water vs. other selected beverages, June 2002-May 2003
WATER QUALITY/ENVIRONMENTAL CONCERNS Short-term threat
PARTICIPATION IN SPORTS Figure 3 Level of sports participation, Fall 2001 vs. Spring 2003
Youth and young adult participation in sports HEALTH, DIET, AND NUTRITION DEMOGRAPHICS
Figure 4 Consumption of bottled water, by age, June 2002-May 2003 Figure 5 Teen consumption of bottled water, June 2002-May 2003 Figure 6 U.S. population projections, by age, 1998-2008
COMPETITION FROM WATER FILTRATION PRODUCTS
MARKET SIZE & TRENDS
MARKET SIZE Figure 7 Retail sales of bottled water, at current and constant prices, 1998-2003 Graph 1 Trends in sales of bottled water, at current and constant prices, 1998-2003 Figure 8 Total U.S. per capita consumption of bottled water, 1997-2002
MARKET SEGMENTATION
OVERVIEW Figure 9 Sales of bottled water, segmented by type, 2001 & 2003 Graph 2 Sales of bottled water, by segment, 2003 Graph 3 Trends in sales of bottled water, by segment, 1998-2003
CONVENIENCE/PET STILL WATER Figure 10 Sales of convenience/PET still water, 1998-2003
JUG/BULK WATER Figure 11 Sales of jug/bulk still water, 1998-2003
SPARKLING/MINERAL WATER
Table of Contents Bottled Water U.S. consumer intelligence, December 2003
Figure 12 Sales of sparkling/mineral water, 1998-2003
SUPPLY STRUCTURE
FOREIGN TRADE Imports
Figure 13 Imports of water, by source country/region, 2000 & 2002 Exports
Figure 14 Exports of water, by destination country/region, 2000 & 2002 MANUFACTURER SALES OF BOTTLED WATER
Figure 15 Sales of bottled water, by manufacturer & brand, 2001 & 2002 FDM BRAND SALES BY SEGMENT
Convenient/PET still water Figure 16 FDM sales of convenient/PET still water, by brand, 2001 & 2003
Jug/bulk water Figure 17 FDM sales of jug/bulk water, by brand, 2001 & 2003
Sparkling/mineral water Figure 18 FDM sales of sparkling/mineral water, by brand, 2001 & 2003
MAJOR MANUFACTURERS AND BRANDS Nestlé Waters North America (formerly Perrier Group of America) Danone Waters North America, Inc. Suntory Water Group PepsiCo, In Crystal Geyser Water Compan Coca-Cola
PRIVATE LABEL SALES Figure 19 Private label sales of bottled water at FDM, 1998-2003 Figure 20 Private label sales of bottled water, by type, 1998-2003
ADVERTISING & PROMOTION
INTRODUCTION MAJOR COMPANIES AND BRANDS
Nestlé Waters North America Danone Waters North America PepsiCo Suntory Crystal Geyser Coca-Cola
RETAIL DISTRIBUTION
OVERVIEW Figure 21 Retail sales of bottled water, by channel, 2001 & 2003 Graph 4 Retail sales of bottled water, by channel, 2003
SUPERMARKETS Figure 22 Supermarket sales of bottled water, 1998-2003
Supermarket operating data Figure 23 Top supermarket operating statistics, latest fiscal year-end Figure 24 Percentage change from latest fiscal year-end versus year prior
MASS MERCHANDISERS/WAREHOUSE CLUBS Figure 25 Mass merchandiser sales of bottled water, 1998-2003
Mass merchandiser operating data Figure 26 Top mass merchandiser operating statistics, latest fiscal year-end Figure 27 Percentage change from latest fiscal year-end versus year prior
CONVENIENCE STORES/GAS STATIONS Figure 28 Convenience store/gas station sales of bottled water, 1998-2003
VENDING Figure 29 Vending sales of bottled water, 1998-2003

Table of Contents Bottled Water U.S. consumer intelligence, December 2003
OTHER OUTLETS Figure 30 All other outlets sales of bottled water, 1998-2003
THE CONSUMER
INTRODUCTION BOTTLED WATER CONSUMPTION
Figure 31 Types of bottled water drunk, June 2002-May 2003 Figure 32 Types of bottled water drunk, by gender, June 2002-May 2003 Figure 33 Types of bottled water drunk, by age, June 2002-May 2003 Figure 34 Types of bottled water drunk, by household income, June 2002-May 2003 Figure 35 Types of bottled water drunk, by race/ethnicity, June 2002-May 2003 Figure 36 Types of bottled water drunk, by region, June 2002-May 2003
Trends in consumption Figure 37 Trends in types of bottled water drunk, 2001-2003
VOLUME OF WATER CONSUMED Non-carbonated water
Figure 38 Volume of consumption of non-carbonated bottled water, June 2002-May 2003 Sparkling water
Figure 39 Volume of consumption of sparkling water/seltzers/natural sodas, June 2002-May 2003 ADULT CONSUMPTION OF BOTTLED WATER COMPARED TO OTHER BEVERAGES
Figure 40 Consumption of bottled water and selected beverages, June 2002-May 2003 Figure 41 Beverage repertoire, June 2002-May 2003
BOTTLED WATER DRINKING & PURCHASING HABITS Figure 42 Bottled water purchasing habits, November 2003 Figure 43 Bottled water purchasing habits, by gender, November 2003 Figure 44 Bottled water purchasing habits, by age, November 2003 Figure 45 Bottled water purchasing habits, by household income, November 2003 Figure 46 Bottled water purchasing habits, by region, November 2003 Figure 47 Bottled water purchasing habits, by metropolitan status, November 2003 Figure 48 Bottled water purchasing habits, by reasons for purchasing, November 2003
Summary REASONS FOR BUYING BOTTLED WATER
Figure 49 Reasons for purchasing bottled water, November 2003 Figure 50 Reasons for purchasing bottled water, by region, November 2003 Figure 51 Reasons for purchasing bottled water, by gender, November 2003 Figure 52 Reasons for purchasing bottled water, by age, November 2003
Summary REASONS FOR NOT PURCHASING BOTTLED WATER
Figure 53 Reasons for not purchasing bottled water, November 2003 Figure 54 Reasons for not purchasing bottled water, by gender, November 2003 Figure 55 Reasons for not purchasing bottled water, by age, November 2003 Figure 56 Reasons for not purchasing bottled water, by household income, November 2003 Figure 57 Reasons for not purchasing bottled water, by region, November 2003
WHETHER BOTTLE LABELS ARE READ Figure 58 Whether bottle labels are read, November 2003 Figure 59 Whether bottle labels are read, by age, November 2003
Information sought from bottle labels Figure 60 Information sought from bottle labels, November 2003 Figure 61 Information sought from bottle labels, by age, November 2003 Figure 62 Information sought from bottle labels, by household income, November 2003
Summary TEEN BOTTLED WATER CONSUMPTION
Figure 63 Teen consumption of bottled water, June 2002-May 2003 Figure 64 Teen consumption of bottled water, by gender and age, June 2002-May 2003 Figure 65 Teen consumption of bottled water, by race/ethnicity, June 2002-May 2003
Trends in consumption Figure 66 Teen usage of bottled water, 2001-2003
Consumption of bottled water compared to other beverages

Table of Contents Bottled Water U.S. consumer intelligence, December 2003
Figure 67 Teen consumption of bottled water and selected beverages, June 2002-May 2003 Figure 68 Beverage repertoire, June 2002-May 2003
Summary VOLUME OF BOTTLED WATER CONSUMED BY TEENS
Non-carbonated water Figure 69 Volume of non-carbonated bottled water consumed, June 2002-May 2003
Sparkling water Figure 70 Volume of sparkling water/seltzers/natural sodas consumed, June 2002-May 2003
WHERE TEENS USUALLY DRINK BOTTLED WATER Figure 71 Where teens drink bottled water, June 2002-May 2003
FUTURE & FORECAST
FUTURE TRENDS Demographics
Figure 72 U.S. population projections, by age, 2003-2008 Continued media coverage on health/weight issues
MARKET FORECAST Overview
Figure 73 Forecast of retail sales of bottled water, at current and constant prices, 2003-2008 Graph 5 Forecasted trends in sales of bottled water, at current and constant prices, 2003-2008
Convenience/PET still water Figure 74 Forecast of sales of convenience/PET still water, at current and constant prices, 2003-2008
Jug/bulk water Figure 75 Forecast of sales of jug/bulk still water, at current and constant prices, 2003-2008
Sparkling/mineral water Figure 76 Forecast of sales of sparkling/mineral water, at current and constant prices, 2003-2008
Forecast factors
APPENDIX: TRADE ASSOCIATIONS
APPENDIX: NEW PRODUCT DEVELOPMENTS
NEW PRODUCT TRENDS Introduction New product introductions
Figure 77 Number of bottled water new product introductions, 1998-2003 Product trends Packaging Product launches by company/brand Forecast/Predictions
NEW PRODUCT BRIEFS Nestlé Waters North America/Great Spring Waters of America: Ice Mountain Fridge Pack Water Bottles Fresh Pure Splash Juice: Thunderhead Fruit-flavored Water Shaw’s Supermarkets: Shaw’s Signature Sparkling Beverages Leading Brands: Soy2O Fruit-flavored Water and Natural Soy Isoflavones Wal-Mart: Kid Connection Purified Drinking Water Safeway: Safeway Select Clear Strawberry & Kiwi Sparkling Water Suntory Water Group: Hinckley Springs Spring Water with Fluoride Ferolito Vultaggio & Sons: AriZona Infused Water Life O2 International: Life O2 Superoxygenated Purified Water
APPENDIX: RESEARCH METHODOLOGY
CONSUMER RESEARCH Sampling & Weighting Presentation & Definition Further Analysis

Table of Contents Bottled Water U.S. consumer intelligence, December 2003
TRADE RESEARCH Informal trade research Formal trade research
DESK & INTERNET RESEARCH SOURCES DEFINITIONS FORECASTS
APPENDIX: WHAT IS MINTeL?
MINTEL PUBLICATIONS MINTEL SERVICES
Product retrieval Retail audits Tailored research Global New Products Database
RESEARCH SUPPORT/CONSULTANCY/MIC The Mintel Information Centre (MiC) PR Research
This report contains U.S. IRI Infoscan data.

Introduction & Abbreviations Bottled Water U.S. consumer intelligence, December 2003
©
INTRODUCTION & ABBREVIATIONS INTRODUCTION The market for bottled water has enjoyed strong growth of 81% over the review period of 1998-2003, but increasing competition and consolidation are the two biggest trends in the industry now. This in turn has caused prices to drop as branded waters try to compete with private label bottled water. Single-serving PET bottles are the fastest growing segment in the industry since bulk water sales have fallen as consumers favor the more portable PET. The industry will continue to grow as bottled water becomes even more readily available through increased distribution channels and as suppliers introduce new value-added waters including fitness and flavored waters. The trend toward healthy eating and participation in fitness is driving bottled water sales, especially the PET segment. This trend is expected to continue to drive bottled water sales through 2008. DATE OF LAST REPORT This is an update of Mintel’s previous report on the bottled water market—Bottled Water—U.S., consumer intelligence, November 2001. A number of U.S. consumer intelligence reports covering other related sectors have been published or are in preparation, including the following: • Smoothies—U.S., consumer intelligence, February 2004 • Coffee—U.S., consumer intelligence, January 2004 • Non-carbonated Drinks—U.S., consumer intelligence, January 2004 • Water Filtration & Purification—U.S, consumer intelligence, December 2003 • Vending—U.S., consumer intelligence, December 2003 • Hispanic Drinks—U.S., consumer intelligence, September 2003 • Store Brand Drinks—U.S., consumer intelligence, October 2003 • Functional Beverages—U.S., consumer intelligence, September 2003 • Energy Drinks—U.S., consumer intelligence, July 2003 • Tea—U.S., consumer intelligence, June 2003 • Milk—U.S., consumer intelligence, April 2003 • Fruit Juice & Juice Drinks—U.S., consumer intelligence, February 2003 • Breakfast Drinks—U.S., consumer intelligence, November 2002 • Sports Drinks—U.S., consumer intelligence, July 2002 • Beverages: Volume 1-The Consumer—U.S., consumer intelligence, July 2002 • Beverages: Volume 2-The Marketplace—U.S., consumer intelligence, July 2002 In addition, Mintel has published a number of reports on the UK market that may be of interest:

Introduction & Abbreviations Bottled Water U.S. consumer intelligence, December 2003
©
• Sports Drinks and Supplements—UK, Market Intelligence, August 2003 • Energy and Stimulant Drinks—UK, Market Intelligence, August 2003 • Bottled Water—UK, Market Intelligence, June 2003 • Tea and Herbal Tea—UK, Market Intelligence, February 2003 • Carbonates—UK, Market Intelligence, February 2003 • Smoothies—UK, Market Intelligence, February 2002 • Adult Soft Drinks—UK, Market Intelligence, January 2002 • Fruit Juice & Juice Drinks—UK, Market Intelligence, June 2003 • Drinks—UK, Market Intelligence, February 2001 • Water Treatment—UK, Market Intelligence, February 2001 DEFINITION For the purposes of this report, Mintel covers the U.S. market for bottled water as defined by the International Bottled Water Association (IBWA). The IBWA defines bottled water as water sealed in a sanitary container, to be sold for human consumption. Flavored carbonated and non-carbonated waters are included. The following products are excluded from this report:
• seltzer • tonic • club soda.
There are several types of bottled water, depending on the source. In the U.S., approximately 75% of bottled water comes from protected springs or wells, with the remaining 25% derived from public water supplies that meet federal and state requirements of the 1974 Safe Drinking Water Act. According to the Food and Drug Administration (FDA), for bottled water to be labeled as such, bottlers must meet the following standards: Artesian water: • from a well in a confined aquifer • water level in well must stand at some height above the top of the aquifer • may also be known as “artesian well water” Fluoridated water: • contains fluoride that is added within the limitations set by Federal Regulations • some spring and artesian sources have trace amounts of naturally occurring fluoride Mineral water: • must contain no less than 250 parts per million (ppm) total dissolved solids (TDS) with the
solids being the minerals in the water • must come from a geologically and physically protected underground water source

Introduction & Abbreviations Bottled Water U.S. consumer intelligence, December 2003
©
• is distinguishable from other types of water by the regular mineral and trace elements present • no minerals may be added to this water Purified water: • produced by distillation, deionization, reverse osmosis or other suitable processes that meet
the legal definition of “purified water” • may also be known as “demineralized water”. Sparkling water: • contains, after treatment and possible replacement of carbon dioxide, the same amount of
carbon dioxide that it had at emergence from the source Spring water: • must come from underground formation and flow naturally to the surface of the earth • emanates from beneath the earth, from under strata that formed in prehistoric times Sterile water: • must meet the requirements under “Sterility Tests” in the U.S. PharMacPPCopoeia • may also be known as “sterilized water.” Well water: • comes from a hole that is bored, drilled or otherwise constructed in the ground, tapping the
water of an aquifer Not included in this report are the following: • water sold from bulk dispensers or coolers; and • home or office water delivery. Value figures throughout this report are at retail selling prices (rsp) excluding sales tax unless otherwise stated. ABBREVIATIONS & TERMS Abbreviations There follows a list of abbreviations used in this report ABC American Broadcasting Company ACC Atlantic Coast Conference AVP Association of Volleyball Professionals CD Compact disc CIF Cost, Insurance, Freight CPI Consumer Price Index DVD Digital versatile disc
Introduction & Abbreviations Bottled Water U.S. consumer intelligence, December 2003
©
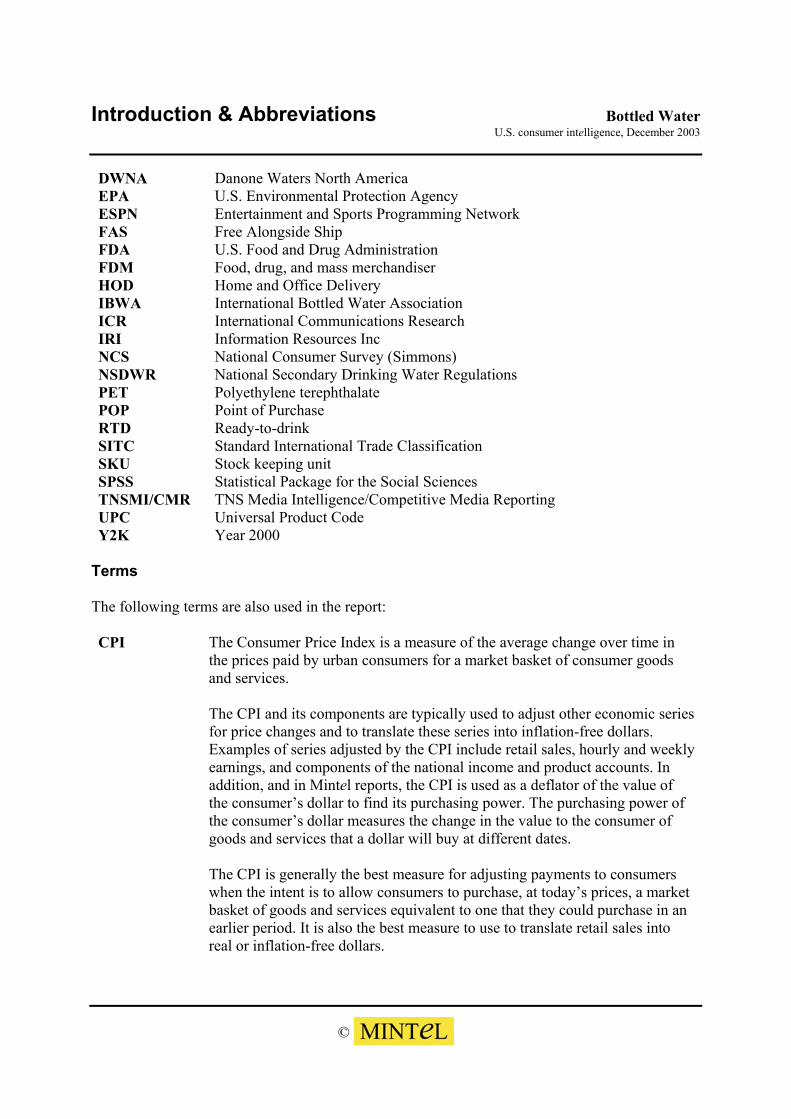
DWNA Danone Waters North America EPA U.S. Environmental Protection Agency ESPN Entertainment and Sports Programming Network FAS Free Alongside Ship FDA U.S. Food and Drug Administration FDM Food, drug, and mass merchandiser HOD Home and Office Delivery IBWA International Bottled Water Association ICR International Communications Research IRI Information Resources Inc NCS National Consumer Survey (Simmons) NSDWR National Secondary Drinking Water Regulations PET Polyethylene terephthalate POP Point of Purchase RTD Ready-to-drink SITC Standard International Trade Classification SKU Stock keeping unit SPSS Statistical Package for the Social Sciences TNSMI/CMR TNS Media Intelligence/Competitive Media Reporting UPC Universal Product Code Y2K Year 2000
Terms The following terms are also used in the report: CPI The Consumer Price Index is a measure of the average change over time in
the prices paid by urban consumers for a market basket of consumer goods and services.
The CPI and its components are typically used to adjust other economic series
for price changes and to translate these series into inflation-free dollars. Examples of series adjusted by the CPI include retail sales, hourly and weekly earnings, and components of the national income and product accounts. In addition, and in Mintel reports, the CPI is used as a deflator of the value of the consumer’s dollar to find its purchasing power. The purchasing power of the consumer’s dollar measures the change in the value to the consumer of goods and services that a dollar will buy at different dates.
The CPI is generally the best measure for adjusting payments to consumers
when the intent is to allow consumers to purchase, at today’s prices, a market basket of goods and services equivalent to one that they could purchase in an earlier period. It is also the best measure to use to translate retail sales into real or inflation-free dollars.

Introduction & Abbreviations Bottled Water U.S. consumer intelligence, December 2003
©
Based on Bureau of Labor Statistics definition. Generations are discussed within this report, and are defined as followed: World War II The generation born in 1932 or before. In 2003, members of this generation
are aged 71 or older. Swing Generation
The generation born between 1933 and 1945. In 2003, members of the Swing generation are between the ages of 58 and 70.
Baby Boomers
The generation born between 1946 and 1964. In 2003, Baby Boomers are between the ages of 39 and 57.
Generation X The generation born between 1965 and 1976. In 2003, Generation Xers are
between the ages of 27 and 38. Echo Boom/ Millennial
The generation born between 1977 and 1994. In 2003, Echo Boomers are between the ages of 26 and 9.
Post-Millennial
The generation born from 1994 to the present. In 2003, Post- Millennials are 8 years and younger.

Market Segmentation Bottled Water U.S. consumer intelligence, December 2003
©
EXECUTIVE SUMMARY A SWIFTLY GROWING MARKET The bottled water market has shown significant growth since the mid-1990s and although some slowdown is to be expected as pricing becomes more competitive, growth should continue to be the trend. With sales of just over $4 billion in 1998 and an estimated $7.4 billion in 2003, the market is likely to surpass $8 billion by 2005. SEGMENTS SHOW VARYING RATES OF GROWTH The fastest growing segment in the market is the convenient/PET segment with 31% growth between 2001 and 2003. This segment now holds over 80% share of the market. The gains in the market share of the convenient/PET segment have come mainly at the expense of jug/bulk still water, which has shown a decrease in sales of over 4% between 2001and 2003. HEALTH CONCERNS & YOUNG ADULTS DRIVE THE MARKET Factors that are driving sales in the bottled water market include increased knowledge of the benefits of hydration and the recommended eight, 8-oz. glasses per day of water intake. Increased participation in sports and fitness activities has also helped to drive sales of bottled water as participants rehydrate themselves with bottled water in convenient carry-along bottles of water. Teens, in particular, show considerable increases in organized sports participation. Health, diet, and nutrition An increase in attention to healthy eating and weight loss and maintenance has helped drive people to bottled water as an alternative to sodas. The American public is considered overweight and obesity has become a severe problem in America, increased consumption of water as part of a healthy diet is now a staple. The younger consumer Young adults aged 15-24 are a key demographic group for bottled water suppliers. Teens tend to drink bottled water in a greater numbers than adults and as previous drivers have shown they are also very involved in sports. The segment of the population comprised of 15-24 year olds will grow by over 2 million between 2003 and 2008. SOFT DRINK MANUFACTURERS LEAD THE MARKET The most recent entries into the bottled water market are large soft drink companies. PepsiCo and Coca-Cola have claimed the top two brands in the market and their growth has continued to be significant. The combined Nestlé Waters North America brands own a combined 23% share of the market.

Market Segmentation Bottled Water U.S. consumer intelligence, December 2003
©
MARKET DRIVERS The Market Drivers section identifies the principal external factors that affect the bottled water market. These factors may have either a positive or negative influence. THE IMPORTANCE OF HYDRATION While eight 8-oz. servings of water are recommended daily for good health, few Americans actually drink the recommended amount. Lack of water consumption can lead to short-term symptoms of dehydration that include dry, itchy skin, or fatigue in the early or mid-day. Longer-term dehydration can affect blood pressure, circulation, kidney function, and digestion. While concern with hydration has been growing in the U.S., a 2000 study by Yankelovich Partners on behalf of the International Bottled Water Association (IBWA) and the Rockefeller University found that only one in five Americans drinks the recommended eight glasses of water a day. Figure 1 lists the reasons given for not drinking the recommended amount of water. Figure 1 Reasons for not drinking daily recommended amount of water, February 2000 Base: 2,818 adults aged 18 and older
Reasons given All % Lack of time/too busy SAMPLE Don’t like the taste Prefer other beverages Forget to drink Not thirsty SAMPLE No bottled water available Can’t leave desk for break Worry about too many restroom breaks
Source: Yankelovich Partners for International Bottled Water Association and The Rockefeller University, 2000 Over one in five respondents felt that they did not have time to consume the recommended daily amount of water. Bottled water has appeared in such varied places as video rental stores, office supply stores and electronics stores. By expanding distribution and raising consumer awareness regarding the importance of drinking water, manufacturers have the opportunity of meeting consumer need whenever or wherever they remember to drink water. Some 12% of respondents to the Yankelovich study cite a preference for other beverages as the reason why they do not drink the recommended amount of the water. Data from the Spring 2003

Market Segmentation Bottled Water U.S. consumer intelligence, December 2003
©
Simmons NCS, presented in Figure 2, details incidence of consumption of some of these competing beverages. Figure 2 Consumption of bottled water vs. other selected beverages, June 2002-May 2003 “Do you drink…?” Base: 20,802 adults aged 18 and older
All % Any bottled water (net): Non-carbonated bottled spring water SAMPLE Sparkling water/seltzer/natural sodas Carbonated beverages (net) Regular Diet Iced tea (ready-to-drink) SAMPLE Thirst quencher and sports/activity drinks Energy drinks
Source: Mintel/Spring 2003 Simmons NCS Carbonated beverages, RTD tea, thirst quenchers and energy drinks all compete with bottled water for consumers’ attention not just outside of home, but for at-home consumption as well. A significantly higher percentage of respondents to the Simmons survey say they drink carbonated beverages than say they drink any type of bottled water. Though they might be interchangeable in the consumer’s mind, consumption of these other beverages actually increases the need for drinking water. Beverages like soft drinks, coffee, and tea, most of which contain caffeine, actually contribute to dehydration. While the above are challenges that bottled water suppliers face in reaching new customers, research does indicate that the presence of bottled water in American life is growing. According to the Spring 2003 Simmons NCS, some 63% of adult respondents say they drink bottled water, compared to 56% who said the same in the Spring 2001 survey. It should be noted that some of the same companies that are now dominating the bottled water market also dominate the carbonated drinks market, namely PepsiCo and Coca-Cola. As these two companies have moved in on the bottled water market, they have applied the same marketing tactics to their products as they have to their more traditional carbonated drinks brands. The implication is that in many respects, bottled water is increasingly being positioned and marketed as a soft drink option, rather than as an alternative to tap water.
Market Segmentation Bottled Water U.S. consumer intelligence, December 2003
©
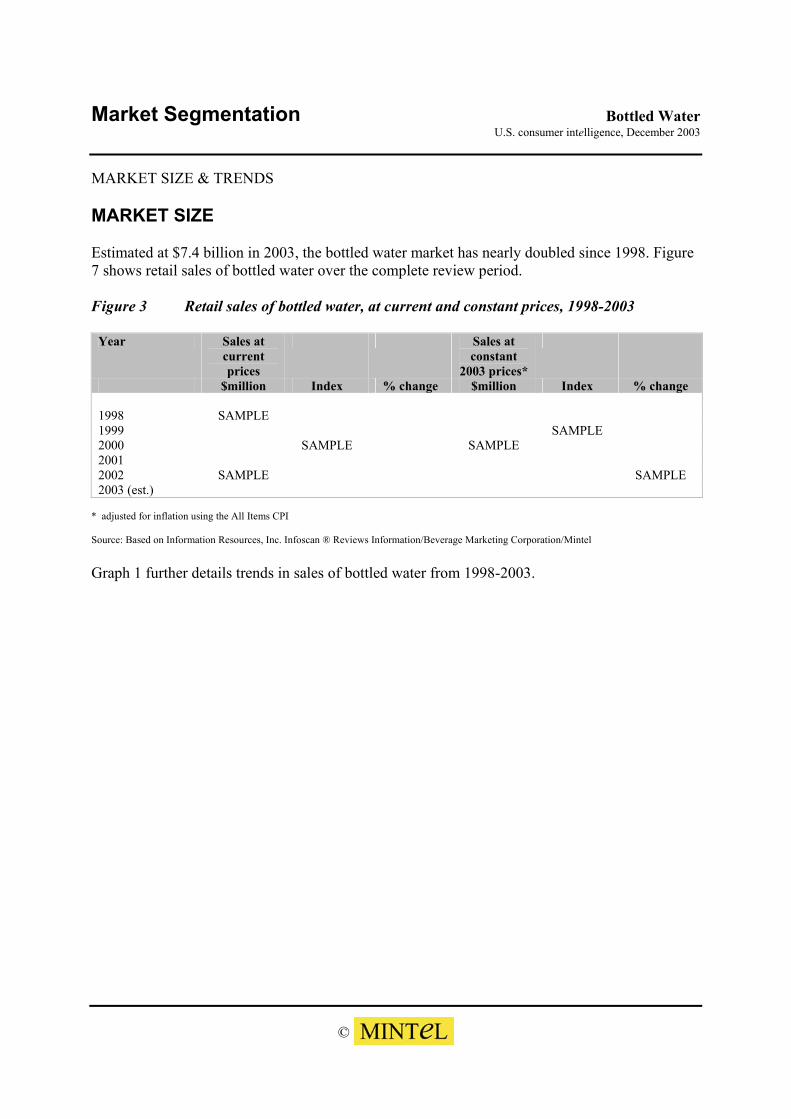
MARKET SIZE & TRENDS MARKET SIZE Estimated at $7.4 billion in 2003, the bottled water market has nearly doubled since 1998. Figure 7 shows retail sales of bottled water over the complete review period. Figure 3 Retail sales of bottled water, at current and constant prices, 1998-2003
Year Sales at current prices
Sales at constant
2003 prices*
$million Index % change $million Index % change 1998 SAMPLE 1999 SAMPLE 2000 SAMPLE SAMPLE 2001 2002 SAMPLE SAMPLE 2003 (est.)
* adjusted for inflation using the All Items CPI Source: Based on Information Resources, Inc. Infoscan ® Reviews Information/Beverage Marketing Corporation/Mintel Graph 1 further details trends in sales of bottled water from 1998-2003.

Market Segmentation Bottled Water U.S. consumer intelligence, December 2003
©
MARKET SEGMENTATION OVERVIEW For the purposes of this report, the bottled water market has been segmented as follows:
• Convenience/PET still water, which includes non-carbonated water for individual consumption
• Jug/bulk still water, 1 gallon or larger bottles of non-carbonated water • Sparkling/mineral water, includes carbonated waters but not flavored seltzers or
tonics. Sales of individual size PET bottles of water have the highest margin for producers and have shown significant growth in market share in just two years. This growth in market share has come at the expense of the more traditional jugs of bottled water that had in the past been the staple. Figure 9 shows the sales of bottled water by segment. Figure 4 Sales of bottled water, segmented by type, 2001 & 2003
2001 2003 Change Sales Share Sales Share 2001-2003 $million % $million % % Convenience/PET still water SAMPLE SAMPLE Jug/bulk still water SAMPLE Sparkling/mineral water SAMPLE SAMPLE Total
*Data may not equal totals due to rounding Source: Based on Information Resources, Inc. Infoscan ® Reviews Information/Beverage Marketing Corporation/Mintel Market share held by each type of product is depicted in Graph 2.

Market Segmentation Bottled Water U.S. consumer intelligence, December 2003
©
SPARKLING/MINERAL WATER Sales of sparkling and mineral waters have not seen the significant gains of PET and are not typically subject to momentary spikes that occur with bulk water. Figure 12 shows sales of sparkling/mineral water from 1998-2003. Figure 5 Sales of sparkling/mineral water, 1998-2003
Year Sales at current prices
Sales at constant
2003 prices*
$million Index % change $million Index % change 1998 SAMPLE SAMPLE SAMPLE 1999 2000 SAMPLE SAMPLE 2001 SAMPLE 2002 SAMPLE 2003 (est.) SAMPLE SAMPLE
* adjusted for inflation using the All Items CPI Source: Based on Information Resources, Inc. Infoscan ® Reviews Information/Mintel While the majority of the years covered by the review period show gains in sales at current prices, examination of constant 2003 prices shows a different story. The year 2001 and 2003 showed the largest gain in sales at current prices, but sales at constant 2003 prices remained below 1998 levels. The segment has been given as boost, as seen in 2003, by flavored varieties, often introduced by retailers through under their store brand name. Shaw’s and Safeway supermarkets both introduced new flavored sparkling waters in 2003 (see New Product Briefs in the Appendix: New Product Developments).

Supply Structure Bottled Water U.S. consumer intelligence, December 2003
©
SUPPLY STRUCTURE The supply structure section covers production of bottled water. Manufacturer and brand profiles are included and foreign trade is also covered. FOREIGN TRADE For the purposes of this report, Mintel has drawn on the U.S. International Trade Commission, which provides data on foreign trade in the following category: • Standard International Trade Classification (SITC) 5: 11101 Waters, including natural or
artificial mineral waters and aerated waters, not containing added sugar or other sweetening matter; ice and snow.
The U.S. is a net importer of bottled. Exports of bottled water amount to about 10% of the value of imports for 2002. These data are further detailed in the following subsections. Imports Figure 13 compares imports of water for 2000 and 2002. Figure 6 Imports of water, by source country/region, 2000 & 2002 SITC5: 11101
2000 2002 Change Customs value Share Customs value Share 2000-2002 $000 % $000 % %
Canada SAMPLE France SAMPLE SAMPLE Italy Fiji Mexico SAMPLE SAMPLE Germany Norway United Kingdom Portugal SAMPLE Poland New Zealand SAMPLE Iceland SAMPLE Georgia Slovenia Belgium All other SAMPLE SAMPLE Total Source: U.S. International Trade Commission DataWeb/Mintel

Supply Structure Bottled Water U.S. consumer intelligence, December 2003
©
France’s share of U.S. imports has decreased in the early 2000s, while others such as Canada, Italy, and Fiji continue to increase imports to the U.S. This trend away from French bottled water imports may have been exacerbated by two factors:
1. backlash toward French products due to political events surrounding the U.S. invasion of Iraq, and
2. new competitive products from other countries that compete with Evian and Perrier. While France was one of the first players in the bottled water market, the lure of the booming market has drawn other countries into the fray. Exports Exports of water rose slightly over the period, as shown in Figure 14. Figure 7 Exports of water, by destination country/region, 2000 & 2002 SITC5: 11101 2000 2002 Change FAS value Share FAS value Share 2000-2002 $000 % $000 % % Canada SAMPLE Japan SAMPLE SAMPLE Mexico Taiwan SAMPLE United Kingdom Bahamas SAMPLE Cayman Islands SAMPLE Jamaica Thailand SAMPLE Hong Kong Trinidad & Tobago Australia Belgium Barbados Cyprus All other SAMPLE Total SAMPLE Source: U.S. International Trade Commission DataWeb/Mintel Not only is Canada the greatest source of bottled water imports, but the country is also the largest recipient of U.S. water.

Advertising & Promotion Bottled Water U.S. consumer intelligence, December 2003
©
ADVERTISING & PROMOTION INTRODUCTION The extraordinary increase in sales of bottled water over the review period has come with only a minimal amount of advertising. As consolidation increases and the major players cement their position in the industry, advertising dollars have increased as well. The competition in the bottled water market is driving companies to differentiate their products from those of competitors. There are basically two overarching themes in the quest to sell bottled water: health and purity, or excitement and youth. While the health approach may appeal to all ages and waters of all price points, ads featuring excitement and youth are targeted to both a younger demographic, but are trying to sell higher-price point waters with brand image (such as Perrier, Evian, or Dasani). MAJOR COMPANIES AND BRANDS Following are brief profiles of promotional activity by leading companies in the bottled water market. Nestlé Waters North America In July 2003 Nestlé Waters North America signed a marketing agreement with Universal Studios to become the official water of Universal theme parks. The marketing agreement is to run for 10 years and targets families by sponsoring the Shrek 4D attraction. Other campaign components include radio and Internet ads, outdoor ads on Nestlé Waters delivery trucks in Orlando and Los Angeles, and on-package promotions. In order to distance the Perrier brand from all things French, ads created by Ogilvy & Mather of New York show Perrier bottles in more American situations. The “Perrier in America” campaign has been ongoing since being introduced in 2000. The company’s plan for the product is to seek a newer young, hip demographic and to make Perrier a “lifestyle beverage” while at the same time distancing it from its French roots. As part of an effort to reach hip, young consumers, Zoom Media launched a 12-week ad campaign for Perrier in summer 2002 by placing ads on 80 backlit billboards located in bars and nightclubs in New York, Miami, and Los Angeles. Targeting club-goers aged 18-34, the ad campaign also utilized 230 washroom billboards. Danone Waters North America Danone’s continuing campaign for its Evian brand emphasizes youth through attitude rather than age. In February 2003, an ad from Havas’ EURO RSCG BETC of Paris shows individuals including a pregnant woman, an elderly woman, and a middle-aged business man singing in

Retail Distribution Bottled Water U.S. consumer intelligence, December 2003
©
RETAIL DISTRIBUTION Further information on many of the retailers named in this section is available from Mintel’s Retail Interactive database. Data included in Retail Interactive include: 3-year financials, operating statistics, company structure, corporate profile and enable company/company and company/sector comparison and analysis. The database is available on Mintel’s website http://reports.mintel.com. For more information call the U.S. HelpDesk at 312.943.5250. OVERVIEW Bottled water has become increasingly available through a wide variety of distribution channels. Where bottled water had previously been limited to food, drug, mass merchandisers, and convenience stores, channels have now expanded to include sporting and concert events, nightclubs, and almost all soft drink vending machines. Figures 21 shows retail sales of bottled water for 2001 and 2003. Figure 8 Retail sales of bottled water, by channel, 2001 & 2003
2001 2003 Change Sales Share Sales Share 2001-2003 $million % $million % % Supermarkets SAMPLE SAMPLE Mass merchandisers/warehouse clubs
Convenience stores/gas stations SAMPLE Vending Drug stores SAMPLE SAMPLE All other* SAMPLE Total
* includes restaurants, other retail or entertainment venues not already detailed Source: Based on Information Resources, Inc. Infoscan ® Reviews Information/Company reports/Beverage Marketing Corporation/Mintel Sales by retailer type for 2003 are illustrated in Graph 4.

The Consumer Bottled Water U.S. consumer intelligence, December 2003
©
THE CONSUMER Mintel is able to offer further analysis of its exclusive research, tailored to individual clients’ needs. It is possible, for example, to net and/or combine codes to create new attitudinal, usage or demographic groups, and cross-analysis can show how the answers to any questions or categories are related. For further details and prices, please call the editorial team at 312.932.0400. INTRODUCTION For the purposes of this report, Mintel commissioned exclusive consumer research through ICR to explore consumer purchase of and attitudes towards bottled water. Fieldwork was conducted October 30-November 3, 2003, among a nationally representative sample (weighted against the total population for estimation) of 1,018 adults aged 18 and over. Mintel has also analyzed data from Simmons Research, using the Spring 2003 National Consumer Survey. The NCS survey was carried out from June 2002-May 2003 and the results presented here are based on the sample of 20,802 adults aged 18 and over, with results weighted to represent the U.S. population. Mintel has also drawn on the Spring 2003 Simmons Teens survey, carried out among a sample of 2,469 teens aged 12-17 from June 2002-May 2003. Mintel has looked at responses by various demographic factors such as age, race/ethnicity, household income and geographic location to give a consumer perspective and analyze usage and trends. Analysis is only presented where significant differences are apparent. BOTTLED WATER CONSUMPTION In order to explore both incidence of consumption and the types of bottled water adults drink, Mintel analyzed data from the Spring 2003 Simmons NCS. Specifically, the Simmons survey asked the following question of respondents: “Do you drink…?” The topline results are presented in Figure 31.
Appendix: Trade Associations Bottled Water U.S. consumer intelligence, December 2003
©
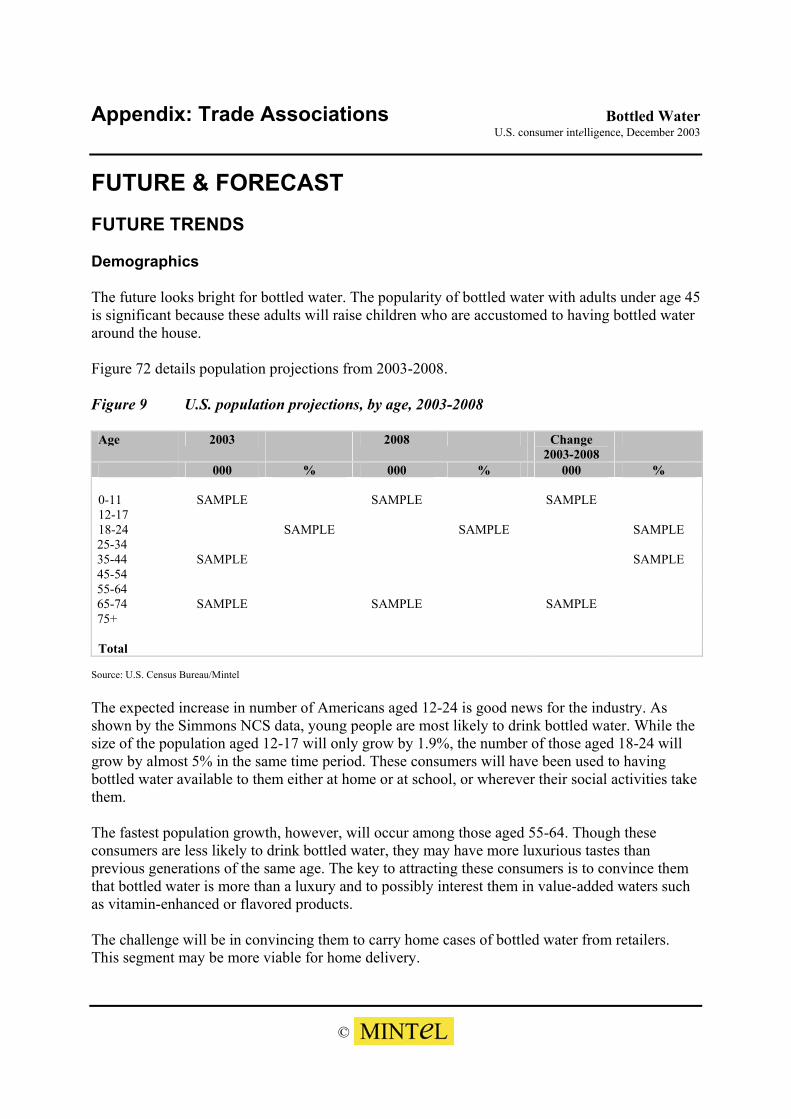
FUTURE & FORECAST FUTURE TRENDS Demographics The future looks bright for bottled water. The popularity of bottled water with adults under age 45 is significant because these adults will raise children who are accustomed to having bottled water around the house. Figure 72 details population projections from 2003-2008. Figure 9 U.S. population projections, by age, 2003-2008
Age 2003 2008 Change 2003-2008
000 % 000 % 000 % 0-11 SAMPLE SAMPLE SAMPLE 12-17 18-24 SAMPLE SAMPLE SAMPLE 25-34 35-44 SAMPLE SAMPLE 45-54 55-64 65-74 SAMPLE SAMPLE SAMPLE 75+ Total
Source: U.S. Census Bureau/Mintel The expected increase in number of Americans aged 12-24 is good news for the industry. As shown by the Simmons NCS data, young people are most likely to drink bottled water. While the size of the population aged 12-17 will only grow by 1.9%, the number of those aged 18-24 will grow by almost 5% in the same time period. These consumers will have been used to having bottled water available to them either at home or at school, or wherever their social activities take them. The fastest population growth, however, will occur among those aged 55-64. Though these consumers are less likely to drink bottled water, they may have more luxurious tastes than previous generations of the same age. The key to attracting these consumers is to convince them that bottled water is more than a luxury and to possibly interest them in value-added waters such as vitamin-enhanced or flavored products. The challenge will be in convincing them to carry home cases of bottled water from retailers. This segment may be more viable for home delivery.

Appendix: Research Methodology Bottled Water U.S. consumer intelligence, December 2003
©
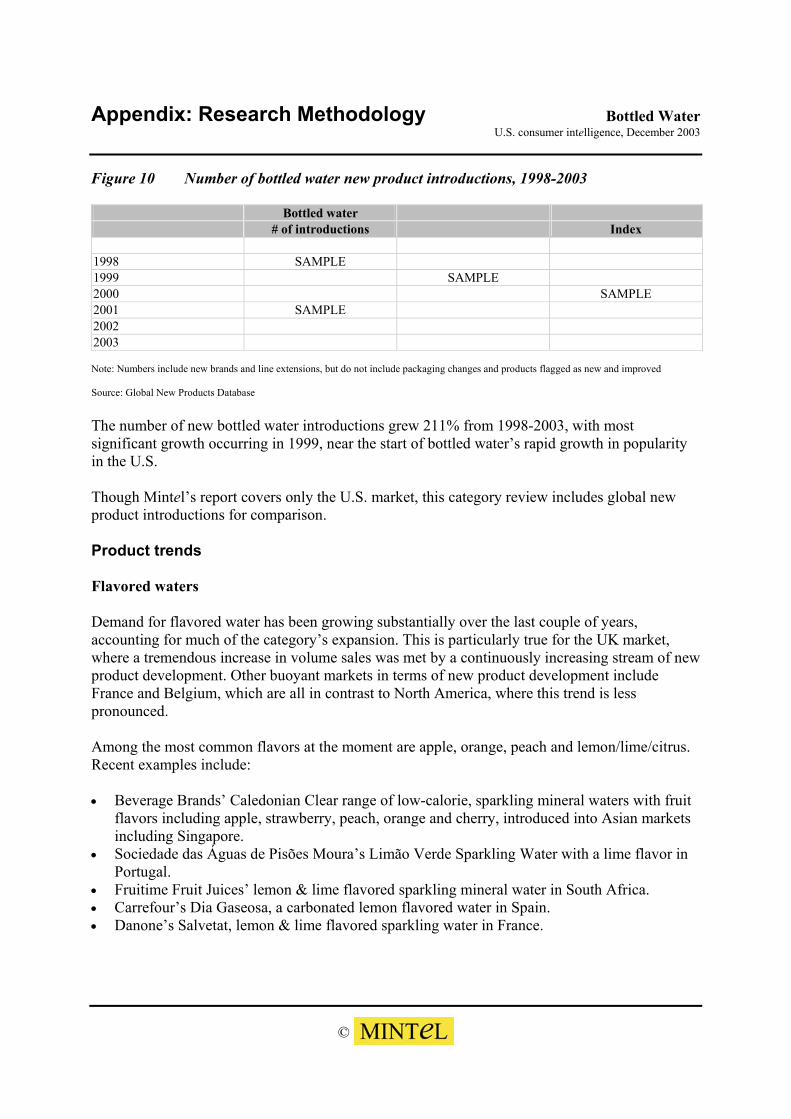
APPENDIX: NEW PRODUCT DEVELOPMENTS The New Product Developments section of this report is provided by GNPD, a division of Mintel specializing in new product monitoring. Trends and products mentioned here indicate new product activity and may not be indicative of broader market trends. The category review is based on new product activity only and in particular includes information on product activity outside the U.S. For more information on GNPD contact Mintel at 312.932.0400. NEW PRODUCT TRENDS Introduction Water, during the last few years, has gained substantially in significance. New formats, such as smaller bottles with convenient closure mechanisms for sportsmen, lightly flavored varieties to attract soft drink aficionados and fortified and health oriented variants have done much to help position water as a drink in its own right. While carbonates struggle to maintain consumer interest—largely due to a lack of differentiation, but also because of their unhealthy perception that collides with the growing good-for-you boom—water has successfully managed to adapt to a number of contemporary trends. New product trends in the bottled water market can be summarized as follows: • Overall increase in new product activity • Growth in flavored waters—particularly in the UK • Near-water drinks with deep-sea water are coming to the fore in Japan • To-date limited activity in truly functional waters • Increasing number of beverages with a wellness positioning • Continuous stream of sports waters • Growing number of waters that are marketed on an energy platform • Few “on-the-go” branded waters This review is an update of the original Water category review published in July 2001. New product introductions Figure 77 outlines the number of new bottled water product introductions in the U.S. from 1998 to 2003.
Appendix: Research Methodology Bottled Water U.S. consumer intelligence, December 2003
©
Figure 10 Number of bottled water new product introductions, 1998-2003 Bottled water # of introductions Index 1998 SAMPLE 1999 SAMPLE 2000 SAMPLE 2001 SAMPLE 2002 2003 Note: Numbers include new brands and line extensions, but do not include packaging changes and products flagged as new and improved Source: Global New Products Database The number of new bottled water introductions grew 211% from 1998-2003, with most significant growth occurring in 1999, near the start of bottled water’s rapid growth in popularity in the U.S. Though Mintel’s report covers only the U.S. market, this category review includes global new product introductions for comparison. Product trends Flavored waters Demand for flavored water has been growing substantially over the last couple of years, accounting for much of the category’s expansion. This is particularly true for the UK market, where a tremendous increase in volume sales was met by a continuously increasing stream of new product development. Other buoyant markets in terms of new product development include France and Belgium, which are all in contrast to North America, where this trend is less pronounced. Among the most common flavors at the moment are apple, orange, peach and lemon/lime/citrus. Recent examples include: • Beverage Brands’ Caledonian Clear range of low-calorie, sparkling mineral waters with fruit
flavors including apple, strawberry, peach, orange and cherry, introduced into Asian markets including Singapore.
• Sociedade das Águas de Pisões Moura’s Limão Verde Sparkling Water with a lime flavor in Portugal.
• Fruitime Fruit Juices’ lemon & lime flavored sparkling mineral water in South Africa. • Carrefour’s Dia Gaseosa, a carbonated lemon flavored water in Spain. • Danone’s Salvetat, lemon & lime flavored sparkling water in France.

Appendix: Research Methodology Bottled Water U.S. consumer intelligence, December 2003
©
APPENDIX: RESEARCH METHODOLOGY Mintel International Group, Ltd is an independent market analysis company. Mintel prides itself on supplying objective information on a whole range of markets and marketing issues. Mintel was founded in 1976 and has a long-established reputation as a leading publisher of “off-the-shelf” market information. Mintel has achieved “Superbrand” status in the UK, and is widely and regularly quoted in both national and specialist press. There are three main sources of information and research stages used in the compilation of Mintel reports: • Exclusive consumer research is commissioned by Mintel for individual reports, and non-
exclusive large-scale surveys are also drawn upon extensively • Trade interviews, both formal and informal, are conducted with relevant industry players • Mintel’s exclusive market size and economic databases are utilized; these have been
developed by our team of statisticians and based on government and business data. Reports are written and managed by analysts who are specialists in specific markets, or in their own fields. CONSUMER RESEARCH Mintel commissions exclusive and original quantitative consumer research—especially for the reports. Mintel invests a considerable sum each year in consumer research. The Mintel report purchaser benefits as the price of an individual report is less than the cost of the original research alone. The research brings an up-to-date and unique insight into important topical issues. Consumer research is conducted amongst a nationally representative sample of adults. Surveys are conducted by specialist survey research firms and typically include: ICR Surveys: Telephone omnibus survey (EXCEL) Results of these surveys are only available in Mintel reports. In addition and as appropriate, Mintel reports draw on: Simmons Research National Consumer Survey surveys using each of the three surveys
covering “Households,” “Teens,” and “Kids.”

Appendix: Research Methodology Bottled Water U.S. consumer intelligence, December 2003
©
Sampling & Weighting
ICR Surveys EXCEL EXCEL is a national, twice-weekly, consumer telephone omnibus service. With the assistance of Computer-Assisted Telephone Interviewing (CATI), interviewers contact, screen, and interview a nationally representative sample of adults, using a questionnaire prepared by Mintel. In each EXCEL survey, at least 1,000 telephone interviews are conducted with males and females, 18 years of age or older living in telephone households located in the continental U.S. These interviews are quota-sampled so that one half of the respondents are males and one half are females. The sample for each EXCEL is a computer-generated, fully replicated, stratified, single-stage random-digit dialing (RDD) sample of telephone households. Within each sample household, one adult respondent is randomly selected using a computerized procedure based on the Most Recent Birthday Method of respondent selection (i.e., May I please speak to the Male/Female, 18 years of age or older, living in this household who had the most recent birthday?). Interviewing for each EXCEL survey is conducted over a five-day period encompassing both weekdays and weekends. Each EXCEL survey is weighted to provide nationally representative and projectable estimates of the adult population. The weighting process takes into account the disproportionate probabilities of household selection due to the number of separate telephone lines and the probability associated with the random selection of an individual household member. Following the application of weights, the sample is post-stratified and balanced by key demographics such as age, sex, region and education. If you would like more information on the sample weighting procedure used for the EXCEL survey please contact Mintel.
Appendix: Research Methodology Bottled Water U.S. consumer intelligence, December 2003
©
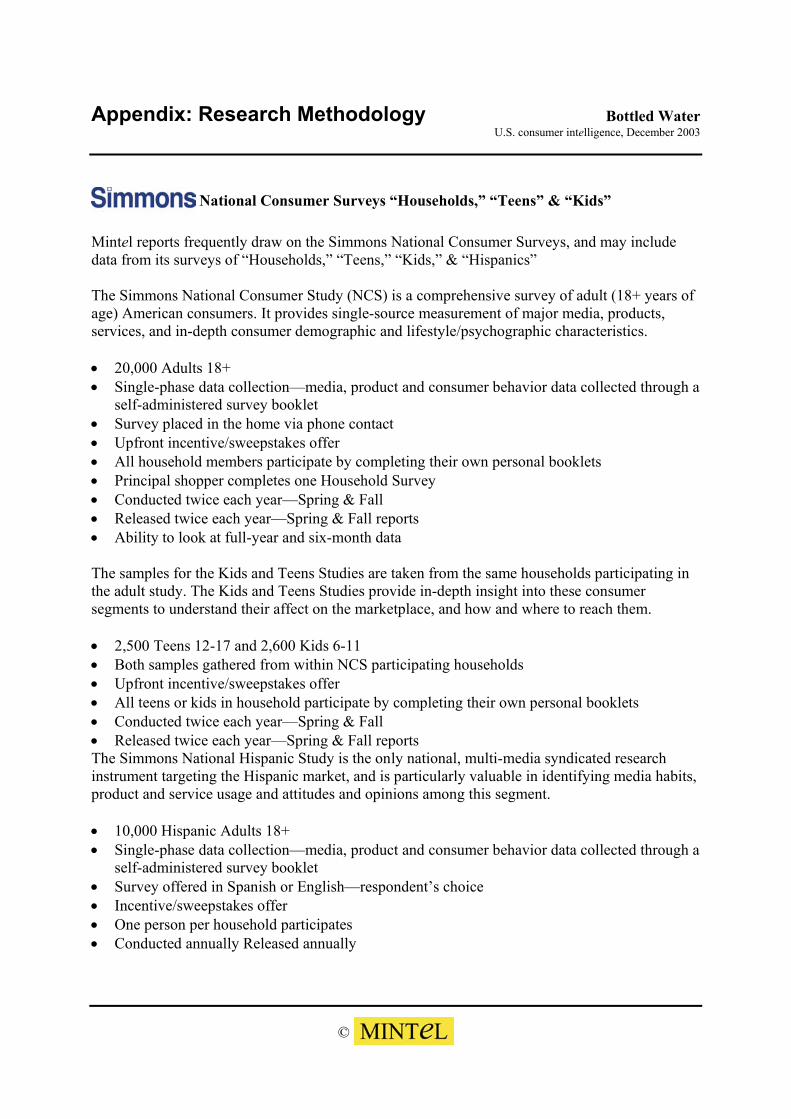
National Consumer Surveys “Households,” “Teens” & “Kids” Mintel reports frequently draw on the Simmons National Consumer Surveys, and may include data from its surveys of “Households,” “Teens,” “Kids,” & “Hispanics” The Simmons National Consumer Study (NCS) is a comprehensive survey of adult (18+ years of age) American consumers. It provides single-source measurement of major media, products, services, and in-depth consumer demographic and lifestyle/psychographic characteristics. • 20,000 Adults 18+ • Single-phase data collection—media, product and consumer behavior data collected through a
self-administered survey booklet • Survey placed in the home via phone contact • Upfront incentive/sweepstakes offer • All household members participate by completing their own personal booklets • Principal shopper completes one Household Survey • Conducted twice each year—Spring & Fall • Released twice each year—Spring & Fall reports • Ability to look at full-year and six-month data The samples for the Kids and Teens Studies are taken from the same households participating in the adult study. The Kids and Teens Studies provide in-depth insight into these consumer segments to understand their affect on the marketplace, and how and where to reach them. • 2,500 Teens 12-17 and 2,600 Kids 6-11 • Both samples gathered from within NCS participating households • Upfront incentive/sweepstakes offer • All teens or kids in household participate by completing their own personal booklets • Conducted twice each year—Spring & Fall • Released twice each year—Spring & Fall reports The Simmons National Hispanic Study is the only national, multi-media syndicated research instrument targeting the Hispanic market, and is particularly valuable in identifying media habits, product and service usage and attitudes and opinions among this segment. • 10,000 Hispanic Adults 18+ • Single-phase data collection—media, product and consumer behavior data collected through a
self-administered survey booklet • Survey offered in Spanish or English—respondent’s choice • Incentive/sweepstakes offer • One person per household participates • Conducted annually Released annually

Appendix: Research Methodology Bottled Water U.S. consumer intelligence, December 2003
©
Presentation & Definition Unless otherwise stated, consumer research data are presented as penetration, i.e. as a percentage of demographic sub-groups such as age, e.g. 71% of 18-24 year olds are suncream users. Profiles are represented as proportions of the population, e.g. 8% of suncream users are aged 18-24. Some reports contain qualitative research, either focus groups or in-depth interviews, and a full explanation of the methodology used in these areas is given in the individual Introduction section of such reports. Definitions of the main consumer classification systems used in the report are shown at the end of this section. Further Analysis Consumer research is stored in a database supervised by Mintel’s data analysts and statisticians. For additional analysis of survey data, please call Joan Heaney or Bill Patterson at 312.932.0400.

Appendix: Research Methodology Bottled Water U.S. consumer intelligence, December 2003
©
TRADE RESEARCH Informal trade research Is undertaken for all reports. This involves contacting relevant players in the trade, not only to gain information concerning their own operations, but also to address various brand and marketing issues in the market under review. To ensure the accuracy of its reports, Mintel will send draft copies of reports to key industry representatives, and take account of their feedback. Comments, where appropriate, are incorporated into the report prior to final publication. Formal trade research Using experienced external researchers, in-depth trade interviews are carried out as appropriate for some reports. This takes the form of full trade interview questionnaires and direct quotations are included in the report. This gives valuable insight into a range of trade views on topical issues. DESK & INTERNET RESEARCH Mintel holds a variety of publications, including government statistics, consumer and trade association statistics, manufacturer-sponsored reports, annual reports, directories and articles from over 200 publications, from both the U.S. and abroad. All information is cross-referenced for easy access. Data from other published sources are the latest available at the time of writing the report. All analysts and writers have access to Mintel’s market size and economic factors database. This is a database containing all areas of consumer expenditure and macroeconomic and demographic factors which affect consumer spending. This database is used in conjunction with an SPSS forecasting package to produce a market size forecast. Mintel subscribes to a number of online databases which are made available to our analysts.

Appendix: Research Methodology Bottled Water U.S. consumer intelligence, December 2003
©
SOURCES Where data are provided by a particular source, the source is indicated below the Figure (Table). Often figures are sourced “Mintel”. This means that information is derived from a variety of sources, with the writer filling in any information gaps or interpreting data, to give an accurate representation of the market. In this way, it can be ensured that data are consistent both with other data in the report and the wider array of Mintel data. Data that are estimated are referenced as such either because the original source data are only at the estimated stage and are not finalized or because they have been estimated by Mintel analysts. DEFINITIONS Most demographic definitions in the reports are self-explanatory; please contact Joan Heaney or Bill Patterson at 312.932.0400 if you have further questions. FORECASTS Market forecasts are created by Mintel’s in-house statisticians using the SPSS and/or SMARTFORECASTING software packages. The statisticians correlate historic market size data with key economic and demographic variables, identifying those factors having most influence on the market. Using forward projections of these factors, a market size forecast is produced. Mintel has compiled its own database of key economic and demographic variables from government and independent sources. The database includes both historical and projected data and are used in combination with Mintel’s own market size and segmentation database.

Appendix: What is Mintel? Bottled Water U.S. consumer intelligence, December 2003
©
APPENDIX: WHAT IS MINTeL? MINTeL PUBLICATIONS In the UK, Mintel publishes over 25 reports each month, covering a wide range of sectors and focusing on topical marketing issues. The ‘Intelligence’ reports are published in five series—Market, Leisure, Retail, Finance and Special Reports—as well as the Irish Series, Industrial, EuroViews and the Internet series. In the U.S., Mintel publishes its consumer intelligence series of reports. consumer intelligence covers 13 sectors: Foodservice, Food, Drink, Pursuits/Hobbies, Travel, Clothing/Fashion, Health/Medical, Beauty/Personal, Household, Services, Publishing, Automotive and e-commerce. Mintel publications provide analysis of market sizes and trends, market segmentation, and consumer attitudes and purchasing habits, as well as assessing the future of the market. By providing a comprehensive picture of the consumer, Mintel’s reports provide thorough analyses of market sectors, breaking down often complex issues into easy-to-understand sections that detail marketing opportunities and weaknesses. What does the future hold for my business? What do my consumers want? What strategies are my competitors employing? What is likely to happen over the next few years? The future of your marketing depends on answering these questions—something Mintel prides itself on. The key to being well equipped for the future is a better understanding of the present. So whatever your question, Mintel will have the answer. Mintel also publishes an Index, updated every month, which is a comprehensive guide to all reports published by Mintel publications from 1998 to date. If you would like details of an earlier report or further details regarding any of the reports mentioned in the Index, please contact the Mintel information team in Chicago at 312.932.0400 or in London at +11 44 (0)20 7606 4533 or email [email protected].

Appendix: What is Mintel? Bottled Water U.S. consumer intelligence, December 2003
©
MINTeL SERVICeS Operating for more than 25 years, Mintel Services has unrivaled, independent experience in the fast-moving product intelligence market. Our in-house team researches trends in consumer packaged goods (cpg) sectors and offers specialist in-depth analyses and services. No other information service provider can put you in touch with global consumer markets by sourcing new or established products, putting them in your hands, monitoring your competitors in stores in over 130 countries, performing quality analyses, and providing a breadth and depth of published data which are simply unrivaled. Mintel Services can provide a customized service, with tactical delivery of information according to your requirements, or offer you a comprehensive range of products and publications. Product retrieval You’ve seen or heard of a product existing in Australia that has given you an idea…but first you want to get your hands on the real thing. One phone call to Mintel Services and we will have one of our field associates retrieve the product, from the country you specify, within 24 hours. As soon as possible, the product will be on your desk. The product retrieval service allows you to perform quality assurance tests, generate new product ideas, undertake consumer product sampling, procure products for tasting panels, identify gaps in the market, perform competitor evaluations, and evaluate new export markets. Retail audits You can receive regular details and updates about your competitors’ single items, whole product ranges, or from particular outlets, delivered straight to your door, as often as you wish. Data can also be collected simultaneously in any number of countries to give you instant worldwide snapshots of particular consumer markets. Many of our researchers use electronic messaging services to deliver the data to you, via Mintel Services, within hours of being collected. Within hours of your request, we can have one of our worldwide contacts out in a store, surveying the state of your and your competitors’ products. For each product or brand, any or all of the following information can be collected, pricing surveys, comprehensive shelf surveys, trade-age surveys, and pack appearance monitoring. Tailored research You simply brief our worldwide network of field associates as to which sectors you are interested in, and they will constantly monitor the retail shelves and trade literature in their region for the new products. The information will then be compiled and sent to you—putting your finger on the pulse, yet keeping your hands free.

Appendix: What is Mintel? Bottled Water U.S. consumer intelligence, December 2003
©
If you require something more specific, just tell us what you want and our network of researchers can be your eyes and ears. You will have a global army of information gatherers working for you. Whether it’s a particular variety of coffee bean found in Papua New Guinea or spices in India, the network will be on the lookout for your requirements. Choose from any combination of our core services and tailor them to suit your own individual company needs, budget and preferences. You can make two kinds of decision. One is informed, the other is not. Track it. Trial it. Try it, with Mintel Services. For details on how to set up an account with Mintel Services, or to discuss your latest project, telephone Paul Phillips at 312.932.0400 or email [email protected].

Appendix: What is Mintel? Bottled Water U.S. consumer intelligence, December 2003
©
Global New Products Database The world’s premier editorial coverage of new product development, the gnpd is a comprehensive database that monitors worldwide product innovation in consumer packaged goods markets, offering unrivaled coverage of new product activity for competitor monitoring and product idea generation. The gnpd covers: • food, beverage and non-food sectors • 31 categories and 101 sub-categories • all key global markets. The gnpd features: • pictures, ingredients, product details and descriptions of all key new products • fully searchable fields • ability to save search criteria • front page that can be customized to user preferences • extract facility to create customized reports and presentations • daily updates • email alert service to deliver the latest news straight to your desktop • dedicated customer service • free consultancy advisory service from our highly experienced editorial teams in London and
Chicago • full IT training from the gnpd helpdesk. Whether you want to monitor how your market is evolving or require instant information on a specific product, you’ll find it all at your fingertips with gnpd.

Appendix: What is Mintel? Bottled Water U.S. consumer intelligence, December 2003
©
RESEARCH SUPPORT/CONSULTANCY/MIC • Mintel’s in-house market analysts are on hand to assist subscribers with any further questions
on published reports. • MiC—the Mintel Information Center—provides an excellent complementary service for
additional customized information requests. The Mintel Information Centre (MiC) • Analyzing any figure, any market, any country • MiC is the information center of Mintel, undertaking customized research which range from a
simple question to the commissioning of exclusive and in-depth market research studies. • Saving you not only time and money, but also energy • Answers can be on your desktop in a fraction of the time compared with conducting or
organizing the search yourself • Access to a vast array of online information services • Unparalleled library of business and marketing information, statistics, trade journals and
within-industry contacts • Each enquiry handled by a professional research manager (even if it is just providing a single
figure). There are two ways to use the MiC service—as a subscriber or ad hoc. A subscription starts from £1,000 and this money is deposited in an account and used as payment for any information delivered. If you cannot find the report you want listed in our published titles, simply ask MiC to write it for you. MiC is in a unique position to bring together proven experts on many CPG, leisure, financial and retail markets, together with consumer lifestyle and attitudinal findings, to produce authoritative market studies that will be concise, easy to read and actionable. PR Research Mintel’s expertise in producing tailor-made market research with maximum media appeal has been built up over many years. Mintel’s strength is that we produce independent, reliable research respected by both end users—manufacturers, retailers, financial institutions, leisure companies etc.—and the media. Through MiC, you can commission a report that serves the dual purpose of forming the base for a publicity campaign, yet remains a strategic document to be used in the product development process. For details on how to set up an account with MiC, or to discuss your latest PR project, simply telephone Sarah Cocker on +11 44 (0)20 7606 4533 or email [email protected].