table of contents - asian development bank · twg-g technical working group on gender ... cheung...
TRANSCRIPT


Poverty & Social Impact Assessment (PSIA) ii
TABLE OF CONTENTSAcknowledgements............................................................................................................iiiAcronyms and abbreviations.............................................................................................. ivList of Tables....................................................................................................................viiList of Figures...................................................................................................................viiList of Boxes ....................................................................................................................viiExecutive Summary .........................................................................................................viii1.0 Overview of the WDC Project................................................................................... 12.0 Project Poverty & Social Impact Assessment............................................................. 3
2.1 Scope of Services and Objectives ............................................................................ 3
2.2 Survey design and methodology............................................................................... 4
3.0 Project Overall Performance (Results) ...................................................................... 64.0 Project Impact ...................................................................................................... 10
4.1 Summary of baseline conditions ............................................................................. 10
4.2 Post-Project conditions of producer group members................................................. 11
4.3 Changes in the incomes of direct beneficiaries as a result of the transfer of technicalknowledge and skills provided by the project for improving design, processing andproduction techniques for small-scale handicraft and food Production........................ 16
4.4 Changes in consumption, quality of life and poverty status of direct beneficiaries........ 19
4.5 Assessment of extent to which knowledge and skills acquired by direct beneficiariesfrom the project have been shared with others in their communities........................... 22
4.6 Impact of the project on gender attitudes and relations in the project’s target areas..... 23
4.7 Improvements in the capacity of WDC, PDWA and MoWA technical staff: KI WDC ..... 24
4.8 Beneficiary profiles/case studies of Beneficiaries in project villages ........................... 26
5.0 Project Effectiveness: community interaction, mobilization, participation, social capitaland the degree of beneficiary buy-in to the achieve the objectives of the project ......... 38
6.0 Project Relevance: community-based approach to enterprise development, overalloutcomes ............................................................................................................. 39
7.0 Project Sustainability Assessment .......................................................................... 428.0 Conclusions: challenges, limitations and opportunities.............................................. 459.0 Detailed recommendations .................................................................................... 46Annexes ......................................................................................................................... 48
Annex 1. Summary of the Household SurveyAnnex 2. QuestionnairesAnnex 3. Terms of ReferenceAnnex 4. Research Team

Poverty & Social Impact Assessment (PSIA) iii
ACKNOWLEDGEMENTS
The research team acknowledge their gratitude to H.E. KETH Sam Ath, CPU members,Project Consultants, National Management Consultants and PIU staff in the provinces ofKampong Chhnang and Siem Reap for their generous support, feedback, comments and forfacilitating the information gathering by the research team for this Research Assessment.

Poverty & Social Impact Assessment (PSIA) iv
ACRONYMS AND ABBREVIATIONSACLEDA Association of Cambodian Local Economic Development AgencyADB Asian Development BankAMK Angkor Mikroheranhvatho (Kampuchea) Co., LtdBDS Business Development ServicesCARDI Cambodian Agricultural Research Development InstituteCaRM Cambodia Resident Mission, ADBCBOs Community Based OrganizationsCEDAC Centre d’Etude et de Développement Agricole CambogienCfC................................Carpets for CommunitiesCPGC…………………..Commune Producer Group CentersCRA Community Resource AssessmentEcDev Economic DevelopmentEDAP Enterprise Development Action PlanEEOW Expanding Employment Opportunities for Women (ILO/Japan
project)FAO.............................. Food and Agriculture OrganizationFGD Focus Group DiscussionFYI For Your InformationGDCC Government-Donor Cooperation CommitteeGET Ahead................... Gender and Enterprise TogetherGIM Grant Implementation ManualGTZ German Technical CooperationGWG Gender Working GroupHATHA KASEKOR The Name of Micro-Credit Agency (Achievements of Farmers?)ILO International Labour OrganizationIOs International OrganizationJFPR Japan Fund for Poverty ReductionJICA Japan International Cooperation AgencyKCH Kampong Chhnang ProvinceKI Key InformantsKWHA........................... Khmer Women’s Handicraft Associationm MeterMEF Ministry of Economy and FinanceMFI Micro finance institutionMOI Market Opportunity IdentificationMoP Ministry of PlanningMoU.............................. Memorandum of UnderstandingMoWA Ministry of Women’s AffairsMSE Micro and small enterpriseMTC Management and Training ConsultantNGOs Non-Governmental OrganizationNSDP National Strategic Development PlanNTFP............................ Non-Timber Forest Products
Poverty & Social Impact Assessment (PSIA) v
PC Project CoordinatorPCU Project Coordination UnitPDWA Provincial Department of Women’s AffairsPGE Partnership for Gender Equity (UNDP project)PIU Project Implementation UnitPMC Project Management ConsultantPMG Priority Mission GroupPRA Participatory Rapid AppraisalPRASAC Programme de Rehabilitation et d’Appui au Secteur Agricole du
CambodgeRGC Royal Government of CambodiaSOE Statement of ExpendituresSRP Siem Reap ProvinceTC Technical CoordinatorTWG-G Technical Working Group on Gender (of the GDCC)UNDP United Nations Development ProgrammeVCA Value Chain AnalysisWDC Women’s Development CenterWID Women in Development

Poverty & Social Impact Assessment (PSIA) vi
Cambodian Terms used in the DocumentAngrot Bamboo sieve used for fishingCheung Tea Cabbage with leaves like duct foot.Chongkeus Cabbage long-leafed like chopsticks.Kanchreng fish Fish basket made from bambooKhatna BroccoliKheav Cabbage Chinese cabbage, green-leafedKheng A big basket, made from bambooKou Yon Local tractor made as vehicle for transporting peopleKraloar Bamboo Sieve-narrow spacedKraloar Bamboo sieve with wider space for carrying vegetablesKronhanh Lettuce.Nonong GourdPandanus/Romchek Pandan leaf with serrated leaves.Proa/paao Umbrella PlantRemorque Trailer towed by bicycle, motorbike or handtractorSiek Basket/Pkleak Flat bamboo basketHatha Kasekor Achievements of Farmers, a micro-finance institutionKome woven mat with intricate and colourful designSiek/Pkleak bamboo baskets
Currency: Exchange rate: US$ 1= Riel 4,100
Poverty & Social Impact Assessment (PSIA) vii
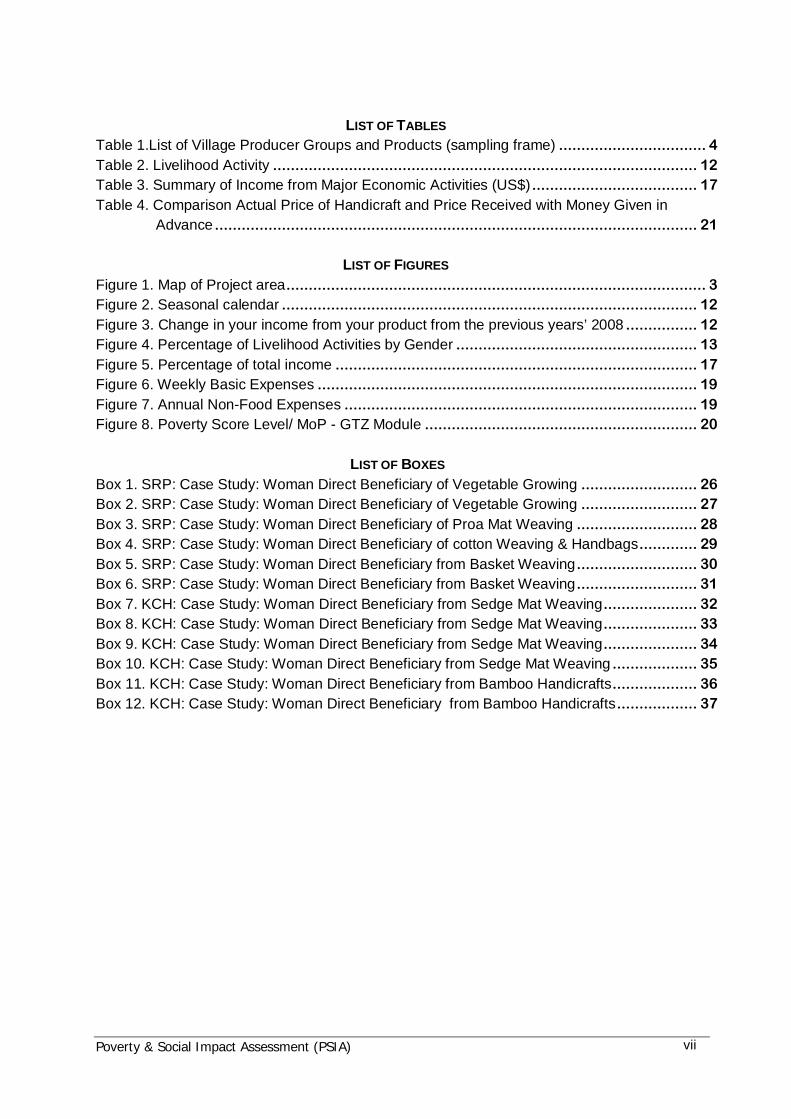
LIST OF TABLESTable 1.List of Village Producer Groups and Products (sampling frame) ................................. 4Table 2. Livelihood Activity ............................................................................................... 12Table 3. Summary of Income from Major Economic Activities (US$) ..................................... 17Table 4. Comparison Actual Price of Handicraft and Price Received with Money Given in
Advance ............................................................................................................ 21
LIST OF FIGURESFigure 1. Map of Project area.............................................................................................. 3Figure 2. Seasonal calendar ............................................................................................. 12Figure 3. Change in your income from your product from the previous years’ 2008 ................ 12Figure 4. Percentage of Livelihood Activities by Gender ...................................................... 13Figure 5. Percentage of total income ................................................................................. 17Figure 6. Weekly Basic Expenses ..................................................................................... 19Figure 7. Annual Non-Food Expenses ............................................................................... 19Figure 8. Poverty Score Level/ MoP - GTZ Module ............................................................. 20
LIST OF BOXESBox 1. SRP: Case Study: Woman Direct Beneficiary of Vegetable Growing .......................... 26Box 2. SRP: Case Study: Woman Direct Beneficiary of Vegetable Growing .......................... 27Box 3. SRP: Case Study: Woman Direct Beneficiary of Proa Mat Weaving ........................... 28Box 4. SRP: Case Study: Woman Direct Beneficiary of cotton Weaving & Handbags............. 29Box 5. SRP: Case Study: Woman Direct Beneficiary from Basket Weaving........................... 30Box 6. SRP: Case Study: Woman Direct Beneficiary from Basket Weaving........................... 31Box 7. KCH: Case Study: Woman Direct Beneficiary from Sedge Mat Weaving..................... 32Box 8. KCH: Case Study: Woman Direct Beneficiary from Sedge Mat Weaving..................... 33Box 9. KCH: Case Study: Woman Direct Beneficiary from Sedge Mat Weaving..................... 34Box 10. KCH: Case Study: Woman Direct Beneficiary from Sedge Mat Weaving ................... 35Box 11. KCH: Case Study: Woman Direct Beneficiary from Bamboo Handicrafts................... 36Box 12. KCH: Case Study: Woman Direct Beneficiary from Bamboo Handicrafts.................. 37

Poverty & Social Impact Assessment (PSIA) viii
EXECUTIVE SUMMARYThe Women’s Development Centers (WDC) Project was implemented by the Ministry ofWomen’s Affairs (MoWA) of the Royal Government of Cambodia (RGC), with grant fundingfrom the Japan Fund for Poverty Reduction (JFPR), administered by the Asian DevelopmentBank (ADB) at a cost of US$2,200,000. The project started 9 March 2006 and wascompleted 13 March 2010.The project areas was in six communes in the provinces of SiemReap and Kampong Chhnang. The overall goal of this project is to reduce poverty byincreasing access to services that support women’s social and economic empowerment. Theproject’s specific objectives are to:
1. Facilitate human development for poor women through life-skills training andadvocacy support;
2. Develop and support micro- and small entrepreneurship by providing adequateinformation, facilitating access to credit, and enabling links to various organizationsand resources; and
3. Build the capacity of institutions that promote a women-friendly entrepreneurialenvironment.
This report on the poverty and social impact assessment comprises the end-of-projectevaluation. The information came from the review of documents generated by the projectand field information coming from a household survey of 180 project beneficiaries, keyinformant interviews, focus group discussions and case studies of 12 women beneficiaries.
The major achievements in the four components for this Project are as follows:
A. Women Development Center (WDC) facility development. Construction of the WDCbuilding in Siem Reap and upgrading of the WDC facility in Kampong Chhnangprovinces; setting up of 5 Commune Producer Group Center (CPGC); staffing,equipment and tools provision and setting up of display area; CPGC centers arefunctioning as well-utilized gathering areas for producer groups;
B. Life Skills Training and Advocacy Support for Women. An integrated counselingprogram on “Family Management and Planning Skills”, was implemented, comprisingthe following interventions: 66 village-workshops on “Women Worker Rights andHome Safety” attended by 2,253 participants; 2 provincial workshops on “Life Skillsand Family Income Generation” conducted; 27 workshops on “Repair andMaintenance of Motorcycles and Other Small Machines” was offered to 413participants; 32 two-day workshops on “Nutrition and Sanitation” attended by 640participants; 3 two-day workshops on “Post-harvest Processing” were attended by 60participants in Siem Reap; a two-day study tour on vegetable farming wasconducted for 20 women; and 26 three-day workshops on “Food Processing” wereattended by 386 participants; and a five-day training-of-trainers workshop was heldfor 12 staff of Provincial Department of Women’s Affairs (PDWA) and WDC.
C. Micro- and Small Enterprise Development and Support. The Project aimed atendowing 3,000 women with entrepreneurial skills in micro- and small enterprisedevelopment. The project utilized a participatory approach to fostering market-

Poverty & Social Impact Assessment (PSIA) ix
oriented rural enterprises, implementing the following interventions: six CommunityResource Assessment (CRA) exercises; 17 village-level three-day Gender andEnterprise workshops, attended by 540 participants; the organization of 76 producergroups, comprised of 889 members; the design and implementation of a substantialnumber of skills training sessions, focused on the production and marketing of theproject-identified handicrafts (i.e., sedge mat, bamboo handicrafts, triangle sedgemats, rattan, pandanus and proa mats); assisted the WDC/PDWA conduct marketresearch exercises, investigating the market for the focus products, recruited trainersand communicated with likely buyers; offered marketing support to the producergroups, assisting with product exhibits, trade fairs and product exposure at variousconferences.
D. Capacity Building and Project Management Support. The project targeted theimproved capacity of 100 provincial department staff, 40 ministry staff and 20 WDCstaff. Institutional strengthening was undertaken through hands-on coaching,planning, assessment and advice. Because of these interventions, staff gained theability to utilize participatory market-oriented approaches to enterprise development,the “GET Ahead” process and PRA-CRA methodologies. These new skills, in turn,enabled them to facilitate project activities in the areas of awareness raising,counseling and skills development activities for the community and producers’groups. The project also provided senior staff with substantial exposure to inter-agency discussions on gender and enterprise development, enhancing theirunderstanding of both concepts.
Project Impact
The project has considerably enhanced the use of off-farm enterprise as a major secondarysource of livelihood, after the mainstay activity – paddy agriculture. In Siem Reap, vegetablegrowing is now engaged in by one-third of households, while rattan and proa mat handicraftsprovide income for 14-16% of households. In Kampong Chhnang, sedge mat weaving iscommon among half of the households, and bamboo handicraft provides income for some14%. The project encouraged more participation in the off-farm enterprise to enable incomegeneration for an additional 6-10 months per year. Most of the producers indicated that theiroff-farm enterprises are providing them more income, with a premium arising from the use ofthe quality controls and designs introduced by the project.
In Kampong Chhnang, sedge mats producers have annual net earnings of almost US$75and bamboo handicraft producers reported incomes of US$49 per year. Vegetableproducers for both provinces reported earning over US$195 from the activity. In Siem Reap,net earnings from proa mats production was almost US$50, rattan production US$48 andleaf mat manufacture US$18.29. The main market of their produce is still the local market,with most of the producers still reliant on local traders. Several producers are trapped in thisrelationship because the traders provide advance payment on the products, a practice thatresults in the producers being bound to low prices and indebtedness.
Poverty & Social Impact Assessment (PSIA) x
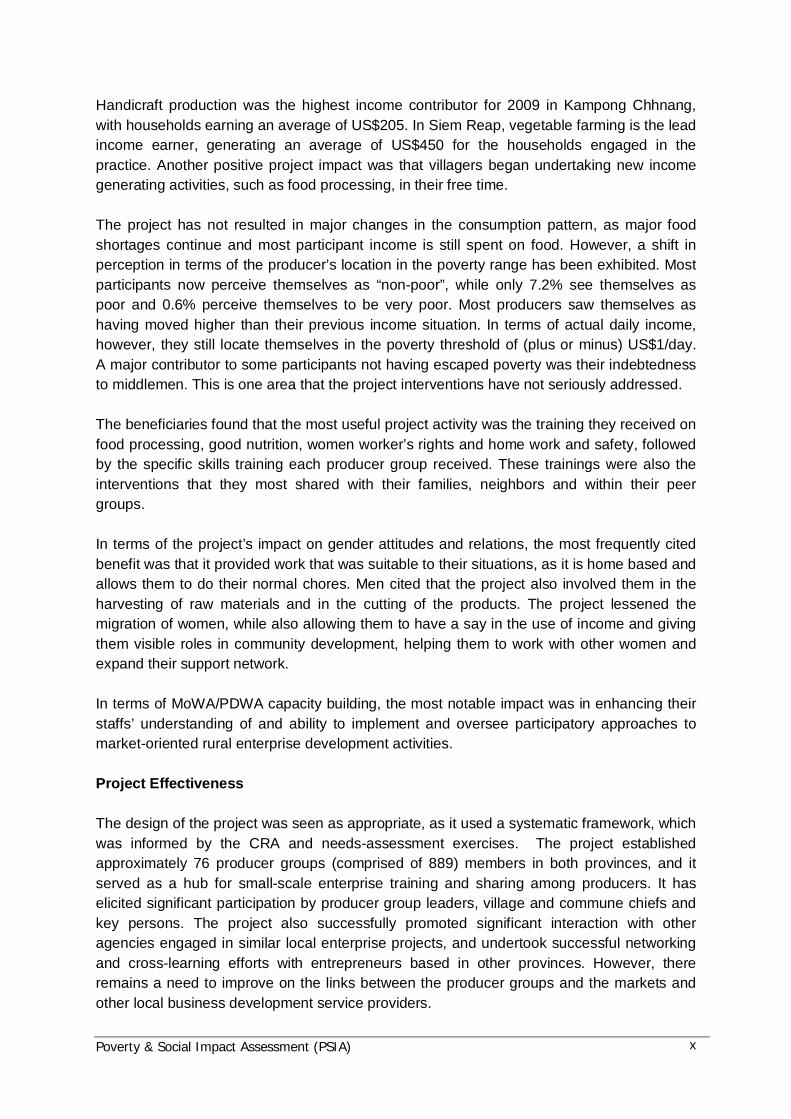
Handicraft production was the highest income contributor for 2009 in Kampong Chhnang,with households earning an average of US$205. In Siem Reap, vegetable farming is the leadincome earner, generating an average of US$450 for the households engaged in thepractice. Another positive project impact was that villagers began undertaking new incomegenerating activities, such as food processing, in their free time.
The project has not resulted in major changes in the consumption pattern, as major foodshortages continue and most participant income is still spent on food. However, a shift inperception in terms of the producer’s location in the poverty range has been exhibited. Mostparticipants now perceive themselves as “non-poor”, while only 7.2% see themselves aspoor and 0.6% perceive themselves to be very poor. Most producers saw themselves ashaving moved higher than their previous income situation. In terms of actual daily income,however, they still locate themselves in the poverty threshold of (plus or minus) US$1/day.A major contributor to some participants not having escaped poverty was their indebtednessto middlemen. This is one area that the project interventions have not seriously addressed.
The beneficiaries found that the most useful project activity was the training they received onfood processing, good nutrition, women worker’s rights and home work and safety, followedby the specific skills training each producer group received. These trainings were also theinterventions that they most shared with their families, neighbors and within their peergroups.
In terms of the project’s impact on gender attitudes and relations, the most frequently citedbenefit was that it provided work that was suitable to their situations, as it is home based andallows them to do their normal chores. Men cited that the project also involved them in theharvesting of raw materials and in the cutting of the products. The project lessened themigration of women, while also allowing them to have a say in the use of income and givingthem visible roles in community development, helping them to work with other women andexpand their support network.
In terms of MoWA/PDWA capacity building, the most notable impact was in enhancing theirstaffs’ understanding of and ability to implement and oversee participatory approaches tomarket-oriented rural enterprise development activities.
Project Effectiveness
The design of the project was seen as appropriate, as it used a systematic framework, whichwas informed by the CRA and needs-assessment exercises. The project establishedapproximately 76 producer groups (comprised of 889) members in both provinces, and itserved as a hub for small-scale enterprise training and sharing among producers. It haselicited significant participation by producer group leaders, village and commune chiefs andkey persons. The project also successfully promoted significant interaction with otheragencies engaged in similar local enterprise projects, and undertook successful networkingand cross-learning efforts with entrepreneurs based in other provinces. However, thereremains a need to improve on the links between the producer groups and the markets andother local business development service providers.

Poverty & Social Impact Assessment (PSIA) xi
Project Relevance and Sustainability
In line with the overall goals, the project proved relevant in addressing the conditions it wasdesigned to tackle, particularly as regards providing better options for off-farm income-earning activities that would enable women and households to supplement their subsistenceagriculture livelihoods. The project improved the entrepreneurial skills of women artisans andprovided impetus for overall female empowerment in the community. It also proved to bestrong in designing the individual interventions so that they were participatory in nature andappropriate to the local context, although it needs to address the issues that will be critical atthe next level, e.g., collective marketing, strengthening the producer groups’ links to marketsand establishing local sources for business-related inputs (including savings and capital).
In terms of the project’s sustainability goals, the trained producer groups have remainedintact, representing a viable resource for pursuing entrepreneurship objectives, and theunderlying resource base for raw materials is still sustainable. Furthermore, the project hasinitiated the transformation of the WDC into an enterprise center, although there arelimitations that will hinder that process, such as the absence of a plan, limited resourcesfrom MoWA and a shortage of staff with management skills or experience with enterprisedevelopment projects.
Recommendations
A major factor on the recommendations section is that the WDC Project was due to end 13March 2010, with no next phase Project Plan by MoWA and no appropriation for thecontinued operations of the WDC. To solidify the gains made by the project, MoWA mustcommit to mapping out the next phase and seek funds for continuation and for a morestrategic direction. To move onto the next step, the WDC management should consider thefollowing:
· Extending the institutional support network to include business development services· Integrate private sector actors and local traders into the process· Enable the producer groups to grow as self-help groups by enabling them with
mechanisms for savings and access to micro-credit· WDC should observe and employ techniques used by other self-sustaining social
enterprises· Continuing product promotion through the media and product fairs· Enlist the assistance of other donors and investors, including NGOs and private
sector actors· Continue to identify innovative, niche products that groups can successfully market

Poverty & Social Impact Assessment (PSIA) 1
1.0 OVERVIEW OF THE WDC PROJECT
The Women’s Development Center's (WDC) Project was implemented by the Ministry ofWomen’s Affairs (MoWA) of the Royal Government of Cambodia (RGC) with grant fundingfrom the Japan Fund for Poverty Reduction (JFPR), administered by the Asian DevelopmentBank (ADB). The total cost of this project was approximately US$2,200,000, of which theJFPR provided grant financing of $1,800,000, and MoWA – together with members of civilsociety and the target communities – provided the amount of $400,000 or equivalent inlabor, office space and materials, counterpart staff and land. The Letter of Agreement for thisproject was signed on 9 March 2006 and project inception officially began with the ADBMission fielded in April 2006. This project was completed 13 March 2010.
The aim of the project was to support an innovative approach to empowering women sociallyand economically and to improving their well-being. The project constructed a new Women'sDevelopment Center (WDC) facility in Siem Reap and upgraded an existing WDC inKampong Chhnang. WDCs are envisioned to be one-stop, women-friendly facilities thatprovide support beyond traditional skills training and promote greater participation for womenin the mainstream economy. The WDCs are expected to encourage women to participate inthe business sector and benefit from the increased importance and attention being paid tomicro- and small enterprises. They are also expected to further develop a market orientationin women’s economic and income-generating choices and to help them achieve greateraccess to capital and business support services.
The WDC facilities functioned beyond providing entrepreneurial skills training for women,also undertaking activities aimed at promoting the social and economic empowerment ofwomen, as well as activities for advocacy support and awareness-raising campaigns. Thiswill instill confidence and dignity in poor women and improve their ability to meet their needsat home, at work and in their communities.
In addition to being a business resource and information center, the WDCs served as abusiness startup referral service. Supporting activities, such as business incubator units,equipment, and assistance in product development and business licensing were provided.These activities were supported by capacity improvements among key Government andWDC staff. The project aimed to improve the quality of life of about 3,000 women, whichequates to approximately 12,000 household members that benefited from the improved skillsand increased income gained by the target beneficiaries.
a) Project Goal, Development Objectives and Key Components
The overall goal of this project is to reduce poverty by increasing access to services thatsupport women’s social and economic empowerment.
The development objectives are to:1. Facilitate human development for poor women through life-skills training and advocacy
support;

Poverty & Social Impact Assessment (PSIA) 2
2. Develop and support micro- and small entrepreneurship by providing adequateinformation, facilitating access to credit, and enabling links to related organizations andresources; and
3. Build the capacity of institutions that promote women-friendly entrepreneurialenvironments.
The JFPR Project had four components:· Component A: WDC Facility Development and Upgrading – building construction and
facility rehabilitation.· Component B: Life Skills and Advocacy Support – counseling; advocacy support; life
skills training; and daycare support/facilitation for about 50 children.· Component C: Micro and Small Enterprise Development and Support – training for
entrepreneurial skills; development of a business referral/one-stop facility for femaleentrepreneurs.
· Component D: Capacity Building and Project Management Support – projectadministration; procurement of goods and services; capacity building improvementsfor ministerial, provincial, and WDC staff; poverty impact assessment.
The expected outputs of the WDC Project were as follows:· The construction of a new 1,500 square meter WDC building facility in Siem Reap
and upgrade of a 900 square meter WDC facility in Kampong Chhnang,· To enable:
i. Counseling support for 1,000 women.ii. Knowledge of individual rights and advocacy support for 3,000 women.iii. Awareness for good sanitation and hygiene for 12,000 beneficiaries through
outreach programs.· To provide entrepreneurial skills in micro- and small enterprise development for
3,000 women.· To improve the capacity of 100 provincial department staff; 40 ministry staff, and 20
WDC staff.

Poverty & Social Impact Assessment (PSIA) 3
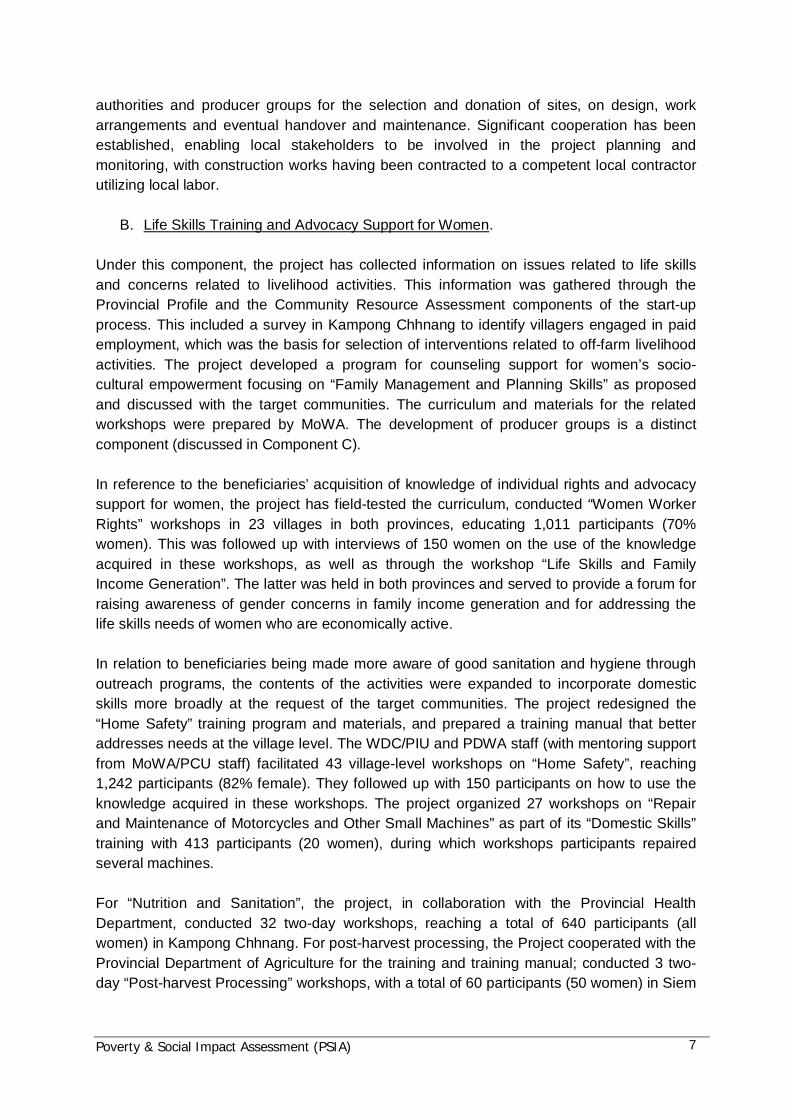
b) Project AreasThe Project areas arelocated in theprovinces ofKampong Chhnangand Siem Reap. Thisencompasses thefollowing sixcommunes: SvayCheck, Samrong, andLeang DaiCommunes in SiemReap and CheungKriev, Trangel, andToek HoutCommunes inKampong Chhnang.
Figure 1. Map of Project area
2.0 PROJECT POVERTY & SOCIAL IMPACT ASSESSMENT
This study on the poverty and social impact assessment in Kampong Chhnang and SiemReap Provinces of Cambodia is part of the end-of-project evaluation of the WDC Project.This is consistent with The Terms of Reference, as prepared by Ministry of Women’sAffairs/JFPR 9081-CAM and the project consultants, which called for an independentconsultant to conduct the assessment.
2.1 SCOPE OF SERVICES AND OBJECTIVES
The scope of services/objectives of this study included the following areas of investigationand analysis:
I. Using Community Resource Assessments, Quarterly Progress Reports and otherProject data generated by the project's implementation. Conduct a household surveyof project beneficiaries, conducting interviews and collecting quantitative, qualitative,and subjective data from beneficiaries on project impacts.
II. Provide a summary of pre- and post-project conditions of producer group members.III. Quantify changes in the incomes of direct beneficiaries as a result of the transfer of
technical knowledge and skills provided by the project for improving design,processing and production techniques for small-scale handicraft and foodprocessing.
IV. To the extent feasible, assess changes in consumption, quality of life, and povertystatus of direct beneficiaries.

Poverty & Social Impact Assessment (PSIA) 4
V. Assess the extent to which knowledge and skills acquired by direct beneficiariesthrough project activities has been shared with others in their communities.
VI. Prepare beneficiary profiles/case studies of at least two women in each projectvillage, describing their history, their livelihoods, and the perceived benefits from theirparticipation in the project. Should be supplemented by quantitative data and photos.
VII. Assess the project’s effectiveness in terms of facilitating community interaction,mobilization, participation, social capital, and the degree of beneficiary buy-in to theachieve the objectives of the Project.
VIII. Assess the impact of the project on gender attitudes and relations in the project’starget areas.
IX. Assess the relevance and effectiveness of the community-led approach to enterprisedevelopment in the Cambodian context.
X. Assess the degree to which the project has achieved its objectives in terms ofdeliverable outputs under each component as outlined in the Grant ImplementationManual.
XI. Evaluate improvements in the capacity of MoWA technical staff engaged by theDepartment of Economic Development to deliver and sustain ongoing programs of asimilar nature in the future.
XII. Provide an assessment of the current and future effectiveness and sustainability ofthe Women’s Development Centers (WDCs) in Siem Reap and Kampong Chhnang.
2.2 SURVEY DESIGN AND METHODOLOGY
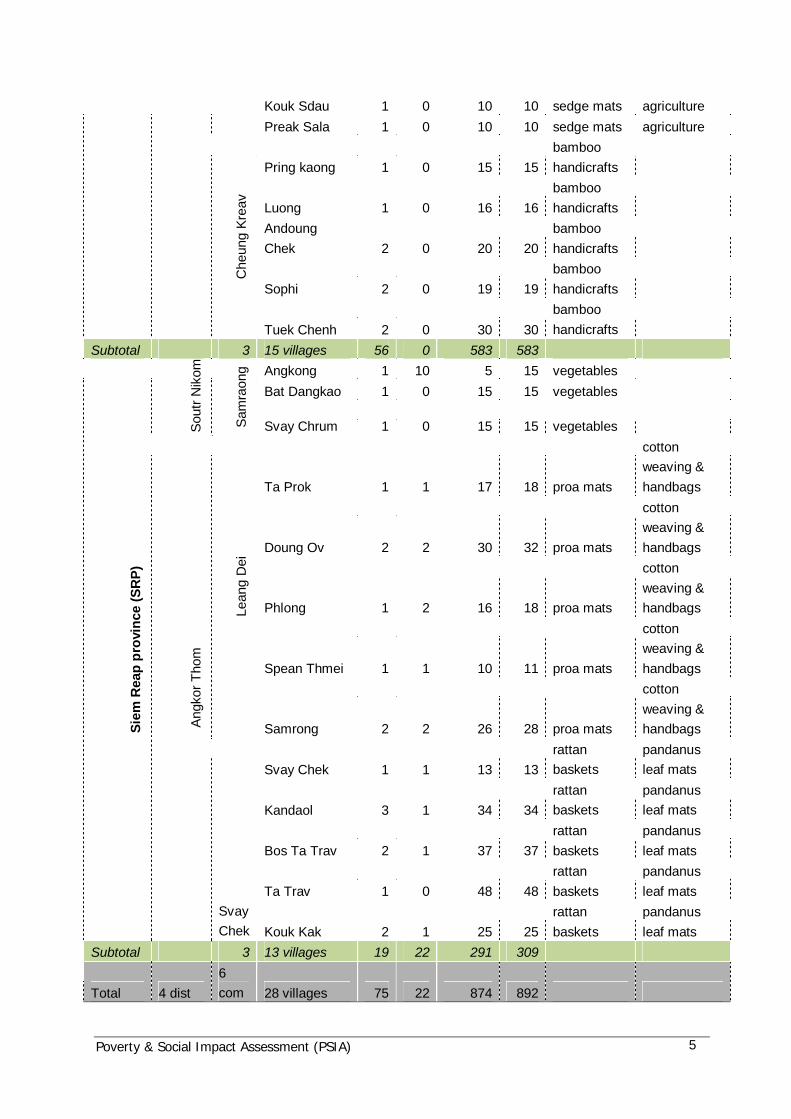
In line with the scope of services, a combination of household surveys, key informantinterviews, and focus group discussions were used as methods for gathering informationabout the WDC Project. These activities were conducted with a sampling of the WDCbeneficiaries, comprising 892 members coming from 75 groups, 28 villages, six communesand four districts in two provinces. A 20% sampling frame was used for the householdsurvey using purposive technique for a total 180 beneficiaries, as listed in Table 1 below.
Table 1.List of Village Producer Groups and Products (sampling frame)
Prov District Com Village
Gro
up
Men
Wom
en
Tota
l
Mai
nPr
oduc
t
Oth
erpr
oduc
ts
Khlaeng Poar 7 0 69 69 sedge mats agricultureAndoungRonuk 9 0 91 91 sedge mats agricultureTrangel 22 0 219 219 sedge mats agricultureTrabek 3 0 30 30 sedge mats agriculture
Kam
pong
Lea
ng
Trag
nel
Chres 2 0 24 24 sedge mats agricultureTrapeangKrapeu 1 0 10 10 sedge mats
agriculture
Tuek Hout 1 0 10 10 sedge mats agriculture
Kam
pong
Chh
nang
Pro
vinc
e(K
CN
)
Rol
ea B
'ier
Toek
Hou
t
Preak Reang 1 0 10 10 sedge mats agriculture
Poverty & Social Impact Assessment (PSIA) 5
Kouk Sdau 1 0 10 10 sedge mats agriculturePreak Sala 1 0 10 10 sedge mats agriculture
Pring kaong 1 0 15 15bamboohandicrafts
Luong 1 0 16 16bamboohandicrafts
AndoungChek 2 0 20 20
bamboohandicrafts
Sophi 2 0 19 19bamboohandicrafts
Che
ung
Krea
v
Tuek Chenh 2 0 30 30bamboohandicrafts
Subtotal 3 15 villages 56 0 583 583Angkong 1 10 5 15 vegetablesBat Dangkao 1 0 15 15 vegetables
Sout
r Nik
om
Sam
raon
g
Svay Chrum 1 0 15 15 vegetables
Ta Prok 1 1 17 18 proa mats
cottonweaving &handbags
Doung Ov 2 2 30 32 proa mats
cottonweaving &handbags
Phlong 1 2 16 18 proa mats
cottonweaving &handbags
Spean Thmei 1 1 10 11 proa mats
cottonweaving &handbags
Lean
g D
ei
Samrong 2 2 26 28 proa mats
cottonweaving &handbags
Svay Chek 1 1 13 13rattanbaskets
pandanusleaf mats
Kandaol 3 1 34 34rattanbaskets
pandanusleaf mats
Bos Ta Trav 2 1 37 37rattanbaskets
pandanusleaf mats
Ta Trav 1 0 48 48rattanbaskets
pandanusleaf mats
Siem
Rea
p pr
ovin
ce (S
RP)
Angk
or T
hom
SvayChek Kouk Kak 2 1 25 25
rattanbaskets
pandanusleaf mats
Subtotal 3 13 villages 19 22 291 309
Total 4 dist6com 28 villages 75 22 874 892

Poverty & Social Impact Assessment (PSIA) 6
Additionally, the following data/information collection methods were used for both provinces,with the following number of targeted respondents:
· Case Studies: 12 women, six in Siem Reap and six in Kampong Chhnang, all ofwhom were selected purposively through the Provincial Department of Women’sAffairs in the respective target provinces;
· Semi-structured individual interviews: 60 respondents from Siem Reap and 120respondents from Kampong Chhnang. all of whom were direct project beneficiaries..
· Key informant individual interviews: nine key informants, four key informants in SiemReap and five in Kampong Chhnang.
· Focus Group Discussions (FGD), with two FGD per province, comprising a collectivetotal of 32 participants.
Both the beneficiary survey and the semi-structured questionnaires were designed in termsof content and format with the WDC Project Management Team. The coding entries werereferenced and the questionnaires underwent pre-testing prior to their full usage. The resultsfor the beneficiary survey were encoded and consolidated using the SPSS softwarepackage.
This report was structured according to the format agreed with the WDC ProjectManagement Team. The succeeding section will follow sub-section 1 in reference to projectimpact, using a comparative analysis of WDC baseline which used the Community ResourceAssessment (CRA) and which was validated by the beneficiary survey for its current status.Section 2 will examine the project’s effectiveness in terms of improving communityinteraction, mobilization, participation, social capital, and the degree of beneficiary buy-in tothe achieve the objectives of the project. Sub-section 3 will look into relevance in terms ofthe use of the community-based approach to enterprise development and its overalloutcomes. Sub-section 4 will look into the assessment of the project’s sustainability. Finallysub-section 5 will consolidate the study’s conclusions, challenges, limitations, opportunitiesand recommendations.
3.0 PROJECT OVERALL PERFORMANCE (RESULTS)
The major achievements recorded by the four components for this project are as follows:
A. Women Development Center (WDC) facility development and upgrading in SiemReap and Kampong Chhnang provinces.
This component of the project is more than 90% completed. Both buildings have beenequipped with staff offices and production areas with the necessary equipment (sewingmachines, loom and tools). Five commune producer buildings have been constructed: two inSiem Reap and three in Kampong Chhnang, with Kampong Chhnang’s facilities nearingcompletion during this evaluation’s field work. The project has completed the necessarypreparatory work for this component, including the following: familiarization and upgrading ofstaff with procurement procedures, participatory consultations with provincial and local
Poverty & Social Impact Assessment (PSIA) 7
authorities and producer groups for the selection and donation of sites, on design, workarrangements and eventual handover and maintenance. Significant cooperation has beenestablished, enabling local stakeholders to be involved in the project planning andmonitoring, with construction works having been contracted to a competent local contractorutilizing local labor.
B. Life Skills Training and Advocacy Support for Women.
Under this component, the project has collected information on issues related to life skillsand concerns related to livelihood activities. This information was gathered through theProvincial Profile and the Community Resource Assessment components of the start-upprocess. This included a survey in Kampong Chhnang to identify villagers engaged in paidemployment, which was the basis for selection of interventions related to off-farm livelihoodactivities. The project developed a program for counseling support for women’s socio-cultural empowerment focusing on “Family Management and Planning Skills” as proposedand discussed with the target communities. The curriculum and materials for the relatedworkshops were prepared by MoWA. The development of producer groups is a distinctcomponent (discussed in Component C).
In reference to the beneficiaries’ acquisition of knowledge of individual rights and advocacysupport for women, the project has field-tested the curriculum, conducted “Women WorkerRights” workshops in 23 villages in both provinces, educating 1,011 participants (70%women). This was followed up with interviews of 150 women on the use of the knowledgeacquired in these workshops, as well as through the workshop “Life Skills and FamilyIncome Generation”. The latter was held in both provinces and served to provide a forum forraising awareness of gender concerns in family income generation and for addressing thelife skills needs of women who are economically active.
In relation to beneficiaries being made more aware of good sanitation and hygiene throughoutreach programs, the contents of the activities were expanded to incorporate domesticskills more broadly at the request of the target communities. The project redesigned the“Home Safety” training program and materials, and prepared a training manual that betteraddresses needs at the village level. The WDC/PIU and PDWA staff (with mentoring supportfrom MoWA/PCU staff) facilitated 43 village-level workshops on “Home Safety”, reaching1,242 participants (82% female). They followed up with 150 participants on how to use theknowledge acquired in these workshops. The project organized 27 workshops on “Repairand Maintenance of Motorcycles and Other Small Machines” as part of its “Domestic Skills”training with 413 participants (20 women), during which workshops participants repairedseveral machines.
For “Nutrition and Sanitation”, the project, in collaboration with the Provincial HealthDepartment, conducted 32 two-day workshops, reaching a total of 640 participants (allwomen) in Kampong Chhnang. For post-harvest processing, the Project cooperated with theProvincial Department of Agriculture for the training and training manual; conducted 3 two-day “Post-harvest Processing” workshops, with a total of 60 participants (50 women) in Siem
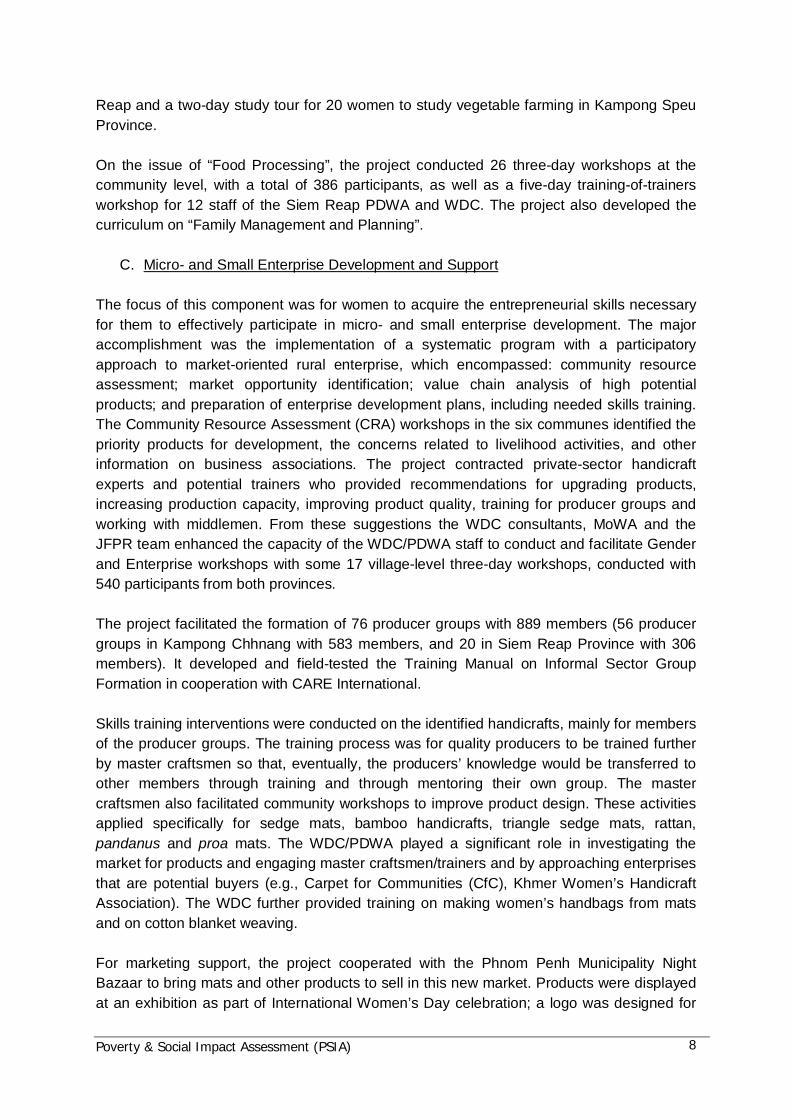
Poverty & Social Impact Assessment (PSIA) 8
Reap and a two-day study tour for 20 women to study vegetable farming in Kampong SpeuProvince.
On the issue of “Food Processing”, the project conducted 26 three-day workshops at thecommunity level, with a total of 386 participants, as well as a five-day training-of-trainersworkshop for 12 staff of the Siem Reap PDWA and WDC. The project also developed thecurriculum on “Family Management and Planning”.
C. Micro- and Small Enterprise Development and Support
The focus of this component was for women to acquire the entrepreneurial skills necessaryfor them to effectively participate in micro- and small enterprise development. The majoraccomplishment was the implementation of a systematic program with a participatoryapproach to market-oriented rural enterprise, which encompassed: community resourceassessment; market opportunity identification; value chain analysis of high potentialproducts; and preparation of enterprise development plans, including needed skills training.The Community Resource Assessment (CRA) workshops in the six communes identified thepriority products for development, the concerns related to livelihood activities, and otherinformation on business associations. The project contracted private-sector handicraftexperts and potential trainers who provided recommendations for upgrading products,increasing production capacity, improving product quality, training for producer groups andworking with middlemen. From these suggestions the WDC consultants, MoWA and theJFPR team enhanced the capacity of the WDC/PDWA staff to conduct and facilitate Genderand Enterprise workshops with some 17 village-level three-day workshops, conducted with540 participants from both provinces.
The project facilitated the formation of 76 producer groups with 889 members (56 producergroups in Kampong Chhnang with 583 members, and 20 in Siem Reap Province with 306members). It developed and field-tested the Training Manual on Informal Sector GroupFormation in cooperation with CARE International.
Skills training interventions were conducted on the identified handicrafts, mainly for membersof the producer groups. The training process was for quality producers to be trained furtherby master craftsmen so that, eventually, the producers’ knowledge would be transferred toother members through training and through mentoring their own group. The mastercraftsmen also facilitated community workshops to improve product design. These activitiesapplied specifically for sedge mats, bamboo handicrafts, triangle sedge mats, rattan,pandanus and proa mats. The WDC/PDWA played a significant role in investigating themarket for products and engaging master craftsmen/trainers and by approaching enterprisesthat are potential buyers (e.g., Carpet for Communities (CfC), Khmer Women’s HandicraftAssociation). The WDC further provided training on making women’s handbags from matsand on cotton blanket weaving.
For marketing support, the project cooperated with the Phnom Penh Municipality NightBazaar to bring mats and other products to sell in this new market. Products were displayedat an exhibition as part of International Women’s Day celebration; a logo was designed for

Poverty & Social Impact Assessment (PSIA) 9
future branding exercises as well as for use on labels and product tags; the “WiSE”trademark was registered with the Ministry of Commerce and a product exhibition wasorganized at a regional workshop on reducing violence against women. Kampong Chhnangproducts were exhibited at a National Trade Fair in Phnom Penh and the Siem Reap WDCwas introduced to private sector tour companies.
D. Capacity Building and Project Management Support: under this component, as of 13March 2010, the project had achieved the following:
In reference to WDC/PDWA management capacity building, the activities were facilitatedthrough the project consultants, MoWA, and the JFPR team. Institutional strengthening wasundertaken through hands-on coaching, planning, assessment and advice, notably on thefollowing: improving roles and responsibilities of staff; project activities’ managementthrough strategic action planning, improving counselling activities to beneficiaries throughtraining/workshops on business counselling, developing operations manuals, facilitatingoffice inter-actions through WDC, DoWA, PDWA, and MoWA meetings, and providingcomputer training.
To improve WDC advocacy and service-delivery capacity, the project familiarized staff with aparticipatory market-oriented approach to enterprise development (the “GET Ahead”process), as well as PRA-CRA methodologies. Facilitation was provided for staff trainingneeds assessment, facilitation training, and training-of-trainers on awareness-raisingactivities. The WDC consultants, MoWA, and the JFPR team also provided moral supportand coaching in many of the project component activities that the WDC and PDWA stafffacilitated.
To achieve the goals of improving MoWA staff members’ capacity to provide guidance andsupport to WDCs, and to promote women’s economic development and mainstream genderin economic policy, the project consultants, MoWA, and the JFPR team relied onmotivational measures and institutional strengthening activities. The project was linked to theframework of MEF’s Merit-based Pay Initiative (MBPI) and the MoWA strategic plan, NearyRattanak III. Significant training was provided for the MOWA Economic DevelopmentDepartment staff on a wide range of topics which will allow them to better support thedevelopment of the WDCs on the following: facilitation skills, data collection and analysis,participatory rural appraisal, community resource assessment, gender and enterprise,gender and economic development, home safety, women’s worker rights, gender analysisand gender in planning. The project also organized a training workshop entitled “OPERACY-Key to Personal Success and Leadership”.
The project’s support for mainstreaming gender in participatory economic development wasengendered in various elements of this component. The MoWA is widely recognized as akey proponent and source of expertise on gender-responsive, participatory economicdevelopment, and the WDC Project is an important source of expertise and assistance toenable women’s economic empowerment and the mainstreaming of gender in participatoryeconomic development.

Poverty & Social Impact Assessment (PSIA) 10
The project collaborated with other MoWA initiatives promoting women’s economicempowerment, with project staff attending and assisting in numerous relevant workshops,e.g. Workshop on Gender and Aid Effectiveness (World Bank, DFID, UNIFEM); Workshopson Gender and Women in Agriculture and Rural Development (FAO); ITC Joint AdvisoryGroup Meeting in Geneva; and the Seminar on Women and the Informal Economy inCambodia (MoWA and the US-based Women in Informal Employment: Globalizing andOrganizing (WIEGO). The PMC prepared a paper on “Integrating gender into trade sectorpolicy and priorities: Experience from Cambodia”, and accompanied the Minister of MoWA toan Expert Round-table on the Gender Dimensions of the Enhanced Integrated Frameworkorganized by the International Trade Centre (ITC) in Geneva. The MTC also providedassistance in preparing a proposal to the Government for a Food Processing Project for2008.
4.0 PROJECT IMPACT
4.1 SUMMARY OF BASELINE CONDITIONS
The baseline conditions for the agriculture and off-farm economic activities were establishedby the Community Resource Assessment conducted by the project in early 2007. Thisserved as the basis for measuring the impact of the WDC Project.
The project areas in Siem Reap faced major agriculture-related issues, including small landholdings with low crop yields, small subsistence livestock raising and lack of surplusproduction of vegetables. There are major constraints in terms of the lack of water during thedry season, the deteriorating soil quality, animal diseases and pest infestation of crops,although there is little use of chemical insecticides. Because farm land is far from the village,it is difficult to transport products to markets and middlemen abound. With limited access toany market information, middlemen are able to arbitrarily set prices. There is a lack oforganized production among the villagers, meaning they cannot collectively bargain forcheaper inputs or for fair prices. The identified issues for off-farm activity in mate weaving ismore related to technical concerns: these activities are done as supplemental effortsbecause they are time-consuming, are labor intensive, require relatively scarce rawmaterials, the collection of which from the forest requires time. Because the products arecrude, non-innovative and of traditional design, their customer appeal is limited and the pricethey command is relatively cheap. Wood-based production for plows and furniture are indecline, due to restrictions on logging, while palm sugar production faces a shortage of fuelwood. There are also further additional constraints, such as high transportation costs.
Similarly, for agriculture in Kampong Chhnang, rice crop cultivation takes place mainlyduring the wet season, although farm sizes are larger and yields seem higher at around2,000 kilograms per hectare. However, production is pesticide-intensive and thereforerequires investment and leads to the dominance of middlemen, money-lenders, andgenerally low purchase prices. Vegetable fields are existent, but these are remote andproducts are difficult to transport. Middlemen and traders monopolize the market andarbitrarily set the price of products. There is little knowledge among the villagers on costs

Poverty & Social Impact Assessment (PSIA) 11
and pricing, and they have no direct link to the market. For off-farm activities, there is redmat weaving handicraft work, but bamboo weaving is more prevalent. The production usesmanual techniques, traditional designs, and is a supplemental activity to agriculture. Tradingis dominated by product demands from middlemen and village brokers who buy the productsproduced by the households and sell it to other provinces. The practice of villagersborrowing money from middlemen in advance and paying it in the form of productscontributes to the products being traded at cheaper prices.
4.2 POST-PROJECT CONDITIONS OF PRODUCER GROUP MEMBERS
Information on the changes in the conditions of the producer group members is based on theresults of the household survey of 180 members of producer groups in the project area andvalidated through the focus group discussions of the study. (Appended as Annex 1.Summary of the Household Survey)
a. Household Status
The project beneficiaries affirm that rice farming is still generally the dominant economicactivity for all members of the household and the primary source of income for 93% of thepopulation. Livestock raising is prevalent in about nine out of 10 families involved. About 5%of Siem Reap’s population pursues livelihood activities for which vegetable farming is theprimary source of income. In all areas, rattan, bamboo, and sedge handicrafts have notexceeded 4% of the households as a primary source of income. As a secondary occupation,vegetable growing is common in Siem Reap (about 32% of households), while rattan andproa mat handicrafts are also considerable (16% and 14% of households, respectively). InKampong Chhnang, sedge mat weaving is the most widespread among households (51%),with bamboo handicraft also considerable (14%).
There have been no major changes in terms of the prevalent characteristics of economicproduction in the area. Characteristically, small land ownership patterns and limited rice cropproduction are trends which remain prevalent, and rice shortages are still a commonexperience, with some 40% of the respondents generally experiencing food shortages forthree to seven months each year. This is attributed to the high dependency ratio at 37.
b. Status of Micro-and-Small Entrepreneurship related to Identified Value Chain
In terms of the level of engagement in the livelihood activities in bamboo handicraft inKampong Chhnang, the project beneficiaries reported engagement in the activity for roughly10.7 months a year, with one-third of involved being adult females, 30% adult male, 42%female children and 40% male children. For sedge/triangle mat products, the activity isundertaken for approximately 4.5 months a year and involves all the members of the family,male and female.
Farming takes up their time for the four crucial cultivation months a year, due to the single-cropping system. Vegetable growing involves only a few households, with most of the workdone by the male and female children for only about three months each year. In Siem Reap,

Poverty & Social Impact Assessment (PSIA) 12
families (male and female adult) are engaged in rattan basket making for about sevenmonths a year. For proa mat making, the activity takes place about 6 months per year.Vegetable growing is much more common in Siem Reap, with about one-third of the adultsinvolved in the activity for an average of five months a year.
Rice farming remains the main livelihood, but, as there is no irrigation and permanent watersources, it takes up an average of 4.7 months, coinciding exactly with the rainy season.
Figure 2. Seasonal calendar
Figure 3. Change in your income from your product from the previous years’ 2008
Table 2. Livelihood Activity% Female
Adults% Male,Adults
%Femalechildren
% MaleChildren
KCHN=120
SRPN=60
KCHN=76
SRPN=53
KCHN=76
SRPN=5
KCHN=10
SRPN=3
Sedge/triangle sedge Mats 67 - 71 - 58 - 60 -Bamboo handicrafts 33 - 29 - 42 - 40 -Vegetables growing 6 33 8 32 11 20 10 33Proa Mats - 30 - 28 - 20 - 33
67.5%50.0%
75.0% 66.7% 70.0%100.0%
12.5%30.0%
15.0% 27.8% 15.0%20.0% 20.0% 10.0% 5.6% 15.0%
0.0%
20.0%
40.0%
60.0%
80.0%
100.0%
120.0%
Sedge/trianglesedge Mats
production (KCHN=80)
Bamboo handicraftsproduction (KCH
n=40)
Vegetables growingproduction SRP
N=20
Proa Matsproduction (SRP
N=18)
Rattan basketsproduction (SRP
N=20)
Pandanus leaf matsproduction (SRP
n=4)
Increase No change Decrease
0
20
40
60
80
100
120
140
Jan Feb Mar Apr May Jun Jul Aug Sep Oct Nov Dec
Sedge/triangle sedge Mats production (KCH N=80) Bamboo handicrafts production (KCH n=40)
Vegetables growing production SRP N=20 Proa Mats production (SRP N=18)
Rattan baskets production (SRP N=20) Pandanus leaf mats production (SRP n=4)
Rice Rice
Dry Small rain Big rain Dry

Poverty & Social Impact Assessment (PSIA) 13
Rattan basket - 33 - 36 - 60 - 33Pandanus leaf mats - 7 - 8 - - - -Agriculture (farming & livestock) 93 95 97 96 89 100 100 100Other - 5 - 4 - 20 - 33
Figure 4. Percentage of Livelihood Activities by Gender
c. Sedge/triangle sedge Mats (Kampong Chhnang)
For Kampong Chhnang, the production of sedge mats follows the planting of rice paddiesand coincides with the harvesting time of raw materials and the coming of traders to thevillages to buy and collect the products. The raw materials for handicrafts are still generallyeither grown by the households (80%) or taken from the forest or the shoreline. Very few buyfrom harvesters.
The focus group discussion with the producer groups indicated that in volume terms, sedgemats are the principal item of production. In terms of product price, the length or size of theproduct being made is a critical determining factor. The average process costs US$5.21 forsedge mats 1.1 m. in length and US$6.30 for mats 1.2 m. in length. The highest pricedhandicraft is the inter-connected sedge mat marketed at US$20.58. The median net earningof the producers in the past year was US$73.17. The local community is the primary marketfor the nearly half of handicraft producers, but more than one-third of the producers havebuyers within the district and access the provincial market. One-fifth of the producers selltheir products in other provinces. The Women’s Center helps the producers by buying someof their handicrafts.
The survey indicated that two-thirds of the respondents suggested an increase in theirincome from handicraft production. The income earned depends on the number of sedgemats produced, as well as their size, quality and price. There are at least four types ofproducts (sedge mat, interconnected mat, crude quality mat, and the triangle mat) and thedimensions vary. The average number produced for the common sedge mat size (1.1-1.2 m.length) is 16 and priced at US$5.75, which nets the producer on average US$92 per year.The sedge mat case study shows the producer making five to six sedge mats per year, sold
67
0
71
0
58
0
60
0
93 95 97 9689
100 100 100
0
20
40
60
80
100
120
KCH N=120 SRP N=60 KCH N=76 SRP N=53 KCH N=76 SRP N=5 KCH N=10 SRP N=3
% Female Adults % Male, Adults %Female children % Male Children
Sedge/triangle sedge Mats Bamboo handicrafts Vegetables growingProa Mats Rattan basket Pandanus leaf matsAgriculture (farming & livestock) Other

Poverty & Social Impact Assessment (PSIA) 14
for 40,000 Riel per piece, earning her annual income of 1,000,000 Riel (or approximatelyUS$256).
The sale of handicrafts to traders is apparently a common practice with 4 out of 5households employing the services of traders. The traders are mainly individuals from thesame community (69%) who act as mediators for selling the handicrafts. Few (14%) comefrom other communities or from different provinces (11%). The Women’s Center alsoprovides the same services of the traders but their market penetration remains limited, withonly 4.6% of handicraft producers opting to sell their wares via the Center.
d. Bamboo handicrafts (Kampong Chhnang)
Particular to bamboo handicrafts in Kampong Chhnang, the raw materials are generallybought from harvesters and suppliers, with only some 3% of households growing their own.There are 10 types of products made in the area, notably various rice baskets, trays andsieves. The product type and the percentage of producing households are as follows:siek/pkleak baskets (47%), kraloar (47%), krancheng (40%), rice baskets (27%), ordinarykraloar (17%), plates and trays (10%), flat baskets (7%), tissue boxes (2%) and angrot (2%).
All of the bamboo products are sold, with the local market absorbing half of the products andthe rest going to other provinces. The WDC Center accounted for some 32.5% of the salesof the project beneficiary households. The price of bamboo products ranges from US$0.15 toUS$2.20, with angrot the highest priced product.
Traders are prevalent in the bamboo market, with all producers accessing their services.Some 50% of households deal with traders from within the community, approximately 42%deal with traders outside the community, and roughly 22% of households trade with theWDC.
In 2009, the income from the sale of bamboo products was said to have increased for atleast 50% of households. Approximately 30% stated that there was no change in theirincome, while 20% cited decreases in income. The median income across all respondentswas US$49 per year.
e. Vegetable growing (Kampong Chhnang and Siem Reap)
The months December, January and February are the peak months of planting vegetablesfor many households in Kampong Chhnang, unlike Siem Reap where the activity is year-round. Head cabbage is the most common vegetable planted in Siem Reap, followed bykhatna and cheung tea cabbage. Cheung tea cabbage and cucumber are the mostcommonly planted vegetables in Kampong Chhnang, followed by chongkeus cabbage andwax gourd. The volume of vegetables harvested depends on the type planted. In general,households harvest 10 kg to 2,000 kg of vegetables each year. The highest volume ofvegetable harvested is head cabbage (1,028 kg in Siem Reap). Chili is also a high volumecrop, followed by eggplant and cucumber. A small portion of the volume of vegetables
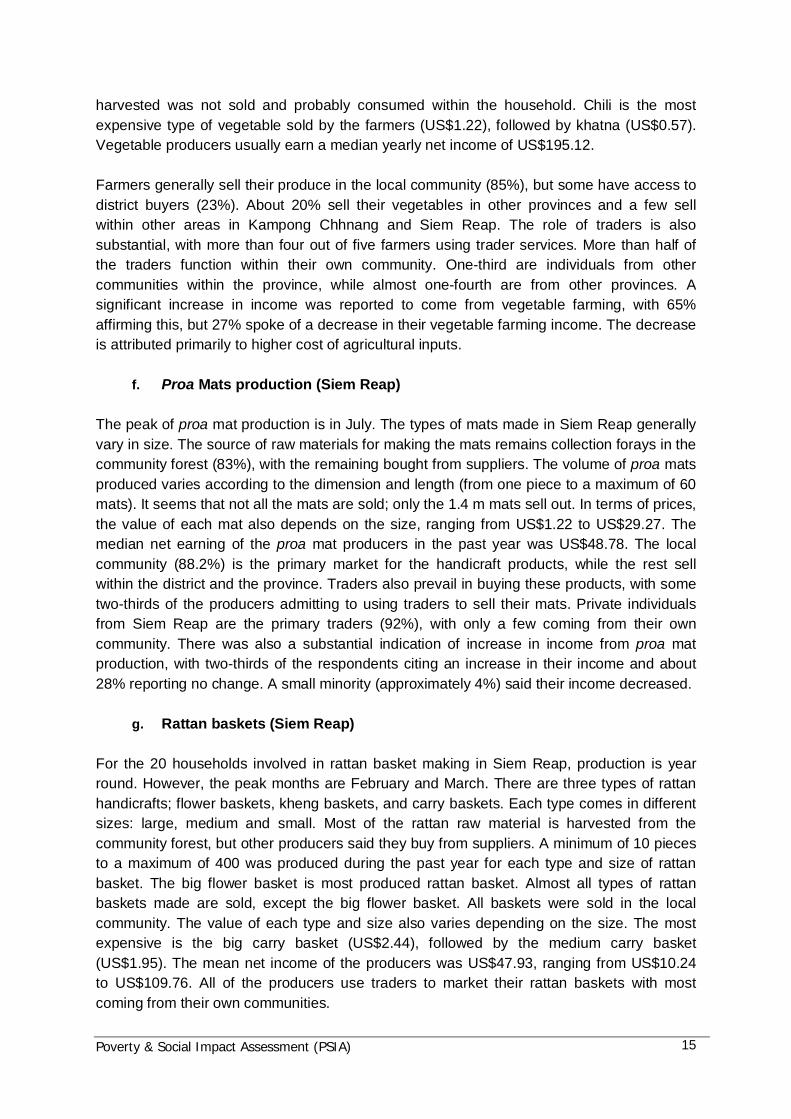
Poverty & Social Impact Assessment (PSIA) 15
harvested was not sold and probably consumed within the household. Chili is the mostexpensive type of vegetable sold by the farmers (US$1.22), followed by khatna (US$0.57).Vegetable producers usually earn a median yearly net income of US$195.12.
Farmers generally sell their produce in the local community (85%), but some have access todistrict buyers (23%). About 20% sell their vegetables in other provinces and a few sellwithin other areas in Kampong Chhnang and Siem Reap. The role of traders is alsosubstantial, with more than four out of five farmers using trader services. More than half ofthe traders function within their own community. One-third are individuals from othercommunities within the province, while almost one-fourth are from other provinces. Asignificant increase in income was reported to come from vegetable farming, with 65%affirming this, but 27% spoke of a decrease in their vegetable farming income. The decreaseis attributed primarily to higher cost of agricultural inputs.
f. Proa Mats production (Siem Reap)
The peak of proa mat production is in July. The types of mats made in Siem Reap generallyvary in size. The source of raw materials for making the mats remains collection forays in thecommunity forest (83%), with the remaining bought from suppliers. The volume of proa matsproduced varies according to the dimension and length (from one piece to a maximum of 60mats). It seems that not all the mats are sold; only the 1.4 m mats sell out. In terms of prices,the value of each mat also depends on the size, ranging from US$1.22 to US$29.27. Themedian net earning of the proa mat producers in the past year was US$48.78. The localcommunity (88.2%) is the primary market for the handicraft products, while the rest sellwithin the district and the province. Traders also prevail in buying these products, with sometwo-thirds of the producers admitting to using traders to sell their mats. Private individualsfrom Siem Reap are the primary traders (92%), with only a few coming from their owncommunity. There was also a substantial indication of increase in income from proa matproduction, with two-thirds of the respondents citing an increase in their income and about28% reporting no change. A small minority (approximately 4%) said their income decreased.
g. Rattan baskets (Siem Reap)
For the 20 households involved in rattan basket making in Siem Reap, production is yearround. However, the peak months are February and March. There are three types of rattanhandicrafts; flower baskets, kheng baskets, and carry baskets. Each type comes in differentsizes: large, medium and small. Most of the rattan raw material is harvested from thecommunity forest, but other producers said they buy from suppliers. A minimum of 10 piecesto a maximum of 400 was produced during the past year for each type and size of rattanbasket. The big flower basket is most produced rattan basket. Almost all types of rattanbaskets made are sold, except the big flower basket. All baskets were sold in the localcommunity. The value of each type and size also varies depending on the size. The mostexpensive is the big carry basket (US$2.44), followed by the medium carry basket(US$1.95). The mean net income of the producers was US$47.93, ranging from US$10.24to US$109.76. All of the producers use traders to market their rattan baskets with mostcoming from their own communities.
Poverty & Social Impact Assessment (PSIA) 16
h. Pandanus leaf mat production (Siem Reap)
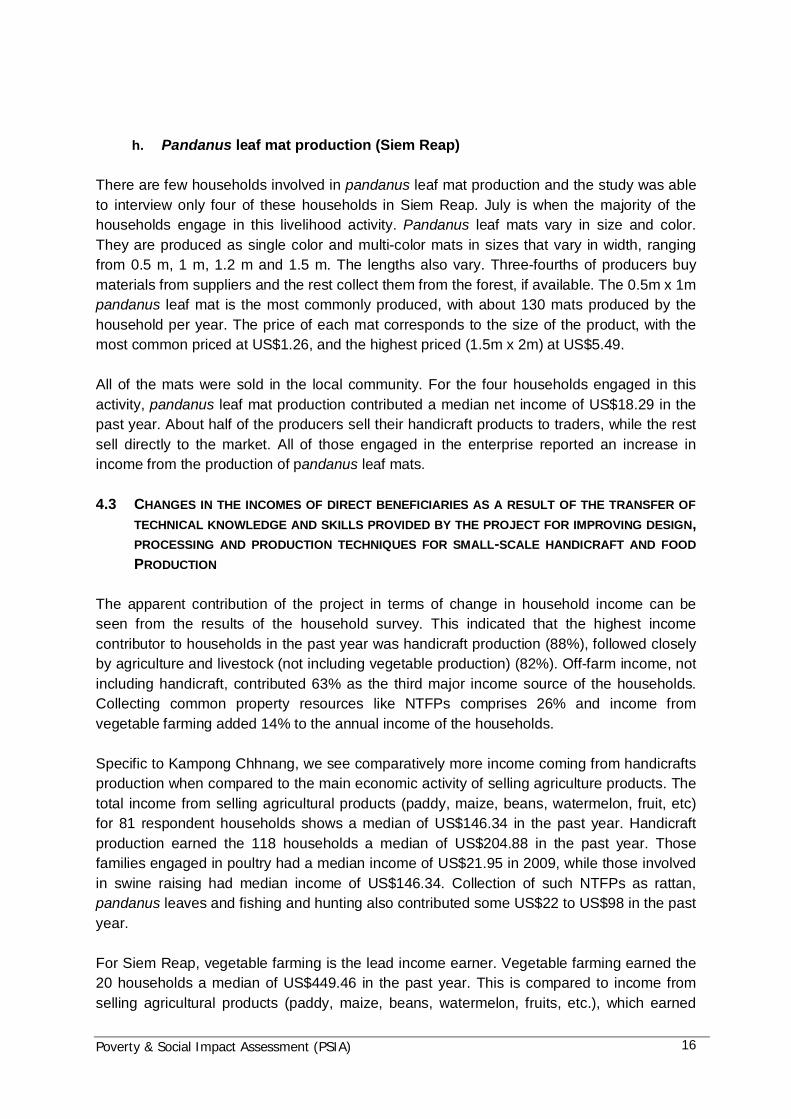
There are few households involved in pandanus leaf mat production and the study was ableto interview only four of these households in Siem Reap. July is when the majority of thehouseholds engage in this livelihood activity. Pandanus leaf mats vary in size and color.They are produced as single color and multi-color mats in sizes that vary in width, rangingfrom 0.5 m, 1 m, 1.2 m and 1.5 m. The lengths also vary. Three-fourths of producers buymaterials from suppliers and the rest collect them from the forest, if available. The 0.5m x 1mpandanus leaf mat is the most commonly produced, with about 130 mats produced by thehousehold per year. The price of each mat corresponds to the size of the product, with themost common priced at US$1.26, and the highest priced (1.5m x 2m) at US$5.49.
All of the mats were sold in the local community. For the four households engaged in thisactivity, pandanus leaf mat production contributed a median net income of US$18.29 in thepast year. About half of the producers sell their handicraft products to traders, while the restsell directly to the market. All of those engaged in the enterprise reported an increase inincome from the production of pandanus leaf mats.
4.3 CHANGES IN THE INCOMES OF DIRECT BENEFICIARIES AS A RESULT OF THE TRANSFER OFTECHNICAL KNOWLEDGE AND SKILLS PROVIDED BY THE PROJECT FOR IMPROVING DESIGN,PROCESSING AND PRODUCTION TECHNIQUES FOR SMALL-SCALE HANDICRAFT AND FOODPRODUCTION
The apparent contribution of the project in terms of change in household income can beseen from the results of the household survey. This indicated that the highest incomecontributor to households in the past year was handicraft production (88%), followed closelyby agriculture and livestock (not including vegetable production) (82%). Off-farm income, notincluding handicraft, contributed 63% as the third major income source of the households.Collecting common property resources like NTFPs comprises 26% and income fromvegetable farming added 14% to the annual income of the households.
Specific to Kampong Chhnang, we see comparatively more income coming from handicraftsproduction when compared to the main economic activity of selling agriculture products. Thetotal income from selling agricultural products (paddy, maize, beans, watermelon, fruit, etc)for 81 respondent households shows a median of US$146.34 in the past year. Handicraftproduction earned the 118 households a median of US$204.88 in the past year. Thosefamilies engaged in poultry had a median income of US$21.95 in 2009, while those involvedin swine raising had median income of US$146.34. Collection of such NTFPs as rattan,pandanus leaves and fishing and hunting also contributed some US$22 to US$98 in the pastyear.
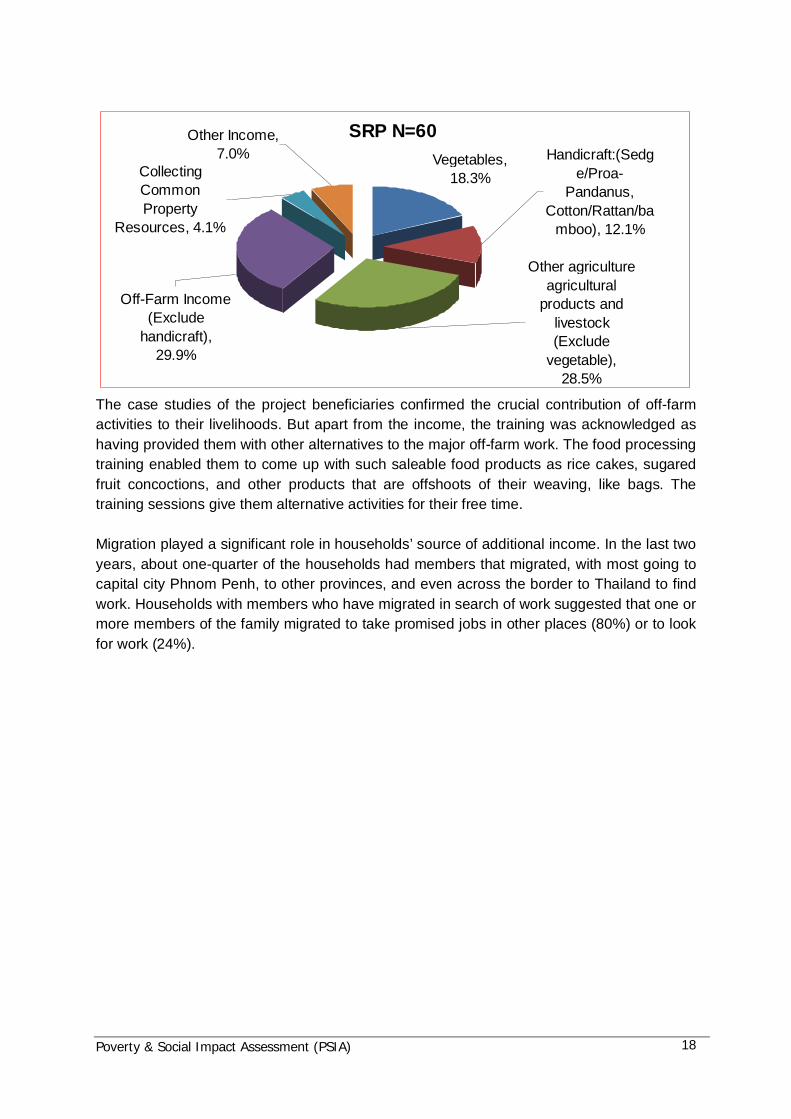
For Siem Reap, vegetable farming is the lead income earner. Vegetable farming earned the20 households a median of US$449.46 in the past year. This is compared to income fromselling agricultural products (paddy, maize, beans, watermelon, fruits, etc.), which earned
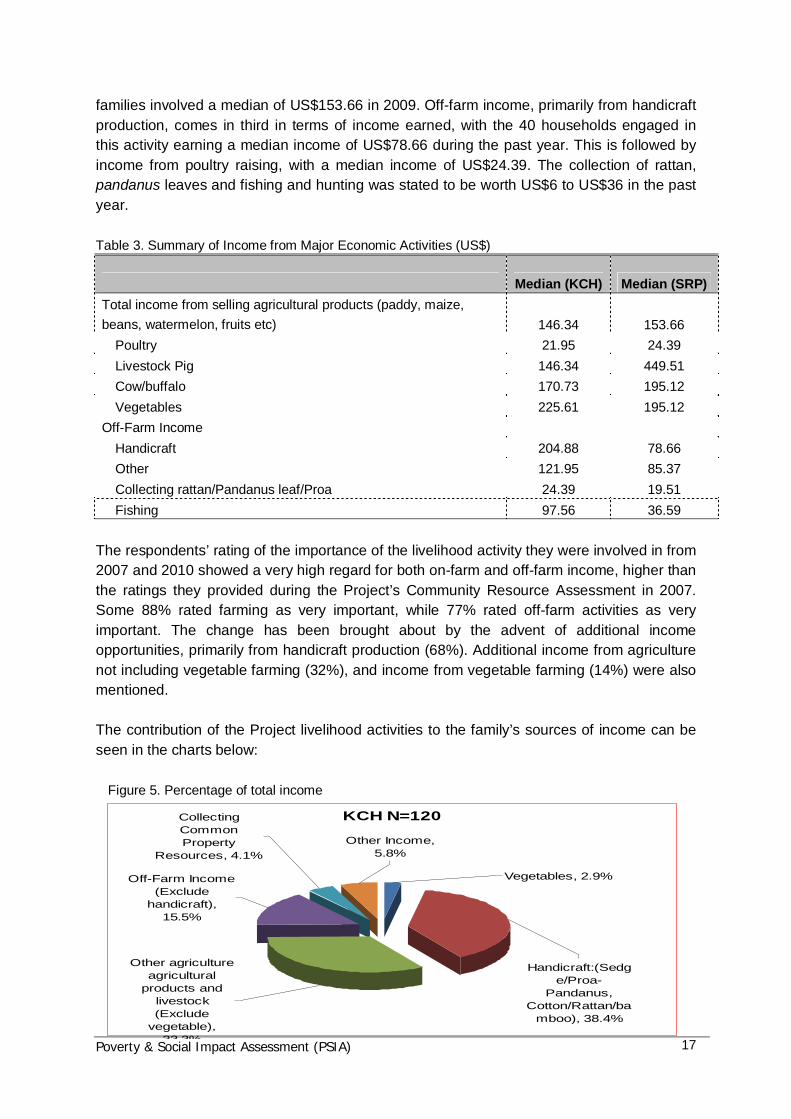
Poverty & Social Impact Assessment (PSIA) 17
families involved a median of US$153.66 in 2009. Off-farm income, primarily from handicraftproduction, comes in third in terms of income earned, with the 40 households engaged inthis activity earning a median income of US$78.66 during the past year. This is followed byincome from poultry raising, with a median income of US$24.39. The collection of rattan,pandanus leaves and fishing and hunting was stated to be worth US$6 to US$36 in the pastyear.
Table 3. Summary of Income from Major Economic Activities (US$)
Median (KCH) Median (SRP)Total income from selling agricultural products (paddy, maize,beans, watermelon, fruits etc) 146.34 153.66
Poultry 21.95 24.39Livestock Pig 146.34 449.51Cow/buffalo 170.73 195.12Vegetables 225.61 195.12
Off-Farm IncomeHandicraft 204.88 78.66Other 121.95 85.37Collecting rattan/Pandanus leaf/Proa 24.39 19.51Fishing 97.56 36.59
The respondents’ rating of the importance of the livelihood activity they were involved in from2007 and 2010 showed a very high regard for both on-farm and off-farm income, higher thanthe ratings they provided during the Project’s Community Resource Assessment in 2007.Some 88% rated farming as very important, while 77% rated off-farm activities as veryimportant. The change has been brought about by the advent of additional incomeopportunities, primarily from handicraft production (68%). Additional income from agriculturenot including vegetable farming (32%), and income from vegetable farming (14%) were alsomentioned.
The contribution of the Project livelihood activities to the family’s sources of income can beseen in the charts below:
Figure 5. Percentage of total income
KCH N=120
Other Income,5.8%
CollectingCommonProperty
Resources, 4.1%
Off-Farm Income(Exclude
handicraft),15.5%
Vegetables, 2.9%
Handicraft:(Sedge/Proa-
Pandanus,Cotton/Rattan/ba
mboo), 38.4%
Other agricultureagricultural
products andlivestock(Exclude
vegetable),33.3%
Poverty & Social Impact Assessment (PSIA) 18
The case studies of the project beneficiaries confirmed the crucial contribution of off-farmactivities to their livelihoods. But apart from the income, the training was acknowledged ashaving provided them with other alternatives to the major off-farm work. The food processingtraining enabled them to come up with such saleable food products as rice cakes, sugaredfruit concoctions, and other products that are offshoots of their weaving, like bags. Thetraining sessions give them alternative activities for their free time.
Migration played a significant role in households’ source of additional income. In the last twoyears, about one-quarter of the households had members that migrated, with most going tocapital city Phnom Penh, to other provinces, and even across the border to Thailand to findwork. Households with members who have migrated in search of work suggested that one ormore members of the family migrated to take promised jobs in other places (80%) or to lookfor work (24%).
SRP N=60Other Income,7.0%
CollectingCommonProperty
Resources, 4.1%
Vegetables,18.3%
Handicraft:(Sedge/Proa-
Pandanus,Cotton/Rattan/ba
mboo), 12.1%
Other agricultureagricultural
products andlivestock(Exclude
vegetable),28.5%
Off-Farm Income(Exclude
handicraft),29.9%

Poverty & Social Impact Assessment (PSIA) 19
4.4 CHANGES IN CONSUMPTION, QUALITY OF LIFE AND POVERTY STATUS OF DIRECTBENEFICIARIESa. Trends in Consumption
The study looked into the trends for both weekly and annual expenditures of the households.The weekly expenditure showed that food expenditures (including eating out) forms the bulkof family expenditure, followed by expenses for education and then by health and hygieneprovisions.
Figure 6. Weekly Basic ExpensesWeekly expense item Mean-KC
(US$)Mean-SR
(US$)Purchasing food besiderice 8.68 7.93Education (courses,teachers and food atschool) 4.71 3.89Soaps, shampoo, make-up 2.93 4.34Eating outside home 3.25 3.38Charging battery 1.29 0.86Other 2.04 1.62
The annual expenditure pattern of the households indicated that most expenses go forhouse repairs/maintenance. The remaining expenditures and allocation of resources varydepending on the province. For Kampong Chhnang, second in terms of cash flow aredonations to relatives and medical treatment. For Siem Reap, the secondary outlay is formedical treatment. Nevertheless, there seem to be consistent, major expenditures made forceremonies, travel and transport, fuel for cooking, expenses for communication, andpurchase of equipment/tools. The latter may be indicative of improving household assets.There is a major omission in that no mention of money for savings was indicated.
Figure 7. Annual Non-Food ExpensesItem Mean
KAMPONGCHHNANG
(US$)
MeanSIEMREAP(US$)
1. House repairs 205.47 132.782. Medical care/health treatment 110.99 80.353. Clothing and footwear 66.47 59.164. Others’ wedding 73.27 69.395. Cooking (gas/charcoal/stove) 36.41 49.236. Ceremony 45.62 24.847. Donations to relatives 134.86 48.328. Travel and transport 43.09 38.39

Poverty & Social Impact Assessment (PSIA) 20
9. Phone card/telephone 41.47 43.7710. Repair of equipment/tools 27.05 25.8711. Water/house rental 20.88 012. Other recreation 6.85 31.44
b. Beneficiary Perspectives on the Range of Poverty Levels
The match between actual income generated and the amount of expenditure was difficult todetermine during the study. However, key informant interviews have noted that much of theincome was dedicated for food expenditure, given poor crop yields for rice and the cost ofraising and educating their children. It was also noted that income from off-farm activitieswas primarily used to meet daily needs. There was also significant information on theincreasing cost of commodities, with food prices spiraling upwards since 2008, which alsomeant increased financial expenditure.
The study made use of the Ministry of Planning (MoP) and GTZ Identification of the PoorestHouseholds Module, which is a self-rating exercise in which households rate where they arein the poverty range. This is a comparative exercise on how they perceive themselvesagainst other families within their community, as well as how they use their income and otherpoverty indicators, such as availability of food, land, work animals, residence and cash,among others.
While the exercise may require factoring other conditions in the future, it is a good indicatorthat the beneficiaries of the project see that several of their needs have been met thanks toincome derived from the project’s activities (including such previously discussed factors asgrowth in farm income, migration, etc.).
The exercise showed that most beneficiaries of the project place themselves at a meanpoverty score of 26.95. (The groups are presented in ranges, with the very poor scoring 59-68, the poor scoring 45-58 and the non-poor scoring from 0-44) Therefore, we see that manyof the respondents see themselves as non-poor. Those who place themselves in the poorcategory comprised about 7.2% of respondents, while those who place themselves in thevery poor category comprised 0.6%. The very poor households are more apparent in SiemReap.
Figure 8. Poverty Score Level/ MoP - GTZ Module
KCH N=120Very poorScore 59-
68, 0%
Non poorScore 0-
44, 97.5%
PoorScore 45-58, 2.5%
SRP N=60
Non poorScore 0-
44, 81.7%
PoorScore 45-58, 16.7%
Very poorScore 59-68, 1.7%

Poverty & Social Impact Assessment (PSIA) 21
Also considered was the daily per capita expense per household, using the povertythreshold of US$1/day. At the point of project start-up, the very poor respondent householdshad per capita expenditure of less than US$1 daily, while the majority poor households hada per capita expenditure of (+ / -) US$1. The overall responses by the households in thesurvey showed that in 2009 their per capita expenditure was (+ / -) US$1. In effect, most ofthem still qualify as poor. However, this factor may not be that reliable in view of the non-cash exchanges common in the rural areas, such as types of barter and the use of rice as anexchange commodity.
Another consideration is the perspective of the household in whether they have moved up ordown the poverty ladder in consideration of the factors they cited (i.e., lack of food, no land,no work animals, no house, not enough money, etc.). The results showed that about 77%said they had moved up, 15% said there had been no change and 8% said they had moveddown. In reference to those who believed they were moving up, the top six responses forexplaining this condition is that they now earn income from handicrafts (34%); they haveincome-earning activity (31%); they have livestock (30%), the prices they get for sedge matsare higher (22%), they can produce more mats than before (11%) and they obtain incomefrom vegetable growing (11%). For those moving down or for whom there was no change inincome, the reasons included the addition of more children and health problems.
c. Indebtedness
Additional information from the interviews conducted by the study showed that a major factorof why some families find it difficult to move out of the very poor range of poverty is theirindebtedness to middlemen. In both provinces, it is customary that middlemen give money inadvance to handicraft producers in order to obtain their products. This is particularlyprevalent in Chueng Kreav in Kampong Chhnang and in Svay Check in Siem Reap. For lasttwo to three years before the WDC Project, handicraft producers experienced delays inrepaying middlemen, which results in the middlemen insisting upon discounts of 30-40% inpurchase for woven mats (sedge, Proa, Pandanus). Producers indebted to middlemen maytherefore be selling their products lower than the actual market price. The comparative priceof products for those who have advanced money from middlemen and the current marketprices are shown in the table below.
Table 4. Comparison Actual Price of Handicraft and Price Received with Money Given in Advance
Handicraft ProductsDiscounted Price
MiddlemenAdvances
Market Price
Bamboo rice sieve 1,600 Riels 2,500 RielsSmall bamboo sieve 500 Riels 600 RielsBamboo winnowing sieve 2,000 Riels 2,500 RielsBamboo medium sieve 900 Riels 1000 RielsBamboo medium sieve (good quality) 3000-3500 RielsRattan basket/set (3) 12, 000 Riels 13,000-15,000Rattan baskets (with good quality) 10,000 Riels

Poverty & Social Impact Assessment (PSIA) 22
The indirect costs of indebtedness underscored the importance of the project to improve thefinancial management of the producer groups. Access to micro-credit is an importantinitiative that the project should address. The producer groups and individual members stilllack the capacity to effectively run a community micro-credit service, and are reluctant toaccess those existing micro-credit services available in the area. Extant services includesuch MFI’s as HATHA KASEKOR, AMK, PRASAC, ACLEDA, Vision Fund, and CEDAC.CEDAC has taken the initiative in forming saving groups in Chueng Kreav commune wherea group member can borrow money at low interest with the interest collected on loans keptwithin the group for re-investment.
4.5 ASSESSMENT OF EXTENT TO WHICH KNOWLEDGE AND SKILLS ACQUIRED BY DIRECTBENEFICIARIES FROM THE PROJECT HAVE BEEN SHARED WITH OTHERS IN THEIRCOMMUNITIES
Project beneficiaries were asked to personally assess the project’s capacity buildingtrainings that they have attended, what was the most useful, and what instruction was mostshared with non-members of their producer groups. More than half of respondents attendedthe training workshops on food processing, good nutrition, women worker’s rights, andhomework and safety. The next training sets are those related to skills in bamboo, sedgemats, and rattan products, which are of course attended by specific target groups. The leastmentioned were those on gender and entrepreneurship, with fewer people attended thesestudy tours.
In terms of usefulness, all the training workshops had a high rating of utility, ranging from83% to 100%. The study tours for vegetable growing and sedge mat production also weregiven an above average rating of 60% and 77%, respectively. There was also high rating interms of what training was imparted to family members and other people in the community.The higher ratings were given to good nutrition, food processing, women rights andhomework and safety. The case studies with producers corroborated the sharing ofknowledge and skills. This was the highest among members of the producer work groupsand with family members helping out in the craft. The mentoring by those who attended thetrainings to others in the work group was the best means of imparting learned knowledgeand skills.
Overall, the producers stated that they had already had the skills, the inclination to excel andexperience in the crafts they are engaged in before the project launched. But they said thatthe project had helped them improve on this potential and opened up their eyes to thebenefits of using newer designs, employing more economical use of resources and thatproduction geared for commercial markets beyond local demand can become especiallyviable economic livelihood activities.
The project has left a bountiful and practical legacy of techniques and technologies thatimprove on product quality, generate economies in the use of raw materials and illustrate theempowering effects group efforts have in setting product standards, prices and negotiating
Poverty & Social Impact Assessment (PSIA) 23
en bloc with middlemen. There is also better regard for the safety of consumers, especiallyas regards the effects of vegetable gardening and the use of pesticides. The producergroups are now functional entrepreneurs, although still in the early stages of understandingthe supply chain and utilising it effectively. A positive impact has been that the members ofthe producer groups have replicated the techniques they have acquired with other membersof the community, thereby laying the foundation for sustainable future enterprises.
4.6 IMPACT OF THE PROJECT ON GENDER ATTITUDES AND RELATIONS IN THE PROJECT’STARGET AREAS
Most of the beneficiaries recognized that the project has promoted work that is suitable forwomen, as it is relatively light and attuned to their normal chores. The household interviewsindicated that the project enabled women to contribute to and increase their household’sincome (28%), while not neglecting their household duties (20%). Male respondents said theproject gave them various things to do, such as collecting sedge (45%), constructing basketbottoms (27%) and helping their spouses in weaving (26%). Both men and women weresatisfied with the project because it gave them the chance to acquire new knowledge inhandicraft making (57%). The project also provided the opportunity for women to play asignificant role in the financial and managerial aspects of household production (38%). Theyappreciated that these activities gave them additional income and the ease in marketing theproducts, due to the presence of traders.
Most women take on handicraft and vegetable garden activities after the end of the mainfarming seasons of cultivation and harvesting. Men see these activities as appropriate, asthe women can stay at home and look after the house and the children. Women are lesslikely to migrate to find work, but the men continue to do so. For men who helped with off-farm activities, their responsibility was mainly in gathering raw materials, and cutting andsplitting them. With this division of duties, women are able to focus better on the intricatework of weaving and share in the responsibilities of managing the financial affairs of thehousehold and the enterprise. On the other hand, as seen in one case study, there are justtoo many responsibilities at home, which limits the concentration of women on running theenterprise, thereby lowering operational and output efficiency. This may be easier to achievewhen household members share the workload.
But for women who have young children or whose children are at an age fit for migrant work,there are no extra hands to ease the work that needs be done. Men must gradually becomeaware of and share these obligations. As a result of an increasing awareness of genderissues in the recent years, as well as the imperatives generated by gender mainstreaming,people have begun to understand the potential to be explored in revising the roles andresponsibilities of men and women. Women are increasingly seen as taking uponthemselves more visible roles in community development, participating in all levels ofcommunity social affairs in central and local governments. This has been seen particularly intheir participation in commune councils and in the community decision-making process.
In the same vein, much of the behavior change brought about by the project is found in thewillingness of women to take risks and innovate production beyond the traditional, includingbeing focused at work, trying out new ideas, seeking knowledge and awareness and buildingup their social and institutional networks. Women producers appreciated working with other

Poverty & Social Impact Assessment (PSIA) 24
women in groups rather than individually and have learned to interact, sharing problems andexperiences to constructively improve their products. There were also signs that there reallywas a high impact coming from the awareness-raising component, particularly for womenrights and safety at home. There was also a healthy interest and talent in food processingactivities. Positive changes were also seen in the producer groups maintaining goodrelationships with WDCs, PDoWA and MoWA as their support network, and from variousclients, traders, and NGOs.
4.7 IMPROVEMENTS IN THE CAPACITY OF WDC, PDWA AND MOWA TECHNICAL STAFF: KIWDC
The project implemented a systematic program with a participatory approach to market-oriented rural enterprise. It set up the infrastructure of two WDC and five commune producercenters and the MOWA, WDC, and PDWA project units. This infrastructure facilitated:community resource assessment, the conduct of the value chain analysis of high-potentialproducts, the establishment of producer groups for selected enterprises, the training ofproducers to improve their skills in product quality assurance and small-businessmanagement, and the provision of awareness-raising on women rights and family health.The project also linked the WDC to entrepreneurs, trainers and the market.
Based on changes in the perceptions of WDC staff members, there have been substantialimprovements in terms of a more committed institutional support from MOWAs. This hasbeen evidenced by the MoWA Economic Development Department staff members whoconducted the assessment of development activities in the target area, and whosubsequently were seen to give their full support to the project. The staffs of the projectcame to the project areas more often and gave advice on improving the quality of productsand on enhancing cooperation between the project units and the community. The level ofsupport from the national office and the community was deemed high by the local projectstaff.
Interviews with the WDC staff affirmed that the project had enhanced their organizationalcapacity to manage this kind of project. The capacity building efforts have boosted theirconfidence and their ability to implement project activities of this nature in future. A majorgain was that the project established linkages between the line ministry of Governmentagencies and the communities. (There was already good participation by local authoritiesand there were good relationships within the project.)
A type of networking partnership in the project between the offices of women affairs in thedistrict and the commune authorities also was formed. They participated in the trainingactivities and were quite active in the construction of the commune producer center in thelocation under their responsibility. For the project staff, they gained experience in workingwith the community. They have come to know how to establish and maintain a network ofproducer groups in each village, about the inter-relations of community resources andlivelihood options, and the staff members have stated that they now have the skills to enablethem to undertake such a project again and/or sustain it. With support and encouragementfrom WDC, PDOWA, and MoWA, they believe the project can be sustained. Thanks to the

Poverty & Social Impact Assessment (PSIA) 25
experience gained during the project's implementation, they are now prepared and backedup by practical experience to better implement the next phase, especially when they arearmed with specific work plans.
However, there were capacity issues that need to be addressed further. The flow ofinformation from national level to the provincial level was not as efficient as would bedesired, and there is a need to improve on access to market information. Under MoWA’sDepartment of Economic Development, the project was strongly supported with participationfrom PDWA, DoWA, and WDC, but it was felt that at the WDC level that there should be staffin charge of market information for producer groups in the community. There are alsolimitations imposed by the lack of marketing or an entrepreneur specialists at the WDC, aswell as budgetary constraints for facilities and equipment maintenance. There is also a needto coordinate with other NGOs present in the area to streamline schedules for communitymobilization exercises.

Poverty & Social Impact Assessment (PSIA) 26
4.8 BENEFICIARY PROFILES/CASE STUDIES OF BENEFICIARIES IN PROJECT VILLAGES
Box 1. SRP: Case Study: Woman Direct Beneficiary of Vegetable Growing
SRP: Case Study: Woman Direct Beneficiary of Vegetable Growing
Mrs. Srey Ny lives in Bat Dangkor village, Samroang Commune, Sotr Nikum district in Siem Reap Province.She has six dependents and her main income comes from paddy agriculture on a land area of more than onehectare. From September to February each year she is engaged in growing vegetables, mainly cabbage andcauliflower, to supplement her income.
She is the group leader of the producer group of vegetable farming, having become the leader after beingselected by her group who saw in her an ability to manage things well. She manages her family’s finances,she has sent her children to attend higher education and she is actively involved in all aspects of civil society,such as community meetings and NGO activities. She is an intrinsically curious person.
Prior to the start up of the Women’s Development Center Project, Mrs. Srey Ny’s main income came from herpaddy crop, with some from vegetable farming and selling fish. She borrowed money from private agents inorder to supplement her family needs when there was a shortfall.
Her main income still comes from her paddy crop. But there is an increasing amount coming from hervegetables. The harvest volume from her vegetable crop has doubled, as she had followed the projecttraining and advice on producing higher-quality vegetables, improving storage and on keeping producefresher. She has also been able to engage in pig raising, and is now producing wine in order to use theresidue from wine production as part of the feed for the pigs. She also works cooking breakfast for schoolchildren.
Srey Ny says that her income has significantly increased. Her vegetable growing provided good income forthis year, earning her US$1,000. This was because the crop grew well and she was able to get good pricesfor her produce. Her main customer is a trader from Kampong Cham province who comes and buys hervegetables at her place of residence.
However, she said that while her income grew, her expenses have also increased. Sending her children touniversity and spending a great deal on health costs for her ill husband consumes a great deal of her income.
She thinks that the project has provided her with the knowledge and experiences she has gained. She hasused these new tools and shared them with her relatives and neighbors. Her training included anunderstanding of the appropriate season for planting her vegetables, the use of fertilizers, appropriatepesticide usage and ensuring that her vegetables are free of toxic substances and thus healthy/safe for theconsumer. The seeds, fertilizers and pesticides for her gardens are bought from the district market of SotrNikum.
To increase her growing area, she has used the land that belongs to her brother-in-law. This has doubled thesize of the area planted with vegetables. She would really like to increase the growing area further, however,she has not been able to afford land or the labor as prices are always going up. Land to purchase forcultivation is also limited and, again, very expensive.
She acknowledges that she cannot continue to increase of her plot and that the cost of labor is increasing.She is considering buying land for vegetable growing, as her current landholdings are small. Regarding thebenefits to other people in her community, she feels that most people have benefited from the project. Thereare households in the community not participating in the producer group who grow their own vegetables. SreyNy revealed that these people have no concern about the health of consumers. As an example, she said theyharvest vegetables even after the recent spraying of pesticides. For this reason she has suggested that theWDC Project should provide awareness raising on the ill effects of pesticide use on people’s health whileencouraging the shift to safer vegetable growing techniques.

Poverty & Social Impact Assessment (PSIA) 27
Box 2. SRP: Case Study: Woman Direct Beneficiary of Vegetable Growing
SRP: Case Study: Woman Direct Beneficiary of Vegetable Growing
Mrs. Moeun Pok resides in Svay Chrum village, Samroang Commune, Sotr Nikum district in Siem ReapProvince. She is a leader of a producer group, selected because she is experienced, very active and wasperceived to have the ability to manage the group members.
Before the start of the WDC Projec,t the main income of her family came from their rice paddy crop and herselling of vegetables. Her household owns about 3.5 hectares of paddy land. The harvest has been justenough to supply the family’s rice needs for the year.
With the implementation of the WDC Project, she had increased the volume of vegetables grown from hergarden by twice the original volume, and has started growing sugar cane too. From the income earned fromher vegetables she has saved money to build and operate a new grocery shop in front of her house. This is avisible investment, which she hopes can further increase her income.
With the changes described above, she has not discontinued her growing of vegetables. This year (2009) shereceived a price of 1,300 Riel (US$0.3) per kilogram for cabbage, earning more despite the cost of seeds,fertilizers, and pesticide bought from Sotr Nikum/Dom Dek market at high prices. The vegetables were boughtat her residence. Middlemen came to reserve for purchase all the vegetables cultivated at a price flexible tothe prevailing market price, and collected the stock after it was harvested. If the volume of the harvest islarger and there is a surplus beyond the middlemen’s demand, she brings it to sell in the district or provincialtown markets. She mentioned that she has the choice of who her middleman will be. She can change them ifthe given price is not appropriate or when there is difficulty in getting payment from her regular middlemen.
Usually, vegetable farming is done from September to February each year. For her household, she growsvegetables in December because her land is lower and water cannot reach her plot from September toNovember. For the period covering late 2009 to early 2010, she has doubled the volume of vegetablesplanted. But next year, she plans to maintain the same production level since the land and labor are limited.She said that her parents assist in cutting grass and fertilizing the vegetables.
The major relevance of the WCD Project for her is that she has used her knowledge, experience andunderstanding from the training, study tours, and workshops and applied it to her growing of crops andvegetables. She has shared her experiences and knowledge with other group members, relatives, andneighbors who have expressed curiosity about these activities. The main lessons she learned related tonatural pesticides usage, fertilizers usage and the uses of nylon nets to create shade for her vegetables andherbs.
The challenge to vegetable growing is that, while she obtained more income compared to last year, she hadto spend more on inputs such as seeds, pesticides, and fertilizers. She also spent more money on food andhousehold consumption needs because of inflation. However, a bright spot was that from her total income ofthe last years she was able to save and was able to buy 1.5 hectares of arable land and one pumpingmachine for irrigating the vegetables. She was also able to build a new toilet for her house and built a groceryshop.
Moeun Pok felt that the other people in her community could benefit from the project by using the newtechnology and techniques for growing vegetables and also suggested that the donor continue supporting,strengthening and raising the awareness of group members in obtaining the refresher training/capacitybuilding, as well as some basic vegetable inputs.

Poverty & Social Impact Assessment (PSIA) 28
Box 3. SRP: Case Study: Woman Direct Beneficiary of Proa Mat Weaving
SRP: Case Study: Woman Direct Beneficiary ofProa Mat Weaving
Mrs. Sin Kay is a villager in Samroang village, Leang Dai Commune, Angkor Thom district in Siem ReapProvince. She has two small children in school. She was selected to be a group member of a producer groupbecause her main occupation is Proa mat weaving. She has long experience in weaving and has no desire tomove to another type of employment.
Before the WCD Project started, her main income came from Proa mat weaving. Her husband is employed inthe construction industry and sometimes receives sub-contracting jobs from the main contractors. She grew afew vegetables and herbs in her residential lot, mainly for home consumption. She also raised livestock, suchas pigs and chickens, to supplement her income. Mrs. Kay is also engaged in rattan weaving. It is difficult toobtain the raw materials for this work, so she takes charge of collecting raw materials from the nearbycommunity forest, which is far from her residence. She must do this herself, as her husband is not involved inthe rattan work. Generally she buys raw materials from other people, because she cannot always go to theforest, as she has domestic chores and must send her children to school.
Proa mats are generally woven during the wet/cool season, because during the dry season weaving must bedone in the early morning (4 a.m to 9 a.m.) as the Proa material is fragile when it is dry. She spends four tofive days to weave one mat and is able to produce four mats per month. This is part-time work, because ofher other domestic work. A bunch of raw Proa material costs 10,000 Riel and can produce one woven Proamat. The price of a woven mat 1.2m by 2m is 25,000 Riel and smaller sized mats are priced 15,000 Riel. Foreach mat, she is able to earn a net profit of about 7,000 Riel to 8,000 Riel per mat. Her products are boughtby middlemen, who make the purchases at her residence when the mats are completed.
As a result of the WCD Project, she has learned dyeing, using 20 to 30 color pigments, more about Proawoven mat weaving, and the more ornate dyed style [kome]. Before the project she used natural colors andtechniques that have been handed down through the generations in her family. Her relatives and neighborshave also shifted to the newly learnt techniques.
A 1.4m. by 2m woven Proa mat can be sold for 50,000 Riel. This is a higher price than the traditional designshe used to do. However, she only sold two Proa woven mats to the WDC, made after 10 days work in theCenter.
She has suggested to the WDC to buy the new products/Proa woven mat with [kome] from her in order toensure her an income that can support her family. The WDC could play an important role to ensure a fairprice for her products and thus, reduce or eliminate the arbitrarily low pricing set by middlemen who oftendrive down buying prices.

Poverty & Social Impact Assessment (PSIA) 29
Box 4. SRP: Case Study: Woman Direct Beneficiary of cotton Weaving & Handbags
SRP: Case Study: Woman Direct Beneficiary of Cotton Weaving & Handbags
Mrs. Thao Heap is 47 year old and lives in a small hut made of palm leaves and bamboo. A widow with fourchildren, she also lives with one other female and an elderly mother. She lives in is a vulnerable household inPhlong village, Leang Dai Commune, Angkor Thom district in Siem Reap Province. She has 2,600 squaremeters (1/4 hectare) of paddy land from which she harvests approximately 300 Kg of rice per year/season.This is well below her family’s rice requirement for a year and the household experiences a rice deficit at leasteight months a year. Her son helps by catching fish for food from the stream during the night. She told us ofinstances when her family members sometimes ate only two meals per day.
She was selected to be in the group of cotton weaving & handbags as the WDC provided training in Proa matweaving. Mrs. Heap seized the opportunity to learn Proa mat weaving, as have the other members in theProa mats group. The reason why she tried to learn Proa mat weaving is because, since she was 17 yearsold she has been engaged in proa mat weaving which is a traditional craft occupation in her family. This skillis useful and can be used for making money. She is a practical woman and has shared her knowledge withneighbors on proa mat weaving with decorative [kome] designs.
She is presently employed part-time by the WDC in Angkor Thom district in Siem Reap Province as ahandbag tailor. She earns US$1.00 for every handbag completed. She has expressed her feelings that,coming from a poor household, she is very satisfied with any kind of job that provided income to herhousehold. She appreciates receiving new knowledge and techniques from training and workshops providedby the Project.
She has taken up jobs in Proa mat weaving, palm leaf weaving, handbag tailoring, and selling cakes. She hasstressed that, for the Proa mats, if raw materials are available she can produce around four woven mats permonth. The raw materials for a bundle of Proa cost 10,000 Riel from which she can produce one Proa mat(1.4m by 2m). She has sold the ornate mats [kome] to the WDC at the price of US$10 each, sometimes up toUS$13. At the time of our interview, she still had two Proa mats that the WDC had not bought.
Generally she has sold the mats within the community and to the WDC center in Angkor Thom district. It wasdifficult for her to tell us her net income from the products sold because, as she has described, she is earning"from hand to mouth". However, she did say that if she sells one Proa mat, she is able to use the income tobuy what her family needs.
Overall she feels the people in this community receive benefits from the project implementation, receivingorders from the WDC. She is particularly satisfied with the project and has suggested that the WDC shouldget more clients to order the products.
She says that her livelihood before and after the implementation of the WDC Project has remained the same.Despite being unable to determine if her household has become poorer or not, she stated that the people inthis community have received benefit from the WDC Project. It enabled several households to be gainfullyemployed from the orders of WDC clients. Personally, she is satisfied with the WDC Project. She alsosuggested that the WDC should work to ensure that there are clients who will order products and createadditional employment for her community.
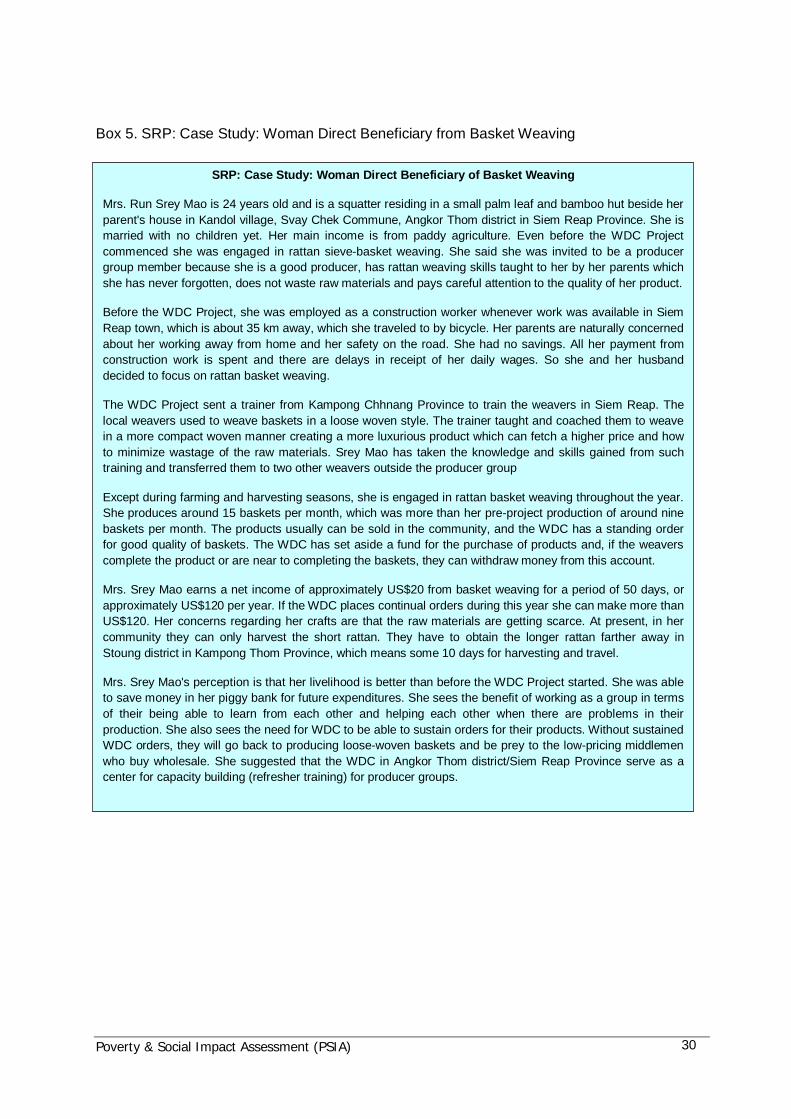
Poverty & Social Impact Assessment (PSIA) 30
Box 5. SRP: Case Study: Woman Direct Beneficiary from Basket Weaving
SRP: Case Study: Woman Direct Beneficiary of Basket Weaving
Mrs. Run Srey Mao is 24 years old and is a squatter residing in a small palm leaf and bamboo hut beside herparent's house in Kandol village, Svay Chek Commune, Angkor Thom district in Siem Reap Province. She ismarried with no children yet. Her main income is from paddy agriculture. Even before the WDC Projectcommenced she was engaged in rattan sieve-basket weaving. She said she was invited to be a producergroup member because she is a good producer, has rattan weaving skills taught to her by her parents whichshe has never forgotten, does not waste raw materials and pays careful attention to the quality of her product.
Before the WDC Project, she was employed as a construction worker whenever work was available in SiemReap town, which is about 35 km away, which she traveled to by bicycle. Her parents are naturally concernedabout her working away from home and her safety on the road. She had no savings. All her payment fromconstruction work is spent and there are delays in receipt of her daily wages. So she and her husbanddecided to focus on rattan basket weaving.
The WDC Project sent a trainer from Kampong Chhnang Province to train the weavers in Siem Reap. Thelocal weavers used to weave baskets in a loose woven style. The trainer taught and coached them to weavein a more compact woven manner creating a more luxurious product which can fetch a higher price and howto minimize wastage of the raw materials. Srey Mao has taken the knowledge and skills gained from suchtraining and transferred them to two other weavers outside the producer group
Except during farming and harvesting seasons, she is engaged in rattan basket weaving throughout the year.She produces around 15 baskets per month, which was more than her pre-project production of around ninebaskets per month. The products usually can be sold in the community, and the WDC has a standing orderfor good quality of baskets. The WDC has set aside a fund for the purchase of products and, if the weaverscomplete the product or are near to completing the baskets, they can withdraw money from this account.
Mrs. Srey Mao earns a net income of approximately US$20 from basket weaving for a period of 50 days, orapproximately US$120 per year. If the WDC places continual orders during this year she can make more thanUS$120. Her concerns regarding her crafts are that the raw materials are getting scarce. At present, in hercommunity they can only harvest the short rattan. They have to obtain the longer rattan farther away inStoung district in Kampong Thom Province, which means some 10 days for harvesting and travel.
Mrs. Srey Mao's perception is that her livelihood is better than before the WDC Project started. She was ableto save money in her piggy bank for future expenditures. She sees the benefit of working as a group in termsof their being able to learn from each other and helping each other when there are problems in theirproduction. She also sees the need for WDC to be able to sustain orders for their products. Without sustainedWDC orders, they will go back to producing loose-woven baskets and be prey to the low-pricing middlemenwho buy wholesale. She suggested that the WDC in Angkor Thom district/Siem Reap Province serve as acenter for capacity building (refresher training) for producer groups.

Poverty & Social Impact Assessment (PSIA) 31
Box 6. SRP: Case Study: Woman Direct Beneficiary from Basket Weaving
SRP: Case Study: Woman Direct Beneficiary of Basket Weaving
Mrs. Soy Prang is 37 years old, residing in Ta Trav village, Svay Chek Commune, Angkor Thom district inSiem Reap province. She has three children and her main income is derived from paddy farming. Before theWDC Project she was engaged in rattan basket weaving, traditional Pandanus mat weaving, and alsoemployed as agricultural labor in order to supplement her main income. She experiences food insecurityseven months/ year.
She has been selected to be in the producer group of rattan basket weaving and trained for weaving goodquality baskets. Mrs. Soy Prang is very satisfied with the weaving skills and is happy as she can start andstop working whenever she feels the need or is not comfortable to work. She added that if she was employedfull time by an employer she could not relax or stop work during working hours.
Presently, she weaves baskets at home and her husband helps in harvesting the rattan from forest and helpssplitting the rattan. She also says that the rattan is now scarce due to fact that many people are competing forthe material and also slash and burn agriculture practiced in her community destroys some of the rattan.
Through trainings and workshops for improved production techniques of high quality rattan basket weavingprovided by the Project she has learned techniques that she applies in her own household and has taughtthese skills to two of her neighbors. However, she said that these good products are somewhat limited asonly WDC orders provides a market for these products. Middlemen do not place orders for these kinds ofbaskets. Since the commencement of the WDC Project she has sold the good quality baskets to WDC onceor twice. Since then the WDC has not made any orders. As a result (for selling purposes), she makestraditional baskets (loose woven baskets).
She is engaged in basket weaving the entire year except during the transplanting and harvesting seasons inher own paddy or is employed by neighbors or in the community/district. Before the project, she weavedtraditional loose woven baskets, which sold for a cheap price in her village (each basket being 0.5m by 0.4mby 0.8m selling for 3,000 Riels). Some households in her community that receive money advances frommiddlemen sell their products at the cheapest price to the middlemen. They have to produce the products tosell for middlemen or else they must re-pay all the money received in advance from them.
During the interview, she could not tell us whether her livelihood had improved or not because the incomefrom basket weaving and other activities is spent for food. Even though the price that can be received forbaskets or other products may be a bit higher, the price of food is also higher.
Although, she spoke well of the WDC Project and said that working as a group had provided benefits towomen in her community in terms of capacity building, introducing the new techniques and technology suchas compact basket weaving, using and saving raw materials in producing baskets, she also suggested thatthe WDC should order the good quality baskets at a higher price. She frankly does not want to weave thetraditional basket that sells at the cheaper price, prices set by middlemen who export these products to PoiPet city/Cambodian-Thai borders.

Poverty & Social Impact Assessment (PSIA) 32
Box 7. KCH: Case Study: Woman Direct Beneficiary from Sedge Mat Weaving
KCH: Case Study: Woman Direct Beneficiary from Sedge Mat Weaving
Mrs. Sim Sok, a beneficiary of the WDC Project, is 56 years old, married with eight children and lives in TrapeangKrapeu village, Tuek Hout commune, Rolea B’ier district, Kampong Chhnang Province. She is now a member ofa producer group in her village. She produces sedge mats and triangle sedge mats. Her livelihood depends onrice cultivation on her two hectares of land, producing sedge mats for sale and on planting vegetables.
Before the WDC Project started, she said her income was not good because her rice production was low yieldingwith 1.5 tons per hectare. This is not adequate for a 10-member household. Her family has (expensive) healthproblems, there are too many children to support and she is in debt. She didn’t save any money during that timeand there was not enough money for the inputs needed by her paddy field, such as fertilizer, diesel to pump waterinto rice field or plow rental services.
The WDC Project supported her in producing sedge mats. She attended the skills training provided by the WDCProject. She is happy to have new technical skills in producing sedge mats of good quality, with good colors andknowing the way of designing Kome which she can sell at a good price. Her income has risen to around1,000,000 Riel, or US$256, per year.
She has produced a new type of sedge mat with some five to six mats produced per year, with one mat selling for40,000 Riel. At the same time, she also produced 100 traditional sedge mats (red mats), with each mat selling for16,000 Riel to 25,000 Riel, depending on its size. The income from selling woven products along with her mainincome from rice production has allowed her to send her children to school, pay off her debts, buy bicycles for herchildren to go to school, buy agricultural materials and purchase some household assets.
In addition, she has tried to save some money from selling her sedge mats and used the money to raise livestock,such as chicken, ducks, pigs and now five cows. She hopes that in the years to come her standard of living willcontinue to improve, since she has been able to diversify into several livelihood activities. Currently, she can sendher children for higher education in Phnom Penh. These improvements and new possibilities can be attributed tothe training activities conducted by the WDC Project.
Aside from the training in skills that have improved the quality of her products, Mrs. Sim Sok also receivedtraining in Home and Work Safety, Gender and Entrepreneurship Development, Food Processing, Post-harvestProcessing and Women Workers Rights. She is happy with the training and has shared her knowledge with othermembers in the group. She also applied the knowledge gained in food processing.
She is working with a group on sedge mats weaving. She said the benefit of working as a group is that it ispossible for members to share knowledge together, discuss matters concerning pricing and work more efficiently.Even though the WDC Project has finished she will continue to strengthen her group and continue her weaving.

Poverty & Social Impact Assessment (PSIA) 33
Box 8. KCH: Case Study: Woman Direct Beneficiary from Sedge Mat Weaving
KCH: Case Study: Woman Direct Beneficiary from Sedge Mat Weaving
Mrs. Ben Orn is 50 years old, a widow with two children and lives in Kouk Sdau village, Tuek Hout commune,Rolea B’ier district, Kampong Chhnang Province. She is now a member of sedge mats producer group, whichwas supported by the WDC Project.
Her main income is from rice cultivation on 1.5 hectares of land that she owns. Other income comes from theweaving of sedge mats. Before the WDC Project started she produced normal sedge mats and triangle sedgemats with the traditional design. She estimated that she produces around 130 to 150 mats (both types of sedgemats) per year. The number of products varies according to the volume of sedge resources available in eachyear. The price of sedge mats also varies according to its size. One triangle sedge mat will sell for 5,000Riel and25,000Riel for one round sedge mat (red mat). Materials come from the sedge plants she has transplanted,although during this past year her plants were destroyed by floods. Because she is a widow and has a lowincome from rice cultivation, her life was fraught with difficulties. She sometimes had no money when she was illand as a result went deeper into debt.
When the project started, she was asked to join as a member of the producer group in her village because shealready had weaving skills. During that time, the project provided new technical skills of producing sedge mats,improving the quality of products with varied colors and by using an intricate kome design which allows mats to besold at a good price (1 mat = 35,000 Riel). She can produce some 10 mats in a year. With the knowledge andskills gained, she has been able to change and diversify her product portfolio. All products she produced weresold to the WDC and to other middlemen.
In her family there are two other members who help produce sedge mats. They work on this every day. She saidshe likes weaving because she can stay at home, look after her grandchildren and produce mats in her free time.She appreciates not just the knowledge gained from the project but also the added income from selling mats.Although her income is not high, she is able at least to afford food and some daily expenses. She is now trying toincrease the number of mats she can produce and sell so that she can save some money. She estimated that herincome was around 900,000 Riel or US$220 per year. She was able to pay off her debts and earn enough moneyto cultivate a dry rice crop. Even with all these activities, she still has free time at home and ventured intocommercial food processing, utilizing skills and knowledge gained from the project.
Since the project, her family members were able to engage in more livelihood activities than before. She hopesthat through these activities her standard of living will improve in the future. She suggested that the project shouldcontinue supporting her producer group in order to strengthen them so that they can become independententrepreneurs. She especially appreciated that the project has supported livelihood activities for widows andfemale-headed households, as this demographic’s economic situation is poor and has no other income exceptrice cultivation.

Poverty & Social Impact Assessment (PSIA) 34
Box 9. KCH: Case Study: Woman Direct Beneficiary from Sedge Mat Weaving
KCH: Case Study: Woman Direct Beneficiary from Sedge Mat Weaving
Mrs. Un Khean is 55 years old, a widow with two children and is one of the beneficiaries of the WDC Project. Sheis currently residing in Khaeng Poar village, Tragnel commune, Kampong Leang district, Kampong ChhnangProvince. She is now a member of sedge mats producer group in her village.
The main income of her family has been the cultivation of rice on 1.2 hectares of land that she owns. Otherincome comes from the cultivation of their upland farm or Chamkar, from her vegetable garden, cattle raising andincome from sedge mats products. She said that before the project her income was just enough to support awhole family. During that time, her living standard was beset with difficulties. The primary use of income wasmedical treatment. In addition, the rice yield was low – only 1.5 tons per hectare. This was not enough to supportthe four members in the family. Her crop also suffered from insect infestation, which destroyed her crops andsome of her cattle became sick. There was little income from her production of sedge mats and with the dailyexpenses she was not able to save money.
By becoming a member of the sedge mats producer group, which was supported by the WDC Project, shelearned a lot, including technical skills, the use of many colors and ornate Kome design which improved herweaving skills and improved the quality of her mats. She produced six or seven mats per year that were sold toDoWA and the WDC Project, with one mat having a price of 40,000 Riel. At the same time, she produced normalsedge mats (red mats) as usual, a total of 30 to 40 mats per year at prices that varied according to size - one matgenerally selling for 25,000 Riel. The number of sedge mats produced depends on the availability of sedgeresources.
She likes this new method because it allows the joining of short sedges which before she would throw away.Therefore, the new designs are more economical. She seemed happy with her work, as it can command higherprices, uses less material, increases the number of products and produces items of good quality. Moreover, shehas introduced this new method to other members in her group and her relatives. All the products she was able toproduce were bought by DoWA and the WDC.
The project also offered her many other livelihood options. She learned about producing jam made from tamarindand making deserts for sale using sour fruit cooked in sugar. She has focused on sedge mats weaving and herchildren have also gotten involved in these other income-earning activities, which added to the family’s income.She estimated that she can make around 100,000 Riel or US$24 per month.
Un Khean has high hopes that her life will improve further because she had been diligent in pursuing livelihoodand income-earning activities. Her personal view is that the WDC Project implementation was satisfactory andthat it enabled many people like her to participate, learn things and apply them to earn income. The trainingprovided by the project was relevant as it improved the sedge mat products and is linked to what the marketdemands. She felt confident that she can increase the volume of mats if there is a strong demand for them. Shesuggested that the WDC Project should continue to support her village and should conduct other trainingworkshops, which are useful in increasing villager income.

Poverty & Social Impact Assessment (PSIA) 35
Box 10. KCH: Case Study: Woman Direct Beneficiary from Sedge Mat Weaving
KCH: Case Study: Woman Direct Beneficiary of Sedge Mat Weaving
Mrs. Meas Sarum is 52 years old and married with four children. She lives in Tragnel village, Tragnel commune,Kampong Leang district, Kampong Chhnang Province. A member of a sedge mats producer group, she one ofthe beneficiaries of the WDC Project,
Her main income has been dependent on rice cultivation. She is also engaged in animal raising, sedge matsweaving and cotton weaving. She continues with these activities upon which her earning a living depends. Shespoke about the difficulties in her socio-economic situation. She has only a small parcel of land (0.8 hectare) forplanting rice and the total of her rice production was around 1,400 kg of rice per year. There has been a chroniclow production of paddy rice, and there has never been enough for her family to eat. There is also the constantworry about money whenever someone in the family gets sick, and there is the high cost of supporting herchildren’s education. She said she copes with the lack of money by borrowing from her neighbor.
When asked about what benefit she got from the WDC Project, she said that the most significant aspect was thetraining. She undertook training on Home and Work Safety, Food Processing, Post-harvest Processing, Genderand Entrepreneurship Development, Women Worker Rights and training on improving the quality of products.She said she has applied what she had learned from all these trainings; especially on sedge mats production andfood processing.
She has changed the style of her sedge mats products from traditional motifs to new sedge mats designs,because the latter command good prices in the market. She also shifted from individual production to workingwith her group. She said that working as group makes production go faster; they can evaluate the quality of theirproducts, share knowledge, discuss market conditions and share common interests.
With the WDC Project she produced a greater number of sedge mats for sale - about 12 mats of the new design,which she sold to DoWA and the WDC center. One sedge mat sold for 40,000 Riel. She was able to increase herlivelihood activities and income throughout the project period. Even though she could not save as much moneyfrom this weaving, her income from this work can support some of her daily expenses. She likes sedge matweaving because she can stay at home, look after children, cook and can earn some money.
She hopes that her standard of living will improve faster through activities, which were supported by the project.Mrs. Sarum suggested that the project should continue to support the women in her community and thus enablethem to sustain their livelihood activities and to improve their standard of living. The existing producer groups ineach village is a resource that should continue to be used she says, as they have skills, experiences and anetwork already in place.

Poverty & Social Impact Assessment (PSIA) 36
Box 11. KCH: Case Study: Woman Direct Beneficiary from Bamboo Handicrafts
KCH: Case Study: Woman Direct Beneficiary of Bamboo Handicrafts
Mrs. Phan Sopha is 53 years old and lives in Luong village, Cheung Kreav commune, Rolea B’ier district,Kampong Chhnang Province. One of the beneficiaries of the WDC Project, she is now a member of a bamboohandicraft producer group in the village.
Her living had depended on paddy rice cultivation on a 0.7 hectare piece of land whose annual yield is around1,400 kg per year. She also raises cattle and produces bamboo handicrafts for sale. Her living condition beforethe WDC Project started was difficult because she had only a small parcel of land with low crop yield and herfamily experienced rice shortages every year. The bamboo products she sells were selling at the low prices setby middlemen. She says that many of the families in her community are in debt and usually need to borrowmoney.
The WDC Project supported her in producing bamboo handicrafts. She had attended many training sessions thatwere provided by the WDC Project. With new techniques and skills learned she has applied these in her work andimproved the quality of her products and also started producing new type of products. She reported that therewas slightly more income when compared to the time before the project started. She estimated that her incomewas around 60,000 Riels or US$14 per month. With this income she can meet her family’s daily expenses andalso buy more raw materials.
Besides the training skills, she also learned many things on Home and Work Safety, Gender andEntrepreneurship Development, Food Processing, Post-harvest Processing, and Women Worker Rights. Shesaid she greatly appreciated these trainings and she has shared the knowledge gained with other communitymembers.
She worked with a group producing bamboo handicrafts. She said that group work encourages members to sharetheir knowledge, allows them to talk about their work experiences, discuss pricing, and enables them to completethe work faster. When the WDC Project is finished, she will continue the craft because she likes this work. Theywill make an effort to strengthen their group and try to find new markets for their products.
As result of the WDC Project, she has been able to increase the livelihood activities of her family. She continuesto raise livestock, make cakes for sale and produces other products made from bamboo. She hopes that herliving standards will continue to improve in the future through these livelihood activities. She suggested that theWDC Project should continue supporting the producer groups in bamboo handicrafts because they need to bestrengthened, especially as regards their ability to save money and find both clients to buy their products and asteady market for their goods.
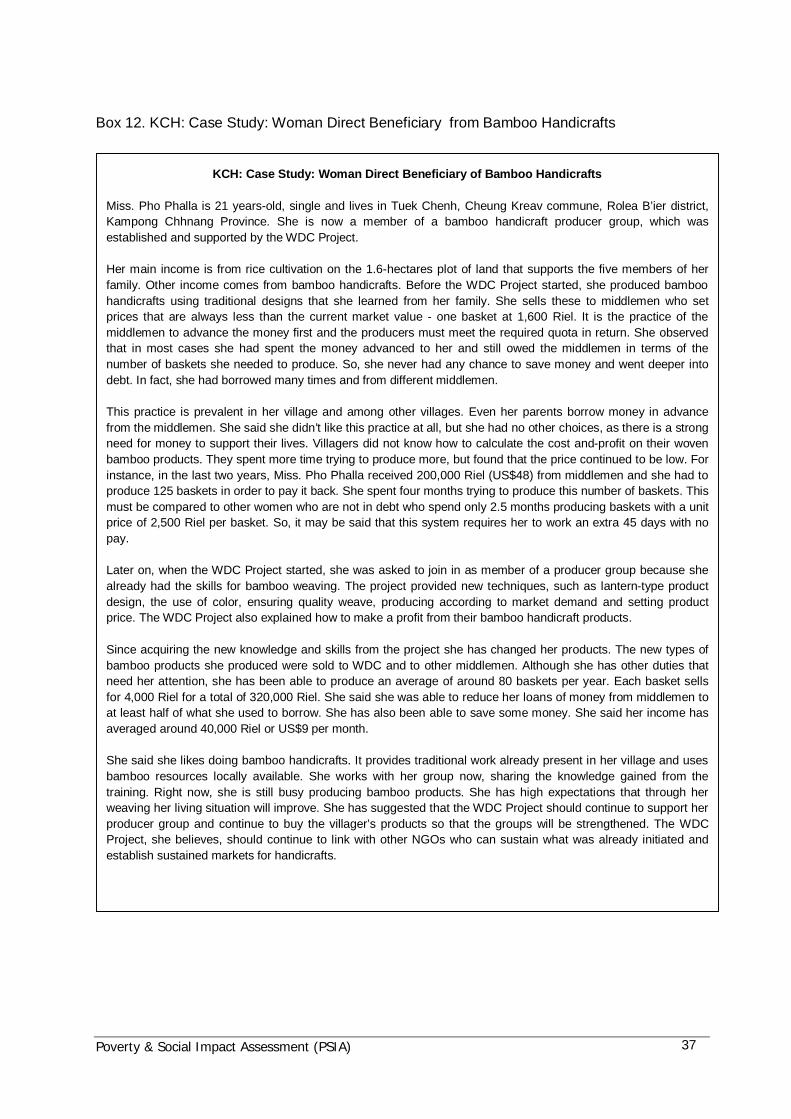
Poverty & Social Impact Assessment (PSIA) 37
Box 12. KCH: Case Study: Woman Direct Beneficiary from Bamboo Handicrafts
KCH: Case Study: Woman Direct Beneficiary of Bamboo Handicrafts
Miss. Pho Phalla is 21 years-old, single and lives in Tuek Chenh, Cheung Kreav commune, Rolea B’ier district,Kampong Chhnang Province. She is now a member of a bamboo handicraft producer group, which wasestablished and supported by the WDC Project.
Her main income is from rice cultivation on the 1.6-hectares plot of land that supports the five members of herfamily. Other income comes from bamboo handicrafts. Before the WDC Project started, she produced bamboohandicrafts using traditional designs that she learned from her family. She sells these to middlemen who setprices that are always less than the current market value - one basket at 1,600 Riel. It is the practice of themiddlemen to advance the money first and the producers must meet the required quota in return. She observedthat in most cases she had spent the money advanced to her and still owed the middlemen in terms of thenumber of baskets she needed to produce. So, she never had any chance to save money and went deeper intodebt. In fact, she had borrowed many times and from different middlemen.
This practice is prevalent in her village and among other villages. Even her parents borrow money in advancefrom the middlemen. She said she didn’t like this practice at all, but she had no other choices, as there is a strongneed for money to support their lives. Villagers did not know how to calculate the cost and-profit on their wovenbamboo products. They spent more time trying to produce more, but found that the price continued to be low. Forinstance, in the last two years, Miss. Pho Phalla received 200,000 Riel (US$48) from middlemen and she had toproduce 125 baskets in order to pay it back. She spent four months trying to produce this number of baskets. Thismust be compared to other women who are not in debt who spend only 2.5 months producing baskets with a unitprice of 2,500 Riel per basket. So, it may be said that this system requires her to work an extra 45 days with nopay.
Later on, when the WDC Project started, she was asked to join in as member of a producer group because shealready had the skills for bamboo weaving. The project provided new techniques, such as lantern-type productdesign, the use of color, ensuring quality weave, producing according to market demand and setting productprice. The WDC Project also explained how to make a profit from their bamboo handicraft products.
Since acquiring the new knowledge and skills from the project she has changed her products. The new types ofbamboo products she produced were sold to WDC and to other middlemen. Although she has other duties thatneed her attention, she has been able to produce an average of around 80 baskets per year. Each basket sellsfor 4,000 Riel for a total of 320,000 Riel. She said she was able to reduce her loans of money from middlemen toat least half of what she used to borrow. She has also been able to save some money. She said her income hasaveraged around 40,000 Riel or US$9 per month.
She said she likes doing bamboo handicrafts. It provides traditional work already present in her village and usesbamboo resources locally available. She works with her group now, sharing the knowledge gained from thetraining. Right now, she is still busy producing bamboo products. She has high expectations that through herweaving her living situation will improve. She has suggested that the WDC Project should continue to support herproducer group and continue to buy the villager’s products so that the groups will be strengthened. The WDCProject, she believes, should continue to link with other NGOs who can sustain what was already initiated andestablish sustained markets for handicrafts.

Poverty & Social Impact Assessment (PSIA) 38
5.0 PROJECT EFFECTIVENESS: COMMUNITY INTERACTION, MOBILIZATION, PARTICIPATION,SOCIAL CAPITAL AND THE DEGREE OF BENEFICIARY BUY-IN TO THE ACHIEVE THEOBJECTIVES OF THE PROJECT
The assessment discovered through discussions with the project stakeholders (the WDCstaff, local provincial and commune authorities and the producers), that the design of theproject was viewed as appropriate. The systematic framework that was established by theCRA and the needs assessment during the start-up phase has helped build up theorganizing and training program for the producers, and also enhance the capacity-buildingactivities for the project implementation units.
After the training and counseling efforts, many producers now have the courage to tryproducing the more innovative products, apply new techniques in their vegetable farmingand engage in new livelihood activities, such as food processing. The project also enabledthe producer groups to share what they learned with the greater community.
The project established 76 producer groups with 889 members in both provinces. Thesegroups became hubs for small-scale enterprises. They became a venue for sharing withother members the techniques and information learned from the project, for learningtogether, sharing experiences, talking about the supply of raw materials and determiningproduct prices. The project has encouraged savings to a certain extent and has socializedthe production rather than the previous individualized production processes. It has alsoallowed members a voice in the discussion and the decision-making process, and hasproven important in mobilizing the participation of the community in village-level workshopsand awareness raising. It has also attracted the attention, concern and participation of villageleaders and other local authorities.
There has been significant participation of producer group leaders, village and communechiefs and key persons in each of the target villages where the Commune Producer GroupCenters are being built. The WDC Project engaged the community in planning andstrengthened agreements on land use for the centers and the eventual maintenance of thefacilities. It has also opened up work with local contractors, who will benefit from theconstruction activities. Local authorities have figured much in mobilizing communityparticipation, in local advocacy and awareness raising activities.
There was also good interaction of the WDC Project with other agencies doing similar localenterprise projects. The project cooperated with CARE in its module on producer groupformation. It cooperated with ILO, utilizing its “GET Ahead” module. It has held talks withCEDAC on its rice intensification and integrated pesticides management techniques. TheWDC Project has also networked with the Carpets for Communities (CfC), an Australian-based social enterprise. The two are discussing the possibility of working together in SiemReap to identify and train women with children who are not attending school so they can usegarment factory remnants to produce rugs. The project also worked with the KhmerWomen’s Handicraft Association.

Poverty & Social Impact Assessment (PSIA) 39
There was good networking and learning with entrepreneurs in other provinces, particularlythrough the producer’s visits, such as the sedge mat producers from Kampong Leaeng’s visitto the Ksach Kandal factory, and the bamboo basket producers from Cheung Kriev’s visit toother producer groups in other parts of the country and markets in Phnom Penh.
Nevertheless, there are aspects that must be addressed to sustain the participation andownership of the members of the producer groups in the process. Foremost is that theyshould not be relegated as just suppliers of the products to the WDC and to the market.They should be linked to the market itself and to other business development serviceproviders where they can access continued information, micro-financing, businessmanagement training and expand their client base.
6.0 PROJECT RELEVANCE: COMMUNITY-BASED APPROACH TO ENTERPRISE DEVELOPMENT,OVERALL OUTCOMES
In line with the overall goal of poverty reduction, the impact of the WDC Project provedconsistent in addressing the conditions it meant to tackle. This was especially true in regardsto providing better options for off-farm income-earning activities for women and householdsto supplement subsistence agriculture. The WDC Project further improved the skills ofwomen artisans and entrepreneurs in terms of providing them knowledge and skills on theirparticular enterprises and heightening their awareness of social issues, specifically on theirrights, household safety and health and hygiene. It provided a way for empowering women,individually through having income, but also as producer groups, which can be the beginningof sustained entrepreneurship. At the institutional level, the WDC Project was consideredrelevant to the needs and aspirations of the target beneficiaries.
The project used a participatory, market-oriented approach to enterprise development. TheCRA component of this approach looked into the existing resources, skills and opportunitiesin terms of their appropriateness to market demands. The project also conducted productselection and market chain analyses before coming up with the enterprise developmentaction plans.
The project has specifically involved women in the participatory rural appraisal and thereforehinged the project design on their practical needs. The project has significantly consideredcommunity and beneficiary suggestions such that the focus of its counseling supportemphasized women's socio-cultural empowerment. It has also encouraged the developmentof other livelihood activities, such as food products, cotton weaving and ways to add value tosuch raw products as sewing handbags. It has encouraged the community and producers tobe concerned about raw material sources through planting and regeneration of sedge,bamboo, pandanus leaf, etc. Overall, the project has been committed to involving strongcommunity support, and has made a concerted effort to engage beneficiary participation inboth the planning and production processes.
Overall, the project recruited villager involvement in the setting up process – the mostimportant elements of this effort being community participation in planning, the setting up ofproduction groups and encouraging the groups to come up with products after addressingweaknesses in skills, product quality, costing-pricing and, to a certain degree, on the sourceof inputs.

Poverty & Social Impact Assessment (PSIA) 40
However, there are still basic aspects not strongly addressed; namely collective marketing,strengthening the links of producer groups (not WDC) to the markets and establishing localsources for inputs (including savings and capital). Interviews with producers seem to indicatea strong reliance on the WDC as a market for their products and a belief that the WDC willbe responsible for finding new markets. The project also has not comprehensivelyaddressed actors in the supply chain, notably the suppliers and the traders whose practicesare major determinants on the cost-profits calculation. The latter is especially critical indetermining the products and prices, which they decide based on their linkages to markets.
The project was not able to factor in an appropriate response to the issue of theindebtedness of many producers to the traders, the effects of which were made clear by thecase studies. The CRA has brought this out, but a strong savings and micro-creditcomponent – which could have been arranged with micro-finance institutions – was notincluded in the project design. However, to a small degree the awareness raising hasresulted in women putting aside savings from their earnings. The project impact could havebeen more significant if it had helped the beneficiaries reduce their debts to and reliance onmiddlemen.
a. Enterprise Development
Key Informants in both provinces have expressed the view that the producer groups havereceived new knowledge, techniques and technology in order to improve product quality andincrease the quantity of products. The use of raw materials is now more economical andefficient, having eliminated the wasteful practice of throwing away short lengths of rawmaterials (sedge, triangle sedge, rattan, bamboo and so forth), as was the practice beforethe WDC Project. Now the shorter lengths of raw materials are being used. Producer groupshave used the knowledge, experiences and understanding gained from the training courses,workshops and study tours and applied this to their livelihood and handicraft activities. Manyof the producers have shifted from working individually to working in groups and networkingwith other groups. The WDC Project enhanced their working environment, and moreparticipants are now working longer hours, placing greater value upon their time and havingmore interest in their production. They also have shared their newfound knowledge andexperiences with others.
The project upgraded the WID center in Kampong Chhnang Province to become a WDC andconstructed a new WDC in Siem Reap Province. The aim of the WDC Project was totransform these facilities into enterprise development-oriented organizations, with linkages toproducer groups, which would supply products to the WDC. To a certain extent, the WDCfunctions as the link for producers for skills training and enterprise counseling. It hasestablished links to a client base, but not to the broader market as yet. It acts as a buyer of asubstantial number of the products from producer groups. However, it is reasonable to saythat the transformation from WID to WDC has still some way to go – mainly due to thecurrent lack of capacity of WDC staff (MoWA) to operate these centers as “EnterpriseDevelopment Centers”. The WDC Director in Siem Reap is a PDWA staff member whosemandate is mainly for governmental services, which may not be business enterprise-orientedin nature. The Director also does not have the skills, support, or funding to operate thecenters as WDC’s. There is a need to push MoWA towards bringing in investment and

Poverty & Social Impact Assessment (PSIA) 41
resources for the WDC to fully realize their functional potential, including facilitating accessto micro finance and to secure alternative markets.
The project has not effectively broken the stranglehold of middlemen over the supply chain.The indebtedness of producers through advance payment by middlemen/traders hasresulted in the continuation of cheap prices and a continuous production of low-pricedproducts. Also, while the project has provided market access to a substantial portion of theproducts, the middlemen/traders continue to control a larger share. There is a need tosustain product demand through the WDC by expanding its client base or linking theproducer groups to the market, rather than relying on middlemen/trader connections. Theproducers and the WDC staff see the next step as being a search for new markets forproducer group products, with consideration on using appropriate media to promoteproducts, including labeling and branding. The WDC and the Commune Producer Centersshould be maximized to showcase products from each village, and to promote activities toattract new wholesale buyers and clients.
b. Improvements in the Capacity of MoWA Technical StaffSubstantial support services were put into place to build up the capacity of MoWA staff in themanagement of the project. There was improvement of procurement procedures and a moredefined relationship of functions between the national offices of PDWA and the WDC. TheMOWA Economic Development Department staff has undergone relevant training in therange of topics needed by the WDC staff for the project component’s activities. Theimprovement of MoWA’s support services is seen by key informants in both provinces asvital for the elimination of delays typically experienced during project start-up. Also desired isa more visible presence by national staff in the supervision and support of WDC activities.WDC/PDWA staff said they received relevant information and knowledge from the nationalstaff, which was facilitated through the trainings they attended and in the interaction ofnational staff with the provincial staff. The national staff is seen to have shown a strongcommitment to truly upgrading the people’s lives, even attending activities scheduled duringweekends.
Generally, we can assume that MoWA Technical Staff have become familiar with theprocess for participatory and market-oriented enterprise development. However, there areother aspects of the enterprise management within a value-chain approach that were notreally implemented in the project’s timeframe, a list that notably includes: accessing capital,market linkages, innovative product design and technologies based on market information. Itis necessary that value-chain expertise be sustained in MoWA for project sustainability or foropening up similar projects (assuming that new project funding is obtained).
c. Overall Impact of the Project
Key Informants in both provinces shared their perceptions of the overall impact of the WDCProject. The skills that the beneficiaries obtained during the project proved useful and helpfulin improving their livelihoods. These skills were applied not only for income-earningpurposes, but also to process food for their own consumption, e.g., food processing andtraining on food preservation such as pickling, jams and bean juice.

Poverty & Social Impact Assessment (PSIA) 42
The WDC is making efforts to widen its network of traders/clients through the promotion andsale of the products at national trade fairs, workshops and seminars. The WDCs andCommune Producer Centers can play an important role in attracting more clients andpromoting community products. Cooperation between government agencies and NGOs isalso part of efforts to promote the village products.
7.0 PROJECT SUSTAINABILITY ASSESSMENT
a. Human Resources:The focus group discussions in both provinces reported that there is an ongoing continuinginvolvement of beneficiaries in handicrafts and vegetable growing as a sustained livelihoodendeavour. There is a viable inherent human resource base with the skills, inclination andexperience in sustaining such livelihoods. There is also improved knowledge by theseartisans, thanks to the project training and their own application of the skills, practices anddisciplines learned. Therefore, the project has left behind the legacy of techniques andtechnology needed to improve product quality, economy in use of raw materials and thebenefits of group effort in setting product standards, prices and negotiating with middlemen.There is also a better regard for the safety of consumers (especially as practiced invegetable gardening). Furthermore, the members of the producer groups have alsoreplicated their techniques with other members of the community. This extends the humanresource knowledge base and sustains interest in the new practices.
b. Sustaining the Farming Resource Base and Raw Materials for HandicraftsIn general, there is a resource base of the raw materials needed for handicrafts enterprise. Asubstantial portion of the project area still has widely available bamboo, pandanus andsedge materials found in common property areas, such as forests and near river areas.There may be limitations in the rattan and proa raw materials, and most are sourced outelsewhere, which adds to the cost of inputs and production. However, in general, the projectbeneficiaries still collect raw materials rather than buying from suppliers. Since non-timberforest product collection is prevalent there seems to be a source for raw materials. Anotherindication of raw material sustainability is that some households plant and grow sedges.
In regions outside of the project areas where the raw materials suppliers get their stock(such as Stoung district in Kampong Thom Province), there is positive development in thatGovernment has approved and awarded community forests, which are managed by thecommunity. This is a good indication of conservation and protection practices, which aim toensure that the raw material base will not be depleted. Nevertheless, sustaining the supplyof raw materials for producer groups is critical to their ongoing viability and long-termsustainability.
For vegetable production, the project has relied on improved practices by the producergroups in organic farming and put in some restraints with respect to the use of pesticidesand chemical fertilizers. However, for the majority there is widespread dependence onchemical inputs throughout the vegetable producing areas. While there is a core group offarmers practicing environmental and health-friendly farming practices, there may be need to

Poverty & Social Impact Assessment (PSIA) 43
expand the practice of organic farming, including diversifying the crops which allows for soilrecovery, e.g. root crops such as legumes which recharge the soil with nitrogen.
c. InfrastructureThe WDC Project has established two WDC facilities. It has set up a five CommuneProducer Group Centers, currently housed in the Commune Compound. The WDC hasfunctional space for housing project management, training beneficiaries, showcasingproducts, demonstrating the basic technologies in the selected crafts and has factored indesign for aesthetics that encourages environmental and sanitation concerns. WDC facilitiesalso house the basic tools needed for improving the packaging of the products, such assewing machines, cooking utensils, cut-designs and training equipment.
There are five Commune Producer Group centers, three in Kampong Chhnang Province andtwo in Siem Reap Province. These rooms, which are adjacent to the Commune offices andare close to the members’ residences, offer areas where the producer groups can gather.The commune centers also provide basic facilities for the producer groups, depending on thetype of producer group where prototype products are displayed. There is a production areawhere such activities as dyeing, design and finishing processes are demonstrated. Goodsproduced from each center could be brought for sale and exposure at the WDCs and thecommune centers could also receive orders from their clients.·Overall, these are long-term investments that continuing or future projects can use and,therefore, add sustainability to the project (within the time-life of the infrastructure). Also ofsignificance was that Government and local authorities played a big role in identifying thelocale of the facilities and processed the deeds for their donation. This assures that thefacilities will continue to be publicly managed if the WDC Project ends, and also that theseresources will continue to be available for public services.
d. Institutional SupportThere have been significant inputs and applied knowledge in project management for theMOWA, the Department of Economic Development, PDWA, and WDC Directors. MoWA’ssupport staff have remained relatively intact and have proven competent in many of theproject’s managerial and supervisory requirements, including standards and procedures,administration and finance, personnel management, project planning and monitoring,training competencies on related development issues and related skills in the selectedenterprises, etc.
Overall, the MOWA, PDOWA and project staff all have the experience to continue managingthe project, although improvement may be needed in competence. This is especially true interms of understanding how to link the supply chain to established markets in the valuechain and on how to progress to the next level of the strategy. However, a positivedevelopment is that the new Government mandate also retained the necessary institutionalsupport bodies for women's enterprise development, as well as vital top-level managementsupport.

Poverty & Social Impact Assessment (PSIA) 44
The support network of the WDCs and Commune Producer Group Centres in bothprovinces, as well as the contact network with clients and traders, has remained intact. TheWDC has expanded interest through the workshops and continued exposure of products,which has expanded the client base as a market for products. While the study has notlooked into gains from marketing of products, a fund from the sale of products has evolved,which can be used for procurement of products from community artisans. Currently,producer groups are still dependent on the WDC structure for client/market linkages,information and technology and will require further supervision in the development of theirenterprise. There is a need to continue the mentoring and supervision by the WDC until suchtime that managers rise from the ranks of the producer groups and are trained in businessmanagement. However, this is a long-term development. which is not achievable within thecurrent project framework. Furthermore, there are still significant limitations in terms of theMoWA’s ability to continue and sustain the project. There is a lack of a carry-over programand funding which will be necessary to ensure that the WDC and the Commune ProducersCenter will be able to assume this function.
The WDC Project has also drawn in the participation of other support institutions. FromGovernment, the Labor Ministry has re-invigorated a program for vocational training with afocus on rural technologies and this can be tapped to assist youth involvement in replicatingthe work of the WDC Project. Recently, the Trailblazer Foundation gave support through thedonation of 40 sewing machines for both WDCs. There exist in the project areas NGOservice providers that can sustain some of the project requirements. For example, CEDAChas activities aimed at promoting sustainable farming technology and Vision-Fund’s micro-credit services project are active in Kampong Chhnang; while GTZ and Plan Internationalhave recently started new programs in Siem Reap.
e. Gender and Socio-cultural IssuesA vital factor in the sustainability of the endeavor is the social capital that has been built. Thisis represented by the number of producer groups among women which have beenestablished and are functional as both production groups and as venues for socialinteraction for livelihood issues, promotion of fair trading practices and for women rights.These are slowly growing into self-help groups that encourage savings and investment.Indications from the women who were interviewed showed that there is a portion of income-earned from the enterprise that is saved for future production. Therefore, there exists at theproducer level an investment resource that can be further mobilized. The groups havefacilitated women’s income-earning capacity, which in turn strengthens their position in thehousehold, and, to a certain degree, improves their self-reliance and negotiating status withmale income earners. The WDC Project has also sustained the skills that were slowly beingeroded. It has involved youth in the production process, therefore ensuring the on-passing ofskills and knowledge to younger entrepreneurs.
A limiting factor has been that the study has not looked into the continued funding of projectactivities. Overall, the project’s impact was positive, especially as regards its impacts inimproving the income-earning capacity of rural women and enabling poor households toadvance in a relatively positive manner from their previous absolute-poverty status. Whilesignificant poverty reduction has not been achieved on a wide-scale basis, those who are

Poverty & Social Impact Assessment (PSIA) 45
beneficiaries of the project benefitted significantly from the advent of greater social capital interms of skills, from the proceeds of actual production, and by gaining invaluable advancesin self-confidence and a more positive outlook on life and on the future.
8.0 CONCLUSIONS: CHALLENGES, LIMITATIONS AND OPPORTUNITIES
Rural livelihoods in vegetable raising and handicrafts are becoming the most significantsupplement to the main livelihood of paddy agriculture. The production is still predominantlyon a small-scale basis and is an independent endeavour by individuals and families. Thevalue and pricing of crops and products continues to be set by traders, who are thepredominant source of capital and the marketing of produce. The WDC Project has made aconcerted effort in terms of improving products, encouraging sustainable vegetable farmingpractices and enabling work groups, which has led to groups having new products, andimproving the price of their produce. The WDC Project has set up the WDC and theCommune Producer Group Centers as hubs for training and counselling, showcasingproducts and even serving as alternative markets. The WDC Project has assisted in theestablishment of new enterprises, primarily by producing new products, even if still, at thisstage, on a limited scale.
The main challenges to the development of enterprise for off-farm activities in the area willdepend on ensuring sustained production of the products and crops, along with sustainedand secure markets. This will require that WDC and producer groups must develop linkagesto the broader market. At the same time, there should be an effort to reduce or break thestranglehold of middlemen/traders over the handicrafts and vegetable-produce trade. Forthis, the main issue is to start up savings programs and access to reasonable micro-credit,so as not to rely so much on the advance of capital from traders, and also to gain greateraccess to a broad range of markets. Therefore, this should be addressed in terms ofallowing producers access to capital on credit, but more so in ensuring that they can marketproduce without going through middlemen.
There are challenges brought about by the conditions of the resource base, as well.Foremost is the decreasing fertility of paddy land due to the lack of rotational cropping andpoor soil health that is impacting productivity. There are initiatives for organic farming, butfarmers – by convenience and for larger volumes of crop yield – continue the practice ofusing chemicals. There is still a relative abundance of raw materials for handicraftproduction, but access is becoming more difficult as producers have to travel considerabledistances to collect resources.
There is also the issue of depletion of common property resources through increases of non-timber forest product harvesting. The latter should be addressed by supporting sustainablemanagement of forest resources, as well as by encouraging re-generation through plantingof sedge plants, pandanus, rattan, and bamboo. There is also the issue of an expandingrural population, which puts more pressure on land use as food requirements increase.People are highly vulnerable to shocks, trends, changes and seasonality. In addition, there iscultural vulnerability in terms of illiteracy and unfamiliarity with commercial practices.

Poverty & Social Impact Assessment (PSIA) 46
Currently, there are opportunities in place for sustaining off-farm enterprise. There is now anetwork of producer groups, which have undergone significant skills acquisition training andbetter social practices training with the WDC and which are as a result more capable ofproducing quality handicrafts and healthier food products. The institutional capacity forsupport services for off-farm enterprise has been strengthened in the WDC. High demand forhandicraft and food products remains, and prices have risen substantially. There are also asubstantial number of external support agencies, donors, NGOs, commercial banks andinvestors that come to the area to respond to various issues; both for social services (health,sanitation, non-formal education, etc.) and for livelihood development services. There areregulatory measures being put in place (Provincial Development Plans, Community ForestrySystem). There is a growing domestic tourism and a foreign tourism market. There is alsoactive networking with traders in the area.
9.0 DETAILED RECOMMENDATIONS
There was a systematic process in the setting up of the WDC Project. It started by ensuringthat there is strong institutional support from MOWA and that the basis for enterprisedevelopment begins by ensuring efforts are compatible with the reality of the on-the-groundsituation, in terms of existing community resources, including social capital. It has proceededefficiently to the next step of establishing a local hub for services to target entrepreneurs,improving women producer’s skills and eventually initiating production on a limited marketingscale. As the producer groups become more functional and better able to churn outproducts, the challenge is more of how to bring in a more comprehensive value-chainstrategy. This requires an understanding of business development and management, both atthe institutional level (MOWA and business development services providers) and at theproducer level.
A major consideration for recommendations is that the WDC Project ended 13 March 2010.There is still no next phase Project Plan prepared by the MoWA and there is still no concreteappropriation for the operations of the WDC and the Commune Producer Centers in thecurrent National Budget. It is therefore crucial that MoWA attend to planning its next phase ifthis project is to be continued. It is also imperative that MoWA seek out possible sources offunds at least sufficient to maintain operations, a process that may require short-termbridging proposals while a major strategic plan to sustain operations is prepared.
As the next step the WDC management should consider the following:
· Extending the institutional support network for business development services bycalling for the cooperation of other agencies or service providers in the project area.There is a presence in the project area of micro-finance institutions that can assist inbreaking/reducing the hold of middlemen over the provision of capital needed forenterprises. There are NGOs doing agro-technology, which can also help inpromoting more sustainable farming and others that can assist in sustainablemanagement of common property resources.

Poverty & Social Impact Assessment (PSIA) 47
· Trading is a vital lifeline to local enterprises. There should be efforts to integrate localtraders into the process with efforts at minimizing trade practices that perpetuatepoverty. There may also be a need to enhance the producer group network’s tradingcapacity by: studying the market, linking to the market and pooling capital to dealdirectly with the market.
· Enabling producer groups to build themselves into self-help groups by encouragingcommon savings or individual savings. Accessing micro-credit is a good idea butshould be pragmatic in terms of discipline and repayment of loans.
· WDCs should consider learning from the successes of some NGOs working in thefield of handicrafts, such as the Artisan d'Angkor (fr. Sentures d’Angkor) in SiemReap Province, which is well managed and a self-sustaining social enterprise.
· The WDC and MOWA should continue product promotion using the various publicand private media services, promotional materials and product exposition trade fairs.This can be tied to national programs for tourism or as independent efforts toshowcase Khmer products in regional or international fairs.
· There is need to attract other donors and investors, including NGOs and the privatesector. There is a need to market the current JFPR-MOWA initiative as a successfulproject and to invite ongoing support, funding and technical support.
· In reference to the products, there is need to continue to innovate to develophandicraft products, but with more focus on niche markets. For example, there wasnot much effort taken to situate handicrafts in terms of woven furniture, art anddecoration. In the case of vegetable production, there is also a need to diversifycrops other than the common market-garden vegetables. This is in consideration ofimproving soil fertility and ensuring that producer groups have a niche or can carveout new directions, rather than follow what is common. Another consideration for thisis the need to consider products that are drought resistant, given the water problemin several areas (the Government-affiliated group CARDI has already tested suchcrops).
· The internet is a reliable and accessible tool to find information on products, learninnovative technology and network with traders. There is still limited knowledge byWDC staff in the use of the internet, meaning related training and facility provision onthis should be considered for future projects.
· Lastly, The WDC and the producer groups have marketable skills in terms of trainingother artisans. There are current initiatives being undertaken to develop IndigenousPeople’s products in Northeast Cambodia, funded largely through natural resourcemanagement funds. There is a demand for trainers on new products, which the WDCcan take the initiative to assist in satisfying.

Poverty & Social Impact Assessment (PSIA) 48
ANNEXES

1
Annex 1. Summary of the Household Survey
A. RESPONDENTS Table 1. Summary of Respondents
Province # Kampong Chhnnang # Siem Reap
Sedge/triangle sedge Mats 80 - Bamboo handicrafts 40 - Vegetables growing - 20 Proa Mats - 18 Rattan basket - 19 Cotton weaving & handicraft - - Pandanus leaf mats - 3 Total 120 60
B. DEMOGRAPHIC INFORMATION The sample population from the two provinces is composed mainly of young adults in the age group of 20-24 years old (Table 2). Females greatly outnumber the males in the sample for both provinces by 1.3:1 in Siem Reap and 1.4:1 in Kampong Chhnang. All in all, the population is composed of the young age group 0-24 years of age comprising 57.34% of the Kampong Chhnang sample population and 57% in Siem Reap. Table 2. Family Members of Respondents by Age Group
KCH SRP Age Female
(n=379) Male
(n=273)Total
(n=652)Female (n=178)
Male (n=136)
Total (n=314)
<5 yrs 5.28 5.13 5.21 5.06 11.03 7.64 5 - 9 yrs 6.60 13.19 9.36 11.80 8.82 10.51 10 - 14 yrs 11.87 13.92 12.73 12.36 11.03 11.78 15 - 19 yrs 9.50 6.96 8.44 6.18 8.09 7.01 20 - 24 yrs 14.25 23.08 17.94 20.79 19.12 20.06 25 - 29 yrs 7.39 5.86 6.75 8.99 13.24 10.83 30 - 34 yrs 5.80 4.40 5.21 8.43 6.62 7.64 35 - 39 yrs 5.28 4.40 4.91 4.49 3.68 4.14 40 - 44 yrs 6.86 6.23 6.60 1.69 2.21 1.91 45 - 49 yrs 5.28 4.76 5.06 6.74 6.62 6.69 50 - 54 yrs 7.92 2.93 5.83 4.49 .74 2.87 55 - 59 yrs 4.22 2.93 3.68 4.49 4.41 4.46 60 - 64 yrs 2.90 2.56 2.76 1.12 2.94 1.91 65 - 69 yrs 2.11 2.20 2.15 1.12 .74 .96 70 - 74 yrs 1.85 .73 1.38 1.12 .74 .96 75+ yrs 2.90 .73 1.99 1.12 - .64
Among the sample population of 966 people, a total of 32% were found to be married, 59% were single, 8.5% are widowed or widower, and 0.7% are separated (Table 3). Moreover, 2.3% were disabled individuals (1.4% in KCH and 4.1% in SRP).

2
Table 3. Civil Status and Disability of Family Members KCH SRP TOTAL
Civil Status (Total n=966) N=652 N=314 Married 32.36 31.53 32.09 Single 57.06 62.10 58.70 Separated/ divorced .92 .32 .72 Widowed 9.66 6.05 8.49
Disability (Total n=966) N=652 N=314 Normal 98.62 95.86 97.72 disabled 1.38 4.14 2.28
In terms of occupation farming and fishing were said to be the primary sources of income in both KCH and SRP (Table 4). Almost 39% in KCH and 48% in SRP (5% involved in vegetable farming) are involved in these activities. Due to the young population of the study sites, 29% in KCH and 23% in SRP are still in school while those that are too young to work and contribute to family income make up around 10% of the total. Handicraft production is also found in both provinces where rattan basket making is the primary source of income (1.2% in KCH and 2.5% in SRP). Proa mats are made by 1.7% of the people in SRP, sedge mats (triangle sedge mats) are made by 3.4% in KCH, and bamboo handicrafts are made by 4% also in KCH. To help support the family, 43% in KCH and 49% in SRP have secondary sources of income. The secondary sources are mainly in farming vegetables followed by handicraft production, construction work, and a few engage in migrant work. Table 4. Occupation of Family Members
KCH SRP
Female Male Total Femal
e Male Total
Main Occupation (Total n=966) N=379 N=273 N=652 N=178 N=136 N=314Farmer-Fisherman 37.47 37.
73 37.58 43.26 44.12 43.63
pupil/student 25.86 34.07 29.29 23.03 23.53 23.25 too young/ old age 10.82 10.99 10.89 12.92 16.91 14.65 Vegetable growing person - - - 5.06 4.41 4.78 Unemployed 3.17 1.83 2.61 4.49 2.94 3.82 Rattan basket producer 1.32 1.10 1.23 3.93 .74 2.55 Self employed 1.85 1.47 1.69 2.81 1.47 2.23 Migrant worker 7.92 2.20 5.52 2.81 .74 1.91 government staff 1.58 4.40 2.76 - 2.94 1.27 Proa mat producer - - - 1.69 - .96 construction worker .26 1.83 .92 - 2.21 .96 Sedge Mat/triangle sedge mat producer 4.75 1.47 3.37 - - -
Bamboo handicraft producer 4.75 2.93 3.99 - - - Company staff .26 - .15 - - -
Second Occupation (Total n=434) N=186 N=93 N=279 N=101 N=54 N=155Vegetable growing person 1.61 5.3
8 2.87 28.71 38.89 32.26
Farmer-Fisherman 16.67 18.28 17.20 19.80 20.37 20.00 Rattan basket producer 2.15 1.08 1.79 20.79 9.26 16.77 Proa mat producer - - - 19.80 5.56 14.84

3
Self employed 3.23 10.75 5.73 3.96 9.26 5.81 construction worker - 13.98 4.66 .99 11.11 4.52 Pandanus leaf mat producer - - - 4.95 1.85 3.87 Migrant worker .54 2.15 1.08 - 1.85 .65 Sedge Mat/triangle sedge mat producer 61.29 32.26 51.61 - - -
Bamboo handicraft producer 13.98 12.90 13.62 - - - government staff .54 2.15 1.08 - - - other - 1.08 .36 .99 1.85 1.29
The households are headed by 47% females and 53% males whereas the SRP sample households have almost the same number of male and female household heads (Table 5). The average household size for the female headed families is five (5) while the male headed is 5.7 members. Female household heads are older than the males (48:44 years old). As stated earlier farming and fishing are the main occupations of the population and this is also true for both male and female household heads. Handicraft production is engaged in by 30.7% of the household heads (combining all types of handicraft), government work is engaged in by 13%, and self-employed is 5.6%. A few (1.2%) are migrant workers, while 2.35% were unemployed at the time of the study. Worth noting is the education of the household heads where close to a third of the female household heads and 18% of the males had no formal education. Generally, both male and female household heads did attend primary levels of schooling but the number decreases as the level of education increases. Only about 8% of both male and female heads had the opportunity to get to high school levels of education. Table 5. Characteristics of Household Heads by Gender
KCH SRP Total Female Male Female Male Female Male
Age of household heads (n=180)
Mean age of household head 49.39 44.38 45.61 43.34 48.01 44.06
Main occupation (Total n=180) N=54 N=66 N=31 N=29 N=85 N=95
Farmer-Fisherman 62.96 74.24 70.97 75.86 65.88 74.74 government staff 5.56 12.12 - 3.45 3.53 9.47 Bamboo handicraft producer 16.67 6.06 - - 10.59 4.21
Vegetable growing person - - 3.23 10.34 1.18 3.16
Rattan basket producer 1.85 3.03 3.23 3.45 2.35 3.16 Sedge Mat/triangle sedge mat producer 11.11 3.03 - - 7.06 2.11
Self employed 1.85 1.52 6.45 3.45 3.53 2.11 construction worker - - - 3.45 - 1.05 Unemployed - - 6.45 - 2.35 - Migrant worker - - 3.23 - 1.18 - Proa mat producer - - 3.23 - 1.18 - Too old - - 3.23 - 1.18 -
Education level (Total n=180) N=54 N=66 N=31 N=29 N=85 N=95
None 18.52 3.03 54.84 51.72 31.76 17.89

4
Primary School 57.41 45.45 35.48 31.03 49.41 41.05 Secondary School 7.41 36.36 3.23 6.90 5.88 27.37 High School 14.81 7.58 3.23 - 10.59 5.26 Other - - - 3.45 - 1.05 DK 1.85 7.58 3.23 6.90 2.35 7.37
Household size (Total n=180) N=54 N=66 N=31 N=29 N=85 N=95
Mean 4.94 5.83 5.06 5.41 4.99 5.71 Single 1.85 - - - 1.18 - 2-4 members 42.59 19.70 38.71 37.93 41.18 25.26 5-7 members 44.44 60.61 51.61 44.83 47.06 55.79 8+ members 11.11 19.70 9.68 17.24 10.59 18.95
C. HOUSEHOLD STATUS Regarding the ownership of homes almost all except 0.83% of the respondents stated that they own their homes or live with their parents. Homes are generally in average and livable condition (71%) while 18% are said to be in good shape. A few (12%) were found to be in poor or dilapidated condition. Roofs are mainly constructed of tiles (44%), corrugated iron (38%), and thatch or palm leaves (19%). The walls are generally made of bamboo or saplings (64%), wood (33%) and the rest are made of cement or bricks. The average area of household structures is 21 to 50 m2 (37%), followed by houses that are less than 21 m2. Table 6. Q1-Q5, Details of Housing Structures
KCH SRP TOTAL The property of household N=120 N=60 N=180
Not own house but don’t pay rent .83 - .56 Own house or live with parents 99.17 100.00 99.44
General condition of the house (Total n=180) N=120 N=60 In good condition and safe 19.17 15.00 17.78 In average condition, livable 71.67 68.33 70.56 In dilapidated condition 9.17 16.67 11.67
Main construction material of the house’s roof N=120 N=60 Tiles, fibrous cement, or concrete 45.83 35.00 42.22 Corrugated iron 40.00 35.00 38.33 Thatch, palm leaves, plastic sheet, tarpaulin or other soft 14.17 30.00 19.44
Main construction material of the house’s exterior walls. N=120 N=60 N=180
Cement, bricks, concrete 5.00 - 3.33 Wood, sawn boards, plywood, corrugated iron 24.17 50.00 32.78 Saplings, bamboo, thatch, palm leaves, or other soft mater 70.83 50.00 63.89
Floor area N=120 N=60 N=180 51 meters or more 22.50 38.33 27.7821-50 meters 39.17 33.33 37.2220 meters square or less 38.33 28.33 35.00
A list of the sources of income for all sample households was established during the survey. Growing rice or other crops is the primary source with two thirds of the households engaged in this livelihood activity (Table 7). An average area of 110 ar is used by each household in this activity.

5
Table 7. Q6 Source of House Income
KCH SRP TOTAL Main household income source N=120 N=60 N=180
Growing rice or other crops or orchard 62.50 71.67 65.56 Micro business, skilled labourer or civil servant 21.67 13.13 18.89
Small or medium-size business 15.83 10.0 13.89 Work as labourer - 5.0 1.67
Households that grow rice, other crops or an orchard as the main source of income N=75 N=43 N=180
Mean (Min-Max) 110.27(2-600)
109.79 (4-450)
110.09(2-600)
Over 50 ar 62.67 62.79 62.71 from 20 to 50 ar 29.33 27.91 28.81 From 0 to 20 ar 8.00 9.30 8.47
An important asset of households is livestock which can be sold during times of hardship and food shortage. In Table 8 it is shown that almost nine (9) out of 10 households raise cows while 7% have buffaloes. Swine or pigs can also be seen in about a fourth of the households. Very few households engage in aquaculture, 1% in KCH and none in SRP. Regarding the number of animals the household owns, it was found that an average of three cows, four buffaloes, and three pigs are raised by those who have these assets. Table 8. Q7. Livestock and Fish Culture
KCH SRP TOTAL Livestock N=95 N=47 N=142
% Pigs 18.95 34.04 23.94 % Cows 90.53 87.23 89.44 % Buffaloes 7.37 6.38 7.04 % raise fish for sale 1.05 - .70 Mean Pigs (Min-Max) 3.22(1-10) 2.38(1-14) 2.82(1-14) Mean Cows (Min-Max) 3.48(1-15) 2.39(1-5) 3.13(1-15) Mean Buffaloes (Min-Max) 4.14(1-6) 3.00(2-4) 3.80(1-6)
Food shortage is generally attributed to lack of rice to eat in Cambodia. In the study areas 40% (Table 9) of the respondents complained of experiencing food shortage generally for three (3) to seven (7) months each year (53%). There is a high dependency ratio of 37% and more than a quarter of the population does not have the ability to contribute to family financial needs (Table 10). Table 9. Q8. Rice Shortages
KCH SRP TOTAL Rice food shortages N=120 N=60 N=180
% household experiences food shortage (> 0 months) 38.33 43.33 40.00
Number of month for food shortage experience (Total n=72) N=46 N=26
Mean number of months experiences (Min-Max) 3.61(1.00-12.00)
4.85(1.00-12.00)
4.06(1.00-12.00)
8-12 months 36.96 38.46 37.50

6
3-7 months 60.87 38.46 52.78 >0-2 months 2.17 23.08 9.72
Table 10. Q9. Dependency Ratio
KCH SRP TOTAL Dependency ratio (Number of not active over number of HH) N=120 N=60 N=180
Mean of dependency ratio (Min-Max) 36.32(0-83.33) 39.64(0-80) 37.43(0-83.33)%Less than one quarter of all household member 40.00 25.00 35.00
%Less than a half but more than one quarter of all household members 32.50 50.00 38.33
%Half or more that half of all household member 27.50 25.00 26.67
Regarding household assets, about 48% of the households own color TV, tape recorder, or mobile phones. About 18% have big radios or a black and white television. Almost 18% do not own anything but a small radio. For assets in transportation owning a bicycle is very common in both provinces (94.7%). This is followed by horse or oxen drawn carts (46%) and motorcycles (29%). Table 11. Q10-Q11. Household Assets
KCH SRP TOTAL Household asset N=120 N=60 N=180
Mean mobile telephone (Min-Max) 1.17(1-3) 1.10(1-2) 1.15(1-3) Mean small radio (Min-Max) 1.02(1-2) 1.00(1-1) 1.02(1-2) Mean stereo (Min-Max) 1.00(1-1) 1.00(1-1) 1.00(1-1) Mean colour TV (Min-Max) 1.00(1-1) 1.00(1-1) 1.00(1-1) Mean video camera (Min-Max) 1.00(1-1) 1.00(1-1) 1.00(1-1) Mean large radio (Min-Max) 1.00(1-1) 1.00(1-1) 1.00(1-1) Mean B&W TV (Min-Max) 1.00(1-1) 1.00(1-1) 1.00(1-1) Mean video player/ karaoke machine (Min-Max) 1.00(1-1) 1.00(1-1) 1.00(1-1)
%Color TV or/and Tape recorder or/and mobile phone 53.33 38.33 48.33
%Large radio or black and white TV 20.83 11.67 17.78 %Nothing or small radio 25.00 50.00 33.33 %Video Camera .83 - .56
Means of transportation N=115 N=56 N=171 % bicycle 96.52 91.07 94.74 % horse/oxen cart 55.65 26.79 46.20 % motorbike 30.43 26.79 29.24 % small boat or canoe (no motor)? 16.52 - 11.11 % motorboat 8.70 - 5.85 % kou yon 6.09 - 4.09 % motorbike remorque 2.61 1.79 2.34 % car/van/ truck 2.61 - 1.75 % tractor - - - Mean bicycle (Min-Max) 1.42(1-4) 1.37(1-4) 1.41(1-4) Mean horse/oxen cart (Min-Max) 1.02(1-2) 1.00(1-1) 1.01(1-2) Mean kou yon (Min-Max) 1.00(1-1) - 1.00(1-1)
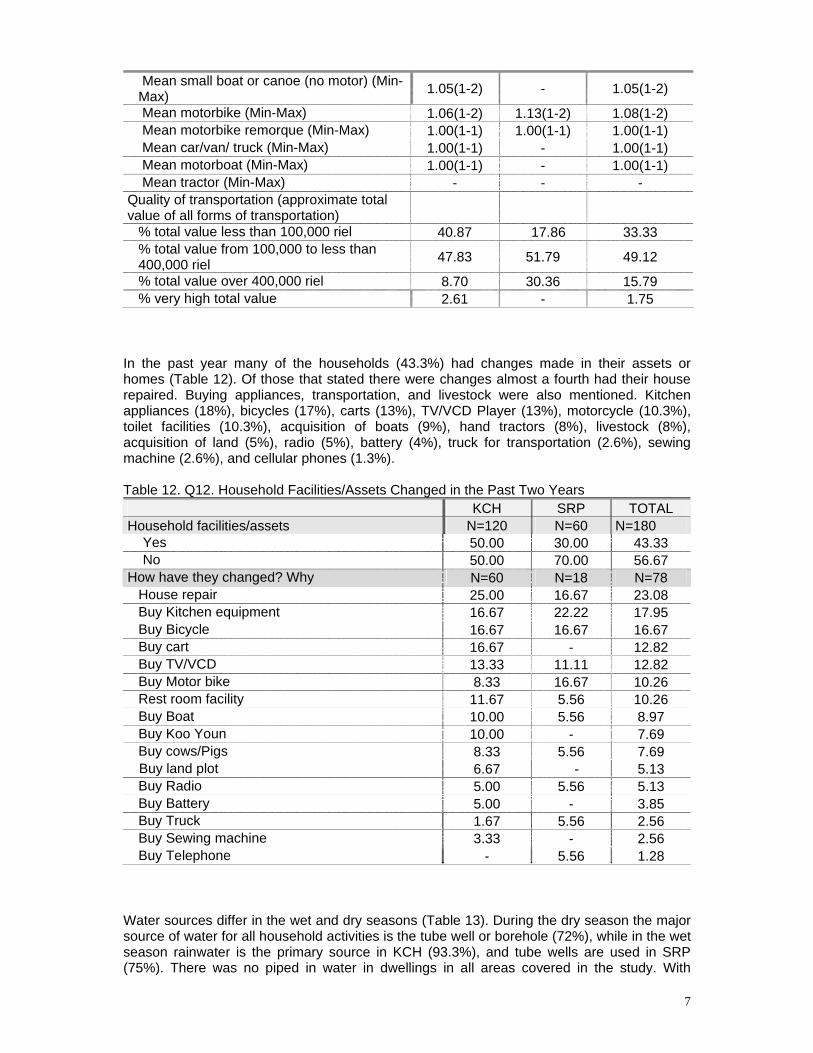
7
Mean small boat or canoe (no motor) (Min-Max) 1.05(1-2) - 1.05(1-2)
Mean motorbike (Min-Max) 1.06(1-2) 1.13(1-2) 1.08(1-2) Mean motorbike remorque (Min-Max) 1.00(1-1) 1.00(1-1) 1.00(1-1) Mean car/van/ truck (Min-Max) 1.00(1-1) - 1.00(1-1) Mean motorboat (Min-Max) 1.00(1-1) - 1.00(1-1) Mean tractor (Min-Max) - - -
Quality of transportation (approximate total value of all forms of transportation)
% total value less than 100,000 riel 40.87 17.86 33.33 % total value from 100,000 to less than 400,000 riel 47.83 51.79 49.12
% total value over 400,000 riel 8.70 30.36 15.79 % very high total value 2.61 - 1.75
In the past year many of the households (43.3%) had changes made in their assets or homes (Table 12). Of those that stated there were changes almost a fourth had their house repaired. Buying appliances, transportation, and livestock were also mentioned. Kitchen appliances (18%), bicycles (17%), carts (13%), TV/VCD Player (13%), motorcycle (10.3%), toilet facilities (10.3%), acquisition of boats (9%), hand tractors (8%), livestock (8%), acquisition of land (5%), radio (5%), battery (4%), truck for transportation (2.6%), sewing machine (2.6%), and cellular phones (1.3%). Table 12. Q12. Household Facilities/Assets Changed in the Past Two Years
KCH SRP TOTAL Household facilities/assets N=120 N=60 N=180 Yes 50.00 30.00 43.33 No 50.00 70.00 56.67 How have they changed? Why N=60 N=18 N=78
House repair 25.00 16.67 23.08 Buy Kitchen equipment 16.67 22.22 17.95 Buy Bicycle 16.67 16.67 16.67 Buy cart 16.67 - 12.82 Buy TV/VCD 13.33 11.11 12.82 Buy Motor bike 8.33 16.67 10.26 Rest room facility 11.67 5.56 10.26 Buy Boat 10.00 5.56 8.97 Buy Koo Youn 10.00 - 7.69 Buy cows/Pigs 8.33 5.56 7.69
Buy land plot 6.67 - 5.13 Buy Radio 5.00 5.56 5.13 Buy Battery 5.00 - 3.85 Buy Truck 1.67 5.56 2.56 Buy Sewing machine 3.33 - 2.56 Buy Telephone - 5.56 1.28
Water sources differ in the wet and dry seasons (Table 13). During the dry season the major source of water for all household activities is the tube well or borehole (72%), while in the wet season rainwater is the primary source in KCH (93.3%), and tube wells are used in SRP (75%). There was no piped in water in dwellings in all areas covered in the study. With

8
regards to sanitation, more than a third of the households suggested that they have toilet facilities while the majority still uses the fields and forests. Those that have toilets have pour-flush water sealed units (73%), dry pits (24%), and soak away types (4.8%). Table 13. Q13. Water and Sanitation
KCH SRP TOTAL Source of water in dry season all activities N=120 N=60 N=180
Tubed/piped well or borehole 70.83 73.33 71.67 Protected dug well 14.17 16.67 15.00 Pond, river or stream 15.83 5.00 12.22 Unprotected dug well 9.17 8.33 8.89 Rainwater 7.50 - 5.00 Tanker truck, vendor or otherwise bought 7.50 - 5.00 Public tap .83 - .56 Other .83 - .56
Source of water in wet season all activities N=120 N=60 N=180 Rainwater 93.33 10.00 65.56 Tubed/piped well or borehole 51.67 75.00 59.44 Protected dug well 8.33 16.67 11.11 Pond, river or stream 14.17 3.33 10.56 Unprotected dug well 9.17 6.67 8.33 Tanker truck, vendor or otherwise bought 2.50 - 1.67 Public tap .83 - .56
Type of toilet does this household have N=120 N=60 N=180 Household did not have any (go forest, field etc) 60.00 75.00 65.00 Household have any type of toilet 40.00 25.00 35.00
Type of toilet N=48 N=15 N=73 dry pit 25.00 20.00 23.81 pour-flush water-sealed 70.83 80.00 73.02 soak away 6.25 - 4.76
D. HANDICRAFT ACTIVITIES- VALUE CHAIN Focusing on the livelihood activities in Kampong Chhnang, the making of bamboo handicrafts appear to take a lot of the peoples' time (10.7 months) in terms of the number of months of production per year. Bamboo handicraft making also involves about a third of the adult females, 30% of the adult males, 42% of the female children, and 40% of the male children. Sedge/triangle mat products are made for an average of 4.5 months a year involving all the members of the family whether male or female and young or old. As farming is the main source of food and livelihood for the households almost all family members are involved in this activity. However, this only takes place about four (4) months a year because only one crop season per year is allowed by the water supply in the areas. Vegetable growing involves only a few households and most of the work is done by the male and female children for only about three (3) months each year. In Siem Reap rattan baskets are produced for about seven (7) months a year based on the study. Male and female adults are the main contributors to this livelihood activity. It is the same with proa mat making, but they only make this material for about six (6) months per year. Vegetable growing is much more common in SRP than in KCH. About a third of the adults are involved in this for an average of five (5) months a year. Farming engages almost all families but as there is no irrigation or water sources. This work only takes place an average of 4.7 months during the rainy season.
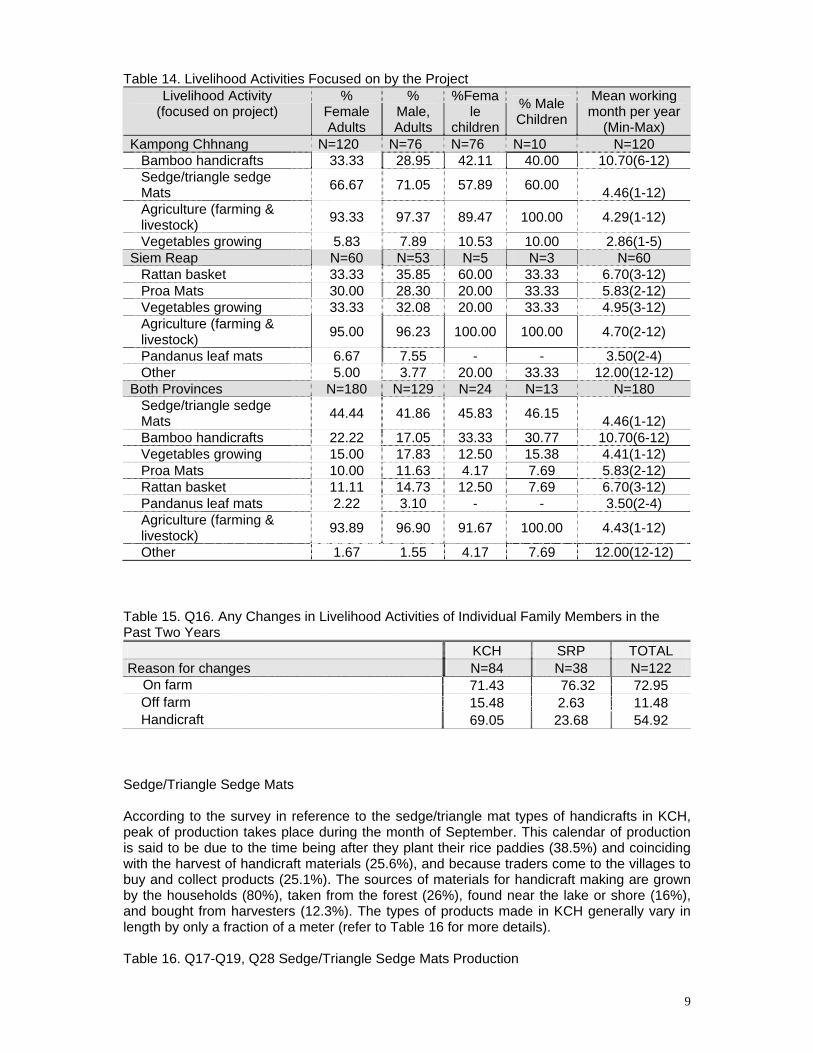
9
Table 14. Livelihood Activities Focused on by the Project Livelihood Activity
(focused on project) %
Female Adults
% Male, Adults
%Female
children
% Male Children
Mean working month per year
(Min-Max) Kampong Chhnang N=120 N=76 N=76 N=10 N=120
Bamboo handicrafts 33.33 28.95 42.11 40.00 10.70(6-12) Sedge/triangle sedge Mats 66.67 71.05 57.89 60.00 4.46(1-12) Agriculture (farming & livestock) 93.33 97.37 89.47 100.00 4.29(1-12)
Vegetables growing 5.83 7.89 10.53 10.00 2.86(1-5) Siem Reap N=60 N=53 N=5 N=3 N=60
Rattan basket 33.33 35.85 60.00 33.33 6.70(3-12) Proa Mats 30.00 28.30 20.00 33.33 5.83(2-12) Vegetables growing 33.33 32.08 20.00 33.33 4.95(3-12) Agriculture (farming & livestock) 95.00 96.23 100.00 100.00 4.70(2-12)
Pandanus leaf mats 6.67 7.55 - - 3.50(2-4) Other 5.00 3.77 20.00 33.33 12.00(12-12)
Both Provinces N=180 N=129 N=24 N=13 N=180 Sedge/triangle sedge Mats 44.44 41.86 45.83 46.15 4.46(1-12) Bamboo handicrafts 22.22 17.05 33.33 30.77 10.70(6-12) Vegetables growing 15.00 17.83 12.50 15.38 4.41(1-12) Proa Mats 10.00 11.63 4.17 7.69 5.83(2-12) Rattan basket 11.11 14.73 12.50 7.69 6.70(3-12) Pandanus leaf mats 2.22 3.10 - - 3.50(2-4) Agriculture (farming & livestock) 93.89 96.90 91.67 100.00 4.43(1-12)
Other 1.67 1.55 4.17 7.69 12.00(12-12) Table 15. Q16. Any Changes in Livelihood Activities of Individual Family Members in the Past Two Years
KCH SRP TOTAL Reason for changes N=84 N=38 N=122 On farm 71.43 76.32 72.95
Off farm 15.48 2.63 11.48 Handicraft 69.05 23.68 54.92
Sedge/Triangle Sedge Mats According to the survey in reference to the sedge/triangle mat types of handicrafts in KCH, peak of production takes place during the month of September. This calendar of production is said to be due to the time being after they plant their rice paddies (38.5%) and coinciding with the harvest of handicraft materials (25.6%), and because traders come to the villages to buy and collect products (25.1%). The sources of materials for handicraft making are grown by the households (80%), taken from the forest (26%), found near the lake or shore (16%), and bought from harvesters (12.3%). The types of products made in KCH generally vary in length by only a fraction of a meter (refer to Table 16 for more details). Table 16. Q17-Q19, Q28 Sedge/Triangle Sedge Mats Production

10
KCH SRP TOTAL Months handicraft production N=80 N=0 N=80
January 28.75 - 28.75 February 32.50 - 32.50 March 36.25 - 36.25 April 41.25 - 41.25 May 35.00 - 35.00 June 33.75 - 33.75 July 42.50 - 42.50 August 47.50 - 47.50 September 60.00 - 60.00 October 51.25 - 51.25 November 32.50 - 32.50 December 25.00 - 25.00
There have been any changes N=39 N=0 N=39 To do after farming 38.46 - 38.46 Base on sedge/triangle sedge collection 25.64 - 25.64 Have trader 23.08 - 23.08
High price 5.13 - 5.13 Have labor 2.56 - 2.56 Have more trader 2.56 - 2.56 Not have trader 2.56 - 2.56 illness 2.56 - 2.56
Type of Product N=80 N=80 Sedge mat -width:1.5m 25.00 - 25.00
sedge mat-width:1.4m 46.25 - 46.25 Sedge mat-width:1.3m 78.75 - 78.75 Sedge mat -width:1.2m 82.50 - 82.50 Sedge mat-width:1.1m 73.75 - 73.75 Sedge mat-width:1m 65.00 - 65.00 Sedge mat-width:0.9m 53.75 - 53.75 Sedge mat-width:0.8m 20.00 - 20.00 Sedge mat-width:0.7m 3.75 - 3.75 Sedge mat connect one to one 10.00 - 10.00 Sedge mat bad quality-width:1.1m 5.00 - 5.00 Sedge mat bad quality-width:1.2m 3.75 - 3.75 Sedge mat bad quality-width:1.3m 1.25 - 1.25 Triangle sedge mat-width:1m 1.25 - 1.25 Triangle sedge mat-width:1.1m 12.50 - 12.50 Triangle sedge mat-width:1.2m 16.25 - 16.25 Triangle sedge mat-width:1.3m 16.25 - 16.25 Triangle sedge mat-width:1.4m 2.50 - 2.50
Source of raw materials extracting/collecting from N=80 N=0 N=80
Grown by family/farming 80.00 - 80.00 Forest (common use) 26.25 - 26.25 Lake 16.25 - 16.25 Bought from other suppliers 12.50 - 12.50
The volume of products made for each type of handicraft has a minimum of one (1) piece to a maximum of 220 depending also on the length of the product (Table 17). However, it would

11
seem that not all handicraft products are sold. For the most produced handicrafts (1.1 and 1.2 m sedge mats) 19 and 13 respectively is the mean volume in pieces produced, and 18 and 12 pieces respectively were disposed of in the past year. In terms of prices the value of handicrafts also depends on the length or size. An average of US$5.21 and US$6.30 for sedge mats of 1.1 m and 1.2 m in length. The highest priced handicraft is Sedge mat (connect one to one) valued at US$20.58. It was found that the median net earnings of the producers in the past year was US$73.17. The local community (49.6%) is the primary market for the handicraft products while a third of the producers have buyers within the district. Some also access the provincial markets (39.7%) while about 20% sell their products in other provinces. The Women’s Center also helps the producers by buying a few of their handicrafts. Based on the survey about two thirds of the respondents suggested an increase in their income from handicraft production. Some 20% reported that their income decreased while 12.5% stated there were no changes. Table 17. Q19-Q22,Q26 Annual volume of Sedge/Triangle Sedge Mats Production
KCH SRP TOTAL Type of handicraft production N=80 N=80 Mean Produce Volume (Min-Max) Sedge mat -width:1.5m 3.20(1-20) - 3.20(1-20)
sedge mat-width:1.4m 4.35(1-15) - 4.35(1-15) Sedge mat-width:1.3m 7.22(1-50) - 7.22(1-50) Sedge mat -width:1.2m 13.05(2-200) - 13.05(2-200) Sedge mat-width:1.1m 18.71(2-220) - 18.71(2-220) Sedge mat-width:1m 9.02(1-30) - 9.02(1-30) Sedge mat-width:0.9m 7.95(1-40) - 7.95(1-40) Sedge mat-width:0.8m 11.25(2-40) - 11.25(2-40) Sedge mat-width:0.7m 8.67(8-10) - 8.67(8-10) Sedge mat connect one to one 4.75(1-12) - 4.75(1-12) Sedge mat bad quality-width:1.1m 107.50(50-200) - 107.50(50-200) Sedge mat bad quality-width:1.2m 22.33(7-50) - 22.33(7-50) Sedge mat bad quality-width:1.3m 20.00(20-20) - 20.00(20-20) Triangle sedge mat-width:1m 4.00(4 – 4) - 4.00(4 – 4) Triangle sedge mat-width:1.1m 82.50(5-480) - 82.50(5-480) Triangle sedge mat-width:1.2m 33.00(5-100) - 33.00(5-100) Triangle sedge mat-width:1.3m 28.31(5-83) - 28.31(5-83) Triangle sedge mat-width:1.4m 20.00(20-20) - 20.00(20-20)
Sum Produce Volume (Median) Sedge mat -width:1.5m 64(2.50) - 64(2.50)
sedge mat-width:1.4m 161(3.00) - 161(3.00) Sedge mat-width:1.3m 455(5.00) - 455(5.00) Sedge mat -width:1.2m 861(8.5) - 861(8.5) Sedge mat-width:1.1m 1104(10.00) - 1104(10.00) Sedge mat-width:1m 469(10.00) - 469(10.00) Sedge mat-width:0.9m 342(6.00) - 342(6.00) Sedge mat-width:0.8m 180(6.50) - 180(6.50) Sedge mat-width:0.7m 26(8.00) - 26(8.00) Sedge mat connect one to one 38(3.00) - 38(3.00) Sedge mat bad quality-width:1.1m 430(90.00) - 430(90.00) Sedge mat bad quality-width:1.2m 67(10.00) - 67(10.00) Sedge mat bad quality-width:1.3m 20(20.00) - 20(20.00) Triangle sedge mat-width:1m 4(4.00) - 4(4.00) Triangle sedge mat-width:1.1m 825(40.00) - 825(40.00) Triangle sedge mat-width:1.2m 429(24.00) - 429(24.00)

12
Triangle sedge mat-width:1.3m 368(20.00) - 368(20.00) Triangle sedge mat-width:1.4m 40(20.00) - 40(20.00)
Type of handicraft sold N=80 N=80 Mean Sold Volume (Min-Max) Sedge mat -width:1.5m 2.75(0-6) - 2.75(0-6)
sedge mat-width:1.4m 3.43(0-10) - 3.43(0-10) Sedge mat-width:1.3m 6.49(0-50) - 6.49(0-50) Sedge mat -width:1.2m 11.64(0-200) - 11.64(0-200) Sedge mat-width:1.1m 17.76(0-220) - 17.76(0-220) Sedge mat-width:1m 7.87(0-30) - 7.87(0-30) Sedge mat-width:0.9m 6.67(0-40) - 6.67(0-40) Sedge mat-width:0.8m 10.81(0-40) - 10.81(0-40) Sedge mat-width:0.7m 7.67(7-8) - 7.67(7-8) Sedge mat connect one to one 4.25(1-9) - 4.25(1-9) Sedge mat bad quality-width:1.1m 97.50(10-200) - 97.50(10-200) Sedge mat bad quality-width:1.2m 22.33(7-50) - 22.33(7-50) Sedge mat bad quality-width:1.3m 20.00(20-20) - 20.00(20-20) Triangle sedge mat-width:1m 4.00(4 - 4) - 4.00(4 - 4) Triangle sedge mat-width:1.1m 79.50(0-480) - 79.50(0-480) Triangle sedge mat-width:1.2m 31.77(5-100) - 31.77(5-100) Triangle sedge mat-width:1.3m 25.00(5-73) - 25.00(5-73) Triangle sedge mat-width:1.4m 20.00(20-20) - 20.00(20-20)
Sum Sold Volume (Median) Sedge mat -width:1.5m 55(2.00) - 55(2.00)
sedge mat-width:1.4m 127(3.00) - 127(3.00) Sedge mat-width:1.3m 409(4.00) - 409(4.00) Sedge mat -width:1.2m 768(7.00) - 768(7.00) Sedge mat-width:1.1m 1048(9.00) - 1048(9.00) Sedge mat-width:1m 409(8.00) - 409(8.00) Sedge mat-width:0.9m 287(5.00) - 287(5.00) Sedge mat-width:0.8m 173(6.50) - 173(6.50) Sedge mat-width:0.7m 23(8.00) - 23(8.00) Sedge mat connect one to one 34(3.00) - 34(3.00) Sedge mat bad quality-width:1.1m 390(90.00) - 390(90.00) Sedge mat bad quality-width:1.2m 67(10.00) - 67(10.00) Sedge mat bad quality-width:1.3m 20(20.00) - 20(20.00) Triangle sedge mat-width:1m 4(4.00) - 4(4.00) Triangle sedge mat-width:1.1m 795(40.00) - 795(40.00) Triangle sedge mat-width:1.2m 413(24.00) - 413(24.00) Triangle sedge mat-width:1.3m 325(20.00) - 325(20.00) Triangle sedge mat-width:1.4m 40(20.00) - 40(20.00)
Type of handicraft price per unit N=80 N=80 Mean Price per unit (Min-Max) (USD) Sedge mat -width:1.5m 11.77(8.54-15.85) - 11.77(8.54-15.85)
sedge mat-width:1.4m 9.97(3.66-14.63) - 9.97(3.66-14.63) Sedge mat-width:1.3m 8.21(2.44-12.20) - 8.21(2.44-12.20) Sedge mat -width:1.2m 6.30(1.46-9.76) - 6.30(1.46-9.76) Sedge mat-width:1.1m 5.21(1.22-8.54) - 5.21(1.22-8.54) Sedge mat-width:1m 4.15(1.46-12.20) - 4.15(1.46-12.20) Sedge mat-width:0.9m 3.59(1.95-12.20) - 3.59(1.95-12.20) Sedge mat-width:0.8m 3.57(1.95-9.76) - 3.57(1.95-9.76) Sedge mat-width:0.7m 1.46(0.98-2.44) - 1.46(0.98-2.44)

13
Sedge mat connect one to one 20.58(14.63-36.59) - 20.58(14.63-36.59)Sedge mat bad quality-width:1.1m 0.61(0.37-0.85) - 0.61(0.37-0.85) Sedge mat bad quality-width:1.2m 1.14(0.98-1.22) - 1.14(0.98-1.22) Sedge mat bad quality-width:1.3m 1.71(1.71-1.71) - 1.71(1.71-1.71) Triangle sedge mat-width:1m 0.73(0.73-0.73) - 0.73(0.73-0.73) Triangle sedge mat-width:1.1m 1.31(0.61-3.66) - 1.31(0.61-3.66) Triangle sedge mat-width:1.2m 1.67(0.98-2.93) - 1.67(0.98-2.93) Triangle sedge mat-width:1.3m 2.02(0.68-3.66) - 2.02(0.68-3.66) Triangle sedge mat-width:1.4m 2.68(2.44-2.93) - 2.68(2.44-2.93)
Net income from your product for this year 2009 (USD) N=80 N=80
Mean net income (Min-Max) 92.01(12.20-292.68) - 92.01(12.20-
292.68) Median net income 73.17 - 73.17
Market of handicraft (Total n=78) Local community 43.59 - 43.59 Within province 39.74 - 39.74 Within district 32.05 - 32.05 Other province in the country 20.51 - 20.51 Sold to Women Center 2.56 - 2.56 Export to abroad - - -
Reason any changes in the number of mats produced annually (Total n=66) N=66 N=66
Have more sedge 33.33 - 33.33 Less sedge(flooding) 22.73 - 22.73
Have trader 15.15 - 15.15 Have members in family helping 7.58 - 7.58 Busy to take care member in family 6.06 - 6.06 Old age 6.06 - 6.06 To do farm 4.55 - 4.55 Have group 1.52 - 1.52 high price 1.52 - 1.52 No trader 1.52 - 1.52
Table 18. Q39 Annual Income from Sedge/Triangle Sedge Mats production
KCH SRP TOTAL Change in your income from your product from the previous years’ 2008 N=40 N=40
Increase 67.50 - 67.50 No change 12.50 - 12.50 Decrease 20.00 - 20.00
In relation to the marketing of the producers the survey asked whether they use traders to sell their handicrafts. Apparently more than four (4) out of five (5) households employ the services of these traders (Table 19). Private individuals from the same community (69.2%) generally act as mediators for selling the handicrafts. Some (13.8%) were from other communities while others (10.8%) were from different provinces. The Women’s Center also provides the same services as the traders, but only a few (4.6%) utilize them for selling their handicrafts.

14
Table 19. Q23-Q25 Access to Traders of Sedge/Triangle Sedge Mats Production KCH SRP TOTAL
Using traders or collectors to sell your products (Total n=80) N=80 N=80
Yes 81.25 - 81.25 No 18.75 - 18.75
List the traders(Total n=65) Private sector within community 69.23 - 69.23
Private sector other community within provinces 13.85 - 13.85 Private sector other province within country 10.77 - 10.77 Women center 4.62 - 4.62 Not remember 4.62 - 4.62
Bamboo Handicrafts Based on the study in reference to bamboo handicrafts in KCH, peak production takes place during the early months of the year (January and February). Bamboo is generally bought from harvesters and suppliers (97.5%) though some respondents (22.5%) suggested that they grow their own. The types of bamboo products made in KCH are siek/pkleak baskets (47.5%), kraloar (47.5%), krancheng (40%), rice baskets (27.5%), ordinary kraloar (17.5%), plates and trays (10%), flat baskets (7.5%), tissue box (2.5%), and angrot (2.5%). Table 20. Q29-Q31, Q40 Bamboo Handicrafts Production
KCH SRP TOTAL Months handicraft production N=40 N=40
January 100.00 - 100.00 February 100.00 - 100.00 March 97.50 - 97.50 April 95.00 - 95.00 May 82.50 - 82.50 June 77.50 - 77.50 July 77.50 - 77.50 August 75.00 - 75.00 September 92.50 - 92.50 October 90.00 - 90.00 November 92.50 - 92.50 December 87.50 - 87.50
There have been any changes N=40 N=40 Busy to make farm rice 5.00 - 5.00
More expense time to do this work(handicraft) 2.50 - 2.50 illness 5.00 - 5.00 No change 87.50 - 87.50
Type of product N=40 N=40 Siek Basket/Pkleak Basket 47.50 - 47.50 Kraloar 47.50 - 47.50 Kanchreng fish 40.00 - 40.00
Rice Basket 27.50 - 27.50 Kraloar bad quality 17.50 - 17.50 Glass/plate tray 10.00 - 10.00 Hand fan 10.00 - 10.00 Flat basket 7.50 - 7.50 Tissue Box 2.50 - 2.50

15
Angrot 2.50 - 2.50 Source of raw materials extracting/collecting from N=40 N=40
Forest (common use - - - Re-grow by family/farming 22.50 - 22.50 Bought from other suppliers 97.50 - 97.50 Other - - -
In terms of the volume of products made kanchreng is the most produced followed by flat baskets. Siek/pkleak baskets and ordinary kraloar are also common bamboo products. Based on the responses in the survey all of the bamboo products are sold and their primary market is the local market (50%) and other provinces (47.5%). The Women’s Center also plays a major role (32.5%) in the bamboo products value chain. Regarding the prices of bamboo products the range is from US$0.15 to US$2.20. Angrot is the highest valued bamboo product made in KCH. All producers use traders to market their bamboo products. In 2009 the income from bamboo products was said to have increased by50%. Thirty percent stated that there was no change, while 20% complained that their income decreased. Table 21. Q32-Q34 , Q38 Annual Volume of Bamboo Handicraft Production
KCH SRP TOTAL
Type of handicraft production N=40 N=40 Mean Produce Volume (Min-Max)
Rice Basket 159.09(100-300) - 159.09(100-300)
Siek Basket/Pkleak Basket 350.37(8-1260) - 350.37(8-1260)
Kraloar 34.53(1-150) - 34.53(1-150) Tissue Box 1.00(1-1) - 1.00(1-1) Glass/plate tray 11.25(1-20) - 11.25(1-20) Hand fan 81.25(1-300) - 81.25(1-300)
Flat basket 633.33(300-
1000) - 633.33(300-1000)
Angrot 15.00(15-15) - 15.00(15-15)
Kraloar bad quality 221.43(50-500) - 221.43(50-500)
Kanchreng fish 842.50(30-3800) - 842.50(30-3800)
Sum Produce Volume (Median) Rice Basket 1750(15.00) - 1750(15.00)
Siek Basket/Pkleak Basket 6657(300.00) - 6657(300.00) Kraloar 656(10.00) - 656(10.00) Tissue Box 1(1.00) - 1(1.00) Glass/plate tray 45(12.00) - 45(12.00) Hand fan 325(12.00) - 325(12.00) Flat basket 1900(600.00) - 1900(600.00) Angrot 15(15.00) - 15(15.00) Kraloar bad quality 1550(200.00) - 1550(200.00) Kanchreng fish 13480(600.00) - 13480(600.00)
Type of handicraft sold N=40 N=40 Mean Sold Volume (Min-Max)
Rice Basket 159.09(100-300) - 159.09(100-300)

16
Siek Basket/Pkleak Basket 374.58(8-1260) - 374.58(8-1260)
Kraloar 34.53(1-150) - 34.53(1-150) Tissue Box 1.00(1-1) - 1.00(1-1) Glass/plate tray 11.25(1-20) - 11.25(1-20) Hand fan 80.50(1-300) - 80.50(1-300)
Flat basket 633.33(300-
1000) - 633.33(300-1000)
Angrot 15.00(15-15) - 15.00(15-15)
Kraloar bad quality 221.43(50-500) - 221.43(50-500)
Kanchreng fish 842.50(30-3800) - 842.50(30-3800)
Sum Sold Volume (Median) Rice Basket 1750(150.00) - 1750(150.00)
Siek Basket/Pkleak Basket 7117(300.00) - 7117(300.00) Kraloar 656(10.00) - 656(10.00) Tissue Box 1(1.00) - 1(1.00) Glass/plate tray 45(12.00) - 45(12.00) Hand fan 322(10.50) - 322(10.50) Flat basket 1900(600.00) - 1900(600.00) Angrot 15(15.00) - 15(15.00) Kraloar bad quality 1550(200.00) - 1550(200.00) Kanchreng fish 13480(600.00) - 13480(600.00)
Type of handicraft price per unit N=40 N=40 Mean Price per unit (Min-Max) (USD)
Rice Basket 0.50(0.41-0.61) - 0.50(0.41-0.61)
Siek Basket/Pkleak Basket 0.59(0.24-0.98) - 0.59(0.24-0.98)
Kraloar 0.73(0.37-0.98) - 0.73(0.37-0.98)
Tissue Box 0.73(0.73-0.73) - 0.73(0.73-0.73)
Glass/plate tray 0.61(0.49-0.73) - 0.61(0.49-0.73)
Hand fan 0.73(0.73-0.73) - 0.73(0.73-0.73)
Flat basket 0.21(0.20-0.24) - 0.21(0.20-0.24)
Angrot 2.20(2.20-2.20) - 2.20(2.20-2.20)
Kraloar bad quality 0.20(0.17-0.14) - 0.20(0.17-0.14)
Kanchreng fish 0.15(0.10-0.22) - 0.15(0.10-0.22)
Net income from your product for this year 2009 N=40 N=40
Mean net income (Min-Max) 53.46(7.32-121.95) - 53.46(7.32-
121.95) Median net income 48.78 - 48.78
Market of handicraft (Total n=40) Local Community 50.00 - 50.00 Other provinces in country 47.50 - 47.50

17
Women Center 32.50 - 32.50 Within district 27.50 - 27.50 Within province 2.50 - 2.50 Export to abroad 2.50 - 2.50
Table 22. Q35-Q37 Access to Traders of Bamboo Handicraft Production
KCH SRP TOTAL Using traders or collectors to sell your products N=40 N=40
Yes 100.00 - 100.00 No 0.00 - 0.00
List the traders(total n=40) Private sector within community 50.00 - 50.00
Private sector other province within country 30.00 - 30.00 Women center 22.50 - 22.50 Not remember 15.00 - 15.00 Private sector other community within provinces 12.50 - 12.50 Export to abroad - - -
Table 23. Q39 Annual Income from Bamboo Handicraft Production
KCH SRP TOTAL Change in your income from your product from the previous years’ 2008 N=40 N=40
Increase 50.00 - 50.00 No change 30.00 - 30.00 Decrease 20.00 - 20.00
Vegetables Growing According to the survey vegetable growing takes place during the months of December, January, and February, the peak months when more households plant their vegetables (Table 24). According to the survey KCH sample households do not plant vegetables in the months of November and December while SRP sample households plant the whole year round. Head cabbage (90%) is the most common vegetable planted in SRP followed by khatna (55%) and cheung tea cabbage (37%). For the households in KCH cheung tea cabbage and cucumber (57%) are the most commonly planted vegetables followed by chongkeus cabbage and wax gourd (43%). Table 24. Q41-Q43 Vegetables Growing Production
KCH SRP TOTAL Months Vegetables growing N=7 N=20 N=27
January 14.29 85.00 66.67 February 57.14 70.00 66.67 March 42.86 55.00 51.85 April 42.86 30.00 33.33 May 42.86 25.00 29.63 June 28.57 30.00 29.63 July 28.57 15.00 18.52 August 28.57 15.00 18.52 September 28.57 20.00 22.22

18
October 14.29 35.00 29.63 November - 45.00 33.33 December - 70.00 51.85
Type of Vegetables growing N=7 N=20 N=27 Head Cabbage - 90.00 66.67
Khatna - 55.00 40.74 Cheung Tea cabbage 57.14 30.00 37.04 Cucumber 57.14 15.00 25.93 Chongkeus cabbage 42.86 10.00 18.52 Water convolvulus 28.57 15.00 18.52 Wax gourd 42.86 - 11.11 Eggplant - 10.00 7.41 Big cucumber - 10.00 7.41 Kronhanh Cabbage 28.57 - 7.41 Nonong 28.57 - 7.41 Pumpkin 28.57 - 7.41 Tamato - 5.00 3.70 Kheav Cabbage 14.29 - 3.70 Chili 14.29 - 3.70
The volume of vegetables harvested depends on the type planted. In general, households harvest 10 kilograms to 2,000 kilograms of vegetables each year. The highest volume of vegetable harvested is head cabbage (1,028 kilograms) probably because most households in SRP plant this type of vegetable. Chili is also a high volume crop followed by eggplant and cucumber. As shown in Table 25 a small portion of the volume of vegetables harvested was not sold probably because it was consumed by the household. Chili is the most expensive type of vegetable sold by the farmers (US$1.22) followed by khatna (US$0.57). Vegetable producers usually earn a median yearly net income of US$195.12. Farmers generally sold their produce in the local community (84.6%) but some have access to district buyers (23.1%). Almost 20% sell their vegetables in other provinces and a few (11.5%) sell within KCH and SRP. Table 25. Q43-Q46 ,Q50 Annual Volume of Vegetable Growing
KCH SRP TOTAL Type of Vegetables growing N=6 N=20 N=26 Mean Produce Volume (Min-Max)
Head Cabbage - 1027.78(200-
2000) 1027.78(200-
200) Cheung Tea cabbage 220.00(10-600) 466.67(100-1000) 384.4410-100) Chongkeus cabbage 200.00(50-500) 60.00(20-100) 144.00(20-500)
Cucumber 925.00(150-
1500) 333.33(50-850) 671.43(50-1500)Water convolvulus 10.00(10-10) 316.67(50-600) 240.00(10-600) Tamato - 20.00(20-20) 20.00(20-20)
Eggplant - 900.00(800-1000)900.00(800-
1000)
Khatna - 595.45(150-1100)595.45(150-
1100) Big cucumber - 40.00(30-50) 40.00(30-50) Kronhanh Cabbage 75.00(50-100) - 75.00(50-100) Nonong 102.50(5-200) - 102.50(5-200) Wax gourd 235.00(5-500) - 235.00(5-500)

19
Chili 1000.00(1000-
1000) - 1000.00(1000-
1000) Pumpkin 375.00(150-600) - 375.00(150-600)
Sum Produce Volume (Median) Head Cabbage - 18500(800.00) 18500(800.00)
Cheung Tea cabbage 660(50.00) 2800(500.00) 3460(500.00) Chongkeus cabbage 600(50.00) 120(60.00) 720(50.00) Cucumber 3700(100.00) 1000(850.00) 4700(850.00) Water convolvulus 10(10.00) 950(300.00) 960(175.00 Tamato - 20(20.00) 20(20.00) Eggplant - 1800(900.00) 1800(900.00) Khatna - 6550(500.00) 6550(500.00) Big cucumber - 80(40.00) 80(40.00) Kronhanh Cabbage 150(75.00) - 150(75.00) Nonong 205(102.50) - 205(102.50) Wax gourd 705(200.00) - 705(200.00) Chili 1000(1000.00) - 1000(1000.00) Pumpkin 750(375.00) - 750(375.00)
Type of Vegetables sold N=6 N=20 N=26 Mean Sold Volume (Min-Max)
Head Cabbage - 1026.11(180-2000)
1026.11(180-2000)
Cheung Tea cabbage 213.33(0-600) 450.00(100-1000) 371.11(0-1000) Chongkeus cabbage 180.00(40-450) 60.00(20-100) 132.00(20-450)
Cucumber 900.00(200-
1500) 333.33(50-850) 657.14(50-1500)Water convolvulus 5.00(5-5) 316.00(48-600) 238.25(5-600) Tamato - 20.00(20-20) 20.00(20-20)
Eggplant - 900.00(800-1000)900.00(800-
1000)
Khatna - 594.54(150-1100)594.54(150-
1100) Big cucumber - 38.50(30-47) 38.50(30-47) Kronhanh Cabbage 70.00(40-100) - 70.00(40-100) Nonong 100.00(0-200) - 100.00(0-200) Wax gourd 234.00(2-500) - 234.00(2-500)
Chili 1000.00(1000-
1000) - 1000.00(1000-
1000) Pumpkin 365.00(130-600) - 365.00(130-600)
Sum Sold Volume (Median) Head Cabbage 640(320.00) 18470(800.00) 18470(800.00)
Cheung Tea cabbage 540(50.00) 2700(450.00) 3340(450.00) Chongkeus cabbage 3600(950.00) 120(60.00) 660(50.00) Cucumber 5(5.00) 1000(100.00) 4600(850.00) Water convolvulus - 948(300.00) 953(174.00) Tamato - 20(20.00) 20(20.00) Eggplant - 1800(900.00) 1800(900.00) Khatna - 6540(500.00) 6540(500.00) Big cucumber 140(70.00) 77(38.50) 77(38.50)
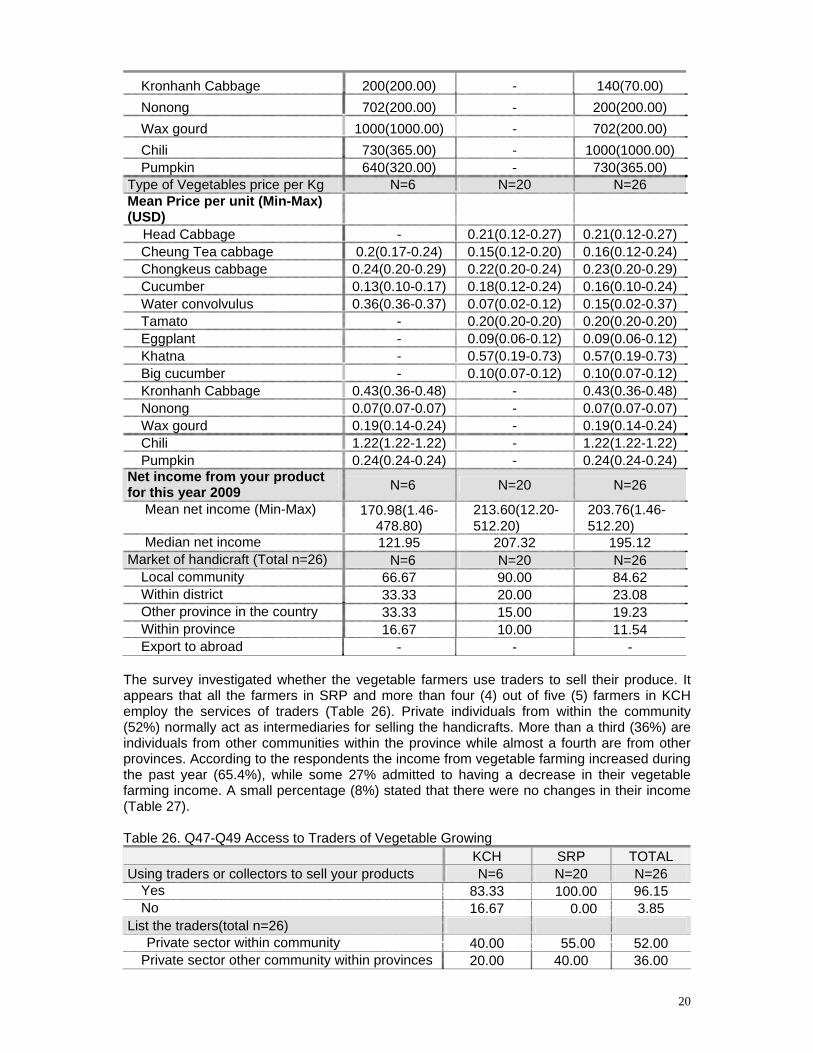
20
Kronhanh Cabbage 200(200.00) - 140(70.00) Nonong 702(200.00) - 200(200.00) Wax gourd 1000(1000.00) - 702(200.00) Chili 730(365.00) - 1000(1000.00) Pumpkin 640(320.00) - 730(365.00)
Type of Vegetables price per Kg N=6 N=20 N=26 Mean Price per unit (Min-Max) (USD)
Head Cabbage - 0.21(0.12-0.27) 0.21(0.12-0.27) Cheung Tea cabbage 0.2(0.17-0.24) 0.15(0.12-0.20) 0.16(0.12-0.24) Chongkeus cabbage 0.24(0.20-0.29) 0.22(0.20-0.24) 0.23(0.20-0.29) Cucumber 0.13(0.10-0.17) 0.18(0.12-0.24) 0.16(0.10-0.24) Water convolvulus 0.36(0.36-0.37) 0.07(0.02-0.12) 0.15(0.02-0.37) Tamato - 0.20(0.20-0.20) 0.20(0.20-0.20) Eggplant - 0.09(0.06-0.12) 0.09(0.06-0.12) Khatna - 0.57(0.19-0.73) 0.57(0.19-0.73) Big cucumber - 0.10(0.07-0.12) 0.10(0.07-0.12) Kronhanh Cabbage 0.43(0.36-0.48) - 0.43(0.36-0.48) Nonong 0.07(0.07-0.07) - 0.07(0.07-0.07) Wax gourd 0.19(0.14-0.24) - 0.19(0.14-0.24) Chili 1.22(1.22-1.22) - 1.22(1.22-1.22) Pumpkin 0.24(0.24-0.24) - 0.24(0.24-0.24)
Net income from your product for this year 2009 N=6 N=20 N=26
Mean net income (Min-Max) 170.98(1.46-478.80)
213.60(12.20-512.20)
203.76(1.46-512.20)
Median net income 121.95 207.32 195.12 Market of handicraft (Total n=26) N=6 N=20 N=26
Local community 66.67 90.00 84.62 Within district 33.33 20.00 23.08 Other province in the country 33.33 15.00 19.23 Within province 16.67 10.00 11.54 Export to abroad - - -
The survey investigated whether the vegetable farmers use traders to sell their produce. It appears that all the farmers in SRP and more than four (4) out of five (5) farmers in KCH employ the services of traders (Table 26). Private individuals from within the community (52%) normally act as intermediaries for selling the handicrafts. More than a third (36%) are individuals from other communities within the province while almost a fourth are from other provinces. According to the respondents the income from vegetable farming increased during the past year (65.4%), while some 27% admitted to having a decrease in their vegetable farming income. A small percentage (8%) stated that there were no changes in their income (Table 27). Table 26. Q47-Q49 Access to Traders of Vegetable Growing
KCH SRP TOTAL Using traders or collectors to sell your products N=6 N=20 N=26
Yes 83.33 100.00 96.15 No 16.67 0.00 3.85
List the traders(total n=26) Private sector within community 40.00 55.00 52.00
Private sector other community within provinces 20.00 40.00 36.00
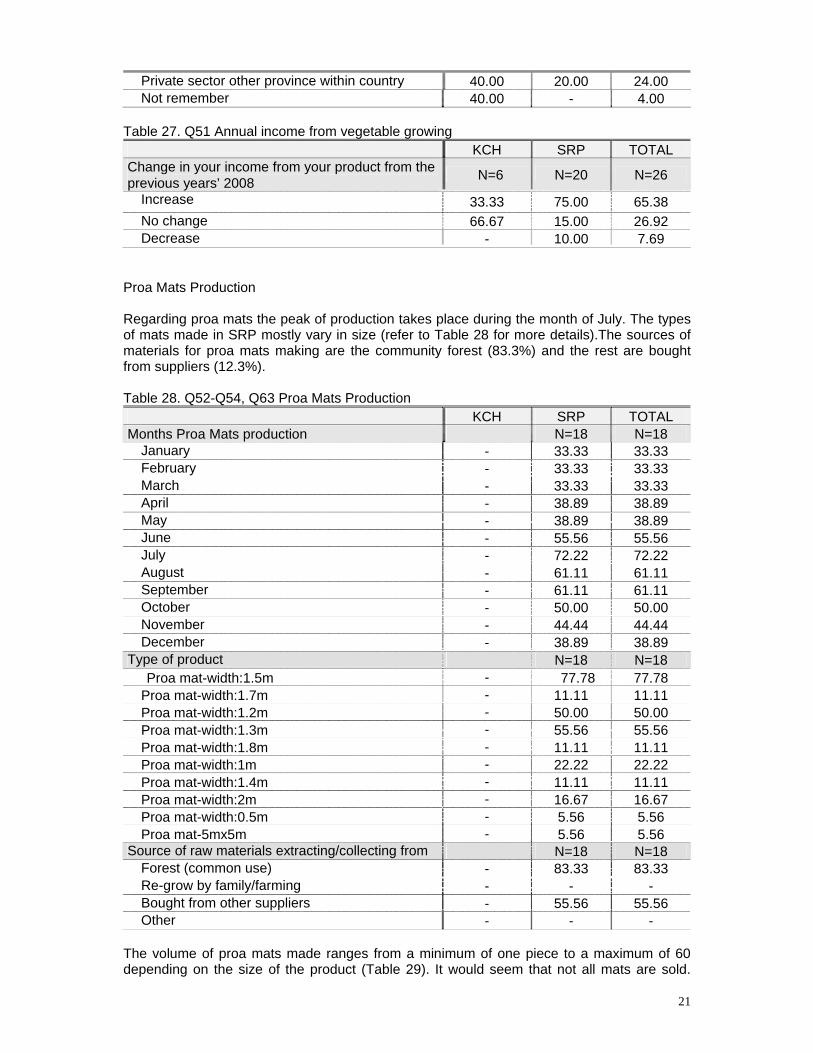
21
Private sector other province within country 40.00 20.00 24.00 Not remember 40.00 - 4.00
Table 27. Q51 Annual income from vegetable growing
KCH SRP TOTAL Change in your income from your product from the previous years’ 2008 N=6 N=20 N=26
Increase 33.33 75.00 65.38 No change 66.67 15.00 26.92 Decrease - 10.00 7.69
Proa Mats Production Regarding proa mats the peak of production takes place during the month of July. The types of mats made in SRP mostly vary in size (refer to Table 28 for more details).The sources of materials for proa mats making are the community forest (83.3%) and the rest are bought from suppliers (12.3%). Table 28. Q52-Q54, Q63 Proa Mats Production
KCH SRP TOTAL Months Proa Mats production N=18 N=18
January - 33.33 33.33 February - 33.33 33.33 March - 33.33 33.33 April - 38.89 38.89 May - 38.89 38.89 June - 55.56 55.56 July - 72.22 72.22 August - 61.11 61.11 September - 61.11 61.11 October - 50.00 50.00 November - 44.44 44.44 December - 38.89 38.89
Type of product N=18 N=18 Proa mat-width:1.5m - 77.78 77.78
Proa mat-width:1.7m - 11.11 11.11 Proa mat-width:1.2m - 50.00 50.00 Proa mat-width:1.3m - 55.56 55.56 Proa mat-width:1.8m - 11.11 11.11 Proa mat-width:1m - 22.22 22.22 Proa mat-width:1.4m - 11.11 11.11 Proa mat-width:2m - 16.67 16.67 Proa mat-width:0.5m - 5.56 5.56 Proa mat-5mx5m - 5.56 5.56
Source of raw materials extracting/collecting from N=18 N=18 Forest (common use) - 83.33 83.33 Re-grow by family/farming - - - Bought from other suppliers - 55.56 55.56 Other - - -
The volume of proa mats made ranges from a minimum of one piece to a maximum of 60 depending on the size of the product (Table 29). It would seem that not all mats are sold.

22
Only the 1.4 m mats had a 100% selling rate. In terms of prices the value of each mat also depends on the size. Valued at US$1.22 to US$29.27 the median net earnings of the proa mats producers in the past year was US$48.78. The local community (88.2%) is the primary market for the handicraft products while the rest are sold within the district and the province. Table 29. Q54-Q57, Q61 Annual Volume Proa Mats Production
KCH SRP TOTAL Type of Proa Mats production N=18 N=18 Mean Produce Volume (Min-Max) Proa mat-width:1.5m - 17.00(2-50) 17.00(2-50)
Proa mat-width:1.7m - 12.50(5-20) 12.50(5-20) Proa mat-width:1.2m - 15.33(1-40) 15.33(1-40) Proa mat-width:1.3m - 13.20(1-40) 13.20(1-40) Proa mat-width:1.8m - 13.00(10-16) 13.00(10-16) Proa mat-width:1m - 24.50(3-60) 24.50(3-60) Proa mat-width:1.4m - 30.00(30-30) 30.00(30-30) Proa mat-width:2m - 13.33(10-20) 13.33(10-20) Proa mat-width:0.5m - 50.00(50-50) 50.00(50-50) Proa mat-5mx5m - 2.00(2-2) 2.00(2-2)
Sum Produce Volume (Min-Max) Proa mat-width:1.5m - 238(10.00) 238(10.00)
Proa mat-width:1.7m - 25(12.50) 25(12.50) Proa mat-width:1.2m - 138(7.00) 138(7.00) Proa mat-width:1.3m - 132(5.00) 132(5.00) Proa mat-width:1.8m - 26(13.00) 26(13.00) Proa mat-width:1m - 98(17.50) 98(17.50) Proa mat-width:1.4m - 60(30.00) 60(30.00) Proa mat-width:2m - 40(10.00) 40(10.00) Proa mat-width:0.5m - 50(50.00) 50(50.00) Proa mat-5mx5m - 2(2.00) 2(2.00)
Type of Proa Mats production for sold N=18 N=18 Mean Sold Volume (Min-Max) Proa mat-width:1.5m - 229(7.00) 229(7.00)
Proa mat-width:1.7m - 14(7.00) 14(7.00) Proa mat-width:1.2m - 124(7.00) 124(7.00) Proa mat-width:1.3m - 124(3.00) 124(3.00) Proa mat-width:1.8m - 25(12.50) 25(12.50) Proa mat-width:1m - 97(17.00) 97(17.00) Proa mat-width:1.4m - 60(30.00) 60(30.00) Proa mat-width:2m - 35(10.00) 35(10.00) Proa mat-width:0.5m - 50(50.00) 50(50.00) Proa mat-5mx5m - 2(2.00) 2(2.00)
Sum Sold Volume (Min-Max) Proa mat-width:1.5m - 16.36(2-50) 16.36(2-50)
Proa mat-width:1.7m - 7.00(4-10) 7.00(4-10) Proa mat-width:1.2m - 13.78(1-40) 13.78(1-40) Proa mat-width:1.3m - 13.78(1-40) 13.78(1-40) Proa mat-width:1.8m - 12.50(10-15) 12.50(10-15) Proa mat-width:1m - 24.25(3-60) 24.25(3-60) Proa mat-width:1.4m - 30.00(30-30) 30.00(30-30) Proa mat-width:2m - 11.67(5-20) 11.67(5-20) Proa mat-width:0.5m - 50.00(50-50) 50.00(50-50)
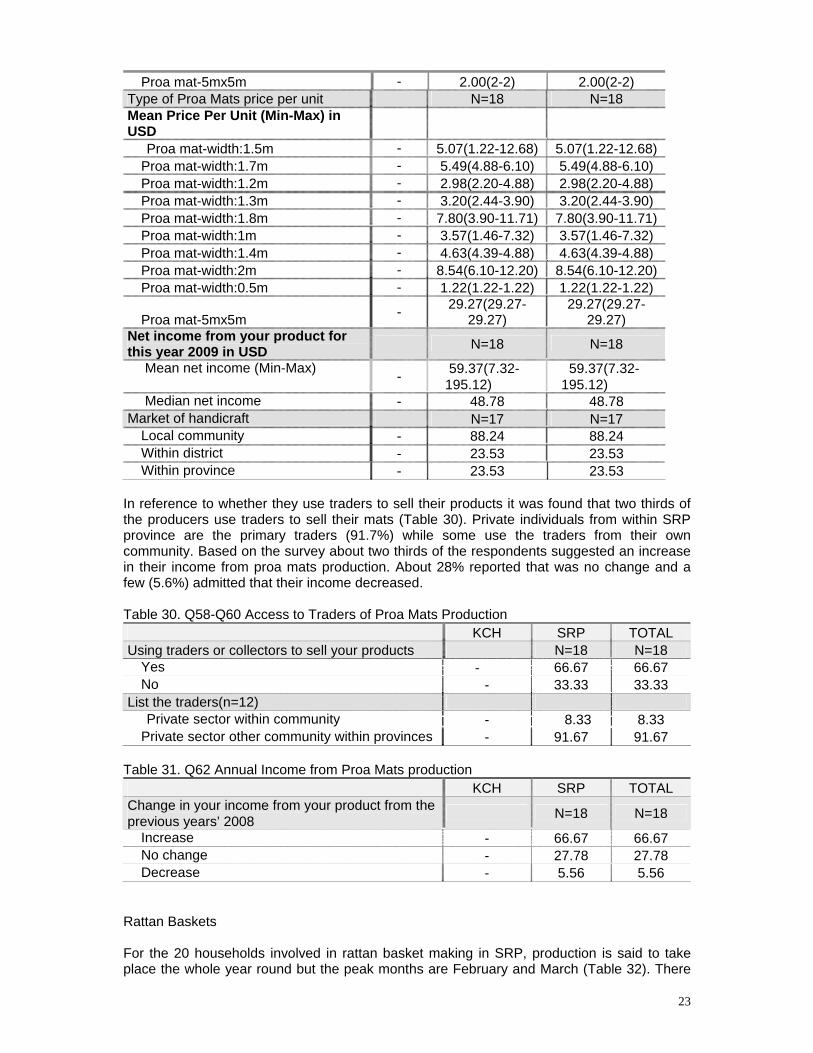
23
Proa mat-5mx5m - 2.00(2-2) 2.00(2-2) Type of Proa Mats price per unit N=18 N=18 Mean Price Per Unit (Min-Max) in USD
Proa mat-width:1.5m - 5.07(1.22-12.68) 5.07(1.22-12.68) Proa mat-width:1.7m - 5.49(4.88-6.10) 5.49(4.88-6.10) Proa mat-width:1.2m - 2.98(2.20-4.88) 2.98(2.20-4.88) Proa mat-width:1.3m - 3.20(2.44-3.90) 3.20(2.44-3.90) Proa mat-width:1.8m - 7.80(3.90-11.71) 7.80(3.90-11.71) Proa mat-width:1m - 3.57(1.46-7.32) 3.57(1.46-7.32) Proa mat-width:1.4m - 4.63(4.39-4.88) 4.63(4.39-4.88) Proa mat-width:2m - 8.54(6.10-12.20) 8.54(6.10-12.20) Proa mat-width:0.5m - 1.22(1.22-1.22) 1.22(1.22-1.22)
Proa mat-5mx5m - 29.27(29.27-29.27)
29.27(29.27-29.27)
Net income from your product for this year 2009 in USD N=18 N=18
Mean net income (Min-Max) - 59.37(7.32-195.12)
59.37(7.32-195.12)
Median net income - 48.78 48.78 Market of handicraft N=17 N=17
Local community - 88.24 88.24 Within district - 23.53 23.53 Within province - 23.53 23.53
In reference to whether they use traders to sell their products it was found that two thirds of the producers use traders to sell their mats (Table 30). Private individuals from within SRP province are the primary traders (91.7%) while some use the traders from their own community. Based on the survey about two thirds of the respondents suggested an increase in their income from proa mats production. About 28% reported that was no change and a few (5.6%) admitted that their income decreased. Table 30. Q58-Q60 Access to Traders of Proa Mats Production
KCH SRP TOTAL Using traders or collectors to sell your products N=18 N=18
Yes - 66.67 66.67 No - 33.33 33.33
List the traders(n=12) Private sector within community - 8.33 8.33
Private sector other community within provinces - 91.67 91.67 Table 31. Q62 Annual Income from Proa Mats production
KCH SRP TOTAL Change in your income from your product from the previous years’ 2008 N=18 N=18
Increase - 66.67 66.67 No change - 27.78 27.78 Decrease - 5.56 5.56
Rattan Baskets For the 20 households involved in rattan basket making in SRP, production is said to take place the whole year round but the peak months are February and March (Table 32). There

24
are three types of rattan handicrafts; flower baskets, kheng baskets, and carry baskets. Each type comes in different sizes: big, medium and small. The rattan is harvested from the community forest (100%) and some are also bought from suppliers (40%). Table 32. Q64-Q66, Q75 Rattan Baskets
KCH SRP TOTAL Months Rattan baskets production N=20 N=20
January - 95.00 95.00 February - 100.00 100.00 March - 100.00 100.00 April - 85.00 85.00 May - 50.00 50.00 June - 35.00 35.00 July - 25.00 25.00 August - 25.00 25.00 September - 35.00 35.00 October - 45.00 45.00 November - 40.00 40.00 December - 50.00 50.00
Type of product N=20 N=20 Flower basket-big - 10.00 10.00
Flower basket-medium - 40.00 40.00 Flower basket-small - 25.00 25.00 Kheng basket-small - 75.00 75.00 Kheng Basket-medium - 45.00 45.00 Kheng Basket-big - 45.00 45.00 Carry Basket-small - 15.00 15.00 Carry Basket-Medium - 5.00 5.00 Carry Basket-Big - 5.00 5.00
Source of raw materials extracting/collecting from N=20 N=20 Forest (common use - 100.00 100.00 Re-grow by family/farming - - - Bought from other suppliers - 40.00 40.00 Other - - -
In terms of volume the most produced rattan basket is the big flower basket (Table 33). A minimum of 10 pieces to a maximum of 400 was produced during the past year for each type and size of rattan basket. Almost all types of rattan baskets made were sold except the big flower basket. All were sold in the local community. The value of each type and size also varies depending on the size. The most expensive is the big carry basket (US$2.44) followed by the medium carry basket (US$1.95). The mean net income of the producers was US$47.93 and ranging from US$10.24 to US$109.76. Table 33. Q66-Q69, Q73 Annual Volume of Rattan Baskets Production
KCH SRP TOTAL Type of Rattan baskets production N=4 N=4 Mean Produce Volume (Min-Max)
Flower basket-big - 300.00(200-400)300.00(200-
400) Flower basket-medium - 168.75(30-400) 168.75(30-400) Flower basket-small - 106.00(20-300) 106.00(20-300) Kheng basket-small - 64.33(10-240) 64.33(10-240) Kheng Basket-medium - 55.44(9-175) 55.44(9-175)
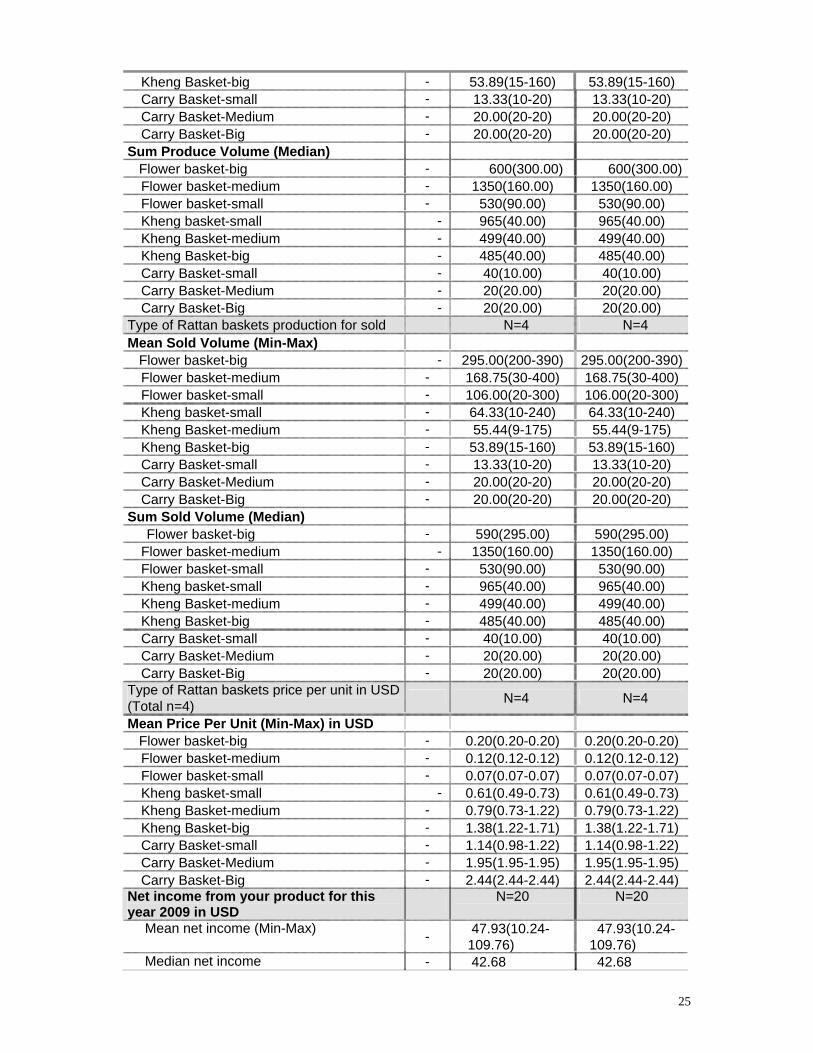
25
Kheng Basket-big - 53.89(15-160) 53.89(15-160) Carry Basket-small - 13.33(10-20) 13.33(10-20) Carry Basket-Medium - 20.00(20-20) 20.00(20-20) Carry Basket-Big - 20.00(20-20) 20.00(20-20)
Sum Produce Volume (Median) Flower basket-big - 600(300.00) 600(300.00)
Flower basket-medium - 1350(160.00) 1350(160.00) Flower basket-small - 530(90.00) 530(90.00) Kheng basket-small - 965(40.00) 965(40.00) Kheng Basket-medium - 499(40.00) 499(40.00) Kheng Basket-big - 485(40.00) 485(40.00) Carry Basket-small - 40(10.00) 40(10.00) Carry Basket-Medium - 20(20.00) 20(20.00) Carry Basket-Big - 20(20.00) 20(20.00)
Type of Rattan baskets production for sold N=4 N=4 Mean Sold Volume (Min-Max) Flower basket-big - 295.00(200-390) 295.00(200-390)
Flower basket-medium - 168.75(30-400) 168.75(30-400) Flower basket-small - 106.00(20-300) 106.00(20-300) Kheng basket-small - 64.33(10-240) 64.33(10-240) Kheng Basket-medium - 55.44(9-175) 55.44(9-175) Kheng Basket-big - 53.89(15-160) 53.89(15-160) Carry Basket-small - 13.33(10-20) 13.33(10-20) Carry Basket-Medium - 20.00(20-20) 20.00(20-20) Carry Basket-Big - 20.00(20-20) 20.00(20-20)
Sum Sold Volume (Median) Flower basket-big - 590(295.00) 590(295.00)
Flower basket-medium - 1350(160.00) 1350(160.00) Flower basket-small - 530(90.00) 530(90.00) Kheng basket-small - 965(40.00) 965(40.00) Kheng Basket-medium - 499(40.00) 499(40.00) Kheng Basket-big - 485(40.00) 485(40.00) Carry Basket-small - 40(10.00) 40(10.00) Carry Basket-Medium - 20(20.00) 20(20.00) Carry Basket-Big - 20(20.00) 20(20.00)
Type of Rattan baskets price per unit in USD (Total n=4) N=4 N=4
Mean Price Per Unit (Min-Max) in USD Flower basket-big - 0.20(0.20-0.20) 0.20(0.20-0.20)
Flower basket-medium - 0.12(0.12-0.12) 0.12(0.12-0.12) Flower basket-small - 0.07(0.07-0.07) 0.07(0.07-0.07) Kheng basket-small - 0.61(0.49-0.73) 0.61(0.49-0.73) Kheng Basket-medium - 0.79(0.73-1.22) 0.79(0.73-1.22) Kheng Basket-big - 1.38(1.22-1.71) 1.38(1.22-1.71) Carry Basket-small - 1.14(0.98-1.22) 1.14(0.98-1.22) Carry Basket-Medium - 1.95(1.95-1.95) 1.95(1.95-1.95) Carry Basket-Big - 2.44(2.44-2.44) 2.44(2.44-2.44)
Net income from your product for this year 2009 in USD N=20 N=20
Mean net income (Min-Max) - 47.93(10.24-109.76)
47.93(10.24-109.76)
Median net income - 42.68 42.68

26
Market of handicraft N=20 N=20 Local community - 100.00 100.00 Within district - 5.00 5.00 Within province - 5.00 5.00
All of the producers use traders to market their rattan baskets (Table 34). These traders usually come from their own communities (65%) while some were from other communities inside SRP. A few of the traders from other provinces also collect rattan handicrafts from the SRP producers. Table 34. Q70-Q72 Access to Traders of Rattan Baskets
KCH SRP TOTAL Using traders or collectors to sell your products N=20 N=20
Yes - 100.00 100.00 No - 0.00 0.00
List the traders Private sector within community - 65.00 65.00
Private sector other community within provinces - 25.00 25.00 Private sector other province within country - 10.00 10.00
Table 35. Q74 Annual Income from Rattan baskets
KCH SRP TOTAL Change in your income from your product from the previous years’ 2008 N=20 N=20
Increase - 70.00 70.00 No change - 15.00 15.00 Decrease - 15.00 15.00
Pandanus Leaf Mats Production Based on the study only four households in SRP are involved in pandanus leaf mats production. July is when the majority of the households engage in this livelihood activity (Table 36). Pandanus leaf mats vary in size and color and the materials are mostly (75%) bought from suppliers or if it is available, or sourced from the forest and collected by the households (25%). Table 36. Q88-Q90, Q99 Pandanus Leaf Mats Production
KCH SRP TOTAL Months Pandanus leaf mats production N=4 N=4
January - - - February - 25.00 25.00 March - - - April - - - May - 50.00 50.00 June - 50.00 50.00 July - 75.00 75.00 August - 50.00 50.00 September - 50.00 50.00 October - 50.00 50.00 November - - - December - 25.00 25.00

27
Type of product N=4 N=4 Pandanus leaf mat-0.5mx1m - 75.00 75.00
Pandanus leaf mat-1.5mx2m - 50.00 50.00 Pandanus leaf mat-1.2mx2m with mix color - 25.00 25.00 Pandanus leaf mat-1.2mx2m - 25.00 25.00 Pandanus leaf mat-1mx1.5m - 25.00 25.00
Source of raw materials extracting/collecting from N=4 N=4 Bought from other suppliers - 75.00 75.00 Forest (common use) - 25.00 25.00
The pandanus leaf mat with the dimensions of 0.5m x 1m is the most produced size of mat (Table 37). In the case of this type of material the price of each mat corresponds to the size of the product. It was found that the highest priced mat size is 1.5m x 2m. All of the mats were sold in the local community. The four households engaged in pandanus leaf mat production netted a median income of US$18.29 in the past year. As for the use of traders half of the producers employ them to market their handicrafts (Table 38). It is also noteworthy that 100% of the households suggested that their income increased from the production of pandanus leaf mats (Table 39). Table 37. Q90-Q93 , Q98 Annual Volume of Pandanus Leaf Mats Production
KCH SRP TOTAL Type of Pandanus leaf mats production N=4 N=4 Mean Produce Volume (Min-Max) Pandanus leaf mat-0.5mx1m - 43.33(10-100) 43.33(10-100)
Pandanus leaf mat-1.5mx2m - 9.50(4-15) 9.50(4-15) Pandanus leaf mat-1.2mx2m with mix color - 3.00(3-3) 3.00(3-3) Pandanus leaf mat-1.2mx2m - 3.00(3-3) 3.00(3-3) Pandanus leaf mat-1mx1.5m - 5.00(5-5) 5.00(5-5)
Sum Produce Volume (Median) Pandanus leaf mat-0.5mx1m - 130(20.00) 130(20.00)
Pandanus leaf mat-1.5mx2m - 19(9.50) 19(9.50) Pandanus leaf mat-1.2mx2m with mix color - 3(3.00) 3(3.00) Pandanus leaf mat-1.2mx2m - 3(3.00) 3(3.00) Pandanus leaf mat-1mx1.5m - 5(5.00) 5(5.00)
Type of Pandanus leaf mats production for sold N=4 N=4
Mean Sold Volume (Min-Max) Pandanus leaf mat-0.5mx1m - 43.33(10-100) 43.33(10-100)
Pandanus leaf mat-1.5mx2m - 9.00(3-15) 9.00(3-15) Pandanus leaf mat-1.2mx2m with mix color - 3.00(3-3) 3.00(3-3) Pandanus leaf mat-1.2mx2m - 3.00(3-3) 3.00(3-3) Pandanus leaf mat-1mx1.5m - 5.00(5-5) 5.00(5-5)
Sum Sold Volume (Median) Pandanus leaf mat-0.5mx1m - 130(20.00) 130(20.00)
Pandanus leaf mat-1.5mx2m - 18(9.00) 18(9.00) Pandanus leaf mat-1.2mx2m with mix color - 3(3.00) 3(3.00) Pandanus leaf mat-1.2mx2m - 3(3.00) 3(3.00) Pandanus leaf mat-1mx1.5m - 5(5.00) 5(5.00)
Type of Pandanus leaf mats production price N=4 N=4

28
per unit in USD Mean Price per Unit in USD (Min-Max) Pandanus leaf mat-0.5mx1m - 1.26(1.22-1.34) 1.26(1.22-1.34)
Pandanus leaf mat-1.5mx2m - 5.49(4.88-6.10) 5.49(4.88-6.10) Pandanus leaf mat-1.2mx2m with mix color - 3.66(3.66-3.66) 3.66(3.66-3.66) Pandanus leaf mat-1.2mx2m - 2.44(2.44-2.44) 2.44(2.44-2.44) Pandanus leaf mat-1mx1.5m - 1.22(1.22-1.22) 1.22(1.22-1.22)
Net income from your product for this year 2009 in USD N=4 N=4
Mean net income (Min-Max) - 62.50(12.20-201.22)
62.50(12.20-201.22)
Median net income - 18.29 18.29 Market of handicraft N=4 N=4
Local community - 100.00 100.00 Within district - 25.00 25.00
Table 38. Q94-Q96Access to Traders of Pandanus Leaf Mats Production
KCH SRP TOTAL Using traders or collectors to sell your products N=4 N=4
Yes - 50.00 50.00 No - 50.00 50.00
List the traders(Total=2) Private sector within community - 100.00 100.00
Table 39. Q98 Annual Income from Pandanus leaf mats production
KCH SRP TOTAL Change in your income from your product from the previous years’ 2008 N=4 N=4
Increase - 100.00 100.00 No change - - - Decrease - - -

29
E. CAPACITY BUILDING The capacity building interventions, workshops, trainings, and study tours greatly increased the abilities of the beneficiaries. Trainings on food processing, improving the quality of bamboo and sedge mat handicrafts, and pandanus leaf and rattan handicrafts provided the highest percentages of usefulness for the beneficiaries (67%-100%). It was also seen that those who received these trainings imparted their knowledge to other people as well. With regards to economics, social, and health issues those that attended the workshops for nutrition, home and work safety, post harvest processing, and gender and entrepreneurship development were also found to have been productive (Table 40). Table 40. Q100 Workshop/Training/Study Tour
KCH SRP TOTAL
%
R
ecei
ved
% U
sefu
l
% S
hare
to
othe
rs
%
Rec
eive
d
% U
sefu
l
% S
hare
to
othe
rs
%
Rec
eive
d
% U
sefu
l
% S
hare
to
othe
rs
Type of training received (Total n=)
N=120
N=60 N=180
Food Processing 75.00 88.89 77.78 60.00 83.33 77.78 70.00 87.30 77.78 Good Nutrition’ 72.50 93.10 83.91 20.00 83.33 66.67 55.00 91.92 81.82Women Worker Right 45.83 87.27 72.73 23.33 71.43 64.29 38.33 84.06 71.01 Home and Work Safety 70.83 96.47 90.59 25.00 93.33 60.00 55.56 96.00 86.00 Post-harvest Processing
56.67 97.06 91.18 26.67 100.0
0 93.75 46.67 97.62 91.67 Training on improving the quality of bamboo products 28.33 97.06 79.41 1.67
100.00
100.00 19.44 97.14 80.00
Training on improving the quality of sedge mat weaving 56.67 94.12 80.88 3.33
100.00
100.00 38.89 94.29 81.43
Training on sewing bags made from triangle sedge mats 10.00 66.67 75.00 5.00 33.33 0.00 8.33 60.00 60.00Pandanus and rattan basket producer groups 7.50 88.89 88.89 28.33 94.12 70.59 14.44 92.31 76.92Gender and entrepreneurship development 12.50 100.00
100.00 15.00 55.56 66.67 13.33 83.33 87.50
Study tour in Kg Spue vegetable growing and marketing 1.67 100.00
100.00 11.67 71.43 71.43 5.00 77.78 77.78
Sedge mat in Koh Dach and bamboo handicraft in Takeo 2.50 100.00 66.67 0.00 - - 1.67
100.00 66.67
Nothing 0.83 - - 13.33 - - 5.00 - - H. EXPENDITURES AND INCOMES Household expenditures for KCH and SRP are presented in Table 41. The figures represent the average, median, and minimum / maximum amounts in US$ spent on different activities of a family’s life. In the past year in terms of median expenditure house repairs, medical care, clothing and footwear, and attending weddings (all have the same figures) were the highest of household expenditures in KCH and SRP. As for the weekly expenses KCH and SRP both

30
had as their highest expenditure the purchasing of food (as being separate from the purchase of rice). Other expenses were education, buying of soaps and shampoos for hygiene, having dinner in restaurants, and recharging of batteries for household use. Table 41. Q101-Q102 Household Expenditures by All Members of Households in 2009 (in USD) Mean Median Min Max Kampong Chhnang Non-Food in whole year 2009 (Total n=120)
House repairs 205.47 48.78 4.88 2195.12 Medical care/health treatment 110.99 48.78 4.88 731.71 Clothing and footwear 66.47 48.78 4.88 585.37 Others’ wedding 73.27 48.78 12.20 365.85 Cooking (gas/charcoal/stove) 36.41 26.83 2.44 160.98 Ceremony 45.62 24.39 2.44 1707.32 Donations to relatives 134.86 24.39 4.88 1463.41 Visits/tourism 43.09 24.39 2.44 487.80 Phone card/telephone 41.47 24.39 0.49 429.27 Repairing equipment/tools 27.05 19.51 2.44 146.34 Water /house rental 20.88 12.20 0.49 68.29 Other recreation (hire video, karaok,…) 6.85 2.44 0.24 73.17 Other 39.02 42.68 4.88 82.93 Total 464.44 306.71 53.66 4914.63
Last week household spent on beside the above expenses (Total n=120)
Purchasing food beside rice 8.68 7.32 0.98 21.95 Education (extra courses, teachers and eating at school) 4.71 2.44 0.24 36.59 Soaps, shampoo, make-up 2.93 2.44 0.37 24.39 Eating outside home 3.25 2.44 0.24 12.20 Charging battery 1.29 0.73 0.12 9.76 Other 2.04 0.46 0.20 22.68 Total 18.54 15.61 2.44 97.56
Siem Reap Non-Food in whole year 2009 (Total n=60)
Medical care/health treatment 80.35 48.78 2.44 975.61 House repairs 132.78 48.78 12.20 878.05 Others’ wedding 69.39 48.78 7.32 292.68 Clothing and footwear 59.16 48.78 9.76 175.61 Phone card/telephone 43.77 34.15 2.44 146.34 Cooking (gas/charcoal/stove) 49.23 24.39 7.32 390.24 Visits/tourism 38.39 24.39 4.88 121.95 Donations to relatives 48.32 20.73 2.44 487.80 Ceremony 24.84 15.85 4.88 121.95 Repairing equipment/tools 25.87 12.20 2.44 121.95 Other recreation (hire video, karaok,…) 31.44 4.88 0.49 146.34 Water /house rental - - - - Other 166.34 195.12 7.32 365.85 Total 405.60 309.76 80.49 1587.80

31
Last week household spent on beside the above expenses (Total n=60)
Purchasing food beside rice 7.93 7.32 0.73 17.07 Soaps, shampoo, make-up 4.34 2.44 0.04 36.59 Education (extra courses, teachers and eating at school) 3.89 2.44 0.73 17.07 Eating outside home 3.38 2.44 0.12 12.20 Charging battery 0.86 0.54 0.15 3.66 Other 1.62 0.39 0.12 5.98 Total 14.97 13.48 1.22 43.29
In the past year the activity that contributed the most to household income was agriculture and livestock not including vegetable production (31.6%) followed closely by handicrafts (29.1%). Off-farm income not including handicrafts contributed 20.6% as the third major source of household income. Vegetables comprised 8.4%, collecting common property resources like NTFPs 4.1%, and other income added 6.2% to the annual income of the households (Table 42). Table 42. Q103 Percentage of Value Chain in Total Household Income in 2009 (in USD) KCH SRP TOTAL Source of income N=120 N=60 N=180
Vegetables 2.9 18.3 8.4 Handicraft:(Sedge/Proa-Pandanus, Cotton/Rattan/bamboo) 38.4 12.1 29.1 Other agriculture agricultural products and livestock (Exclude vegetable) 33.3 28.5 31.6 Off-Farm Income (Exclude handicraft) 15.5 29.9 20.6 Collecting Common Property Resources 4.1 4.1 4.1 Other Income 5.8 7.0 6.2
Specific to KCH income from agricultural products, off-farm income, and collection of common property income is itemized on Table 43. For agriculture and livestock the total income from selling agricultural products (paddy, maize, beans, watermelon, fruits etc), gave the 81 households a median of US$146.34 in the past year. Of the 46 families involved in poultry their median income in 2009 was US$21.95 while those involved in swine raising (23 HH) had a median income of US$146.34. Handicraft production on the other hand had higher earnings than those from agricultural products. This off-farm income earned 118 households a median of US$204.88 in the past year. Collection of NTFPs like rattan, pandanus leaves, fishing, and hunting also contributed US$22 to US$98 in the past year for those that were involved in these types of livelihood activities. Table 43. Q103 Kampong Chhnang, Total Household Income in 2009 (in USD)
n Mean Median Min Max Income from selling agricultural products and livestock
Total income from selling agricultural products (paddy, maize, beans, watermelon, fruits etc)
81 215.77 146.34 4.88 1463.41
Poultry 46 29.34 21.95 5.85 80.49 Livestock Pig 23 188.07 146.34 48.78 609.76 Cow/buffalo 16 261.59 170.73 63.41 853.66 Vegetables 6 406.10 225.61 4.88 1359.76 Fish culture 2 65.85 65.85 9.76 121.95 Other 6 93.50 67.07 24.39 243.90

32
Off-Farm Income Handicraft 118 273.92 204.88 29.27 1756.10 Migrated to other area within country 21 231.24 195.12 12.20 1073.17 Small business/petty trade 20 73.78 46.34 4.88 292.68 Migrated to Thailand boundary 3 130.08 73.17 48.78 268.29 Migrated across to Thailand 0 - - - - Other 38 165.79 121.95 2.44 853.66
Collecting Common Property Resources Collecting rattan/Pandanus leaf/Proa 17 111.48 24.39 2.44 487.80 Fishing 13 94.00 97.56 7.32 243.90 Hunting 7 51.74 21.95 4.88 243.90 Other 0 - - - -
Other Income Interest from lending money 4 85.37 73.17 48.78 146.34 Land/house rental 3 277.72 52.68 48.78 731.71 Equipment/animal rentals 3 85.37 109.76 24.39 121.95 Selling Land 2 670.73 670.73 243.90 1097.56 Remittances 1 48.78 48.78 48.78 48.78 other 7 292.68 126.83 73.17 731.71
Total All income in household 120 701.34 579.88 48.78 2725.85 As for SRP income from selling agricultural products (paddy, maize, beans, watermelon, fruits etc) earned the 31 families involved a median of US$153.66 in 2009. Poultry raising was the next most common agricultural livelihood activity and 26 households earned a median of US$24.39. Vegetable farming however earned 20 households a median of US$449.46 in the past year. The off-farm income from handicraft production for the 40 households engaged in this activity earned a median of US$78.66 per household in the past year. Collection of NTFPs like rattan, pandanus leaves, fishing, and hunting also added some US$6 to US$36 to the households involved in the past year. Table 44. Q103 Siem Reap, Total Household Income in 2009 (in USD) n Mean Median Min Max Income from selling agricultural products and livestock
Total income from selling agricultural products (paddy, maize, beans, watermelon, fruits etc)
31 238.55 153.66 19.51 975.61
Poultry 26 30.63 24.39 4.88 85.37 Vegetables 20 426.46 449.51 43.90 829.27 Livestock Pig 9 240.65 195.12 36.59 585.37 Cow/buffalo 7 416.38 195.12 97.56 1170.73 Fish culture 0 - - - - Other 0 - - - -
Off-Farm Income Handicraft 40 141.07 78.66 11.71 648.78 Small business/petty trade 17 122.38 24.39 2.44 890.24 Migrated to other area within country 4 451.22 536.59 48.78 682.93 Migrated across to Thailand 1 439.02 439.02 439.02 439.02 Migrated to Thailand boundary 1 117.07 117.07 117.07 117.07 Other 39 243.28 85.37 7.32 1487.80
Collecting Common Property Resources Fishing 10 97.56 36.59 4.88 365.85 Collecting rattan/Pandanus leaf/Proa 7 33.80 19.51 4.88 85.37

33
Hunting 4 9.76 6.10 2.44 24.39 Other 11 58.54 24.39 9.76 243.90
Other Income Selling Land 3 845.53 975.61 585.37 975.61 Interest from lending money 2 40.24 40.24 12.20 68.29 Remittances 1 24.39 24.39 24.39 24.39 Equipment/animal rentals 1 12.20 12.20 12.20 12.20 Land/house rental 1 2.44 2.44 2.44 2.44 other 4 148.17 101.22 48.78 341.46
Total All income in household 60 775.29 559.76 26.83 2348.78 During the study the respondents were asked to rate the importance of each of the livelihood activity they were involved in from 2007 and 2010. It would seem that all of the respondents gave very high importance to both on-farm and off farm income, higher than the ratings they gave during the year 2007. The change is evidently shown in Table 45. According to the respondents the change was brought about by their additional income primarily a result of handicraft production (67.8%). Income from agriculture excluding vegetable farming (31.7%) and income from vegetable farming (13.9%) were also mentioned as major contributors to change (Table 46). Table 45. Q104 Scale of Importance of Source Income (in USD)
KCH SRP TOTAL 2007 2010 2007 2010 2007 2010
Farming (Total n=) N=120 N=120 N=60 N=60 N=180 N=180 Very important 82.50 90.83 65.00 83.33 76.67 88.33 Moderately important 11.67 8.33 15.00 10.00 12.78 8.89 Not so important 5.00 .83 13.33 1.67 7.78 1.11 Not important at all or not relevant or not related
.83 - 6.67 5.00 2.78 1.67
Don’t know - - - - - - Off-Farm Income (Total n=) N=119 N=119 N=57 N=57 N=176 N=176
Very important 68.07 82.35 26.32 68.42 54.55 77.84 Moderately important 29.41 16.81 42.11 17.54 33.52 17.05 Not so important 2.52 .84 17.54 1.75 7.39 1.14 Not important at all or not relevant or not related
- - 14.04 12.28 4.55 3.98
Don’t know - - - - - - Collecting Common Property Resources (Total n=)
N=33 N=33 N=14 N=14 N=47 N=47
Very important 57.58 57.58 28.57 71.43 48.94 61.70 Moderately important 18.18 15.15 57.14 21.43 29.79 17.02 Not so important 21.21 21.21 7.14 7.14 17.02 17.02 Not important at all or not relevant or not related
3.03 6.06 7.14 - 4.26 4.26
Don’t know - - - - - - Other Income (Total n=) N=18 N=18 N=11 N=11 N=29 N=29
Very important 38.89 38.89 54.55 54.55 44.83 44.83 Moderately important 38.89 44.44 9.09 18.18 27.59 34.48 Not so important 11.11 5.56 27.27 27.27 17.24 13.79

34
Not important at all or not relevant or not related
11.11 11.11 9.09 - 10.34 6.90
Don’t know - - - - - - Table 46. Q104 Scale of Importance of Income Earned by Activity (in USD) KCH SRP TOTAL Source of income (Total n=) N=120 N=60 N=180 Income from handicraft 77.50 48.33 67.78
Income from vegetable 4.17 33.33 13.89 Income from agriculture exclude vegetable 35.00 25.00 31.67 Big household member - 1.67 .56 No idea 13.33 11.67 12.78
G. MIGRATION Migration plays a significant role in households as a source of additional income. In the last two years about a quarter of the households have members that migrated mostly to the capital Phnom Penh and to other provinces and even across the border to Thailand to find work (Table 47). An average stay in these locations was 17.8 months. In the last three months however, 46 households suggested that one or more members of the family migrated because they found work (80.4%) in other places or left to find work (23.9%) to help contribute to the family’s needs. Table 47. Q105 Migration in the Last Two Years KCH SRP TOTAL Household have experiences migration (Total n=) N=120 N=60 N=180
% HH migration 30.00 16.67 25.56 % HH never migration 70.00 83.33 74.44
Mean number of family member (Min-Max) 1.39(1-3) 1.10(1-2) 1.3391-3) Location of migration of family members (Total n=)
N=36 N=10 N=46
Within Province 8.33 30.00 13.04 Outside province 16.67 30.00 19.57 Phnom Penh 72.22 40.00 65.22 Country border 13.89 - 10.87 To Abroad 2.78 - 2.17
Mean duration in month (Min-Max) 14.97(1-84) 27.80(1-120) 17.76(1-120)
Family member look for work in last 3 months (Total n=)
N=36 N=10 N=46
% look for works 22.22 30.00 23.91 % Not look for work or have work already 83.33 70.00 80.43
H. GENDER In terms of gender suitable work for women in relation to the project was found to be light and normal chores (75.1%). It was also said that the project gave women the opportunity to contribute and increase their household’s income (28.3%) and at the same time look after their household members (20.3%). For the men the project gave them various things to do like collecting sedge (45%), constructing basket bottoms (27.2%), and helping their spouses in weaving (25.6%). Both men and women were satisfied with the project because it gave them the chance to acquire new knowledge in handicraft making like the application of a

35
variety of styles and adding colors to their products (57.2%). They were also happy that it gave them additional income (23%) and that it was easy to market the products because of the traders that helped them (10%). Regarding the strengths of the project the beneficiaries mentioned that knowledge was the most important to them, (31.1%) followed by an improvement in their livelihood, and additional aesthetic value by coloring their products (26.7%). On the other hand, a few respondents mentioned that there were also weaknesses in the implementation of the project. About 11% complained that they found it difficult to follow the instructions and some 4% mentioned that their health was affected. Other weaknesses mentioned were the distance of the materials is far, that they find that they cannot invest money due to the high cost of materials, and that they have no market yet for their products. As for the financial and managerial aspect of the project it was seen that the spouse (women) are responsible for this activity (37.8%). Table 48. Q106-Q109 Gender Perception KCH SRP TOTAL Project suitable for women (Total n=) N=120 N=60 N=180 Normal work/light work 76.67 71.93 75.14
Can increase income in household 26.67 31.58 28.25 Can look after the member in household 23.33 14.04 20.34
Types of assistance that men are involved in the project activities (Total n=) N=120 N=60 N=180
Collect sedge (harvest, find..) 42.50 50.00 45.00 To put the bottom of Kroloar/basket 30.00 21.67 27.22 To help weaving 31.67 13.33 25.56 To beat a mats 17.50 - 11.67
Make loom 12.50 - 8.33 Sedge split 10.83 - 7.22 To dip the sedge 8.33 - 5.56 Bamboo split 5.00 - 3.33 To make rope 4.17 - 2.78 Sedge drying 1.67 - 1.11 To twist the rattan - 3.33 1.11 To water the crops - 1.67 .56 To spray insecticide poison - 1.67 .56 No idea .83 5.00 2.22 Do not nothing 3.33 11.67 6.11
Reason for satisfaction with projects (Total n =) N=120 N=60 N=180
Get knowledge (put color, make style,..) 59.17 53.33 57.22 Easy to get money/income 25.00 18.33 22.78 Have traders to collect production 11.67 6.67 10.00 To improve livelihood 9.17 10.00 9.44 Additional job - 6.67 2.22 Provide job to villagers .83 3.33 1.67 No migration .83 - .56 No idea .83 3.33 1.67
Strong aspects of the project implementation (Total n=) N=120 N=60 N=180
To get knowledge 30.00 33.33 31.11 To improve the livelihood 14.17 51.67 26.67
To know how to dip the color 36.67 6.67 26.67 The product can sell the high price 22.50 8.33 17.78

36
To pay attention from the trainer 22.50 1.67 15.56 To know how to make the long mat 15.00 8.33 12.78 Have trader/market 17.50 - 11.67 To know how to food making 4.17 3.33 3.89 Use time less than before for weaving 5.00 - 3.33 To do team work 4.17 1.67 3.33 To get technique to grow .83 3.33 1.67 Have many style .83 1.67 1.11 Have a jobs - - - No idea .83 5.00 2.22
Weak aspects of the project implementation N=120 N=60 N=180 Difficult to follow it 5.83 20.00 10.56 Affect to health - 11.67 3.89
The resource far away from home(sedge, bamboo) 3.33 3.33 3.33
Expense more time to do it 3.33 3.33 3.33 Not have market yet 4.17 1.67 3.33 Material for mat weaving is high price(string, leak) 4.17 - 2.78
Difficult to weaving because the string is very small 2.50 - 1.67
Provide the training is shortly .83 3.33 1.67 Natural disaster - 5.00 1.67 Not enough document .83 1.67 1.11 Not have finance - 3.33 1.11 No sample during training .83 - .56 No idea/don't know 76.67 48.33 67.22
Who make decision in terms of financial and managerial aspects (Total n=) N=120 N=60 N=180
Spouse 41.67 30.00 37.78 HH head 34.17 26.67 31.67
Both husband and wife 9.17 21.67 13.33 Mother/father 5.00 18.33 9.44 Relative 10.00 3.33 7.78
I. POVERTY PROFILE Based on the GTZ module the beneficiaries of the project had a mean poverty score of 26.95 (Table 49). This means that for the score range of 59-68 which is the range for the very poor households only 1.7% in the province of SRP and 0.6% of all beneficiaries was tagged as very poor households. About 7% of all households were in the poor category and a huge majority (92.2%) was labeled as non-poor households. Table 49. Poverty Score Level/GTZ Module
KCH SRP TOTAL Poverty level (Total n=180) N=120 N=60
Very poor (Score 59-68) - 1.67 0.56 Poor (Score 45-58) 2.50 16.67 7.22 Non poor (Score 0-44) 97.50 81.67 92.22
Mean of poverty score (Min-Max) 24.96(2-49) 30.95(4.60) 26.95(2-60)

37
In 2009 the very poor households had less than US$1 per capita expenditure while the poor households had a maximum per capita expenditure of less than US$1, but some had amounts of US$1 or more (Table 50). This is also true for non-poor households. Overall, household per capita expenditure in 2009 regardless of poverty level was still less than US$1. Table 50. Q101-Q102 Proxy Household Expenditures per Capita 2009 (in USD) Cross-referenced by Poverty Score Level
KCH SRP TOTAL Very poor (Total n=) N=1 N=1
< 1 US$ - 100.00 100.00 > 1 US$ - - -
Poor (Total n=) N=3 N=10 N=13 < 1 US$ 100.00 90.00 92.31 > 1 US$ - 10.00 7.69
Non poor (Total n=) N=117 N=49 N=166 < 1 US$ 82.91 77.55 81.33 > 1 US$ 17.09 22.45 18.67
Overall (Total n=) N=120 N=60 N=180 < 1 US$ 83.33 80.00 82.22 > 1 US$ 16.67 20.00 17.78
Table 51. Q110-Q111 Poverty Perception Compared to Other Villagers
KCH SRP TOTAL Poverty Level 1-Very poor (Total n=) N=1 N=1
Extremely poor - - - Poor - 100.00 100.00 Not poor - - - Wealthy - - -
Poverty level 2 – Poor (Total n=) N=3 N=10 N=13 Extremely poor - - - Poor 66.67 80.00 76.92 Not poor 33.33 20.00 23.08 Wealthy - - -
Poverty level 3 – Non poor (Total n=) N=117 N=49 N=166 Extremely poor 5.13 2.04 4.22 Poor 18.80 32.65 22.89 Not poor 72.65 65.31 70.48 Wealthy 3.42 - 2.41
Overall for perception (Total n=) N=120 N=60 N=180 Extremely poor 5.00 1.67 3.89 Poor 20.00 41.67 27.22 Not poor 71.67 56.67 66.67 Wealthy 3.33 - 2.22
Three most important reasons for being a “poor” household (Total n=) N=120 N=60 N=180
Lack of food 69.17 58.33 65.56 No agricultural land 78.33 76.67 77.78 No animals 53.33 33.33 46.67 Poor or no house to live in 47.50 61.67 52.22 Not enough money 51.67 68.33 57.22 Others - 1.67 0.56

38
Table 52. Q112-Q116 Well- being from 2007 to 2010
KCH SRP TOTAL Poverty Level 1-Very poor (Total n=) N=1 N=1
Move up - - - No change - 100.00 100.00 Move down - - -
Poverty level 2 – Poor (Total n=) N=3 N=10 N=13 Move up 33.33 80.00 69.23 No change 33.33 10.00 15.38 Move down 33.33 10.00 15.38
Poverty level 3 – Non poor (Total n=) N=117 N=49 N=166 Move up 74.36 85.71 77.71 No change 17.09 8.16 14.46 Move down 8.55 6.12 7.83
Overall Well-being (Total n=) N=120 N=60 N=180 Move up 73.33 83.33 76.67 No change 17.50 10.00 15.00 Move down 9.17 6.67 8.33
Reason for positive change or move up N=88 N=50 N=138 Household member have job/can get income 31.82 30.00 31.16
Land renting 2.27 - 1.45 get income from handicraft work 42.05 22.00 34.78 To produce the mats more than before 10.23 12.00 10.87
Sedge mats are high price 29.55 8.00 21.74 get good skill 1.14 2.00 1.45 income livestock/agriculture 34.09 24.00 30.43 income from vegetable growing - 30.00 10.87
Reason for no change N=21 N=6 N=27 More children/more household member 23.81 16.67 22.22
The same job 42.86 16.67 37.04 No trader 19.05 16.67 18.52 Health problem 19.05 33.33 22.22 No permanent job 9.52 - 7.41 No agriculture land 4.76 - 3.70 Expense for schooling - - - Widow - 16.67 3.70 Loan - 16.67 3.70
Reason for negative change or move down N=11 N=4 N=15
Old aged/health problem 72.73 50.00 66.67 Unemployed 27.27 - 20.00 More children to school 27.27 - 20.00 No household member to help work 9.09 50.00 20.00
Disabled - 25.00 6.67 Loan 9.09 25.00 13.33

- 1 -
Annex 2. Questionnaires
HOUSEHOLD QUESTIONNAIRE A. Location of target areas
Province: ...............District:................Commune....................Village:...................... Code: ...............Code:....................Code ...................Code....................... Interview Record Interviewer’s name: ................................................ Date of interview: ..............Feb/2010 Remarks:...................................................................................................................
B. Demographic information (household contact number...........................)
CO
DE
Respondent & Household members
a. Relationship
to respondent (Use Code)
b. Civil Status (Use
Code)
c. Age
d. Sex (M=1; F=2)
e. Which producer
group are you belongin
g to?
f. Disability
, 1-=normal, 2=disabl
ed
g. Main Occupa
tion (Use
Code)
g. Second Occupa
tion (Use
Code)
h. educat
ion
1 Respondent: Household Members: 2 3 4 5 6 7 8 9 10 Codes for a 1=Household head 2=Spouse 3=Son or daughter 4=Father/ Mother 6=Other relatives
Codes for b 1=Married 2=Single 3=Separated/ divorced 4=Widowed
Codes for c 00=For less
than one year
98=Do not know
Codes for e,g,h 00=pupil/student 90=too young/ old age 1=Unemployed 2=Farmer-Fisherman 3= Migrant worker 4= Sedge Mat/triangle sedge mat
producer 5= Bamboo handicraft producer 6 = Vegetable growing person 7 = Proa mat producer
8 = Pandanus leaf mat producer 9=Rattan basket producer 10= Cotton weaver and handicraft maker 97= Other, specify......................

- 2 -
C. House Situation/status: Question 1 – 11 Extracted from GTZ/MOP for Identification of Poor Household. 1. Is this house the property of your household? Or does your household rent it from other
people?
(INTERVIEWER: Do not read out) (INTERVIEWER: Please tick one circle below)
Not own house and pay rent
Not own house but don’t pay rent
Own house or live with parents
Q1 NO SCORE
2. Main construction material of the house’s roof. (INTERVIEWER: Observe—do not ask)
(INTERVIEWER: Do not read out) POINTS
- Thatch, palm leaves, plastic sheet, tarpaulin or other soft materials - OR not own house (rent-free, or paying rent)
8
Corrugated iron 4
Tiles, fibrous cement, or concrete 0
Q2 SCORE
3. Main construction material of the house’s exterior walls. (INTERVIEWER: Observe—do not ask)
(INTERVIEWER: Do not read out) POINTS
- Saplings, bamboo, thatch, palm leaves, or other soft materials - OR not own house (rent-free, or paying rent)
4
Wood, sawn boards, plywood, corrugated iron 2
Cement, bricks, concrete 0
Q3 SCORE
4. General condition of the house. (INTERVIEWER: Observe—do not ask)
(INTERVIEWER: Do not read out) POINTS
- In dilapidated condition - OR not own house (rent-free, or paying rent)
4
In average condition, livable 2
In good condition and safe 0
Q4 SCORE
5. (INTERVIEWER: Ask and observe): How many meters by how many meters is the floor area of
your house?

- 3 -
(INTERVIEWER: Do not read out) POINTS
- 20 meters square or less - OR not own house (rent-free, or paying rent)
4
21-50 meters 2
51 meters or more 0
Q5 SCORE
6.a. Which activity is the main income source for your household: growing rice or other crops, fishing, or other activities?
Growing rice or other crops or orchard
Ask Q6b
Fishing
Ask Q6c Ask only one question
Other activities
Ask Q6d
(***INTERVIEWER: Ask only households that grow rice, other crops or an orchard as the main source of income)
6.b. How many ar of land does your household have for growing rice or other crops? Please include land around the house which is used for growing rice, other crops or an orchard.
Q6 SCORE (Interviewer must write the score for only one question: Q6b, Q6c or Q6d)
Unit calculation NUMBER OF AR
(Interviewer: do not read out) SCORE
From 0 to 20 ar 8 From 20 to 50 ar 4
1 kong ≈ 10 ar 1 ha ≈ 100 ar 1 ar = 100 m² 1 rai ≈ 16 ar
= Over 50 ar 0
(***INTERVIEWER: Ask only households for whom fishing is the main source of income)
6.c. What types of fishing equipment do you have? (not including boats)
(INTERVIEWER: Do not read out) Fishing equipment Quantity Size and
condition Line hooks Throw net Set net Drag net Other (please specify the types of equipment):
…………… …………………………………………………………….

- 4 -
…………………………………………………………….
(INTERVIEWER: Do not read out) POINTS
None or very little equipment and in poor condition
8
Little equipment and in fair condition 4
(INTERVIEWER: Please make your own judgment of the quantity and quality of the equipment listed above)
Enough equipment and of good quality 0
(***INTERVIEWER: Ask only households for whom “other activities” are the main source of income for the household)
6.d. What activity provides the main source of income for your household?
(INTERVIEWER: Do not read out) SCORE Work as labourer 8 Micro business, skilled labourer or civil servant 4 Small or medium-size business 0
(***INTERVIEWER: Ask only households living on land (not on water) 7.a. For households living on land. Does your household have pigs? goats? cows? buffaloes? horses? How many..? (count weaners and older). Among these animals, how many do you share (provas) with others? (INTERVIEWER: Please write the number of animals in the boxes below. Count any animal which is provas as only half an animal.)
Pigs Cows Buffaloes Goats Horses
And does your household raise fish for sale? Yes No
(INTERVIEWER: Do not read out) POINTS • No pigs or goats • No cows, buffaloes or horses • No fish raising for sale
10
• 1-2 pigs • OR 1-5 goats • OR 1-2 cows, buffaloes or horses • NO fish raising for sale
5
• 3-9 pigs • AND/OR 6-19 goats • AND/OR 3-9 cows, buffaloes or horses • AND/OR does fish raising for sale
0
• 10 or more pigs • AND/OR 20 or more goats • AND/OR 10 or more cows, buffaloes or horses (total)
Disqualify
Q7 SCORE (INTERVIEW-ER: Write the score for Q7a OR Q7b, NOT BOTH)

- 5 -
(***INTERVIEWER: Ask only households living on water) 7.b. For households living on water. Does your household have pigs? How many are weaners and older? Among these pigs, how many do you share (provas) with other? (INTERVIEWER: Please write the number of pigs in the boxes below. Count any pig which is provas as only half an animal.)
Pigs
And does your household do fish raising for sale? Yes No
(INTERVIEWER: Do not read out) POINTS • No pigs • No fish raising for sale 10
• 1-2 pigs OR fish raising for sale, but not both 5 • 3 or more pigs • AND/OR does fish raising for sale 0
8. During the last 12 months, did your household owe rice or borrow rice from
other people? For how many months?
Number of months (INTERVIEWER: Do not read out) POINTS
8-12 months 8 = 3-7 months 4
Q8 SCORE
9.a. (INTERVIEWER: Please write down the total number of household members by checking the table of all household members in Section B of the questionnaire)
9.b. How many persons in your household cannot produce an income (because of young or old age, school pupil, poor health, disability, looking after children or other household members, or any other reasons)?
(INTERVIEWER: Do not read out) POINTS Half or more than half of all household members 8 Less than a half but more than one quarter of all household members
4
Less than one quarter of all household members 0
Q9 SCORE
10. Does your household have … ? How many? (INTERVIEWER: Please write the number of assets in each box below)

- 6 -
small radio? stereo? colour TV? video camera?
large radio? B&W
TV? video player/
karaoke machine?
mobile telephone
(INTERVIEWER: Do not read out) POINTS Nothing or one small radio 6 Large radio OR black and white TV 3 Colour TV and/or tape recorder and/or mobile telephone and/or VCD player and/or karaoke machine 0
Video camera Disqualify
Q10 SCORE
11. Does your household have … ? How many? (INTERVIEWER: Please write the number of assets in each box below)
bicycle? horse/oxen cart? kou yon? small boat or canoe
(no motor)?
motorbike? motorbike remorque? car/van/
truck? motorboat?
tractor?
(INTERVIEWER: Do not read out) POINTS (total value less than 100,000 riel) • No means of transportation • OR one old bicycle only • OR one small, old rowboat or canoe
8
(total value from 100,000 to less than 400,000 riel) • Old bicycle • Very old motorbike • Old horse or oxen cart • Old, medium size rowboat (without
motor)
4
(total value over 400,000 riel) • Bicycle with fair condition • Motorcycle with fair condition • New horse/oxen cart • New, large rowboat OR motorboat • Motorbike remorque • Kou yon (hand tractor)
0
(INTERVIEWER: Please calculate the approximate total value of all forms of transportation)
(very high total value) • Tractor • Car/van/truck
Disqualify
Q11 SCORE
(SUPERVISOR: Please total up all the points from the right-hand column and write the total in the TOTAL SCORE box to the right. SPECIAL NOTE: If any household had animals or assets which earned the "Disqualify" score, please write "DISQUALIFIED" in the box to the right. This means that a household will be given a Total Score of zero.)
TOTAL SCORE

- 7 -
12. Have household facilities/assets changed in the past two years? How have they changed? Why?
__________________________________________________________________________ __________________________________________________________________________ Water supply and Sanitation 13. What different water sources are used by this household for all activities
Please tick all applicable
Water Source
Dry season
Wet season
1 Piped in dwelling 2 Public tap 3 Tubed/piped well or borehole 4 Protected dug well 5 Unprotected dug well 6 Pond, river or stream 7 Rainwater 8 Tanker truck, vendor or otherwise bought 9 Other
14. What type of toilet does this household have? [_] 1. yes [_] 0. no
[_] 1. dry pit [_] 2. pour-flush water-sealed [_] 3. soak away [_] 4. septic tank
If No [ ] toilet go to next question D. Handicraft Activities- Value Chain: 15. Are you engaged in the following livelihood activities (FY 2007-2010)? Who are responsible for these
activities? REFER TO MAIN OCCUPATION IN THE DEMOGRAPHIC TABLE (COMPLETE TABLE BELOW)
Livelihood Activity (focused on project)
Female Adults
Male, Adults
Female children
Male Children
working month per year
1 Sedge/triangle sedge Mats 2 Bamboo handicrafts 3 Vegetables growing 4 Proa Mats 5 Rattan basket 6 Cotton weaving & handicraft 7 Pandanus leaf mats 8 Agriculture (farming &
livestock)
97 Other, specify____________

- 8 -
16. Have there been any changes in livelihood activities of individual family members in the past two years? If yes, explain.
__________________________________________________________________________ __________________________________________________________________________ IF ENGAGED IN Sedge/triangle sedge Mats production;
17. What months of the year do you usually produce Sedge/triangle sedge mats? TICK ( ) ALL
APPROPRIATE BOXES [_] 1 =January [_] 7 = July [_] 2 = February [_] 8 = August [_] 3 = March [_] 9 = September [_] 4 = April [_] 10 = October [_] 5 = May [_] 11 = November [_] 6 = June [_] 12 = December
18. Have there been any changes in when you produce your mats? If yes, explain. ____________________________________________________________________ ____________________________________________________________________
19. What is the average volume of Sedge/triangle sedge mats that you can produce yearly? COMPLETE TABLE BELOW
Type of Mats/size Estimated Volume (unit/set)
Volume of Products Sold
Price of Product Per Units
1 2 3 4 5
20. Have there been any changes in the number of mats produced annually? If yes, explain.
_____________________________________________________________________________
21. Where do you sell your products? Market Percentage of Volume Sold 1 Local community 2 Within district 3 Within province 4 Other province in the country 5 Export to abroad 97 Other, specify______________
22. Have there been any changes in where you sell your products? If yes, explain. _________________________________________________________________________
23. Do you use traders or collectors to sell your products? [_] 1=Yes [_] 0=No 24. If yes, please list the traders or collectors that you sell your products to.
__________________________________________________ __________________________________________________

- 9 -
25. Have there been any changes in how you sell your products? If yes, explain. 26. Please estimate your net income from your product for this year (2009). STATE AMOUNT US$
__________
27. Have you observed a change in your income from your product from the previous years’ (2008) amount?
[_] 1 = Increased [_] 2 = Decreased [_] 0 = No change
28. Where is your source of raw materials extracting/collecting from? [_] 1. Forest (common use) [_] 2. Re-grow by family/farming [_] 3. Bought from other suppliers [_] 4. Other........................ (ENUMERATOR PROBE FOR RAW MATERIAL SUSTAINABILITY)
IF ENGAGED IN Bamboo handicrafts;
29. What months of the year do you usually produce Bamboo handicrafts ? TICK ( ) ALL
APPROPRIATE BOXES [_] 1 =January [_] 7 = July [_] 2 = February [_] 8 = August [_] 3 = March [_] 9 = September [_] 4 = April [_] 10 = October [_] 5 = May [_] 11 = November [_] 6 = June [_] 12 = December
30. Have there been any changes in when you produce your handicrafts? If yes, explain. ___________________________________________________________________________
31. What is the average volume of Bamboo handicrafts that you can produce yearly? COMPLETE TABLE BELOW
Type of Bamboo handicrafts Estimated Volume (unit/set)
Volume of Products Sold Price of Product Per Units
1 2 3 4 5
32. Have there been any changes in the number of handicraft produced annually? If yes, explain
__________________________________________________________________________

- 10 -
33. Where do you sell your products? Market Percentage of Volume Sold 1 Local community 2 Within district 3 Within province 4 Other province in the country 5 Export to abroad 97 Other, specify______________
34. Have there been any changes in where you sell your products? If yes, explain.
________________________________________________________________________ 35. Do you use traders or collectors to sell your products? [_] 1=Yes [_] 0=No 36. If yes, please list the traders or collectors that you sell your products to?.
__________________________________________________ __________________________________________________ __________________________________________________
37. Have there been any changes in how you sell your products? If yes, explain. _______________________________________________________________________
38. Please estimate your net income from your product for this year (2009). STATE AMOUNT US$ __________
39. Have you observed a change in your income from your product from the previous years’ (2008)
amount? [_] 1 = Increased [_] 2 = Decreased [_] 0 = No change
40. Where is your source of raw materials extracting/collecting from?
[_] 1.Forest (common use) [_] 2.Re-grow by family/farming [_] 3.Bought from other suppliers [_] 4.Other............................ (ENUMERATOR PROBE FOR RAW MATERIAL SUSTAINABILITY)
IF ENGAGED IN Vegetables growing;
41. What months of the year do you usually grow vegetables? TICK ( ) ALL APPROPRIATE BOXES
[_] 1 =January [_] 7 = July [_] 2 = February [_] 8 = August [_] 3 = March [_] 9 = September [_] 4 = April [_] 10 = October [_] 5 = May [_] 11 = November [_] 6 = June [_] 12 = December
42. Have there been any changes in when you growing your vegetable? If yes, explain. __________________________________________________________________________
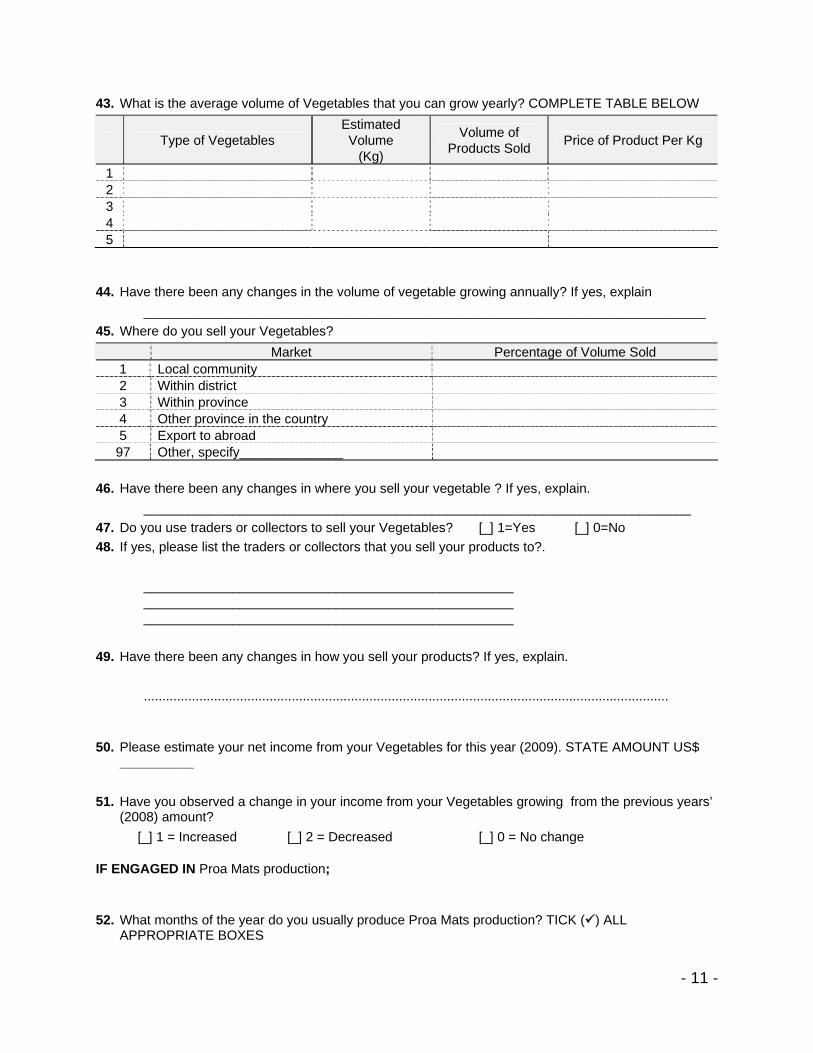
- 11 -
43. What is the average volume of Vegetables that you can grow yearly? COMPLETE TABLE BELOW
Type of Vegetables Estimated Volume
(Kg)
Volume of Products Sold Price of Product Per Kg
1 2 3 4 5
44. Have there been any changes in the volume of vegetable growing annually? If yes, explain ____________________________________________________________________________
45. Where do you sell your Vegetables? Market Percentage of Volume Sold 1 Local community 2 Within district 3 Within province 4 Other province in the country 5 Export to abroad 97 Other, specify______________
46. Have there been any changes in where you sell your vegetable ? If yes, explain.
__________________________________________________________________________ 47. Do you use traders or collectors to sell your Vegetables? [_] 1=Yes [_] 0=No 48. If yes, please list the traders or collectors that you sell your products to?.
__________________________________________________ __________________________________________________ __________________________________________________
49. Have there been any changes in how you sell your products? If yes, explain.
..............................................................................................................................................
50. Please estimate your net income from your Vegetables for this year (2009). STATE AMOUNT US$ __________
51. Have you observed a change in your income from your Vegetables growing from the previous years’
(2008) amount? [_] 1 = Increased [_] 2 = Decreased [_] 0 = No change
IF ENGAGED IN Proa Mats production;
52. What months of the year do you usually produce Proa Mats production? TICK ( ) ALL
APPROPRIATE BOXES

- 12 -
[_] 1 =January [_] 7 = July [_] 2 = February [_] 8 = August [_] 3 = March [_] 9 = September [_] 4 = April [_] 10 = October [_] 5 = May [_] 11 = November [_] 6 = June [_] 12 = December
53. Have there been any changes in when you produce your Proa mats? If yes, explain. __________________________________________________________________________
54. What is the average volume of Proa mats that you can produce yearly? COMPLETE TABLE BELOW
Type of Mats Estimated Volume (unit/set)
Volume of Products Sold
Price of Product Per Units
1 2 3 4 5
55. Have there been any changes in the number of Proa mats produced annually? If yes, explain
_________________________________________________________________________ 56. Where do you sell your products?
Market Percentage of Volume Sold 1 Local community 2 Within district 3 Within province 4 Other province in the country 5 Export to abroad 97 Other, specify______________
57. Have there been any changes in where you sell your products? If yes, explain.
_________________________________________________________________________ 58. Do you use traders or collectors to sell your products? [_] 1=Yes [_] 0=No 59. If yes, please list the traders or collectors that you sell your products to.
__________________________________________________ __________________________________________________ __________________________________________________
60. Have there been any changes in how you sell your products? If yes, explain. ________________________________________________________________________
61. Please estimate your net income from your product for this year (2009). STATE AMOUNT US$ __________
62. Have you observed a change in your income from your product from the previous years’ (2008)
amount? [_] 1 = Increased [_] 2 = Decreased [_] 0 = No change
63. Where is your source of raw materials extracting/collecting from?
[_] 1. Forest (common use)

- 13 -
[_] 2.Re-grow by family/farming [_] 3.Bought from other suppliers [_] 4. Other...................... (ENUMERATOR PROBE FOR RAW MATERIAL SUSTAINABILITY)
IF ENGAGED IN Rattan baskets;
64. What months of the year do you usually produce Rattan basket? TICK ( ) ALL APPROPRIATE
BOXES [_] 1 =January [_] 7 = July [_] 2 = February [_] 8 = August [_] 3 = March [_] 9 = September [_] 4 = April [_] 10 = October [_] 5 = May [_] 11 = November [_] 6 = June [_] 12 = December
65. Have there been any changes in when you produce your rattan baskets? If yes, explain. ___________________________________________________________________
66. What is the average volume of Rattan basket that you can produce yearly? COMPLETE TABLE BELOW
Type of Rattan basket Estimated Volume (unit/set)
Volume of Products Sold Price of Product Per Units
1 2 3 4 5
67. Have there been any changes in the number of Rattan Baskets produced annually? If yes, explain
___________________________________________________________________________ 68. Where do you sell your products?
Market Percentage of Volume Sold 1 Local community 2 Within district 3 Within province 4 Other province in the country 5 Export to abroad 97 Other, specify______________
69. Have there been any changes in where you sell your products? If yes, explain. __________________________________________________________________________
70. Do you use traders or collectors to sell your products? [_] 1=Yes [_] 0=No 71. If yes, please list the traders or collectors that you sell your products to?.
__________________________________________________ __________________________________________________ __________________________________________________
- 14 -
72. Have there been any changes in how you sell your products? If yes, explain.
73. Please estimate your net income from your product for this year (2009). STATE AMOUNT US$ __________
74. Have you observed a change in your income from your product from the previous years’ (2008)
amount? [_] 1 = Increased [_] 2 = Decreased [_] 0 = No change
75. Where is your source of raw materials extracting/collecting from?
[_] 1. Forest (common use) [_] 2. Re-grow by family/farming [_] 3. Bought from other suppliers [_] 4. Other.......................... (ENUMERATOR PROBE FOR RAW MATERIAL SUSTAINABILITY)
IF ENGAGED IN Cotton weaving & handicraft;
76. What months of the year do you usually produce Cotton weaving & handicraft? TICK ( ) ALL
APPROPRIATE BOXES [_] 1 =January [_] 7 = July [_] 2 = February [_] 8 = August [_] 3 = March [_] 9 = September [_] 4 = April [_] 10 = October [_] 5 = May [_] 11 = November [_] 6 = June [_] 12 = December
77. Have there been any changes in when you produce your cotton weaving and handicrafts? If yes, explain.
_________________________________________________________________________
78. What is the average volume of Cotton weaving & handicraft that you can produce yearly? COMPLETE TABLE BELOW
Type of Cotton weaving & handicraft
Estimated Volume (unit/set)
Volume of Products Sold Price of Product Per Units
1 2 3 4 5
79. Have there been any changes in the number of cotton weaving and handicrafts produced annually? If
yes, explain __________________________________________________________________________
80. Where do you sell your products?

- 15 -
Market Percentage of Volume Sold 1 Local community 2 Within district 3 Within province 4 Other province in the country 5 Export to abroad 97 Other, specify______________
81. Have there been any changes in where you sell your products? If yes, explain.
_________________________________________________________________________
82. Do you use traders or collectors to sell your products? [_] 1=Yes [_] 0=No 83. If yes, please list the traders or collectors that you sell your products to.
__________________________________________________ __________________________________________________ __________________________________________________
84. Have there been any changes in how you sell your products? If yes, explain. _________________________________________________________________________
85. Please estimate your net income from your product for this year (2009). STATE AMOUNT US$ __________
86. Have you observed a change in your income from your product from the previous years’ (2008)
amount? [_] 1 = Increased [_] 2 = Decreased [_] 0 = No change
87. Where is your source of raw materials extracting/collecting from?
a. Forest (common use) b. Re-grow by family/farming c. Bought from other suppliers d. Other............................ (ENUMERATOR PROBE FOR RAW MATERIAL SUSTAINABILITY)
IF ENGAGED IN Pandanus leaf mats production;
88. What months of the year do you usually produce Pandanus leaf mats? TICK ( ) ALL APPROPRIATE
BOXES [_] 1 =January [_] 7 = July [_] 2 = February [_] 8 = August [_] 3 = March [_] 9 = September [_] 4 = April [_] 10 = October [_] 5 = May [_] 11 = November [_] 6 = June [_] 12 = December
89. Have there been any changes in when you produce your Pandanus leaf mats? If yes, explain. _________________________________________________________________________
90. What is the average volume of Pandanus leaf mats that you can produce yearly? COMPLETE TABLE BELOW

- 16 -
Type of Mats Estimated Volume (unit/set)
Volume of Products Sold Price of Product Per Units
1 2 3 4 5
91. Have there been any changes in the number of Pandanus leaf mats produced annually? If yes,
explain __________________________________________________________________________
92. Where do you sell your products? Market Percentage of Volume Sold 1 Local community 2 Within district 3 Within province 4 Other province in the country 5 Export to abroad 97 Other, specify______________
93. Have there been any changes in where you sell your products? If yes, explain.
_________________________________________________________________________
94. Do you use traders or collectors to sell your products? [_] 1=Yes [_] 0=No 95. If yes, please list the traders or collectors that you sell your products to.
__________________________________________________ __________________________________________________ __________________________________________________
96. Have there been any changes in how you sell your products? If yes, explain. ________________________________________________________________________
97. Please estimate your net income from your product for this year (2009). STATE AMOUNT US$ __________
98. Have you observed a change in your income from your product from the previous years’ (2008)
amount? [_] 1 = Increased [_] 2 = Decreased [_] 0 = No change
99. Where is your source of raw materials extracting/collecting from?
a. Forest (common use) b. Re-grow by family/farming c. Bought from other suppliers d. Other............................ (ENUMERATOR PROBE FOR RAW MATERIAL SUSTAINABILITY)

- 17 -
E. CAPACITY BUILDING: 100. What kind of workshop/training/study tour have you participated, and providing by the project? probe
for appropriate answer
TRAINING ACTIVITIES/COURSE TITLE
WHO PARTICIPATED?
HANDOUT/MATERIALS OBTAINED
HOW USED? usefulness
and benefits
TRANSFER KNOWLEDGE TO
WHOM workshop/training/study tour a. Food Processing yes [ ], no [ ]
b. Good Nutrition’ yes [ ], no [ ]
c. Women Worker Right yes [ ], no [ ]
d. Home and Work Safety yes [ ], no [ ]
e. Post-harvest Processing’. yes [ ], no [ ]
f. training on improving the quality of bamboo products yes [ ], no [ ]
g. training on improving the quality of sedge mat weaving yes [ ], no [ ]
h. training on sewing bags made from triangle sedge mats yes [ ], no [ ]
i. Pandanus and rattan basket producer groups yes [ ], no [ ]
j. Gender and entrepreneurship development
k. Study tour in Kg Spue vegetable growing and marketing
l. Sedge mat in Koh Dach and bamboo handicraft in Takeo

- 18 -
F. Expenditures and Incomes 101. Household expenditures on non-food items by all members of household in 2009:
(moeun=10000)
1. clothing and footwear ..................................moeun riels
2. medical care/health treatment ..................................moeun riels
3. others’ wedding ..................................moeun riels
4. ceremony ..................................moeun riels
5. house repairs ..................................moeun riels
6. visits/tourism ..................................moeun riels
7. donations to relatives ..................................moeun riels
8. other recreation(hire video, karaok,…) …..............................moeun riels
9. repairing equipment/tools ..................................moeun riels
10. phone card/telephone .................................moeun riels
11. water /house rental ................................moeun riels
12. cooking (gas/charcoal/stove) .................................moeun riels
13. other .................................moeun riels
Total (1 to 13) . ..............................moeun riels
102. Last week how much has your household spent on beside the above expenses:
1. Soaps, shampoo, make-up ...........................moeun riels
2. Education (extra courses, teachers and eating at school.....................moeun riels
3. Purchasing food beside rice .................................moeun riels
4. Eating outside home .................................moeun riels
5. Charging battery .................................moeun riels
6. Other:......................................... .................................moeun riels
Total (from 1 to 6) . ................................moeun riels

- 19 -
Now I would like to ask you about your total income: 103. What has been your income from all members of the household? Note: If recording without type of income, please put them in code other
Last year (2009) Household income I.Income from selling agricultural products and livestock Total income from selling agricultural products (paddy, maize, beans, watermelon, fruits etc)................................ Vegetables,........................................................................ Livestock Pig: ..................................................................... Cow/buffalo:.................................................................... Poultry ............................................................................. Fish culture:.....................................................................
………………............moeun riels ………………............moeun riels ………………............moeun riels ………………............moeun riels ………………............moeun riels ………………............moeun riels
II.Off-Farm Income Handicraft:(Sedge/Proa-Pandanus,Cotton/Rattan/bamboo) Palm juice/sugar production: ......................................... Small business/petty trade........................................... Other:............................................................................
………………............moeun riels………………............moeun riels………………............moeun riels………………............moeun riels
III. Collecting Common Property Resources Fishing: ......................................................................... Hunting:........................................................................ Collecting rattan/Pandanus leaf/Proa: ........................... Other:...........................................................................
………………............moeun riels ………………............moeun riels ………………............moeun riels ………………............moeun riels
IV. Other Income Land/house rental:......................................................... Equipment/animal rentals............................................. Interest from lending money ........................................ Remittances................................................................... Selling land: ................................................................. Other: ..........................................................................
………………............moeun riels ………………............moeun riels ………………............moeun riels ………………............moeun riels ………………............moeun riels
………………............moeun riels
Total ………………...........moeun riels 104. According to your own idea, how important are your incomes from the different sources you have
mentioned? (Please choose appropriate coding) Scale of importance:
1=very important, 2=moderately important, 3=not so important, 4=not important at all or not relevant or not related, 5=don’t know
Source A. before 2007 B. presently, 2010 I. Farming II. Off-farm (handicraft) III. Collecting Common Property Resources
IV. Other Any explanation/ reasons?.........................................................................................
- 20 -
G. MIGRATION: 105. Have you or your family members worked in other places for the last 2 years? if yes record, if no
skip to next question.
Name? Sex? Worked where? How
long?
Do you or your family members look for job in last 3
month?
H. GENDER: 106. How do you think about the project? (probe for reason)
106a.Is it suitable for women? .............. 106b Are you satisfied with this project implementation............. 106c What Kind of work or assistance that men are involved in the project
activities?............................ 107. What were the strong aspects of the project implementation?
108. What were the weak aspects of the project implementation? 109. In your household who will be the decision making, in terms of financial and managerial aspects?
(please specify)................

- 21 -
I. POVERTY PERCEPTIONS
110. How do you rank your household compared to others in this village?
(1) Extremely poor (2) Poor (3) Not poor (4) Wealthy
111. In your opinion, what are the three most important reasons for being a “poor” household?
[_] 1. Lack of food [_] 2. No agricultural land [_] 3. No animals [_] 4. Poor or no house to live in [_] 5. Not enough money [_] 6. Others…………………………………………………………………………..
Here is a picture of a 10-step ladder (well-being). Imagine that at the bottom, on the first step, stand the poorest people, and on the highest step, the tenth, stand the rich.
Figure 1. 10-Step Ladder
10 9 8 7 6 5 4 3 2 1
112. On which step of this ladder are you located today 2010? 113. On which step were you located before 2007 114. (If there was a positive change) What are the important factors that helped you move up? (Record in
term of level of significance) 115. (If there was a negative change) What are the factors that could not helped you move up? (Record
in term of level of significance) 116. (If there is no change) What are the factors that could not helped you move up? (Record in term of
level of significance) 117. If we/I invite you to participate in FGD, are you willing to participate? if so
We will be held the session on................ place................. (Supervisor determines a time and place to be held for FGD session)

- 22 -
Date of interview.............................................................................................................. Village..................... Commune..................... District..................... Province.................. Name of respondents: .......................................... Sex: ..................... Age: .................... Marital Status: .................................................... Number of children: ........................... Main Occupation: ............................................................................................................ Code: ........................................ Group.......................................................................
Guide Questions for Case Study:
1. How were you selected to be a member of your producer group? 2. Before the project starting, what is your main income from?
3. During that time, was your income sufficient to support your family? Please specify your livelihood condition? (Cultivation, consumption, health, children’s education, income, expend, saving...etc). Regarding livelihood activities is there any difficulties? Problem encountered? How did you solve it?
4. Which livelihood activities you are engaged in? (Sedge/triangle sedge mats, bamboo handicraft, vegetables growing, Proa Mats, Rattan Baskets, Farming and Livestock, Cotton Weaving and Pandanus leaf mats, and other...)
5. Are you satisfied with this kind of work (the works mentioned above)? Please explain?
6. Who are responsible for these works? How many members in your family are engaged in these works?
7. Did you get any training skills regarding the work above? Please specify the kind of training/workshop? Who trained, where, when and for how many days? Training tour?
8. How did the training help improving a quality of products? Did you share knowledge gaining from training to other people? if so to whom
9. What month of the year do you do your work (handicraft/weaving/growing? State month of the year...? Has this changed over the past two years?
10. What is the average annual volume of (product) that you produced prior to the Have there been any changes in livelihood activities of individual family members in the past two years? If yes, explain.
11. Have there been any changes in the number of mats produced annually? If yes, explain.
12. Where do you sell your products?
- 23 -
13. Have there been any changes in where you sell your products? If yes, explain.
14. Do you use traders or collectors to sell your products? (please list the traders or collectors that you sell your products to)
15. Have there been any changes in whom (trader) you sell your products? If yes, explain
16. Please estimate your net income from your product for this year (2009). In Riels?
17. Have you observed a change in your income from your product from the previous years’
(2008) amount? Increased? Decreased? Or No change 18. Where is your source of raw materials extracting/collecting from?
19. Where do you sell your products prior to the project? Has this changed? If yes, explain.
20. Besides benefits from production (product); do you have other sources of income? Please specify? And how many members in your family contribute in earning a living? Please specify the works. Have there been any changes in the livelihood activities of family members over the past year? If yes, explain.
21. Right now, how is your living conditions been improved? Please describe your living condition (income, expend, saving, consuming, health, house improvement, cultivation, livestock, buying luxury good, buying agriculture tools, sending children to higher education, and so on...)
22. How has working in a group contributed to your ability to improve your quality of life?
23. If comparing your living condition before and after project implementation, how did you say: increase, decrease or stay the same? If increase or decrease how many percentages contributed to your whole income?
24. Do other people in the community think they have benefited from the project and if so, how? Did the project help your community? How?
25. Are you satisfied with this project implementation?
26. Do you have any suggestions/ comments?
- 24 -
Interview with Key Informants (MoWA/WDC/DoWA staff /local Authorities/NGO staff/external trainers involved in project?) Four KIs from each team
Introduction Welcome and thanks for your valuable time and allowing me to conduct an interview. Introduction of moderator/interviewer Explain why I am here! We need your valuable idea/expression, approximately 45 minutes!
1. What were the strong aspects of the project implementation?
2. What were the weak aspects of the project implementation?
3. What difficulties did you face in implementing of this project implementation?
4. How could the project implementation be improved?
5. If you were asked to implement this type of project again, do you feel confident that you
could do it?
6. Would you be willing to do it? Why or why not?
7. Do you feel confident that the MoWA/DoWA/WDC have the capacity to implement this process again?
8. What level of support for this project did you observe from the MoWA and from community?
9. What is a real benefit from the project implementation? Please describe..........................
10. Do you feel that services and assistance/support provided by project will be sufficient to justify all of the effort made by MoWA/DoWA/WDC?
11. How well did the project owner (MoWA) utilize mobilize and capitalize on the resources
provided by the project?
12. How do the staff of MoWA-PDWA and WDC manage to find trader for their producer group?
13. How the WDC will be managed, staffed and what services will be provided in the future?
14. What resources or commitment does MoWA have to transforming the centers from the
traditional vocational training model to an enterprise development orientated organization which provides demand driven services?
15. Do you have any suggestions and comments regarding this project?

- 25 -
Interview with Producer groups Each district conduct one FGD,
Therefore two FGDs in KCH and two FGDs in SRP Introduction Welcome and thanks for allowing us to conduct the interviews. Introduction of moderator/interviewer and note taker Explain why they are here! Stress confidentiality. Encourage all to participate; there are no right or wrong answers- just personal opinions. There does not need to be consensus. Tell participants about the estimated length of the discussion and how their information will
be used! As we are here why don’t we start to introduce ourselves, by starting from...
1. Could you please tell me about your situation before project is start implementing, how is your livelihood? please describe....................................And if comparing to now,
2. How has your living standard changed? Are you happy with this project? What is your
real benefit from the project activities? Please describe..................................................
3. You are now a member of producer group, what kind of products did your group members produced? Please specify?
4. What are benefits of being working as group? How is your group members work
together? How about benefits? Share knowledge and skills both inside and outside of the group?
5. What will you do to continue working together as group? How to strengthen your group?
6. Did you participate in the training sessions provided by the project? probe for
- What kind of training are you participated - do you obtaining the handout/materials - Which training course is useful? - Did you share your knowledge, gaining from training to others people
(relatives/neighbor)
7. How much you make money per month from the project if we compared to before project implementation?
8. In your household who manage money and make decision to buy equipment and facility for household? Wife or husband or parents or others? Have their been any changes in decision making patterns related to project interventions? (probe for decision making)
9. What level of support for this project did you observe from (probe for/from)
- MoWA - DoWA/WDC? - External trainers and - Local authorities
- 26 -
10. When the project is finished/no longer providing training and support , can you run this business by yourselves? Are you confident to operate this business? (probe for entrepreneurship/keep searching for creating more job)
11. Do you feel that services and assistance/support provided by project will be sufficient to
justify all of the effort made by MoWA/DoWA/WDC/local authorities?
12. How do you think about the Commune Producer Group Centers being constructed? What is the useful of these centers?
13. How will you be maintained, operated and managed these centers? What do you
perceive the benefits from these centers?
14. What do you think of new building WDC at Siem Reap and the upgraded WDC at Kampong Chhnang? What do you perceive the benefits of the WDC’s to be? Will you use the facilities?
15. Do you have any suggestions and comments regarding this project?
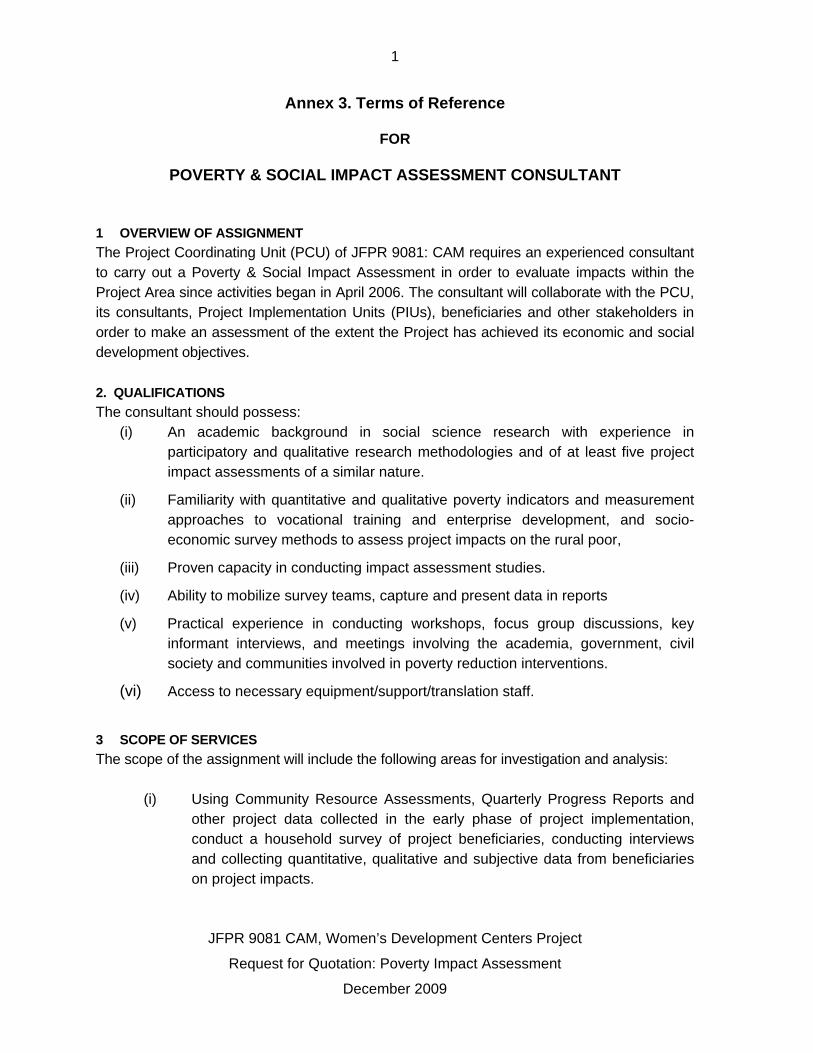
JFPR 9081 CAM, Women’s Development Centers Project
Request for Quotation: Poverty Impact Assessment
December 2009
1
Annex 3. Terms of Reference
FOR
POVERTY & SOCIAL IMPACT ASSESSMENT CONSULTANT
1 OVERVIEW OF ASSIGNMENT The Project Coordinating Unit (PCU) of JFPR 9081: CAM requires an experienced consultant to carry out a Poverty & Social Impact Assessment in order to evaluate impacts within the Project Area since activities began in April 2006. The consultant will collaborate with the PCU, its consultants, Project Implementation Units (PIUs), beneficiaries and other stakeholders in order to make an assessment of the extent the Project has achieved its economic and social development objectives. 2. QUALIFICATIONS The consultant should possess:
(i) An academic background in social science research with experience in participatory and qualitative research methodologies and of at least five project impact assessments of a similar nature.
(ii) Familiarity with quantitative and qualitative poverty indicators and measurement approaches to vocational training and enterprise development, and socio-economic survey methods to assess project impacts on the rural poor,
(iii) Proven capacity in conducting impact assessment studies.
(iv) Ability to mobilize survey teams, capture and present data in reports
(v) Practical experience in conducting workshops, focus group discussions, key informant interviews, and meetings involving the academia, government, civil society and communities involved in poverty reduction interventions.
(vi) Access to necessary equipment/support/translation staff.
3 SCOPE OF SERVICES The scope of the assignment will include the following areas for investigation and analysis:
(i) Using Community Resource Assessments, Quarterly Progress Reports and
other project data collected in the early phase of project implementation, conduct a household survey of project beneficiaries, conducting interviews and collecting quantitative, qualitative and subjective data from beneficiaries on project impacts.

JFPR 9081 CAM, Women’s Development Centers Project
Request for Quotation: Poverty Impact Assessment
December 2009
2
(ii) Provide a summary of pre and post project conditions of producer group members.
(iii) Quantify changes in the incomes of direct beneficiaries as a result of the transfer of technical knowledge and skills provided by the Project for improving design, processing, and production techniques for small-scale handicraft and food processing.
(iv) To the extent feasible, assess changes in consumption, quality of life and poverty status of direct beneficiaries.
(v) Assess the extent to which knowledge and skills acquired by direct beneficiaries through Project activities has been shared with others in their communities.
(vi) Prepare beneficiary profiles/case studies of at least 2 women in each project village, describing their history, their livelihoods, and the perceived benefits from their participation in the project, supplemented by quantitative data and photos.
(vii) Assess the Project’s effectiveness in terms of facilitating community interaction, mobilization, participation, social capital, and the degree of beneficiary buy-in to the achieve the objectives of the Project.
(viii) Assess the impact of the Project on gender attitudes and relations in the Project’s target areas.
(ix) Assess the relevance and effectiveness of the community-led approach to enterprise development in the Cambodian context.
(x) Assess the degree to which the Project has achieved its objectives in terms of deliverable outputs under each component as outlined in the Grant Implementation Manual.
(xi) Evaluate improvements in the capacity of MoWA technical staff engaged by the Department of Economic Development to deliver and sustain ongoing programs of a similar nature in the future.
(xii) Provide an assessment of the current and future effectiveness and sustainability of the Women’s Development Centers (WDC’s) at Siem Reap and Kompong Chhnang.
4. REPORTS
The required reports are:

JFPR 9081 CAM, Women’s Development Centers Project
Request for Quotation: Poverty Impact Assessment
December 2009
3
1) PSIA outline, 5 February, 2010
2) Draft Poverty & Social Impact Assessment no later than 22 February 2010.
3) Final report by 8 March 2010, in English and Khmer, 5 hard copies of each, with electronic files on CD-ROM.

JFPR 9081 CAM, Women’s Development Centers Project
Request for Quotation: Poverty Impact Assessment
December 2009
4
SCHEDULE C
COST ESTIMATES
POVERTY IMPACT ASSESSMENT
JFPR 9081 CAM Women’s Development Project
ITEM NO. DESCRIPTION UNIT QUANTITY UNIT RATE TOTAL COST
1 Training Survey Teams Day
2 Conducting Household Surveys Household
3 Transport Trips
4 Design Data Processing Program Entry
5 Reports (Khmer) Volume
6 Reports (English) Volume
7 Communications Lump Sum
Total
Lump Sum Payment
Sample Cost Estimate Sheet Insert Quantity unit Rates and totals – plus total lump sum for whole of the contract.
Annex 4. Research Team / DC Research
1. Mr. SO Dane, Team leader 2. Mr. SAO Botumroath, Team coordinator & Research Associate 3. Ms. Gaye Valerie Vergara Salacup, Research Consultant 4. Mr. CRUZ ABELARDO, advisor to DC Research team 5. Mr. Florante Verdjan T. Dagaas, Research Consultant 6. Mr. CHEA Chantha, Supervisor 7. Ms. KE Bopha, Enumerator 8. Ms. PRAK Bunna, Enumerator 9. Mr. SO Danann, Enumerator 10. Ms. CHHIN Kim Heng, Enumerator 11. Mr. REM Ngek, data entry and statistician 12. Ms. SIV Madeth, Enumerator 13. Ms. PRUM Chanmakara, Enumerator 14. Ms. UY Lida, Enumerator 15. Ms. KHENG Ratha, Enumerator 16. Mr. OUK Lino, Enumerator and data entry 17. Mr. Alan Pilgrim, Editor of Research team 18. Mr. Richard Pinkham, Professional editor