table of contents · 4.c. evaluation quality assurance 17 4.d. phases and deliverables 18 5....
TRANSCRIPT

Impact Evaluation of
WFP’s School Feeding Programmes
in Bangladesh (2001-2009)
Final Terms of Reference
TABLE OF CONTENTS
1. Background 3
1.A. Definitions 31.B. WFP’s Corporate Approach to School Feeding 31.C. Country Context: School Feeding in Bangladesh 41.D. WFP’s School Feeding Programme in Bangladesh 7
2. Reason for the Evaluation 11
2.A. Evaluation Rationale 112.B. Evaluation Objectives & Users 122.C. Key Questions 122.D. Scope & Limitations 132.E. Evaluation Stakeholders 13
4. Evaluation approach 14
4.A. Evaluability Assessment 144.B. Methodology 164.C. Evaluation Quality Assurance 174.D. Phases and Deliverables 18
5. Organisation of the evaluation 19
5.A. Evaluation Team 195.B. Roles and Responsibilities 205.C. Communication 205.D. Budget 20
Annex 2. Geographical Priorities for WFP in Bangladesh 23
Annex 3. Prior Evaluations of Relevance to School Feeding in Bangladesh 24
Annex 4. WFP Logical Framework for School Feeding 27
TOR Impact Evaluation School Feeding Bangladesh 2010 Final OE March 01, 2011
1

Acronyms
BMI Body Mass IndexCIDA Canadian International Development AgencyCP Country ProgrammeDFID Department for International DevelopmentDPs Development PartnersEB Executive BoardEFA Education for AllELP Essential Learning Package EMOP Emergency OperationEQAS Evaluation Quality Assurance SystemER Evaluation reportFAAD Food Assistance and DevelopmentFFE Food for EducationFFT Food for TrainingFFW Food for WorkGDF Gross Domestic ProductGFD General Food DistributionGoB Government of BangladeshIFS Integrated Food SecurityIR Inception ReportKPIs Key Performance IndicatorsMCH Mother-and-child-healthMDG Millennium Development GoalNDRI Natural Disasters Risk IndexNGO Non-governmental OrganizationOE Office of EvaluationPEDP Primary Education Development ProgrammePRRO Protracted Relief and Recovery OperationPRSP Povery Reduction Strategy PaperPSQLs Primary School Quality LevelsRD Rural DevelopmentRD/IFS Rural Development/Integrated Food SecuritySF School FeedingSFP School Feeding ProgrammeSMC School Management CommitteeSOWC The State of the World’s ChildrenTL Team LeaderTOR Terms of ReferenceUN United NationsUNDP United Nations Development ProgrammeUNICEF United Nations Children’s FundUSA United States of AmericaVGD Vulnerable Group DevelopmentWFP World Food Programme
TOR Impact Evaluation School Feeding Bangladesh 2010 Final OE March 01, 2011
2

1. Background
1.A. Definitions
1. WFP’s Office of Evaluation uses the following working definition of ‘impact’: “Lastingand/or significant effects of the intervention – social, economic, environmental or technical – on individuals, gender and age-groups, households communities and institutions. Impact can be intended or unintended, positive and negative, macro (sector) and micro (household).”1
2. For the purpose of this evaluation school feeding is understood as programmes that are implemented through schools as the food distribution point for school children and pre-school children. It can include wet and dry feeding distributed at any point in time during the school day (breakfast, mid-morning, lunch) and Take Home Rations.
1.B. WFP’s Corporate Approach to School Feeding
3. Overview: The world community has regularly re-stated its commitment to education as a human right. Access to and quality of education are also regarded asan essential plank for poverty reduction: human capital – education, knowledge, skills, access to and understanding of information – is part of the livelihoods approach that recognizes poverty as more than a lack of income. Education is embedded in the Millennium Development Goals: MDG 2 (achieve universal primaryeducation) and MDG 3 (promote gender equality and empower women, with targetsfor eliminating gender disparity in education). School feeding also relates to MDG 1 (eradicate poverty and hunger). A series of multilateral events since 1990 made explicit linkages between education, nutrition and health and have established action plans and special funds.
4. School feeding has been one of WFP’s programme areas since its establishment in 1963.2 By 1993, pre-primary and primary school feeding accounted for more than half of WFP’s development commitments.3 Between 2006 and 2008, as the largest implementer of school feeding programmes in the world, WFP invested US$ 475 million (14% of its total budget) in some 70 countries, reaching an average of 22 million schoolchildren, about half of whom were girls. School feeding beneficiaries4 accounted for around 20% of total WFP beneficiaries.
5. WFP’s School Feeding Handbook 1999 recognised that there was insufficient evidence that school feeding addresses malnutrition and therefore explicitly focused on educational outcomes: increasing enrolment and attendance, including reducing gender disparity, and improving learning outcomes through enhancing ability to concentrate). Take-Home Rations, particularly, aimed to reduce the opportunity cost of sending children to school. School feeding was at the core of strategic priority/objective 4 in WFP’s Strategic Plans 2004-2008 and 2006-2009 and was clearly aligned with MDG 2 and MDG 3.
6. New Strategic Plan: In WFP’s latest strategic plan (2008-2011), school feeding is embedded in a broadened Strategic Objective 4, which aims to reduce chronic hunger and under-nutrition. It sets a goal of increasing levels of education and foresees school feeding addressing short-term hunger, and thus improving learning abilities, providing a safety net by ensuring children attend school both through food in school and take-home rations, and addressing micro-nutrient deficiencies. By using locally produced foods, school feeding is also expected to have a positive impact on local markets. Through a positive contribution to learning results and school completion, it may also have an effect on breaking the inter-generational cycle of hunger.
1 Based on definitions used by ALNAP, OECD/DAC and INTRAC.2 School Feeding Handbook, WFP, 1999 referencing FAO Conference Resolution 1/61 of24 Nov.1961. 3 Ibid. 4 Excluding pre-schoolers. WFP Annual Performance Reports 2006 through 2008TOR Impact Evaluation School Feeding Bangladesh 2010 Final OE March 01, 2011
3

7. The WFP School Feeding Policy 20095 sets six objective areas, that positions school feeding as a safety net within broader social protection systems. The six objective areas are: education; nutrition; gender equality in education; value transfer to households; a platform for wider socio-economic benefits; and capacity development for governments. Key indicators are established for outcomes and impact in each of these areas.
8. The policy envisages various models for school feeding with different degrees of government ownership. It introduces 8 Standards Guiding Sustainable and Affordable School Feeding Programmes, that guide phased transition from programmes that rely mostly on external (WFP) funding and implementation to those that rely on national funding and implementation. At a recent strategy workshop, a range of possible models for school feeding were developed that describe how WFP support relates to the government’s own school feeding programme, as shown in Figure 1.
Figure 1. School Feeding Models6
1 2 3 4 5No government programme
Government.programme is planned but not yet implemented
Government programme is running in parallel to WFP
Full government funding with WFP providing the service
National funding and implementation
Countries RwandaSierra Leone
Tanzania
BurundiMalawi
BeninZambiaGhanaMali
El SalvadorEcuador
Chile
1.C. Country Context: School Feeding in Bangladesh
9. General Development and Food Insecurity: Bangladesh is ranked 146 out of 177 countries on the UNDP Human Development Index, with a population of 157.8 million. A high percentage of the population lives below the poverty line with 49.6% living on $1.25 or less per day and 81.3% living on less than $2 per day. Bangladesh is rated 123 of 155 countries on the gender development index and second to last (108 of 109 countries) in terms of gender empowerment7. However, significant progress towards poverty reduction has been made. For example, the annual per capita Gross Domestic Product (GDP) has almost doubled over the past 20 years, and gender disparity has been reduced in primary and secondary education. UNICEF reports that Bangladesh is among only six countries in the world that have reduced by half or more their child mortality rate since 1990 (from 151/1000 in 1990 to 65 in 2007)8. Bangladesh has the third largest number of the world’s hungry people after India and China. An estimated 28 million ‘ultra-poor’ people survive on less than 1,805 kilocalories per day9. Malnutrition rates in Bangladesh are among the highest in the world. Approximately 50% of children under five years of age are stunted and underweight. Malnutrition among women has long been recognized as a problem of significant magnitude. 45.5% of mothers of children under five years of age have a body mass index (BMI) less than 18.510. Bangladesh had a Global Hunger Index score of 24.7 in 2009. Although this reflects a reduction from 35.9 in 1990, it is still within the category of “alarming”11. Bangladesh is also ranked first in natural disaster risk of 15 countries rated as
5 WFP/EB.2/2009/4-A6 PowerPoint Presentation for the WFP School Feeding Strategy Workshop, Cape Town,May 20097 UNDP 2009 Human Development Report8 UNICEF Child Survival in Bangladesh Fact Sheet February 20109 WFP Annual Report 2006 10 Food Security Atlas of Bangladesh 200411 Global Hunger Index 2009 IFPRI et alTOR Impact Evaluation School Feeding Bangladesh 2010 Final OE March 01, 2011
4

subject to "extreme risk". Over the last 30 years Bangladesh has seen 191,637 deaths as a result of major natural disasters12.
10. Education: Bangladesh has made considerable progress in recent years in expanding basic education. The overall adult literacy rate increased from 29% in 1981 to 54% by 2008. The gender gap in basic education is narrowing. In 1994, 35% more men than women were literate, but by 2008 that difference had declined to 18%13. School enrolment at the primary level increased from 59% in 1982 to 96%in 1999, although it had declined to 85% by 200814. Gender parity has been achieved at both primary and secondary levels15.
11. As shown in the following table, Bangladesh slightly exceeds the average for the South Asia Region for total net attendance nationally, although not in urban or slumschools, with slum schools falling far below it for both boys and girls. Bangladesh exceeds the South Asia Region average for girls attendance except in the case of slum schools. Completion rate is below the South Asia Region average but rate of transition to secondary school exceeds it. Differences between Divisions within Bangladesh are also shown.
Table 1. Education Indicators
Net Attendance Ratio16Completion
Rate17Rate of Transition toSecondary School18
Boys Girls Total Total Total
Reference BenchmarksMDGs 100 100South Asia Region 83 79 81 79 84MICS 2006
National 78.9 83.7 81.3 46.7 89.1
Urban 79.0 83.0 80.9 53.6 91.3
Rural 79.0 84.2 81.5 43.8 88.3
Non-slum 81.3 81.2 81.2 53.8 93.2
Slum 45.8 59.4 52.3 32.5 84.5Division
Barisal 80.9 87.3 84.1 52.1 87.8
Chittagong 80.9 85.7 83.2 44.4 91.8
Dhaka 75.6 81.1 78.3 44.3 89.1
Khulna 84.9 89.3 87.0 53.3 91.9
Rajshahi 78.1 81.9 79.9 47.6 87.2
Sylhet 79.5 83.9 81.7 44.3 82.6
12. Figure 2 below shows Bangladesh student attainment profiles by grade level according to age, gender, and urban-rural area. The differences between the age cohorts illustrates how the older generation of rural women had a much lower attainment rate than the current generation. In addition, the differences between
12 Natural Disasters Risk Index (NDRI),Maplecroft Natural Disasters Series 201013 UNICEF Statisticshttp://www.unicef.org/infobycountry/bangladesh_bangladesh_statistics.html December201014 Asian Development Bank Statistics www.adb.org/statistics December 201015 Bangladesh PRSP, 2005; Bangladesh Human Development Report 2000; Finan etal., 200116 SOWC 2004 & 2009 Special Edition. NAR year of ref: 200217 World Bank Ed Stats. Year of ref: 2000 & 2006. 18 EFA 2005 & 2010. Year of Ref: 2000 & 2005. Regional data is expressed in median.School year ending in 2006
TOR Impact Evaluation School Feeding Bangladesh 2010 Final OE March 01, 2011
5

the rural-urban and male-female have been reduced in the youngest cohort as compared to the older, thus suggesting greater equality. For all cohorts, the proportion that completes additional education decreases between Grade 5 and 6 (normally between ages 10-11 years) as children move into secondary school.
Figure 2. Attainment Profiles
13.
Government strategy: The first Government of Bangladesh Poverty Reduction StrategyPaper (PRSP) was completed in 2005. It included “quality education” as one of eight priority areas for attention. Recommendations for quality improvement included appointment of qualified teachers, arranging modern in-service training, improving the teacher-student ratio, introducing an effective monitoring, supervision and evaluation mechanism, developing the curriculum, and activating the School Management Committee (SMC). School feeding did not feature prominently in the 2005 PRSP, but the paper said that consideration should be given to introducing a school-feeding programme as a means of improving child nutrition.
14. The second Poverty Reduction Strategy Paper was completed in 2009. In that document, education features as a part of the knowledge base for human resourcesdevelopment. The report states that “The country’s education system comprising primary, secondary, tertiary, and non-formal education will be developed to build a knowledge-based society.” Tentatively in June 2011, the government will launch its own school feeding programme in poverty-prone areas. Initially, 1.2 million primaryschool children will receive fortified biscuits, replicating the WFP model. The government plans to allocate US$90 million from its own resources, over a period ofthree years for the implementation of the programme.
15. “Education for All” the National Plan of Action (II) 2003-2015 prepared by the Ministry of Primary and Mass Education refers to the School Feeding Programme as a pilot supported and coordinated by WFP, that would be expanded as proposed in the PRS. The plan includes an objective of developing and implementing a “phased school feeding program for primary education based on nutritionally-relevant meal content, cost-effectiveness, decentralized supply chains and a management strategy which avoids vesting responsibilities on teachers”.
16. The National Plan Of Action For Children 2005-2010 prepared by the Ministry of Women and Children Affairs also refers to the school biscuit programme without
TOR Impact Evaluation School Feeding Bangladesh 2010 Final OE March 01, 2011
6

giving details. The National Strategy for Anemia Prevention and Control in Bangladesh identifies children aged 2-5 and school aged children aged 5-11 as medium risk group but also states that these are not covered by the National Nutrition Programme. These groups should be targeted if resources are available through iron-folate or multiple micronutrient supplements.19
17.The Government of Bangladesh carried out its own Food for Education (FFE) program from 1993 to 2002. The FFE program provided a free monthly ration of riceor wheat to poor families if their children attend primary school. FFE covered about 27% of all primary schools and enrolled about one-third of all primary school students. FFE beneficiary students accounted for about 13% of all students in primary schools in Bangladesh. The FFE programme was brought to an end becauseof concerns on the part of the government and donors about ‘leakages’ – the diversion of subsidized food rations away from the intended recipients. It was replaced by the Primary Education Stipend programme (a cash-for-education programme)20. The Government also carries out the Female Stipend Program (FSP),created in 1982 in Bangladesh to help increase the enrolment and retention of girls in secondary schools21. The Primary Education Stipend Project (Phase-II) runs from 2008 to 201322.
1.D. WFP’s School Feeding Programme in Bangladesh
18. WFP’s History in Bangladesh: WFP has been providing food assistance to Bangladesh since 1974. Initially started as a welfare relief operation in feeding centres, WFP assistance gradually evolved to rehabilitation (1979 -1987) and then development interventions (from 1988).
19. Figures 3 and 4 below show the evolution of beneficiaries and metric tons for Vulnerable Group Distribution (VGD) Rural Development/Integrated Food Security (RD/IFS) and School Feeding Programmes (SFP) from 1975 to 2005.23 The first school feeding interventions began in 2001.
Figure 3. Trend of WFP Programme Participants/Beneficiaries 1975-2005
19 National Strategy for Anemia Prevention and Control in Bangladesh Feb 2007Institute of Public Health Nutrition, Ministry of Family Health and Welfare20 Ryan, J.G. and Meng, X. 2004. The contribution of IFPRI research and the impact of the Food for Education program in Bangladesh on school outcomes and earnings. Impact Assessment Discussion Paper No. 22. International Food Policy Research Institute: Washington, DC. http://impact.cgiar.org/21 Raynor, Janet, Wesson, Kate (2006). The Girls’ Stipend Program in Bangladesh. Journal of Education for International Development 2:2. Retrieved from http://www.equip123.net/JEID/articles/3/Girls’StipendPrograminBangladesh.pdf on December 2010.22 Ministry of Primary and Mass Education, Government of the People's Republic of Bangladesh Retrieved from http://www.mopme.gov.bd/index.php?option=com_content&task=view&id=426&Itemid=492 December 201023 WFP’s 30 Years in BangladeshTOR Impact Evaluation School Feeding Bangladesh 2010 Final OE March 01, 2011
7

Figure 4. Trend of WFP Resources MT 1975-2005
20. Over time, WFP Bangladesh increased its emphasis on targeting malnutrition. The first fortification programme began in 2001 with the provision of micronutrient fortified biscuits through the SFP. In 2002 vitamin and mineral fortified wheat flour (“atta”) was integrated into the VGD programme.
21.WFP School Feeding in Bangladesh: WFP’s school feeding programme has evolved over time, as shown in Table 2 below. It began as a pilot in 2001 at the request of the Government of Bangladesh (GOB), as a complement to the GOB’s Food for Education Programme. WFPs school feeding programme provided supplementary feeding to school children in geographically targeted food insecure areas24. The nutritional supplement was in the form of fortified biscuits given daily to children attending government-managed and NGO-managed primary schools in targeted areas. In addition to school feeding in its Country Programmes, WFP has also fed school children during times of emergency through its EMOPs.
22. School feeding is carried out in partnership with the Government of Bangladesh and UNICEF. Local NGOs are the implementing partners. Donors to the Country Programme include Australia, DFID, CIDA, France, European Commission, Japan, UNDP, USA and others. The Government of Bangladesh provides in kind support.
23. The evolution in the number of beneficiaries for school feeding as compared to the total portfolio is shown in Table 2 below. School feeding was the second largest activity, having reached approximately 14% of total beneficiaries. The increase
24 School Feeding in Vulnerable Rural Areas and Urban Slums in Bangladesh: ABaseline Report To The World Food Programme, Bangladesh October 2002.TOR Impact Evaluation School Feeding Bangladesh 2010 Final OE March 01, 2011
8

from 2003 to 2004 was due to the scaling up of what had previously been a pilot activity.
Table 2. Number of Beneficiaries by Activity25
Activities 2002 2003 2004 2005 2006 2007 2008 2009
Supplementary Feeding 140,334 20,600 491,861 175,738 204,961 32,804 117,470 61,962
School Feeding 356,018 435,062 1,206,212 1,309,869 591,358 571,041 1,103,229 1,559,004
GFD 0 014,176,41
8 4,089,000 3,747,010 8,247,371 3,485,545 850,000
Cash & Vouchers 0 0 0 0 0 0 0 307,855
FFT 187,848 214,279 254,647 275,700 782,602 8,500 410,960 282,787
FFW 95,205 60,212 110,183 60,100 39,200 0 75,857 61,053
MCH 13,972 10,980 17,190 89,349 16,290 1,196 65,687 20,048
Total 793,377 741,13316,256,51
1 5,999,756 5,381,421 8,860,912 5,258,748 3,142,709
School Feeding (% total) 45% 59% 7% 22% 11% 6% 21% 50%
24. School feeding took place in four Emergency Operations and in two Country Programmes described in Table 3 below. Protracted Relief and Recovery Operations supporting refugees from Myanmar begun in 2002 provided school feeding to smallnumbers of beneficiaries (from 4,400 to 7,585 in total). Since the PRROs reached small numbers and a different population, they are not included in the evaluation.
Table 3. Projects with School Feeding in Bangladesh 2000-2009
Planned Actual
Project No.
TypeStart Date
End Date
End Date
TitleApproved Budget
MT
6317.0 EMOPDec 2000
Nov 2003
Nov 2003
Assistance to flood affected people in Southwest Bangladesh 40,074,126 109,829
10059.0 CPJan 2001
Dec 2005
Dec 2006
Country Programme-Bangladesh 2001-2005 209,888,160 769,703
10380.0 EMOPAug 2004
Aug 2005
Nov 2005
Assistance to Flood-Affected People in Bangladesh 73,688,243 191,075
10715.0 EMOPNov 2007
May 2008
Feb 2009
Food Assistance to Cyclone Affected Populations in Southern Bangladesh 78,836,981 99,624
10410.0 CPJan 2007
Dec 2010
Country Programme-Bangladesh 2007-2010 297,298,089 650,538*
10788.0 EMOPNov 2008
Jul 2009
Jul 2010
Emergency safety net for vulnerable groups affected by high food prices and natural disasters inBangladesh 182,087,800 257,261
25. The beneficiaries reached by WFP’s programmes are shown in the table below. Approximately 50% of beneficiaries were girls.
Table 4. Children Receiving School Meals Planned and Actual
Children Receiving School Meals - Planned and Actual 2001-2009
ProjectCategory
ProjectNo. Year
PLANNED ACTUAL
Total Boys Girls Total % girls% Actual
v Planned
EMOP 6317.0 2001 175,000 89,780 85,220 175,000 49 100
EMOP 6317.0 2002 356,018 178,009 178,009 356,018 50 100
25 Data source DACOTA, within which data is not available for 2001. The table doesnot include projects with refugees (PRRO 10045.1/.2/.3/.4).
TOR Impact Evaluation School Feeding Bangladesh 2010 Final OE March 01, 2011
9

EMOP 6317.0 2003 435,062 213,187 221,875 435,062 51 100
CP 10059.02004
600,000 300,000 300,000 600,000 50 100
EMOP 10380.0 800,000 303,106 303,106 606,212 50 76
CP 10059.02005
805,356 399,068 406,288 805,356 50 100
EMOP 10380.0 800,000 250,113 254,400 504,513 50 63
CP 10059.0 2006 766,000 291,908 299,450 591,358 51 77
CP 10410.0 2007 599,200 279,810 291,231 571,041 51 95
CP 10410.02008
600,000 269,500 280,500 550,000 51 92
EMOP 10715.0 569,766 271,082 282,147 553,229 51 97
CP 10410.0
2009
600,000 286,187 286,910 573,097 50 96
EMOP 10715.0 450,000 215,347 228,387 443,734 51 99
EMOP 10788.0 600,000 265,665 276,508 542,173 51 90N.B. The above table does not include projects with refugees (PRRO 10045.1/.2/.3/.4)
26. The following table shows the proportion of school feeding beneficiaries reached by the different types of projects over the years.
Table 5. School Feeding Beneficiaries by Programme Type
EMOP Country Programme
Total # % of total # % of total
2001 175,000 175,000 100%
2002 356,018 356,018 100%
2003 435,062 435,062 100%
2004 1,206,212 606,212 50% 600,000 50%
2005 1,309,869 504,513 39% 805,356 61%
2006 591,358 591,358 100%
2007 571,041 571,041 100%
2008 1,103,229 553, 229 50% 550,000 50%
2009 1,559,004 985,907 63% 573,097 36%
27. WFP’s SFP provides each child with a packet of biscuits for each day of school attendance (up to six days per week). A packet of biscuits costs approximately 6 cents but provides the child with 300 kilocalories and a range of micronutrients contributing about 75% of the daily requirement of vitamin A, zinc, folic acid and iron. In addition to education goals, the SFP also aims to improve the micronutrient status of pre-primary and primary school aged children who receive the snack. Furthermore, it also aims to improve the local level management of primary education and increase the number and role of females in School Management Committees. Currently, 100% of the high energy biscuits used in the school feedingprogramme are manufactured in Bangladesh, thus contributing to local economic development as well as education goals.
28. Approximate coverage of Districts is shown in the table below. Two districts, Kurigram and Gaibandha were covered by both CPs and an emergency intervention and for the longest period of time (approximately 8 years). Jhenaidah and Lalmonirhat Districts were covered for approximately 5 years and by both EMOP and CP. EMOP 10380 that took place from 2004-2005 is not included in the table because it’s coverage was widespread.
29. A map of WFP priority geographic areas for 2007-2010 is included as Annex 2.
TOR Impact Evaluation School Feeding Bangladesh 2010 Final OE March 01, 2011
10

Table 6. Geographical Coverage of Programmes with School Feeding 2000-200926
Division District EMOP 63172000-2001
EMOP 107152007-2008
EMOP 107882008-2009
CP 100592002-2006
CP 104102007-2010
Appr YrsTotal
Khulna Satkhira X X 2
Khulna Jessore X 1
Khulna Jhenaidah X X 5
Barisal Barisal X 1
Barisal Bhola X 1
Barisal Patuakhali X X 2
Barisal Borguna X 1
Barisal Jhalokathi X X 2
Barisal Pirojpur X X 2
Khulna Bagherat X 1
Khulna Khulna X 1
Barisal Barguna X 1
Rajshahi Kurigram X X X 8
Rajshahi Lalmonirhat X X 5
Rajshahi Nilphamari X 1
Rajshahi Rangpur X 1
Rajshahi Gaibandha X X X 8
Dhaka Kishoreganj X 3
Dhaka Netrokona X 3
Khulna Chuadanga X 4
Dhaka Dhaka (urbanslum)
X 4
Khulna Merherpur X 4
2. Reason for the Evaluation
2.A. Evaluation Rationale
30. Systematic analysis of the WFP school feeding portfolio globally and application of the following criteria led to selection of Bangladesh as one of five countries selected for impact evaluation of school feeding in 2010-2011. The criteria were: i) minimum 7 years duration and still ongoing in 2009; ii) more than 300,000 beneficiaries per year; iii) a sample of different feeding modalities; iv) relative priority in the light of other planned WFP evaluations (&/or recently conducted ones) in the country; v) timeliness for corporate learning – maximising synergy with WFP/World Bank initiative on ‘sustainable school feeding’, integrating school meals into a larger context of education and social safety nets; and vi) Country Office and Regional Bureau interest in the evaluation being conducted.
31. Furthermore, because Bangladesh has been employing a micro-nutrient biscuit modality exclusively, it was included in the portfolio of impact evaluations of school feeding to enable impacts associated with micronutrient fortification to be assessed, and to increase understanding of the benefits of biscuits in comparison with other delivery modalities.
2.B. Evaluation Objectives & Users
32. Like all evaluations at WFP, this evaluation serves accountability and learning purposes. The group of impact evaluations all have similar objectives:
26 Sources: For EMOPs (Project Document)For CP 10059.0 (Coates, J., & Hassan, Z.. 2002. School Feeding in Vulnerable Rural Areas and Urban Slums in Bangladesh: A Baseline Report to the WFP Bangladesh) For CP 10410.0 (Surch. 2007. Baseline SurveyReport on Food For Education Activity) Note that for EMOP 10788 Districts indicated are those most affected by flooding.
TOR Impact Evaluation School Feeding Bangladesh 2010 Final OE March 01, 2011
11

a.evaluate the outcomes and impact achieved so far from the various modalities that have been used in relation to intended educational, gender, and capacity development objectives stated in project documents; and
b.evaluate outcomes and impact achieved in relation to WFP’s new nutrition andvalue transfer policy objectives (even though these were not explicitly included in the programme design) and assess the extent to which the programme has met, or has the potential to meet, these;
c. evaluate outcomes and impacts that were not explicitly intended on each of the above dimensions; and
d. identify changes needed to WFP operations in order to fulfil potential to contribute optimally to development objectives and the objectives of the current WFP Strategic Plan and School Feeding Policy 2009.
33. The programmes cannot be held accountable on point (ii) for achievement of objectives that were not included in the programme design. However, some unexpected and/or less explicit outcomes may already have been achieved towardsthese objectives. These should be recorded for learning purposes, in Bangladesh and possibly more widely. For this reason - in evaluation jargon – the evaluation will be primarily 'formative', rather than 'summative'.
34. The main intended users of the evaluation are the WFP Country Office and its counterparts within the Ministry of Primary and Mass Education. As co-implementing partners of certain aspects of the programme, UNDP (capacity development), UNESCO (non-formal education), WHO (de-worming) and UNICEF (concerning the Essential Learning Package) are expected to find the evaluation useful.
2.C. Key Questions
35. A number of assessments have already been carried out that relate directly to school feeding in Bangladesh (see Annex 3 for a list of related evaluations). Two outcome or impact level assessments were conducted of WFP’s school feeding programmes, one in 2004 and the most recent in 201027. These assessments analysed the effects of WFPs school feeding programmes on core educational and nutritional indicators using a difference in difference approach that compares programme results against both baseline and control groups.
36. The 2004 assessment concluded that WFPs school feeding increased enrolment and attendance and reduced drop-out rates; the fortified biscuits were largely in addition to children’s normal diet and improved their BMI.
37. Results from the 2010 study show beneficial outcomes on school level average enrolment counts, the rate of attendance, and dropout behavior. School feeding wasfound to be effective in retaining the already enrolled students in school, however, it did not increase the rate of school enrolment among school-age children.
38. The prevalence of anemia in FFE-assisted primary schools was less than half ofthe non-assisted schools. The BMI and worm infestation statistics suggest that thechildren from the entire program districts fare better than their counterparts fromthe control districts.
39. There was no clear evidence of the FFE impact on cognitive ability and rate of success in achievement tests for children in different grades of primary schools.
40. The evaluation will review the data from these previous studies to ensure that the evaluation does not duplicate surveys already conducted on core indicators, rather it is expected that the focus will be on deepening understanding of several aspects, as outlined in the key questions below.
27 Impact of Feeding Children in School: Evidence from Bangladesh 2004 A. U. Ahmedand Food for Education Activity of the World Food Programme: Outcome Survey Report2010 S. MoutafaTOR Impact Evaluation School Feeding Bangladesh 2010 Final OE March 01, 2011
12

Q1. Outcomes and impacts beyond primary education into seconday school,wider social benefits and other areas including: a) primary completion rate (anddrop outs throughout the primary school years), b) transition to secondary education;c) greater success in secondary level education; d) nutrition and health; and e) widerlivelihoods benefits.
Q2. Factors that have affected impact including a) the different types of schools(formal and non-formal, government and non-government) b) seasonal labor,economic strata of families, or/and gender aspects etc c) Essential Learning Packageinterventions d) other WFP interventions in the targeted areas such as mother andchild health and e) class size (teacher/student ratio) and other factors related toeducation quality.
Q3. Alignment of WFP’s targeting strategy and school feeding modality withGovernment policy priorities and activities in the education sector (and other sectors),other WFP activities in Bangladesh, and activities of other partners.
Q4. Changes that could be made in strategy and programme design toaddress findings emerging from analysis in Key Questions 1, 2 and 3.
2.D. Scope & Limitations
41. The evaluation will not include WFPs work with refugees in the Protracted Relief and Recovery Operations, since this targets a non-Bangladeshi, more transient population, with different overall objectives and thus would require a different evaluation approach and be different to compare with the other school feeding activities in the country. Furthermore, the numbers of beneficiaries of the school feeding in refugee camps was small (from 4,400 to 7,585 in total). For these reasons the evaluation will not include the PRROs.
42. The previous outcome/impact evaluations were done of WFPs Country Programmes, not the Emergency Operations. Furthermore the EMOPs are short duration interventions that would be expected to have different impacts than longerterm interventions. Although in some cases (as shown in Table 6 above, there appears to be overlap between districts receiving emergency assistance and those receiving Country Programme assistance.
43. Therefore, in order to enable conclusions to be drawn from similar interventions, and to build upon previously conducted baselines and evaluations, a thorough assessment will be carried out during the Inception Phase of the feasibility of evaluating both emergency and longer term interventions in the same assessment, or if the evaluation should focus on the two Country Programmes that took place between 2001 and 2010 or on districts where WFP has had a longer terms presencethrough a combination of Country Programmes and Emergency Operations.
2.E. Evaluation Stakeholders
44. There is a fairly large and diverse group, who have an interest in the education sector and the actual and potential contribution of school feeding as one tool (amongst many) to contribute to the efficiency of the education sector as well as to nutrition, food security and social protection. They have an interest in evidence from this evaluation about the impact and outcomes of school feeding to inform future policy and strategy. There is also a smaller group – largely within the wider group - who also have a direct interest in the WFP school feeding programme itself (e.g. programme partners).
45. Representatives of all stakeholders in the narrower group and a selection of stakeholders from the wider group will contribute to the evaluation as key informants. A detailed list of stakeholders in each category will be drawn up during the Inception Phase with the assistance of the Country Office. Nevertheless, the following are already evident:
Directorate of Primary Education under the Ministry of Primary and Mass Education is the main partner for the implementation of the school feeding component
TOR Impact Evaluation School Feeding Bangladesh 2010 Final OE March 01, 2011
13

NGO service providers are involved in the implementation of the activity
Directorate of Primary Education officials at the district and subdistrict levels coordinate local implementation between WFP and local NGO service providers
Head teachers and school teachers have responsibilities for storage of the biscuits at schools and their distribution in the classrooms
School Management Committees support the School Feeding Activities at school and community levels
The Ministry of Health and Family Welfare would have an interest in the nutritional and health outcomes.
Bangladesh international organizations (UN, NGO and other) that are involved in related activities and support. UNICEF is a close collaborator with WFP on the school feeding programme, and WHO is a partner for deworming.
Donors
Biscuit manufacturing companies
WFP Bangladesh Programme Officers and senior management responsible for the School Feeding Programme
WFP Headquarters and Regional Bureau responsible for providing programme support to WFP School Feeding activities
WFP Headquarters School Feeding Policy staff
School children and their families/households
46. The TOR is based on school feeding impact evaluations carried out in Kenya, Gambia, Cote d’Ivoire and Cambodia through which in-depth processes of engagement were carried out with WFP School Feeding Policy and Programme staff at Headquarters. Consultations also took place with Bangladesh Country Office and the draft TOR will be discussed with the Country Office and Headquarters staff in the School Feeding programme and policy units. Discussions will take place with in-county stakeholders during the Inception Mission and changes incorporated at that time as needed.
4. Evaluation approach
4.A. Evaluability Assessment
Evaluability is the extent to which an activity or a programme can be evaluated in a reliable and credible fashion. It necessitates that a policy, intervention or operation provides: (a) a clear description of the situation before or at its start that can be used as reference point to determine or measure change; (b) a clear statement of intended outcomes, i.e. the desired changes that should be observable once implementation is under way or completed; (c) a set of clearly defined and appropriate indicators with which to measure changes; and (d) a defined timeframe by which outcomes should beoccurring.
47. Until 2009, WFP did not have a formally adopted “logical framework for school feeding” presented in one document. However, the WFP Strategic Results Framework gives important guidance under Strategic Objective 4 Reduce Chronic Hunger and Undernutrition, for which Outcome 4.2 concerns school feeding directly.The 2009 WFP School Feeding Policy includes a logical framework which carries forward indicators previously used for education and nutrition outcomes28 and adds more - see Annex 4.
28 In the Indicator Compendium (2006-7), 2005, and the 2007 study Food forEducation Works: A Review of FFE Programme Monitoring and Evaluation 2002-2006,Aulo Gelli for WFP. The latter was commissioned by WFP, although never formallyadopted. It also presented a logic model and programme theory.TOR Impact Evaluation School Feeding Bangladesh 2010 Final OE March 01, 2011
14

48. Educational Outcomes: WFPs logical framework for the school feeding components includes net enrolment rate in primary education as the main indicatorat outcome/impact level. Other indicators include increased attendance, reduced drop-out and enhanced learning.
49. Two baseline surveys were undertaken for WFP Bangladesh’s School Feeding Programme. A baseline study was conducted by Friedman School of Nutrition Science and Policy of Tufts University in collaboration with a Bangladeshi company DATA in May and June of 2002. A total of 192 schools were sampled using intervention and control schools, in urban and rural areas in seven districts. The study used primarily school surveys, and discussions with teachers and students.
50. A second WFP baseline study was undertaken by Surch, a Bangladeshi company in 2007 at the beginning of the new Country Programme. The study covered 140 sample schools and 1,454 households around the schools. In addition to school surveys, students were given an achievement test and household surveys assessedsuch things as children’s involvement in work activities, household head education level, household income, and knowledge of worm infestation and night blindness prevention.
51. Both of these studies were followed up with evaluations at the outcome and/or impact level of enrolment, attendance, dropout and learning.
52. School surveys were also undertaken in 2005, 2006 and 2007 by the Second Primary Education Development Programme by the Ministry of Primary and Mass Education. The information was intended to serve as benchmark data for various indicators that were agreed between the Government of Bangladesh and (Development Partners (DPs) for monitoring the progress of PEDP-II activities. Theseindicators were divided into two groups, namely Key Performance Indicators (KPIs) and Primary School Quality Levels (PSQLs). KPIs are broader system level indicators whereas the PSQLs are school level physical inputs reckoned to provide an appropriate and enabling teaching-learning environment in the schools for quality primary education.
53. Nutritional Outcomes: Since the WFP Bangladesh school feeding programme has always been based on high energy micronutrient rich biscuits, a nutritional objective has been implied although not explicit in the programme documents. The biscuit would be expected to contribute to improved nutritional status and health byreducing micronutrient deficiencies, especially when taken in combination with a deworming programme. However, the 2002 baseline survey was not able to collect data on students’ iron or vitamin A status. Although it was recommended that the information be collected in future, the second baseline did not collect this data either. However, both studies did collect information on BMI. The 2010 assessmentanalyzed BMI, anemia and worm infestation in intervention schools as compared to control.
54. Value Transfer Outcomes: Value transfer outcomes provide a challenge in that WFP has only very recently adopted this objective for school feeding. The team will use the new logic model in the new WFP School Feeding Policy (2009) as far as possible to guide the evaluation in generating evidence of unplanned results already achieved and assessment of future potential. This is not ‘evaluable’ for accountability purposes, but can be used for learning purposes. The evaluation will aim to increase understanding of household behaviour in terms of time or resourcessaved and its allocation to investment in productive activities.
55. WFP Bangladesh’s School Feeding Programme has long aimed to use school feeding to stimulate improvement in school management and infrastructure. Specifically in order to be eligible for the SFP, schools were required to provide arsenic free wells on site or nearby and a sanitary latrine (preferably separate facilities for girls and boys). The baseline found that 8% of intervention schools had no sanitary latrine and 87.6% had no confirmed sources of arsenic free ground water.
TOR Impact Evaluation School Feeding Bangladesh 2010 Final OE March 01, 2011
15

56. WFP Bangladesh also aimed to improve the viability of School Management Committees. Baseline data indicated that only 1 of the 192 schools surveyed did not have a SMC and most (77%) had convened at least 8 times the previous year. 98% of these committees had a female member but only 34% had at least two females. Female members attended fewer meetings than males (females attended 66.6% of meetings as compared to 76% for males). School Management Committees received training in the purpose and management of the SFP.
57. The costs and cost effectiveness of different delivery modalities for school feeding were analysed in 2009. The study found that the standardised yearly average school feeding cost per child was $48 USD, whereas the yearly costs per child were lowest at $23 USD for biscuit programmes.29 The lowest costs of any programme studied were $15 USD in the Bangladesh Country Programme, whereas the highest were also in Bangladesh $25 USD in the emergency operation, where the urgency of the situation precluded options for purchasing commodities at the most favorable price.
4.B. Methodology
58. Mixed Methods: This impact evaluation takes a mixed methods approach, which makes optimum use of evaluation resources and possibilities to support evaluative assessments and show developments over time in order to provide evidence for well-informed decision making in as timely a manner as possible. It will draw on the body of existing data and research as far as possible.
59. The approach has four ‘legs’ (main methods), which complement each other. Data from the ‘legs’ will be systematically triangulated to verify and deepen insights. The combination and balance between these four different methods will bedecided by the Evaluation Team in the Inception Phase, selected as appropriate to purpose and context. They are:
desk review of existing literature and stakeholder interviews to establish and assess the institutional logic of the programme, implementation strategies and allocations of resources;
review of literature and secondary data, focused on prior evaluations already carried out relevant to school feeding in Bangladesh including two impact evaluations;
quantitative survey(s) among beneficiaries and schools, as necessary to complement existing data and address the evaluation questions; and
field interviews among beneficiaries and all key stakeholders.
60. The interviews seek to deepen the understanding and analysis of the data generated by the other methods and to add substance to the indicators. Qualitativemethods will include semi-structured interviews, focus group discussion, and observation. Participatory methods will be used with those intended to benefit from the programme (school children and their households) and with those most closely involved in implementation (e.g. in schools and WFP staff). Some form of tracer study of previous beneficiaries is also likely to be appropriate.
61. Survey sampling will be representative and randomised. The evaluation will seek comparative data with schools in similar settings, which have not received school feeding (a control group). Ideally the control group would be selected from districts where WFP has never provided food assistance, if possible.
62. The evaluation will adopt if possible the sampling strategy utilized in previous baseline studies and impact evaluations in order to build upon the previous findings, including control groups and baseline comparisons. The evaluation team
29 New benchmarks for costs and cost-efficiency of school feeding in areas of high food insecurityA.Cavallero, A.Gelli, L.Minervini, M.Mirabile, L.Molinas and M.Regnault de la Mothe WFP(09/06/2010, final draft)
TOR Impact Evaluation School Feeding Bangladesh 2010 Final OE March 01, 2011
16

will carefully assess the history and evolution of the WFP school feeding activities indifferent districts in order to select a rational sample (see Table 6).
63. The focus for quantitative field work will be carefully selected during the Inception Phase by the team in consultation with the Evaluation Manager and Country Office, based on the most important data gaps undermining the team’s ability to answer the evaluation questions. A thorough review of existing data must be carried out during the country based Inception Mission.
64. Once specific needs are determined, additional survey data will be collected by national consultants before the full team starts qualitative field work. A preliminary schedule of work is reflected in the table of Phases & Deliverables below.
65. Using Standards: Established standards will be used to assess WFP’s performance. In some areas, the standards may have been set by WFP, as it is the largest player in the school feeding area. In other areas, standards are not yet defined and the evaluation team will analyze and evaluate the working tools that WFP has developed to determine whether these tools meet professional standards. The 2009 School Feeding Policy sets 8 ‘Standards Guiding Sustainable and Affordable School’ with indicators. The World Bank and others have identified good practice concerning food based social safety nets30.
66. Evaluation Matrix: In the Inception Phase the evaluation team will develop an evaluation matrix that expands the key questions and articulates sub-questions, verifiable indicators to respond to these, means of verification and methods for datacollection.
4.C. Evaluation Quality Assurance
67. WFP has developed an Evaluation Quality Assurance System (EQAS) based on international good evaluation practice. It sets out process maps and templates for evaluation products as well as checklists for feedback on quality for each of the evaluation products. This quality assurance does not interfere with the views and independence of the evaluation team, but ensures that the evaluation is systematically based on clear and convincing evidence and presented clearly and logically.
68. The evaluation team will be required to ensure the quality of data used in the evaluation report is checked for validity, accuracy and reliability. The evaluation report will clearly indicate limitations to the conclusions that can be drawn from the evidence.
4.D. Phases and Deliverables
68. The evaluation will take place in five phases with timing as shown in Table 7 below:
(i) Design phase is to establish and agree on the terms of reference, identify the evaluation team leader and team members, engage key stakeholders, and compile background information and relevant documents for easy access of the evaluation team during the next phase.
(ii) Inception phase is for the evaluation team to arrive at a common understandingof the terms of reference, review documentation, develop an evaluation matrix accordingly, decide on the methodologies to be used during the evaluation and site selection for field work, assign division of responsibilities in the team and determinethe logistics arrangements for field work and the timetable for delivery of the evaluation report. This will be captured in a brief Inception Report.
(iii) Evaluation phase is to compile the evidence from documents and field work. This phase will take place in two parts: first, finalising desk review in preparation for
30 A good oveview is Food-Based Safety Nets and Related Programs. Beatrice LorgeRogers, Ph.D. and Jennifer Coates, M.S. September 2002 No. 0225 Social ProtectionDiscussion Paper Series. Social Protection Unit. Human Development Network TheWorld BankTOR Impact Evaluation School Feeding Bangladesh 2010 Final OE March 01, 2011
17

fieldwork, so that the evaluation team goes to the field as prepared as possible; and, second, field work at community/school/and household levels, at sub-national levels, and with stakeholders in capitals. At the end of this phase the Team Leader will debrief key stakeholders at the Country Office, Regional Bureau & Headquarterson progress (subject to triangulation of all evidence).
(iv) Reporting phase is to present the findings of the evaluation in a concise and well-substantiated evaluation report, including the quality assurance process. The draft report will be shared with key stakeholders for comments and revised in as much as comments are justified. Key findings and evidence may be presented at a workshop to WFP Bangladesh stakeholders.
(v) Presentation to the WFP Executive Board and follow-up, with the purpose of reacting to and implementing recommendations from the evaluation.
Table 7: Phases and Deliverables for the Evaluation
Phase Timing Expected Outputs1. Design PhasePreparation of draft TOR by OE By November 10, 2010Team selection & contracting November 30, 2010 Team assembledCirculation of TOR for review December 10-22, 2010 Improved draft of TORClearance of TOR by Dir, OE January 8, 2010 FINAL TOR2. Inception PhasePreliminary desk review of literature by team
December-January 2010
Possible Team Leader workshop and School Feeding workshop
TBD
Team briefing & planning in Bangladesh
February 6-10, 2011
Draft IR February 28, 2011 Draft Inception Report
OE quality assurance & report revisions March 2011 Revised draft Inception Report
Circulation of IR for review by Internal Reference Group
March 15, 2011
Clearance of IR by Dir, OE End of March 2011FINAL WORKING VERSION OF INCEPTION REPORT
3. Evaluation Phase March-April 2011Field work surveys in Bangladesh March 15-30, 2011 Survey ReportField work evaluation team in Bangladesh April 3-20, 2010 Team members’ reportsDebriefing and stakeholder workshop in Bangladesh
April 21, 2010 Aide memoire
4. Reporting PhaseTL drafts evaluation report May15, 2011 Draft Evaluation Report
OE quality assurance & report revisions May 30, 2011 Revised draft Evaluation Report
Circulation of ER for review by Internal Reference Group
June2011
OE consolidates comments June 2011 Comments matrix to TLTL revises ER July 2011
Clearance of ER by Dir, OE July 30, 2011 FINAL EVALUATION REPORT
5. Executive Board (EB) and Follow-upEditing & translation August 2011Preparation of Management Response August 2011 Management ResponsePreparation of Evaluation Brief September 2011Presentation of Summary Evaluation Report & Management Response to EB
November 2011 (EB.2/2011)
Dissemination of report December 31, 2011National Holidays during the Evaluation Phase include February 21 Shahid Dibash, February 26 Eid-e-Miladunani (exact date subject to sighting of moon); March 17 Bangabandhu Birthday, March 26 Independence Day, and April 14 Bangla New Year
The Evaluation Manager will participate in the Inception Mission.
TOR Impact Evaluation School Feeding Bangladesh 2010 Final OE March 01, 2011
18

5. Organisation of the evaluation
5.A. Evaluation Team
69. The evaluation will be carried out by a consultancy firm with which WFP Office ofEvaluation has developed a long term agreement to provide evaluation services.The firm will develop a proposal for an evaluation team that will comprise thefollowing members.
70. The team leader for the evaluation requires strong evaluation and leadership skills and technical expertise in one of the technical areas listed below. His/her primary responsibilities will be (a) setting out the methodology and approach in theInception Report; (b) guiding and managing the team during the inception and evaluation phase and overseeing the preparation of working papers; (c) consolidating team members’ inputs to the evaluation products; (d) representing the evaluation team in meetings with stakeholders; (e) delivering the Inception Report, draft and final evaluation reports (including the Executive Board summary report) in line with agreed OE standards (EQAS) and agreed timelines. The full job description is provided separately.
71. The evaluation team members will bring together a complementary combination of technical expertise in the fields of education, nutrition, value transfer, food security, economics and gender. The team leader will be internationally recruited. The remaining team members will be a mix of international and national recruitment. The blend of technical areas across the team will depend on that of the team leader first. At least one team member should be familiar with WFP’s work in general.
72. The evaluation team members will contribute to the design of the evaluation methodology in their area of expertise; undertake documentary review prior to fieldwork; conduct field work to generate additional evidence from a cross-section of stakeholders, including carrying out site visits, as necessary to collect information; participate in team meetings, including with stakeholders; prepare inputs in their technical area for the evaluation products; and contribute to the preparation of the evaluation report.
73. All members of the evaluation team will abide by the Code of Conduct for evaluators, ensuring they maintain impartiality and professionalism.
74. Research support will be needed to collect, compile, and undertake basic data analysis as requested by the evaluation team leader and evaluation manager. Several Bangladesh based research companies have been involved in collecting and analyzing baseline and other data related to WFPs school feeding and other work. One of these firms will be contracted by the consultancy firm to provide support to the evaluation team as needed.
5.B. Roles and Responsibilities
75. Internal Reference Group: The evaluation manager will set up an advisory reference group composed of WFP stakeholders (from the Country Office, school feeding units in the Policy and Programme Support Divisions, nutrition division and the regional bureau). The purpose of the reference group is to serve as a sounding board for early feedback on key evaluation products (e.g. the TOR, Inception Report and Evaluation Report), according to the communication milestones shown above.
76. WFP Country Office will also (i) provide access to information that is necessary to prepare and conduct the evaluation; (ii) be available to the evaluation team to discuss all aspects of the school feeding programme that the evaluation team considers relevant; (iii) facilitate the evaluation team’s contacts with stakeholders; and (iv) arrange in-Bangladesh meetings and field visits, and provide logistical support during the fieldwork.
77. WFP HQ and Regional Bureau staf will also be available for discussion with the evaluation team and provide information.
TOR Impact Evaluation School Feeding Bangladesh 2010 Final OE March 01, 2011
19

78. Evaluation Manager: The evaluation will be managed by Jamie Watts, Senior Evaluation Officer in the Office of Evaluation (OE) of WFP. The evaluation team leader reports to the evaluation manager, who has the following responsibilities: (a) prepare the terms of reference and manage the process of getting feedback from stakeholders and finalizing the TOR; (b) in consultation with the consultancy firm and the Country Office, develop the evaluation team leader and evaluation team members; (c) identify and set up the reference group and peer review panel; (d) organize all communications between the evaluation team and other stakeholders (WFP, reference group, etc.); (e) manage collection of documentation from within and outside WFP and make this information available to the evaluation team in an organized way; (f) review and exercise first level quality assurance on the evaluation products (Inception Report, and Evaluation Report); (g) manage the evaluation within the given budget and time.
79. Director, OE: The evaluation manager reports directly to the Director, OE, who will provide second level quality assurance and guidance on evaluation or technical issues, as required.
5.C. Communication
80. The evaluation will ensure communications at several milestones in the form of distributing and discussing: (a) the draft Terms of Reference; (b) the draft InceptionReport; (b) briefing for the WFP Country Office and key partners at the beginning and end of the fieldwork; (c) the Evaluation Report.
81. It is possible that a national school feeding stakeholder’s workshop will be convened during the timeframe within which the evaluation is taking place, although this is not certain at the time of writing. However, if such a workshop does take place, it would be ideal to use the event as a mean of engaging the participants in the evaluation process. The workshop is currently planned for November 2011, by which time the Evaluation Report would have been finalized. However, the findings, conclusions and recommendations could be presented as a basis for building understanding of strengths and weaknesses of past efforts and as a basis for discussing ways forward.
5.D. Budget
82. The evaluation will be funded from OE’s Programme Support Budget. The overall budget figure is US$200,000. In addition to consultant costs, this budget also includes a trip by the Evaluation Manager to Bangladesh for the Inception Mission, the cost of a team member to participate in a Rome based team leader workshop in May 2010 and in country costs as shown below. A preliminary budget detailed budget developed during the TOR phase will be finalized during the Inception Phase, when more details are known about in country costs associated with specific methodologies and logistics.
83. In country costs that will be covered by WFP include the following. Approximately$4,000 from the total budget will be kept aside for these expenses.
Inception mission (6 days) Vehicle transportation Driver Overtime Driver Overnight expenses Fuel
End of Evaluation Debriefing Workshop Transportation for guests Tea and snacks Facilities rental
TOR Impact Evaluation School Feeding Bangladesh 2010 Final OE March 01, 2011
20

Annex 1. Fact Sheet
Core Standard Indicators for Country Context – Bangladesh
Indicator DataBenchmark/MDG status Source
Gen
era
l
Population (total)(2000) 140,766,909 (2008) 160,000,128
World Bank. Quick Query MDG
Rate of natural increase (%)(1990.95) 2.1(2005-10) 1.5 UNDP HDR 2009
Urban Population (% of total)(1990) 19.8(2010) 28.1 UNDP HDR 2009
Human Development Index (value and rank)
(2000) 145 /173 value: 0.478(2007) 146/182 value: 0.543
UNDP HDR 2002UNDP HDR 2009
Gender-Development related index (value and rank)
(2000) 121/173 value: 0.468(2007) 123/182 value: 0.536
MDG 3: On-track UNDP HDR 2002UNDP HDR 2009
Eco
no
mic
Gini Index (value)(2000) 31(2005) 31
100=most unequalMedian 39.040/134 countries
World Bank - Data &Statistics
GNI per capita (US $)(2000) 350(2008) 520 World Bank. WDI
Annual GDP growth rate(2000) 6(2008) 6 World Bank. WDI
Agriculture as % of GDP(1998) 25.4
(2008) 19.0
World Bank.Country at a glance
Net Food trade (food exp-food imp) as % of GDP(2000.2) -2.5
(2004-06) -2.9 FAO Country Profile
Po
vert
y Percentage of population living below the national poverty line
(2000) 35.6 (2006) 40.0
MDG 1: On-track UNDP HDR 2002UNDP HDR 2009
Percentage of population living below $2 a day(2001) 82.8(2007) 81.3
UNDP HDR 2003UNDP HDR 2009
Foo
d S
ecu
rity Income/food deficit status (LIFDC: Yes or No) Yes FAO Country Profiles
Global Hunger Index 2009 (value and rank)
(1988-92) 35.9(2002-07) 24.7 rank: 67/84
Extrem. Alarming Alarming IFPRI. GHI 2009
Prevalence of undernourishment in total population %
(2000.2) 28(2004-06) 26
MDG 1: On-track
FAO Country Profile
Nu
triti
on
Weight-for-height (Wasting), prevalence for < 5 (%)(2001) 10 (2007) 16
HighVery High
UNICEF SOWC 2003SOWC 2009
Height-for-age (Stunting), prevalence for < 5 (%)(2001) 45 (2007) 36
Very HighHigh
UNICEF SOWC 2003SOWC 2009
Weight-for-age (Underweight), prevalence for < 5 (%)(2001) 48 (2007) 46
Very HighVery High
UNICEF SOWC 2003, SOWC 2009
Prevalence of anaemia (%) in < 5 (2001) 47.0 (Hb <110g/L) Severe ( ≥ 40.0)WHO "Prevalence ofanaemia ‘93-‘05"
Hea
lth
< 5 mortality rate (per 1000 live births)
(1990) 149(2008) 54
MDG 4: On-track UNICEF SOWC 2009 SpecialEdition
Maternal Mortality rate (per 100,000 live births)(2001) 400(2008) 350
MDG 5: Laggingbehind
UNICEF SOWC 2003UNICEF SOWC 2009 SpecialEdi.
Population not using improved water source (%)(2000) 3(2006) 20
UNDP HDR 2002UNDP HDR 2009
Life expectancy at birth(1995-2000) 58.1(2007) 66
UNDP HDR 2002UNDP HDR 2009
People living with HIV/AIDS (%) - Adults(2001) N.A.(2007) N.A.
MDG 6: On-track UNAIDS Global AIDSEpidemic Report 2008
Public expenditures on health (% of government expenditures) (2006) 7.4 UNDP HDR 2009
Edu
cati
on
Literacy Rate Youth (15-24 years) (%)(2001) Male: 67 Female: 60(2008) Male: 73 Female: 76 World Bank WDI
Public expenditures on education (% of government expenditures)
(1997) 13.8*(2000-07) 14.2 UNDP HDR 2002
UNDP HDR 2009
Notes All data presented are the latest available
For sources and definitions see links available in the technical notes
* Data do not include expenditure on tertiary education
TOR Impact Evaluation School Feeding Bangladesh 2010 Final OE March 01, 2011
21

Annex 2. Geographical Priorities for WFP in Bangladesh
TOR Impact Evaluation School Feeding Bangladesh 2010 Final OE March 01, 2011
22

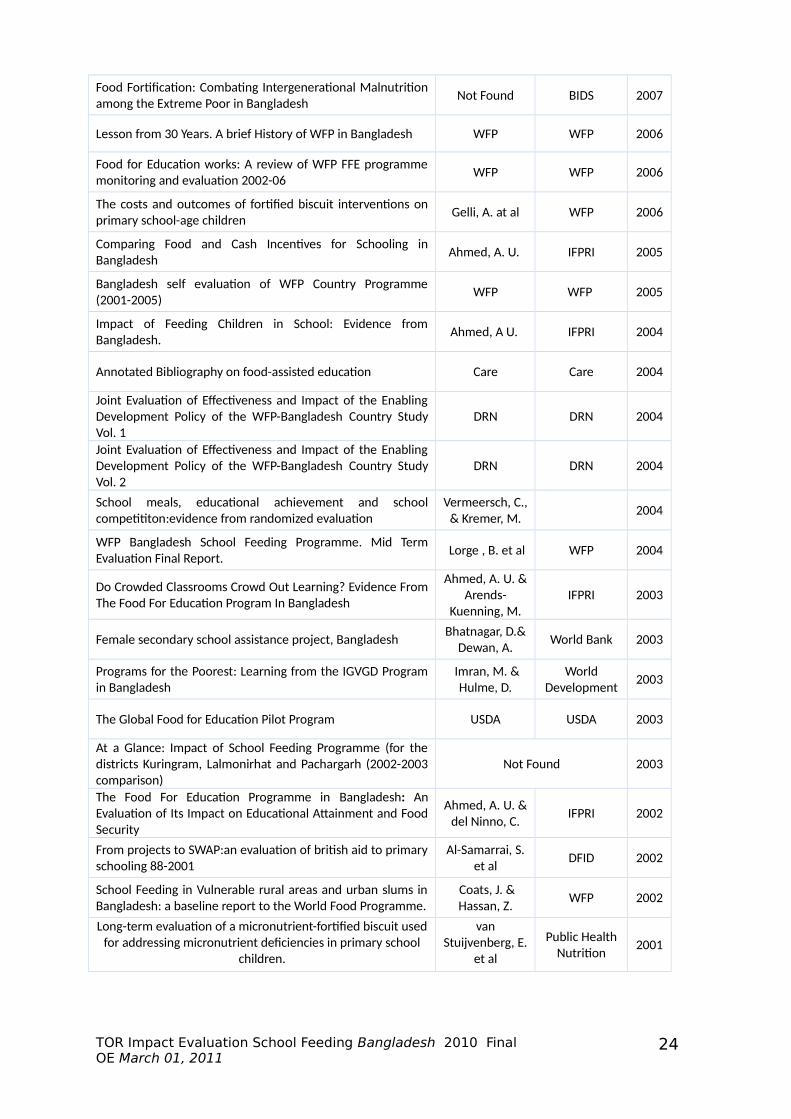
Annex 3. Prior Evaluations of Relevance to School Feeding in Bangladesh
Title Author Organization Year
Food for Education (FFE) Activity of the World FoodProgramme: Outcome survey report
Mustafa, S. DATA 2010
New benchmarks for costs and cost-efficiency of schoolfeeding in areas of high food insecurity
Cavallero A. etal
WFP 2010
Exploring the Long-term Impact of DevelopmentInterventions within Life-History Narratives in RuralBangladesh
Davis, Peter IFPRI 2010
School Feeding in Bangladesh 2010 WFP WFP 2010
School Feeding: Outcomes and costsGalloway, R. et
al
Food &NutritionBulletin
2009
Assessing impact of asset transfer on children's education: acase of BRAC's ultra poor programme in Bangladesh
Sulaiman, M. UNESCO 2009
Multi-Micronutrient-Fortified Biscuits Decrease Prevalence ofAnemia and Improved Micronutrient Status and Effectivenssof Deworming in Rural Vietnamese School Children
Nga, T.T. et alJournal ofNutrition
2009
The costs and cost-efficiency of providing food throughschools in areas of high food insecurity
Gelli, A. et alFood &
NutritionBulletin
2009
School feeding for improving the physical and psychosocialhealth of disadvantaged students (Review)
Kristjansson, B.et al
CochranCollaboration
2009
Comparing Food and Cash Transfers for the Ultra Poor inBangladesh
Ahmed, A.U. etal
IFPRI 2009
Educational and Health Impacts of Two School FeedingSchemes: Evidence of a Randomized Trial in Rural BurkinaFaso
Kazianga, H. etal
World Bank 2009
An assesment of School Feeding Programs: programmingfood for development
Tim Finan World Vision 2009
Country Programme Bangladesh Final Evaluation ReportGardener, J. et
alWFP 2009
Crafting a Graduation Pathway for the Ultra Poor: Lessonsand Evidence from a BRAC programme
Matin, I. et al
ChronicPoverty
ResearchCentre
2008
How effective are Food for Education Programs? A criticalassessment of the evidence from developing countries
Adelman, S. W.,et al
IFPRI 2008
Realist review to understand the efficacy of school feedingprogrammes
Greenhalgh, T.et al
BMJ 2007
Does a food for education program affect school outcomes?The Bangladesh case
Meng, x. &Ryan, J.
IZA 2007
Thematic Evaluation on school feeding in emergencysituation-full report (OEDE/2007/06)
WFP WFP 2007
Thematic Evaluation on school feeding in emergencysituation-BRIEF (OEDE/2007/06)
WFP WFP 2007
Baseline Survey Report on Food for Education Activity Surch Surch 2007
TOR Impact Evaluation School Feeding Bangladesh 2010 Final OE March 01, 2011
23
Food Fortification: Combating Intergenerational Malnutritionamong the Extreme Poor in Bangladesh
Not Found BIDS 2007
Lesson from 30 Years. A brief History of WFP in Bangladesh WFP WFP 2006
Food for Education works: A review of WFP FFE programmemonitoring and evaluation 2002-06
WFP WFP 2006
The costs and outcomes of fortified biscuit interventions onprimary school-age children
Gelli, A. at al WFP 2006
Comparing Food and Cash Incentives for Schooling inBangladesh
Ahmed, A. U. IFPRI 2005
Bangladesh self evaluation of WFP Country Programme(2001-2005)
WFP WFP 2005
Impact of Feeding Children in School: Evidence fromBangladesh.
Ahmed, A U. IFPRI 2004
Annotated Bibliography on food-assisted education Care Care 2004
Joint Evaluation of Effectiveness and Impact of the EnablingDevelopment Policy of the WFP-Bangladesh Country StudyVol. 1
DRN DRN 2004
Joint Evaluation of Effectiveness and Impact of the EnablingDevelopment Policy of the WFP-Bangladesh Country StudyVol. 2
DRN DRN 2004
School meals, educational achievement and schoolcompetititon:evidence from randomized evaluation
Vermeersch, C.,& Kremer, M.
2004
WFP Bangladesh School Feeding Programme. Mid TermEvaluation Final Report.
Lorge , B. et al WFP 2004
Do Crowded Classrooms Crowd Out Learning? Evidence FromThe Food For Education Program In Bangladesh
Ahmed, A. U. &Arends-
Kuenning, M.IFPRI 2003
Female secondary school assistance project, BangladeshBhatnagar, D.&
Dewan, A.World Bank 2003
Programs for the Poorest: Learning from the IGVGD Programin Bangladesh
Imran, M. &Hulme, D.
WorldDevelopment
2003
The Global Food for Education Pilot Program USDA USDA 2003
At a Glance: Impact of School Feeding Programme (for thedistricts Kuringram, Lalmonirhat and Pachargarh (2002-2003comparison)
Not Found 2003
The Food For Education Programme in Bangladesh: AnEvaluation of Its Impact on Educational Attainment and FoodSecurity
Ahmed, A. U. &del Ninno, C.
IFPRI 2002
From projects to SWAP:an evaluation of british aid to primaryschooling 88-2001
Al-Samarrai, S.et al
DFID 2002
School Feeding in Vulnerable rural areas and urban slums inBangladesh: a baseline report to the World Food Programme.
Coats, J. &Hassan, Z.
WFP 2002
Long-term evaluation of a micronutrient-fortified biscuit usedfor addressing micronutrient deficiencies in primary school
children.
vanStuijvenberg, E.
et al
Public HealthNutrition
2001
TOR Impact Evaluation School Feeding Bangladesh 2010 Final OE March 01, 2011
24

Effect of iron-, iodine-, and beta-carotene-fortified biscuits onthe micronutrient status of primary school children: arandomized controlled trial.
vanStuijvenberg, E.
et al
AmericanJournal of
ClinicalNutrition
1999
Is there an intrahousehold flypaper effect? Evidence from aSchool Feeding Programme
Jacoby, H. IFPRI 1997
The Girls’ Stipend Program in BangladeshRaynor, Janet,Wesson, Kate
Journal ofEducation forInternationalDevelopment
2006
TOR Impact Evaluation School Feeding Bangladesh 2010 Final OE March 01, 2011
25

Annex 4. WFP Logical Framework for School Feeding
TOR Impact Evaluation School Feeding Bangladesh 2010 Final OE March 01, 2011
26

TOR Impact Evaluation School Feeding Bangladesh 2010 Final OE March 01, 2011
27

TOR Impact Evaluation School Feeding Bangladesh 2010 Final OE March 01, 2011
28