table of contents - raeco€¦ · · 2013-07-26table of contents table of contents ... about the...
TRANSCRIPT
Table Of Contents
TABLE OF CONTENTS .......................................................................................1
INTRODUCTION ................................................................................................16
Welcome to QuestSuite Professional .............................. 16 Related topics ...................................................................................................................16
About the applets ................................................................................... 18 Related topics ...................................................................................................................18
What's new in this release ............................................................ 19 Related topics ...................................................................................................................19
GETTING STARTED ..........................................................................................20
The application window .................................................................. 20
Related topics ............................................................................................................ 20
Changing your View options ..................................................... 21 Related topics ...................................................................................................................21
Navigating in QuestSuite Professional .......................... 22
Using the text links (navigating without the Navigation Bar) ................................ 22 Using the Web part of the Toolbar ........................................................................... 22 Related topics ............................................................................................................ 22
Choosing an instrument and a task................................... 24 Related topics ...................................................................................................................24
Working with windows ..................................................................... 25
Related topics ............................................................................................................ 25
File types you'll use ............................................................................. 26
Related topics ............................................................................................................ 26
SETTING UP QUESTSUITE PROFESSIONAL .................................................27
Setting up System Options.......................................................... 27 Related topics ...................................................................................................................28
1
Setting up the User Profile database................................ 29 Related topics ...................................................................................................................29
Setting up the Instrument database .................................. 30 Related topics ...................................................................................................................30
Setting up Remote Connection ............................................... 31 Related topics ...................................................................................................................31
Setting up the software license .............................................. 32 Registering or upgrading your copy of QuestSuite Professional ..............32 Moving your copy of QuestSuite Professional to another computer .......33 Checking the status of your software license ....................................................33 Related topics ...................................................................................................................34
Setting up your printer ..................................................................... 35 Related topics ...................................................................................................................35
MAINTAINING INSTRUMENT RECORDS.........................................................36
Maintaining an instrument's certification history36 Related topics ...................................................................................................................36
Setting re-certification alarms for instruments ..... 37 Related topics ...................................................................................................................37
Viewing pending re-certification alarms ....................... 38 Related topics ...................................................................................................................38
FILE OPERATIONS ...........................................................................................39
Overview of file operations.......................................................... 39 Related topics ...................................................................................................................39
Opening and closing files ............................................................. 40 Closing files.......................................................................................................................40 Related topics ...................................................................................................................40
Saving files .................................................................................................... 41 Related topics ...................................................................................................................41
Importing files ............................................................................................ 42 Related topics ...................................................................................................................42
2
Searching for data files.................................................................... 43 Canceling a search .........................................................................................................43 Related topics ...................................................................................................................43
Sending files as email attachments ................................... 44 Related topics ...................................................................................................................44
Exiting QuestSuite Professional............................................ 45
CONDUCTING TESTS AND RETRIEVING DATA.............................................46
Overview: Setting up tests, conducting tests, and getting data ....................................................................................... 46
Related topics ...................................................................................................................46
Connecting with an instrument............................................... 48 Related topics ...................................................................................................................48
Programming an instrument ...................................................... 49 Related topics ...................................................................................................................49
Setting an instrument's date and time ............................ 50 Related topics ...................................................................................................................50
Retrieving setup information from an instrument51 Related topics ...................................................................................................................51
Retrieving data from an instrument ................................... 52 Canceling data retrieval................................................................................................52 Related topics ...................................................................................................................52
Clearing an instrument's memory........................................ 53 Related topics ...................................................................................................................53
Disconnecting from a remote instrument ................... 54 Related topics ...................................................................................................................54
YOUR WORKING ENVIRONMENT ...................................................................55
Setup files .................................................................................................................... 55
Overview of setup files..........................................................................55 Related topics ..........................................................................................................................55
The Setup dialog box...............................................................................56
3
Related topics ..........................................................................................................................56
Creating and opening setup files............................................57 Related topics ..........................................................................................................................57
Saving setup files .........................................................................................58 Related topics ..........................................................................................................................58
Data files...................................................................................................................... 59
Overview of data files..............................................................................59 Related topics ..........................................................................................................................59
The data-file window.................................................................................60 Related topics ..........................................................................................................................60
Working in the data-file window ...............................................61 Related topics ..........................................................................................................................61
Charts .......................................................................................................................... 62
Overview of charts ......................................................................................62 Related topics ..........................................................................................................................62
The chart tabs ....................................................................................................63 Using the charting toolbar................................................................................................64 Using the chart's context menu ....................................................................................65 Using the Data Editor and the Legend Box............................................................66 Related topics ..........................................................................................................................66
Changing chart colors ...........................................................................67 Using the Palette Bar and the Pattern Bar..............................................................67 Related topics ..........................................................................................................................67
Changing your view of chart data..........................................68 Zooming in and out...............................................................................................................68 Using scan lines and limit lines ....................................................................................68 Using the Traces & Axes dialog box ..........................................................................69 Changing the time range for a chart ..........................................................................69 Displaying data for different sensor bars ...............................................................69 Related topics ..........................................................................................................................70
Chart properties ..............................................................................................71 The General tab .......................................................................................................................71 The Series tab ..........................................................................................................................71 The Axes tab .............................................................................................................................72
4
The 3D tab...................................................................................................................................72 Related topics ..........................................................................................................................72
Chart axis properties ...............................................................................74 The Scale tab ............................................................................................................................74 The Labels tab..........................................................................................................................74 The Grid Lines tab .................................................................................................................75 Related topics ..........................................................................................................................75
Annotating charts .........................................................................................76 The Annotate toolbar ...........................................................................................................76 Working with annotation object properties ...........................................................76 Working with annotation objects .................................................................................77 Related topics ..........................................................................................................................78
Editing data points ......................................................................................79 The Edit and Select tabs ....................................................................................................79 The Summary tab ...................................................................................................................80 The List tab ................................................................................................................................80 Related topics ..........................................................................................................................80
Working with the Stay Time for a chart or report82 Changing Stay Time settings in a chart ...................................................................82 Changing Stay Time settings in a report .................................................................82 Related topics ..........................................................................................................................82
Using the Air Exchange charting tool ..............................83 Related topics ..........................................................................................................................83
Copying charts to other files ........................................................84 Related topics ..........................................................................................................................84
Printing charts...................................................................................................85 Related topics ..........................................................................................................................85
Saving charts ......................................................................................................86 Related topics ..........................................................................................................................86
Reports ........................................................................................................................ 87
Overview of reports ...................................................................................87 Related topics ..........................................................................................................................87
The report tabs .................................................................................................88 Related topics ..........................................................................................................................88
5
Setting up reports ........................................................................................89 Related topics ..........................................................................................................................89
Printing reports................................................................................................91 Related topics ..........................................................................................................................91
Saving reports ...................................................................................................92 Related topics ..........................................................................................................................92
Exporting reports ..........................................................................................93 Related topics ..........................................................................................................................93
USING THE NOISE APPLET .............................................................................94
Overview of noise dosimeters ................................................. 94 Virtual dosimeters...........................................................................................................94 Applications.......................................................................................................................95 The Noise applet ..............................................................................................................95 Related topics ...................................................................................................................95
Setting up noise dosimeters ...................................................... 96 The Dosimeter tab...........................................................................................................96 The General tab................................................................................................................96 The Auto-On tab...............................................................................................................97 The Security tab...............................................................................................................97 The Print tab ......................................................................................................................97
Related topics ............................................................................................................ 98
Understanding noise-level data and parameters 99 C minus A ...........................................................................................................................99 Criterion level..................................................................................................................100 Dose ....................................................................................................................................100 Exchange rate .................................................................................................................100 Exposure ...........................................................................................................................100 LAvg....................................................................................................................................100 LEQ......................................................................................................................................101 LDN......................................................................................................................................101 LN .........................................................................................................................................101 LMax....................................................................................................................................101 LPeak ..................................................................................................................................101 Measuring range ............................................................................................................102
6
Overload ............................................................................................................................102 Pascal-squared hours .................................................................................................102 Projected dose ...............................................................................................................102 Projected time.................................................................................................................102 Projected TWA................................................................................................................102 Response level ...............................................................................................................102 SEL ......................................................................................................................................103 SPL ......................................................................................................................................103 Statistics: Percent Time Statistical Distribution ..............................................103 Test......................................................................................................................................103 Time history.....................................................................................................................103 Threshold level...............................................................................................................103 TWA.....................................................................................................................................104 Type 1 and Type 2 .........................................................................................................104 UL (Upper Limit) Time .................................................................................................104 Weighting..........................................................................................................................104 Related topics .................................................................................................................105
Working with noise data............................................................................................. 106
Components of a noise data file ............................................106 Related topics ........................................................................................................................106
File summaries for noise data...................................................107 The Summary tab .................................................................................................................107 The Projected Dose tab ....................................................................................................107 The Projected TWA tab.....................................................................................................108 The Statistics Chart tab....................................................................................................108 The Exceedance Chart tab .............................................................................................108 The Report tab .......................................................................................................................108 Related topics ........................................................................................................................108
Changing the increment and duration...........................109 Related topics ........................................................................................................................109
Individual tests in noise data files.......................................110 The Summary tab .................................................................................................................110 The History Chart tab ........................................................................................................110 The Report tab .......................................................................................................................110 Related topics ........................................................................................................................110
Creating combination tests...........................................................111
7
Related topics ........................................................................................................................111
Calibrations .........................................................................................................112 Field calibrators and instrument re-certification ..............................................112 Related topics ........................................................................................................................112
USING THE SOUND APPLET .........................................................................114
Overview of sound level meters........................................... 114 Applications.....................................................................................................................114 The Sound applet ..........................................................................................................115 Related topics .................................................................................................................115
Setting up sound level meters ............................................... 116 The Integration Threshold tab .................................................................................116 The Trigger tab ...............................................................................................................116 The Logging tab .............................................................................................................116 The Display tab...............................................................................................................117 The Weight tab................................................................................................................117 The Print tab ....................................................................................................................118 Related topics .................................................................................................................118
Understanding sound-level data and parameters119 BATT ...................................................................................................................................119 C-A .......................................................................................................................................119 CNEL (community noise exposure level)............................................................119 LLOG...................................................................................................................................119 LPeak ..................................................................................................................................119 OVL......................................................................................................................................120 Pa2H....................................................................................................................................120 RTMS and RTHM............................................................................................................120 TAKM ..................................................................................................................................120 Related topics .................................................................................................................120
Working with sound data ........................................................................................... 121
Components of a sound data file..........................................121 Related topics ........................................................................................................................121
File summaries for sound data ................................................122 The Summary tab .................................................................................................................122 The Report tab .......................................................................................................................122 Related topics ........................................................................................................................122
8
Groups and sessions ............................................................................123 The Summary tab .................................................................................................................123 The History Chart tab ........................................................................................................123 The Statistics Chart tab....................................................................................................123 The Exceedance Chart tab .............................................................................................123 The Report tab .......................................................................................................................123 Related topics ........................................................................................................................124
Individual tests in sound data files ....................................125 The Summary tab .................................................................................................................125 The History Chart tab ........................................................................................................125 The Statistics Chart tab....................................................................................................125 The Exceedance Chart tab .............................................................................................125 The Report tab .......................................................................................................................125 Related topics ........................................................................................................................125
Filters ...........................................................................................................................127 Related topics ........................................................................................................................127
Calibrations .........................................................................................................128 Field calibrators and instrument re-certification ..............................................128 Related topics ........................................................................................................................128
USING THE HEAT STRESS APPLET .............................................................130
Overview of heat stress monitors ...................................... 130 Personal heat stress monitors ................................................................................130 Area heat stress monitors .........................................................................................130 Applications.....................................................................................................................131 The Heat Stress applet................................................................................................131 Related topics .................................................................................................................131
Setting up heat stress monitors........................................... 132 Setting up the QT-III .....................................................................................................132
The General tab ........................................................................................................................132 The User Parameters tab .....................................................................................................132
Setting up the QT-15 ....................................................................................................133 The General tab ........................................................................................................................133 The Auto-On tab.......................................................................................................................133 The Alarms tab .........................................................................................................................133
Setting up the QT-34 and QT-36..............................................................................134
9
The General tab ........................................................................................................................134 The Auto-On tab.......................................................................................................................134 The Stay Times tab (QT-36 only) ......................................................................................134
Related topics .................................................................................................................135
Remotely controlling the heat stress monitors .. 136 Related topics .................................................................................................................137
Understanding heat stress data and parameters138 Acclimatization...............................................................................................................138 ACGIH.................................................................................................................................138 ASHRAE ............................................................................................................................139 clo ........................................................................................................................................139 EPRI.....................................................................................................................................139 Heat Index, Humidex ....................................................................................................139 Heat stress, heat strain...............................................................................................139 HVAC ..................................................................................................................................139 Metabolic rate (met)......................................................................................................139 MRT (mean radiant temperature)............................................................................140 MTA (moving time average) ......................................................................................140 Navy PHEL .......................................................................................................................140 PMV, PPD ..........................................................................................................................140 Relative humidity (RH) ................................................................................................140 Sensor bar ........................................................................................................................141 Stay time (work/rest regimen)..................................................................................141 Strain index......................................................................................................................141 Thermal comfort ............................................................................................................141 WBGT (Wet Bulb Globe Temperature) .................................................................142 Weighted WBGT average ...........................................................................................142 Related topics .................................................................................................................142
Working with heat stress data.................................................................................... 143
Components of a heat stress data file...........................143 Related topics ........................................................................................................................143
File summaries for heat stress data .................................144 The Summary tab .................................................................................................................144 The History Chart tab ........................................................................................................144 The Report tab .......................................................................................................................144 Related topics ........................................................................................................................144
10
Individual tests in heat stress data files .....................146 The Summary tab .................................................................................................................146 The History Chart tab ........................................................................................................146 The Report tab .......................................................................................................................146 The Stay Time tab ................................................................................................................146 The Thermal Comfort tab ................................................................................................147 Related topics ........................................................................................................................147
Calibrations .........................................................................................................148 Related topics ........................................................................................................................148
USING THE GAS DETECTION APPLET.........................................................149
Overview of gas monitors ........................................................... 149 The sensors .....................................................................................................................149 Applications.....................................................................................................................149 The Gas Detection applet ..........................................................................................150 Related topics .................................................................................................................150
Setting up gas monitors ............................................................... 151 The Common tab (ML-2000)......................................................................................151 The Sensor tabs .............................................................................................................151 The Miscellaneous tab ................................................................................................152 The Print tab (ML-2000)...............................................................................................153 Related topics .................................................................................................................153
Understanding gas detection data and parameters ................................................................................................... 154
Alarm levels .....................................................................................................................154 Average..............................................................................................................................154 Combustible (explosive) range ...............................................................................154 High alarm level .............................................................................................................155 LEL (lower explosive limit), UEL (upper explosive limit) .............................155 Peak.....................................................................................................................................155 Peak STEL level .............................................................................................................155 ppm .....................................................................................................................................155 STEL (short-term exposure limit) ...........................................................................155 STEL alarm level ............................................................................................................155 TWA (time-weighted average) ..................................................................................156 TWA alarm level .............................................................................................................156
11
Related topics .................................................................................................................156 Working with gas data ............................................................................................... 157
Components of a gas data file ..................................................157 Related topics ........................................................................................................................157
File summaries for gas data ........................................................158 The Summary tab .................................................................................................................158 The Report tab .......................................................................................................................158 Related topics ........................................................................................................................158
Individual tests in gas data files ............................................159 The Summary tab .................................................................................................................159 The History Chart tab ........................................................................................................159 The Alarms tab ......................................................................................................................159 The Report tab .......................................................................................................................159 Related topics ........................................................................................................................159
Calibrations .........................................................................................................160 Related topics ........................................................................................................................160
USING THE INDOOR AIR QUALITY APPLET ................................................161
Overview of indoor air quality monitors ..................... 161 Applications.....................................................................................................................161 The Indoor Air Quality applet ...................................................................................162 Related topics .................................................................................................................162
Setting up indoor air quality monitors .......................... 163 The General tab..............................................................................................................163 The Inputs tab .................................................................................................................164 Related topics .................................................................................................................164
Remotely controlling the indoor air quality monitors.......................................................................................................... 165
Related topics .................................................................................................................165
Understanding air quality data and parameters. 167 Air changes per hour ...................................................................................................167 Air exchange rate ..........................................................................................................167 Air half life ........................................................................................................................167 CO2 decay ........................................................................................................................167
12
CO2 range.........................................................................................................................168 Correlation coefficient.................................................................................................168 Dew point ..........................................................................................................................168 Mean air life......................................................................................................................168 Relative humidity (RH) ................................................................................................168 Tracer gas.........................................................................................................................168 VOC (volatile organic compound) ..........................................................................169 Related topics .................................................................................................................169
Understanding correlation coefficients ....................... 170 See also .............................................................................................................................171
Working with air quality data...................................................................................... 172
Components of an air quality data file ..........................172 Related topics ........................................................................................................................172
File summaries for air quality data .....................................173 The Summary tab .................................................................................................................173 The History Chart tab ........................................................................................................173 The Report tab .......................................................................................................................173 Related topics ........................................................................................................................173
Individual tests in air quality data files .........................174 The Summary tab .................................................................................................................174 The History Chart tab ........................................................................................................174 The Report tab .......................................................................................................................174 Related topics ........................................................................................................................174
GETTING HELP ...............................................................................................175
Using this Help system .................................................................. 175 Related topics .................................................................................................................175
Contacting Quest Technologies .......................................... 176 Related topics .................................................................................................................176
ACCLIMATIZATION.........................................................................................177
ACGIH ..............................................................................................................178
AIR EXCHANGE RATE....................................................................................179
CA.....................................................................................................................180
13
CNEL ................................................................................................................181
CRITERION LEVEL..........................................................................................182
DEW POINT .....................................................................................................183
DOSE................................................................................................................184
EPRI .................................................................................................................185
EXCHANGE RATE...........................................................................................186
HEAT INDEX ....................................................................................................187
HEAT STRESS.................................................................................................188
HUMIDEX .........................................................................................................189
INTEGRATING SOUND LEVEL METER .........................................................190
ISO....................................................................................................................191
LAVG................................................................................................................192
LDN ..................................................................................................................193
LEL...................................................................................................................194
LEQ ..................................................................................................................195
LMAX................................................................................................................196
LN.....................................................................................................................197
LPEAK..............................................................................................................198
MEASURING RANGE ......................................................................................199
METABOLIC RATE..........................................................................................200
MRT..................................................................................................................201
MSHA ...............................................................................................................202
MTA..................................................................................................................203
NAVY PHEL .....................................................................................................204
OSHA ...............................................................................................................205
14
PA2H ................................................................................................................206
PMV AND PPD.................................................................................................207
PPM..................................................................................................................208
PROJECTED DOSE.........................................................................................209
PROJECTED TIME ..........................................................................................210
PROJECTED TWA...........................................................................................211
RESPONSE LEVEL .........................................................................................212
RH.....................................................................................................................213
SEL...................................................................................................................214
SLM ..................................................................................................................215
STAY TIME.......................................................................................................216
STEL.................................................................................................................217
TAKM ...............................................................................................................218
THRESHOLD LEVEL .......................................................................................219
TWA..................................................................................................................220
UEL...................................................................................................................221
UPPER LIMIT ...................................................................................................222
WBGT...............................................................................................................223
WEIGHTED WBGT AVERAGE........................................................................224
WEIGHTING .....................................................................................................225
GLOSSARY......................................................................................................226
15
Introduction
Welcome to QuestSuite Professional Welcome to the Help system for QuestSuite Professional. QuestSuite Professional is a suite of integrated applets (small applications) that together provide one place where you can organize, manage, analyze, and mine data from all types of Quest Technologies instruments. QuestSuite Professional contains five applets, one for each kind of instrument: noise dosimeters, sound level meters, heat stress monitors, gas monitors, and indoor air quality monitors. With QuestSuite Professional, you can:
• Program most instruments for different test conditions—For example, to program an indoor air quality monitor, you can choose the channels to be recorded, the logging mode (such as survey or continuous), and the data storage period. In all applets, you can save your configurations in setup files for easy retrieval and reuse.
• Easily retrieve and store test data—QuestSuite Professional retrieves test data from the instruments and stores the data on your computer. Within each data file, you can view file summaries and the results of individual tests, and you can add comments. QuestSuite’s searching feature makes it easy to find the files you want to evaluate.
• View full-color charts of your recorded data—QuestSuite Professional generates charts automatically. You can select chart styles, choose the information you want to display, annotate charts with free-form comments, and add comments to specific data points. You can zoom in to see more detailed data, and use a scan line to view exact numeric data values. You can print charts and save them as files.
• View detail, summary, statistics, and exceedance reports—View them on-screen, print them, or save them in files. You can also export reports to other programs.
• Keep track of instrument certifications—Set re-certification alarms and maintain certification histories for each instrument in the Instrument database.
• Mine data—Search the database for exposure records based on combinations of criteria, such as test date, subject name, company name, work area, or exposure type (noise, sound, heat stress, gas, or indoor air quality).
Note: Before you begin using QuestSuite to record and retrieve data, you need to set up the system options, the User Profile database, the Instrument database, and the software license.
Related topics About the applets What's new in this release The application window Navigating in QuestSuite Professional Setting up System Options Setting up the User Profile database Setting up the Instrument database
16

Setting up the software license File types you'll use
17
About the applets
QuestSuite Professional contains five applets, one for each type of instrument used with the software. The applets are:
• Noise—Used to manage data collected from these noise dosimeters: Q-100, Q-300, Q-400, and Q-500.
• Sound—Used to manage data collected from these sound level meters: Model 1900 and Model 2900.
• Heat Stress—Used to manage data collected from these heat stress monitors: QT-II, QT-III, QT-15, QT-34, and QT-36.
• Gas Detection—Used to manage data collected from these gas monitors: SafeLog 100 and MultiLog 2000.
• Indoor Air Quality—Used to manage data collected from the aq-5000, aq-5001, aq-5000 Pro, and aq-5001 Pro indoor air quality monitors.
Related topics
The application window Navigating in QuestSuite Professional Overview of noise dosimeters Overview of sound level meters Overview of heat stress monitors Overview of gas monitors Overview of indoor air quality monitors
18
What's new in this release
If you have used previous versions of QuestSuite, you'll notice some differences when you start using QuestSuite Professional:
• A browser-like interface with two main panes, and a Navigation Bar in the left pane
• New View options: Fonts and Navigation Bar
• An Instrument database and a User Profile databasethe data from both databases are stored in the same physical file, but you enter database information in separate screens
• Re-certification alarms for instruments
• Better reporting capability with the ability to export report data to multiple formats
• Expanded charting capabilities
• The ability to save charts and reports to separate files
• The ability to email data files, chart files, and report files
• The ability to import old QuestSuite data files
• Enhanced searching capabilities
• An enhanced File Open dialog box, showing information about data files
• Enhanced support for combining tests in the Noise applet
• The ability to connect to remote instruments by modem
Related topics
Welcome to QuestSuite Professional About the applets The application window Navigating in QuestSuite Professional Choosing an instrument and a task File types you'll use
19
Getting started
The application window
The QuestSuite Professional application window follows standard Windows conventions. You'll find a menu bar, a toolbar, and a status bar, along with the standard Minimize, Maximize/Restore, and Close buttons. Some menu choices are dimmed if they are unavailable when no files are open or when no instrument is connected. The QuestSuite Professional application window looks and works similarly to Web-browser applications such as Internet Explorer. This browser interface includes two main panes (left side and right side).
• The left pane contains the Navigation Bar for easy access to each applet.
• In the right pane, the top section displays various items at different times. (See the table below.) The bottom section contains text links that provide access to applets and to other instruments in the applet (except when a data file is open and filling the screen).
Items displayed in the top section of the application window's right pane After you do this: The top section of the right pane displays this: Launch QuestSuite Professional
The home page, which lists common tasks (Open a data file; Search for a data file; Set up the system options; Set up the User Profile database; Set up the Instrument database).
Select an applet The instruments available for each applet (for the first four applets), or the tasks available for the aq-5000/5001.
Select an instrument The operations available for that instrument. Select an operation The corresponding dialog box. Open a data file The data-file window. Select the Quest Online option in the Navigation Bar
Quest Technologies Web pages. (Internet access is required for this option.)
Related topics What's new in this release Changing your View options Navigating in QuestSuite Professional Choosing an instrument and a task Working with windows Overview of data files
20
Changing your View options
You can change your view of the QuestSuite Professional application window in several ways:
• Showing or hiding the toolbar (at the top of the window)
• Showing or hiding the status bar (at the bottom of the window)
• Showing or hiding the Navigation Bar (the left pane of the application window) You can also change the size of the type displayed in the right pane of the application window. (This setting does not affect text within dialog boxes or data files.) To show or hide the toolbar:
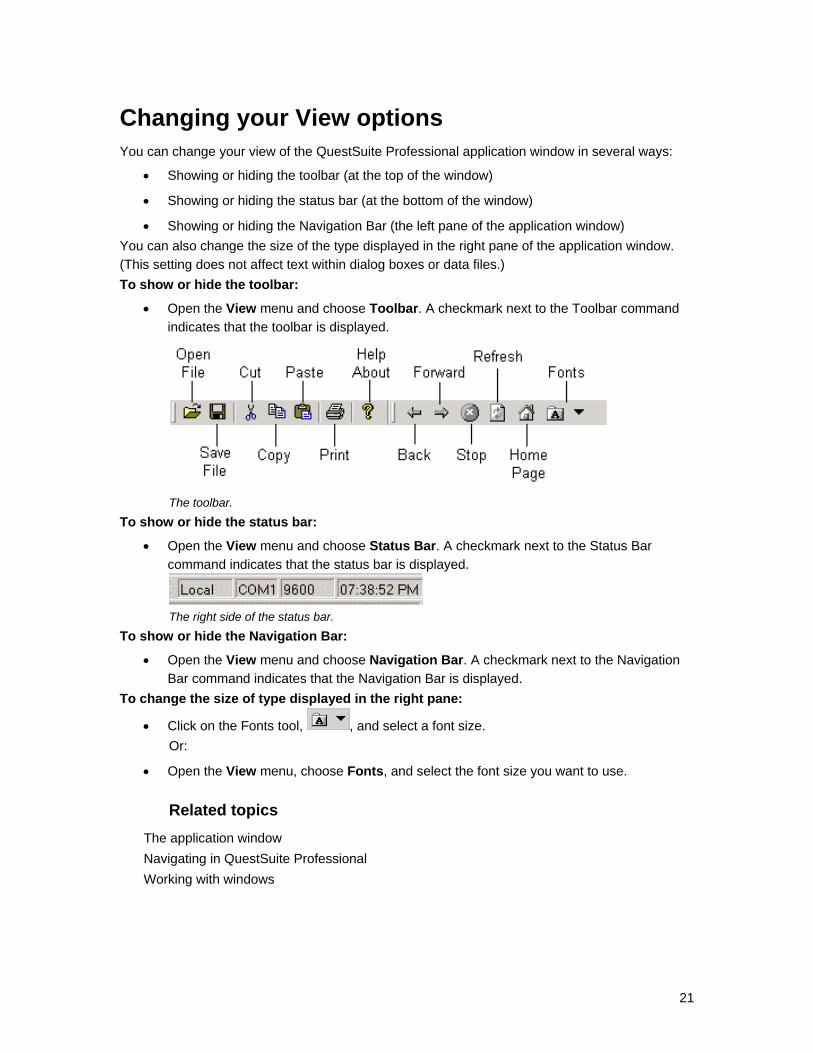
• Open the View menu and choose Toolbar. A checkmark next to the Toolbar command indicates that the toolbar is displayed.
The toolbar.
To show or hide the status bar:
• Open the View menu and choose Status Bar. A checkmark next to the Status Bar command indicates that the status bar is displayed.
The right side of the status bar.
To show or hide the Navigation Bar:
• Open the View menu and choose Navigation Bar. A checkmark next to the Navigation Bar command indicates that the Navigation Bar is displayed.
To change the size of type displayed in the right pane:
• Click on the Fonts tool, , and select a font size. Or:
• Open the View menu, choose Fonts, and select the font size you want to use.
Related topics
The application window Navigating in QuestSuite Professional Working with windows
21
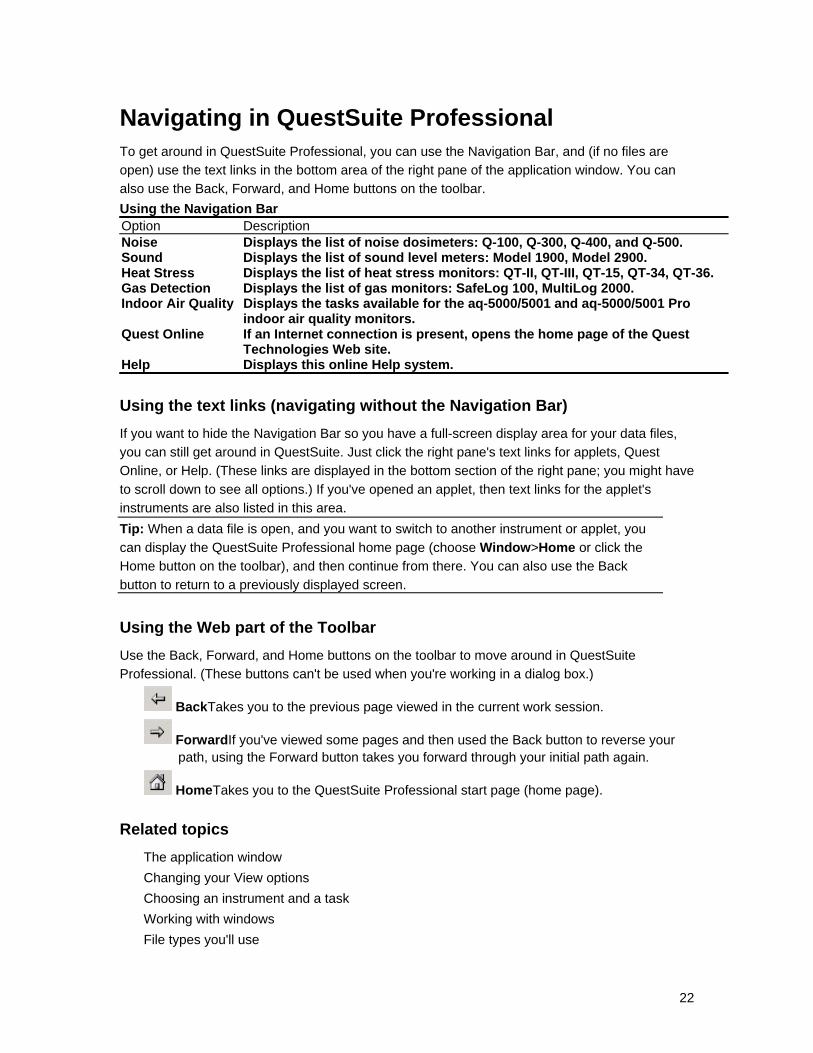
Navigating in QuestSuite Professional To get around in QuestSuite Professional, you can use the Navigation Bar, and (if no files are open) use the text links in the bottom area of the right pane of the application window. You can also use the Back, Forward, and Home buttons on the toolbar. Using the Navigation Bar Option Description Noise Displays the list of noise dosimeters: Q-100, Q-300, Q-400, and Q-500. Sound Displays the list of sound level meters: Model 1900, Model 2900. Heat Stress Displays the list of heat stress monitors: QT-II, QT-III, QT-15, QT-34, QT-36. Gas Detection Displays the list of gas monitors: SafeLog 100, MultiLog 2000. Indoor Air Quality Displays the tasks available for the aq-5000/5001 and aq-5000/5001 Pro
indoor air quality monitors. Quest Online If an Internet connection is present, opens the home page of the Quest
Technologies Web site. Help Displays this online Help system.
Using the text links (navigating without the Navigation Bar) If you want to hide the Navigation Bar so you have a full-screen display area for your data files, you can still get around in QuestSuite. Just click the right pane's text links for applets, Quest Online, or Help. (These links are displayed in the bottom section of the right pane; you might have to scroll down to see all options.) If you've opened an applet, then text links for the applet's instruments are also listed in this area. Tip: When a data file is open, and you want to switch to another instrument or applet, you can display the QuestSuite Professional home page (choose Window>Home or click the Home button on the toolbar), and then continue from there. You can also use the Back button to return to a previously displayed screen.
Using the Web part of the Toolbar Use the Back, Forward, and Home buttons on the toolbar to move around in QuestSuite Professional. (These buttons can't be used when you're working in a dialog box.)
BackTakes you to the previous page viewed in the current work session.
ForwardIf you've viewed some pages and then used the Back button to reverse your path, using the Forward button takes you forward through your initial path again.
HomeTakes you to the QuestSuite Professional start page (home page).
Related topics The application window Changing your View options Choosing an instrument and a task Working with windows File types you'll use
22

23
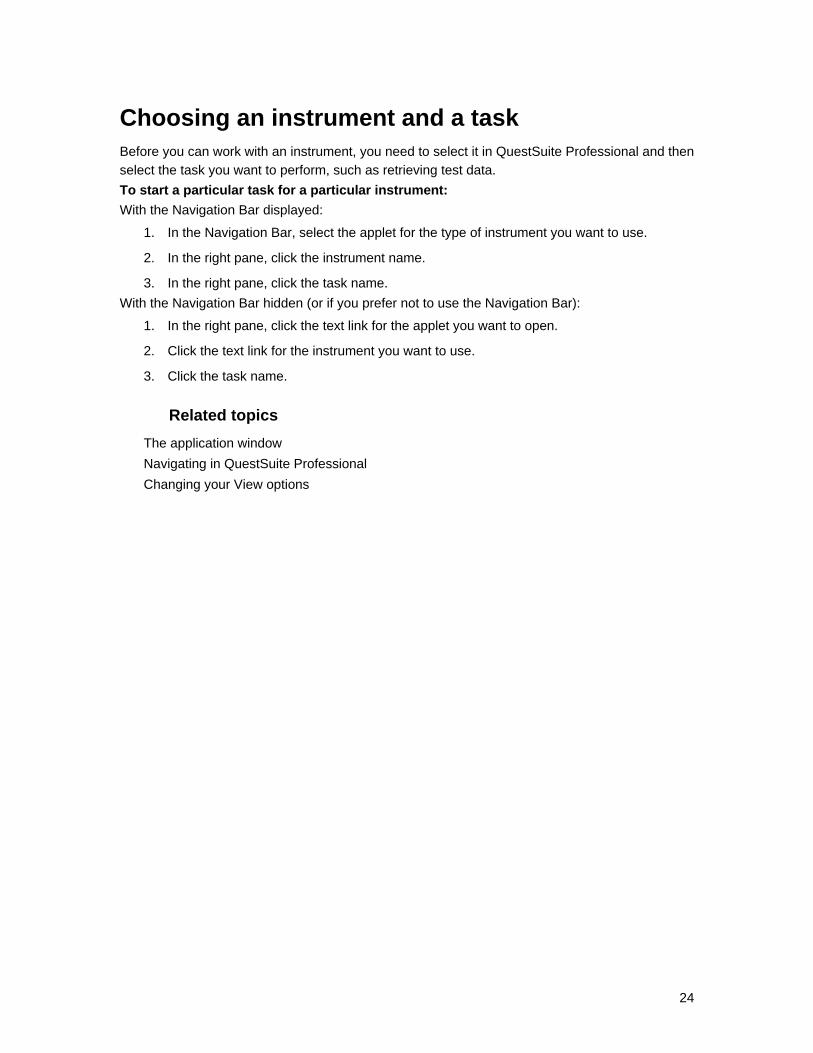
Choosing an instrument and a task
Before you can work with an instrument, you need to select it in QuestSuite Professional and then select the task you want to perform, such as retrieving test data. To start a particular task for a particular instrument: With the Navigation Bar displayed:
1. In the Navigation Bar, select the applet for the type of instrument you want to use.
2. In the right pane, click the instrument name.
3. In the right pane, click the task name. With the Navigation Bar hidden (or if you prefer not to use the Navigation Bar):
1. In the right pane, click the text link for the applet you want to open.
2. Click the text link for the instrument you want to use.
3. Click the task name.
Related topics
The application window Navigating in QuestSuite Professional Changing your View options
24
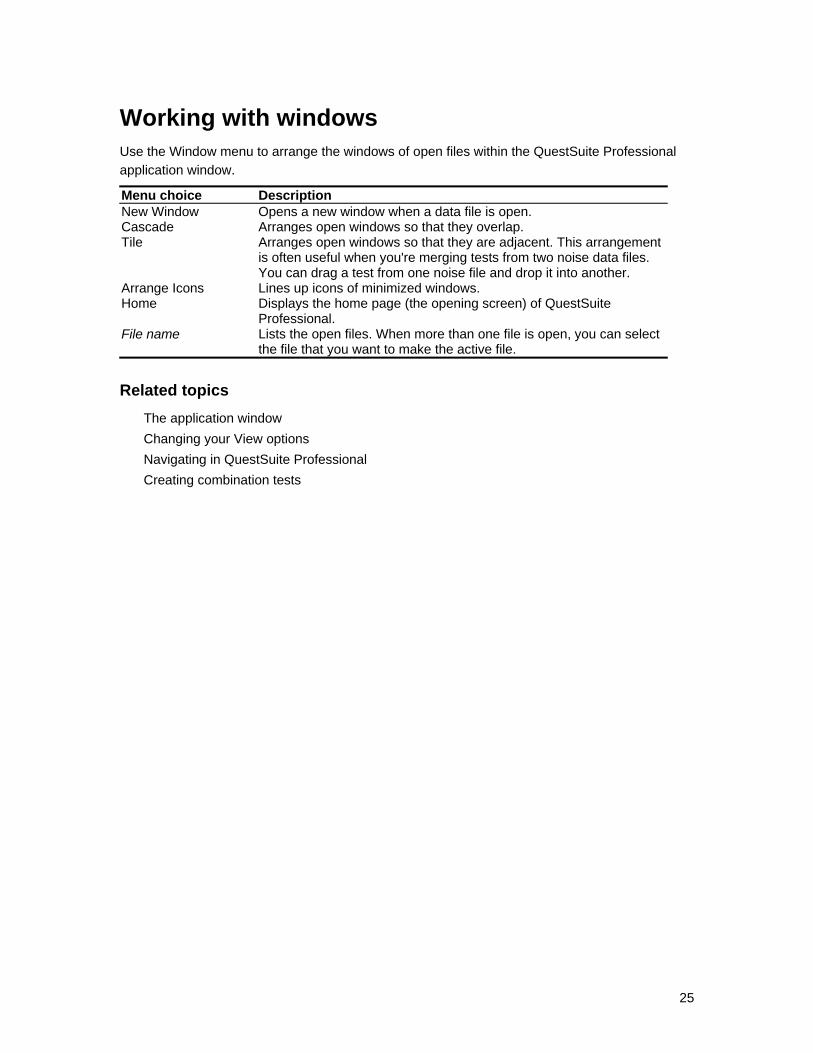
Working with windows
Use the Window menu to arrange the windows of open files within the QuestSuite Professional application window.
Menu choice Description New Window Opens a new window when a data file is open. Cascade Arranges open windows so that they overlap. Tile Arranges open windows so that they are adjacent. This arrangement
is often useful when you're merging tests from two noise data files. You can drag a test from one noise file and drop it into another.
Arrange Icons Lines up icons of minimized windows. Home Displays the home page (the opening screen) of QuestSuite
Professional. File name Lists the open files. When more than one file is open, you can select
the file that you want to make the active file.
Related topics The application window Changing your View options Navigating in QuestSuite Professional Creating combination tests
25
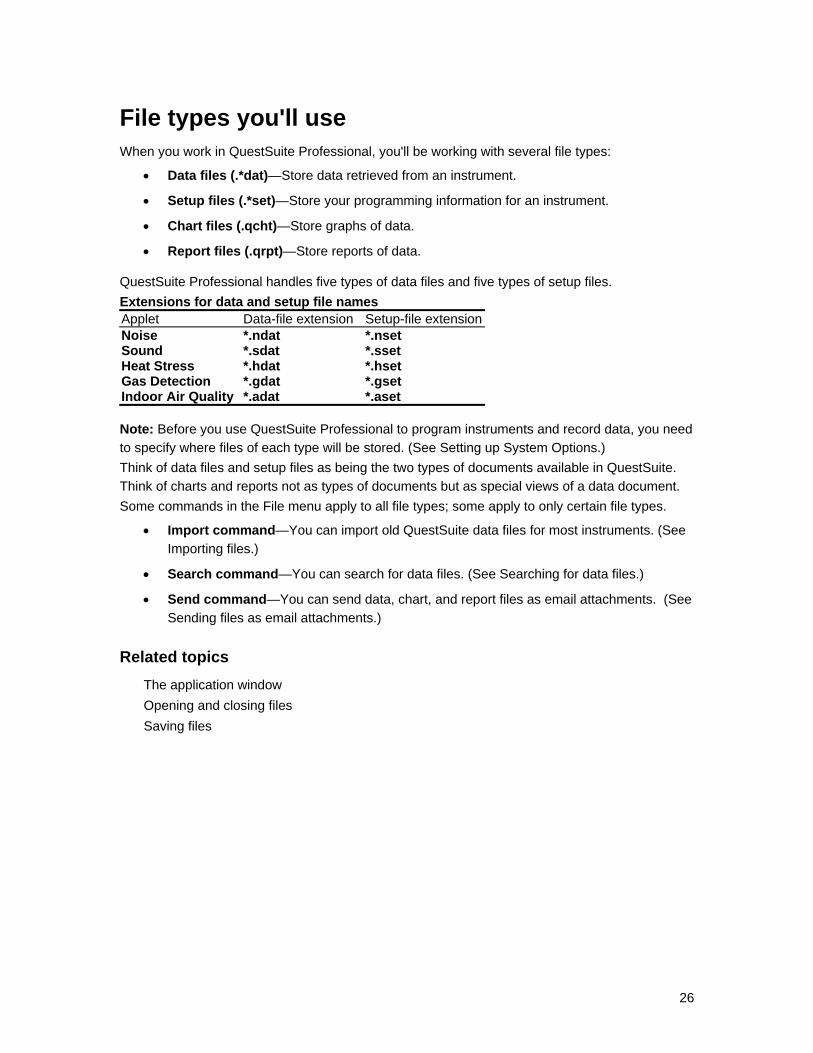
File types you'll use
When you work in QuestSuite Professional, you'll be working with several file types:
• Data files (.*dat)—Store data retrieved from an instrument.
• Setup files (.*set)—Store your programming information for an instrument.
• Chart files (.qcht)—Store graphs of data.
• Report files (.qrpt)—Store reports of data.
QuestSuite Professional handles five types of data files and five types of setup files. Extensions for data and setup file names Applet Data-file extension Setup-file extensionNoise *.ndat *.nset Sound *.sdat *.sset Heat Stress *.hdat *.hset Gas Detection *.gdat *.gset Indoor Air Quality *.adat *.aset
Note: Before you use QuestSuite Professional to program instruments and record data, you need to specify where files of each type will be stored. (See Setting up System Options.) Think of data files and setup files as being the two types of documents available in QuestSuite. Think of charts and reports not as types of documents but as special views of a data document. Some commands in the File menu apply to all file types; some apply to only certain file types.
• Import command—You can import old QuestSuite data files for most instruments. (See Importing files.)
• Search command—You can search for data files. (See Searching for data files.)
• Send command—You can send data, chart, and report files as email attachments. (See Sending files as email attachments.)
Related topics The application window Opening and closing files Saving files
26
Setting up QuestSuite Professional
Setting up System Options
Before you use QuestSuite Professional to program instruments and record data, you need to set up a few system options. You need to specify the locations of various types of files used in QuestSuite Professional, and you need to set communications parameters. You should also set instrument re-certification options. The System Options dialog box has three tabs: General, Communications, and Re-certifications. To set up general options:
1. From the Setup menu, choose System Options. The System Options dialog box opens, with the General tab showing.
2. To specify locations for the various file types, you can type text in the text boxes or use the Browse buttons. You need to specify locations for five file types: data, setup, report, and chart files, and the User Profile/Instrument database file. The default location for the User Profile/Instrument database file is the QuestSuite Professional program directory. That directory contains Data, Setup, Charts, and Reports subdirectories. These are the default locations for the respective file types.
3. Choose OK to save your settings and close the dialog box. (Or you can click the other tabs to set up their options.)
To set up communications options: 1. From the Setup menu, choose System Options. The System Options dialog box opens,
with the General tab showing. Click the Communications tab.
2. From the Port drop-down list box, select the number of the communications port that you'll use to connect your computer with the instrument. Or, from the list of modems configured for the system, select the modem you want to use.
3. To set or change the baud rate, drag the slider bar until the number you want appears in the Baud box.
4. Choose OK to save your settings and close the dialog box. Note: Before QuestSuite Professional can communicate with an instrument, you still need to physically connect the instrument with the computer. Connect the RS-232 cable from the instrument to the computer's serial port (the one that corresponds to the COM port you selected). To set up re-certifications options:
1. From the Setup menu, choose System Options. The System Options dialog box opens, with the General tab showing. Click the Re-certifications tab.
2. Check or uncheck the Disable Re-certification Alarms checkbox, depending on whether you want to be prompted when you run QuestSuite Professional. If this option is unchecked (so alarms are enabled), and re-certification alarms exist (that is, at least one alarm is going off), a message box will prompt you when you start the program.
3. Choose the Show Re-certifications button to open a window showing a list of the instruments with re-certifications pending and the number of days until they're due.
27
4. Choose OK to save your settings and close the dialog box. (Or you can click the other tabs to set up their options.)
Related topics
Setting up the User Profile database Setting up the Instrument database Setting up the software license Setting up Remote Connection Setting up your printer Setting re-certification alarms for instruments
28
Setting up the User Profile database
The User Profile database stores information about the users of the various Quest Technologies instruments. Use the User Profile database to add, edit, or delete information about subjects (people being monitored by instruments, such as noise dosimeters), companies (where the subjects work), and work areas (places where subjects were working while being monitored). Information entered into the User Profile database will be available later for entry into newly retrieved data files. This information can also be edited or entered in the data files later. To set up the User Profile database:
1. From the Setup menu, choose User Profile Database. The User Profile Database dialog box opens, with the Subject Name tab showing.
2. To add a subject nameChoose the Add button, type the name, and choose OK. To change a subject nameSelect the name from the list, choose the Modify button, make your changes, and choose OK. To delete a subject nameSelect the name from the list, and choose the Delete button. QuestSuite prompts you to confirm the deletion. Choose Yes to delete the name from the database (or choose No to cancel the deletion).
3. To add, change, or delete companies, click the Company tab. To add a companyChoose the Add button, type the company name, and choose OK. To change a companySelect the company from the list, choose the Modify button, make your changes, and choose OK. To delete a companySelect the company from the list, and choose the Delete button. QuestSuite prompts you to confirm the deletion. Choose Yes to delete the company from the database (or choose No to cancel the deletion).
4. To add, change, or delete work areas, click the Work Area tab. To add a work areaChoose the Add button, type the work area's name, and choose OK. To change a work areaSelect the work area from the list, choose the Modify button, make your changes, and choose OK. To delete a work areaSelect the work area from the list, and choose the Delete button. QuestSuite prompts you to confirm the deletion. Choose Yes to delete the work area from the database (or choose No to cancel the deletion).
5. When you're done working in the User Profile Database dialog box, choose OK to save your changes and close the dialog box. (Or choose Cancel to close the dialog box without saving your changes.)
Related topics
Setting up System Options Setting up the Instrument database Setting up the software license Setting up Remote Connection Setting up your printer
29
Setting up the Instrument database
The Instrument database stores information about the various Quest Technologies instruments being used. Use the Instrument database to add, edit, or delete information about these instruments, including their re-certification frequency and due dates. Note: Whenever data is retrieved from an instrument, QuestSuite Professional checks the Instrument database. If that instrument is not found in the database, a new entry is automatically added. This entry is given a purchase date of the current date. Because an instrument's re-certification alarm refers to the instrument's purchase date, you might want to change the default date to the actual purchase date or to some other date that is more appropriate for re-certifications. To set up the Instrument database:
1. From the Setup menu, choose Instrument Database. The Instrument Database dialog box opens.
2. To add an instrument—Choose the Add button. Select the instrument from the Model drop-down list box. Enter the instrument's serial number, firmware version, purchase date, and description. Set a re-certification alarm. Choose OK. Tip: The serial number and firmware version are usually displayed temporarily on the instrument's screen when you first turn the instrument on.
To change instrument information—Select the instrument from the list, and choose the Edit/View button to open the Instrument dialog box. Make your changes, and choose OK. To delete an instrument—Select the instrument from the list, and choose the Delete button. QuestSuite prompts you to confirm the deletion. Choose Yes to delete the instrument from the database (or choose No to cancel the deletion).
3. Choose OK to close the Instrument Database dialog box. Note: In the Instrument dialog box, the Certification History section is not available until after you have added an instrument. (Add the instrument; select it in the Instrument database; then choose Edit>View.)
Related topics
Setting re-certification alarms for instruments Maintaining an instrument's certification history Setting up System Options Setting up the User Profile database Setting up Remote Connection Setting up the software license Setting up your printer
30
Setting up Remote Connection
If your computer has a modem, you have access to a phone line, and your remote instrument is connected to a modem, you can use QuestSuite Professional to program remote instruments and to retrieve data from remote instruments. (You cannot go through a network; your computer's modem must be connected directly to a phone line.) To set up a remote connection:
1. From the Setup menu, choose Remote Connection. The Connect Remote Recorder dialog box opens.
2. Type the phone number needed to reach the remote instrument, and choose Dial.
3. You can now program the instrument or retrieve data from it.
4. After you've conducted your test and retrieved data, you can disconnect. Choose Setup>Hang Up.
Related topics
Setting up System Options Setting up the User Profile database Setting up the Instrument database Setting up the software license Setting up your printer
31
Setting up the software license
When QuestSuite Professional is installed and run once on a computer on which it has never been installed before, the software becomes a 60-day trial version. For those 60 days, the software has all the features of a registered copy. At the end of the trial period, if QuestSuite Professional hasn't been registered, you can still view and manipulate any data files created during the trial period, but most of the data retrieval and instrument setup functions will no longer work. There are two exceptions, however:
• The Indoor Air Quality applet will continue to work; you will not be locked out of that.
• In the Noise applet, you will still be able to use the Setup dialog box for the Q-100 noise dosimeter. You'll still be able to set up the instrument and to save and load setup files.
Using the Setup>License menu, you can do the following:
• Register or upgrade your copy of QuestSuite Professional.
• Import or export the program's license (so you can move your copy of QuestSuite Professional to a different computer).
• Open a dialog box that contains license status information.
Registering or upgrading your copy of QuestSuite Professional The Setup>License>Register Or Upgrade command opens the Register dialog box. You can use this dialog box to register your software or to upgrade a registered copy of the software. (For example, you can upgrade from a stand-alone license to a network license, or add users to a network license.) This dialog box contains a reference code, which is unique to the computer on which QuestSuite Professional is installed. You'll need to give this reference code to Quest Technologies so that we can use it to generate an unlock code for you. You'll use this unlock code to complete the registration or upgrade process. You can then use all of the features of the software for an unlimited time. Upgrading a registered copy of QuestSuite Professional deletes the existing license and replaces it with a new one. To register or upgrade your copy of QuestSuite Professional:
1. From the Setup menu, choose License. From the flyout menu, choose Register Or Upgrade. The Register dialog box opens.
2. Notice the reference code in the dialog box. Use the Quest Technologies Web site (www.quest-technologies.com), or email the Customer Service department of Quest Technologies, and submit this reference code. (You can select this code in the Register dialog box, copy the code to the Windows clipboard, and paste it into an email message.) You can also call Customer Service.
3. Quest Technologies will provide you with an unlock code. Type or paste that code into the Unlock Code text box in the Register dialog box, and choose the OK button. If the last set of question marks in the Unlock Code box remains after you have pasted in the new unlock code, don't worry about it. The software registration or upgrade process should still be successful. Also, if you open the Register dialog box again later, you'll see that the Unlock Code box displays a series of question marks again, as it did before you
32
registered or upgraded. This is normal. The unlock code is intended for one-time use. The License Status code contains the registration information.
Moving your copy of QuestSuite Professional to another computer Importing and exporting your QuestSuite Professional software license allows you to move the license to a different computer, including back to the computer that the license came from. For example, if you have a desktop computer with QuestSuite Professional registered on it, and you want to use QuestSuite Professional on your laptop computer, you can transfer the license. If you have a multi-user network license, you can also export single-user licenses from it, thereby reducing the number of simultaneous users allowed for your network copy of QuestSuite Professional. If you have a site license, you effectively have a network license with an unlimited number of users. To transfer a license from one computer (the source) to another (the destination), and back again:
1. Install QuestSuite Professional on the destination computer. The software will initially run as a trial version. (This procedure assumes that a registered copy of QuestSuite Professional is already installed on your desktop computer.)
2. On the source computer, open QuestSuite Professional, and choose Setup>License>Export License. On the destination computer, open QuestSuite Professional, and choose Setup>License>Import License.
3. Type (or copy and paste) the reference code from the Import License dialog box on the destination computer into the Export License dialog box on the source computer. Choose OK. The Export License dialog box displays an unlock code.
4. Type (or paste) the unlock code from the Export License dialog box on the source computer into the Import License dialog box on the destination computer. Your source copy of QuestSuite Professional is now a trial version, and your destination PC's copy of QuestSuite Professional is now a registered copy.
5. To move the license back to the source computer, repeat steps 2 through 4, but switch the commands for each computer. (The former destination computer is now the source computer, and the former source computer is now the destination computer.)
Note: Exporting a license from a multi-user license works the same way as exporting a single-user license, except that the source of the exported license is still usable if there is at least one license remaining. All multi-user licenses are effectively network licenses, although they don't have to be used on a network.
Checking the status of your software license
The License Status dialog box contains a reference code that tells Quest Technologies what kind of license you have. To check the status of your software license, you'll need to contact Quest Technologies. To check the status of your software license:
1. Choose Setup>License>License Status to open the License Status dialog box.
2. Email or call Quest Technologies, and give the Customer Service representative this
33
code. After entering this code into software used by Quest Technologies, the Customer Service representative will tell you the status of your software license.
Tip: For information about software license options, see the Quest Technologies Web site.
Related topics
Setting up System Options Setting up the User Profile database Setting up the Instrument database Contacting Quest Technologies
34
Setting up your printer
The Print Setup command in QuestSuite Professional's File menu opens the standard Windows Print Setup dialog box. Here, you choose your printer, paper orientation (portrait or landscape), paper size, and paper source. You can print charts and reports in QuestSuite Professional.
Related topics
Printing charts Printing reports
35
Maintaining instrument records
Maintaining an instrument's certification history
After an instrument has been re-certified, use the Certification dialog box to add to the instrument's certification history. To maintain an instrument's certification history:
1. From the Setup menu, choose Instrument Database. The Instrument Database dialog box opens.
2. Select the instrument for which you want to add certification information, and choose the Edit/View button to open the Instrument dialog box.
3. Choose the Add button to open the Certification dialog box. Note: The Add button is not available until the selected instrument's re-certification due date has been reached.
4. Enter the certification date, the certificate number, and the name of the organization that performed the certification. Choose OK to return to the Instrument dialog box.
5. Choose OK to close the Instrument dialog box. Then choose OK to close the Instrument Database dialog box.
Note: In the Instrument dialog box, the Certification History section is not available until after you have added an instrument. (Add the instrument; select it in the Instrument database; then choose Edit>View.)
Related topics
Setting re-certification alarms for instruments Viewing pending re-certification alarms Setting up System Options Setting up the Instrument database
36
Setting re-certification alarms for instruments
Use the Instrument dialog box to set alarms to remind yourself of instrument re-certification due dates and to maintain each instrument's certification history. To set re-certification alarms:
1. From the Setup menu, choose Instrument Database. The Instrument Database dialog box opens.
2. Select the instrument for which you want to set an alarm, and choose the Edit/View button to open the Instrument dialog box.
3. In the Certifications section, enter a Certification Frequency. (The default is 12 months, which will start from the purchase date entered for the instrument and then repeat 12 months after each subsequent re-certification entry.) In the Notify box, specify when you want the instrument's re-certification alarm to go off. (The default is 30 days before the due date.) The default 12-month certification frequency and 30-day notification period apply to all types of instruments. Note: For alarms here to be activated, the Disable Re-certification Alarms checkbox must be unchecked on the Re-certifications tab of the System Options dialog box.
4. Choose OK to close the Instrument dialog box. Then choose OK to close the Instrument Database dialog box.
Related topics
Maintaining an instrument's certification history Viewing pending re-certification alarms Setting up System Options Setting up the Instrument database
37
Viewing pending re-certification alarms
If an instrument's re-certification due date has been reached, then when you launch QuestSuite Professional, it will display this message: "One or more instruments in the Instrument database require re-certification. Do you want to view a list of those re-certification alarms?" Choose Yes to open the Re-Certification Alarms dialog box. For each instrument needing re-certification, this dialog box shows:
• The model and serial number of the instrument.
• The re-certification due date.
• The number of days remaining until the due date.
Related topics
Maintaining an instrument's certification history Setting re-certification alarms for instruments Setting up System Options Setting up the Instrument database
38
File operations
Overview of file operations
Menu and dialog-box choices often change depending on whether any files are open, on the types of files that are open, and on which type of open file is active when you choose a command from the menu. This concept applies to the File menu. Choices available in the File menu change depending on whether or not files are open. If no files are open, the Close, Print Preview, and Send commands are dimmed. Some File-menu choices apply to only certain file types:
• Import—You can import old QuestSuite data files.
• Search—You can search for data files.
• Send—You can send data, chart, and report files as email attachments.
Related topics
The application window File types you'll use
39
Opening and closing files
You can open files of any of the four types: data files, chart files, report files, and setup files. To open a file:
1. From the File menu, choose Open. From the flyout menu, choose Data File, Chart File, Report File, or Setup File. The Open dialog box appears.
You can also click the icon on the toolbar. If you do this, the Files Of Type drop-down list box in the Open dialog box lists data files, chart files, report files, and setup files.
2. Type or select the file name, and choose the Open button. Note: Your choices for opening files change depending on how or where you open the file:
• The File>Open command offers four types of files in the flyout menu. If you choose Data File, the Open dialog box displays information about the files. This information consists of the following: instrument model and serial number, start date, end date, subject, company, work area, and applet version.
• If you choose the Open An Existing Data File operation from within an applet, the Open dialog box lists only that applet's file type (say, .ndat files in the Noise applet) in the Files Of Type list box.
• When you open a setup file from within an instrument's Setup dialog box, the Open dialog box lists only that applet's type of setup file.
Closing files
Closing a data file also closes all unsaved chart and report views of that data file. To close a file:
1. If more than one file is open, activate the file you want to close. (Click on its window to activate it, or use the Window menu.)
2. From the File menu, choose Close.
Related topics
File types you'll use Saving files Importing files Searching for data files Sending files as email attachments
40
Saving files
In the Save As dialog box, the file type available in the Save As Type drop-down list box depends on the type of file that is active in the QuestSuite Professional application window. To save a file for the first time or with a new name:
1. If more than one file is open, activate the file you want to save. (Select it from the Window menu.)
2. From the File menu, choose Save As. The Save As dialog box opens.
3. From the Save In list box, select the drive and directory where you want to save the file.
4. In the Save As Type box, the correct type should already be selected. (The file type available in this box depends on the type of file that was active when you chose the Save As command.)
5. Type a file name, and choose the Save button. To save your changes in the current file:
• Choose File>Save, or click the Save tool, .
Related topics
Opening and closing files Importing files Saving charts Saving reports Saving setup files
41
Importing files
You can import data files created in previous versions of QuestSuite. To import a QuestSuite data file into QuestSuite Professional:
1. In QuestSuite Professional, open the File menu, and choose Import.
2. From the Look In list box, select the drive and directory containing the file you want.
3. In the Files Of Type drop-down list box, select the type of file you want to import.
4. Type or select the file name you want, and choose the Open button. The file opens, and the file-name extension changes automatically to .*dat (depending on the type of data file).
Imported files are automatically saved in their new formats, in the directory specified for saving data files in QuestSuite Professional.
Related topics
File types you'll use Opening and closing files Saving files Searching for data files Overview of data files Creating and opening setup files
42
Searching for data files
You can search for data files by using several search criteria: instrument model and serial number, subject name (person being monitored), company, work area (location of the test), and starting and ending dates (to find any files that have data recorded within the time span specified). To search for a data file:
1. From the File menu, choose Search. The Search For Data Files window opens.
2. Specify the drive and directory that you want to search in. (Type the path in the Search In box, or use the Browse button.) If you want the search to look in all the subdirectories under the directory you have specified, check the Include Subfolders checkbox.
3. Specify your search criteria. You can leave the default option of All, or you can select one option from any combination of fields. To specify starting and ending dates, first check the Check Dates checkbox. Tip: Searches are not case-sensitive, and QuestSuite Professional will find all files that have your search criteria entered anywhere in the corresponding fields. For example, if you enter "Quest Technologies" in the Company field, QuestSuite Professional will find all files with "Quest Technologies" anywhere in that field (including, for example, "Quest Technologies, Inc."). This allows you to search for files without knowing exactly how information was entered into a field.
4. Choose the Find Now button. The results (if any) appear in the box at the bottom of the window. Double-click on a listed file name to open the file.
5. Click the window's Close icon to close the Find window. (If you want to leave it open, you can also minimize the window to get it out of your way.)
Canceling a search
When you cancel a search by clicking the Stop button, any files found remain in the results box. So, when you find the file you want, you can save time by canceling the rest of the search.
Related topics
Overview of data files Opening and closing files Importing files
43
Sending files as email attachments
You can use the Send command to send QuestSuite Professional files by email to other people. The Send command opens your email application, starts a new message, and adds the selected file as an attachment. You can send data files, chart files, and report files. To send a file:
1. Open the file that you want to send. (If you have more than one file open, make sure that the one you want to send is active.)
2. From the File menu, choose Send. The Send command opens your email application, starts a new message, and adds the selected file as an attachment.
3. Fill in the To field (and other fields, such as CC and Subject, if you want). Compose your message, and send it. After you send the message, you should be returned to QuestSuite Professional.
Note: If your computer is not on a network or does not have a MAPI-compliant email application, this option will not be available. (MAPI stands for Messaging Application Programming Interface, a system built into Windows for enabling different email applications to work together.)
Related topics
Overview of data files Opening and closing files Importing files
44

Exiting QuestSuite Professional To exit QuestSuite Professional:
• From the File menu, choose Exit. Or:
• Click the Close icon in the application window.
45
Conducting tests and retrieving data
Overview: Setting up tests, conducting tests, and getting data
The process of recording data and getting it from an instrument involves seven main steps:
1. In QuestSuite Professional, select the applet for the instrument you want to use. Then select the instrument, and choose Set Up The Instrument.
2. In the Setup dialog box, choose the settings that you want to use to program the instrument. (Use the default settings; create a new setup file; or open a setup file.) Quest Technologies instruments come factory-programmed for common test conditions, but if you want to create your own settings for collecting data, you'll need to create setup files and program the instruments with the new settings.
3. Connect with the instrument, either locally or remotely. For a local connectionPlug the instrument's RS-232 cable into your computer's serial port. For a remote connectionConnect with the instrument by modem, and choose Setup>Remote Connection. Steps 2 and 3 can be done in any order, but you must complete both steps before you can do the following steps.
4. Send the setup information to the instrument. (Choose the Program button in the Setup dialog box.)
5. Conduct the test and record data. (You can do this manually on the instrument or in QuestSuite Professional by using the Remote Control command if it's available for the instrument you're using.) When you're done testing, stop recording.
6. Retrieve the data, and name the file in which it will be stored. (Choose the Retrieve Instrument Data operation for the instrument.) If the instrument is connected directly to your computer, choosing this operation opens the COM port. When you click the Retrieve button, QuestSuite Professional tries to access the instrument. If the instrument is not there, the software retries and will eventually time-out and report a communications error.
7. Disconnect. (Choose Setup>Hang Up if connected by modem, or just unplug the instrument from the computer.)
Related topics
Creating and opening setup files Saving setup files Connecting with an instrument Programming an instrument Setting an instrument's date and time
46

Retrieving setup information from an instrument Retrieving data from an instrument Clearing an instrument's memory Disconnecting from a remote instrument
47
Connecting with an instrument
Before you can connect with the instrument, you need to set up communications options. To connect with an instrument directly:
1. Plug the instrument's RS-232 cable into your computer's serial port. Make sure the instrument is on.
2. You can now program the instrument or retrieve data from it. When the instrument is connected directly to your computer, choosing the instrument's Retrieve Instrument Data operation opens the COM port. When you click the Retrieve button in the Retrieve Data dialog box, QuestSuite tries to access the instrument. If the instrument is not there, the software retries and will eventually time-out and report a communications error. (All this also happens if you've chosen the Set Up The Instrument operation, and then clicked the Program or Retrieve buttons in the instrument's Setup dialog box.)
3. If the direct connection is successful, QuestSuite completes the selected operation. To connect with an instrument remotely:
1. The instrument (at the remote location) should be on and connected via modem to a phone line. The computer should also have its modem connected to a phone line.
2. From the Setup menu, choose Remote Connection. In the Connect Remote Recorder dialog box, type the phone number for the instrument you want to connect with, and choose the Dial button.
3. You can now program the instrument or retrieve data from it.
4. After you've conducted your test and retrieved data, you can disconnect. Choose Setup>Hang Up.
At all times, the status bar displays the connection type (local or remote) along with the port number and the baud rate.
Related topics
Programming an instrument Retrieving setup information from an instrument Retrieving data from an instrument Remotely controlling the heat stress monitors Remotely controlling the indoor air quality monitors
48
Programming an instrument
Before you can program an instrument, you must first have a setup file open and your computer must be connected to the instrument, either directly by cable or remotely by modem. (Quest Technologies instruments come factory-programmed for common test conditions, but if you want to create your own settings for collecting data, you'll need to create setup files.) There are three ways to choose a setup file for programming:
• Create a new setup file (and use it right away).
• Open an existing setup file.
• Retrieve setup information from an instrument, modify the settings, and save the settings in a new setup file.
Note: Some instruments cannot be programmed if they still hold data that has not been cleared. If you try to program one of these instruments, you'll get a message box saying that sending new settings will cause the logged data in the unit to be cleared. You'll need to clear the instrument's memory (clear the data from it) before you can program the instrument. (Retrieving data does not clear it from the instrument.) To program an instrument:
1. Make sure the instrument is on. If you're retrieving data from a local instrument, then connect it by cable to the computer's serial port. If you're retrieving data from a remote instrument, connect with it by modem. (See Connecting with an instrument.)
2. Select the applet for the instrument you're using, and then select the instrument.
3. Choose the Set Up The Instrument operation to open the Setup dialog box. Create or open a setup file.
4. If you are programming a remote instrument, then dial into (if you haven't already).
5. In the Setup dialog box, choose the Program button.
6. When the "Recorder successfully programmed" message is displayed, choose OK. Instruments maintain the most recent setup parameters, so you do not need to reprogram an instrument unless a change is required or unless the internal batteries lose power or are removed for longer than 2 minutes.
Related topics
Connecting with an instrument Retrieving setup information from an instrument Retrieving data from an instrument Remotely controlling the heat stress monitors Remotely controlling the indoor air quality monitors
49
Setting an instrument's date and time
You'll need to set the date and time for each instrument the first time it's used and any time the battery loses power. You can set the date and time both locally and remotely. To set an instrument's date and time:
1. Make sure the instrument is on. Make sure the instrument is connected by cable to your computer's serial port or is connected by modem.
2. Select the applet for the instrument you're using, and then select the instrument.
3. Choose the Set The Instrument's Date/Time operation to open the Set Instrument Date/Time dialog box.
4. If you are programming a remote instrument, then dial into it to connect with it by modem. (See Connecting with an instrument.)
5. Type or select the date and the time in the fields provided, and choose OK.
6. If you're connecting remotely, choose Setup>Hang Up. If you're connecting locally, just unplug the instrument's serial cable from the computer.
Related topics
Programming an instrument Remotely controlling the heat stress monitors Remotely controlling the indoor air quality monitors
50
Retrieving setup information from an instrument
You can retrieve an instrument's setup parameters by using the Setup dialog box. You can then modify the settings and program the instrument with them, and/or save them as a new setup file. To retrieve setup parameters from an instrument:
1. If you're retrieving setup parameters from a local instrument, then connect it by cable to the computer's serial port, and make sure the instrument is on. If you're retrieving setup parameters from a remote instrument, connect with it by modem. (See Connecting with an instrument.)
2. Select the applet for the instrument you're using, and then select the instrument.
3. Choose the Set Up The Instrument operation to open the Setup dialog box.
4. Choose the Retrieve button. If the connection is successful, the settings in the dialog box will change to reflect the current setup of the instrument. (If the connection is unsuccessful, a communications error message will appear. Check the connection to the instrument, and try again.)
5. Change any settings that you want to change.
6. To save the settings in a file, choose the Save As button. In the Save As dialog box, specify a directory and a file name, and choose the Save button.
7. To program the instrument with the settings, choose the Program button in the Setup dialog box.
Related topics
Programming an instrument Retrieving data from an instrument Remotely controlling the heat stress monitors Remotely controlling the indoor air quality monitors
51
Retrieving data from an instrument
When you've conducted tests and you have a set of test data that you want to work with, retrieve the data from the instrument. Note: A data file can store one test or a series of tests. The number of tests in a data file depends on the number of tests that are stored in the instrument when you retrieve data. Data stays in the instrument until you clear it. To retrieve recorded data from an instrument:
1. Make sure the instrument is on. If you're retrieving data from a local instrument, then connect it by cable to the computer's serial port. If you're retrieving data from a remote instrument, connect with it by modem. (See Connecting with an instrument.)
2. Select the applet for the instrument you're using, and then select the instrument.
3. Choose the Retrieve Instrument Data operation to open the Retrieve Data dialog box.
4. Specify a file name (and a directory) under which to save the data that will be retrieved. Fill in the other file-information fields.
5. Choose the Retrieve button. Each data file is displayed in its own window. From here, you can view, save, and print charts and reports for the data. Tip: If you do not supply a file name, QuestSuite uses the default file name of QuestSuite Professional-#, where # is a number that starts at 1 and then goes up by one for each data file created during the current work session. If you exit QuestSuite and then start it again, the number starts at 1 again. Think of this default file name as being similar to Microsoft Word's default file name of "Document1." You could use it, but it's not descriptive. It's better to give your data files names that are informative.
Note: To retrieve data from an instrument, there must be data already recorded. You can do this manually—by pressing the Record button on the instrument (it's typically a toggle to start and stop recording)—or you can do this through the QuestSuite Professional software, using the Remote Control command for instruments that have it available.
Canceling data retrieval You can cancel your data retrieval by choosing the Cancel button. The retrieval stops and the Retrieve Data dialog box closes. All data in the instrument stays intact.
Related topics
Overview of data files Clearing an instrument's memory Remotely controlling the heat stress monitors Remotely controlling the indoor air quality monitors
52
Clearing an instrument's memory
For some instruments, you need to clear their memory (remove data) before you can program them. If you try to program one of these instruments (while it still has data), you'll get a message box saying that sending new settings to the instrument will cause the logged data in the unit to be cleared. You'll need to clear the instrument's memory before you can program the instrument. (Retrieving data does not clear it.) The memory-clearing requirement varies by instrument type:
• Noise dosimetersYou must clear memory before reprogramming the instrument.
• Sound level metersYou must clear memory before reprogramming the instrument only if you are changing modes (from Session mode to non-Session mode, or vice versa).
• Heat stress monitorsFor most of them, you do not need to clear memory before reprogramming. For the QT-III monitor, however, you do.
• Gas monitorsYou do not need to clear memory before reprogramming the instrument.
• Indoor air quality monitorsYou must clear memory before reprogramming the instrument.
To clear an instrument's memory: 1. The instrument should be on and should be connected either by cable to the computer's
serial port or by modem. (If by modem, choose Setup>Remote Connection.)
2. Select the applet for the instrument you're using, and then select the instrument.
3. Choose the Clear The Instrument's Memory operation. The following confirmation message is displayed: "Are you sure that you want to clear the instrument's memory?"
4. Choose Yes.
Related topics
Retrieving data from an instrument Remotely controlling the heat stress monitors Remotely controlling the indoor air quality monitors
53
Disconnecting from a remote instrument
When you're done working with a remote instrument (one connected by modem), you can turn off communications between it and QuestSuite Professional. To end a remote connection with an instrument:
• From the Setup menu, choose Hang Up. If you are working with an instrument that is connected directly to your computer's serial port, you do not need to end the connection. You can just unplug the instrument from the computer.
Related topics
Connecting with an instrument Remotely controlling the heat stress monitors Remotely controlling the indoor air quality monitors
54
Your working environment
Setup files
Overview of setup files
Setup files store settings and parameters for recording data on instruments. You use these settings to program the instruments. All instruments come with default setup values, which you can change. You can save your new settings in setup files. Typical parameters include threshold level, exchange rate, and weighting (for noise dosimeters); logging intervals, exchange rate, and weighting (for sound level meters); logging rate and temperature scale (for heat stress monitors); logging type, sensor type, and alarm levels (for gas monitors); and instrument mode, temperature scale, and inputs (for indoor air quality monitors). You work with setup files in the Setup dialog box for a specific instrument. In this dialog box, you can do the following:
• View, create, open, and save setup files.
• Retrieve setup information from an instrument.
• Program an instrument.
Related topics
The Setup dialog box Creating and opening setup files Saving setup files Programming an instrument Retrieving setup information from an instrument
55
The Setup dialog box
No matter which instrument you are using, the Setup dialog box will contain certain common features:
• Tabs—Used to set parameters or values, select options, and (on the Print tab), set print options for instrument data if the instrument has a Print function and is connected directly to a printer.
• Program button—Sends the current setup information to the instrument that is connected to the computer.
• Retrieve button—Extracts setup information from an instrument, so you can modify the parameters, and then either program the same or another instrument or save the setup information to a setup file.
• Open, Save, Save As, Close, and Help buttons—Used for opening, saving, and closing setup files and for getting Help on the Setup dialog box.
• Cancel button—Cancels your changes and closes the dialog box.
Related topics
Programming an instrument Retrieving setup information from an instrument Creating and opening setup files Saving setup files Setting up noise dosimeters Setting up sound level meters Setting up heat stress monitors Setting up gas monitors Setting up indoor air quality monitors
56
Creating and opening setup files
To create a setup file: 1. Select the applet for the instrument for which you want to create a setup file. Then select
the instrument.
2. Choose Set Up The Instrument. The Setup dialog box opens.
3. Modify default settings as you wish, or retrieve settings from the instrument and modify those.
4. Save the setup file. To open a setup file:
1. From the File menu, choose Open and then choose Setup File. The Open dialog box appears. From the Files Of Type drop-down list box, select the type of setup file you want to use. (Or leave the default of All Setup Files to see a list of all of them.)
You can also click the icon on the toolbar. If you do this, the Files Of Type drop-down list box in the Open dialog box lists data files, chart files, report files, and setup files.
2. Type or select the file name, and choose the Open button. Note: When you open a setup file from within an instrument's Setup dialog box, the Open dialog box lists only that applet's type of setup file.
Related topics
The Setup dialog box Saving setup files
57
Saving setup files
To save a setup file you've just created: 1. In the Setup dialog box, choose the Save As button. The Save As dialog box opens.
2. Specify a file name and directory, and choose the Save button. To save a setup file you've modified:
• In the Setup dialog box, choose the Save button. The file will be saved with the same name and in the same directory.
Related topics
The Setup dialog box Creating and opening setup files
58
Data files
Overview of data files
Data files store the information recorded by and retrieved from Quest Technologies instruments. A data file can store one test or a series of tests. The number of tests in a data file depends on the number of tests that are stored in the instrument when you retrieve data. Data stays in the instrument until you clear it. In addition to the test data, a data file includes information entered into the Retrieve Data dialog box when the data was retrieved. This informationsubject name, company, work area, description, and commentscan also be added or edited later. There are two ways to create a data file in QuestSuite Professional:
• Retrieve recorded data from an instrument, and save the data in a file.
• Import a data file created in a previous version of QuestSuite, and save it as a QuestSuite Professional data file.
All data files have a File Summary and individual tests. Some types of data files have other information, too, such as Calibrations, Filters, Combination Tests, Group Summaries, or Session Summaries. QuestSuite Professional creates charts and reports automatically. In a data-file window, you can do the following:
• View and save data files.
• In some data files, perform what-if analyses.
• View, save, annotate, and print charts.
• View, save, print, and export reports. Tip: In chart tabs, you can right-click to display a context menu (a pop-up menu of commands relevant to the area where you right-clicked).
Related topics
Opening and closing files The data-file window Searching for data files Sending files as email attachments Overview of charts Overview of reports
59
The data-file window
All data files have a File Summary and individual tests. Some types of data files have other information, too, such as Calibrations, Filters, Combination Tests, Group Summaries, or Session Summaries. QuestSuite Professional creates charts and reports automatically, and you can view these in the data-file window. The data-file window has two main sections: an Explorer pane and a data pane.
• The Explorer pane, on the left, displays a Windows-Explorerlike tree structure. You can click items in the tree to select the File Summary or individual tests (or other items available, such as Calibrations). You can click an item's + sign to expand the item's tree (show all components of that item, such as all tests under the Tests label). You can click an item's sign to collapse the item's tree.
• The data pane, on the right, contains tabs (similar to dialog-box tabs) across the top of the pane, plus sub-tabs across the bottom of the pane. The tabs differ depending on the kind of data file that's open and on whether you are viewing a File Summary or an individual test. Tabs typically display data, settings, charts, or reports.
A File Summary window contains the following tabs:
• Summary, with any or all of these sub-tabs: General, Setup, Values, and Profile.
• Other tabs depend on the file type but typically display data tables (such as Projected TWA in noise files), charts, and reports.
A Test window contains the following tabs:
• Summary, with any or all of these sub-tabs: General, Setup, Values, and Comments.
• Other tabs depend on the file type, but typically display history charts and reports.
Related topics
Working in the data-file window Overview of charts Overview of reports Components of a noise data file Components of a sound data file Components of a heat stress data file Components of a gas data file Components of an air quality data file
60
Working in the data-file window
The data-file window has two main sections: an Explorer pane and a data pane. You can change the width of these panes. If you hide the QuestSuite Navigation Bar, the data-file window can fill the application window. To change the width of the panes:
1. Place the mouse pointer over the Explorer pane's right edge. The mouse pointer should change to a double-arrow with vertical lines:
2. Drag the edge left or right until you get the pane sizes you want.
To use the Explorer pane to change your view of the data pane:
• To select the file summary or an individual test (or other items available, such as Calibrations), click the item in the tree.
• To expand an item's tree (show all components of that item, such as all tests under the Tests label), click an item's + sign.
• To collapse the item's tree, click an item's sign. To navigate in the data pane:
• Click the tab or sub-tab that you want to display.
Related topics
Overview of charts The chart tabs Overview of reports The report tabs
61
Charts
Overview of charts
When you open or create a data file, charts are created automatically (where applicable). Different charts are available for different types of instruments. Also, different charts are available for file summaries and for individual tests within a data file. QuestSuite Professional provides the following chart types:
• Statistics chartShows the amplitude distribution for noise data: the percentage of samples that occurred at each sound level measured. (You can also think of this as the percentage of time that noise was recorded at a particular decibel level.) Statistics charts are available in noise and sound data files.
• Exceedance chartShows the percentage of time that samples occurred above a particular decibel level. Exceedance charts are available in noise and sound data files.
• History chartShows the time history of recorded data. For example, in noise data files, a history chart shows noise exposure levels over time. In heat stress data files, a history chart shows heat stress exposure levels over time. History charts are available in all types of data files.
Related topics
The chart tabs Chart properties Chart axis properties Annotating charts Overview of reports Components of a noise data file Components of a sound data file Components of a heat stress data file Components of a gas data file Components of an air quality data file
62
The chart tabs
On a chart tab, you can do the following:
• Change the chart's appearance: • Change the chart's style. (Use the Gallery tool or the Chart Properties dialog box.) Charts
are already displayed in the style that best suits their data, however, so you don't need to change chart styles.
• Change chart colors. (Use the Color tool, the Palette Bar, the Pattern Bar, the Color command in the chart's context menu, or the Chart Properties dialog box.)
• Show or hide grid lines on the chart. (Use the toolbar or the Chart Properties dialog box.) You can display horizontal or vertical grid lines, or both at once.
• Change the chart from 3D to 2D, or vice versa, and add a Z-Clustered effect. • Rotate the chart. (Clicking the Rotate tool opens the Chart Properties dialog box and
displays the 3D tab.) The Rotate tool is available only if the chart is displayed in 3D mode.
• Display point labels. (Use the context menu or the Chart Properties dialog box.) • Add or edit a chart title. (Use the context menu or the Chart Properties dialog box.) • Change the font for the chart title and point labels. (Select the chart title before opening
the Font dialog box.)
• Show or hide the chart toolbar(s).
• Show or hide the Data Editor, and show or hide the chart legend. You can also move and resize the Data Editor and the legend, and change their font.
• Copy charts to other files.
• Print charts.
• Save chart files. For history charts, you can also do the following:
• Use the Annotate toolbar to annotate charts.
• Zoom in and out on the chart (magnify the image and return it to normal).
• Add limit lines or scan lines. (A limit line and a scan line cannot be displayed simultaneously on the same chart.)
• Switch traces and axes. Note that the Traces & Axes tool is not available (it's dimmed) when a chart is magnified (with the Zoom In tool).
• Change the time range displayed on the chart.
• In noise and sound files, edit data points.
• In data files for area heat stress monitors, use the Stay Time tool to change the settings displayed for a chart's scan line.
• In data files for area heat stress monitors, use the Display Sensor Bars tool to show or hide data from each of three sensor bars.
63
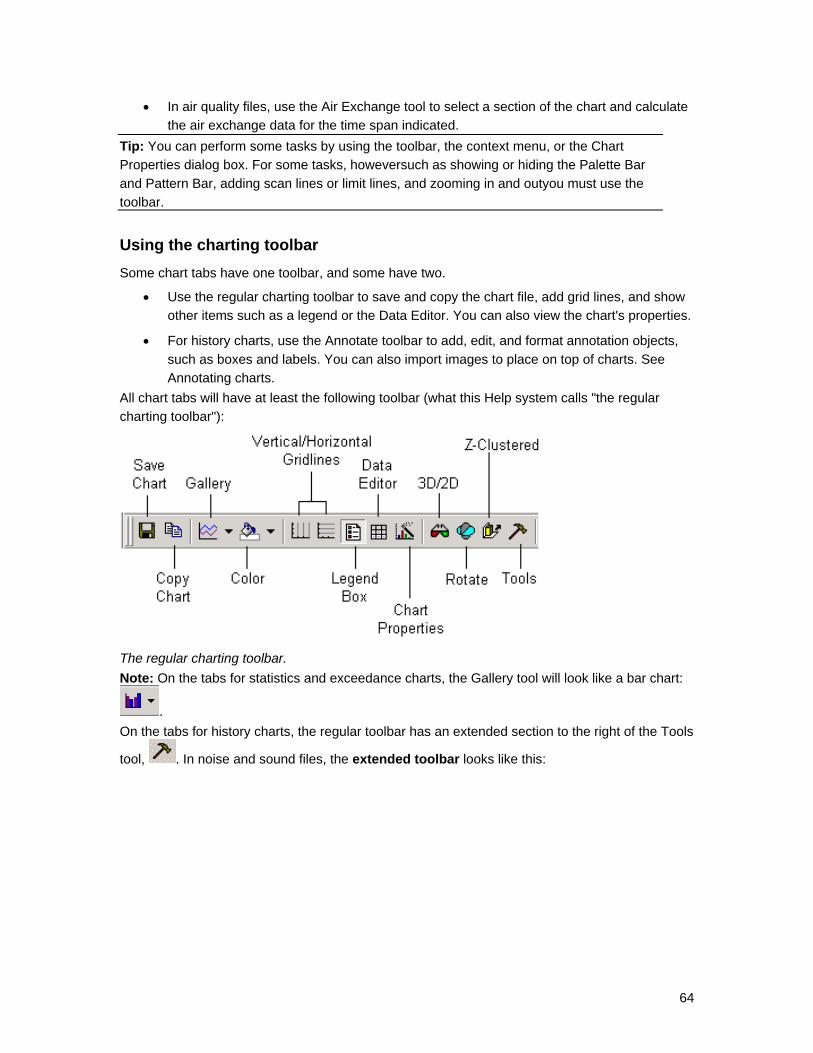
• In air quality files, use the Air Exchange tool to select a section of the chart and calculate the air exchange data for the time span indicated.
Tip: You can perform some tasks by using the toolbar, the context menu, or the Chart Properties dialog box. For some tasks, howeversuch as showing or hiding the Palette Bar and Pattern Bar, adding scan lines or limit lines, and zooming in and outyou must use the toolbar.
Using the charting toolbar
Some chart tabs have one toolbar, and some have two.
• Use the regular charting toolbar to save and copy the chart file, add grid lines, and show other items such as a legend or the Data Editor. You can also view the chart's properties.
• For history charts, use the Annotate toolbar to add, edit, and format annotation objects, such as boxes and labels. You can also import images to place on top of charts. See Annotating charts.
All chart tabs will have at least the following toolbar (what this Help system calls "the regular charting toolbar"):
The regular charting toolbar. Note: On the tabs for statistics and exceedance charts, the Gallery tool will look like a bar chart:
. On the tabs for history charts, the regular toolbar has an extended section to the right of the Tools
tool, . In noise and sound files, the extended toolbar looks like this:
64
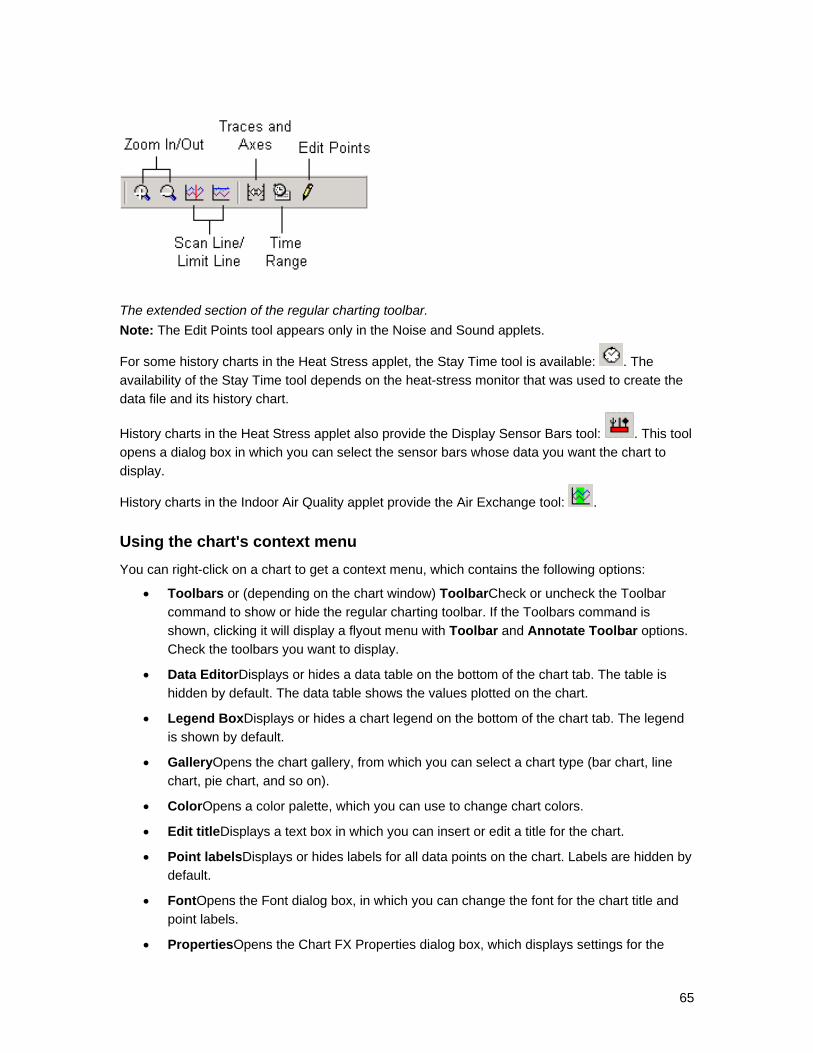
The extended section of the regular charting toolbar. Note: The Edit Points tool appears only in the Noise and Sound applets.
For some history charts in the Heat Stress applet, the Stay Time tool is available: . The availability of the Stay Time tool depends on the heat-stress monitor that was used to create the data file and its history chart.
History charts in the Heat Stress applet also provide the Display Sensor Bars tool: . This tool opens a dialog box in which you can select the sensor bars whose data you want the chart to display.
History charts in the Indoor Air Quality applet provide the Air Exchange tool: .
Using the chart's context menu
You can right-click on a chart to get a context menu, which contains the following options:
• Toolbars or (depending on the chart window) ToolbarCheck or uncheck the Toolbar command to show or hide the regular charting toolbar. If the Toolbars command is shown, clicking it will display a flyout menu with Toolbar and Annotate Toolbar options. Check the toolbars you want to display.
• Data EditorDisplays or hides a data table on the bottom of the chart tab. The table is hidden by default. The data table shows the values plotted on the chart.
• Legend BoxDisplays or hides a chart legend on the bottom of the chart tab. The legend is shown by default.
• GalleryOpens the chart gallery, from which you can select a chart type (bar chart, line chart, pie chart, and so on).
• ColorOpens a color palette, which you can use to change chart colors.
• Edit titleDisplays a text box in which you can insert or edit a title for the chart.
• Point labelsDisplays or hides labels for all data points on the chart. Labels are hidden by default.
• FontOpens the Font dialog box, in which you can change the font for the chart title and point labels.
• PropertiesOpens the Chart FX Properties dialog box, which displays settings for the
65
current chart. Tip: If you right-click directly on a data line or bar, the context menu might display only three commands: Gallery, Color, and Properties. To get the full context menu, right-click on a clear area of the chart or in the margins.
Using the Data Editor and the Legend Box
You can move the Data Editor and the Legend Box around (by dragging them) and change their size and appearance. You can right-click on a Data Editor or Legend Box to display a context menu for those items. You use this menu to do the following:
• Hide the Data Editor or the Legend Box (choose Hide).
• Change the size (enable or disable AutoSize). You might need to also choose Floating before you can drag to resize the Data Editor or the Legend Box.
• Change the font use (choose Font).
• Select either Fixed or Floating to either dock or move the Data Editor or Legend Box.
• Select Left, Top, Right, or Bottom for the placement of the docked Data Editor or Legend Box.
You can use the Palette Bar to change the background color of the Legend Box.
Related topics
Changing chart colors Changing your view of chart data Chart properties Chart axis properties Annotating charts
66
Changing chart colors
You can change the color of the following chart elements: each data series, the Legend Box, the background, the chart box, and chart text (the title and data points). The background is the box containing the chart; when the mouse pointer hovers over this area, the tool tip "Chart area" is displayed. The tool tip for the chart box is "Plot area." To change the color of a chart element: For most elements, you can do any of the following:
• Click the Color tool, , and click a color in the palette window. You'll see the bar below the paint bucket in the Color tool's icon change to that color. Drag the mouse from the Color tool to the chart element that you want to color.
• Right-click over the chart element, choose Color from the context menu, and select a color in the Palette window. (This works for most chart elements, but not for the Legend Box. To change its color, use the Palette Bar.)
• Use the Palette Bar.
• Use the Chart Properties dialog box.
Using the Palette Bar and the Pattern Bar
When you display the Palette Bar and the Pattern Bar, they appear docked below the charting toolbar (and the Annotate toolbar, if shown). You can drag either bar to dock it against a different side of the chart (instead of above it) or to turn the bar into a floating window. To use the Palette Bar or the Pattern Bar:
1. In the regular charting toolbar, click the Tools tool: . From the drop-down menu, choose PaletteBar and/or PatternBar, depending on which you want to use. The selected bar(s) will be displayed beneath the toolbar.
2. From the Palette Bar or the Pattern Bar, drag a color or pattern onto the part of the chart you want to change. You can change the chart's background color, the plot area, the area surrounding the chart, and the legend's background. If a chart title is displayed, you can drag a color onto the title to change the title's color.
3. Use the arrows at either end of the Palette Bar to scroll through the colors available. To define a custom color, you can double-click a color to open the Color dialog box.
Related topics
The chart tabs Chart properties Annotating charts
67
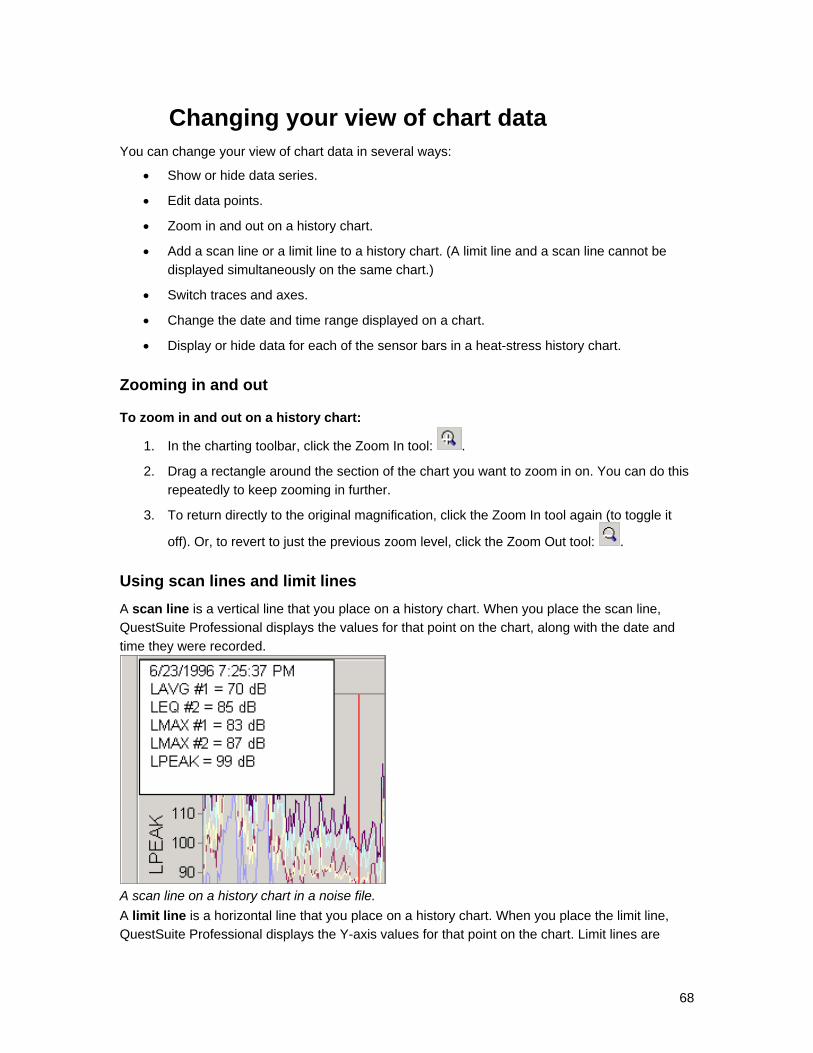
Changing your view of chart data
You can change your view of chart data in several ways:
• Show or hide data series.
• Edit data points.
• Zoom in and out on a history chart.
• Add a scan line or a limit line to a history chart. (A limit line and a scan line cannot be displayed simultaneously on the same chart.)
• Switch traces and axes.
• Change the date and time range displayed on a chart.
• Display or hide data for each of the sensor bars in a heat-stress history chart.
Zooming in and out
To zoom in and out on a history chart:
1. In the charting toolbar, click the Zoom In tool: .
2. Drag a rectangle around the section of the chart you want to zoom in on. You can do this repeatedly to keep zooming in further.
3. To return directly to the original magnification, click the Zoom In tool again (to toggle it
off). Or, to revert to just the previous zoom level, click the Zoom Out tool: .
Using scan lines and limit lines
A scan line is a vertical line that you place on a history chart. When you place the scan line, QuestSuite Professional displays the values for that point on the chart, along with the date and time they were recorded.
A scan line on a history chart in a noise file. A limit line is a horizontal line that you place on a history chart. When you place the limit line, QuestSuite Professional displays the Y-axis values for that point on the chart. Limit lines are
68
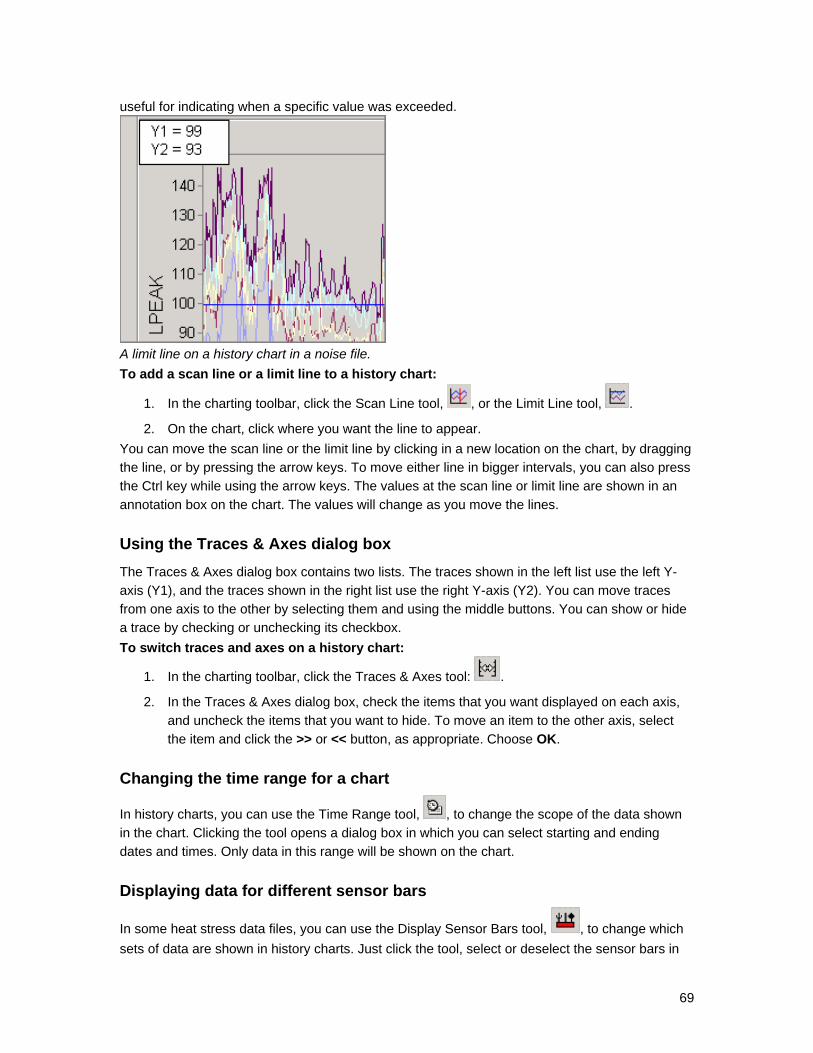
useful for indicating when a specific value was exceeded.
A limit line on a history chart in a noise file. To add a scan line or a limit line to a history chart:
1. In the charting toolbar, click the Scan Line tool, , or the Limit Line tool, .
2. On the chart, click where you want the line to appear. You can move the scan line or the limit line by clicking in a new location on the chart, by dragging the line, or by pressing the arrow keys. To move either line in bigger intervals, you can also press the Ctrl key while using the arrow keys. The values at the scan line or limit line are shown in an annotation box on the chart. The values will change as you move the lines.
Using the Traces & Axes dialog box The Traces & Axes dialog box contains two lists. The traces shown in the left list use the left Y-axis (Y1), and the traces shown in the right list use the right Y-axis (Y2). You can move traces from one axis to the other by selecting them and using the middle buttons. You can show or hide a trace by checking or unchecking its checkbox. To switch traces and axes on a history chart:
1. In the charting toolbar, click the Traces & Axes tool: .
2. In the Traces & Axes dialog box, check the items that you want displayed on each axis, and uncheck the items that you want to hide. To move an item to the other axis, select the item and click the >> or << button, as appropriate. Choose OK.
Changing the time range for a chart
In history charts, you can use the Time Range tool, , to change the scope of the data shown in the chart. Clicking the tool opens a dialog box in which you can select starting and ending dates and times. Only data in this range will be shown on the chart.
Displaying data for different sensor bars
In some heat stress data files, you can use the Display Sensor Bars tool, , to change which sets of data are shown in history charts. Just click the tool, select or deselect the sensor bars in
69
the dialog box, and choose OK.
Related topics
The chart tabs Editing data points Working with the Stay Time for a chart or report Using the Air Exchange charting tool Annotating charts
70
Chart properties
Use the Chart FX Properties dialog box to change the appearance of your chart. This dialog box has four tabs: General, Series, Axes, and 3D. Note: The options on the Series tab change depending on whether you are viewing the properties for a history chart or for statistics or exceedance charts. Tip: If you've changed a few too many options in the Chart Properties dialog box and you want to display the chart with its default settings, the quickest way is to close the data file and open it again.
The General tab
Use the General tab to select various options for displaying the chart, and to enter a title. The options are:
• 3DDisplays the chart in three dimensions.
• Cluster (Z-Axis)Adds a Z-axis to a three-dimensional bar chart. (Basically, this makes a 3D chart look even more 3D.)
• StackedDisplays the chart in Stacked, Stacked 100%, or Normal mode.
• Axis StyleSelect a frame style for the axes: None, 3D Frame, Math, or Flat Frame.
• Grid linesSelect horizontal or vertical grid lines (or both), which are displayed at the major intervals of the numerical (Y) or categorical (X) axis, respectively.
• PaletteSelect a color palette. If this option is empty, use the default palette.
• SchemeSelect a set of patterns to be applied to elements in the chart area. The default is solid colors; you can also choose black-and-white or colored patterns.
• BackgroundSelect the color you want to use in the area surrounding the chart.
• Chart BoxSelect the color you want to use in the plot area.
• TitleType or edit a chart title.
The Series tab
Use the Series tab to select various options for displaying the chart's data series. Select All Series, or select one series. (For example, in a noise data file, a statistics chart might offer series named Dosimeter #1 and Dosimeter #2, and a history chart might offer series named LAVG #1, LEQ #2, LMAX #1, LMAX #2, and LPEAK.) Then select a fill color and border or line options (such as color, style, and weight) for the selected series or their markers. The options in the right side of the Series tab change depending on what kind of chart you're viewing:
• For history charts: • Select a chart style from the Gallery, select a marker shape, select an interval for
showing markers (such as Show Every 10 data points), and select a marker size. • Show or hide point labels, and show or hide the selected series (check or uncheck
71
Visible).
• For statistics and exceedance charts: • Select a chart style from the Gallery. • Select a Gap Width. (Type a value between 0 and 100 to specify the amount of space
you want between categories of data markers. The larger the value, the greater the distance between categories.)
• Select a marker shape (Square, Cylinder, or Cone) for column, bar, and cube charts. If you select Cylinder or Cone, a box will appear in which you can type a number to specify the number of sides in the base of the cylinder or cone.
• Show or hide point labels, and show or hide the selected series (check or uncheck Visible).
The Axes tab
Use the Axes tab to select an axis, choose whether to show or hide it, and select formatting options for it. (When hidden, the axis will not display grid lines, tick marks, or labels.) For both major units and minor units, enter a value to specify the interval of tick marks, grid lines, and labels for the axis. Click the Details button to open the Axis Properties dialog box.
The 3D tab
Use the 3D tab to tweak the appearance of a 3D chart. (Clicking the Rotate tool on the charting toolbar will open the Chart Properties dialog box and display this tab.) If you check the Rotated View checkbox, you can do the following:
• Rotate the chart interactively by dragging the dots around the two intersecting plates in the diagram in the top-left corner of the dialog box. The preview, to the right, displays the rotation angle you have chosen for the chart.
• Specify an X Angle, which rotates the plot area around the X-axis. Rotation is measured in degrees.
• Specify a Y Angle, which rotates the plot area around the Y-axis. Rotation is measured in degrees.
• Drag the Perspective slider to set the ratio of the front of the chart to the back of the chart. The slider scale ranges from 0 degrees (the default) to 100 degrees.
On this tab, you can also select options for the following:
• ShadowsSelect a rendering method: None (Unlit), Fixed Angle, or Realistic. The default is Fixed Angle.
• DepthUse the slider to specify the depth of a 3D chart relative to its width.
Related topics
Overview of charts The chart tabs
72

Changing your view of chart data Chart axis properties
73
Chart axis properties
Use the Axis Properties dialog box to change the appearance of your chart's axes. This dialog box has four tabs: General, Scale, Labels, and Grid Lines. The General tab displays the same options as the Axes tab in the Chart Properties dialog box.
The Scale tab
When you open the Axis Properties dialog box, it displays the Scale tab, with information and options for the axis selected on the Axes tab of the Chart Properties dialog box. Use the Scale tab to set the following:
• Minimum and MaximumSet the lowest and highest data values for the selected axis.
• Scale UnitType a number to divide numbers and reformat labels displayed in the selected axis. This option is particularly useful when you have big numbers in the selected axis. For example, if you have 10,000,000 and want to display 10 as labels in the selected axis, type 1,000,000 as the Scale unit, and all axis labels will be divided by this factor.
• FormatSelect a format for the labels in the selected axis. Options for the X-axis in history charts are: Date, Time, Long Date, Date/Time. For other axes in most other charts, options are: None, Number, Currency, Scientific Notation, and Percentage.
• Decimal PlacesEnter a number to specify the number of digits displayed to the right of the decimal point.
• Logarithmic ScaleRecalculates the scale values (minimum, maximum, scale) for the selected axis in powers of 10 based on the range of data plotted in the chart. No zeroes or negative data are permitted on a logarithmic chart. This setting applies only to numerical axes.
• Zero LineSelect this box to have the category axis (X-axis) cross the value axis (Y-axis) at zero. If the chart contains negative values, the zero-line marker will cross the category axis when this option is selected.
The Labels tab
Use this tab to select options and specify a title for the selected axis's labels:
• OrientationSet the amount of rotation for labels in the selected axis. In the Degrees box, enter a positive number to rotate labels from lower left to upper right, or enter a negative number to rotate labels from upper left to lower right.
• Show LabelsHide or show labels for the selected axis.
• 2 LevelsDisplays staggered labels. This option is useful if labels overlap because space is tight in the selected axis.
• Rotate With ChartEnsures that labels will rotate according to the angles set on the 3D tab of the Chart Properties dialog box. Use this option if you want to give labels a special effect when the chart is rotated.
74
• TitleType an axis title. To insert a line break, place the insertion point where you want to insert the line break, and press Ctrl+Enter. The title will appear when you choose Apply or OK.
The Grid Lines tab
Use this tab to select the color, style,and weight for the grid lines displayed at the major and minor intervals of the selected axis. Note: The Show Gridlines option must be enabled on the General tab of the Axis Properties dialog box. You can also select the following options:
• Align With LabelsEnsures that labels are centered and aligned with tick marks at the major intervals in the selected axis.
• InterlacedLets you display interlaced colors between a range of grid lines in the chart area. The main color is taken from the color used in the major grid lines, and the secondary color is taken from the Background box on the General tab of the Chart Properties dialog box.
Related topics
The chart tabs Changing your view of chart data Chart properties
75
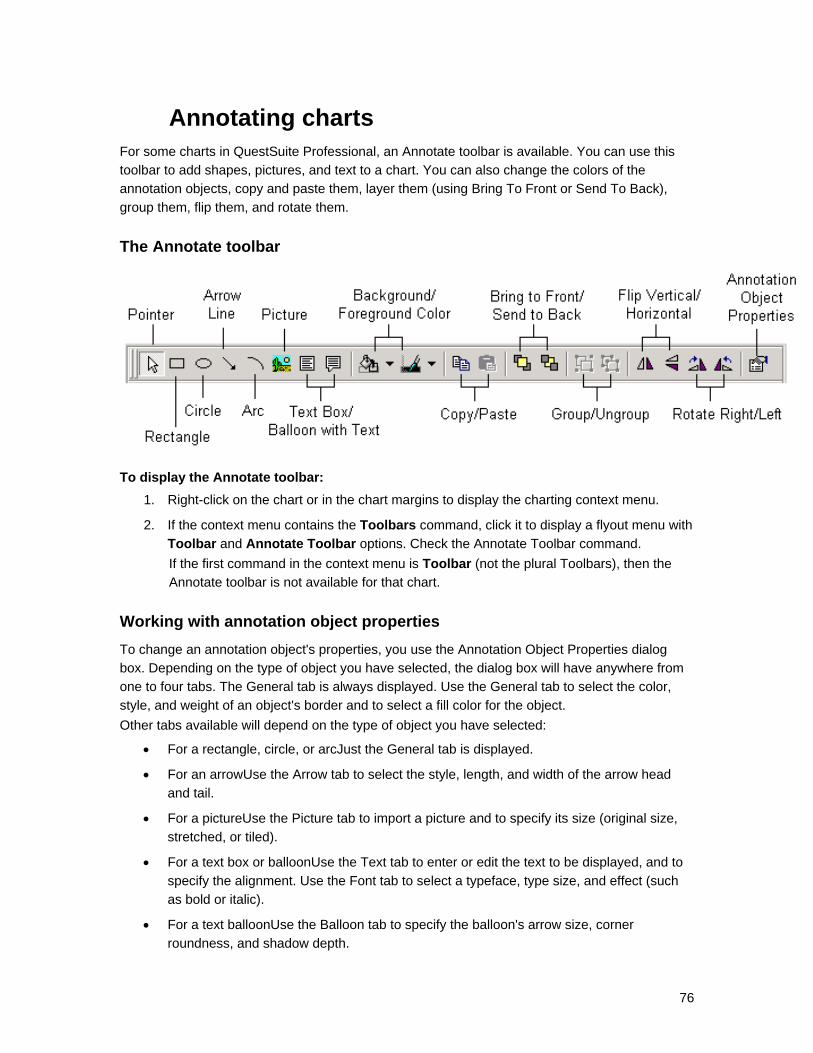
Annotating charts
For some charts in QuestSuite Professional, an Annotate toolbar is available. You can use this toolbar to add shapes, pictures, and text to a chart. You can also change the colors of the annotation objects, copy and paste them, layer them (using Bring To Front or Send To Back), group them, flip them, and rotate them.
The Annotate toolbar
To display the Annotate toolbar: 1. Right-click on the chart or in the chart margins to display the charting context menu.
2. If the context menu contains the Toolbars command, click it to display a flyout menu with Toolbar and Annotate Toolbar options. Check the Annotate Toolbar command. If the first command in the context menu is Toolbar (not the plural Toolbars), then the Annotate toolbar is not available for that chart.
Working with annotation object properties
To change an annotation object's properties, you use the Annotation Object Properties dialog box. Depending on the type of object you have selected, the dialog box will have anywhere from one to four tabs. The General tab is always displayed. Use the General tab to select the color, style, and weight of an object's border and to select a fill color for the object. Other tabs available will depend on the type of object you have selected:
• For a rectangle, circle, or arcJust the General tab is displayed.
• For an arrowUse the Arrow tab to select the style, length, and width of the arrow head and tail.
• For a pictureUse the Picture tab to import a picture and to specify its size (original size, stretched, or tiled).
• For a text box or balloonUse the Text tab to enter or edit the text to be displayed, and to specify the alignment. Use the Font tab to select a typeface, type size, and effect (such as bold or italic).
• For a text balloonUse the Balloon tab to specify the balloon's arrow size, corner roundness, and shadow depth.
76
Tip: A text balloon's shadow is not displayed unless the balloon has a fill color. The fill color can be White, but if None is chosen, the shadow will not show up.
To open the Annotation Object Properties dialog box:
• With the Pointer tool, select the object whose properties you want to view or change. Click the Properties tool in the Annotate toolbar. Or:
• Double-click the object. (The mouse pointer should be a four-headed arrow when you double-click.)
Working with annotation objects
If you've worked in drawing or painting software before, many of the tools in the Annotate toolbar will seem self-explanatory. To add shapes or lines to a chart:
1. In the Annotate toolbar, click the tool for the shape or line that you want (Rectangle, Circle, Arrow Line, or Arc).
2. Click on the chart, and drag the mouse pointer where you want the shape or line to go; then release the mouse button.
To add boxed text to a chart: 1. In the Annotate toolbar, click the Text Box tool or the Balloon With Text tool.
2. Click on the chart, and drag the mouse pointer to place and size the text box or balloon; then release the mouse button. The word "Text" will appear inside the new text box or balloon.
3. To enter text, either double-click the text box or balloon to select the word "Text" (which you can then type over), or open the Annotate Object Properties dialog box and enter the text there.
To add a picture to a chart: 1. In the Annotate toolbar, click the Picture tool.
2. Click on the chart, and drag the mouse pointer to place and size the box that will contain the picture; then release the mouse button.
3. Open the Annotation Object Properties dialog box, and select the Picture tab.
4. Choose the Select Picture button, and use the Open dialog box to select the picture file you want to use. Choose Open, and then OK.
To move an annotation object: 1. Using the Pointer tool, place the mouse pointer over the object so that the pointer turns
into a four-headed arrow. 2. Drag the object to move it where you want it to go.
To resize an annotation object: 1. Using the Pointer tool, select the object. 2. Place the mouse pointer over one of the object's handles so that the pointer turns into a
two-headed arrow. Drag the handle to resize the object.
77
To copy and paste an annotation object: 1. Using the Pointer tool, select the object you want to copy. Click the Copy tool. 2. Click the Paste tool. The pasted object appears directly on top of the original object. Drag
the pasted object to move it where you want it to go. To delete an annotation object:
• Click on the object to select it; then press the Del key. Or:
• Using the Pointer tool, place the mouse pointer over the object so that the pointer turns into a four-headed arrow. Right-click on the object to display its context menu. Choose Delete.
Related topics
The chart tabs Copying charts to other files Printing charts Saving charts
78
Editing data points
In the history charts of noise and sound data files, you can edit data points. You might want to do this to remove (or lower) part of a test where a noise occurred that should not be part of the test data. Or you might want to do a what-if analysis to see what the dose would be if the overall sound level were reduced by a fixed amount (such as through a hearing protection device). The Edit Points tool on the charting toolbarfor history charts onlyopens the Point Editing dialog box. (This tool is available for history charts in the Noise and Sound applets.) In a noise file's history chart, this tool opens the LAVG Point Editing dialog box. In a sound file's history chart, the Edit Points tool opens the LEQ Point Editing dialog box. The Point Editing dialog box has four tabs: Edit, Select, Summary, and List. The Annotate Graph button is available when the Summary tab is active.
The Edit and Select tabs
As you'd expect, you use these tabs to select and edit data points. To edit data points in a history chart:
1. Click the Edit Points tool, , to open the Point Editing dialog box. (Leave this open while you work on the chart; you can go back and forth between the dialog box and the chart.)
2. In the LAVG Point Editing dialog box (for noise data files), use the Set To option to select a data series (typically, LAVG or LEQ). The numbers displayed in the Entire Test section of the dialog box will change depending on the data series selected. (The LEQ Point Editing dialog box, for sound data files, does not have the Set To option.)
3. Select the data points that you want to edit. You can do this in several ways: 4. On the chart, drag a rectangular area to select the data points you want to edit. 5. If you want to select all data points in the chart, choose the Select All button on the Edit
tab of the dialog box. 6. If you want to select all the data points within a given time range or value range, click the
Select tab. Then do the following: • For a time rangeCheck the Select By Time checkbox. Enter a time range. (Choose the
Time Range button, enter dates and times in the Time Range dialog box, and choose OK.) Choose the Select Range button.
• For a value rangeCheck the Select By Value checkbox. Select an operator (such as >=), and enter a value. Choose the Select Range button.
Tip: You can use both of these options; just click Select Range each time you specify a range. (To cancel your most recent time-range or value-range selection, choose the Unselect Range button.) Using both options at the same time allows you to select data points by date/time and by value, such as selecting all data points greater than 80 and recorded between noon and 1 PM on a particular date. Another way to select the values to edit is to use the mouse to drag a rectangle on the chart.
On the chart, selected data points will be indicated by small, solid squares.
79
4. On the Edit tab, check the Lower By checkbox and/or the Clip At checkbox, and enter values by which you want to lower the data points or clip the data points. (Clipping reduces all values above a specified level to the clipping level.) Then choose the Apply button. You can select different areas of the chart and modify them independently. Just keep selecting ranges, editing data points, and clicking Apply.
Note: At any time while you're working in the Point Editing dialog box, you can do the following:
• Deselect all selected data pointsChoose the Unselect All button on the Edit tab. Deselecting data points leaves their current values intact, whether they are original or edited values.
• Restore selected data points to their original valuesChoose the Restore Selected button on the Edit tab. (Selected points will remain selected.)
• Restore all data points to their original valuesChoose the Restore All button on the Edit tab. (Selected points will remain selected.)
If data points are selected when you close the Point Editing dialog box, those points will still be selected the next time you open the dialog box. The numbers in the Entire Test section (on the Edit tab) represent the logged data calculations for LAvg, TWA, and dose (for noise data files) or LEQ and TWA (for sound data files). These calculations might change based on the changes you make with the Lower By or Clip At options. The same data is displayed in more detail on the Summary tab. Note: In the legend, the label for any data series you've edited will include the word "Edited"; for example, "LEQ" will become "Edited LEQ." The original label will return when all data points for the series have been restored to their original values (when you click the Restore All button).
The Summary tab
The Summary tab lists the parameters, the edited values for them, and their original values. The Selected column indicates whether a data point was selected for editing. The numbers listed represent the data values. Click the Annotate Graph button to add a text box containing a summary of the edited data. You can drag this text box to move it around on the chart, or drag its handles to resize it.
The List tab The List tab lists all of the data points in the test. The Date and Time columns indicate the date and time of each data point's measurement. The Selected column indicates (with a "Yes" or "No" entry) whether a point has been selected. The Edited column indicates (with a "Yes" or "No" entry) whether a point has been edited.
Related topics
The chart tabs Changing your view of chart data Annotating charts Understanding noise-level data and parameters
80

Understanding sound-level data and parameters
81
Working with the Stay Time for a chart or report
The stay time is the length of time a worker should be able to work safely under particular heat stress conditions. In data files for area heat stress monitors, you can use the Stay Time dialog box to change chart and report settings. In the Stay Time dialog box, you can select a Stay Time Type (Navy, EPRI, ACGIH Acclimatized, ACGIH Unacclimatized, or ISO). The Clothing Type options are displayed only when EPRI is selected. For any type of stay time, you can select an option in the Work Level/Metabolism drop-down list box. The Work Level/Metabolism options change depending on the Stay Time Type selected. Note: The Stay Time dialog box is accessible from history charts and from the Report Setup dialog box in data files for area heat stress monitors only (not for data files produced by personal heat stress monitors).
Changing Stay Time settings in a chart
For history charts, you can use the Stay Time tool, , to open the Stay Time dialog box. Here, you can change the settings displayed for a scan line. When you put a scan line on the chart, QuestSuite Professional displays an annotation showing the stay times as indicated by settings in the Stay Time dialog box. If you change the settings, the contents of the annotation box change accordingly.
Changing Stay Time settings in a report In the Report Setup dialog box for heat stress data files (area heat stress monitors only), you can click the Stay Time button to open the Stay Time dialog box. Here, you can change the settings for stay-time information to be included in the report. Note: The Stay Time button is available only when the Full report type is selected.
Related topics
The chart tabs Changing your view of chart data Annotating charts Setting up reports Understanding heat stress data and parameters Components of a heat stress data file
82
Using the Air Exchange charting tool In indoor-air-quality data files, the history charts provide an Air Exchange tool, . Use this tool to calculate and display air exchange data for the chart. To display air exchange data on a chart:
1. Click the Air Exchange tool in the history chart's toolbar.
2. Drag across a section of the chart, and release the mouse button. (As you're dragging the mouse, you'll see a green vertical band displayed where you're dragging on the chart.) The air exchange data for the time span selected will be calculated and shown in an annotation box.
Note: The Air Exchange tool will be disabled if the data was not recorded at 1-minute intervals.
Related topics
The chart tabs Changing your view of chart data Annotating charts Understanding air quality data and parameters Components of an air quality data file
83
Copying charts to other files
When you're working on a chart tab, you can copy the chart to the Windows Clipboard. From there, you can paste it into another application. To copy a chart:
1. Make sure the chart tab is the active tab.
2. From the Edit menu, choose Copy. (Or click the icon in the toolbar.)
Related topics
Chart properties Printing charts Saving charts
84
Printing charts
You can print charts from within the chart tabs. To print a chart:
1. Make sure the chart tab is the active tab and that your chart is set up the way you want it displayed.
2. From the File menu, choose Print. (Or click the icon in the toolbar.) The Print dialog box opens.
3. Choose OK.
Related topics
Chart properties Saving charts
85
Saving charts
After you've got a chart set up the way you want it, you might want to save it for later use. To save a chart:
1. Make sure the chart tab is the active tab, and make sure that your chart is set up the way you want it.
2. From the File menu, choose Save As. (Or click the icon on the chart tab's toolbar.)
3. Specify a location and a name. The chart-file format should already be listed in the Save As Type box.
4. Choose Save. Note: You cannot modify a chart file after it has been saved. However, you can always use the associated data file to create another chart.
Related topics
Copying charts to other files Printing charts
86
Reports
Overview of reports
When you click a data file's Report tab for the first time, QuestSuite Professional automatically generates a report. By default, QuestSuite generates the Summary report. For every type of data file, QuestSuite Professional provides two kinds of reports: Summary and Full. For noise and sound data files, QuestSuite also provides Statistics and Exceedance reports (for File Summaries only). Data-file summaries and individual tests have separate reports. All reports include the following information at the beginning: data file name, instrument model, instrument serial number and firmware version, and test identification information (subject name, company, and work area). The rest of a report's contents vary according to the type of data file, but a Summary report typically contains such information as:
• Test information, such as the start date, start time, and test duration
• Sensor calibration information, if applicable
• Measuring parameters, such as criterion level, threshold level, and exchange rate for noise data, or instrument mode, memory mode, and storage period for air quality data
• Overall statistics for each test, such as the minimum and maximum values for the entire test, with their dates and times of occurrence, and the overall average for the entire test
The Full report contains the Summary report plus a table of time-history data. This data shows the values for each time-history period for each input. The Statistics report lists the decibel levels in the measuring range, the number of samples recorded at each level, and the percentage of test time that each level was recorded. These statistics are used to create the statistics charts in noise and sound files. The Exceedance report lists each percentage point, from 1 to 100, and lists the decibel levels recorded as being reached or exceeded for that percentage of time. These statistics are used to create the exceedance charts in noise and sound files.
Related topics
Overview of data files Overview of charts The report tabs Setting up reports Printing reports Saving reports Exporting reports
87
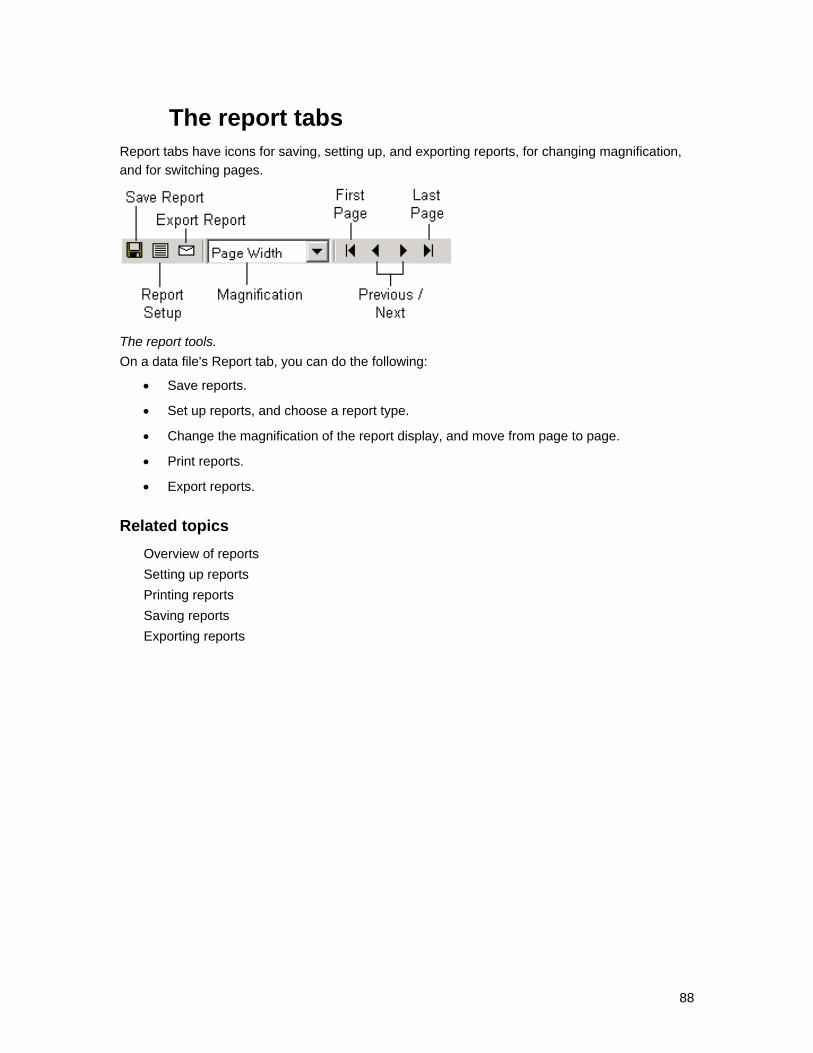
The report tabs
Report tabs have icons for saving, setting up, and exporting reports, for changing magnification, and for switching pages.
The report tools. On a data file's Report tab, you can do the following:
• Save reports.
• Set up reports, and choose a report type.
• Change the magnification of the report display, and move from page to page.
• Print reports.
• Export reports.
Related topics
Overview of reports Setting up reports Printing reports Saving reports Exporting reports
88
Setting up reports
When you click a data file's Report tab for the first time, QuestSuite Professional automatically generates a report. By default, QuestSuite generates the Summary report. To set up a report:
1. Open the data file for which you want to create a report. (If you have more than one file open, make sure the correct data file is active.) In the data file's Explorer pane, select the File Summary or the test for which you want to create a report. Then select the Report tab.
2. On the Report tab, click the Setup icon: . The Report Setup dialog box opens. Some Report Setup options will vary depending on the type of data file and on whether you're generating a report for a file summary or for an individual test.
3. Choose a Report Type. You'll always have at least the Full and Summary options; sometimes you'll also have Statistics and Exceedance options.
4. For a Full reportIf results from more than one test are stored in the data file, select a Test Number or All Tests. (If only one test was conducted for this data file, these options will not be available.)
5. If you want to change the date and time range for the report data, choose the Time Range button. Enter dates and times in the From and To boxes, and choose OK.
6. In the Report Setup dialog box for indoor-air-quality data filesUnder Input Information, check the items that you want to include in the report. (Only those inputs that were recorded in this data file will be available for selection.) These checkboxes are available only for a Full report.
7. In the Report Setup dialog box for indoor-air-quality data filesUnder Temperature Units, select Degrees Fahrenheit or Degrees Celsius.
8. In the Report Setup dialog box for heat stress and gas data filesUnder Temperature Units, select Degrees F or Degrees C.
9. In the Report Setup dialog box for heat stress data filesSelect a WBGT option (Inside or Outside). Choose the Stay Time button to open the Stay Time dialog box. Select a stay-time type and other related options; then choose OK. Note: The WBGT and Stay Time options are available only for Full reports for data that was recorded by area heat stress monitors.
10. Choose OK to display the report.
Related topics
Overview of reports The report tabs Printing reports Saving reports Exporting reports
89

Working with the Stay Time for a chart or report
90
Printing reports
You can print reports from within the report tabs. To print a report:
1. Make sure the report tab is the active tab.
2. From the File menu, choose Print. (Or click the icon in the toolbar.) The Print dialog box opens.
3. Choose OK.
Related topics
Setting up reports Saving reports Exporting reports
91
Saving reports
After you've set up a report, you might want to save it for later use. To save a report:
1. Make sure the report tab is the active tab, and make sure that your report is set up the way you want it.
2. From the File menu, choose Save As. (Or click the icon on the Report tab.)
3. Specify a location and a name. The report-file format should already be listed in the Save As Type box.
4. Choose Save. Note: You cannot modify a report file after it has been saved. However, you can always use the associated data file to create another report.
Related topics
Setting up reports Printing reports Exporting reports
92
Exporting reports
After you've created a report, you can export it for use in other programs. The following export formats are available:
• Comma-separated values (CSV) • Crystal Reports (RPT) • Data Interchange Format (DIF) • Excel 5.0, Excel 7.0, and Excel 8.0 (all XLS) • HTML 3.2 (Extended) • HTML 3.2 (Standard) • HTML 4.0 (DHTML) • Lotus 1-2-3 (WK1, WK3, or WKS) • Paginated text • Record style (columns of values) • Tab-separated text • Tab-separated values • Text • Word for Windows document
To export a report: 1. Make sure the Report tab is the active tab.
2. Click the Export icon, , on the Report tab. The Export dialog box opens.
3. Select a format (a file type).
4. Choose OK.
Related topics
Overview of reports The report tabs Setting up reports Saving reports Printing reports
93
Using the Noise applet
Overview of noise dosimeters
The Noise applet in QuestSuite Professional supports the Q-100, Q-300, Q-400, and Q-500 data-logging noise dosimeters. Q-Series noise dosimeters provide you with comprehensive tools for assessing and managing occupational and environmental noise. These dosimeters consist of a cable-mounted microphone that converts sound pressure into an electrical signal. This signal is conditioned, monitored, and integrated over time in order to provide a host of automatically calculated values that can be used in occupational and environmental noise assessments. Programmable test variables permit Q-Series noise dosimeters to serve virtually any application. Standard accessories for all Q-Series noise dosimeters include a pendant microphone, an SLM adapter, a calibrator adapter, and a user's manual. The SLM adapter converts the noise dosimeter to an integrating sound level meter. The calibrator adapter mates the dosimeter’s microphone with Quest Technologies' QC-Series acoustical calibrators for convenient field calibration. Optional single- and multi-unit dosimeter field kits combine the dosimeter and standard accessories with an acoustical calibrator in a single, convenient storage case. Noise dosimeters can be used in several ways. Various Q-series dosimeters can be used as:
• Personal noise dosimetersUsed to measure a worker's daily exposure to noise levels. This information can be used to ensure compliance with OSHA regulations and to determine whether a hearing conservation program is needed.
• Integrating sound level metersUsed to measure the total sound energy during a period and calculate an average. Integrating the signal gives more of an average response and filters out transient sounds.
• Peak sound level metersUsed to detect the highest level of instantaneous sound pressure.
• Time-history monitorsUsed to provide a histogram of a worker's minute-by-minute noise exposure levels. This data can help you identify major contributors to the average daily noise exposure.
• Amplitude (statistical) distribution monitorsUsed to measure the percentage of time that sound occurred at specific decibel levels. You can then determine whether the levels are due to transient peak levels or to a more sustained high level of sound.
• Survey (event) monitorsUsed to monitor noise levels for time-limited events or activities, such as car races or airport activity.
• Exceedance level monitorsUsed to determine whether allowable noise levels have been exceeded. If they have, then some action might need to be taken to reduce the noise levels.
Virtual dosimeters
Some Quest Technologies noise dosimeters enable you to test conditions for multiple standards simultaneously by using virtual dosimeters. The physical instrument is itself a dosimeter that
94
logs certain kinds of noise data. Within the physical instrument, electronic circuitry and software work together to allow that data to be logged under different setup conditions. Each set of setup conditions is a virtual dosimeter; it is not a separate physical thing, but you can record data as if it were. The virtual dosimeters always work simultaneously. So, depending on how you set up the instrument, you can log data with one or more virtual dosimeters.
Applications
Applications for the Q-Series noise dosimeters include: • Industrial noise control • Hearing conservation compliance • Community noise measurements • Work site assessments • Personal noise verification • Military applications • OSHA compliance • MSHA compliance • Traffic studies
Tip: For details about noise dosimeters, including the differences between the various models, see the Quest Technologies Web site. (In QuestSuite Professional's Navigation Bar, click Quest Online.)
The Noise applet In addition to providing the usual charting and reporting functions, the Noise applet allows you to:
• Program a dosimeter by selecting options such as threshold level and exchange rate. Program each "virtual dosimeter" independently.
• Set printing parameters for printing directly from the instrument in the field. • For some dosimeters, calculate C minus A values. • Set up keypad security codes to prevent accidental test interruptions or data erasure. • Program a dosimeter to run automatically. • Combine individual events (tests) in one report. • Compute Projected Dose and Projected TWA for varying work-shift durations. • Use the Edit function to do what-if analyses without corrupting original data.
Related topics
Setting up noise dosimeters Understanding noise-level data and parameters Components of a noise data file Changing the increment and duration
95
Setting up noise dosimeters
To set up any of the noise dosimeters, you select the Noise applet, select the dosimeter, and then select Set Up The Instrument. QuestSuite Professional supports four dosimeters. The Q-100 and Q-300 dosimeters each have their own Setup dialog boxes; the Q-400 and Q-500 dosimeters share a Setup dialog box. Each Setup dialog box for noise dosimeters has five tabs: Dosimeter, General, Auto-On, Security, and Print.
The Dosimeter tab
Some Quest Technologies noise dosimeters enable you to test conditions for multiple standards simultaneously by using virtual dosimeters. The Q-300 instrument provides three virtual dosimeters; the Q-100, Q-400, and Q-500 provide two. For all of these instruments, you use the Dosimeter tab to set the following parameters: Threshold, Exchange Rate, Upper Limit, Criterion Level, Response Level, and Weighting. (See the table of typical dosimeter settings at the end of this topic.)
• For the Q-300You can enable or disable each of the three dosimeter columns.
• For the Q-400/500Check the C Minus A checkbox to have this value calculated. Using this option limits how some of the other parameters can be set. You can also select the On setting for LDN to have the day/night level calculated. When you select the C Minus A option, the other fields are dimmed, and the parameters on the Dosimeter tab are set to identical values, with one exception. The Weighting values are automatically set as A for Dosimeter 1 and C for Dosimeter 2. (When C Minus A is unchecked, QuestSuite automatically reverts to the dosimeters having the same Weighting setting.) When you select the On setting for LDN, QuestSuite Professional automatically sets the Threshold to 40 and the Exchange Rate to 3.
The General tab
Use this tab to select a projected time (which is used for the Projected Dose and Projected TWA calculations), a calibration level, and a measuring range.
• For the Q-100 and the Q-400/500Specify which virtual dosimeters should log data: just Dosimeter #1, or both #1 and #2. Logging values from both virtual dosimeters takes up more memory and lessens the amount of data that can be logged. Also on this tab, select a logging interval, and select values to log (Average, Maximum, and Peak values).
• For the Q-300You can enable or disable data logging.
• For the Q-400/500You cannot select a measuring range, but you can select a Level Triggered option and set the On and Off values. When Level Triggered is enabled, the dosimeter will store an event each time the sound level goes above the Level On value and then goes below the Level Off value. In either event mode (Manual or Level Triggered), this dosimeter can store up to 999 events.
96
The Auto-On tab
Use this tab to enable the Automatic programming feature and to program the instrument to run automatically.
• For the Q-100 and Q-400/500Select a mode (date, weekdays, or daily), and then, as necessary for the mode, specify the date, time, duration, days, time format, and/or date format.
• For the Q-300Select a date and time. Then select a run time of either Continuous or Duration (and specify a duration).
The Security tab
Use this tab to enter a four-digit code that users must enter to access the instrument or to use the Auto-On feature. Users must enter this code on the instrument in order to start or stop recording and/or change the setup. By limiting access to the instrument, the security code can prevent accidental test interruptions or data erasures.
• For the Q-100 and Q-400/500The code secures the Auto-On feature. If the Secure Auto-On option is selected, then the Auto-On settings cannot be changed on the instrument itself until a user enters the security code. The Q-100 also has a Secure Unit option (On or Off). When Secure mode is on, the instrument's controls are locked while in Run mode, unless the security code is entered on the instrument keypad.
• For the Q-300Two levels of security, with separate codes, are available for this instrument. If Option 1 is enabled, the instrument's controls are locked while it's in Run mode. The test run cannot be interrupted unless the security code is entered on the instrument. If Option 2 is enabled, Setup Menu items on the instrument cannot be changed unless the security code is entered.
The Print tab
Use this tab to set up parameters for printing logged data directly from the instrument in the field.
• For the Q-100 and Q-400/500Set parameters for printing time-history reports.
• For the Q-300Select the items you want to print (logged data, statistics, and/or events), and select a printout interval. The printout interval is the number of minutes of recorded data that are combined into one data point on the printout.
Tip: For details on connecting an instrument to a printer via a parallel or serial interface module, see each instrument's product manual.
The following table lists typical dosimeter settings for several noise-exposure-level standards. Typical dosimeter settings for common applications Field Dosimeter 1:
OSHA Hearing Conservation Controls
Dosimeter 2: OSHA Engineering
Dosimeter 3: ACGIH
Threshold 80dB 90dB 80dB Exchange Rate 5dB 5dB 3dB Criterion Level 90dB 90dB 85dB Frequency Weighting A A A
97

Response Time Slow Slow Slow
Related topics Overview of noise dosimeters Understanding noise-level data and parameters Components of a noise data file
98
Understanding noise-level data and parameters
To set up the noise dosimeters and work with noise-level data, you'll need to understand the following terms and concepts:
• C minus A • Criterion level • Dose • Exchange rate • Exposure • LAvg • LEQ • LDN • LN • LMax • LPeak • Measuring range • Overload • Pascal-squared hours • Projected dose • Projected time • Projected TWA • Response level • SEL • SPL • Statistics • Test • Threshold level • Time history • TWA • Type 1, Type 2 • UL Time • Weighting
C minus A
The Q-400 and Q-500 dosimeters enable you to record C-weighted and A-weighted sound pressure levels simultaneously for the evaluation of hearing protection devices and other noise reduction devices. These dosimeters will also calculate the difference between the C-weighted and A-weighted values. Calculating C-A is effectively a way to measure the amount of lower-frequency noise. The two
99
Weighting curves are different; C is more flat, while A simulates human hearing and therefore drops off (has a lower response) at lower frequencies. Therefore, when you subtract A from C, you get what is left (the lower-frequency noise content).
Criterion level The criterion level is the constant decibel level that, if applied for 8 hours, would produce 100% of the accumulated noise dose allowed by law. For example, OSHA mandates the criterion level to be 90dB for 8 hours. For an 8-hour sample, an average level (LAvg) of 90dB will result in 100% dose. The criterion level is typically set by a regulating agency such as OSHA and is usually not applicable for community noise monitoring.
Dose
A dose is a percentage of the maximum allowable daily noise exposure. A dose reading of 100% is the maximum allowable exposure to accumulated noise. The dosimeter calculates the dose based on the following variables: criterion level, threshold, and exchange rate. When you're taking noise samples for less than the full workday, you can calculate a full day's dose by using this formula (assuming that the sampled noise continues at the same level for the full workday):
(# workday hours / # sample hours) * % dose = full workday dose For example, if a 0.5-hour sample results in 9% dose and the workday is 7.5 hours long, then the dose for the full workday can be computed as follows:
(7.5 hours / 0.5 hours) * 9% = 135% dose
Exchange rate
The exchange rate is the number of decibels that a sound must change in order to either halve or double the rate of dose accumulation. The exchange rate is also called the doubling rate. Regulatory limits on unprotected exposure are commonly stated in terms of the maximum permissible exposure time (criterion length) at a specific sound level (criterion level). For example, OSHA specifies a maximum exposure time of 8 hours at 90dBA (A-weighted decibels). Because OSHA's exchange rate is 5dB, for every 5 decibels the noise exposure increases, the permissible exposure time is cut in half, and for every 5 decibels the noise exposure decreases, the permissible exposure time is doubled. Thus, a worker could be exposed to a noise level of 95dB for only 4 hours. The exchange rate affects the integrated readings of LAvg, dose, and TWA but does not affect the instantaneous sound level.
Exposure
Exposure is a method of measuring noise dosage. Exposure is measured in Pascal-squared hours instead of as a percentage of dose.
LAvg
100
LAvg is the average sound level (in dB) computed for a chosen time duration, based on a 4, 5, or 6dB exchange rate. LAvg with a 3dB exchange rate is referred to as LEQ (equivalent sound level). All sound levels at or above the threshold level are averaged into the calculations relating to noise exposure. LAvg is typically calculated with no threshold, with a threshold of 80dB, and with a threshold of 90dB. LAvg can become a bit confusing when thresholds are used. Any sound below the threshold is not included in this average. Remember that sound is measured in a logarithmic scale of decibels; therefore, the average cannot be computed by simply adding the levels and dividing by the number of samples. When you're averaging decibels, short durations of high levels can significantly contribute to the average level. For example, assume that the threshold is set to 80dB and the exchange rate is 5dB (the settings of OSHA’s Hearing Conservation Amendment). Consider taking a 1-hour noise measurement in an office where the A-weighted sound level was typically between 50dB and 70dB. If the sound level never exceeded the 80dB threshold during the one-hour period, then the LAvg would not indicate any reading at all. If 80dB was exceeded for only a few seconds due to a telephone ringing near the instrument, then only those seconds would contribute to the LAvg, resulting in a level perhaps around 40dB (notably lower than the actual levels in the environment).
LEQ
LEQ is the equivalent continuous sound levelthe average sound level for the measurement period based on a 3dB exchange rate. The term LEQ is functionally the same as LAvg except that LEQ is used only when the exchange rate is set to 3dB and the threshold is set to None.
LDN
LDN stands for day/night level. It is the average sound pressure recorded during a 24-hour calendar day. Before the average is calculated by the instrument, a 10-decibel penalty for nighttime noise events is automatically added to data recorded between 10 PM and 7 AM.
LN
LN stands for exceedance level. It is the sound pressure level that is exceeded for a given percentage (N) of run time.
LMax
LMaxthe maximum levelis the highest sound level recorded during a measurement interval with a particular response setting (Slow or Fast) and weighting (A or C). LMax is the highest value that is included in LAvg or dose calculations. Under OSHA regulations, unprotected workers may not be exposed to maximum sound levels greater than 115dB, measured with a Slow response rate.
LPeak
The peak level is the highest instantaneous sound pressure level recorded during a measurement interval. Unlike the maximum level, the peak is detected independently of dosimeter settings for response rate or weighting. Under OSHA regulations, unprotected workers may not be exposed to peak sound levels greater than 140dB.
101
Tip: Peak is the instantaneous peak value of the waveform. LMax is the maximum value of the integrated (RMS) waveform (this value takes into account how long the sound source was at that level).
Measuring range
This is the range of noise levels that will be recorded by the dosimeter. Typically, you'll use a range of 40 to 110dB with both Dosimeter 1 and Dosimeter 2 set to either A or C weighting. If one dosimeter is set to A weighting, and the other is set to C weighting, the measurement range is 70 to 140dB. Different ranges are used for different applications, such as community noise measurements or industrial/commercial noise measurements.
Overload
An overload occurs when the input for a noise dosimeter or sound level meter is too high for the current measurement range. When this happens, you need to change the measuring range.
Pascal-squared hours
Pascal-squared hours (Pa²H) is a measure of sound exposure accumulated during the measurement period, given in Pa²H rather than as a percentage of dose. Pa²H is defined as the time integral of the squared instantaneous A-weighted sound pressure over a specific duration; for example, the duration of a working day. One Pa²H is typically the maximum allowable exposure.
Projected dose
Projected dose is a computed estimation (as a percentage) of what the dose would be for a work shift. Such estimations are useful in preliminary work-place surveys. For example, suppose that a worker's exposure is monitored for 1 hour, and a dose of 40% is obtained. If you assume an 8-hour shift, during which the noise exposure stays the same, the dosimeter will compute an estimated 8-hour projected dose of 320%.
Projected time
Projected time is the estimated length of the work shift for which noise exposure is being measured. Projected time (typically 8 hours) is used in the calculations for projected dose and projected TWA.
Projected TWA
The projected TWAabbreviated as TWA (Prt) and expressed in decibelsis a calculation used to determine the TWA when you want to use a measurement time that is different from the worker's exposure time. Note: A short-term sample can be used only if the average noise level in the work area is relatively constant throughout a work shift.
Response level
102
This is also called the response rate or the time constant. Instruments used to measure sound levels have selectable response time constants, which were originally established to describe the dynamic response characteristics of analog sound level meters. (Typically, noise is not constant. Using a response of Slow or Fast simply smoothes the noise fluctuation and makes the sound level easier to work with.) The response rate determines how quickly the unit responds to fluctuating noise. The time constants are:
• Slow1 second (1,000 milliseconds, or msec) • Fast0.125 second (125 milliseconds) • Peak50 microseconds • Impulse35 millisecond rise with a decay time of 1.5 seconds
Typical occupational and environmental noise regulations require a Slow response rate. The Impulse response rate, with its fast rising time and slow falling time, represents the loudness of a short-duration sound, and is therefore used to determine annoyance rather than risk of hearing damage. The Peak response rate measures the actual peak sound pressure level of a short-duration sound and is used to determine the risk of hearing damage.
SEL
SELsound exposure levelis the constant sound level that, if lasting for one second, would deliver the same amount of acoustical energy as that delivered over the entire measurement period. SEL is typically measured using a 3dB exchange rate without a threshold. (SEL is not used by OSHA.)
SPL
SPLsound pressure levelis the basic measure of noise loudness, expressed in decibels.
Statistics: Percent Time Statistical Distribution
For a given run time, this is the percentage of time that sound occurred at a specific decibel level. This percentage is also called the amplitude distribution.
Test A test (or event or study) refers to each time the dosimeter is run and then paused.
Time history
A time history is a report or a chart that shows how sound levels are accumulated over time.
Threshold level The threshold levelalso called the cutoff levelis a decibel level below which sound is not accumulated or averaged into LAvg, LEQ, or dose calculations. (The threshold affects the LAvg, TWA, and dose measurements.) All sound below the threshold is considered non-existing noise for the averaging and integrating functions. The threshold does not affect measurements in the
103
sound level mode. OSHA uses two thresholds. The original Occupational Noise Exposure Standard (1971) uses a 90dB threshold and calls for engineering controls to reduce the noise levels if the 8-hour TWA is greater than 90dB. The Hearing Conservation Amendment (1983) uses an 80dB threshold and calls for a hearing conservation program to be put in place if the 8-hour TWA exceeds 85dB (50% dose). The Hearing Conservation Amendment is the more stringent of the two rulings and is what most US industrial users are concerned with. For example, with an 80dB threshold, suppose that you placed a 79dB calibrator on the dosimeter for a period of time. Because all of the noise is below the threshold, there will be no average (you can think of it as an average of 0dB). If the calibrator were 80dB instead, then the average would be 80dB. On histogram printouts, typically 1-minute (or other specified increment) averages are printed. Because real noise fluctuates, it is quite possible to have an average level below the threshold. This also applies for the overall LAvg.
TWA
TWAtime-weighted averageis the sound level (in dB) that is accumulated for any time period but with its average level computed over an 8-hour period. TWA is usually measured with A-weighting, Slow response, and a 5dB exchange rate. All sound levels at or above the threshold level (cutoff level) are averaged into the calculations relating to noise exposure. TWA is calculated with no cutoff, with cutoff 1 (typically 80db), and with cutoff 2 (typically 90db). If the time period is less than 8 hours, the TWA will be less than the LAvg. If the time period is more than 8 hours, the TWA will be more than the LAvg. When you're measuring using OSHA’s guidelines, TWA is the proper number to report if the full work shift was measured. Tip: Need clarification on the difference between LAvg and TWA? LAvg is the average sound level over the run time of your sample. If you run the dosimeter for 30 minutes, LAvg is the average sound level over that 30-minute period. TWA always assumes an 8-hour run time. So if you run the dosimeter for 30 minutes, the TWA calculation will assume 7 hours 30 minutes of silence and give the 8-hour average.
Type 1 and Type 2
Types are grades of sound level meters and noise dosimeters. Type 1 is a precision instrument (laboratory and field grade). Type 2 is a general-purpose instrument.
UL (Upper Limit) Time
UL Time is the amount of time that the sound level exceeds a preset level (the Upper Limit).
Weighting
Noise dosimeters and sound level meters need to mimic human hearing, which is frequency-dependent and level-dependent. The frequency range for human hearing is 20 Hz to 20 KHz. Our hearing puts more weight on some frequency ranges than on others, however. Therefore, sounds of various frequencies, even if they are at the same level, do not sound equally loud. Our ears are more sensitive to high-frequency noises than to low-frequency noises. Noises between 2,000 and
104
4,000 Hz seem louder and are more damaging than noises with similar amounts of energy at other frequencies. Weighting is the filtering of sound before averaging. A, B, C, and Linear are the standard weighting networks (circuits) available in noise dosimeters and sound level meters. These frequency filters cover the frequency range of human hearing. A weighting is the most commonly used filter in both industrial noise applications and community noise regulations. A-weighted measurements are written as dBA or dB(A). The A-weighted filter attempts to make the dosimeter respond the way the human ear hears. This filter attenuates the frequency below several hundred hertz as well as the high frequencies (about 6,000 hertz). B weighting is similar to A but with less attenuation. The B weighting is very seldom, if ever, used. Quest Technologies instruments typically provide A-weighted and C-weighted measurements. C weighting provides a fairly flat frequency response with only slight attenuation of the very high and low frequencies. C weighting is intended to represent how the ear perceives sound at high decibel levels. C weighting is often used as a flat response when Linear weighting is not available. C-weighted measurements are written as dBC or dB(C). Linear weighting has a flat frequency response curve over the entire measurement frequency range. Linear weighting is most commonly found on upper-model sound-level meters and is typically used for performing audiometric analysis and octave band filter analysis. Linear weighting is being replaced by Z weighting, which is defined as flat from 20 Hz to 20 KHz.
Related topics
Setting up noise dosimeters Components of a noise data file Understanding sound-level data and parameters
105
Working with noise data
Components of a noise data file
Noise data files have four main components, shown as the four main levels in the file's Explorer pane:
• File SummaryDisplays information about all the tests stored in the data file. Charts and reports are created based on all of the tests. The file summary in a noise data file contains five tabs: Summary, Projected Dose, Projected TWA, Statistics Chart, Exceedance Chart, and Report. The Summary tab has four sub-tabs: General, Setup, Values, and Profile.
• TestsDisplays information about individual tests (Test 1, Test 2, and so on), which you select in the Explorer pane. Each test has its own collection of tabs (Summary tab, with General, Setup, Values, and Comments sub-tabs; plus a History Chart tab and a Report tab.)
• Combination TestsDisplays data for any test combinations you create. The data display for combination tests looks the same as for individual tests.
• CalibrationsDisplays an instrument's calibration history, which is downloaded into the file with other instrument data. You can add calibrator information later so you have a record of which calibrator was used for each calibration. On this screen, calibrator information is the only information you can enter.
Related topics
File summaries for noise data Individual tests in a noise data file Creating combination tests Calibrations
106
File summaries for noise data
The file summary in a noise data file contains five tabs: Summary, Projected Dose, Projected TWA, Statistics Chart, Exceedance Chart, and Report.
The Summary tab
In a noise data file, the Summary tab for a file summary has four sub-tabs: General, Setup, Values, and Profile.
• Use the General sub-tab to view product information (instrument model, serial number, firmware version, and applet version) and test information (number of tests in the file, total number of periods, starting and ending times of the first and last tests in the file, total run time, measuring range, and projected period).
• Use the Setup sub-tab to view the parameters (such as weighting, threshold, and exchange rate) programmed into the dosimeters used to run the tests recorded in the file.
• Use the Values sub-tab to view summaries of data for all the tests in the file. (Values are displayed for each virtual dosimeter used.) The type of summary depends on the particular measurement. For example, a peak would be the overall peak for all the tests. For descriptions of the values recorded, see Understanding noise-level data and parameters. Values include Peak, date and time at which Peak occurred, Maximum, date and time at which Maximum value occurred, Minimum, date and time at which Minimum value occurred, LAvg, TWA, TWA (8), Dose, Dose (8), SEL, Upper Limit Time, Overload, LDN, and Pa2Sec (Pascal-squared seconds). The "Dose 8" parameter shows the dose for an 8-hour duration. "Dose [08:00]" changes to reflects the Projected Time. If you change that to 6, for example, then "Dose [08:00]" changes to "Dose [06:00]" and the calculations for it change accordingly. The same concept applies to "TWA [08:00]" and its calculations. The C minus A column displays the result of subtracting A-weighted valuesfor measurements such as LAvg, TWA and dosefrom the C-weighted values. The result provides a rough assessment of the low-frequency noise levels. Changing the value in the Projected Time field (and choosing the Apply button) changes the Projected Dose and Projected TWA shown on this tab.
• Use the Profile sub-tab to view information about the tests. The subject name, company, and work area can be selected from drop-down list boxes, which list the contents of the User Profile database. A description and comments can also be added on this sub-tab. Typically, you'll enter this information when you retrieve data into a data file, but you can also enter it later.
The Projected Dose tab
The Projected Dose tab displays computed estimations (as percentages) of what the dose would be for a work shift. Such estimations are useful in preliminary work-place surveys. Estimations are displayed, with time increments, for each dosimeter. The default is a 1-minute increment,
107
going across the table and continuing for a duration of 8 hours. (The first line starts at zero; the second line starts at the 5-minute mark; the third line at the 10-minute mark, and so on.) Click the Edit button on this tab to open the Increment And Duration dialog box. Here, you can change the time increments in the table, or change the duration covered by the table (or change both).
The Projected TWA tab
The Projected TWA tab displays the estimated time-weighted average for the specified duration (typically, 8 hours). Click the Edit button on this tab to open the Increment And Duration dialog box. Here, you can change the increment or duration, or both.
The Statistics Chart tab
The chart on this tab shows amplitude distribution statistics for all tests in the file. The amplitude distribution shows the percentage of time that noise samples occurred at particular decibel levels.
The Exceedance Chart tab
The chart on this tab shows exceedance levels for all tests in the file. That is, the chart shows the percentage of time that noise samples exceeded a particular decibel level.
The Report tab
From the Report tab of a noise data file's file summary, you can set up four kinds of reports: Full, Summary, Statistics, and Exceedance.
Related topics
Understanding noise-level data and parameters Setting up noise dosimeters Components of a noise data file Individual tests in a noise data file Creating combination tests Calibrations
108
Changing the increment and duration
In the File Summary component of a noise data file, the Projected Dose tab and the Projected TWA tab each contain an Edit button. Click this button to open the Increment And Duration dialog box. Here, you can change the increment or duration (or both) used to display test results on these tabs. You can do what-if analyses to extrapolate the dose and/or TWA if data is recorded for fewer or more than 8 hours. Note: Changing the increment and duration shown does not change the test data recorded in the file. To change the increment or duration (or both):
1. In a noise data file, select the File Summary, and then select either the Projected Dose tab or the Projected TWA tab.
2. Choose the Edit button to open the Increment And Duration dialog box.
3. The values for increment and duration are shown in the format hh:mm:ss (hours, minutes, and seconds). To change either value, click the part of it that you want to change. (You can change only one parthours, minutes, or secondsat a time.) Then click the up or down arrow to increase or decrease that component of the increment or duration.
4. Choose OK to return to the data-file tab and view the results shown there.
Related topics
Understanding noise-level data and parameters Components of a noise data file File summaries for noise data
109
Individual tests in noise data files
The Tests section in a noise data file contains three tabs: Summary, History Chart, and Report.
The Summary tab
The Summary tab for a noise data file's Tests section has four sub-tabs: General, Setup, Values, and Comments.
• Use the General sub-tab to view information about the selected test (test number, total number of periods, starting and ending times, total run time, logging interval, measuring range, and projected period).
• Use the Setup sub-tab to view the parameters (such as weighting, threshold, and exchange rate) programmed into the dosimeters used to run the selected test.
• Use the Values sub-tab to view value summaries for the selected test. (For descriptions of the values recorded, see Understanding noise-level data and parameters.)
• Use the Comments sub-tab to view or type comments about the selected test. Typical comments describe the test conditions and what kind of testing was being done.
The History Chart tab
The History Chart tab shows the time-history data (how sound levels are accumulated over time) for the selected test.
The Report tab
From the Report tab of a noise data file's Tests section, you can set up two kinds of reports: Full and Summary.
Related topics
Understanding noise-level data and parameters Setting up noise dosimeters Components of a noise data file File summaries for noise data Creating combination tests Calibrations
110
Creating combination tests
In noise data files, you can combine individual tests. The combination tests look the same as the individual tests. (They have the same three tabs: Summary, History Chart, and Report.) Combining tests allows you to build a noise exposure profile out of different tests. That is, one test might sample noise from a particular task, and another test might sample noise from a different task. Combining these tests allows you to determine such things as the Percent Dose that would result from having the same person perform those different tasks for the tested durations. You can combine tests within the same noise file or between similarly set up noise files. A combination test does not exist until you start one with a single test. Note: Tests can be combined only when their setup criteria are compatible with each other. For the dosimeters in the test being copied and in the target (combination) test, the following parameters must be the same:
• Exchange rate • Criterion level • Response level (Fast or Slow) • Weighting (A or C weighting)
This means that for every dosimeter defined in the instrumentsome instruments have one, some have two, and some have three dosimeters definedDosimeter 1 must match Dosimeter 1 with respect to these parameters, Dosimeter 2 must match Dosimeter 2, and so on. You don't need the same number of dosimeters in each test; you just need matching parameters for the ones that are defined. To combine tests in a noise data file:
1. In the noise file's Explorer pane, select a test that you want to combine.
2. Drag the test onto the Combination Tests tree or onto a test under that tree, and drop the selected test. (Or you can choose Edit>Copy, highlight the target, and choose Edit>Paste.)
3. QuestSuite Professional displays the following confirmation message: "Are you sure that you want to paste onto the selected test?" Choose Yes. The combination test will appear in the Explorer pane.
Related topics
Components of a noise data file Individual tests in a noise data file Setting up noise dosimeters
111
Calibrations
Although Quest Technologies noise dosimeters maintain accurate calibration over a long period of time, you should check the calibration and make any adjustments necessary before each use. (For calibration instructions, see the dosimeter product manuals.) Each dosimeter stores the time, date, and SPL of its calibration. This information is included in data printouts and downloads. In a noise data file, the Calibrations screen displays the calibration history of the dosimeter used to record that file's data. (This history covers the calibrations performed just for that data file. For instance, you might calibrate the dosimeter between each test when you're putting multiple tests into one file.) This information is downloaded into the data file with other instrument data. You can add calibrator information laterthe calibrator's serial number and calibration date and timeso you have a record of which calibrator was used for each calibration. On this screen, calibrator information is the only information that you can enter. To enter calibrator information:
1. Select a calibration record in the table. The Calibrator Information fields become available.
2. Enter the serial number of the calibrator used, and enter the date and time of the calibrator's calibration.
3. Choose the Apply button.
Field calibrators and instrument re-certification
The Quest Technologies QC-10 and QC-20 calibrators provide quick, precise field calibration. Each calibrator generates a stable acoustic signal at a controlled frequency and amplitude to verify the accuracy of your meter in the field. Model QC-10 is a general-purpose calibrator that generates a constant sound pressure level of 114dB at a fixed frequency of 1,000 Hz. Model QC-20 is recommended for use with precision ANSI and IEC Type 1 meters. With this calibrator, you can select a SPL of 94 or 114dB and select a frequency of 250 or 1,000 Hz to generate four different outputs. Quest Technologies dosimeters maintain their accuracy for many months of use. However, it's recommended that each dosimeter be returned annually to a Quest Authorized Service Station for re-certification. Quest Technologies maintains and uses calibration standards traceable to the National Institute of Standards and Technology (NIST). This means that the instruments used to calibrate Quest Technologies products have themselves been calibrated to standards set by NIST. Quest Technologies is an ISO 9001 Registered Company and an A2LA ISO/IEC Guide 25 Accredited Calibration Laboratory. Quest Technologies calibration services include product updates. Tip: For more information on calibration services, or to place a service order, see the Quest Technologies Web site.
Related topics
Components of a noise data file Maintaining an instrument's certification history
112

Setting re-certification alarms for instruments Viewing pending re-certification alarms
113

Using the Sound applet
Overview of sound level meters
The Sound applet in QuestSuite Professional supports the Model 1900 and Model 2900 sound level meters. The 1900 provides Type 1 accuracy for applications requiring high precision, and the 2900 provides Type 2 accuracy for general field-survey work. Each of these meters incorporates an internal data-logger, allowing you to store one or more sound studies in the field for later printing or downloading to a computer. A second RMS circuit (an optional feature) can be used to simultaneously measure both C- and A-weighted SPLs, calculate the difference, and provide the result for display or printout. You can attach an octave band filter to the sound level meter to analyze sound across a band of frequencies. This enables you to do a limited spectral analysis of the sound; that is, you can do minor analysis to determine which ranges of frequencies are present in the sound, and to what extent. You can attach a vibration meter to the sound level meter to measure and analyze various types of industrial vibration.
Applications
Applications for the Model 1900 and 2900 sound level meters include: • Occupational noise measurements and compliance • Environmental noise measurements and compliance • Frequency analysis of sound sources • Evaluation of hearing protection and noise control devices • Vibration measurement • Audiometer analysis and calibration • Engineering control studies • Machine performance analysis • Product testing • Research and development • Quality control • Maintenance inspections and troubleshooting • Toy safety testing
Tip: For more information, see the Quest Technologies Web site. Information about specific sound level meters is provided in the Products section of the site. You can also find information about accessories, such as calibrators, octave band filters, and vibration meters. Also, for application details, see the Application News Notes, available in the Support section of the site. These Notes include such topics as "Occupational Noise Exposure in U.S. Mines" (Note 2) and "Sound Measurement for Noise Ordinance Enforcement" (Note 5).
114
The Sound applet In addition to providing the usual charting and reporting functions, the Sound applet allows you to:
• Specify which measured noise values are displayed on the meter. • Specify which measured noise values are included in charts. • Configure your meter for changing applications, such as community noise surveys,
industrial hygiene surveys, or compliance with various regional standards. • View calibration history, individual data points, statistics tables, and exceedance charts.
Related topics
Setting up sound level meters Understanding sound-level data and parameters Components of a sound data file
115
Setting up sound level meters
To set up either of the sound level meters, you select the Sound applet, select the meter, and then select Set Up The Instrument. QuestSuite Professional supports two sound level meters: the Model 1900 and Model 2900. Their Setup dialog boxes are identical. The Sound Setup dialog box has six tabs: Integration Threshold, Trigger, Logging, Display, Weight, and Print.
The Integration Threshold tab
Use this tab to enable the Integration Threshold option, to set the threshold, and to set exceedance levels.
• The integration threshold is the threshold level for averaging. Set it from 0 to 180dB; the default is 80. If the Integration Threshold option is enabled, the meter will not integrate sound pressure levels below the specified threshold.
• Four exceedance levelsthe sound pressure level exceeded for N% of the time during a studyare available. LN settings can range from 1 to 99. Default settings are 5, 10, 50, and 90.
The Trigger tab
Use this tab to enter settings for a threshold-triggered study, to program the meter to begin recording at a certain time (Auto-On), and to program the meter to run for a certain duration (program run time). The Trigger tab has four sets of options:
• Trigger OnTo run a threshold-triggered study, check the Enable checkbox, and set the Level to a dB value ranging from 0 to 180 (the default is 80). When the SPL reaches this level, the meter will begin recording a study.
• Trigger OffTo have the threshold-triggered study end when the SPL falls to a certain dB level, check the Enable checkbox and set a Level that's equal to or less than the Trigger On value.
• Auto-On TimeTo have the meter start recording at a certain date and time, check the Enable checkbox, and set a date and time.
• Program Run TimeIf you enable the Program Run Time option and set a duration, the study will last for the specified amount of time unless the Threshold Off level is reached first. If the SPL is still above the Off level, a new study will begin after the run-time duration ends.
The Logging tab
Use this tab to specify what data gets logged, at what interval, and where the data will be stored. Specifically, use this tab's options to do the following:
• Select any or all of the five quantities available for logging (LEQ or LAvg, LMax, LPeak, L10, L90).
• Enable the Stats Table Logging option to log statistics tables for each study. This
116
information can be downloaded to QuestSuite Professional but is not available directly from the meter. This data is used to create the statistics charts in sound data files.
• You can also log to the meter's internal memory (enable the Logging To Memory option) and to the COM port (enable the Com Port Logging option).
• Select a logging interval from the drop-down list. (Shorter logging intervals will fill instrument memory faster than longer intervals will.)
• Enable Session mode. Session mode allows you to change the setup of the meter between tests within a session. Any number of consecutive studies can be grouped into a session.
The Display tab
Use this tab to select the values that will be displayed on the meter when it is running.
• In the Display Options list box, all measurement options are selected by default. To display only some, click the Selected option and then uncheck those measurements that you do not want displayed.
• The C-A option activates a second RMS circuit, which allows simultaneous measurement of both C- and A-weighted SPLs for evaluation of hearing protectors and other noise reduction devices. Note: This feature can be used only if the optional C-A circuit board is installed in the meter. The A Weighting option must be selected, and the Peak response time should not be used. Tip: If a threshold is set, it affects both C and A, which may cause large values for C-A if the levels are at or near the threshold.
• The TAKM option displays the time integration of individual Taktmaximal values. Taktmaximal is the maximum level (LMax) encountered over a 3-second or 5-second period (you select the interval on the Display tab). Taktmaximal measurements are required by some countries' noise regulations. A Taktmaximal measurement calculates a higher average level for highly impulsive sounds than does a LEQ measurement. Note: TAKM is affected by the exchange rate and should be run with an exchange rate of 3dB.
Note: The C-A option and the TAKM option cannot be used simultaneously.
The Weight tab
Use this tab to select the general and peak weighting, the response level, the exchange rate, and the measuring range.
• Under General Weighting, select A, C, or Linear weighting for the values being logged. Select a response level (Peak, Impulse, Slow, or Fast) for the values being logged.
• The Peak Weighting option lets you set the weighting for peak levels independently of the weighting selected for general logged values. Think of this option as the setting for a second peak detector, for which the Response Level is always set to Peak and the Weighting can be set to A, C, or Linear. If you set the main meter's Response to Peak,
117
you'll effectively have two meters both set to Peak response. (You wouldn't typically do this, however, unless you needed to measure peaks with different weightings.) If you're logging LPeak (selected on the Logging tab), then you are logging one peak level. If you set the Response to Peak for the main meter (on the Weighting tab), then the LMax level will also be a peak. (You'll be logging two peaks. If the weightings are set the same for the meter and for the peak detector, the readings will be the same.)
• If you selected the TAKM option on the Display tab, then select a 3dB exchange rate on the Weight tab.
• If you selected the C-A option on the Display tab, then select A for General Weighting on the Weight tab, and select Fast, Slow, or Impulse as the response rate.
The Print tab
Use this tab to set up parameters for printing logged data directly from the instrument in the field.
• End Of LineSelect the end-of-line character for printouts: CR Only (carriage return; the printer head returns to the left margin); CR-LF (carriage return and line feed); LF Only (line feed; the printer head advances to the next line); or LF-CR (line feed and carriage return).
• Print SectionsSelect which report sections you want to have on the printout: a report header; a summary of all measurements; a time history; and a filter grouping. Data collected using an optional bandpass filter can be grouped under a common header if the Filter Grouping option is checked, or this data can be printed as an individual study.
• P40The P40 option prints the report in compressed mode, so the printout will fit on a 40-column printer.
• LocationsIf you've used Session mode, you can check the Locations option here to print individual memory locations along with session data.
Tip: For details on connecting an instrument to a printer via a parallel interface module or a serial cable, see the instrument's product manual.
Related topics
Overview of sound level meters Understanding sound-level data and parameters Understanding noise-level data and parameters Components of a sound data file
118
Understanding sound-level data and parameters
To set up the sound level meters and work with sound data, you'll need to understand the terms and concepts explained in Understanding noise-level data and parameters, and you'll need to understand the following:
• BATT • C-A • CNEL • LLOG • LPeak • OVL • Pa2H • RTMS, RTHM • TAKM
BATT
"BATT" is a display option in the Sound Setup dialog box. This option displays the voltage of the weaker of the two 9-volt batteries to indicate remaining battery life in the sound level meter.
C-A
An optional second RMS detector can be used to provide a simultaneous C-Aweighted LEQ or LAvg for the measured sound. This detector is a separate circuit board that can be installed in the meter.
CNEL (community noise exposure level) CNEL (community noise exposure level) is the average sound pressure for a 24-hour study, with additional factors for time of day. Sound pressures recorded between 7 PM and 10 PM are increased by 5dB before being averaged. Also, as with the LDN, sound pressures recorded between 10 PM and 7 AM are increased by 10dB before being averaged. (A 3dB exchange rate is assumed.)
LLOG
LLOG is the last LEQ or LAvg logged during a study. This display is updated at the end of each logging interval.
LPeak
LPeak is the peak levelthe highest instantaneous sound pressure level recorded during a measurement interval. Output from a second peak detector can be viewed as LPeak or be logged. This frequency weighting is independent of the main RMS detector. You can set up this frequency weighting by using the Peak Weighting section of the Weight tab of the Sound Setup
119
dialog box.
OVL
This display option indicates the percentage of time during a study that an overload (OL) condition occurred. Overload indicates that the signal has exceeded the measuring range.
Pa2H
Pascal-squared hours (Pa²H) is a measure of sound exposure accumulated during the measurement period, given in Pa²H rather than as a percentage of dose. Pa²H is defined as the time integral of the squared instantaneous A-weighted sound pressure over a specific duration; for example, the duration of a working day. One Pa²H is typically the maximum allowable exposure.
RTMS and RTHM
RTMS represents the run time in minutes and seconds. RTHM represents the run time in hours and minutes. For a study lasting longer than one hour, the Min:Sec display wraps around to 00:00. The Hrs:Min display counts to 99:59 and then wraps around to 00:00, but the actual time is stored in memory.
TAKM
The TAKM Sound Setup option displays the time integration of individual Taktmaximal values. Taktmaximal is the maximum level (LMax) encountered over a 3-second or 5-second period (you select the interval on the Display tab). Taktmaximal measurements are required by some countries' noise regulations. A Taktmaximal measurement calculates a higher average level for highly impulsive sounds than does a LEQ measurement.
Related topics
Understanding noise-level data and parameters Setting up sound level meters Components of a sound data file
120
Working with sound data
Components of a sound data file
Sound data files have four main components, shown as the four main levels in the file's Explorer pane:
• File SummaryDisplays information about all the tests stored in the data file. Reports are created based on all of the tests. In a sound data file, the file summary contains two tabs: Summary and Report. The Summary tab has two sub-tabs: General and Profile.
• Group Summary or Session SummaryDisplays information about the selected group or session. Tests are stored in either groups or sessions. You can select the group or session summary or an individual test within that summary, and view the corresponding data. A group or session summary has five tabs: Summary; History Chart; Statistics Chart; Exceedance Chart; and Report.
• TestsDisplays information about individual tests (Test 1, Test 2, and so on), which you select in the Explorer pane. Each test has its own collection of tabs: Summary (with General, Setup, Values, and Comments sub-tabs); History Chart; Statistics Chart; Exceedance Chart; and Report.
• FiltersShows the filter changes that occurred between tests in a data file. The filters are octave band filters that can be attached to the sound level meter to turn it into an octave band analyzer.
• CalibrationsDisplays an instrument's calibration history, which is downloaded into the file with other instrument data. You can add calibrator information later so you have a record of which calibrator was used for each calibration. On this screen, calibrator information is the only information you can enter.
Related topics
File summaries for sound data Groups and sessions Individual tests in sound data files Filters Calibrations Components of a noise data file
121
File summaries for sound data
The file summary in a sound data file contains two tabs: Summary and Report.
The Summary tab
In a sound data file, the Summary tab for a file summary has two sub-tabs: General and Profile.
• Use the General sub-tab to view product information (instrument model, serial number, firmware version, and applet version) and either group information or session information (number of groups or sessions in the file, number of tests in the file, total number of periods, starting and ending times of the first and last tests in the file, and total run time).
• Use the Profile sub-tab to view information about the tests. The subject name, company, and work area can be selected from drop-down list boxes, which list the contents of the User Profile database. A description and comments can also be added on this sub-tab. Typically, you'll enter this information when you retrieve data into a data file, but you can also enter it later.
The Report tab
From the Report tab of a sound file's file summary, you can set up two kinds of reports: Full and Summary.
Related topics
Understanding sound-level data and parameters Setting up sound level meters Components of a sound data file Groups and sessions Individual tests in sound data files Filters Calibrations
122
Groups and sessions
In sound data files, individual tests are arranged by group or by session (depending on the way the data was recorded). Each group and session has its own summary, and these summaries are numbered. You can select a Group Summary or a Session Summary in the file's Explorer pane, and view the corresponding data. Whether you're viewing a group summary or a session summary, the data-file window displays the same five tabs: Summary, History Chart, Statistics Chart, Exceedance Chart, and Report.
The Summary tab
For session summaries, the Summary tab has four sub-tabs: General, Setup, Values, and Comments. For group summaries, the Summary tab has just two sub-tabs: General and Comments.
• For a group summary or session summaryUse the General sub-tab to view group or session information, such as the number of tests in the group or session, total number of periods, starting and ending times, and total run time. Session information also includes the measuring range.
• For a session summaryUse the Setup sub-tab to view the parameters (such as weighting, peak weighting, threshold, and exchange rate) programmed into the sound level meter used to run the tests in the selected session.
• For a session summaryUse the Values sub-tab to view summary values for the selected session. (For descriptions of the values recorded, see Understanding noise-level data and parameters and Understanding sound-level data and parameters.)
• For a group summary or session summaryUse the Comments sub-tab to view or type comments about the selected group or session. Typical comments describe the test conditions and what kind of testing was being done.
The History Chart tab
The History Chart tab shows the time-history data (how sound levels are accumulated over time) for the selected group or session.
The Statistics Chart tab The chart on this tab shows amplitude distribution statistics for the selected group or session. The amplitude distribution shows the percentage of time that sound samples occurred at particular decibel levels.
The Exceedance Chart tab The chart on this tab shows exceedance levels for the selected group or session. That is, the chart shows the percentage of time that sound samples exceeded a particular decibel level.
The Report tab
123
From the Report tab of a selected group summary or session summary in a sound file, you can set up four kinds of reports: Full, Summary, Statistics, and Exceedance.
Related topics
Understanding noise-level data and parameters Understanding sound-level data and parameters Setting up sound level meters Components of a sound data file File summaries for sound data Individual tests in sound data files Filters Calibrations
124
Individual tests in sound data files
In sound data files, individual tests are arranged by group or by session (depending on the way the data was recorded). In the file's Explorer pane, click the + sign next to a group or session to display the tests it contains. Then select the test you want to view data for. The data-file window for an individual test contains five tabs: Summary, History Chart, Statistics Chart, Exceedance Chart, and Report.
The Summary tab
For individual tests, the Summary tab has four sub-tabs: General, Setup, Values, and Comments.
• Use the General sub-tab to view the following test information: test number, number of periods, starting and ending times, run time, and logging interval.
• Use the Setup sub-tab to view the parameters (such as weighting, peak weighting, threshold, and exchange rate) programmed into the sound level meter used to run the selected test.
• Use the Values sub-tab to view summary values for the selected test. (For descriptions of the values recorded, see Understanding noise-level data and parameters and Understanding sound-level data and parameters.)
• Use the Comments sub-tab to view or type comments about the selected test. Typical comments describe the test conditions and what kind of testing was being done.
The History Chart tab
The History Chart tab shows the time-history data (how sound levels are accumulated over time) for the selected test.
The Statistics Chart tab The chart on this tab shows amplitude distribution statistics for the selected test. The amplitude distribution shows the percentage of time that sound samples occurred at particular decibel levels.
The Exceedance Chart tab The chart on this tab shows exceedance levels for the selected test. That is, the chart shows the percentage of time that sound samples exceeded a particular decibel level.
The Report tab
From the Report tab of a selected test in a sound file, you can set up four kinds of reports: Full, Summary, Statistics, and Exceedance.
Related topics
Understanding sound-level data and parameters
125

Understanding noise-level data and parameters Setting up sound level meters Components of a sound data file File summaries for sound data Filters Calibrations
126
Filters
The Filters section of a sound data file shows the filter changes that occurred between tests in the file. (The filters are octave band filters that users attach to a sound level meter to turn it into an octave band analyzer.) All the filter information, except for the serial number, is downloaded with the other data in the file. The serial number is the only information you can enter on this screen. In the Filter Changes box, each entry represents a physical filter change. If you reconnect the same physical filter to the sound level meter, the filter is recognized, so the reconnection will not show up as a change on the Filters screen. Tip: You can change the column widths in the Filter Changes box; just drag an edge of a column heading.
Changing the bands on these filters changes the instrument's response at certain frequency ranges. Similarly, an octave band analyzer does sound analysis on a band of frequencies. This equipment enables you to do a limited spectral analysis of the sound; that is, you can determine which ranges of frequencies are present in the sound, and to what extent. To add filter information:
1. Select an entry in the Filter Changes box.
2. Type the filter's serial number in the Serial Number box, and choose Apply.
Related topics
Overview of sound level meters Components of a sound data file Calibrations
127
Calibrations
Although Quest Technologies sound level meters maintain accurate calibration over a long period of time, you should check the calibration and make any adjustments necessary before each use. (For calibration instructions, see the instrument product manuals.) Each sound level meter stores the time, date, and SPL of its calibration. This information is included in data printouts and downloads. In a sound data file, the Calibrations screen displays the calibration history of the sound level meter used to record that file's data. (This history covers the calibrations performed just for that data file. For instance, you might calibrate the meter between each test when you're putting multiple tests into one file.) This information is downloaded into the data file with other instrument data. You can add calibrator information laterthe calibrator's serial number and the calibration date and timeso you have a record of which calibrator was used for each calibration. On this screen, calibrator information is the only information you can enter. To enter calibrator information:
1. Select a calibration record in the table. The Calibrator Information fields become available.
2. Enter the serial number of the calibrator used, and enter the date and time of the calibrator's calibration.
3. Choose the Apply button.
Field calibrators and instrument re-certification
The Quest Technologies QC-10 and QC-20 calibrators provide quick, precise field calibration. Each calibrator generates a stable acoustic signal at a controlled frequency and amplitude to verify the accuracy of your meter in the field. Model QC-10 is a general-purpose calibrator that generates a constant sound pressure level of 114dB at a fixed frequency of 1,000 Hz. Model QC-20 is recommended for use with precision ANSI and IEC Type 1 meters. With this calibrator, you can select a SPL of 94 or 114dB and select a frequency of 250 or 1,000 Hz to generate four different outputs. Quest Technologies sound level meters maintain their accuracy for many months of use. However, it's recommended that each meter be returned annually to a Quest Authorized Service Station for re-certification. Quest Technologies maintains and uses calibration standards traceable to the National Institute of Standards and Technology (NIST). This means that the instruments used to calibrate Quest Technologies products have themselves been calibrated to standards set by NIST. Quest Technologies is an ISO 9001 Registered Company and an A2LA ISO/IEC Guide 25 Accredited Calibration Laboratory. Quest Technologies calibration services include product updates. Tip: For more information on calibration services, or to place a service order, see the Quest Technologies Web site.
Related topics
Overview of sound level meters Components of a sound data file
128

Maintaining an instrument's certification history Setting re-certification alarms for instruments
129
Using the Heat Stress applet
Overview of heat stress monitors
The Heat Stress applet in QuestSuite Professional supports the QT-II and QT-III data-logging personal heat stress monitors and the QT-15, QT-34, and QT-36 data-logging area heat stress monitors.
Personal heat stress monitors
Personal heat stress monitors (the QT-II and QT-III) monitor an individual’s body temperature for indications of the onset of heat strain. (The QT-III also measures the individual's heart rate.) These devices warn users when their personal body temperature has risen above a safe level, so users can take action to cool themselves off.
Area heat stress monitors
Area heat stress monitors (also called thermal environment monitors) provide simultaneous protection to groups of workers with a single instrument. All three area heat stress monitors (QT-15, QT-34, and QT-36) measure three parameters: ambient or dry bulb temperature (DB), natural wet bulb temperature (WB), and globe temperature (G). The monitors use these readings to compute the Wet Bulb Globe Temperature (WBGT). This index can then be used with guidelines developed by ACGIH, the U.S. Navy, EPRI, ISO, and other organizations. Each set of guidelines includes considerations for real-life variables, such as activity levels or clothing types worn. Using QT area monitors with these guidelines enables you to determine appropriate work/rest regimens or stay times for workers in situations where heat stress is a safety and liability risk. Tip: The guidelines for stay times and work/rest regimens represent the expected impact of given environmental conditions and physical activity on groups of individuals. Each worker is physiologically unique, however. Environmental conditions and physical activity that cause heat stress for one worker might not affect another. Therefore, area monitoring should be used only with worker observation and with individual monitoring for heat stress symptoms.
All three area monitors provide inputs where you can add two more sensor bars. With all three sensor bars in use, you can simultaneously monitor up to three locations of a plant, shop, or any area up to 100 feet away. You can also use the three sensor bars to take readings for a weighted WBGT average. The QT-34 and QT-36 also measure relative humidity (RH) and compute the Heat Index (HI) and the Canadian Humidex. The QT-36 also computes the stay times for three indices: ACGIH stay times, Navy PHELs, and EPRI action limits. With the QT-36, you can also plug in an optional detachable probe to measure air velocity in meters per second. The QT-36 can then be used as an indoor thermal comfort monitor using the air velocity probe, temperature readings, and RH readings simultaneously. Other applications include verification of air flow in fume hoods or in rooms normally requiring a minimum amount of
130
air flow to be safe for occupancy. Tip: For more information, see the Quest Technologies Web site. Information about specific heat stress monitors is provided in the Products section of the site. Also, see the Application News Notes, available in the Support section of the site. These Notes include such topics as "Work/Rest Regimens as a Heat Stress Management Tool" (Note 4).
Applications
Applications for the QT-Series heat-stress monitors include: • Management of occupational heat stress • Management of sports and recreational heat stress • Indoor-air-quality inspections • HVAC system performance testing • Thermal comfort monitoring • Risk analysis of job function or activity • Physical exertion analysis • Testing of heat stress control products
The Heat Stress applet In addition to providing the usual charting and reporting functions, the Heat Stress applet allows you to:
• Maintain permanent records of comprehensive exposure assessment. • Automatically determine PMV and PPD thermal-comfort indices. • Perform what-if analyses on PMV and PPD values.
Related topics
Setting up heat stress monitors Remotely controlling the heat stress monitors Understanding heat stress data and parameters Components of a heat stress data file
131
Setting up heat stress monitors
To set up the heat stress monitors, you select the Heat Stress applet, select the monitor, and then select Set Up The Instrument. The QT-II monitor cannot be set up through QuestSuite Professional, but the QT-III, QT-15, QT-34, and QT-36 monitors can. Each of these monitors has its own Setup dialog box; the QT-34 and QT-36 are the most similar to each other.
Setting up the QT-III The Setup dialog box for the QT-III has two tabs: General and User Parameters.
The General tab
Use this tab to select a temperature scale (Fahrenheit or Celsius), to enable security and enter a User ID, to disable alerts and reminders, and to select the screens you want to display on the monitor: heart rate and temperature; date and time; test duration; and/or strain index.
SecurityThe QT-III allows you to turn on a secure mode, which locks out the ability to use the monitor's LOG button to stop logging. When this feature is used, logging can be stopped only by using QuestSuite Professional to send a command to stop logging.
User IDThe User ID is a 6-character identifier that is stored each time logging is started. This ID identifies which user was wearing the instrument while data was recorded. If a User ID is entered, it will appear at the top of each report.
AlertsWhile the QT-III is logging, it uses a two-stage alert system, with both visual and audio indicators. The first stage is a warning alert, which indicates that body temperature, heart rate, or both are approaching a level at which there is a limited amount of time to work before heat stress might become limiting. At this point, the worker might be able to take action to reduce the physiological strain and extend the work time.
The second stage is an action alert, which indicates that the worker should stop work immediately and take action to cool down. After an action alert is given, the user can acknowledge the alert by pressing any key on the monitor. The unit will then sound an alert reminder (8 rapid sounds) once every minute until logging is stopped, or until a transition occurs and the heat stress level returns to normal.
Caution: If a worker experiences symptoms of heat-related disorders, he or she must take action to limit heat stress exposures, even if no alerts are given by the personal heat stress monitor.
Heart rate and temperatureThe QT-III measures and records the user’s heart rate and temperature, and calculates the level of heat strain once a minute.
Strain indexA strain index is a method of showing the progression of physiological strain, with 0.00 being resting conditions and 1.00 being the action alert. The QT-III calculates and displays separate strain indices for heart rate and body temperature.
The User Parameters tab
Use this tab to select an age group and clothing type for users being monitored, and to enter a custom header. This is a 50-character header which will appear at the start of
132
each report. Note: The age group and clothing type selected set the monitor's operating thresholds; therefore, it is very important that these options be selected correctly and be set before logging is started.
Setting up the QT-15
The Setup dialog box for the QT-15 has three tabs: General, Auto-On, and Alarms.
The General tab Use this tab to select a data set to display (one of the three sensor bars or the ISO average, to select a temperature (wet bulb, dry bulb, globe, WBGT indoor/outdoor/custom) to display, to select a print rate, and to define custom WBGT factors. (All three sensors still measure and record, but the only data set that's shown on the monitor is the one that's selected here. This applies to temperatures, too.)
Data SetThe QT-15 can accommodate three sensor bars for simultaneous temperature monitoring at three locations. The data from these bars can be analyzed separately or be combined into a weighted WBGT average according to ISO 7243.
TemperatureThe QT-15 displays indoor or outdoor WBGT readings as well as any of the individual sensor temperatures used to compute the WBGT reading.
Custom WBGT FactorsYou can modify the constants to create a custom WBGT index. Print RateThis is the frequency with which logged data is printed. The print rate
determines the time interval between data points on the printout. Data is logged every 30 seconds in Run mode, but the print rate is used to condense the data. For example, a 10-minute print rate would print every twentieth set of temperature information (every 10 minutes).
The Auto-On tab Use this tab to enable the automatic programming feature and to program the instrument to run automatically. Select a mode (date, weekdays, or daily), and then, as necessary for the mode, specify the start date, start time, and/or days.
The Alarms tab Use this tab to select the WBGT index and the sensor set for which you want to program an alarm. You'll also specify the temperature threshold (Level) and the relay state. The maximum alarm temperature is 199.9°C (391.8°F).
Data Set, Temperature, and LevelThe QT-15's alarm signals the user that the environment is above the programmed temperature threshold. This threshold can be assigned to any one of the WBGT indexes for any one of the three sensor bars or for the ISO average. In addition, the temperature read by any single sensor (wet bulb, dry bulb, or globe) of any sensor bar can also serve as an alarm threshold. This feature is available only through QuestSuite Professional and cannot be set through the keypad.
Relay StateThe instrument's alarm jack connects to a set of relay contacts which are activated if the programmed alarm value is exceeded. These relay contacts can be used
133
to signal external equipment that the alarm temperature has been exceeded. The relays can be programmed to either open or close when the alarm temperature is exceeded. (When the temperature reaches or exceeds the alarm temperature, normally open relays will close, and normally closed relays will open.)
Note: The QT-15, QT-34, and QT-36 can all accommodate two optional additional sensor bars. The Setup dialog boxes for the 34 and 36 don't have options for setting or selecting sensor bars. On these instruments, if the sensor bars are needed, the user installs them, and the instrument detects that they are there.
Setting up the QT-34 and QT-36
The Setup dialog box for the QT-34 has two tabs: General and Auto-On. The Setup dialog box for the QT-36 has those two tabs plus a third tab: Stay Times.
The General tab Use this tab to select a language, a logging rate, a temperature scale (Fahrenheit or Celsius), and a calculation (Humidex or Heat Index).
The Auto-On tab Use this tab to enable the automatic programming feature and to program the instrument to run automatically. Select a mode (date, weekdays, or daily), and then, as necessary for the mode, specify the start date, start time, duration, and/or days.
The Stay Times tab (QT-36 only) Use this tab to turn on air-flow measuring (if the optional meter is attached to the instrument) and to set the parameters for calculating stay times in the environment where the instrument will be used. The QT-36 provides users with real-time guidance on stay times and work/rest regimens. Guidance is based on screening criteria for heat stress as defined in the ACGIH TLV Handbook, the U.S. Navy PHEL charts, and EPRI Action Limits.
Air VelocityAn optional detachable probe for measuring air velocity can be used to extend the applications for the QT-36 beyond traditional heat stress measurements. The QT-36 can serve as an indoor thermal comfort monitor if the air velocity probe, temperature readings, and RH sensor readings are used simultaneously. (Other applications include verification of air flow in fume hoods or in rooms normally requiring a minimum amount of air flow to be safe for occupancy.) Air velocity is measured in meters per second over a range of 0 to 20 m/s in increments of 0.1 m/s.
CalculationSelect the index you want to use for calculating stay times: ACGIH, Navy, EPRI, or ISO (or none).
MeasurementSelect the measurement you want to use with the stay-time index: WBGT indoor or WBGT outdoor.
Worker ConditionThe Acclimated and Unacclimated options apply only to the ACGIH index; the Navy, EPRI, and ISO calculations will ignore this setting.
Clothing FactorThis is a clothing correction for the WBGT in degrees Celsius, ranging
134
from 0 to 9.9°C. The clothing correction will be applied to the selected WBGT when the work duration is calculated, but will not affect the WBGT as displayed by the unit. The Clothing Factor value should typically be set to 0.0 for the Navy index.
Note: Do not confuse the clothing factor here with clothing insulation values.
Related topics
Overview of heat stress monitors Remotely controlling the heat stress monitors Understanding heat stress data and parameters Components of a heat stress data file
135
Remotely controlling the heat stress monitors
The QT-III, QT-15, QT-34, and QT-36 heat stress monitors can be controlled remotely. That is, you can access additional functions through QuestSuite Professional rather than having to perform them on the instrument itself. You can use the Remote Control function with either a local connection or a remote connection. With a local connection, the instrument is connected, by serial cable, directly to your computer. With a remote connection, the instrument (in a remote location) is connected to a phone line and communicates with your computer by modem. Tip: "Remotely controlling" the instruments means that you can control them and view their data from QuestSuite Professional rather than from their keypads and displays. For those instruments that have a Remote Control function, it gives you access to a couple more options, in addition to programming the instrument and retrieving data from it by using QuestSuite. A "remote connection" refers to communicating via modem and phone line with an instrument in another (non-local) location.
To remotely control a heat stress monitor: 1. Make sure that the instrument is on. If you're retrieving data from a local instrument, then
connect it by cable to the computer's serial port. If you're retrieving data from a remote instrument, connect with it by modem. (See Connecting with an instrument.)
2. Select the Heat Stress applet, and then select the instrument.
3. Choose the Remotely Control The Instrument operation to open the instrument's Remote Control dialog box. For the QT-IIIDo any of the following:
View the recording status to verify that the remote instrument is recording. View the number of periods recorded so far. Choose the Stop Logging button to stop the instrument's logging. Choose the Clear Data button to clear the instrument's data. (Data cannot be cleared
while the instrument is logging.) View the user's heart rate and temperature readings on your computer screen as they
occur. Also displayed are the Strain Indices for both heart rate and temperature. The Strain Index values appear only after data has been logged.
Choose the Chart button to view a chart of the instrument user's heart rate and temperature readings, in real time. For the QT-15, QT-34, and QT-36Do any of the following:
Choose the Clear button to clear the data from the instrument. Check the Celsius checkbox to display temperatures in degrees Celsius instead of
degrees Fahrenheit. View the wet bulb, dry bulb, and globe temperatures, the indoor and outdoor WBGT
values, the RH (relative humidity) values, and the Heat Index valuesall in real time. (For the QT-36, the air-velocity value is also displayed.)
Choose the Chart button to view a chart of these values in real time.
4. When you're done using the Remote Control features, choose the Close button to close
136
the dialog box.
5. If you were using a local connection, you can unplug the instrument from your computer. If you were using a remote connection, then choose Setup>Hang Up to disconnect from the remote instrument.
Related topics
Connecting with an instrument Disconnecting from a remote instrument Setting up heat stress monitors
137
Understanding heat stress data and parameters
To set up the heat stress monitors and work with heat stress measurement data, you'll need to understand the following terms and concepts:
• Acclimatization • ACGIH • ASHRAE • clo • EPRI • Heat Index, Humidex • Heat stress, heat strain • HVAC • Metabolic rate (met) • MRT (mean radiant temperature) • MTA (moving time average) • Navy PHEL • PMV, PPD • RH (relative humidity) • Sensor bar • Stay time (work/rest regimen) • Strain index • Thermal comfort • WBGT (Wet Bulb Globe Temperature) • Weighted WBGT average (or ISO average)
Acclimatization
Acclimatization is a gradual physiological adaptation that improves an individual's ability to tolerate heat stress. Basically, the longer you do hard work in the heat, the better your body becomes at cooling itself off. You can become acclimated (or acclimatized) by gradually increasing your exposure to the hot environment or by gradually increasing your activity level in that environment. Some heat stress indices have options for acclimated workers vs. unacclimated workers.
ACGIH
ACGIH is the American Conference of Governmental Industrial Hygienists, a member-based organization and community of professionals that advances worker health and safety through education and through the development and dissemination of scientific and technical knowledge. The ACGIH provides annual editions of the TLVs (Threshold Limit Values) and BEIs (Biological Exposure Indices) publications and provides work-practice guides.
138
ASHRAE
ASHRAE is the American Society of Heating Ventilating and Air-conditioning Engineers. The ASHRAE scale is a set of seven descriptors of subjective warmth. The usual wording is: cold (-3), cool (-2), slightly cool (-1), neutral (0), slightly warm (+1), warm (+2), and hot (+3). Because of individual differences, it is impossible to specify a thermal environment that will satisfy everyone. The ASHRAE standard is to specify a thermal environment that is acceptable to at least 80% of the occupants.
clo
A clo is a clothing insulation unita unit used to express the amount of thermal insulation provided by clothing.
EPRI EPRI, the Electric Power Research Institute, was founded in 1973 as a non-profit energy research consortium. EPRI manages a program of scientific research, technology development, and product implementation. (For more information, see www.epri.com.)
Heat Index, Humidex
The Heat Index (HI) is determined using the dry bulb temperature and relative humidity. Based on charts from the US National Weather Service, the Heat Index represents how an average person feels relative to climate conditions. For a given temperature, the higher the humidity, the higher the Heat Index. The Heat Index is defined over a temperature range of 70°F to 120°F (21°C to 49°C) and a relative humidity range of 30% to 99%. Outside this range, dashes will appear in the instrument's HI display. The Humidex, used primarily in Canada, works on the same concept as the Heat Index, but the values are slightly different. The Humidex is defined over a temperature range of 70°F to 109°F (21°C to 43°C) and a relative humidity range of 20% to 99%. Outside this range, dashes will appear in the instrument's Humidex display.
Heat stress, heat strain
Heat stress is the net heat load to which a worker might be exposed from the combined contributions of the metabolic cost of work, environmental factors, and clothing requirements. Environmental factors include air temperature, humidity, air movement, and radiant heat exchange. Personal factors are the worker's activity level and clothing type. Heat strain is the overall physiological response resulting from heat stress.
HVAC
HVAC stands for heating, ventilation, and air conditioning and refers to a building's systems for regulating air temperature and keeping the air fresh.
Metabolic rate (met)
139
Metabolic rate is the rate of heat production by the body when engaged in various tasks. Metabolic rate, expressed in met units, is often defined in terms of the resting metabolism.
MRT (mean radiant temperature) MRTmean radiant temperatureis the uniform surface temperature of an imaginary black enclosure with which an occupant would exchange the same amount of radiant heat as in an actual nonuniform environment. MRT is an approximate indication of the effect that the surface temperatures of surrounding objects have on human comfort. Radiant heat transfer is the transfer of heat energy from a location of higher temperature to a location of lower temperature by means of electromagnetic radiation (rather than by conduction or convection). A worker whose body temperature is greater than the temperature of the surrounding surfaces radiates heat to these surfaces. Conversely, hot surfaces and infrared light sources radiate heat that can increase the body's heat load.
MTA (moving time average) MTA stands for moving time average. It is essentially a sliding window of time over which an average level of heart rate is calculated. In the history charts of some heat-stress data files, you'll see "MTA" followed by numbers, such as MTA-30. The number is the number of minutes over which the average is calculated. For MTA-30, there would be no MTA calculated during the first 30 minutes. After the first 30 minutes, an MTA would be calculated. Then a new 30-minute MTA would be calculated for each subsequent half-hour. So, the first MTA would be for minutes 1 through 30, the second MTA would be for minutes 31 through 60, and so on.
Navy PHEL
The U.S. Navy has a heat stress prevention program that identifies safe physiological heat exposure limits (PHELs) for people exposed to environments with high heat or humidity. The Navy PHEL chart provides standards for stay times.
PMV, PPD
PMV is the predicted mean vote (on a seven-point, cold-to-hot sensation scale) for a large population of people exposed to a certain environment. This vote predicts the average comfort level that people will select on this seven-point scale. PPD is the predicted percentage of dissatisfied (uncomfortable) people at each PMV value. The PMV scale ranges from -3 (too cold) to +3 (too hot), where zero represents "just right." Because of individual differences, it is impossible to specify a thermal environment that will satisfy everyone. Therefore, PPD never goes below 5%. PMV tables are available for different environments and for given clothing and metabolic rates. These tables can be found in ISO standard 7730.
Relative humidity (RH) Relative humidity is the amount of water vapor in the air at a specific temperature as compared with the maximum amount of water vapor that the air can hold at that temperature. RH is expressed as a percentage.
140
Sensor bar Used in the QT area heat-stress monitors, a sensor bar is a set of three sensors:
• Natural wet bulb thermometerIndicates the effects of humidity on an individual. Relative humidity and wind speed are taken into account by measuring the amount of evaporative cooling taking place at a thermometer covered with a moistened wick.
• Globe thermometerIndicates the radiant heat exposure to an individual due to either direct light or hot objects in the environment. This is accomplished by placing a temperature sensor inside a blackened copper sphere and measuring the temperature rise.
• Dry bulb thermometerMeasures the ambient air temperature. This measurement is used in the outdoor WBGT calculation when a high solar radiant heat load might be present.
The QT area heat stress monitors have three sensor bars (one default; two optional). You can use these for simultaneous monitoring of up to three sensor arrays. The data from these arrays can be analyzed separately or combined into a weighted average WBGT reading according to ISO 7243.
Stay time (work/rest regimen) Stay time is the length of time a worker should be able to work safely under particular heat stress conditions. There are several indices (with their own terminology) for calculating stay times:
• ACGIH stay times • Navy PHELs (physiological heat exposure limits) • EPRI (Electric Power Research Institute) action limits • ISO (International Organization for Standardization) work/rest regimens
Strain index
A strain index is a method of showing the progression of physiological strain, with 0.00 being resting conditions and 1.00 being the action alert. The QT-III calculates and displays separate strain indices for heart rate and body temperature.
Thermal comfort Thermal comfort is a person's subjective evaluation of the thermal environment. (Does it feel too hot, too cold, or just right?) There are various indices for measuring and predicting thermal comfort. Two internationally recognized standards that address human thermal comfort in buildings are:
• ASHRAE Standard 55-1992Specifies conditions or comfort zones for which 80% of sedentary or slightly active persons find the environment thermally acceptable.
• ISO 7730:1994Provides a method for predicting the thermal sensation and the degree of discomfort of people exposed to moderate thermal environments; and specifies acceptable environmental conditions for comfort. This standard uses the PMV-PPD model.
141
WBGT (Wet Bulb Globe Temperature) The Wet Bulb Globe Temperature is a value computed from the three parametersdry bulb temperature (DB), natural wet bulb temperature (WB), and globe temperature (G)measured by area heat stress monitors. (See Sensor bar.) Described in ISO 7243:1989, the WBGT Index provides a single value that enables you to evaluate the level of heat stress caused by an environment. The WBGT Index provides work/rest regimens based on the WBGT and the metabolic rate of the worker. The QT-36 area heat stress monitor calculates the WBGT and displays work/rest regimens for each of the four metabolic work categories. You can also use QuestSuite Professional to get this information from the data recorded by all three of the area heat stress monitors. (See The Stay Time tab in Individual tests in heat stress data files.) There are two WBGT indices: Indoor and Outdoor. They are calculated using these formulas:
WBGT Indoor = 0.7WB + 0.3G WBGT Outdoor = 0.7WB + 0.2G + 0.1DB
Weighted WBGT average
(Also referred to as the ISO Average in QuestSuite Professional.) When the space surrounding a worker does not have a constant temperature, you need to determine the WBGT index at three heightscorresponding to the worker's ankles, abdomen, and headand then calculate a weighted average of those three WBGT measurements. The average is computed with this formula, which is specified in ISO 7243:1989:
WBGTweighted = (WBGThead + (2 x WBGTabdomen) + WBGTankles) / 4 The QT area monitors assign the top sensor bar (Sensor #1) the double weighting. This calculation is shown if a WBGT display has been selected as a Setup option and if three sensor bars are connected to the instrument.
Related topics
Setting up heat stress monitors Components of a heat stress data file
142
Working with heat stress data
Components of a heat stress data file
All heat stress data files have at least two components, shown as the two main levels in the file's Explorer pane:
• File SummaryDisplays information about all the tests stored in the data file. Charts and reports are created based on all of the tests. The file summary in a heat stress data file contains three tabs: Summary, History Chart, and Report. The Summary tab has three sub-tabs: General, Values, and Profile.
• TestsDisplays information about individual tests (Test 1, Test 2, and so on), which you select in the Explorer pane. Each test has its own collection of tabs; the tabs vary depending on the instrument used to collect the data. In the data files for the heat stress monitors, the individual tests have at least the following three tabs: Summary, History Chart, and Report. The Summary tab has four sub-tabs: General, Setup, Values, and Comments. In the data files for all three of the area heat stress monitors (QT-15, QT-34, QT-36), individual tests also have a Stay Time tab. Individual tests in QT-36 data files have a fifth tab: Thermal Comfort.
QT-II data files also have one additional component (for viewing only):
• CalibrationsDisplays an instrument's calibration history, which is downloaded into the file with other instrument data.
In data files created with any of the three area heat stress monitors, history charts have the Stay Time charting tool and the Display Sensor Bar charting tool.
Related topics
File summaries for heat stress data Individual tests in heat stress data files Calibrations
143
File summaries for heat stress data
The file summary in a heat stress data file contains three tabs: Summary, History Chart, and Report.
The Summary tab
In a heat stress data file, the Summary tab for a file summary has three sub-tabs: General, Values, and Profile.
• Use the General sub-tab to view product information (instrument model, serial number, firmware version, and applet version) and test information (number of tests in the file, starting and ending times of the first and last tests in the file, and total run time). For data files created by area heat stress monitors, test information might also include the active sensor bars and WBGT custom settings. In QT-15 data files, the General sub-tab also displays alarm settings.
• Use the Values sub-tab to view summaries of data for all the tests in the file. The kinds of data displayed here depend on the heat stress monitor used to create the file. For example, the QT-III files show maximum, average, and minimum values for the subject's core temperature and heart rate. QT-15 data files showfor each sensor bar usedseveral values for wet bulb temperature, dry bulb temperature, globe temperature, and indoor, outdoor, and custom WBGT. (Values include Maximum, date and time at which the Maximum value occurred, Average, Minimum, and date and time at which the Minimum value occurred.) For descriptions of the values recorded, see Understanding heat stress data and parameters.
• Use the Profile sub-tab to view information about the tests. The subject name, company, and work area can be selected from drop-down list boxes, which list the contents of the User Profile database. A description and comments can also be added on this sub-tab. Typically, you'll enter this information when you retrieve data into a data file, but you can also enter it later.
The History Chart tab
The chart on this tab shows heat stress exposure levels over time (for data recorded by personal heat stress monitors) or temperature, and sometimes humidity, readings over time (for data recorded by area heat stress monitors).
The Report tab
From the Report tab of a heat stress data file's file summary, you can set up two kinds of reports: Full and Summary. For either kind of report, you can select temperature units (degrees Celsius or Fahrenheit). For full reports in files created by area heat stress monitors, you can also select WBGT Indoor or WBGT Outdoor, and select Stay Time factors.
Related topics
144

Understanding heat stress data and parameters Setting up heat stress monitors Components of a heat stress data file Individual tests in heat stress data files Calibrations
145
Individual tests in heat stress data files
The Tests section in a heat stress data file contains at least three tabs: Summary, History Chart, and Report. In the data files for all three of the area heat stress monitors (QT-15, QT-34, QT-36), individual tests also have a Stay Time tab. Individual tests in QT-36 data files have a fifth tab: Thermal Comfort.
The Summary tab The Summary tab for a heat stress data file's Tests section has four sub-tabs: General, Setup, Values, and Comments.
• Use the General sub-tab to view the following test information: test number, number of periods, starting and ending times, run time, and logging interval. Test information recorded by area heat stress monitors also includes the sensor bars used.
• Use the Setup sub-tab to view the parameters programmed into the monitor used to run the selected test. These parameters vary according to the instrument used. Typical parameters are Alarm Level (for QT-II files), Age Group and Clothing Type (for QT-III files), and Heat Index, Humidex, and Air Flow (for QT-36 files).
• Use the Values sub-tab to view value summaries for the selected test. Value types vary according to the instrument used. (For descriptions of the values recorded, see Understanding heat stress data and parameters.)
• Use the Comments sub-tab to view or type comments about the selected test. Typical comments describe the test conditions and what kind of testing was being done.
The History Chart tab
The History Chart tab shows the time-history data (such as heat stress exposure over time) for the selected test.
The Report tab
From the Report tab of a heat stress data file's Tests section, you can set up two kinds of reports: Full and Summary. For either kind of report, you can select temperature units (degrees Celsius or Fahrenheit). For full reports in files created by area heat stress monitors, you can also select WBGT Indoor or WBGT Outdoor, and select Stay Time factors.
The Stay Time tab
In data files created by the area heat stress monitors, you can use the Stay Time tab to calculate stay times based on data in the selected test. Four sets of stay-time guidelines are available: Navy PHEL, ACGIH, EPRI, and ISO. The Worker Condition options apply only to ACGIH guidelines. The Clothing Type option applies only to EPRI guidelines. To calculate stay times:
1. Select a sensor bar (if more than one is available); select the calculation type; and select WBGT Indoor or WBGT Outdoor.
146
2. Select a Worker Condition or Clothing Type (if applicable).
3. Choose the Calculate button. The results are displayed in the table below the options.
The Thermal Comfort tab
In data files created by the QT-36 monitor, you can use the Thermal Comfort tab to do what-if analyses using the selected test's data. To do what-if analysis with thermal comfort factors:
1. Set values for clothing insulation units, metabolic rate, and external work. (External work is any external force that might affect thermal stresses. As with metabolic rate, external work values are expressed in met units.)
2. Enter values for dry bulb temperature, relative humidity, and air flow (air velocity).
3. Choose the Calculate button. Resultsincluding the PMV and PPDare displayed in the table below the options.
You can choose the Reset button to restore the dry bulb temperature, relative humidity, and air flow values to their original values.
Related topics
Understanding heat stress data and parameters Setting up heat stress monitors Components of a heat stress data file File summaries for heat stress data Calibrations Working with the Stay Time for a chart or report
147
Calibrations
Data files for QT-II personal heat stress monitors show the calibration history for the instrument used to record each file's data. This calibration history is downloaded with the data.
Related topics
Overview of heat stress monitors Components of a heat stress data file
148
Using the Gas Detection applet
Overview of gas monitors
The Gas Detection applet supports the SafeLog 100 and MultiLog 2000 data-logging gas detection monitors. Both monitors are compact devices that are worn by users. The monitors provide audio and visual alerts when real-time gas levels exceed prescribed limits. The SafeLog 100 accommodates one sensor at a time; users can select from ten interchangeable electrochemical sensors. The SafeLog 100 measures gas concentration at one sample per second. It logs over 60 hours (in continuous or multiple sessions) of 1-minute historical data. The MultiLog 2000 simultaneously measures up to four gases from a selection of nine toxic gases, oxygen, and combustible gases. The MultiLog 2000 stores the concentration level, STEL, TWA, average level, peak level, peak STEL, and temperature.
The sensors
Quest Technologies' unique smart-sensor technology includes automatic sensor recognition, alarm set points, calibration levels and dates, service dates, temperature compensation information, and other valuable data that travels with each sensor from one monitor to another. Quest Technologies monitors also let users confirm proper calibration and/or perform recalibration in the field. For the SL-100, users can select from ten electrochemical sensors: a sensor for oxygen (O2), plus sensors for nine toxic gases. These are ammonia (NH3), carbon monoxide (CO), chlorine (Cl2), ethylene oxide (ETO), hydrogen cyanide (HCN), hydrogen sulfide (H2S), nitric oxide (NO), nitrogen dioxide (NO2), and sulphur dioxide (SO2). The ML-2000 can use these same sensors, plus a sensor for combustible gases. These gases can be measured as a percentage of LEL (lower explosive limit) or as a percentage by volume of CH4 (methane). This second option is just a different way of reporting the concentration of one particular combustible gas (methane). When CH4 is 5% by volume, it is also at 100% of its LEL point. (There is one combustible-gas sensor, and it detects all combustible gases. The CH4 and LEL settings just change how the sensor data is interpreted.)
Applications
Applications for Quest gas monitors include: • Water and wastewater treatment plants • Street and sewer maintenance • Fire safety and HazMat teams • Building inspections • Confined spaces • Mining industry • Paper and pulp mills • Food processing
149
• Police and safety departments • Landfills and transfer stations • Refineries and cargo ships • Telecommunications and cable • Manufacturing • Municipal power utilities
The Gas Detection applet In addition to providing the usual charting and reporting functions, the Gas Detection applet allows you to:
• Preview and tailor specific data for employee notification reports. • Select and chart critical peak-exposure data in specific time ranges.
Related topics
Setting up gas monitors Understanding gas detection data and parameters Components of a gas data file
150
Setting up gas monitors
To set up either of the gas monitors, you select the Gas Detection applet, select the monitor, and then select Set Up The Instrument. QuestSuite Professional supports two gas monitors: the SafeLog 100 and MultiLog 2000. You'll use the SL-100 Setup and ML-2000 Setup dialog boxes, respectively, to program them. The SL-100 Setup dialog box has two tabs: Sensor and Miscellaneous. The ML-2000 Setup dialog box has seven tabs: one for each of the instrument's four sensors, plus Common, Miscellaneous, and Print.
The Common tab (ML-2000) The ML-2000 monitor has slots for four sensors. Settings on the Common tab apply to all sensors used during any given session.
• Security CodeThis is a four-digit code that users need to type into the instrument in order to enter Setup mode and change any setup parameters.
• BacklightIf you use the Backlight option, you select how long you want the instrument's backlight to be on. If it's on, the backlight will illuminate the instrument screen for the selected interval each time a key is pressed during Run mode and in the Main Menu, whenever the instrument is turned on and off, and when an alarm sounds. The backlight is useful in low-light areas but is not noticeable in bright areas.
• Pre-Alarms EnabledWhen this feature is enabled, if the sensor reading exceeds the pre-alarm level, the instrument chirps once per second. (The Pre-Alarm feature is available only through QuestSuite, not through the instrument's Setup menu.) Set the Pre-alarm level slightly lower than the Alarm level, so you know when you're approaching dangerous levels of toxic gases.
• Alarm Latch EnabledIf this feature is enabled, then when the alarm sounds, it "latches," or stays on, until the user presses the instrument's I/O key to acknowledge the alarm.
• LoggingSelect a logging mode: Continuous or Level-Triggered. For level-triggered logging, when a trigger level is reached, a session begins and the instrument logs time-history data from all of the sensors. When the level falls below the trigger, the logging stops.
• IntervalThis option determines how often sensor data is stored in memory. If you don't want to record time-history data, set Interval to Off.
The Sensor tabs
The SL-100 Setup dialog box has one Sensor tab; the ML-2000 Setup dialog box has four. For either instrument, use the Sensor tab(s) to select a sensor type and other related options.
• For both instrumentsUse the Sensor Type drop-down list box to select the type of sensor to be used. For both instruments, you can select any of the gases listed in Overview of gas monitors, plus COu (unfiltered carbon monoxide). For the ML-2000, you can also select Combustible (CH4) and Combustible (LEL), but only on the Sensor #1 and Sensor #2 tabs.
151
• For both instrumentsUse the Span field to set the concentration of the calibration gas used to calibrate each sensor. For example, if the sensor will be calibrated at 25 ppm, enter “25” as the span value.
Caution: Each sensor should be calibrated before the user enters the work area. Failure to calibrate can result in inaccurate sensor readings, so an uncalibrated gas monitor can be as dangerous as no monitor at all. For detailed calibration instructions, see the instrument's product manual.
• For both instrumentsAlarm Level and Pre-Alarm Level options vary for different sensor types. (The Alarm Levels fields are not available until you select a sensor type. When you select a sensor type, its default alarm values are displayed.) For the oxygen sensor, High and Low activation levels can be set. For the combustible-gas sensor (either LEL or CH4), the High level can be set. For the toxic-gas sensors, three levels can be set: High, STEL, and TWA. Note: Each sensor has alarm activation levels. Although you can change any of these levels, we recommend that you use the default values that have been factory-programmed into the instrument.
• For the ML-2000Pre-Alarm Levels are not available unless you enable Pre-Alarms on the Common tab. Level-Triggered options are not available during Continuous logging mode. When you use Level-Triggered mode, the trigger conditions can be set to any of the instrument's alarm parameters, but the specific trigger levels need not match the alarm levels. For the oxygen sensor, High and Low trigger levels can be set. For the combustible-gas sensors, a High level can be set. For the toxic-gas sensors, High, STEL, and TWA levels can be set. If Level-Triggered mode is enabled, default trigger-level values will be displayed on each Sensor tab as soon as you select a sensor type on that tab. Note: You still need to check each trigger's checkbox to enable that particular trigger.
• For the ML-2000The Service Date field lets you specify service due dates for the installed sensors. Whenever the instrument is turned on after this date has passed, a "Service Reminder" message appears on the instrument's screen, along with a list of which sensors need service.
Tip: Each sensor's internal memory stores the service date information, so it will travel with the sensor if it is removed and installed in another instrument.
The Miscellaneous tab
The Miscellaneous tab is similar in both Setup dialog boxes. You select temperature display units (degrees Fahrenheit or Celsius), a time format, and a date format. You can also enable the instrument's confidence chirpa periodic beeping sound that lets the user know that the instrument is on and is working properly.
• For the ML-2000You can set the interval for the confidence chirp. (The SL-100 chirps every 30 seconds while the instrument is running.)
• For the SL-100The Security Code is a four-digit code that users need to type into the
152
instrument in order to enter Setup mode and change any parameters.
The Print tab (ML-2000) Use this tab to select report sections to be printed when you print directly from the instrument. Report sections are Alarm Settings, Calibration, File Summary, Header, and Logged Data. All sections are selected by default. To change settings, click the Selected option and then uncheck the options that you want to leave out of the printout.
Related topics
Overview of gas monitors Understanding gas detection data and parameters Components of a gas data file
153
Understanding gas detection data and parameters
To set up the gas monitors and work with gas detection data, you'll need to understand the following terms and concepts:
• Alarm levels • Average • Combustible (explosive) range • High alarm level • LEL (lower explosive limit) and UEL (upper explosive limit) • Peak • Peak STEL level • ppm (parts per million) • STEL (short-term exposure limit) • STEL alarm level • TWA (time-weighted average) • TWA alarm level
Alarm levels
Quest Technologies gas monitors have alarms for oxygen, combustible gases, and toxic gases. For the oxygen sensor, low and high alarm levels can be set. The low alarm level for oxygen is anything less than 19.5%, and the high alarm level is anything greater than 23.5%. Both oxygen-deficient and oxygen-rich atmospheres present hazardous work conditions. Oxygen deficiency is dangerous for workers in confined spaces. Oxygen-rich atmospheres can lower the combustible range of some gases and cause them to burn. For the combustible-gas sensor, the high level can be set. The default alarm level for LEL is 10% of LEL. For the toxic-gas sensors, three levels can be set: high, STEL, and TWA.
Average Average values in a gas data file refer to the average level of the gases recorded during a single monitoring session.
Combustible (explosive) range
Fires and explosions need three things in order to happen: enough oxygen; an ignition source (flame, spark, or heat); and a source of fuel (such as certain chemicals and hazardous substances). The combustible range is the concentration range between the LEL and UEL; this is the range in which a fuel can ignite and sustain a fire. For example, for methane gas at ambient temperature, the LEL is 5% gas in air by volume, while the UEL is about 15% gas in air by volume. All concentrations between 5% and 15% are in the explosive range. Tip: The combustible range increases with increasing temperatures and in oxygen-rich atmospheres.
154
High alarm level This alarm level identifies the highest concentration of a toxic gas to which an unprotected worker should ever be exposed. When this level is reached or exceeded, the instrument's alarm sounds.
LEL (lower explosive limit), UEL (upper explosive limit) Both LEL and UEL refer to concentrations of combustible gases in air. The LEL (lower explosive limit) is the lowest concentration of gas that will burn or explode upon contact with a source of ignition. Below the LEL, the mixture won't burn because there is insufficient fuel. The UEL (upper explosive limit) is the highest concentration of gas that will burn or explode upon contact with a source of ignition. Above the UEL, the mixture won't burn because there is insufficient oxygen. The LEL and UEL are usually indicated by the percentage of gas, by volume, in air. An atmosphere that contains less than the LELthe value of which varies among the combustible gasesis called a lean atmosphere. An atmosphere that exceeds the UELthe value of which also varies among the combustiblesis called a rich atmosphere. The range between the LEL and UEL is the combustible (explosive) range. Caution: Although a rich atmosphere might not present imminent danger of igniting at the time of the current measurement, there is still some danger. Any dilution of this rich atmosphere could bring the concentration of the gas down into the combustible range (between LEL and UEL).
Peak
Peak is the highest level of a gas recorded during a single monitoring session.
Peak STEL level STEL is calculated on a rolling 15-minute basis, after each additional minute. The peak STEL is the maximum or peak value of those rolling calculations. The peak 15-minute STEL appears on the instrument display and on printouts.
ppm The abbreviation ppm stands for parts per million. Toxic gases are measured in this unit.
STEL (short-term exposure limit) STEL is the average toxic-gas exposure level for any 15-minute interval during a work period. The gas monitor calculates the STEL by summing the measured values and then dividing this sum by the number of samples measured over a 15-minute period. (At one sample per second, the total would be 900.) After the first 15-minute exposure, the sum of measured values is updated each minute.
STEL alarm level The STEL alarm level indicates the maximum average concentration of a toxic gas to which an unprotected worker can be exposed over any STEL time interval during a work period.
155
TWA (time-weighted average) TWA (time-weighted average) is the average toxic-gas exposure level over an 8-hour period. The gas monitor calculates TWA by summing the measured values and then dividing this sum by the number of samples measured over an 8-hour period. (At one sample per second, the total would be 28,800.) The instrument then compares the TWA to the TWA alarm level.
TWA alarm level This is the maximum average concentration of a toxic gas to which an unprotected worker can be exposed over an 8-hour period.
Related topics
Setting up gas monitors Components of a gas data file Understanding air quality data and parameters
156
Working with gas data
Components of a gas data file
Gas data files have three components, shown as the three main levels in the file's Explorer pane:
• File SummaryDisplays information about all the tests stored in the data file. Reports are created based on all of the tests. In a gas data file, the file summary contains two tabs: Summary and Report. The Summary tab has three sub-tabs: General, Values, and Profile.
• TestsDisplays information about individual tests (Test 1, Test 2, and so on), which you select in the Explorer pane. Each test has its own collection of tabs: Summary (with General, Setup, Values, and Comments sub-tabs); History Chart; Alarms; and Report.
• CalibrationsDisplays an instrument's calibration history, which is downloaded into the file with other instrument data.
Related topics
File summaries for gas data Individual tests in gas data files Calibrations
157
File summaries for gas data
The file summary in a gas data file contains two tabs: Summary and Report.
The Summary tab
In a gas data file, the Summary tab for a file summary has three sub-tabs: General, Values, and Profile.
• Use the General sub-tab to view product information (instrument model, serial number, firmware version, and applet version) and test information (number of tests in the file, total number of periods, starting and ending times of the first and last tests in the file, and total run time).
• Use the Values sub-tab to view summaries of data for all the tests in the file. (Values are displayed for each sensor used.) Values include sensor type, high alarm, date and time at which the high alarm occurred, low/STEL alarm, date and time at which the alarm occurred, high and low ambient temperatures, and the dates and times at which these occurred. For descriptions of the values recorded, see Understanding gas detection data and parameters.
• Use the Profile sub-tab to view information about the tests. The subject name, company, and work area can be selected from drop-down list boxes, which list the contents of the User Profile database. A description and comments can also be added on this sub-tab. Typically, you'll enter this information when you retrieve data into a data file, but you can also enter it later.
The Report tab
From the Report tab of a gas file's file summary, you can set up two kinds of reports: Full and Summary.
Related topics
Understanding gas detection data and parameters Setting up gas monitors Components of a gas data file Individual tests in gas data files Calibrations
158
Individual tests in gas data files
The Tests section in a gas data file contains four tabs: Summary, History Chart, Alarms, and Report.
The Summary tab The Summary tab for a gas data file's Tests section has four sub-tabs: General, Setup, Values, and Comments.
• Use the General sub-tab to view information about the selected test (test number, total number of periods, starting and ending times, total run time, and logging interval).
• Use the Setup sub-tab to view the sensor type and the parameters (such as logging interval, alarm settings, and trigger levels) programmed into the monitor used to run the selected test.
• Use the Values sub-tab to view value summaries for the selected test. (For descriptions of the values recorded, see Understanding gas detection data and parameters.)
• Use the Comments sub-tab to view or type comments about the selected test. Typical comments describe the test conditions and what kind of testing was being done.
The History Chart tab
The History Chart tab shows the time-history data (gas exposure levels accumulated over time) for the selected test. Specifically, the chart shows each gas's high and low levels, LEL, STEL, and/or TWA (these vary depending on the sensor used). Temperatures are also shown.
The Alarms tab
The Alarms tab displays a list of alarms recorded during the selected test. For each alarm, the alarm number, sensor type, date and time, and reason are shown here.
The Report tab
From the Report tab of a gas data file's Tests section, you can set up two kinds of reports: Full and Summary.
Related topics
Understanding gas detection data and parameters Setting up gas monitors Components of a gas data file File summaries for gas data Calibrations
159
Calibrations
Gas data files show the calibration history for the sensors used to record each file's data. This calibration history is downloaded with the data.
Related topics
Overview of gas monitors Components of a gas data file
160
Using the Indoor Air Quality applet
Overview of indoor air quality monitors
The Indoor Air Quality applet in QuestSuite Professional supports the aq-5000, aq-5001, aq-5000 Pro, and aq-5001 Pro indoor air quality (IAQ) monitors. These monitors measure, display, and record data on up to six channels:
• Carbon dioxide (CO2) • Relative humidity (RH) • Temperature • Dew point (aq-5000/5001 Pro only) • Toxic gas • An analog input
Carbon dioxide levels are used as a surrogate indicator of ventilation system effectiveness. Excessive carbon dioxide levels can indicate an insufficient supply of fresh air or an occupancy level beyond a room's capacity. Temperature and relative humidity measurements help you evaluate occupant comfort, which can be a key contributor to productivity in the workplace and to comprehension rates in a learning environment. Oxygen and toxic gas measurements can identify conditions immediately dangerous to life and health. Air velocity, sound level, VOC (volatile organic compound) levels, dust levels, and light intensity are all additional examples of factors that can either be immediately dangerous to life and health or significantly influence the productivity and/or comprehension rates of those present. The carbon dioxide, relative humidity, and temperature inputs are built into the IAQ monitors. The aq-5000 Pro and aq-5001 Pro monitors also record the dew point. The toxic-gas input allows you to use optional Quest Technologies sensors to measure any of the following gases: oxygen, ammonia, carbon monoxide, chlorine, ethylene oxide, hydrogen cyanide, hydrogen sulfide, nitric oxide, nitrogen dioxide, and sulphur dioxide. The analog input enables you to attach your own linear input source and use it to monitor additional pollutants, such as dust, formaldehyde, or VOCs. On the aq-5000 Pro, you can use the analog input to attach the Quest Air Probe II air-velocity probe. All inputs selected for a given test are measured simultaneously, allowing information to be compared and correlated. Tip: For details about IAQ monitors, including the differences between the various models, see the Quest Technologies Web site. (In QuestSuite Professional's Navigation Bar, click Quest Online.)
Applications
Applications for the IAQ monitors include: • IAQ complaint investigation and mitigation • Air-exchange-rate measurement • HVAC system performance monitoring
161
• HVAC system balancing • Mold investigation and remediation
The Indoor Air Quality applet In addition to providing the usual charting and reporting functions, the Indoor Air Quality applet allows you to:
• Automatically determine the air exchange rate based on CO2 decay. • Append comments to monitoring results. • Program the monitor, retrieve data, and view real-time data remotely via modem.
Related topics
Setting up indoor air quality monitors Remotely controlling the indoor air quality monitors Understanding air quality data and parameters Components of an air quality data file
162
Setting up indoor air quality monitors
To set up the indoor air quality monitors, you select the Indoor Air Quality applet, and then select Set Up The Instrument. QuestSuite Professional supports the following IAQ monitors: the aq-5000 Pro and aq-5001 Pro, and the aq-5000 and aq-5001. They all use the same Setup dialog box, labeled Indoor Air Quality Setup. The Indoor Air Quality Setup dialog box has two tabs: General and Inputs.
The General tab
Use this tab to select instrument and memory modes, a temperature scale, and a few other general options.
• CO2 Full Scale RangeThis is the maximum range for the carbon-dioxide input readings. The 5,000-ppm scale provides greater accuracy than the 20,000-ppm scale. The 05,000 ppm range uses a resolution of 1 ppm. The linearization table used is in 50-ppm steps. The 020,000 ppm range uses a resolution of 1 ppm up to half scale and a resolution of 10 ppm up to full scale. The linearization table used is in 200-ppm steps.
• Instrument ModeSelect Data Logging or Survey mode. Data Logging modeThe IAQ monitor records time-history data on all active channels.
Depending on the storage period selected, the IAQ monitor stores the average or sample value on each channel for each storage period. The IAQ monitor also stores the minimum and maximum values with the date and time of occurrence for each channel for the entire test. This mode is useful for long-term data-logging with trend analysis.
Survey modeEvery time you press the Record key (or start recording remotely), the monitor records the instantaneous value on all active channels and then stops recording. Each survey is recorded as an individual test. This mode is useful for building walk-through surveys.
• Memory ModeWhen memory is full, the monitor either stops recording (Stop When Full) or begins to write over previously recorded data (Wrap Around).
• Secure CodePrograms the monitor with the code entered here. If Secure mode is enabled while the IAQ monitor is recording, all functions are locked out until Secure mode is disabled. If Secure mode is enabled while the monitor is not recording, users can turn the monitor on and off but cannot access other functions. Users enable and disable Secure mode by entering the 4-digit code on the IAQ monitor itself.
• Statistics DisplayApplies only when Data Logging mode is selected. The Brief option displays the average value for each channel for each test in memory, beginning with the present test. The Full option displays the minimum, average, and maximum values for each channel for the current test only.
• Storage PeriodApplies only when Data Logging mode is selected. This option determines how the IAQ monitor stores time-history data.
• SampleSamples once every period and saves the value detected on each active channel.
• AverageComputes and saves the average value on each active channel once every
163
period. (The sample rate is once every second.) Tip: If you want to be able to use the Air Exchange tool on the data file's history chart, you'll need to set up the instrument to record 1-minute samples or 1-minute averages.
• Enable BacklightWhen this option is enabled, the backlight of the monitor's display turns on for one minute any time an Up Arrow or Down Arrow button is pressed on the recorder. If this option is disabled, the backlight remains off. Battery life will be longer with the backlight disabled.
The Inputs tab
Use the Inputs tab to determine which inputs get recorded and how.
• Input Recording StatusDetermines which inputs will be recorded. The Toxic Gas channel requires using optional sensors for taking measurements. If you have not installed a toxic-gas sensor, leave this channel off.
• Analog InputDetermines whether or not an analog input (linear output sensor/analyzer) will be recorded. The analog input channel requires an optional input cable and a linear output sensor/analyzer for taking measurements. If you have not connected an analog input cable, leave this channel off.
• Air Probe II ConnectedThis option becomes available when the Analog Input box is checked. (You must be using the aq-5000 Pro monitor to use the Air Probe II.) When you check the Air Probe II Connected checkbox, the units, descriptor, and calibration points are set automatically. Check the Feet Per Minute checkbox if you want to use that measurement unit rather than the default of meters per second (m/s).
• DescriptorIf you're recording analog input: Type up to 4 characters to identify the type of sensor being used (for example, "gas").
• UnitsIf you're recording analog input: Type up to 4 characters to define the measurement units used by the sensor (for example, "ppm").
• Calibration PointsIf you're recording analog input: In the first text box, type the number of volts to be used for the first calibration point. In the second box, type the number of units to be used. Calibration points create a mapping of analog-input voltage to analog-input engineering units. (For example, 0 volts = 1ppm.) The values entered for Low and High calibration points must be different.
Related topics
Overview of indoor air quality monitors Remotely controlling the indoor air quality monitors Understanding air quality data and parameters Components of an air quality data file
164
Remotely controlling the indoor air quality monitors
The aq-5000, aq-5001, aq-5000 Pro, and aq-5001 Pro indoor air quality monitors can be controlled remotely. That is, you can access additional functions through QuestSuite Professional rather than having to perform them on the instrument itself. You can use the Remote Control function with either a local connection or a remote connection. With a local connection, the instrument is connected, by serial cable, directly to your computer. With a remote connection, the instrument (in a remote location) is connected to a phone line and communicates with your computer by modem. Tip: "Remotely controlling" the instruments means that you can control them and view their data from QuestSuite Professional rather than from their keypads and displays. For those instruments that have a Remote Control function, it gives you access to a couple more options, in addition to programming the instrument and retrieving data from it by using QuestSuite. A "remote connection" refers to communicating via modem and phone line with an instrument in another (non-local) location.
To remotely control an IAQ monitor: 1. Make sure that the instrument is on. If you're retrieving data from a local instrument, then
connect it by cable to the computer's serial port. If you're retrieving data from a remote instrument, connect with it by modem. (See Connecting with an instrument.)
2. Select the Indoor Air Quality applet.
3. Choose the Remotely Control The Instrument operation to open the monitor's Remote Control dialog box. Do any of the following:
Click the Start or Stop buttons to start or stop the instrument's logging. View the current date and time, the current test number, and the elapsed recording time. View the monitor's remaining memory (in percentage) and battery life (in volts). View the recording status to verify that the remote instrument is recording. The dialog box
also displays the storage period, memory mode, and instrument mode programmed into the monitor.
Click the Clear button to clear the instrument's data. (Data cannot be cleared while the instrument is logging.)
View the values of the inputs being recordedsuch as CO2, temperature, and RHall in real time.
4. When you're done using the Remote Control features, click Close to close the dialog box.
5. If you were using a local connection, you can unplug the instrument from your computer. If you were using a remote connection, then choose Setup>Hang Up to disconnect from the remote instrument.
Related topics
Connecting with an instrument
165

Disconnecting from a remote instrument Setting up indoor air quality monitors
166
Understanding air quality data and parameters
To set up the indoor air quality monitors and work with IAQ data, you'll need to understand the terms and concepts explained in Understanding gas detection data and parameters, and you'll need to understand the following:
• Air changes per hour • Air exchange rate • Air half life • CO2 decay • CO2 range • Correlation coefficient • Dew point • Mean air life • Relative humidity • Tracer gas • VOC (volatile organic compound)
Air changes per hour Air changes per hour is the number of times per hour that a room's complete air volume is removed or exhausted. This number is one of several factors that QuestSuite Professional uses to produce air exchange data.
Air exchange rate
Air exchange rate is the rate at which the total volume of air in a room is replaced with fresh outside air. Using carbon dioxide as a tracer gas, QuestSuite Professional calculates the air exchange rate. This information is useful for determining how effectively a ventilation system is moving carbon dioxide out of the area being analyzed. To produce air exchange data, QuestSuite Professional looks at the decay of carbon dioxide and calculates the correlation coefficient of the data, the air changes per hour, the air half life, and the mean air life. Note: Computing the air exchange rate requires that data be recorded for a Storage Period of either 1-minute sample or 1-minute average. If you create an air-exchange-rate report (within a chart), but data was recorded for a different Storage Period, the results might be misleading or incorrect.
Air half life
Air half life is the time it takes to reduce the carbon dioxide concentration in an area to half its initial value. This value is one of several factors that QuestSuite Professional uses to produce air exchange data.
CO2 decay
167
Determining the air exchange rate by using carbon dioxide involves tracking the concentrations of carbon dioxide over time. Carbon dioxide readings are noted at one-minute intervals. After allowing sufficient time for the ambient carbon dioxide levels to spike, the source of the carbon dioxide (either the room's occupants or a supply of compressed gas) is removed. The resultant decay in carbon dioxide levels over time is due to a combination of exhaust ventilation (intentional air exchange) and exfiltration (supplemental flow pathways). If you plot the logarithm of the decaying carbon dioxide concentrations as a function of time, it yields a straight line whose slope is the air exchange rate. See Tracer gas and Understanding correlation coefficients.
CO2 range
The CO2 range is the maximum range for the carbon-dioxide input readings. There are two scales: 5,000 ppm and 20,000 ppm. The 5,000-ppm scale provides greater accuracy than the 20,000-ppm scale.
Correlation coefficient The correlation coefficient is a quantitative measure of the strength of the relationship between your data and the theoretical mathematical model describing an ideal room exhaust. For a decay or exhaust study, the correlation coefficient will range from -1.00 to 0. See Understanding correlation coefficients.
Dew point The dew point is the temperature at which dew forms. The Dew Point parameter for the aq-5000/5001 Pro provides information (along with RH and temperature) about the thermal comfort of an environment being monitored. Generally, when the dew point approaches the air temperature, we become very uncomfortable.
Mean air life
Mean air life is the average time that a contaminant would remain in the room. The mean air life is a measure of the age of the air in the room. It is a quantitative value that can be used to compare rooms to see which ones are well ventilated and which ones are stuffy or poorly ventilated.
Relative humidity (RH) Relative humidity is the amount of water vapor in the air at a specific temperature as compared with the maximum amount of water vapor that the air can hold at that temperature. RH is expressed as a percentage.
Tracer gas
A tracer gas is a harmless gas that is released into a building so its concentration can be measured and charted (traced) over time. A tracer gas should be non-reactive, non-toxic, odorless, and colorless. Tracer gases can be measured in several ways, one of which is to release the gas and measure its rate of decay. QuestSuite Professional uses carbon dioxide as a tracer gas when calculating
168
the air exchange rate. To produce air exchange data, QuestSuite Professional analyzes the decay of carbon dioxide and calculates the correlation coefficient of the data, the air changes per hour, the air half life, and the mean air life. This information is used to determine how the air in a building circulates and at what rate fresh air is introduced.
VOC (volatile organic compound) You can use the analog channel of the IAQ monitors to attach VOC monitors. VOC (volatile organic compound) monitors use either of two techniques for monitoring VOCs: photoionization detection (PID) and flame ionization detection (FID). Photoionization is the process of ionization that occurs when a photon of sufficient energy is absorbed by a molecule that results in the formation of an ion plus an electron. Flame ionization is the process of ionization that occurs in organic compounds when the carbon-carbon bond is broken via a thermal process (in the flame) that results in the formation of carbon ions.
Related topics
Understanding correlation coefficients Setting up indoor air quality monitors Components of an air quality data file
169
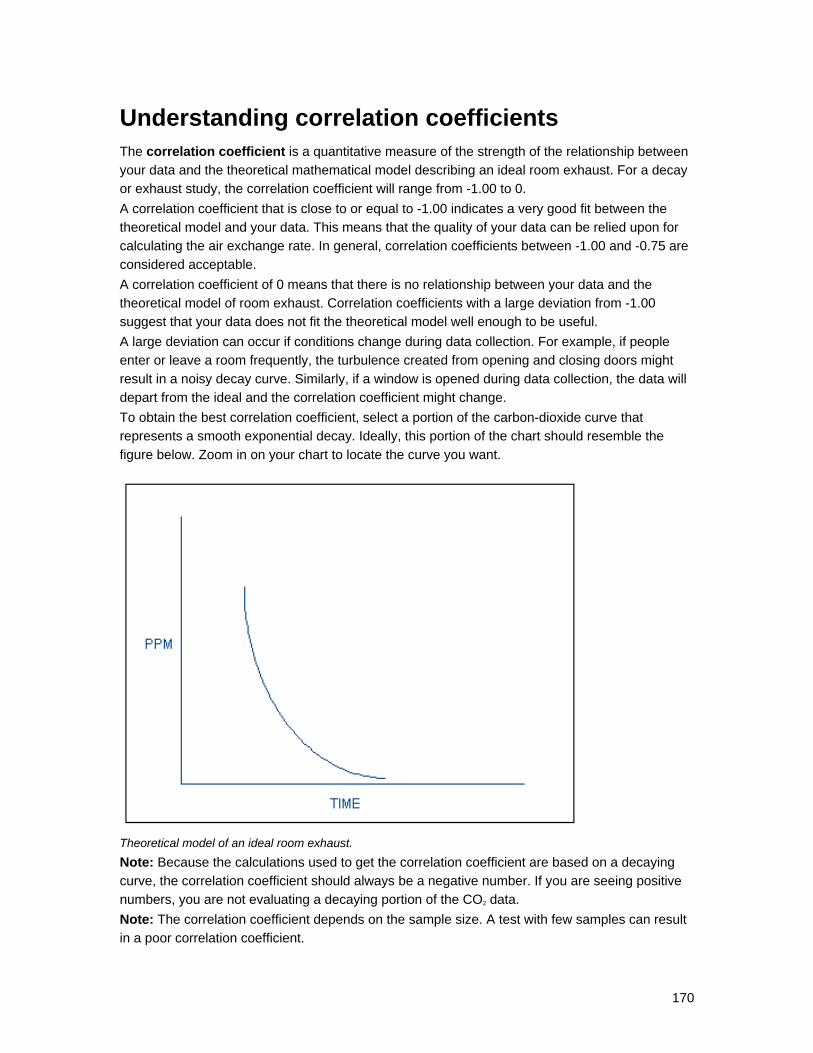
Understanding correlation coefficients
The correlation coefficient is a quantitative measure of the strength of the relationship between your data and the theoretical mathematical model describing an ideal room exhaust. For a decay or exhaust study, the correlation coefficient will range from -1.00 to 0. A correlation coefficient that is close to or equal to -1.00 indicates a very good fit between the theoretical model and your data. This means that the quality of your data can be relied upon for calculating the air exchange rate. In general, correlation coefficients between -1.00 and -0.75 are considered acceptable. A correlation coefficient of 0 means that there is no relationship between your data and the theoretical model of room exhaust. Correlation coefficients with a large deviation from -1.00 suggest that your data does not fit the theoretical model well enough to be useful. A large deviation can occur if conditions change during data collection. For example, if people enter or leave a room frequently, the turbulence created from opening and closing doors might result in a noisy decay curve. Similarly, if a window is opened during data collection, the data will depart from the ideal and the correlation coefficient might change. To obtain the best correlation coefficient, select a portion of the carbon-dioxide curve that represents a smooth exponential decay. Ideally, this portion of the chart should resemble the figure below. Zoom in on your chart to locate the curve you want.
Theoretical model of an ideal room exhaust. Note: Because the calculations used to get the correlation coefficient are based on a decaying curve, the correlation coefficient should always be a negative number. If you are seeing positive numbers, you are not evaluating a decaying portion of the CO2 data. Note: The correlation coefficient depends on the sample size. A test with few samples can result in a poor correlation coefficient.
170

See also
Understanding air quality data and parameters The chart tabs Using the Air Exchange charting tool
171
Working with air quality data
Components of an air quality data file
IAQ data files have two components, shown as the two main levels in the file's Explorer pane:
• File SummaryDisplays information about all the tests stored in the data file. Reports are created based on all of the tests. In an IAQ data file, the file summary contains three tabs: Summary, History Chart, and Report. The Summary tab has four sub-tabs: General, Setup, Values, and Profile.
• TestsDisplays information about individual tests (Test 1, Test 2, and so on), which you select in the Explorer pane. Each test has its own collection of tabs: Summary (with General, Setup, Values, and Comments sub-tabs); History Chart; and Report.
Related topics
File summaries for air quality data Individual tests in air quality data files
172
File summaries for air quality data
The file summary in an air quality data file contains three tabs: Summary, History Chart, and Report.
The Summary tab
In an air quality data file, the Summary tab for a file summary has four sub-tabs: General, Setup, Values, and Profile.
• Use the General sub-tab to view product information (instrument model, serial number, firmware version, and applet version) and test information (number of tests in the file, total number of periods, starting and ending times of the first and last tests in the file, and total run time).
• Use the Setup sub-tab to view parameters (such as inputs, instrument mode, and memory mode) programmed into the monitor used to run the tests recorded in the file.
• Use the Values sub-tab to view summaries of data for all the tests in the file. (Values are displayed for each input channel used.) Values include maximum level, date and time at which the maximum occurred, minimum level, date and time at which the minimum occurred, and the average level. For descriptions of the values recorded, see Understanding air quality data and parameters.
• Use the Profile sub-tab to view information about the tests. The subject name, company, and work area can be selected from drop-down list boxes, which list the contents of the User Profile database. A description and comments can also be added on this sub-tab. Typically, you'll enter this information when you retrieve data into a data file, but you can also enter it later.
The History Chart tab
The History Chart tab shows a summary of the time-history data (CO2, temperature, RH, and other data accumulated over time) for the file.
The Report tab
From the Report tab of an IAQ file's file summary, you can set up two kinds of reports: Full and Summary. You can also select temperature units. For a full report, you can select a test number (or all tests), a time range, and the inputs you want the report to include.
Related topics
Understanding air quality data and parameters Setting up indoor air quality monitors Components of an air quality data file Individual tests in air quality data files
173
Individual tests in air quality data files
The Tests section in an air quality data file contains three tabs: Summary, History Chart, and Report.
The Summary tab
In an air quality data file, the Summary tab for a selected test has four sub-tabs: General, Setup, Values, and Comments.
• Use the General sub-tab to view information about the selected test (test number, total number of periods, starting and ending times of the first and last tests in the file, total run time, and logging interval).
• Use the Setup sub-tab to view parameters (such as inputs, instrument mode, and memory mode) programmed into the monitor used to run the selected test.
• Use the Values sub-tab to view summaries of data for the selected test. (Values are displayed for each input channel used.) Values include maximum level, date and time at which the maximum occurred, minimum level, date and time at which the minimum occurred, and the average level. For tests recorded by the aq-5000 Pro or aq-5001 Pro, this sub-tab also shows the STEL, STEL date and time, and TWA. For descriptions of the values recorded, see Understanding air quality data and parameters.
• Use the Comments sub-tab to view or type comments about the selected test. Typical comments describe the test conditions and what kind of testing was being done.
The History Chart tab
The History Chart tab shows the time-history data (CO2, temperature, RH, and other data accumulated over time) for the selected test.
The Report tab
From the Report tab of an individual test in an IAQ file, you can set up two kinds of reports: Full and Summary. You can also select temperature units. For a full report, you can select a time range and select the inputs you want the report to include.
Related topics
Understanding air quality data and parameters Setting up indoor air quality monitors Components of an air quality data file File summaries for air quality data
174
Getting help
Using this Help system
If you're looking at this online Help, then you already know how to use the Help system! You can use the Contents tab, the Index tab, the Search tab, the Browse buttons, and hypertext links to jump to various topics in this Help system. This Help system covers only the QuestSuite Professional software. For information about Windows, consult your Windows documentation. For detailed information about Quest Technologies instruments, consult the printed guides that came with the instruments. You can also find information on the Quest Technologies Web site. If you have Internet access, you can get to that site by clicking Quest Online in the Navigation Bar in QuestSuite Professional, or by loading a browser program such as Internet Explorer and going to http://www.quest-technologies.com. To get context-sensitive Help:
1. Display the window or dialog box on which you want help. (If the dialog box contains a Help button, then a corresponding Help topic is available. Context-sensitive help is also available for each kind of data file.)
2. Choose the Help button, or press F1. The Help topic corresponding to that window or dialog box should be displayed.
To view definitions of terms:
• Many terms in this help system have pop-up descriptions available. These terms are identified by black underlined links, which you click to display a term's pop-up window. Click again to close the window. These same terms also have screen tipsshort definitions that you can display by keeping the mouse pointer hovering over the term for a few seconds.
• You can also view terms and definitions in the Glossary tab of the Help system. For more details, see each applet's "Understanding data and parameters" topics (such as "Understanding noise-level data and parameters").
To check the version of QuestSuite Professional that you're using:
1. From the Help menu, choose About QuestSuite Professional. (Or click the icon in the toolbar.) The About window is displayed.
2. To close the window, choose OK.
Related topics
Contacting Quest Technologies
175
Contacting Quest Technologies
If you're having problems with a Quest Technologies instrument or the QuestSuite Professional software, and you cannot solve them after checking the documentation, you can get help in a number of ways. For technical support:
• Check the Quest Technologies Web site. Go to http://www.quest-technologies.com, and click on Online Support. You'll find product manuals, FAQs (frequently asked questions), application news notes, and other helpful information.
• Call Quest Technologies Technical Support at 1.800.245.0779 (Monday–Friday, 8:00 am to 5:00 pm, CST).
• Email Quest Technologies Technical Support at [email protected].
For sales questions:
• Call 1.800.245.0779 (Monday–Friday, 8:00 am to 5:00 pm, CST).
• Email Customer Service at [email protected]. Note: Before you call Quest Technologies Technical Support, please have the following information ready:
• Version of the QuestSuite Professional software (check Help About).
• List of hardware on which this software is running: • Computer type and speed (such as Pentium 200MHz) • Operating system (such as Windows 2000 or XP) • Amount of memory on computer; expanded and extended memory, if any • Type and version of BIOS in your computer • Type of graphics adapter • Type of printer
• Complete description of the problem, including circumstances during which the problem occurs and the exact error message that is displayed (if any).
• The instrument's serial number and firmware version. Tip: Check the Quest Technologies Web site periodically for information about new product releases and promotions and for updated FAQs and application news notes.
Related topics
Using this Help system
176

Acclimatization A gradual physiological adaptation that improves an individual's ability to tolerate heat stress. Basically, the longer you do hard work in the heat, the better your body becomes at cooling itself off. You can become acclimated (or acclimatized) by gradually increasing your exposure to the hot environment or by gradually increasing your activity level in that environment. The ACGIH heat stress index has options for acclimated workers vs. unacclimated workers.
177

ACGIH The American Conference of Governmental Industrial Hygienists, a member-based organization and community of professionals that advances worker health and safety through education and through the development and dissemination of scientific and technical knowledge. The ACGIH provides annual editions of the TLVs (Threshold Limit Values) and BEIs (Biological Exposure Indices) publications and provides work-practice guides.
178
Air exchange rate Air exchange rate is the rate at which the total volume of air in a room is replaced with fresh outside air. Using carbon dioxide as a tracer gas, QuestSuite Professional calculates the air exchange rate. This information is useful for determining how effectively a ventilation system is moving carbon dioxide out of the area being analyzed. To produce air exchange data, QuestSuite Professional looks at the decay of carbon dioxide and calculates the correlation coefficient of the data, the air changes per hour, the air half life, and the mean air life. Note: Computing the air exchange rate requires that data be recorded for a Storage Period of either 1-minute sample or 1-minute average. If you create an air-exchange-rate report (within a chart), but data was recorded for a different Storage Period, the results might be misleading or incorrect.
179
CA The Q-400 and Q-500 dosimeters enable you to record C-weighted and A-weighted sound pressure levels simultaneously for the evaluation of hearing protection devices and other noise reduction devices. These dosimeters will also calculate the difference between the C-weighted and A-weighted values. Calculating C-A is effectively a way to measure the amount of lower-frequency noise. The two Weighting curves are different; C is more flat, while A simulates human hearing and therefore drops off (has a lower response) at lower frequencies. Therefore, when you subtract A from C, you get what is left (the lower-frequency noise content). In Quest Technologies sound-level meters, an optional second RMS detector can be used to provide a simultaneous C-Aweighted LEQ or LAvg for the measured sound. This detector is a separate circuit board that can be installed in the meter.
180

CNEL Community noise exposure levelthe average sound pressure for a 24-hour study, with additional factors for time of day. Sound pressures recorded between 7 PM and 10 PM are increased by 5dB before being averaged. Also, as with the LDN, sound pressures recorded between 10 PM and 7 AM are increased by 10dB before being averaged. (A 3dB exchange rate is assumed.)
181
Criterion level The constant decibel level that, if applied for 8 hours, would produce 100% of the accumulated noise dose allowed by law. For example, OSHA mandates the criterion level to be 90dB for 8 hours. For an 8-hour sample, an average level (LAvg) of 90dB will result in 100% dose. The criterion level is typically set by a regulating agency such as OSHA and is usually not applicable for community noise monitoring.
182

Dew point The temperature at which dew forms. The Dew Point parameter for the aq-5000/5001 Pro provides information (along with RH and temperature) about the thermal comfort of an environment being monitored. Generally, when the dew point approaches the air temperature, we become very uncomfortable.
183
Dose A percentage of the maximum allowable daily noise exposure. A dose reading of 100% is the maximum allowable exposure to accumulated noise. The dosimeter calculates the dose based on the following variables: criterion level, threshold, and exchange rate. When you're taking noise samples for less than the full workday, you can calculate a full day's dose by using this formula (assuming that the sampled noise continues at the same level for the full workday):
(# workday hours / # sample hours) * % dose = full workday dose For example, if a 0.5-hour sample results in 9% dose and the workday is 7.5 hours long, then the dose for the full workday can be computed as follows:
(7.5 hours / 0.5 hours) * 9% = 135% dose .
184

EPRI The Electric Power Research Institute, founded in 1973 as a non-profit energy research consortium. EPRI manages a program of scientific research, technology development, and product implementation. (For more information, see www.epri.com.)
185
Exchange rate The number of decibels that a sound must change in order to either halve or double the rate of dose accumulation. The exchange rate is also called the doubling rate. Regulatory limits on unprotected exposure are commonly stated in terms of the maximum permissible exposure time (criterion length) at a specific sound level (criterion level). For example, OSHA specifies a maximum exposure time of 8 hours at 90dBA (A-weighted decibels). Because OSHA's exchange rate is 5dB, for every 5 decibels the noise exposure increases, the permissible exposure time is cut in half, and for every 5 decibels the noise exposure decreases, the permissible exposure time is doubled. Thus, a worker could be exposed to a noise level of 95dB for only 4 hours. The exchange rate affects the integrated readings of LAvg, dose, and TWA but does not affect the instantaneous sound level.
186
Heat Index The Heat Index (HI) is determined using the dry bulb temperature and relative humidity. Based on charts from the U.S. National Weather Service, the Heat Index represents how an average person feels relative to climate conditions. For a given temperature, the higher the humidity, the higher the Heat Index. The Heat Index is defined over a temperature range of 70°F to 120°F (21°C to 49°C) and a relative humidity range of 30% to 99%. Outside this range, dashes will appear in the instrument's HI display.
187

Heat stress Heat stress is the net heat load to which a worker might be exposed from the combined contributions of the metabolic cost of work, environmental factors, and clothing requirements. Environmental factors include air temperature, humidity, air movement, and radiant heat exchange. Personal factors are the worker's activity level and clothing type. Heat strain is the overall physiological response resulting from heat stress.
188

Humidex The Humidex, used primarily in Canada, works on the same concept as the Heat Index, but the values are slightly different. The Humidex is defined over a temperature range of 70°F to 109°F (21°C to 43°C) and a relative humidity range of 20% to 99%. Outside this range, dashes will appear in the instrument's Humidex display.
189
Integrating sound level meter A meter that accumulates the total sound energy over a measurement period and calculates an average. Also called an "integrating-averaging sound level meter."
190

ISO The International Organization for Standardization. ISO is a worldwide federation of national standards bodies from more than 140 countries. ISO is a non-governmental organization established in 1947. ISO's work results in international agreements that are published as International Standards. (See www.iso.org.)
191

LAvg The average sound level (in dB) computed for a chosen time duration, based on a 4, 5, or 6dB exchange rate. LAvg with a 3dB exchange rate is referred to as LEQ (equivalent sound level). All sound levels at or above the threshold level are averaged into the calculations relating to noise exposure. LAvg is typically calculated with no threshold, with a threshold of 80dB, and with a threshold of 90dB.
192

LDN Day/night levelthe average sound pressure recorded during a 24-hour calendar day. Before the average is calculated by the instrument, a 10-decibel penalty for nighttime noise events is automatically added to data recorded between 10 PM and 7 AM.
193

LEL Lower explosive limitthe lowest concentration of a combustible gas that will burn or explode upon contact with a source of ignition. Below the LEL, the mixture won't burn because there is insufficient fuel. LEL is specified as a percentage of gas by volume in air.
194

LEQ The equivalent continuous sound levelthe average sound level for the measurement period based on a 3dB exchange rate. The term LEQ is functionally the same as LAvg except that LEQ is used only when the exchange rate is set to 3dB and the threshold is set to None.
195

LMax The maximum levelthe highest sound level recorded during a measurement interval with a particular response setting (Slow or Fast) and weighting (A or C). LMax is the highest value that is included in LAvg or dose calculations. Under OSHA regulations, unprotected workers may not be exposed to maximum sound levels greater than 115dB, measured with a Slow response rate.
196

LN Exceedance levelthe sound pressure level that is exceeded for a given percentage (N) of run time.
197

LPeak In the Noise and Sound applets, the peak level is the highest instantaneous sound pressure level recorded during a measurement interval. Unlike the maximum level, the peak is detected independently of dosimeter settings for response rate or weighting. Under OSHA regulations, unprotected workers may not be exposed to peak sound levels greater than 140dB.
198
Measuring range The range of noise levels that will be recorded by a noise dosimeter or sound level meter. Typically, for a noise dosimeter, you'll use a range of 40 to 110dB with both Dosimeter 1 and Dosimeter 2 set to either A or C weighting. If one dosimeter is set to A weighting, and the other is set to C weighting, the measurement range is 70 to 140dB. Different ranges are used for different applications, such as community noise measurements or industrial/commercial noise measurements. Sound level meters use a different set of ranges.
199

Metabolic rate The rate of heat production by the body when engaged in various tasks. Metabolic rate, expressed in met units, is often defined in terms of the resting metabolism.
200
MRT Mean radiant temperaturethe uniform surface temperature of an imaginary black enclosure with which an occupant would exchange the same amount of radiant heat as in an actual nonuniform environment. MRT is an approximate indication of the effect that the surface temperatures of surrounding objects have on human comfort. Radiant heat transfer is the transfer of heat energy from a location of higher temperature to a location of lower temperature by means of electromagnetic radiation (rather than by conduction or convection). A worker whose body temperature is greater than the temperature of the surrounding surfaces radiates heat to these surfaces. Conversely, hot surfaces and infrared light sources radiate heat that can increase the body's heat load.
201

MSHA Mine Safety & Health Administration, part of the U.S. Department of Labor.
202
MTA Moving time averagea sliding window of time over which an average level of heart rate is calculated. In the history charts of some heat stress data files, you'll see "MTA" followed by numbers, such as MTA-30. The number is the number of minutes over which the average is calculated. For MTA-30, there would be no MTA calculated during the first 30 minutes. After the first 30 minutes, an MTA would be calculated. Then a new 30-minute MTA would be calculated for each subsequent half-hour. So, the first MTA would be for minutes 1 through 30, the second MTA would be for minutes 31 through 60, and so on.
203

Navy PHEL The U.S. Navy has a heat stress prevention program that identifies safe physiological heat exposure limits (PHELs) for people exposed to environments with high heat or humidity. The Navy PHEL chart provides standards for stay times.
204

OSHA Occupational Safety & Health Administration, part of the U.S. Department of Labor.
205

Pa2H Pascal-squared hoursa measure of sound exposure accumulated during the measurement period, given in Pa²H rather than as a percentage of dose. Pa²H is defined as the time integral of the squared instantaneous A-weighted sound pressure over a specific duration; for example, the duration of a working day. One Pa²H is typically the maximum allowable exposure.
206
PMV and PPD PMV is the predicted mean vote (on a seven-point, cold-to-hot sensation scale) for a large population of people exposed to a certain environment. This vote predicts the average comfort level that people will select on this seven-point scale. PPD is the predicted percentage of dissatisfied (uncomfortable) people at each PMV value. The PMV scale ranges from -3 (too cold) to +3 (too hot), where zero represents "just right." Because of individual differences, it is impossible to specify a thermal environment that will satisfy everyone. Therefore, PPD never goes below 5%. PMV tables available for different environments and for given clothing and metabolic rates. These tables can be found in ISO standard 7730.
207

ppm Parts per million. Toxic gases are measured in this unit.
208

Projected dose A computed estimation (as a percentage) of what the dose would be for a work shift. Such estimations are useful in preliminary work-place surveys. For example, suppose that a worker's exposure is monitored for 1 hour, and a dose of 40% is obtained. If you assume an 8-hour shift, during which the noise exposure stays the same, the dosimeter will compute an estimated 8-hour projected dose of 320%.
209

Projected time The estimated length of the work shift for which noise exposure is being measured. Projected time (typically 8 hours) is used in the calculations for projected dose and projected TWA.
210

Projected TWA The projected TWAabbreviated as TWA (Prt) and expressed in decibelsis a calculation used to determine the TWA when you want to use a measurement time that is different from the worker's exposure time. Note: A short-term sample can be used only if the average noise level in the work area is relatively constant throughout a work shift.
211
Response level Also called the response rate or the time constant. Instruments used to measure sound levels have selectable response time constants, which were originally established to describe the dynamic response characteristics of analog sound level meters. (Typically, noise is not constant. Using a response of Slow or Fast simply smoothes the noise fluctuation and makes the sound level easier to work with.) The response rate determines how quickly the unit responds to fluctuating noise. The time constants are:
• Slow1 second (1,000 milliseconds, or msec) • Fast0.125 second (125 milliseconds) • Peak50 microseconds • Impulse35 millisecond rise with a decay time of 1.5 seconds
Typical occupational and environmental noise regulations require a Slow response rate. The Impulse response rate, with its fast rising time and slow falling time, represents the loudness of a short-duration sound, and is therefore used to determine annoyance rather than risk of hearing damage. The Peak response rate measures the actual peak sound pressure level of a short-duration sound and is used to determine the risk of hearing damage.
212

RH Relative humiditythe amount of water vapor in the air at a specific temperature as compared with the maximum amount of water vapor that the air can hold at that temperature. RH is expressed as a percentage.
213

SEL Sound exposure levelthe constant sound level that, if lasting for one second, would deliver the same amount of acoustical energy as that delivered over the entire measurement period. SEL is typically measured using a 3dB exchange rate without a threshold. (SEL is not used by OSHA.)
214

SLM Sound level meter.
215

Stay time The length of time a worker should be able to work safely under particular heat stress conditions.
216

STEL Short-term exposure limitThe average toxic-gas exposure level for any 15-minute interval during a work period. The gas monitor calculates the STEL by summing the measured values and then dividing this sum by the number of samples measured over a 15-minute period. (At one sample per second, the total would be 900.) After the first 15-minute exposure, the sum of measured values is updated each minute.
217

TAKM The TAKM Sound Setup option displays the time integration of individual Taktmaximal values. Taktmaximal is the maximum level (LMax) encountered over a 3-second or 5-second period (you select the interval on the Display tab). Taktmaximal measurements are required by some countries' noise regulations. A Taktmaximal measurement calculates a higher average level for highly impulsive sounds than does a LEQ measurement.
218
Threshold level The threshold levelalso called the cutoff levelis a decibel level below which sound is not accumulated or averaged into LAvg, LEQ, or dose calculations. (The threshold affects the LAvg, TWA, and dose measurements.) All sound below the threshold is considered non-existing noise for the averaging and integrating functions. The threshold does not affect measurements in the sound level mode. OSHA uses two thresholds. The original Occupational Noise Exposure Standard (1971) uses a 90dB threshold and calls for engineering controls to reduce the noise levels if the 8-hour TWA is greater than 90dB. The Hearing Conservation Amendment (1983) uses an 80dB threshold and calls for a hearing conservation program to be put in place if the 8-hour TWA exceeds 85dB (50% dose). The Hearing Conservation Amendment is the more stringent of the two rulings and is what most US industrial users are concerned with. For example, with an 80dB threshold, suppose that you placed a 79dB calibrator on the dosimeter for a period of time. Because all of the noise is below the threshold, there will be no average (you can think of it as an average of 0dB). If the calibrator were 80dB instead, then the average would be 80dB. On histogram printouts, typically 1-minute (or other specified increment) averages are printed. Because real noise fluctuates, it is quite possible to have an average level below the threshold. This also applies for the overall LAvg.
219
TWA Time-weighted average. In the Noise and Sound appletsTWA is the sound level (in dB) that is accumulated for any time period but with its average level computed over an 8-hour period. TWA is usually measured with A-weighting, Slow response, and a 5dB exchange rate. In the Gas Detection and Indoor Air Quality appletsTWA is the average toxic-gas exposure level over an 8-hour period. The instrument calculates TWA by summing the measured values and then dividing this sum by the number of samples measured over an 8-hour period. The instrument then compares the TWA to the TWA alarm level.
220

UEL Upper explosive limitthe highest concentration of a combustible gas that will burn or explode upon contact with a source of ignition. Above the UEL, the mixture won't burn because there is insufficient oxygen. UEL is specified as a percentage of gas by volume in air.
221

Upper Limit The Upper Limit sets the decibel level for the UL Time function. If the Upper Limit is set to 115dB, for example, then UL Time is the amount of time that the sound level was measured at or above 115dB.
222
WBGT Wet Bulb Globe Temperature. A value computed from the three parametersdry bulb temperature (DB), natural wet bulb temperature (WB), and globe temperature (G)measured by area heat stress monitors. Described in ISO 7243:1989, the WBGT Index provides a single value that enables you to evaluate the level of heat stress caused by an environment. The WBGT Index provides work/rest regimens based on the WBGT and the metabolic rate of the worker. The QT-36 area heat stress monitor calculates the WBGT and displays work/rest regimens for each of the four metabolic work categories. You can also use QuestSuite Professional to get this information from the data recorded by all three of the area heat stress monitors. There are two WBGT indices: Indoor and Outdoor. They are calculated using these formulas:
WBGT Indoor = 0.7WB + 0.3G WBGT Outdoor = 0.7WB + 0.2G + 0.1DB
223
Weighted WBGT average (Also referred to as the ISO Average in QuestSuite Professional.) When the space surrounding a worker does not have a constant temperature, you need to determine the WBGT index at three heightscorresponding to the worker's ankles, abdomen, and headand then calculate a weighted average of those three WBGT measurements. The average is computed with this formula, which is specified in ISO 7243: 1989:
WBGTweighted = (WBGThead + (2 x WBGTabdomen) + WBGTankles) / 4 The QT area monitors assign the top sensor bar (Sensor #1) the double weighting. This calculation is shown if a WBGT display has been selected as a Setup option and if three sensor bars are connected to the instrument.
224
Weighting The filtering of sound before averaging. A, B, C, and Linear are the standard weighting networks (circuits) available in noise dosimeters and sound-level meters. These frequency filters cover the frequency range of human hearing. A weighting is the most commonly used filter in both industrial noise applications and community noise regulations. A-weighted measurements are written as dBA or dB(A). The A-weighted filter attempts to make the dosimeter respond the way the human ear hears. This filter attenuates the frequency below several hundred hertz as well as the high frequencies (about 6,000 hertz). B weighting is similar to A but with less attenuation. The B weighting is very seldom, if ever, used. Quest Technologies instruments typically provide A-weighted and C-weighted measurements. C weighting provides a fairly flat frequency response with only slight attenuation of the very high and low frequencies. C weighting is intended to represent how the ear perceives sound at high decibel levels. C weighting is often used as a flat response when Linear weighting is not available. C-weighted measurements are written as dBC or dB(C). Linear weighting has a flat frequency response curve over the entire measurement frequency range. Linear weighting is most commonly found on upper-model sound-level meters and is typically used for performing audiometric analysis and octave band filter analysis. Linear weighting is being replaced by Z weighting, which is defined as flat from 20 Hz to 20 KHz.
225
Glossary acclimatization
A gradual physiological adaptation that improves an individual's ability to tolerate heat stress. Basically, the longer you do hard work in the heat, the better your body becomes at cooling itself off. You can become acclimated (or acclimatized) by gradually increasing your exposure to the hot environment or by gradually increasing your activity level in that environment. The ACGIH heat stress index has options for acclimated workers vs. unacclimated workers.
ACGIH American Conference of Governmental Industrial Hygienists, a member-based organization and community of professionals that advances worker health and safety through education and through the development and dissemination of scientific and technical knowledge. The ACGIH provides annual editions of the TLVs (Threshold Limit Values) and BEIs (Biological Exposure Indices) publications and provides work-practice guides.
air changes per hour The number of times per hour that a room's complete air volume is removed or exhausted. This number is one of several factors that QuestSuite Professional uses to produce air exchange data.
air exchange rate The rate at which the total volume of air in a room is replaced with fresh outside air.
air half life The time it takes to reduce the carbon dioxide concentration in an area to half its initial value. This value is one of several factors that QuestSuite Professional uses to produce air exchange data.
ASHRAE American Society of Heating, Refrigerating and Air-Conditioning Engineers, Inc. ASHRAE Standard 55-1992 -- Thermal Environmental Conditions for Human Occupancy -- specifies conditions or comfort zones for which 80% of sedentary or slightly active persons find the environment thermally acceptable. (For more information, see www.ashrae.org.)
BEIs Biological Exposure Indices. (See ACGIH.)
clo Clothing insulation unit. A unit used to express the amount of thermal insulation provided by clothing.
CNEL Community noise exposure level. The average sound pressure for a 24-hour study, with additional factors for time of day. Sound pressures recorded between 7 PM and 10 PM are increased by 5dB before being averaged. Sound pressures recorded between 10 PM and 7 AM are increased by 10dB before being averaged. (A 3dB exchange rate is assumed.)
CO2 Carbon dioxide.
226
CO2 decay Determining the air exchange rate by using carbon dioxide involves tracking the concentrations of carbon dioxide over time. Carbon dioxide readings are noted at one-minute intervals. After allowing sufficient time for the ambient carbon dioxide levels to spike, the source of the carbon dioxide (either the room's occupants or a supply of compressed gas) is removed. The resultant decay in carbon dioxide levels over time is due to a combination of exhaust ventilation (intentional air exchange) and exfiltration (supplemental flow pathways). If you plot the logarithm of the decaying carbon dioxide concentrations as a function of time, it yields a straight line whose slope is the air exchange rate.
CO2 range (Used in the Indoor Air Quality applet.) The maximum range for the carbon-dioxide input readings. There are two scales: 5,000 ppm and 20,000 ppm. The 5,000-ppm scale provides greater accuracy than the 20,000-ppm scale.
combustible range The concentration range between the LEL and UEL for a combustible gas; this is the range in which a fuel can ignite and sustain a fire. The combustible range increases with increasing temperatures and in oxygen-rich atmospheres.
correlation coefficient A quantitative measure of the strength of the relationship between your data and the theoretical mathematical model describing an ideal room exhaust. For a decay or exhaust study, the correlation coefficient will range from -1.00 to 0. (See the Help topic "Understanding correlation coefficients.")
COu Unfiltered carbon monoxide.
criterion level The constant decibel level that, if applied for 8 hours, would produce 100% of the accumulated noise dose allowed by law.
DB Dry bulb temperature (the ambient air temperature). One of three temperature readings measured by area heat stress monitors. (See WBGT.)
dB (decibel) The unit of sound pressure used to measure noise. (The unit, one tenth of a Bell, is named after Alexander Graham Bell.) Decibels are computed logarithmically. An increase of 10dB is perceived by human ears as a doubling of the noise level.
dew point The temperature at which dew forms. The Dew Point parameter for the aq-5000/5001 Pro provides information (along with RH and temperature) about the thermal comfort of an environment being monitored. Generally, when the dew point approaches the air temperature, we become very uncomfortable.
dose A percentage of the maximum allowable daily noise exposure.
EPRI The Electric Power Research Institute. Founded in 1973 as a non-profit energy research consortium. EPRI manages a program of scientific research, technology development, and product implementation. (For more information, see www.epri.com.)
227
exchange rate The number of decibels that a sound must change in order to either halve or double the rate of dose accumulation.
G (or GT) Globe temperature. Indicates the radiant heat exposure to an individual due to either direct light or hot objects in the environment). One of three temperature readings measured by area heat stress monitors. (See WBGT.)
Heat Index The Heat Index (HI) is determined using the dry bulb temperature and relative humidity. Based on charts from the U.S. National Weather Service, the Heat Index represents how an average person feels relative to climate conditions. For a given temperature, the higher the humidity, the higher the Heat Index. (For details, see the Help topic "Understanding heat stress data and parameters.")
heat strain The overall physiological response resulting from heat stress.
heat stress The net heat load to which a worker might be exposed from the combined contributions of the metabolic cost of work, environmental factors, and clothing requirements. Environmental factors include air temperature, humidity, air movement, and radiant heat exchange. Personal factors are the worker's activity level and clothing type.
Humidex The Humidex, used primarily in Canada, works on the same concept as the Heat Index, but the values are slightly different. (For details, see the Help topic "Understanding heat stress data and parameters.")
HVAC Heating, ventilation, and air conditioning. Refers to a building's systems for regulating air temperature and keeping the air fresh.
IAQ Indoor air quality.
integrating sound level meter A meter that accumulates the total sound energy (sound pressure level) over a set measurement period and calculates an average. Also called an "integrating-averaging sound level meter."
ISO The International Organization for Standardization. ISO is a worldwide federation of national standards bodies from more than 140 countries. ISO is a non-governmental organization established in 1947. ISO's work results in international agreements which are published as International Standards. (See www.iso.org.)
LAvg The average sound level (in dB) computed for a chosen time duration, based on a 4, 5, or 6dB exchange rate.
LDN Day/night level. The average sound pressure recorded during a 24-hour calendar day. Before the average is calculated by the instrument, a 10dB penalty for nighttime noise events is automatically added to data recorded between 10 PM and 7 AM.
LEL
228
Lower explosive limit. The lowest concentration of a combustible gas that will burn or explode upon contact with a source of ignition. Below the LEL, the mixture won't burn because there is insufficient fuel. LEL is specified as a percentage of gas by volume in air.
LEQ Equivalent continuous sound level. The average sound level for the measurement period based on a 3dB exchange rate.
LMax Maximum level. The highest sound level recorded during a measurement interval with a particular response setting (Slow or Fast) and weighting (A or C).
LN Exceedance level. The sound pressure level that is exceeded for a given percentage (N) of run time.
LPeak Peak level. In the Noise and Sound applets, the peak level is the highest instantaneous sound pressure level recorded during a measurement interval.
mean air life The average time that a contaminant would remain in the room being monitored for air quality. The mean air life is a measure of the age of the air in the room. It is a quantitative value that can be used to compare rooms to see which ones are well ventilated and which are stuffy or poorly ventilated.
measuring range The range of noise levels that will be recorded by a noise dosimeter or sound level meter.
metabolic rate The rate of heat production by the body when engaged in various tasks. Metabolic rate, expressed in met units, is often defined in terms of the resting metabolism.
MRT Mean radiant temperature. The uniform surface temperature of an imaginary black enclosure with which an occupant would exchange the same amount of radiant heat as in an actual nonuniform environment. MRT is an approximate indication of the effect that the surface temperatures of surrounding objects have on human comfort. (See "radiant heat transfer.")
MSHA Mine Safety & Health Administration, part of the U.S. Department of Labor.
MTA Moving time average. A sliding window of time over which an average level of heart rate is calculated. In the history charts of some heat stress data files, you'll see "MTA" followed by numbers, such as MTA-30. The number is the number of minutes over which the average is calculated. For MTA-30, there would be no MTA calculated during the first 30 minutes. After the first 30 minutes, an MTA would be calculated. Then a new 30-minute MTA would be calculated for each subsequent half-hour. So, the first MTA would be for minutes 1 through 30, the second MTA would be for minutes 31 through 60, and so on.
NIST National Institute of Standards and Technology, a non-regulatory federal agency within the U.S. Commerce Department's Technology Administration. NIST's mission is to
229
develop and promote measurements, standards, and technology to enhance productivity, facilitate trade, and improve the quality of life. For more information, see www.nist.gov on the Web.
OSHA Occupational Safety & Health Administration, part of the U.S. Department of Labor.
overload Condition in which the input for a noise dosimeter or sound level meter is too high for the current measurement range. When this happens, you need to change the measuring range.
Pa2H Pascal-squared hours. A measure of sound exposure accumulated during the measurement period.
Peak In the Gas Detection applet, peak is the highest level of a gas recorded during a single monitoring session. In the Noise and Sound applets, peak is the highest instantaneous sound pressure level recorded during a measurement interval.
PHEL Physiological heat exposure limits. The U.S. Navy has a heat stress prevention program that identifies safe PHELs for people exposed to environments with high heat or humidity. The Navy PHEL chart provides standards for stay times.
PMV Predicted mean vote (on a seven-point, cold-to-hot sensation scale) for a large population of people exposed to a certain environment. This vote predicts the average comfort level that people will select on this seven-point scale.
PPD Predicted percentage of dissatisfied (uncomfortable) people at each value on the PMV scale. (See the Help topic "Understanding heat stress data and parameters.")
ppm Parts per million. Toxic gases are measured in this unit.
printout interval The number of minutes of recorded data that are combined into one data point on a printout.
projected dose A computed estimation (as a percentage) of what the dose would be for a work shift. Such estimations are useful in preliminary work-place surveys.
projected time The estimated length of the work shift for which noise exposure is being measured. Projected time (typically 8 hours) is used in the calculations for projected dose and projected TWA.
projected TWA A calculation used to determine the TWA when you want to use a measurement time that is different from the worker's exposure time. Abbreviated as TWA (Prt) and expressed in decibels.
radiant heat transfer The transfer of heat energy from a location of higher temperature to a location of lower temperature by means of electromagnetic radiation. A worker whose body temperature is
230
greater than the temperature of the surrounding surfaces radiates heat to these surfaces. Conversely, hot surfaces and infrared light sources radiate heat that can increase the body's heat load.
response level Also called the "response rate" or the "time constant." The response rate determines how quickly the noise dosimeter or sound level meter responds to fluctuating noise.
RH Relative humidity. The amount of water vapor in the air at a specific temperature as compared with the maximum amount of water vapor that the air can hold at that temperature. RH is expressed as a percentage.
RMS Root mean square. The RMS value is a special kind of mathematical average. The RMS voltage of a signal is computed by squaring the instantaneous voltage, integrating over the desired time, and taking the square root.
RTHM Run time in hours and minutes (Sound applet).
RTMS Run time in minutes and seconds (Sound applet).
sample A unit or chunk of data recorded during a given time interval (such as a 1-minute logging interval).
SEL Sound exposure level. The constant sound level that, if lasting for one second, would deliver the same amount of acoustical energy as that delivered over the entire measurement period. SEL is typically measured using a 3dB exchange rate without a threshold.
SLM Sound level meter.
SPL Sound pressure level. The basic measure of noise loudness, expressed in decibels.
stay time The length of time a worker should be able to work safely under particular heat stress conditions.
STEL Short-term exposure limit. The average toxic-gas exposure level for any 15-minute interval during a work period. Gas monitors calculate the STEL by summing the measured values and then dividing this sum by the number of samples measured over a 15-minute period.
strain index A method of showing the progression of physiological strain, with 0.00 being resting conditions and 1.00 being the action alert. The QT-III personal heat stress monitor calculates and displays separate strain indices for heart rate and body temperature.
TAKM A Sound Setup option that displays the time integration of individual Taktmaximal values. Taktmaximal is the maximum level (LMax) encountered over a 3-second or 5-second period (you select the interval).
231
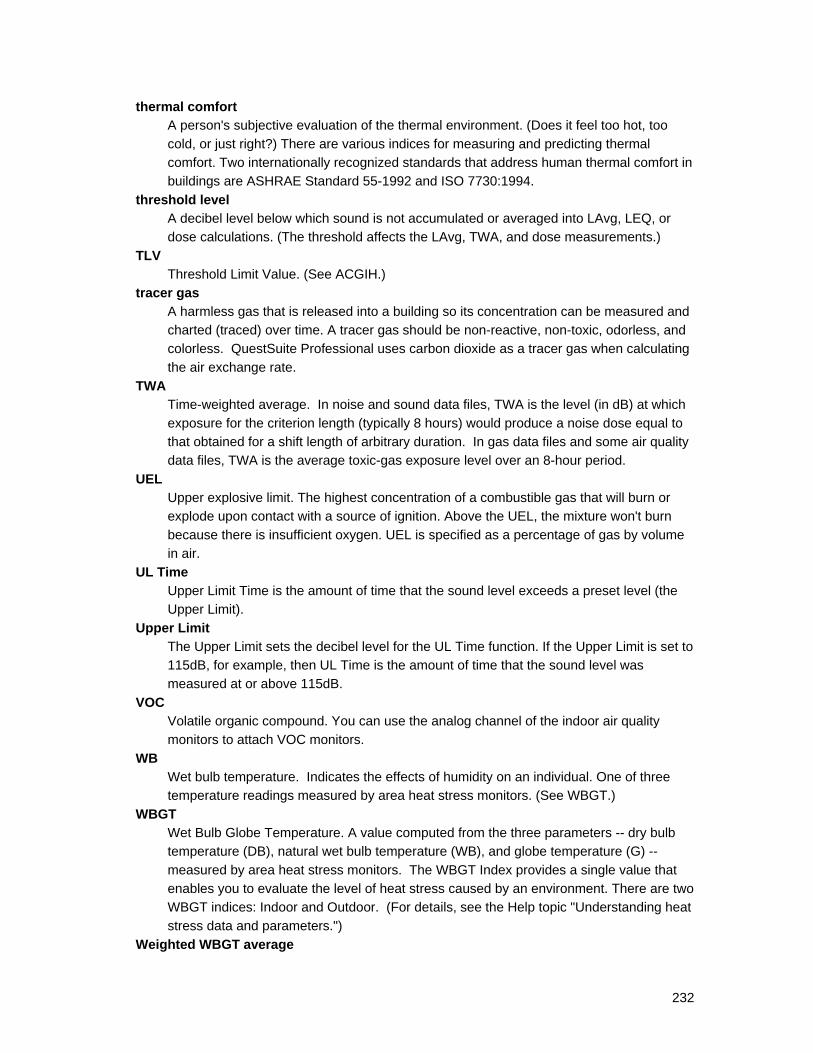
thermal comfort A person's subjective evaluation of the thermal environment. (Does it feel too hot, too cold, or just right?) There are various indices for measuring and predicting thermal comfort. Two internationally recognized standards that address human thermal comfort in buildings are ASHRAE Standard 55-1992 and ISO 7730:1994.
threshold level A decibel level below which sound is not accumulated or averaged into LAvg, LEQ, or dose calculations. (The threshold affects the LAvg, TWA, and dose measurements.)
TLV Threshold Limit Value. (See ACGIH.)
tracer gas A harmless gas that is released into a building so its concentration can be measured and charted (traced) over time. A tracer gas should be non-reactive, non-toxic, odorless, and colorless. QuestSuite Professional uses carbon dioxide as a tracer gas when calculating the air exchange rate.
TWA Time-weighted average. In noise and sound data files, TWA is the level (in dB) at which exposure for the criterion length (typically 8 hours) would produce a noise dose equal to that obtained for a shift length of arbitrary duration. In gas data files and some air quality data files, TWA is the average toxic-gas exposure level over an 8-hour period.
UEL Upper explosive limit. The highest concentration of a combustible gas that will burn or explode upon contact with a source of ignition. Above the UEL, the mixture won't burn because there is insufficient oxygen. UEL is specified as a percentage of gas by volume in air.
UL Time Upper Limit Time is the amount of time that the sound level exceeds a preset level (the Upper Limit).
Upper Limit The Upper Limit sets the decibel level for the UL Time function. If the Upper Limit is set to 115dB, for example, then UL Time is the amount of time that the sound level was measured at or above 115dB.
VOC Volatile organic compound. You can use the analog channel of the indoor air quality monitors to attach VOC monitors.
WB Wet bulb temperature. Indicates the effects of humidity on an individual. One of three temperature readings measured by area heat stress monitors. (See WBGT.)
WBGT Wet Bulb Globe Temperature. A value computed from the three parameters -- dry bulb temperature (DB), natural wet bulb temperature (WB), and globe temperature (G) -- measured by area heat stress monitors. The WBGT Index provides a single value that enables you to evaluate the level of heat stress caused by an environment. There are two WBGT indices: Indoor and Outdoor. (For details, see the Help topic "Understanding heat stress data and parameters.")
Weighted WBGT average
232
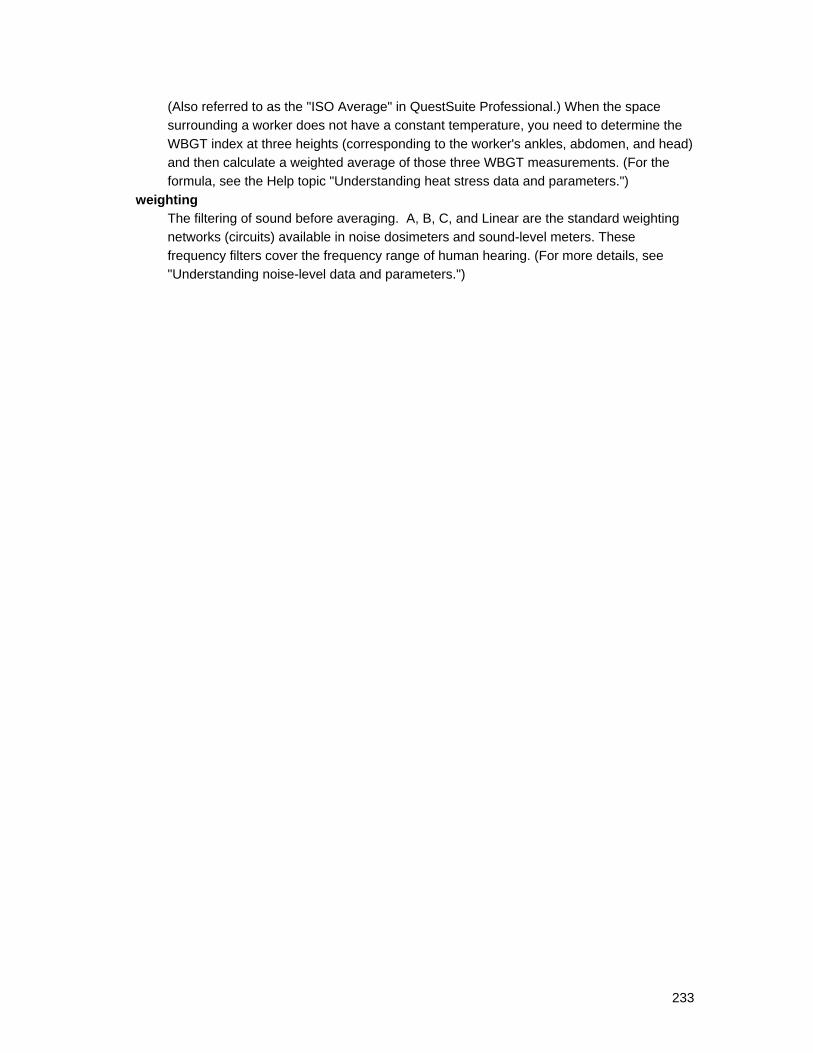
(Also referred to as the "ISO Average" in QuestSuite Professional.) When the space surrounding a worker does not have a constant temperature, you need to determine the WBGT index at three heights (corresponding to the worker's ankles, abdomen, and head) and then calculate a weighted average of those three WBGT measurements. (For the formula, see the Help topic "Understanding heat stress data and parameters.")
weighting The filtering of sound before averaging. A, B, C, and Linear are the standard weighting networks (circuits) available in noise dosimeters and sound-level meters. These frequency filters cover the frequency range of human hearing. (For more details, see "Understanding noise-level data and parameters.")
233
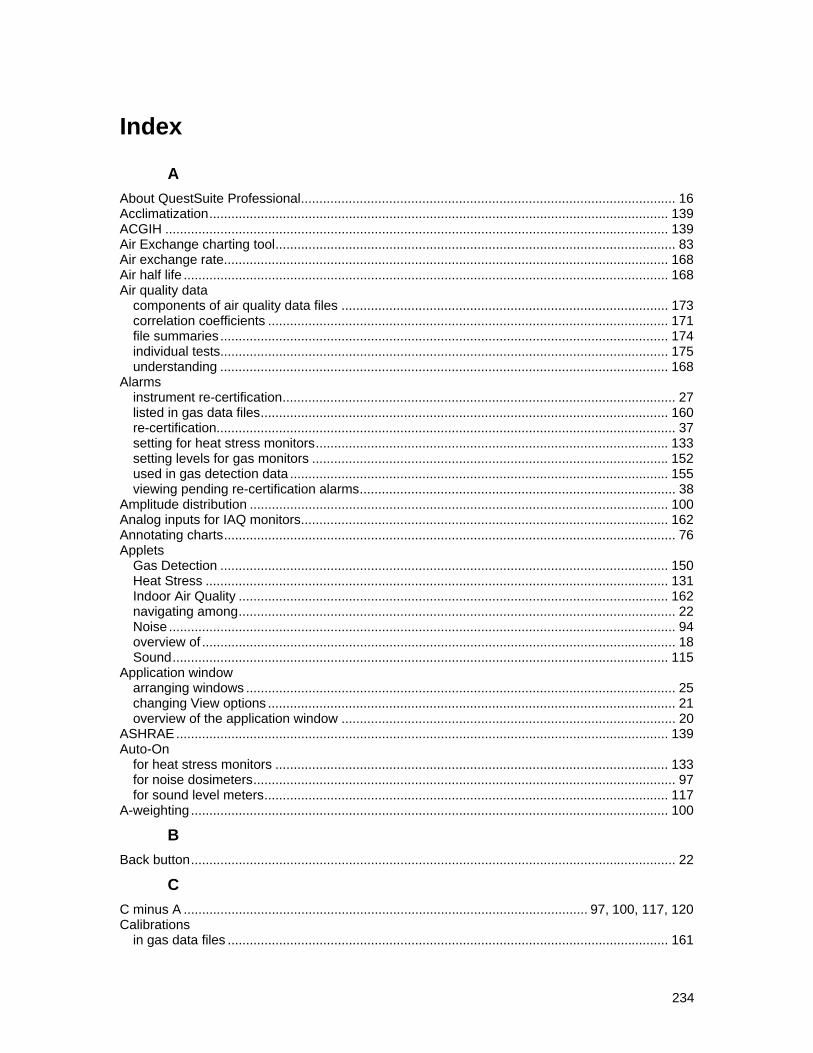
Index
A About QuestSuite Professional...................................................................................................... 16 Acclimatization............................................................................................................................. 139 ACGIH ......................................................................................................................................... 139 Air Exchange charting tool............................................................................................................. 83 Air exchange rate......................................................................................................................... 168 Air half life .................................................................................................................................... 168 Air quality data
components of air quality data files ......................................................................................... 173 correlation coefficients ............................................................................................................. 171 file summaries.......................................................................................................................... 174 individual tests.......................................................................................................................... 175 understanding .......................................................................................................................... 168
Alarms instrument re-certification........................................................................................................... 27 listed in gas data files............................................................................................................... 160 re-certification............................................................................................................................. 37 setting for heat stress monitors................................................................................................ 133 setting levels for gas monitors ................................................................................................. 152 used in gas detection data ....................................................................................................... 155 viewing pending re-certification alarms...................................................................................... 38
Amplitude distribution .................................................................................................................. 100 Analog inputs for IAQ monitors.................................................................................................... 162 Annotating charts........................................................................................................................... 76 Applets
Gas Detection .......................................................................................................................... 150 Heat Stress .............................................................................................................................. 131 Indoor Air Quality ..................................................................................................................... 162 navigating among....................................................................................................................... 22 Noise .......................................................................................................................................... 94 overview of ................................................................................................................................. 18 Sound....................................................................................................................................... 115
Application window arranging windows ..................................................................................................................... 25 changing View options ............................................................................................................... 21 overview of the application window ........................................................................................... 20
ASHRAE...................................................................................................................................... 139 Auto-On
for heat stress monitors ........................................................................................................... 133 for noise dosimeters................................................................................................................... 97 for sound level meters.............................................................................................................. 117
A-weighting .................................................................................................................................. 100
B Back button.................................................................................................................................... 22
C C minus A .............................................................................................................. 97, 100, 117, 120 Calibrations
in gas data files ........................................................................................................................ 161
234
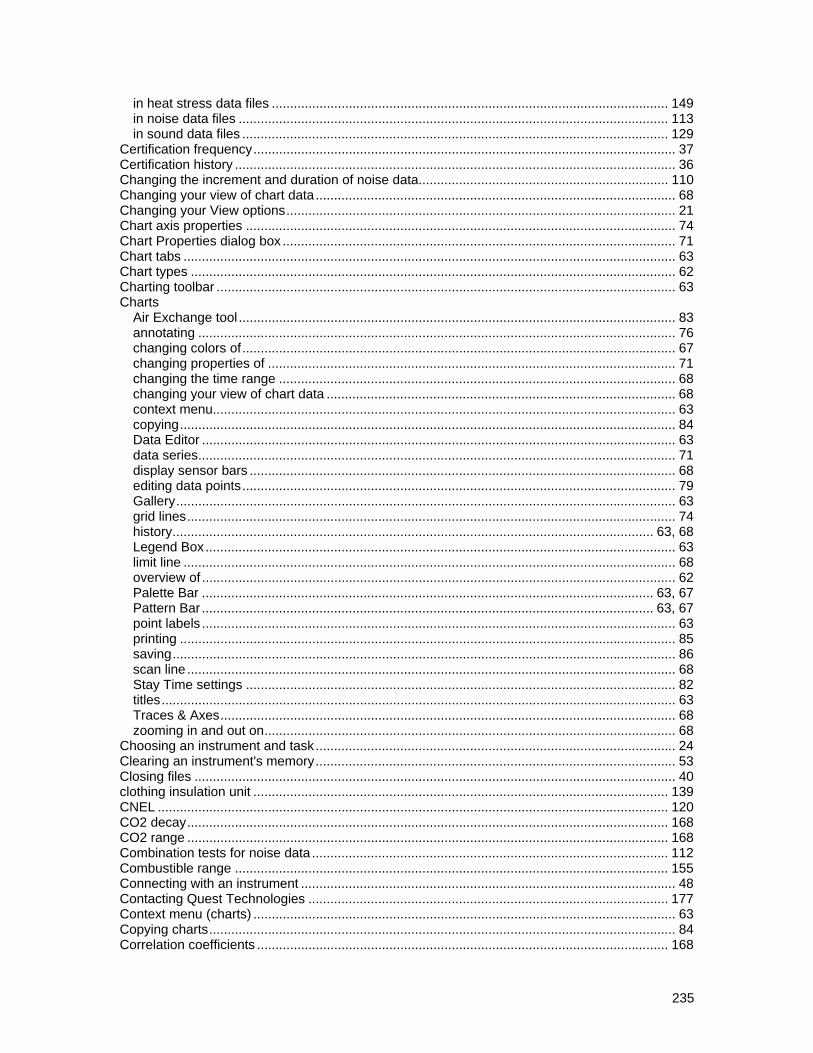
in heat stress data files ............................................................................................................ 149 in noise data files ..................................................................................................................... 113 in sound data files .................................................................................................................... 129
Certification frequency................................................................................................................... 37 Certification history ........................................................................................................................ 36 Changing the increment and duration of noise data.................................................................... 110 Changing your view of chart data.................................................................................................. 68 Changing your View options.......................................................................................................... 21 Chart axis properties ..................................................................................................................... 74 Chart Properties dialog box ........................................................................................................... 71 Chart tabs ...................................................................................................................................... 63 Chart types .................................................................................................................................... 62 Charting toolbar ............................................................................................................................. 63 Charts
Air Exchange tool ....................................................................................................................... 83 annotating .................................................................................................................................. 76 changing colors of...................................................................................................................... 67 changing properties of ............................................................................................................... 71 changing the time range ............................................................................................................ 68 changing your view of chart data ............................................................................................... 68 context menu.............................................................................................................................. 63 copying....................................................................................................................................... 84 Data Editor ................................................................................................................................. 63 data series.................................................................................................................................. 71 display sensor bars .................................................................................................................... 68 editing data points...................................................................................................................... 79 Gallery........................................................................................................................................ 63 grid lines..................................................................................................................................... 74 history................................................................................................................................... 63, 68 Legend Box................................................................................................................................ 63 limit line ...................................................................................................................................... 68 overview of ................................................................................................................................. 62 Palette Bar ........................................................................................................................... 63, 67 Pattern Bar ........................................................................................................................... 63, 67 point labels ................................................................................................................................. 63 printing ....................................................................................................................................... 85 saving......................................................................................................................................... 86 scan line ..................................................................................................................................... 68 Stay Time settings ..................................................................................................................... 82 titles............................................................................................................................................ 63 Traces & Axes............................................................................................................................ 68 zooming in and out on................................................................................................................ 68
Choosing an instrument and task.................................................................................................. 24 Clearing an instrument's memory.................................................................................................. 53 Closing files ................................................................................................................................... 40 clothing insulation unit ................................................................................................................. 139 CNEL ........................................................................................................................................... 120 CO2 decay................................................................................................................................... 168 CO2 range ................................................................................................................................... 168 Combination tests for noise data ................................................................................................. 112 Combustible range ...................................................................................................................... 155 Connecting with an instrument ...................................................................................................... 48 Contacting Quest Technologies .................................................................................................. 177 Context menu (charts) ................................................................................................................... 63 Copying charts............................................................................................................................... 84 Correlation coefficients ................................................................................................................ 168
235
Creating setup files........................................................................................................................ 57 Criterion level............................................................................................................................... 100 C-weighting.................................................................................................................................. 100
D Data
clearing from an instrument ....................................................................................................... 53 retrieving from an instrument ..................................................................................................... 52
Data Editor..................................................................................................................................... 63 Data files
air quality.................................................................................................................................. 173 gas ........................................................................................................................................... 158 heat stress................................................................................................................................ 144 importing .................................................................................................................................... 42 noise......................................................................................................................................... 107 overview of ................................................................................................................................. 59 saving......................................................................................................................................... 41 searching for .............................................................................................................................. 43 sound ....................................................................................................................................... 122
Data pane ................................................................................................................................ 60, 61 Data points..................................................................................................................................... 79 Data series (charts) ....................................................................................................................... 71 Database
Instrument .................................................................................................................................. 30 User Profile ................................................................................................................................ 29
Data-file window ............................................................................................................................ 60 Date and time setup for instruments ............................................................................................. 50 Day/night level ............................................................................................................................. 100 Dew point..................................................................................................................................... 168 Dose ............................................................................................................................................ 100
E Editing data points ......................................................................................................................... 79 Emailing files.................................................................................................................................. 44 EPRI ............................................................................................................................................ 139 Exceedance chart .......................................................................................................................... 62 Exceedance levels....................................................................................................................... 100 Exceedance report ........................................................................................................................ 87 Exchange rate.............................................................................................................................. 100 Exiting QuestSuite Professional .................................................................................................... 45 Explorer pane .......................................................................................................................... 60, 61 Exporting
reports ........................................................................................................................................ 93 software license ......................................................................................................................... 32
Exposure (noise).......................................................................................................................... 100
F File menu ....................................................................................................................................... 39 File operations ............................................................................................................................... 39 File summaries
for air quality data .................................................................................................................... 174 for gas data .............................................................................................................................. 159 for heat stress data .................................................................................................................. 145 for noise data ........................................................................................................................... 108 for sound data .......................................................................................................................... 123
236
File Summary window ................................................................................................................... 60 File types ....................................................................................................................................... 26 File-name extensions .................................................................................................................... 26 Files
creating and opening setup files ................................................................................................ 57 importing .................................................................................................................................... 42 opening and closing ................................................................................................................... 40 overview of data files ................................................................................................................. 59 overview of setup files................................................................................................................ 55 saving......................................................................................................................................... 41 saving charts .............................................................................................................................. 86 saving reports............................................................................................................................. 92 saving setup files ....................................................................................................................... 58 searching for .............................................................................................................................. 43 sending as email attachments ................................................................................................... 44
Filters ........................................................................................................................................... 128 Fonts
changing in application window ................................................................................................. 21 changing in charts...................................................................................................................... 63
Forward button............................................................................................................................... 22 Full report....................................................................................................................................... 87
G Gallery ........................................................................................................................................... 63 Gas data
calibrations ............................................................................................................................... 161 components of gas data files ................................................................................................... 158 file summaries.......................................................................................................................... 159 individual tests.......................................................................................................................... 160 understanding .......................................................................................................................... 155
Gas monitors overview of ............................................................................................................................... 150 setting up.................................................................................................................................. 152
Grid lines (charts) .......................................................................................................................... 74 Groups and sessions (sound files) .............................................................................................. 124
H Hanging up from a remote connection .......................................................................................... 54 Heat Index ................................................................................................................................... 139 Heat stress................................................................................................................................... 139 Heat stress data
calibrations ............................................................................................................................... 149 components of heat stress data files ....................................................................................... 144 file summaries.......................................................................................................................... 145 individual tests.......................................................................................................................... 147 Stay Time................................................................................................................................... 82 understanding .......................................................................................................................... 139
Heat stress monitors overview of ............................................................................................................................... 131 remotely controlling.................................................................................................................. 137 setting up.................................................................................................................................. 133
History charts changing your view of chart data ............................................................................................... 68 overview of charts ...................................................................................................................... 62 the chart tabs ............................................................................................................................. 63
237
Home button .................................................................................................................................. 22 Home page .................................................................................................................................... 25
I Importing
data files..................................................................................................................................... 42 software license ......................................................................................................................... 32
Indoor air quality monitors overview of ............................................................................................................................... 162 remotely controlling.................................................................................................................. 166 setting up.................................................................................................................................. 164
Inputs for indoor air quality monitors ........................................................................................... 164 Installing QuestSuite Professional on another computer .............................................................. 32 Instrument
certification history ..................................................................................................................... 36 choosing..................................................................................................................................... 24 clearing memory from ................................................................................................................ 53 connecting with locally or remotely ............................................................................................ 48 disconnecting from..................................................................................................................... 54 programming.............................................................................................................................. 49 retrieving data from .................................................................................................................... 52 retrieving setup information from ............................................................................................... 51 setting date and time.................................................................................................................. 50 setting re-certification alarms for................................................................................................ 37 viewing re-certification alarms for .............................................................................................. 38
Instrument database...................................................................................................................... 30 Instrument re-certifications
maintaining an instrument's certification history ........................................................................ 36 setting up in System Options ..................................................................................................... 27
Integration Threshold................................................................................................................... 117
L LAvg............................................................................................................................................. 100 LAVG Point Editing dialog box ...................................................................................................... 79 LDN.............................................................................................................................................. 100 Legend Box.................................................................................................................................... 63 LEL .............................................................................................................................................. 155 LEQ.............................................................................................................................................. 100 LEQ Point Editing dialog box......................................................................................................... 79 License Status ............................................................................................................................... 32 Limit line......................................................................................................................................... 68 Linear weighting........................................................................................................................... 100 LMax ............................................................................................................................................ 100 LN ................................................................................................................................................ 100 LPeak
in the Noise applet ................................................................................................................... 100 in the Sound applet .................................................................................................................. 120
M Maintaining instrument certification history ................................................................................... 36 Maximum level............................................................................................................................. 100 Mean air life ................................................................................................................................. 168 Measuring range.......................................................................................................................... 100 Metabolic rate .............................................................................................................................. 139 MRT ............................................................................................................................................. 139
238
MTA ............................................................................................................................................. 139
N Navigating in QuestSuite Professional .......................................................................................... 22 Navigation Bar
showing or hiding ....................................................................................................................... 21 using........................................................................................................................................... 22
Navy PHELs ................................................................................................................................ 139 New features in QuestSuite Professional...................................................................................... 19 Noise data
calibrations ............................................................................................................................... 113 changing the increment and duration ...................................................................................... 110 combination tests ..................................................................................................................... 112 components of noise data files ................................................................................................ 107 file summaries.......................................................................................................................... 108 individual tests.......................................................................................................................... 111 understanding .......................................................................................................................... 100
Noise dosimeters overview of ................................................................................................................................. 94 setting up.................................................................................................................................... 97
O Opening
files............................................................................................................................................. 40 setup files ................................................................................................................................... 57
Overload in Noise applet ......................................................................................................................... 100 in Sound applet ........................................................................................................................ 120
Overview of applets.................................................................................................................................... 18 of charts ..................................................................................................................................... 62 of conducting tests and getting data .......................................................................................... 46 of data files................................................................................................................................. 59 of file operations......................................................................................................................... 39 of gas monitors ........................................................................................................................ 150 of heat stress monitors............................................................................................................. 131 of indoor air quality monitors.................................................................................................... 162 of noise dosimeters.................................................................................................................... 94 of reports .................................................................................................................................... 87 of setup files ............................................................................................................................... 55 of sound level meters............................................................................................................... 115
P Palette Bar ............................................................................................................................... 63, 67 Pascal-squared hours.................................................................................................................. 100 Pattern Bar............................................................................................................................... 63, 67 Peak level
in Gas Detection applet............................................................................................................ 155 in Noise applet ......................................................................................................................... 100 in Sound applet ........................................................................................................................ 120
Peak STEL................................................................................................................................... 155 PHELs.......................................................................................................................................... 139 PMV ............................................................................................................................................. 139 Point Editing dialog box ................................................................................................................. 79 Point labels .................................................................................................................................... 63
239
Print Setup ..................................................................................................................................... 35 Printing
charts ......................................................................................................................................... 85 reports ........................................................................................................................................ 91
Programming an instrument .................................................................................................... 49, 56 Projected dose
calculating for what-if analysis ................................................................................................. 110 defined ..................................................................................................................................... 100 in file summaries for noise data ............................................................................................... 108
Projected time.............................................................................................................................. 100 Projected TWA
calculating for what-if analysis ................................................................................................. 110 defined ..................................................................................................................................... 100 in file summaries for noise data ............................................................................................... 108
Properties annotation objects...................................................................................................................... 76 chart ........................................................................................................................................... 71 chart axes................................................................................................................................... 74
Q Quest Technologies
Contacting Quest Technologies............................................................................................... 177 QuestSuite Professional
application window..................................................................................................................... 20 exiting......................................................................................................................................... 45 file types ..................................................................................................................................... 26 home page ................................................................................................................................. 25 moving to another computer ...................................................................................................... 32 navigating in ............................................................................................................................... 22 new features in........................................................................................................................... 19 overview of ................................................................................................................................. 16 overview of conducting tests and getting data........................................................................... 46 software license ......................................................................................................................... 32
R Re-certification alarms
enabling or disabling .................................................................................................................. 27 viewing ....................................................................................................................................... 38
Relative humidity ......................................................................................................................... 139 Remote Connection
hanging up ................................................................................................................................. 54 setting up.................................................................................................................................... 31 using........................................................................................................................................... 48
Remote Control for heat stress monitors ........................................................................................................... 137 for indoor air quality monitors................................................................................................... 166
Report tabs .................................................................................................................................... 88 Report types .................................................................................................................................. 87 Reports
exporting .................................................................................................................................... 93 overview of ................................................................................................................................. 87 printing ....................................................................................................................................... 91 saving......................................................................................................................................... 92 setting up.................................................................................................................................... 89 Stay Time settings ..................................................................................................................... 82
240
Response level ............................................................................................................................ 100 Retrieving data from an instrument ............................................................................................... 52 Retrieving setup information from an instrument........................................................................... 51
S Saving
charts ......................................................................................................................................... 86 files............................................................................................................................................. 41 reports ........................................................................................................................................ 92 setup files ................................................................................................................................... 58
Scan line ........................................................................................................................................ 68 Searching for data files.................................................................................................................. 43 Security codes
for gas monitors ....................................................................................................................... 152 for heat stress monitors ........................................................................................................... 133 for indoor air quality monitors................................................................................................... 164 for noise dosimeters................................................................................................................... 97
SEL .............................................................................................................................................. 100 Sending files as email attachments............................................................................................... 44 Sensor bars
displaying data on charts ........................................................................................................... 68 on area heat stress monitors ................................................................................................... 139 sensors for gas monitors.......................................................................................................... 150 toxic-gas sensors for IAQ monitors.......................................................................................... 162
Setting an instrument's date and time ........................................................................................... 50 Setting re-certification alarms ........................................................................................................ 37 Setting up
Communications ........................................................................................................................ 27 gas monitors............................................................................................................................. 152 heat stress monitors................................................................................................................. 133 indoor air quality monitors........................................................................................................ 164 Instrument database .................................................................................................................. 30 noise dosimeters........................................................................................................................ 97 printer ......................................................................................................................................... 35 Re-certifications ......................................................................................................................... 27 Remote Connection ................................................................................................................... 31 reports ........................................................................................................................................ 89 software license ......................................................................................................................... 32 sound level meters................................................................................................................... 117 System Options.......................................................................................................................... 27 User Profile database ................................................................................................................ 29
Setup dialog box............................................................................................................................ 56 Setup files
creating ...................................................................................................................................... 57 opening ...................................................................................................................................... 57 overview of ................................................................................................................................. 55 retrieving from an instrument ..................................................................................................... 51 saving......................................................................................................................................... 58
Software license checking status of ...................................................................................................................... 32 importing and exporting ............................................................................................................. 32 registering or upgrading ............................................................................................................. 32
Sound data calibrations ............................................................................................................................... 129 components of sound data files ............................................................................................... 122 file summaries.......................................................................................................................... 123
241
filters......................................................................................................................................... 128 groups and sessions ................................................................................................................ 124 individual tests.......................................................................................................................... 126 understanding .......................................................................................................................... 120
Sound level meters overview of ............................................................................................................................... 115 setting up.................................................................................................................................. 117
SPL .............................................................................................................................................. 100 Statistics (noise) .......................................................................................................................... 100 Statistics chart ............................................................................................................................... 62 Statistics report .............................................................................................................................. 87 Status bar ...................................................................................................................................... 21 Stay Time dialog box ..................................................................................................................... 82 Stay times
calculating from heat stress data ............................................................................................. 147 defined ..................................................................................................................................... 139 setting for the QT-36 ................................................................................................................ 133
STEL............................................................................................................................................ 155 Strain index.................................................................................................................................. 139 Summary report ............................................................................................................................. 87 System options .............................................................................................................................. 27
T Tabs
chart ........................................................................................................................................... 63 in data-file windows.................................................................................................................... 60 report.......................................................................................................................................... 88
TAKM................................................................................................................................... 117, 120 Terminology
air quality data and parameters ............................................................................................... 168 correlation coefficients ............................................................................................................. 171 gas detection data and parameters ......................................................................................... 155 heat stress data and parameters ............................................................................................. 139 noise-level data and parameters.............................................................................................. 100 sound-level data and parameters ............................................................................................ 120
Test window................................................................................................................................... 60 Tests
combining in noise data files.................................................................................................... 112 individual tests in air quality data files...................................................................................... 175 individual tests in gas data files ............................................................................................... 160 individual tests in heat stress data files ................................................................................... 147 individual tests in noise data files............................................................................................. 111 individual tests in sound data files ........................................................................................... 126
Thermal comfort calculating in heat stress data files .......................................................................................... 147 defined ..................................................................................................................................... 139
Threshold level ............................................................................................................................ 100 Threshold-triggered study............................................................................................................ 117 Time history ................................................................................................................................. 100 Time range
for editing data points................................................................................................................. 79 Time Range tool......................................................................................................................... 68
Toolbar Annotate..................................................................................................................................... 76 charting ...................................................................................................................................... 63 report tools ................................................................................................................................. 88
242
243
showing and hiding .................................................................................................................... 21 Web section ............................................................................................................................... 22
Toxic-gas sensors for gas monitors ....................................................................................................................... 150 for indoor air quality monitors................................................................................................... 162
Tracer gas.................................................................................................................................... 168 Traces & Axes dialog box.............................................................................................................. 68 TWA
for gas detection data .............................................................................................................. 155 for noise-level data................................................................................................................... 100
Type 1.......................................................................................................................................... 100 Type 2.......................................................................................................................................... 100 Types of charts .............................................................................................................................. 62
U UEL.............................................................................................................................................. 155 UL Time ....................................................................................................................................... 100 User Profile database .................................................................................................................... 29 Using this Help system ................................................................................................................ 176
V View options .................................................................................................................................. 21 Virtual dosimeters.................................................................................................................... 94, 97
W WBGT.......................................................................................................................................... 139 Weighted WBGT average............................................................................................................ 139 Weighting..................................................................................................................................... 100 Window
data file....................................................................................................................................... 60 QuestSuite Professional ............................................................................................................ 20
Windows working with ............................................................................................................................... 25
Z Zooming in and out on charts ........................................................................................................ 68