table 138.--current and projected designs of softwood
TRANSCRIPT

Table 138.--Current and projected designs of softwood plywood systems.
Process parameters
Technology type
Mid-1970s Mid-1980s Late-1980s
Percent of bolts which spinout 8 3 0
Spinout core size (inches) 9.5 6.8 N/A
Target core size (inches) 5.0 3.3 2.0
Ratio of actual-to-nominal veneer thickness 1.024 1.000 1.008
Ratio of thickness variability to actual veneer thickness .055 .032 ,040
Clipper speed (fpm) 375 500 500
Target veneer moisture (percent dry basis) 4.5 9.0 9.0
Table 139.--Proportion of various softwood plywood systems by region in 1985, with projections to 2040.
Projections
Section and region 1985 2000 2010 2020 2030 2040
South Mid-1970s 40 5 0 0 0 0 M id-1980s 60 70 65 63 62 60 Late-1980s 0 25 35 37 38 40
Pacific Coast Pacific Northwest
Pacific Northwest-West Mid-1970s 70 30 20 17 16 15 Mid-1980s 30 55 52 51 50 50 Late-1980s 0 15 28 32 34 35
Pacific Northwest-East Mid-1970s 40 20 15 12 10 10 Mid-1980s 60 68 65 60 55 55 Late- 1980s 0 12 20 28 35 35
Table 140,--Trend in diameter of softwood veneer logs processed by plywood mills, by plywood mill system and region in 1985, with projections to 2040.
Projections
Section and region 1985 2000 2010 2020 2030 2040
Inches
South Mid-1970s 12.0 12.5 12.7 12.6 12.5 12.4 Mid-1980s 11.0 11.0 11.0 11.0 11.0 11.0 Late-1980s 9,0 9.0 9.0 9.0 9.0 9.0
Pacific Coast Pacific Northwest
Pacific Northwest-West Mid-1970s 15.5 14.8 14.5 14.3 14.1 14.0 Mid-1980s 14.5 13.0 12.5 12.1 11.7 11.5 Late-1980s 12.0 11.8 11.5 11.0 10.6 10.2
Pacific Northwest-East Mid-1970s 15.5 14.5 14.0 13.5 13.2 13.0 Mid-1980s 14.0 12.5 12.0 11.7 11.6 11.5 Late-1980s 10.0 10.0 10.0 10.0 10.0 10.0
215
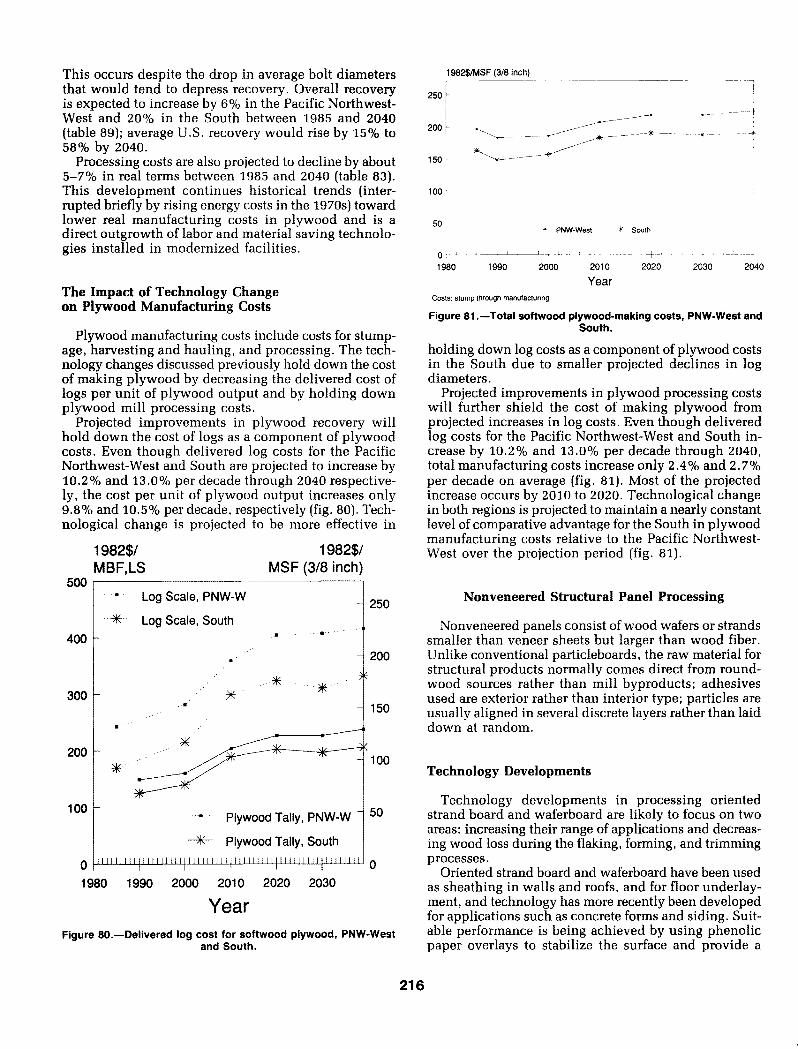
This occurs despite the drop in average bolt diameters that would tend to depress recovery. Overall recovery is expected to increase by 6% in the Pacific Northwest- West and 20% in the South between 1985 and 2040 (table 89); average U.S. recovery would rise by 15% to 58% by 2040.
Processing costs are also projected to decline by about 5-7% in real terms between 1985 and 2040 (table 83). This development continues historical trends (inter- rupted briefly by rising energy costs in the 1970s) toward lower real manufacturing costs in plywood and is a direct outgrowth of labor and material saving technolo- gies installed in modernized facilities.
The Impact of Technology Change on Plywood Manufacturing Costs
Plywood manufacturing costs include costs for stump- age, harvesting and hauling, and processing. The tech- nology changes discussed previously hold down the cost of making plywood by decreasing the delivered cost of logs per unit of plywood output and by holding down plywood mill processing costs.
Projected improvements in plywood recovery will hold down the cost of logs as a component of plywood costs. Even though delivered log costs for the Pacific Northwest-West and South are projected to increase by 10.2% and 13.0% per decade through 2040 respective- ly, the cost per unit of plywood output increases only 9.8% and 10.5% per decade, respectively (fig. 80). Tech- nological change is projected to be more effective in
19825/ 19825/ MBF, LS MSF (3/8 inch'
5OO " Log Scale, PNW-W
- 250 - ~ Log Scale, South . , i
4 0 0 - "
- 200
3 0 0 - " 150
ii.-
2 0 0 - ~ 1 0 0
1 0 0 - • Plywood Tally, PNW-W - 50
Plywood Tally, South
0 I I I I I I l l l l J l l l l l l l l l J l l l l J l J l l l J l l J l l l l l l l l t l l l l l l l I I l l l l l l 0
1 9 8 0 1 9 9 0 2000 2010 2020 2 0 3 0
Year Figure 8 0 . - - D e l i v e r e d log cost for so f twood p lywood, P N W - W e s t
and South .
1 9 8 2 ~ S F (3/8 inch)
250 t i
I 200 ~ ~ ~ . ~ / ~
loo I I i
50 ~ PNW-West ~'~ South
1980 1990 2000 2010 2020 2030 2040
Year Costs: stump through manufactunng
Figure 81 . - - T o t a l so f twood p lywood-mak ing costs, P N W - W e s t and South .
holding down log costs as a component of plywood costs in the South due to smaller projected declines in log diameters.
Projected improvements in plywood processing costs will further shield the cost of making plywood from projected increases in log costs. Even though delivered log costs for the Pacific Northwest-West and South in- crease by 10.2% and 13.0% per decade through 2040, total manufacturing costs increase only 2.4% and 2.7% per decade on average (fig. 81). Most of the projected increase occurs by 2010 to 2020. Technological change in both regions is projected to maintain a nearly constant level of comparative advantage for the South in plywood manufacturing costs relative to the Pacific Northwest- West over the projection period (fig. 81).
Nonveneered Structural Panel Processing
Nonveneered panels consist of wood wafers or strands smaller than veneer sheets but larger than wood fiber. Unlike conventional particleboards, the raw material for structural products normally comes direct from round- wood sources rather than mill byproducts; adhesives used are exterior rather than interior type; particles are usually aligned in several discrete layers rather than laid down at random.
Technology Developments
Technology developments in processing oriented strand board and waferboard are likely to focus on two areas: increasing their range of applications and decreas- ing wood loss during the flaking, forming, and trimming processes.
Oriented strand board and waferboard have been used as sheathing in walls and roofs, and for floor underlay- ment, and technology has more recently been developed for applications such as concrete forms and siding. Suit- able performance is being achieved by using phenolic paper overlays to stabilize the surface and provide a
2 1 6

Examples of structural composite products, from top left: wood joist with laminated veneer lumber (LVL) flange and plywood web, wood joist with LVL flange and wood particle web, waferboard and subfloor/underlayment, Parallam (reg. trademark of McMillan Bodel Inc.), conventional plywood, COM-PLY (reg. trademark of the American Plywood Association), LVL, and Waveboard (reg. trademark of the Alberta Research Council). (Credit: Forest Products Research Society)
suitable basis for paint or concrete forming. To improve panel stability, the trend has been to displace phenolic adhesives, either totally or in part, with isocyantate adhesives. While more costly than phenolics on a pound for pound basis, isocyanate adhesives are more profit- able for a given level of panel stability than phenolic adhesives because they allow shorter press times and more moisture in the furnish.
Better flaker designs are likely to be adopted in the future to reduce the generation of fines (pieces of wood too small to be used) and improve forming techniques to increase wood utilization. Disc flakers are normally used in mills today. These machines normally require logs to be reduced to 4-foot bolts for processing. The flakers generate from 8-10% small particles (fines) that are unsuitable for use in panels along with about 4% kerf losses caused by the primary and secondary slasher saws. To reduce these losses, whole log flaking utiliz- ing ring and disk waferizers, with losses due to fines also in the 8-10% range but lower slasher kerf losses of about 2%, seems likely to be adopted (Pallmann GMBH 1987).
In current practice, fines are burned for fuel, but with improved mat formers, some of the fines could be used in the core layer of panels without reducing panel strength. This can be accomplished by electrostatically orienting particles. Panel strength increases as uni- formity of particle alignment improves (Fyie et al. 1980).
Electrostatic orienters achieve higher orientation ratios than mechanical orienters, thus achieving panel strength with smaller particles that are as good as mechanically oriented panels with standard size furnish. The effec- tiveness of electrostatic orientation, however, decreases with large particle sizes, thus electrostatic orientation will likely complement mechanical formers rather than displace them (Buecking et al. 1980).
Another means to reduce wood losses is to employ continuous presses now gaining acceptance in particle- board and medium density fiberboard facilities. Continu- ous mats would eliminate end trimming resulting in wood savings of 1-2%. But the larger size and rougher surface of oriented strand board and waferboard fur- nishes wear out the steel bands used in these presses and for that reason their adoption by industry appears un- likely (Soine 1988).
Projected Recovery and Costs
Nonveneered structural panel wood recoveries are estimated to average between 55% and 60% (based on losses of 4% for trimming log ends and log rejects, 8-12% for fines, 35-38% for panel densification, and 3 % for panel trim). This rate of recovery is projected to increase about 2% between 1986 and 2040 due to ira-
217

provements in bolt preparation and flaking and more complete utilization of fines (table 90).
Oriented strand board and waferboard manufacturing costs have decreased during the past 5 years because of savings made possible by improved glue blenders. Resin dosages of liquid phenolic resins have declined from over 5% to less than 4%. Powdered resin dosages have also been reduced from 3 % to 2 %. Further potential for savings in this area is limited, so the projections of processing costs for waferboard show more modest declines than those for plywood. The adoption of modern technology by remaining mills is expected to account for the bulk of the projected 4% reduction in processing costs between 1986 and 2040 (table 84).
Pulp, Paper, Paperboard and Related Products
Paper and board products are made primarily from new or recycled wood fiber. New wood fiber is in the form of woodpulp which is made from pulpwood. Recy- cled wood fiber is derived from wastepaper which con- sists of old newspapers, old corrugated containers, mixed grades, pulp substitutes, and high grade deink- ing. Different paper and board products use different mixes of woodpulps, wastepaper, and other fiber. This mix, or fiber furnish, reflects the requirements for a par- ticular product grade, the level of technology, and the availability of fibers.
Paper and board products are classified into paper grades and paperboard grades. The major paper grades include tissue (sanitary products, napkins, toweling), printing and writing (bond paper, computer paper, copy- ing paper, and paper for books and magazines), pack- aging and industrial (wrapping papers, bags, and sacks), and newsprint. The major paperboard grades include unbleached kraft (linerboard for corrugated boxes), semi- chemical (corrugating medium for boxes), solid bleached (folding boxes and food containers), and recycled paper- board (a variety of products including gypsum wallboard facing).
Although specific manufacturing processes and fiber requirements differ among the product grades, paper and board processing generally involves wood handling (de- barking, chipping, and chip screening), pulping and bleaching (conversion of chips into pulp using chemi- cal or mechanical processes, bleaching when needed), stock preparation (repulping, deinking, and removal of other contaminants from wastepaper furnish, fiber refin- ing, mixing pulp with additives and recycled fiber), and conversion to paper and board (sheet formations, press- ing, drying).
Technological Developments
Technological developments in the U.S. paper and board industry focus on the ability to improve produc- tion efficiency and product quality while mitigating or eliminating negative impacts on the environment. Some of the technical challenges facing the industry include
An experimental spinning disk separator takes a stream of recycled paper slurry and spins sticky contaminates to an outer ring while dropping useable pulp fiber to an inner ring. (Credit: USDA Forest Products Laboratory)
the need to reduce energy costs, reduce capital equip- ment costs, improve strength and quality of recycled fiber, increase fiber recovery, develop processes that can use more hardwood fiber, develop processes that are more environmentally benign, and provide better qual- ity paper products for present and future uses.
Many current and likely future technological develop- ments address the above challenges. Table 141 provides a list of such developments in paper and board process- ing, describing the likely impact of each development on wood requirements. These developments are viewed as very likely to take effect over the next 50 years. They were incorporated into the projections of paper and board, woodpulp, and pulpwood production shown in Chapter 7 (Ince et al., in prep.).
Table 142 lists those technological developments that were considered, but not included in the projections. They were not included because they were viewed by industry, university, and government researchers as less likely to be commercially significant during the next 50 years.
Paper and Board Manufacturing Processes
As mentioned above, each paper and board product grade uses specific production processes. These proc- esses can be defined in terms of the percentages of fiber used, the nonfiber manufacturing costs, and the date of commercial availability. Technological developments result in new, more cost-effective processes which use increasing amounts of wastepaper and mechanical pulps and have lower nonfiber manufacturing costs.
2 1 8

Table 141 .--Technological developments in pulp and paper processing included in the projections.
Type of development Description Impact
Meeting needs for improved stacking strength in corrugated boxes
Meeting increasing demands for quality and uniformity in printing and writing papers with improved papermaking technology
Meeting demand for printability and quality in linerboard with improved forming and finishing technology
Gradual replacement of traditional groundwood pulp by modern mechanical pulps in newsprint and other groundwood papers
Improvement in pulp bleaching systems to reduce capital costs and operating costs, and to meet environmental objectives
Modernization of equipment and processes in older mills to improve efficiency and reduce costs
Better recycled fiber recovery, improved contaminant removal technology for wastepaper furnish, and increased use of recycled fiber; technological responses to increased supply of recyclable paper
Displacement of chemical pulp fractions by modern high-yield mechanical pulp, in newsprint and tissue, and to some extent in printing and writing paper, reducing capital requirements and wood costs
Continued adoption of improved pressing technology in papermaking, reducing sheet drying costs, increasing throughput, and improving product quality
Commercial adoption of impulse drying, press drying, or related improvements in pressing and drying technology
Further development of nonwoven products and improvements in sanitary products based on fluff pulp
Development of laminated paper and packaging products
Continued displacement of some fiber products by plastics and other substitutes
Edgewise compressive strength eventually becomes the principal performance criterion
Increased use of higher quality fillers, drainage and retention additives, coating pigments, and hardwood fiber; more machine finishing and alkaline papermaking
Development of multi-ply forming; improved stock preparation systems; use of hardwood fiber for printability on the surface, or sand- wiching hardwood or recycled fiber in the core for economy
Thermomechanical (TMP), Chemi- thermomechanical (CTMP), and pressurized groundwood (PGW) replace some older groundwood and refiner processes, with improvement in pulp quality
Adoption of short-sequence bleaching systems, chlorine dioxide in bleaching, and lower yield in bleached kraft pulping; development of peroxide and other bleaching technologies for TMP and CTMP; use of higher yield bleached mechanical pulps
More tree-length wood handling and chip thickness screening; improvements in stock preparation, paper machine systems, and kraft chemical recovery; energy savings through use of variable-speed drives, high-efficiency motors and upgraded turbine generators; use of more wood or bark for fuel
Improved centrifugal cleaners, slotted screens, deinking systems, and high-consistency re- fining; technology for removal of contaminants such as "stickles"; chemical treatment to restore some bonding strength to recycled fibers
TMP and CTMP with higher percentages of hardwood fiber will replace some chemical pulp fractions in newsprint and tissue, pro- viding better opacity and bulk; substitution in printing and writing limited by color reversion and brightness
Wide-nip and high-impulse press sections will continue to be installed in linerboard mills, and will be installed in mills producing other grades
Interfiber bonding and substantial strength improvements with higher yield pulps, espe- cially with hardwoods, result from drying under pressure or simultaneous pressing and drying
Innovation in sanitary products and new durable nonwoven products; use of new specialty market pulps; some displacement of woodpulp by "superabsorbent" additives
Development of laminated or coextruded packaging structures based on paper or paperboard with plastic or metal foil surfaces
Continued innovation and substitution of plastics in packaging, especially food pack- aging, bag and grocery sacks, and shipping containers; use of synthetic polymers to rein- force paper and paperboard
Compressive strength is improved with higher density linerboard, increased use of higher-yield pulps and more hardwood; improved quality control in kraft linerboard
Less total wood fiber use per ton of product; lower basis weight with more uniform quality; more hardwood
Higher proportions of hardwood fiber and recycled fiber in unbleached kraft paper- board; separate pulping and refining for hardwoods and softwoods
Wider market potential for higher yield mechanical pulp; greater ability to substitute for lower yield chemical pulp
Greater use of bleached mechanical pulps will reduce wood input requirements, although lower yield kraft pulping will increase wood requirements
Lower wood requirements due to gains in wood utilization efficiency, especially in older bleached kraft and sulfite mills; offset somewhat by more use of wood for fuel
Modest growth in recycled paperboard production, but substantial growth in use of recycled fiber in traditionally virgin fiber grades, such as kraft linerboard, semichemical corrugating medium, news- print, and tissue
Higher yield and cost savings; increased use of hardwoods with CTMP
Increased ability to use hardwood and recycled fiber in kraft linerboard; higher production rates; energy and capital cost savings
Substantial savings in capital, energy, and wood requirements; increased use of higher yield pulp and more hardwood in grades like kraft linerboard
More efficient use of wood fiber per unit in sanitary and nonwoven products; more use of bleached CTMP
Expanded product market potential, but lower wood use for current paper and board packaging
Decline in the long-term rate of growth in demand for packaging grades relative to GNP and population growth
219

Table 141,--Continued,
Type of development Description Impact
Substitution of paper by electronic means of communication and information storage
Regulation related to recycling
Increased demands for product uniformity and quality control; better control of inventory in packaging and shipping
Gradual long-term displacement of print media and written communication by electronic and computer technology; short-term comple- mentary effects on demand for printing and writing paper
Decreasing availability of sanitary landfill capacity and escalating waste disposal costs are prompting legislative initiatives on recycling
Improvements in instrumentation and on-line testing for product quality control, mill test labs, and computer controls in production;
Decline in the long-term rate of growth in demand for newsprint and printing and writing grades relative to GNP and population growth
Increased supply of recycled fiber from wastepaper
With the assurance of better quality control and uniformity, lower basis weights will be acceptable in some markets; more consumer demand will be satisfied per ton of product output
Table 142.--Potential technological developments in pulp and paper processing not included in the projections.
Type of development Description Impact
Expanded use of new chemical treatments to improve properties of paperboard products
Expanded use of anthraquinone (AQ) in kraft, sulfite, and soda pulping
Biological fiber treatment, and "biopulping"
Advances in biological effluent treatment systems
Commercial development of nonsulfur chemimechanical pulping process (NSCMP)
Organisolv pulping
Fiber-based structural products
Production of new food substances for animals or humans using wood or pulp- mill by-products
New chemicals from wood
Substitution of wood fiber by kenaf or other natural fibers
Chemical impregnation to increase strength and moisture resistance; chemical saturation for flame resistance
AQ additives provide marginal enhancement of chemical pulping processes; neutral sulfite AQ process is an alternative to bleached kraft for high tensile strength products
Pretreatment with biological lignases or fungi prior to mechanical pulping; treatments could include biobleaching
Use of microbial agents for decolorization, removal of waste, and improvement in effluent treatment systems
Potential application in corrugating medium and linerboard mills; a relatively high yield process suitable for small or medium size mills using hardwoods or mixed species
Development of pulping processes based on organic solvents instead of water; includes alcohol pulping as a substitute for kraft, and ester mechanical pulping with chemical recovery
Development of molded fiber structural compo- nents and products; includes potential products reinforced with high-strength polymers or carbon fibers;
Traditional examples include vanillin, torula yeast, animal feed molasses, shiitake mush- rooms, wood chip animal fodder and ruminant feed
Various chemical feedstocks can be produced from wood, in addition to the conventional silvichemicals, naval stores, lignosulfonates, and other pulp mill by-products; direct acid hydrolysis, "wood-to-oil" processes, and fermentation offer alternatives
Kenaf, bagasse, straw, cotton, and other natural fibers are used for specialty products, or in regions of the world with scarce wood resources
Improved product performance can be achieved for specialty applications
Marginally higher pulp yield is achieved, but concept is limited by cost of AQ chemical, plus differences in capital and energy inputs
Improved efficiency in mechanical pulping processes with application of biotech- nology, but development is in early stages
Improved efficiency in effluent control and waste treatment; potential impact on optimal pulp yield or pulping process
Elimination of inorganic sulfur emissions; less wood input with higher pulp yield
Economic advantages derive from higher yield and lower capital costs; likely to require additional development
New product market potential for use of wood fiber in high performance products, but mass-commodity markets likely to be met by lower cost solid-wood products
Product development likely to be limited except in a national emergency
Technologies will remain available, but will not likely be developed so long as adequate supplies of petroleum, coal, anc~ other resources are available at low cost
Limited development potential in the United States because of abundant wood resources
2 2 0

Table 143 describes the processes used to make se- lected paper and board grades. The table describes those processes which are currently available as well as those future processes that are expected to become available in the next 50 years. For example, in making newsprint, there are four processes which are currently used. Newsprint processes one and two use mostly mechani- cal pulp with smaller fractions of chemical pulps. Newsprint process three uses only wastepaper, and has a lower nonfiber manufacturing cost than processes one and two. Newsprint process four uses equal amounts of mechanical pulp and wastepaper. Another example is unbleached kraft, for which two current processes and two future processes are identified. Unbleached kraft processes one and two use principally chemical pulp with only a small portion of wastepaper. Unbleached kraft process three, a future process, uses higher yield kraft pulp and more hardwood. Another future process, unbleached kraft process four, shifts a substantial por- tion of the furnish to high yield mechanical pulps, while further increasing the amount of wastepaper used. Non- fiber manufacturing costs are the highest for process one and the lowest for process four.
The projections of paper and board, woodpulp, and pulpwood in Chapter 7 are based, in part, on projections by product grade and process. Figures 82 and 83 show
40
I J ~ Process 1 I I
Million Tons 5O j
1 I m Process 2 ~ Process 3 m Process 4 !
J
20
0
1990 2000 2010 2020 2030 2040 Year
Figure 82.--Unbleached kraH production in the United States by process.
the production of unbleached kraft and newsprint by process. For unbleached kraft, the projections show a shift from processes one and two to processes three and four. Newsprint process three, which uses only wastepaper, is projected to become the dominant process for manufacturing newsprint in the United States, although the Canadians are expected to continue to make newsprint largely from raw wood fiber.
Table 143.--Fiber consumption and date of availability of paper and board manufacturing processes, by product grade.
Fiber consumption
Nonfiber costs
Chemical Mechanical per ton Oate Product grade pulp pulp Wastepaper of product available 1
Percent 1986 dollars Year
Newsprint
Process One 25 75 3602 Process Two 9 91 3863 Process Three 1 O0 3512 Process Four 50 50 3994
Unbleached Kraft Process One 93 7 1773 Process Two 85 15 1583 Process Three 85 15 1403 Process Four 50 30 20 1333
Semichemica/ Process One 60 40 201 Process Two 90 10 214 Process Three 100 215
Solid Bleached Process One 100 460 Process Two 37 63 370
Recycled Process One 100 2303
1No year is specified for processes that are currently available. 2North and South. 3South. 4Rocky Mountains and Pacific Coast.
J
1,995 2,010
J
2,000
1,995
221

Mtlhon tons 20 - - - -
i I . J ~ Process1 I Process 2
15 ~
"'.'.~'. Process 3 BIBB Process 4
j r " "
"<~ ' "i
" \ . , . ,
1990 2000 2010 2020 2030 2040 Year
Figure 83.--Newsprint production in the United States by process.
Wood Product Use in Construction
Construction, and repair and alteration of houses, apartments and nonresidential structures use most of the structural lumber and structural panels that are produced (tables 95 and 98). There are many opportunities to im- prove construction practices to reduce the volume of wood used while maintaining the quantity and quality of construction (Row and Hagenstein 1988). There are also opportunities to expand wood use, such as use of wood in place of concrete in making residential hous- ing foundations.
Possible Changes in Technology
There are many ways to save wood in construction because most wood structures are built stronger than needed (NAHB Res. Foundation 1971). Although this has long been recognized, builders continue to rely on conservative practices that waste material. For example, 90% of exterior wall framing is spaced at 16-inch inter- vals (McKeever 1988) even though 24-inch spacing gives adequate strength for one-story homes and the top floor walls of multistory structures. Similarly, 91% of inte- rior walls space framing at 16-inch intervals. Even in roofs, where structurally efficient wood trusses are wide- ly used, 28% of roof framing is placed at 16-inch in- tervals.
Overdesign is partly a holdover of practices imposed by older technologies. Sixteen inch spacing probably stems from the time when walls were plastered over wooden lath. Tradesmen found it difficult to plaster on lath when studs were spaced more than 16 inches apart. In modern times, most walls are finished with plaster- board that easily spans 24 inches. Approximately 400 board feet of lumber could be saved in walls and parti- tions of a typical single-family home by converting to 24-inch spacing.
Where walls intersect to form corners, it is necessary to provide supports for finish wall sheeting. This has traditionally been done by using an additional stud at intersections. Three-stud corners could be replaced by
metal brackets that are available to support wallboard. In a typical home, the elimination of 3-stud corners could save about 100 board feet.
Overdesign extends to floors where bridging between joists and overlapping of joists on the center girder are common. But bridging adds nothing to the strength of a floor, and joints that are butted on the center girder instead of overlapped can be adequately held together by metal plates and plywood subflooring. Additional material could be saved by using 1-inch boards for header joists (at the end of the floor joists) instead of 2-inch stock. Shorter joists may be used with an "in- l ine" joist system where one joist is cantilevered (ex- tended) over the center girder and held to a second shorter "in-l ine" joist by a structural splice. Stress is reduced in the overhanging (extended) joist. Structurally sound floors have also been built using only 1-inch wide stock, but this reduces the nailing surface (Hanke 1986). A more practical approach is to continue to use 2-inch stock, but with narrower dimensions such as 2x8s in- stead of 2xl0s. The amount of lumber saved by using smaller joists, thinner headers, and butted joints is about 700 board feet in an average size home; but the nation- wide impact of such a change would be about half that savings per home since about half of new homes are built on a concrete slab and use no lumber for flooring.
Adoption of "opt imum value engineering" practices such as those listed above could save 10-15% of the dimension lumber required in a conventional house. Another way to economize on wood use in a building is to develop more efficient building materials. The metal plated wood roof truss is one example. Roof trusses transfer loads to exterior load bearing walls, eliminating outward thrust and the need for interior load bearing walls. Wood roof trusses are widely used in all construc- tion sectors in increasingly diverse shapes and config- urations. A high percentage of residential structures already use trusses; thus, increased savings due to ex- panded use in housing is limited.
A more recent wood saving product is the prefabri- cated wood I-joist. I-joist design recognizes that the most critical parts of a member are its top and bottom edges. Accordingly, most of the material is contained in the two flanges (the edges). The flanges are connected by a web of plywood or structural flake board. I-joists are usually used in floors where they replace traditional 2x10 and 2x12 joists, but they can be used for longer spans up to 40 feet. Because they are a fabricated product, they can be made in continuous lengths. They are also less like- ly to shrink and swell over time and thereby reduce the likelihood of squeaky floors. They are lighter and stronger than lumber, and precut holes in the web eas- ily accommodate piping and duct work. Web stiffeners are required at points where they support load bearing walls and lateral support is critical in many applications.
Another engineered product that saves wood is lami- nated veneer lumber (LVL). LVL is a solid structural product made from 1/10 or 1/8-inch thick veneers, laid together in parallel grain pattern, coated with waterproof adhesives which are cured by heat and pressure, with lengths ranging up to 80 feet. It is somewhat stronger
2 2 2

Engineered wood structural members are used frequently In nonresidential structures. (Credit: USDA Forest Products Laboratory)
and stiffer than lumber. LVL has been used for flanges of I-joists, headers and beams, concrete forms, scaffold planks and partition framework. It has found uses in prefabricated housing where its higher strength is better able to resist forces while house sections are moved.
Structural members are also being made from recon- stituted strands of wood. A product is being made by laminating long strands of wood with exterior adhesives and heat pressing into shapes similar to dimension lum- ber. Its properties and uses are similar to those for LVL.
Stressed skin panels, consisting typically of two outer layers of plywood or oriented strand board with foam insulation in the core, can reduce wood use in timber frame residential construction and construction of indus- trial and commercial buildings. In timber frame con- stmction and many industrial/commercial buildings, the loads are carried by a few key members. The interven- ing bays require only a nonload bearing wall. This means that the structural requirements on the wall are less than for walls in light frame construction. A conventional built-up system using 2x4s and foam sheathing results in overdesigned wall sections and inferior insulation. In contrast, stressed skin panels require less lumber and provide superior insulation performance. These panels
may be used in roofs as well as walls in industrial/com- mercial buildings.
Decay of wood in structures due to moisture is a seri- ous problem and an increasing concern since insulation in walls has increased which may lead to greater con- densation. Correcting this problem will hold down need for wood use in repair. Under winter conditions, humid- ity from the building enters into the framing cavities and condenses. This reduces the R value of the insulation, and promotes fungus growth, which leads to decay. Proper installation of polyethylene vapor retarders avoids the problem, but proper installation is difficult in practice because of the many breaks in the sheet to accommodate electrical outlets and the like. An alter- native system, called the Airtight Drywall Approach (ADA), uses gaskets between the framing and the interior drywall only (Lstiburek 1985). The vapor retarder is the painted drywall. The system is based on the idea that infiltration through gaps in the barrier, rather than the permeability of the barrier, is the chief cause of exces- sive vapor transmission. By closing off infiltration routes with gaskets, infiltration is decreased, and drywall is less likely to be inadvertently punctured during construction than a plastic barrier. Studies have shown that if air
2 2 3

vapor movement from the inside of the structure is controlled, moisture build-up in insulated walls is not severe enough to cause structural decay.
The rate of adoption of the wood saving techniques mentioned above will depend in part on the in-place costs of wood products and the resultant pressure to reduce wood cost and wood use.
Substitution Between Wood and N o n w o o d Materials
Wood use may decrease or increase in certain types of construction as its competitive position changes with respect to steel and concrete. In evaluating suitability for various types of construction, wood products are compared to steel and concrete in structural capability, fire resistance (in large structures), insulation, and cost.
The main structural property of concrete is its com- pressive strength. In addition, reinforced concrete pos- sesses good tensile strength. But these favorable properties are in excess of what is typically required in residential and smaller commercial structures. At over $100/cubic yard, this material is expensive for the re- quired performance levels in such structures. Moreover, other positive features of concrete, such as its fire insulat- ing capabilities and low sound transmission, become crucial factors only in large structures. The superior strength of concrete becomes economic only when it is fully utilized, e.g., in larger structures. Thus, no major displacement of wood by concrete is expected in most construction markets.
One area where concrete is used in light frame con- struction is for basement walls and footings because it is impervious to decay by soil organisms. Improper curing, however, may lead to basement walls that leak and opportunities to use treated wood products for foun- dations. A chemically treated but otherwise conven- tional stud and plywood wall may be placed over a coarse gravel footing. The key element is a drainage path through the gravel to a gravel bed under the floor where the water collects and is removed by a sump pump or is diverted by pipe to daylight. By not allowing moisture pressure to build up, leakage is eliminated, and the chemical treatment makes the structure durable and last- ing. Preserved wood foundations generally cost less than poured concrete and are slightly more economic than concrete block due to speed of installation (Spelter 1985a). But quality control requirements (use of gal- vanized steel nails, proper chemical treatment, proper installation technique, etc.) are strict and the system has not been as widely adopted as initially thought, although many homes in colder climates have been built with chemically treated wood foundations.
Like concrete, steel has superior strength properties compared to wood, and can cost less than wood in some cases. But the rate that heat is conducted through a 2x4 steel stud is about two and a half times that conducted through a wooden stud. Sound transmission through steel is also greater. These drawbacks cannot be over- come without incurring expenses that negate what in-
itial economic advantage may exist. Nevertheless, steel construction is more likely than concrete to displace wood, particularly in larger residential and mid-sized commercial structures. The degree of displacement will depend on relative changes in in-place wood and steel costs.
Projected Wood End-Use Rates in Construction
Projected wood use rates in this analysis take into ac- count the potential effects of technology developments mentioned above and the expected changing competi- tiv e position of wood materials compared to steel and concrete. The rate of change in use rates is driven by the economic pressure of changing in-place wood prices and changing in-place prices for steel and concrete. Higher prices for wood will increase adoption of wood saving practices and decrease the competitiveness of wood ver- sus steel and concrete in selected applications. Under the economic scenario portrayed in the base projections in Chapter 7, use of softwood lumber per square foot of floor area in residential construction declines by 24% between 1986 and 2040 (table 144). Total structural panel usage is more stable, however, because one con- sequence of more efficient lumber use is a need for thicker structural panels in walls, roofs and floors.
Wood needed per household for repair and alteration is projected to remain relatively constant for softwood lumber and plywood, but is expected to increase for oriented strand board and waferboard. Wood use per dol- lar of nonresidential construction is projected to remain stable for softwood lumber, and rises slowly for struc- tural panels as declines in use of softwood plywood are offset by increases for oriented strand board and wafer- board (table 145).
Table 144.--Single-family and multifamily average floor area and wood product use per square foot of floor, 1986, with projections to 2040.
Average Softwood Structural 1 Year floor area lumber panels
Sq. ft. 3/8- Square Bd. ft./ inch basis
feet sq. ft. per sq. ft.
Single-family housing
1986 1825 6.3 3.4 2000 1950 5.9 3.2 2010 1975 5.5 3.3 2020 1990 5.2 3.3 2030 2000 5.0 3.2 2040 2010 4.8 3.2
Multifamily housing
1986 956 4.2 2.6 2000 1065 4.0 2.5 2010 1080 3.9 2.5 2020 1090 3,7 2.5 2030 1100 3.6 2.5 2040 1100 3.6 2.5
1Softwood plywood and oriented strand board/waferboard.
2 2 4
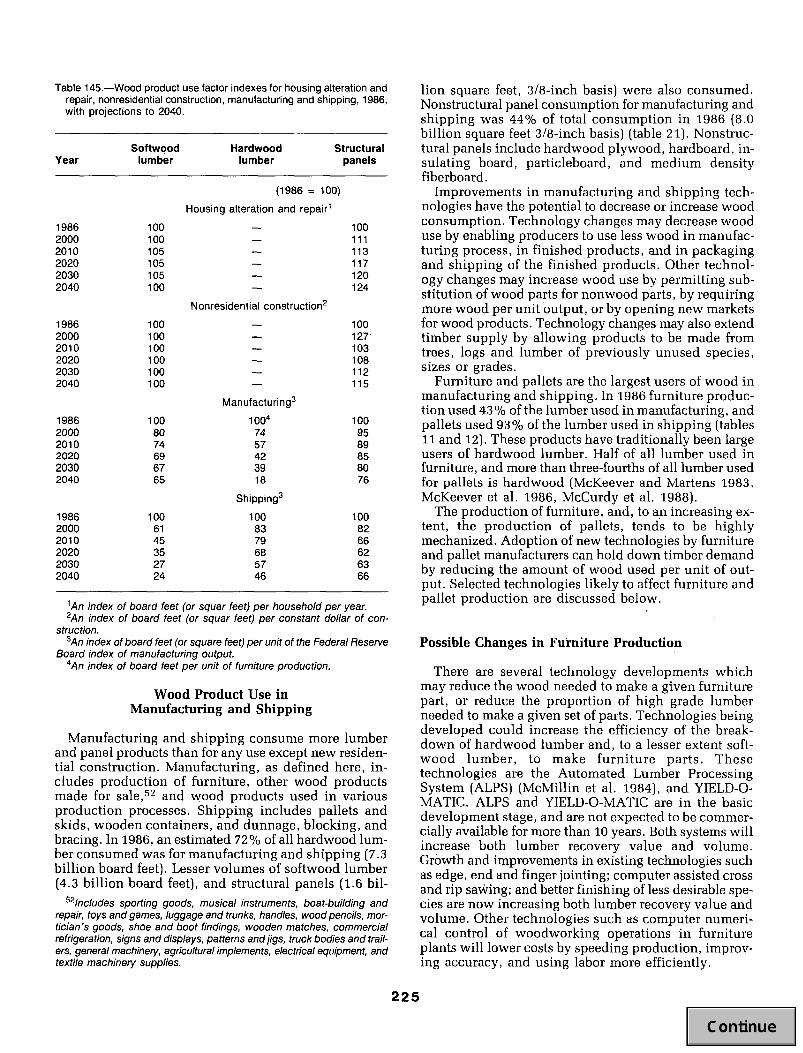
Table 145.--Wood product use factor indexes for housing alteration and repair, nonresidential construction, manufacturing and shipping, 1986, with projections to 2040.
Softwood Hardwood Structural Year lumber lumber panels
(1986 = 100)
Housing alteration and repair ~
1986 100 - - 100 2000 100 - - 111 2010 105 - - 113 2020 105 - - 117 2030 105 - - 120 2040 100 - - 124
Nonresidential construct ion 2
1986 100 - - 100 2000 100 - - 127' 2010 100 - - 103 2020 100 - - 108 2030 100 - - 112 2040 100 - - 115
Manufactur ing 3
1986 100 1004 100 2000 80 74 95 2010 74 57 89 2020 69 42 85 2030 67 39 80 2040 65 18 76
Shipping 3
1986 100 100 100 2000 61 83 82 2010 45 79 66 2020 35 68 62 2030 27 57 63 2040 24 46 66
1An index of board feet (or squar feet) per household per year. 2An index of board feet (or squar feet) per constant dollar of con-
struction. 3An index of board feet (or square feet) per unit of the Federal Reserve
Board index of manufacturing output. 4An index of board feet per unit of furniture production.
Wood Product Use in Manufacturing and Shipping
Manufacturing and shipping consume more lumber and panel products than for any use except new residen- tial construction. Manufacturing, as defined here, in- cludes production of furniture, other wood products made for sale, 52 and wood products used in various production processes. Shipping includes pallets and skids, wooden containers, and dunnage, blocking, and bracing. In 1986, an estimated 72% of all hardwood lum- ber consumed was for manufacturing and shipping (7.3 billion board feet). Lesser volumes of softwood lumber (4.3 billion board feet), and structural panels (1.6 bil-
~21ncludes sporting goods, musical instruments, boat-building and repair, toys and games, luggage and trunks, handles, wood pencils, mor- tician's goods, shoe and boot findings, wooden matches, commercial refrigeration, signs and displays, patterns and jigs, truck bodies and trail- ers, general machinery, agricultural implements, electrical equipment, and textile machinery suppfies.
lion square feet, 3/8-inch basis) were also consumed. Nonstructural panel consumption for manufacturing and shipping was 44% of total consumption in 1986 (8.0 billion square feet 3/8-inch basis) (table 21). Nonstruc- tural panels include hardwood plywood, hardboard, in- sulating board, particleboard, and medium density fiberboard.
Improvements in manufacturing and shipping tech- nologies have the potential to decrease or increase wood consumption. Technology changes may decrease wood use by enabling producers to use less wood in manufac- turing process, in finished products, and in packaging and shipping of the finished products. Other technol- ogy changes may increase wood use by permitting sub- stitution of wood parts for nonwood parts, by requiring more wood per unit output, or by opening new markets for wood products. Technology changes may also extend timber supply by allowing products to be made from trees, logs and lumber of previously unused species, sizes or grades.
Furniture and pallets are the largest users of wood in manufacturing and shipping. In 1986 furniture produc- tion used 43 % of the lumber used in manufacturing, and pallets used 93% of the lumber used in shipping (tables 11 and 12). These products have traditionally been large users of hardwood lumber. Half of all lumber used in furniture, and more than three-fourths of all lumber used for pallets is hardwood (McKeever and Martens 1983, McKeever et al. 1986, McCurdy et ah 1988).
The production of furniture, and, to an increasing ex- tent, the production of pallets, tends to be highly mechanized. Adoption of new technologies by furniture and pallet manufacturers can hold down timber demand by reducing the amount of wood used per unit of out- put. Selected technologies likely to affect furniture and pallet production are discussed below.
Possible Changes in Furniture Production
There are several technology developments which may reduce the wood needed to make a given furniture part, or reduce the proportion of high grade lumber needed to make a given set of parts. Technologies being developed could increase the efficiency of the break- down of hardwood lumber and, to a lesser extent soft- wood lumber, to make furni ture parts. These technologies are the Automated Lumber Processing System (ALPS) (McMillin et ah 1984), and YIELD-O- MATIC. ALPS and YIELD-O-MATIC are in the basic development stage, and are not expected to be commer- cially available for more than 10 years. Both systems will increase both lumber recovery value and volume. Growth and improvements in existing technologies such as edge, end and finger jointing; computer assisted cross and rip sawing; and better finishing of less desirable spe- cies are now increasing both lumber recovery value and volume. Other technologies such as computer numeri- cal control of woodworking operations in furniture plants will lower costs by speeding production, improv- ing accuracy, and using labor more efficiently.
2 2 5