table 1 trends in lifetime prevalence of use of various...
TRANSCRIPT

1991 1992 1993 1994 1995 1996 1997 1998 1999 2000 2001 2002 2003 2004 2005 2006 2007 2008 2009 2010 2011 2012 2013 2014 2015 2016 2017
8th Grade 18.7 20.6 22.5 25.7 28.5 31.2 29.4 29.0 28.3 26.8 26.8 24.5 22.8 21.5 21.4 20.9 19.0 19.6 19.9 21.4 20.1 18.5‡ 21.1 20.3 20.5 17.2 18.2 +1.0
10th Grade 30.6 29.8 32.8 37.4 40.9 45.4 47.3 44.9 46.2 45.6 45.6 44.6 41.4 39.8 38.2 36.1 35.6 34.1 36.0 37.0 37.7 36.8‡ 39.1 37.4 34.7 33.7 34.3 +0.7
12th Grade 44.1 40.7 42.9 45.6 48.4 50.8 54.3 54.1 54.7 54.0 53.9 53.0 51.1 51.1 50.4 48.2 46.8 47.4 46.7 48.2 49.9 49.1‡ 49.8 49.1 48.9 48.3 48.9 +0.6
Any Illicit Drug other
8th Grade 14.3 15.6 16.8 17.5 18.8 19.2 17.7 16.9 16.3 15.8‡ 17.0 13.7 13.6 12.2 12.1 12.2 11.1 11.2 10.4 10.6 9.8 8.7‡ 10.4 10.0 10.3 8.9 9.3 +0.4
10th Grade 19.1 19.2 20.9 21.7 24.3 25.5 25.0 23.6 24.0 23.1‡ 23.6 22.1 19.7 18.8 18.0 17.5 18.2 15.9 16.7 16.8 15.6 14.9‡ 16.4 15.9 14.6 14.0 13.7 -0.3
12th Grade 26.9 25.1 26.7 27.6 28.1 28.5 30.0 29.4 29.4 29.0‡ 30.7 29.5 27.7 28.7 27.4 26.9 25.5 24.9 24.0 24.7 24.9 24.1‡ 24.8 22.6 21.1 20.7 19.5 -1.2
including Inhalants a,c
8th Grade 28.5 29.6 32.3 35.1 38.1 39.4 38.1 37.8 37.2 35.1 34.5 31.6 30.3 30.2 30.0 29.2 27.7 28.3 27.9 28.6 26.4 25.1‡ 25.9 25.2 24.9 20.6 23.3 +2.7 s
10th Grade 36.1 36.2 38.7 42.7 45.9 49.8 50.9 49.3 49.9 49.3 48.8 47.7 44.9 43.1 42.1 40.1 39.8 38.7 40.0 40.6 40.8 40.0‡ 41.6 40.4 37.2 35.9 37.0 +1.1
12th Grade 47.6 44.4 46.6 49.1 51.5 53.5 56.3 56.1 56.3 57.0 56.0 54.6 52.8 53.0 53.5 51.2 49.1 49.3 48.4 49.9 51.8 50.3‡ 52.3 49.9 51.4 49.3 50.3 +1.1
8th Grade 10.2 11.2 12.6 16.7 19.9 23.1 22.6 22.2 22.0 20.3 20.4 19.2 17.5 16.3 16.5 15.7 14.2 14.6 15.7 17.3 16.4 15.2 16.5 15.6 15.5 12.8 13.5 +0.6
10th Grade 23.4 21.4 24.4 30.4 34.1 39.8 42.3 39.6 40.9 40.3 40.1 38.7 36.4 35.1 34.1 31.8 31.0 29.9 32.3 33.4 34.5 33.8 35.8 33.7 31.1 29.7 30.7 +1.0
12th Grade 36.7 32.6 35.3 38.2 41.7 44.9 49.6 49.1 49.7 48.8 49.0 47.8 46.1 45.7 44.8 42.3 41.8 42.6 42.0 43.8 45.5 45.2 45.5 44.4 44.7 44.5 45.0 +0.5
8th Grade 17.6 17.4 19.4 19.9 21.6 21.2 21.0 20.5 19.7 17.9 17.1 15.2 15.8 17.3 17.1 16.1 15.6 15.7 14.9 14.5 13.1 11.8 10.8 10.8 9.4 7.7 8.9 +1.2 s
10th Grade 15.7 16.6 17.5 18.0 19.0 19.3 18.3 18.3 17.0 16.6 15.2 13.5 12.7 12.4 13.1 13.3 13.6 12.8 12.3 12.0 10.1 9.9 8.7 8.7 7.2 6.6 6.1 -0.5
12th Grade 17.6 16.6 17.4 17.7 17.4 16.6 16.1 15.2 15.4 14.2 13.0 11.7 11.2 10.9 11.4 11.1 10.5 9.9 9.5 9.0 8.1 7.9 6.9 6.5 5.7 5.0 4.9 -0.2
8th Grade 3.2 3.8 3.9 4.3 5.2 5.9 5.4 4.9 4.8 4.6‡ 5.2 4.1 4.0 3.5 3.8 3.4 3.1 3.3 3.0 3.4 3.3 2.8 2.5 2.0 2.0 1.9 1.9 0.0
10th Grade 6.1 6.4 6.8 8.1 9.3 10.5 10.5 9.8 9.7 8.9‡ 8.9 7.8 6.9 6.4 5.8 6.1 6.4 5.5 6.1 6.1 6.0 5.2 5.4 5.0 4.6 4.4 4.2 -0.2
12th Grade 9.6 9.2 10.9 11.4 12.7 14.0 15.1 14.1 13.7 13.0‡ 14.7 12.0 10.6 9.7 8.8 8.3 8.4 8.7 7.4 8.6 8.3 7.5 7.6 6.3 6.4 6.7 6.7 0.0
TABLE 1Trends in Lifetime Prevalence of Use of Various Drugs
in Grades 8, 10, and 12(Entries are percentages.)
2016–
2017change
Any Illicit Drug a
than Marijuana a,b
Any Illicit Drug
Marijuana/Hashish
Inhalants c,d
Hallucinogens b,f
(Table continued on next page.)

1991 1992 1993 1994 1995 1996 1997 1998 1999 2000 2001 2002 2003 2004 2005 2006 2007 2008 2009 2010 2011 2012 2013 2014 2015 2016 2017
8th Grade 2.7 3.2 3.5 3.7 4.4 5.1 4.7 4.1 4.1 3.9 3.4 2.5 2.1 1.8 1.9 1.6 1.6 1.9 1.7 1.8 1.7 1.3 1.4 1.1 1.3 1.2 1.3 +0.1
10th Grade 5.6 5.8 6.2 7.2 8.4 9.4 9.5 8.5 8.5 7.6 6.3 5.0 3.5 2.8 2.5 2.7 3.0 2.6 3.0 3.0 2.8 2.6 2.7 2.6 3.0 3.2 3.0 -0.2
12th Grade 8.8 8.6 10.3 10.5 11.7 12.6 13.6 12.6 12.2 11.1 10.9 8.4 5.9 4.6 3.5 3.3 3.4 4.0 3.1 4.0 4.0 3.8 3.9 3.7 4.3 4.9 5.0 +0.1
8th Grade 1.4 1.7 1.7 2.2 2.5 3.0 2.6 2.5 2.4 2.3‡ 3.9 3.3 3.2 3.0 3.3 2.8 2.6 2.5 2.4 2.7 2.8 2.3 1.9 1.5 1.2 1.3 1.2 0.0
10th Grade 2.2 2.5 2.8 3.8 3.9 4.7 4.8 5.0 4.7 4.8‡ 6.6 6.3 5.9 5.8 5.2 5.5 5.7 4.8 5.4 5.3 5.2 4.5 4.4 4.1 3.3 3.1 2.9 -0.2
12th Grade 3.7 3.3 3.9 4.9 5.4 6.8 7.5 7.1 6.7 6.9‡ 10.4 9.2 9.0 8.7 8.1 7.8 7.7 7.8 6.8 7.7 7.3 6.6 6.4 5.1 4.8 4.7 4.8 +0.1
8th Grade, original — — — — — 3.4 3.2 2.7 2.7 4.3 5.2 4.3 3.2 2.8 2.8 2.5 2.3 2.4 2.2 3.3 2.6 2.0 1.8 1.4 — — — —
— — — — — — — — — — — — — — — — — — — — — — — 2.4 2.3 1.7 1.5 -0.1
10th Grade,original — — — — — 5.6 5.7 5.1 6.0 7.3 8.0 6.6 5.4 4.3 4.0 4.5 5.2 4.3 5.5 6.4 6.6 5.0 5.7 3.7 — — — —
— — — — — — — — — — — — — — — — — — — — — — — 5.2 3.8 2.8 2.8 0.0
12th Grade, original — — — — — 6.1 6.9 5.8 8.0 11.0 11.7 10.5 8.3 7.5 5.4 6.5 6.5 6.2 6.5 7.3 8.0 7.2 7.1 5.6 — — — —
— — — — — — — — — — — — — — — — — — — — — — — 7.9 5.9 4.9 4.9 0.0
8th Grade 2.3 2.9 2.9 3.6 4.2 4.5 4.4 4.6 4.7 4.5 4.3 3.6 3.6 3.4 3.7 3.4 3.1 3.0 2.6 2.6 2.2 1.9 1.7 1.8 1.6 1.4 1.3 -0.1
10th Grade 4.1 3.3 3.6 4.3 5.0 6.5 7.1 7.2 7.7 6.9 5.7 6.1 5.1 5.4 5.2 4.8 5.3 4.5 4.6 3.7 3.3 3.3 3.3 2.6 2.7 2.1 2.1 0.0
12th Grade 7.8 6.1 6.1 5.9 6.0 7.1 8.7 9.3 9.8 8.6 8.2 7.8 7.7 8.1 8.0 8.5 7.8 7.2 6.0 5.5 5.2 4.9 4.5 4.6 4.0 3.7 4.2 +0.5
8th Grade 1.3 1.6 1.7 2.4 2.7 2.9 2.7 3.2 3.1 3.1 3.0 2.5 2.5 2.4 2.4 2.3 2.1 2.0 1.7 1.5 1.5 1.0 1.2 1.2 1.0 0.9 0.8 -0.1
10th Grade 1.7 1.5 1.8 2.1 2.8 3.3 3.6 3.9 4.0 3.7 3.1 3.6 2.7 2.6 2.5 2.2 2.3 2.0 2.1 1.8 1.6 1.4 1.5 1.0 1.1 0.8 0.8 0.0
12th Grade 3.1 2.6 2.6 3.0 3.0 3.3 3.9 4.4 4.6 3.9 3.7 3.8 3.6 3.9 3.5 3.5 3.2 2.8 2.4 2.4 1.9 2.1 1.8 1.8 1.7 1.4 1.7 +0.3
Cocaine other than Crack h
8th Grade 2.0 2.4 2.4 3.0 3.4 3.8 3.5 3.7 3.8 3.5 3.3 2.8 2.7 2.6 2.9 2.7 2.6 2.4 2.1 2.1 1.8 1.6 1.4 1.4 1.3 1.1 1.0 -0.1
10th Grade 3.8 3.0 3.3 3.8 4.4 5.5 6.1 6.4 6.8 6.0 5.0 5.2 4.5 4.8 4.6 4.3 4.8 4.0 4.1 3.4 3.0 3.0 2.9 2.2 2.3 1.9 1.9 -0.1
12th Grade 7.0 5.3 5.4 5.2 5.1 6.4 8.2 8.4 8.8 7.7 7.4 7.0 6.7 7.3 7.1 7.9 6.8 6.5 5.3 5.1 4.9 4.4 4.2 4.1 3.4 3.3 3.5 +0.2
in Grades 8, 10, and 12
TABLE 1 (cont.)Trends in Lifetime Prevalence of Use of Various Drugs
Revised
(Entries are percentages.)
2016–
2017change
LSD b
Hallucinogens other than LSD b
Ecstasy (MDMA) g
Revised
Revised
Cocaine
Crack
(Table continued on next page.)

1991 1992 1993 1994 1995 1996 1997 1998 1999 2000 2001 2002 2003 2004 2005 2006 2007 2008 2009 2010 2011 2012 2013 2014 2015 2016 2017
8th Grade 1.2 1.4 1.4 2.0 2.3 2.4 2.1 2.3 2.3 1.9 1.7 1.6 1.6 1.6 1.5 1.4 1.3 1.4 1.3 1.3 1.2 0.8 1.0 0.9 0.5 0.5 0.7 +0.2
10th Grade 1.2 1.2 1.3 1.5 1.7 2.1 2.1 2.3 2.3 2.2 1.7 1.8 1.5 1.5 1.5 1.4 1.5 1.2 1.5 1.3 1.2 1.1 1.0 0.9 0.7 0.6 0.4 -0.2
12th Grade 0.9 1.2 1.1 1.2 1.6 1.8 2.1 2.0 2.0 2.4 1.8 1.7 1.5 1.5 1.5 1.4 1.5 1.3 1.2 1.6 1.4 1.1 1.0 1.0 0.8 0.7 0.7 0.0
8th Grade — — — — 1.5 1.6 1.3 1.4 1.6 1.1 1.2 1.0 1.0 1.1 1.0 1.0 0.9 0.9 0.9 0.9 0.8 0.6 0.6 0.8 0.3 0.3 0.4 +0.1
10th Grade — — — — 1.0 1.1 1.1 1.2 1.3 1.0 0.8 1.0 0.9 0.8 0.8 0.9 0.9 0.7 0.9 0.8 0.8 0.7 0.7 0.6 0.5 0.5 0.3 -0.2
12th Grade — — — — 0.7 0.8 0.9 0.8 0.9 0.8 0.7 0.8 0.7 0.7 0.9 0.8 0.7 0.7 0.6 1.1 0.9 0.7 0.7 0.8 0.6 0.5 0.4 0.0
8th Grade — — — — 1.5 1.6 1.4 1.5 1.4 1.3 1.1 1.0 1.1 1.0 0.9 0.9 0.7 0.9 0.8 0.7 0.7 0.5 0.5 0.4 0.3 0.4 0.5 +0.1
10th Grade — — — — 1.1 1.7 1.7 1.7 1.6 1.7 1.3 1.3 1.0 1.1 1.1 1.0 1.1 0.8 1.0 0.9 0.8 0.8 0.7 0.5 0.4 0.3 0.3 0.0
12th Grade — — — — 1.4 1.7 2.1 1.6 1.8 2.4 1.5 1.6 1.8 1.4 1.3 1.1 1.4 1.1 0.9 1.4 1.3 0.8 0.9 0.7 0.7 0.6 0.4 -0.2
8th Grade — — — — — — — — — — — — — — — — — — — — — — — — — — — —
10th Grade — — — — — — — — — — — — — — — — — — — — — — — — — — — —
12th Grade 6.6 6.1 6.4 6.6 7.2 8.2 9.7 9.8 10.2 10.6 9.9‡ 13.5 13.2 13.5 12.8 13.4 13.1 13.2 13.2 13.0 13.0 12.2 11.1 9.5 8.4 7.8 6.8 -1.0
8th Grade 10.5 10.8 11.8 12.3 13.1 13.5 12.3 11.3 10.7 9.9 10.2 8.7 8.4 7.5 7.4 7.3 6.5 6.8 6.0 5.7 5.2 4.5‡ 6.9 6.7 6.8 5.7 5.7 -0.1
10th Grade 13.2 13.1 14.9 15.1 17.4 17.7 17.0 16.0 15.7 15.7 16.0 14.9 13.1 11.9 11.1 11.2 11.1 9.0 10.3 10.6 9.0 8.9‡ 11.2 10.6 9.7 8.8 8.2 -0.6
12th Grade 15.4 13.9 15.1 15.7 15.3 15.3 16.5 16.4 16.3 15.6 16.2 16.8 14.4 15.0 13.1 12.4 11.4 10.5 9.9 11.1 12.2 12.0‡ 13.8 12.1 10.8 10.0 9.2 -0.8
Methamphetamine n,o
8th Grade — — — — — — — — 4.5 4.2 4.4 3.5 3.9 2.5 3.1 2.7 1.8 2.3 1.6 1.8 1.3 1.3 1.4 1.0 0.8 0.6 0.7 0.0
10th Grade — — — — — — — — 7.3 6.9 6.4 6.1 5.2 5.3 4.1 3.2 2.8 2.4 2.8 2.5 2.1 1.8 1.6 1.4 1.3 0.7 0.9 +0.2
12th Grade — — — — — — — — 8.2 7.9 6.9 6.7 6.2 6.2 4.5 4.4 3.0 2.8 2.4 2.3 2.1 1.7 1.5 1.9 1.0 1.2 1.1 -0.1
Heroin I,j
TABLE 1 (cont.)Trends in Lifetime Prevalence of Use of Various Drugs
in Grades 8, 10, and 12(Entries are percentages.)
2016–
2017change
With a Needle j
Without a Needle j
Narcotics other than Heroin k,l
Amphetamines k,m
(Table continued on next page.)

1991 1992 1993 1994 1995 1996 1997 1998 1999 2000 2001 2002 2003 2004 2005 2006 2007 2008 2009 2010 2011 2012 2013 2014 2015 2016 2017
8th Grade — — — — — — — — — — — — — — — — — — — — — — — — — — — —
10th Grade — — — — — — — — — — — — — — — — — — — — — — — — — — — —
12th Grade 3.3 2.9 3.1 3.4 3.9 4.4 4.4 5.3 4.8 4.0 4.1 4.7 3.9 4.0 4.0 3.4 3.4 2.8 2.1 1.8 2.1 1.7 2.0 1.3 1.2 1.4 1.5 +0.1
Sedatives (Barbiturates) k,p
8th Grade — — — — — — — — — — — — — — — — — — — — — — — — — — — —
10th Grade — — — — — — — — — — — — — — — — — — — — — — — — — — — —
12th Grade 6.2 5.5 6.3 7.0 7.4 7.6 8.1 8.7 8.9 9.2 8.7 9.5 8.8 9.9 10.5 10.2 9.3 8.5 8.2 7.5 7.0 6.9 7.5 6.8 5.9 5.2 4.5 -0.7
8th Grade 3.8 4.1 4.4 4.6 4.5 5.3 4.8 4.6 4.4 4.4‡ 5.0 4.3 4.4 4.0 4.1 4.3 3.9 3.9 3.9 4.4 3.4 3.0 2.9 2.9 3.0 3.0 3.4 +0.4
10th Grade 5.8 5.9 5.7 5.4 6.0 7.1 7.3 7.8 7.9 8.0‡ 9.2 8.8 7.8 7.3 7.1 7.2 7.4 6.8 7.0 7.3 6.8 6.3 5.5 5.8 5.8 6.1 6.0 0.0
12th Grade 7.2 6.0 6.4 6.6 7.1 7.2 7.8 8.5 9.3 8.9‡ 10.3 11.4 10.2 10.6 9.9 10.3 9.5 8.9 9.3 8.5 8.7 8.5 7.7 7.4 6.9 7.6 7.5 -0.1
Any Prescription Drug q
8th Grade — — — — — — — — — — — — — — — — — — — — — — — — — — — —
10th Grade — — — — — — — — — — — — — — — — — — — — — — — — — — — —
12th Grade — — — — — — — — — — — — — — 24.0 23.9 22.2 21.5 20.9 21.6 21.7 21.2‡ 22.2 19.9 18.3 18.0 16.5 -1.6
8th Grade — — — — — 1.5 1.1 1.4 1.3 1.0 1.1 0.8 1.0 1.0 1.1 1.0 1.0 0.7 0.7 0.9 2.0 1.0 0.7 0.6 0.8 0.9 0.6 -0.3
10th Grade — — — — — 1.5 1.7 2.0 1.8 1.3 1.5 1.3 1.0 1.2 1.0 0.8 1.3 0.9 0.7 1.4 1.2 0.8 1.1 1.0 0.5 1.0 0.7 -0.3
12th Grade — — — — — 1.2 1.8 3.0 2.0 1.5 1.7 — — — — — — — — — — — — — — — — —
8th Grade 70.1 69.3‡ 55.7 55.8 54.5 55.3 53.8 52.5 52.1 51.7 50.5 47.0 45.6 43.9 41.0 40.5 38.9 38.9 36.6 35.8 33.1 29.5 27.8 26.8 26.1 22.8 23.1 +0.3
10th Grade 83.8 82.3‡ 71.6 71.1 70.5 71.8 72.0 69.8 70.6 71.4 70.1 66.9 66.0 64.2 63.2 61.5 61.7 58.3 59.1 58.2 56.0 54.0 52.1 49.3 47.1 43.4 42.2 -1.2
12th Grade 88.0 87.5‡ 80.0 80.4 80.7 79.2 81.7 81.4 80.0 80.3 79.7 78.4 76.6 76.8 75.1 72.7 72.2 71.9 72.3 71.0 70.0 69.4 68.2 66.0 64.0 61.2 61.5 +0.3
2017
TABLE 1 (cont.)Trends in Lifetime Prevalence of Use of Various Drugs
in Grades 8, 10, and 12(Entries are percentages.)
2016–
change
Crystal Methamphetamine (Ice) o
Tranquilizers b,k
Rohypnol r
Alcohol s
Any Use
(Table continued on next page.)

1991 1992 1993 1994 1995 1996 1997 1998 1999 2000 2001 2002 2003 2004 2005 2006 2007 2008 2009 2010 2011 2012 2013 2014 2015 2016 2017
8th Grade 26.7 26.8 26.4 25.9 25.3 26.8 25.2 24.8 24.8 25.1 23.4 21.3 20.3 19.9 19.5 19.5 17.9 18.0 17.4 16.3 14.8 12.8 12.2 10.8 10.9 8.6 9.2 +0.6
10th Grade 50.0 47.7 47.9 47.2 46.9 48.5 49.4 46.7 48.9 49.3 48.2 44.0 42.4 42.3 42.1 41.4 41.2 37.2 38.6 36.9 35.9 34.6 33.5 30.2 28.6 26.0 25.1 -1.0
12th Grade 65.4 63.4 62.5 62.9 63.2 61.8 64.2 62.4 62.3 62.3 63.9 61.6 58.1 60.3 57.5 56.4 55.1 54.7 56.5 54.1 51.0 54.2 52.3 49.8 46.7 46.3 45.3 -0.9
Beverages e,n
8th Grade — — — — — — — — — — — — — 37.9 35.5 35.5 34.0 32.8 29.4 30.0 27.0 23.5 21.9 19.2 19.3 16.3 16.0 -0.3
10th Grade — — — — — — — — — — — — — 58.6 58.8 58.1 55.7 53.5 51.4 51.3 48.4 46.7 44.9 42.3 38.7 33.3 34.8 +1.5
12th Grade — — — — — — — — — — — — — 71.0 73.6 69.9 68.4 65.5 67.4 62.6 62.4 60.5 58.9 57.5 55.6 53.6 51.2 -2.4
8th Grade 44.0 45.2 45.3 46.1 46.4 49.2 47.3 45.7 44.1 40.5 36.6 31.4 28.4 27.9 25.9 24.6 22.1 20.5 20.1 20.0 18.4 15.5 14.8 13.5 13.3 9.8 9.4 -0.4
10th Grade 55.1 53.5 56.3 56.9 57.6 61.2 60.2 57.7 57.6 55.1 52.8 47.4 43.0 40.7 38.9 36.1 34.6 31.7 32.7 33.0 30.4 27.7 25.7 22.6 19.9 17.5 15.9 -1.6
12th Grade 63.1 61.8 61.9 62.0 64.2 63.5 65.4 65.3 64.6 62.5 61.0 57.2 53.7 52.8 50.0 47.1 46.2 44.7 43.6 42.2 40.0 39.5 38.1 34.4 31.1 28.3 26.6 -1.7
Smokeless Tobacco t
8th Grade 22.2 20.7 18.7 19.9 20.0 20.4 16.8 15.0 14.4 12.8 11.7 11.2 11.3 11.0 10.1 10.2 9.1 9.8 9.6 9.9 9.7 8.1 7.9 8.0 8.6 6.9 6.2 -0.7
10th Grade 28.2 26.6 28.1 29.2 27.6 27.4 26.3 22.7 20.4 19.1 19.5 16.9 14.6 13.8 14.5 15.0 15.1 12.2 15.2 16.8 15.6 15.4 14.0 13.6 12.3 10.2 9.1 -1.0
12th Grade — 32.4 31.0 30.7 30.9 29.8 25.3 26.2 23.4 23.1 19.7 18.3 17.0 16.7 17.5 15.2 15.1 15.6 16.3 17.6 16.9 17.4 17.2 15.1 13.2 14.2 11.0 -3.2 s
Any Vapingbb
8th Grade — — — — — — — — — — — — — — — — — — — — — — — — 21.7 17.5‡ 18.5 —
10th Grade — — — — — — — — — — — — — — — — — — — — — — — — 32.8 29.0‡ 30.9 —
12th Grade — — — — — — — — — — — — — — — — — — — — — — — — 35.5 33.8‡ 35.8 —
8th Grade — — — — — — — — — — — — — — — — — — — — — — — — — — 10.6 —
10th Grade — — — — — — — — — — — — — — — — — — — — — — — — — — 21.4 —
12th Grade — — — — — — — — — — — — — — — — — — — — — — — — — — 25.0 —
2016–
TABLE 1 (cont.)Trends in Lifetime Prevalence of Use of Various Drugs
in Grades 8, 10, and 12(Entries are percentages.)
2017change
Been Drunk o
Flavored Alcoholic
Cigarettes
Any Use
Vaping Nicotinebb
(Table continued on next page.)

1991 1992 1993 1994 1995 1996 1997 1998 1999 2000 2001 2002 2003 2004 2005 2006 2007 2008 2009 2010 2011 2012 2013 2014 2015 2016 2017
8th Grade — — — — — — — — — — — — — — — — — — — — — — — — — — 4.0 —
10th Grade — — — — — — — — — — — — — — — — — — — — — — — — — — 9.8 —
12th Grade — — — — — — — — — — — — — — — — — — — — — — — — — — 11.9 —
8th Grade — — — — — — — — — — — — — — — — — — — — — — — — — — 17.0 —
10th Grade — — — — — — — — — — — — — — — — — — — — — — — — — — 27.5 —
12th Grade — — — — — — — — — — — — — — — — — — — — — — — — — — 30.7 —
8th Grade 1.9 1.7 1.6 2.0 2.0 1.8 1.8 2.3 2.7 3.0 2.8 2.5 2.5 1.9 1.7 1.6 1.5 1.4 1.3 1.1 1.2 1.2 1.1 1.0 1.0 0.9 1.1 +0.1
10th Grade 1.8 1.7 1.7 1.8 2.0 1.8 2.0 2.0 2.7 3.5 3.5 3.5 3.0 2.4 2.0 1.8 1.8 1.4 1.3 1.6 1.4 1.3 1.3 1.4 1.2 1.3 1.1 -0.2
12th Grade 2.1 2.1 2.0 2.4 2.3 1.9 2.4 2.7 2.9 2.5 3.7 4.0 3.5 3.4 2.6 2.7 2.2 2.2 2.2 2.0 1.8 1.8 2.1 1.9 2.3 1.6 1.6 0.0
Previously surveyed drugs that have been dropped.
8th Grade — — — — — — — — — — — — — — — — — — — — — — — — — — — —
10th Grade — — — — — — — — — — — — — — — — — — — — — — — — — — — —
12th Grade 1.6 1.5 1.4 1.7 1.5 1.8 2.0 2.7 1.7 0.8 1.9 1.5 1.6 1.3 1.1 1.2 1.2 0.6 1.1 — — — — — — — — —
8th Grade — — — — — — — — — — — — — — — — — — — — — — — — — — — —
10th Grade — — — — — — — — — — — — — — — — — — — — — — — — — — — —
12th Grade 2.9 2.4 2.9 2.8 2.7 4.0 3.9 3.9 3.4 3.4 3.5 3.1 2.5 1.6 2.4 2.2 2.1 1.8 1.7 1.8 2.3 1.6 1.3 — — — — —
8th Grade — — — — — — — — — — — — — — — — — — — — — — — — — — — —
10th Grade — — — — — — — — — — — — — — — — — — — — — — — — — — — —
12th Grade 1.3 1.6 0.8 1.4 1.2 2.0 1.7 1.6 1.8 0.8 1.1 1.5 1.0 1.3 1.3 1.2 1.0 0.8 0.7 0.4 0.6 0.8 — — — — — —
Source. The Monitoring the Future study, the University of Michigan.
Note: See footnotes following Table 4.
(Entries are percentages.)
TABLE 1 (cont.)Trends in Lifetime Prevalence of Use of Various Drugs
in Grades 8, 10, and 12
Methaqualone e,k
2016–
2017change
Nitrites e
PCP e
Steroids k,u
Vaping Marijuanabb
Vaping Just Flavoringbb

1991 1992 1993 1994 1995 1996 1997 1998 1999 2000 2001 2002 2003 2004 2005 2006 2007 2008 2009 2010 2011 2012 2013 2014 2015 2016 2017
8th Grade 11.3 12.9 15.1 18.5 21.4 23.6 22.1 21.0 20.5 19.5 19.5 17.7 16.1 15.2 15.5 14.8 13.2 14.1 14.5 16.0 14.7 13.4‡ 15.2 14.6 14.8 12.0 12.9 +0.9
10th Grade 21.4 20.4 24.7 30.0 33.3 37.5 38.5 35.0 35.9 36.4 37.2 34.8 32.0 31.1 29.8 28.7 28.1 26.9 29.4 30.2 31.1 30.1‡ 32.1 29.9 27.9 26.8 27.8 +1.0
12th Grade 29.4 27.1 31.0 35.8 39.0 40.2 42.4 41.4 42.1 40.9 41.4 41.0 39.3 38.8 38.4 36.5 35.9 36.6 36.5 38.3 40.0 39.7‡ 40.1 38.7 38.6 38.3 39.9 +1.6
8th Grade 8.4 9.3 10.4 11.3 12.6 13.1 11.8 11.0 10.5 10.2‡ 10.8 8.8 8.8 7.9 8.1 7.7 7.0 7.4 7.0 7.1 6.4 5.5‡ 6.3 6.4 6.3 5.4 5.8 +0.3
10th Grade 12.2 12.3 13.9 15.2 17.5 18.4 18.2 16.6 16.7 16.7‡ 17.9 15.7 13.8 13.5 12.9 12.7 13.1 11.3 12.2 12.1 11.2 10.8‡ 11.2 11.2 10.5 9.8 9.4 -0.4
12th Grade 16.2 14.9 17.1 18.0 19.4 19.8 20.7 20.2 20.7 20.4‡ 21.6 20.9 19.8 20.5 19.7 19.2 18.5 18.3 17.0 17.3 17.6 17.0‡ 17.8 15.9 15.2 14.3 13.3 -1.0
including Inhalants a,c
8th Grade 16.7 18.2 21.1 24.2 27.1 28.7 27.2 26.2 25.3 24.0 23.9 21.4 20.4 20.2 20.4 19.7 18.0 19.0 18.8 20.3 18.2 17.0‡ 17.6 16.8 17.0 13.5 15.8 +2.3 ss
10th Grade 23.9 23.5 27.4 32.5 35.6 39.6 40.3 37.1 37.7 38.0 38.7 36.1 33.5 32.9 31.7 30.7 30.2 28.8 31.2 31.8 32.5 31.5‡ 33.2 31.0 28.9 27.7 29.1 +1.4
12th Grade 31.2 28.8 32.5 37.6 40.2 41.9 43.3 42.4 42.8 42.5 42.6 42.1 40.5 39.1 40.3 38.0 37.0 37.3 37.6 39.2 41.5 40.2‡ 42.3 39.2 40.2 38.7 41.2 +2.5
8th Grade 6.2 7.2 9.2 13.0 15.8 18.3 17.7 16.9 16.5 15.6 15.4 14.6 12.8 11.8 12.2 11.7 10.3 10.9 11.8 13.7 12.5 11.4 12.7 11.7 11.8 9.4 10.1 +0.8
10th Grade 16.5 15.2 19.2 25.2 28.7 33.6 34.8 31.1 32.1 32.2 32.7 30.3 28.2 27.5 26.6 25.2 24.6 23.9 26.7 27.5 28.8 28.0 29.8 27.3 25.4 23.9 25.5 +1.6
12th Grade 23.9 21.9 26.0 30.7 34.7 35.8 38.5 37.5 37.8 36.5 37.0 36.2 34.9 34.3 33.6 31.5 31.7 32.4 32.8 34.8 36.4 36.4 36.4 35.1 34.9 35.6 37.1 +1.5
Synthetic Marijuana n,o
8th Grade — — — — — — — — — — — — — — — — — — — — — 4.4 4.0 3.3 3.1 2.7 2.0 -0.7 s
10th Grade — — — — — — — — — — — — — — — — — — — — — 8.8 7.4 5.4 4.3 3.3 2.7 -0.6
12th Grade — — — — — — — — — — — — — — — — — — — — 11.4 11.3 7.9 5.8 5.2 3.5 3.7 +0.2
8th Grade 9.0 9.5 11.0 11.7 12.8 12.2 11.8 11.1 10.3 9.4 9.1 7.7 8.7 9.6 9.5 9.1 8.3 8.9 8.1 8.1 7.0 6.2 5.2 5.3 4.6 3.8 4.7 +0.9 s
10th Grade 7.1 7.5 8.4 9.1 9.6 9.5 8.7 8.0 7.2 7.3 6.6 5.8 5.4 5.9 6.0 6.5 6.6 5.9 6.1 5.7 4.5 4.1 3.5 3.3 2.9 2.4 2.3 -0.1
12th Grade 6.6 6.2 7.0 7.7 8.0 7.6 6.7 6.2 5.6 5.9 4.5 4.5 3.9 4.2 5.0 4.5 3.7 3.8 3.4 3.6 3.2 2.9 2.5 1.9 1.9 1.7 1.5 -0.1
2017change
Any Illicit Drug a
Any Illicit Drug other than Marijuana a,b
Any Illicit Drug
TABLE 2Trends in Annual Prevalence of Use of Various Drugs
in Grades 8, 10, and 12(Entries are percentages.)
2016–
Marijuana/Hashish
Inhalants c,d
(Table continued on next page.)

1991 1992 1993 1994 1995 1996 1997 1998 1999 2000 2001 2002 2003 2004 2005 2006 2007 2008 2009 2010 2011 2012 2013 2014 2015 2016 2017
8th Grade 1.9 2.5 2.6 2.7 3.6 4.1 3.7 3.4 2.9 2.8‡ 3.4 2.6 2.6 2.2 2.4 2.1 1.9 2.1 1.9 2.2 2.2 1.6 1.6 1.3 1.3 1.2 1.1 -0.1
10th Grade 4.0 4.3 4.7 5.8 7.2 7.8 7.6 6.9 6.9 6.1‡ 6.2 4.7 4.1 4.1 4.0 4.1 4.4 3.9 4.1 4.2 4.1 3.5 3.4 3.3 3.1 2.9 2.8 -0.1
12th Grade 5.8 5.9 7.4 7.6 9.3 10.1 9.8 9.0 9.4 8.1‡ 9.1 6.6 5.9 6.2 5.5 4.9 5.4 5.9 4.7 5.5 5.2 4.8 4.5 4.0 4.2 4.3 4.4 +0.1
8th Grade 1.7 2.1 2.3 2.4 3.2 3.5 3.2 2.8 2.4 2.4 2.2 1.5 1.3 1.1 1.2 0.9 1.1 1.3 1.1 1.2 1.1 0.8 1.0 0.7 0.9 0.8 0.9 +0.1
10th Grade 3.7 4.0 4.2 5.2 6.5 6.9 6.7 5.9 6.0 5.1 4.1 2.6 1.7 1.6 1.5 1.7 1.9 1.8 1.9 1.9 1.8 1.7 1.7 1.9 2.0 2.1 2.1 -0.1
12th Grade 5.2 5.6 6.8 6.9 8.4 8.8 8.4 7.6 8.1 6.6 6.6 3.5 1.9 2.2 1.8 1.7 2.1 2.7 1.9 2.6 2.7 2.4 2.2 2.5 2.9 3.0 3.3 +0.3
8th Grade 0.7 1.1 1.0 1.3 1.7 2.0 1.8 1.6 1.5 1.4‡ 2.4 2.1 2.1 1.9 2.0 1.8 1.6 1.6 1.5 1.8 1.8 1.3 1.2 1.0 0.8 0.8 0.7 -0.1
10th Grade 1.3 1.4 1.9 2.4 2.8 3.3 3.3 3.4 3.2 3.1‡ 4.3 4.0 3.6 3.7 3.5 3.7 3.8 3.3 3.5 3.5 3.5 3.0 2.7 2.6 1.9 2.0 1.8 -0.2
12th Grade 2.0 1.7 2.2 3.1 3.8 4.4 4.6 4.6 4.3 4.4‡ 5.9 5.4 5.4 5.6 5.0 4.6 4.8 5.0 4.2 4.8 4.3 4.0 3.7 3.0 2.9 2.7 2.9 +0.2
8th Grade — — — — — — — — — — — — — — — — — — — — — — — — — — — —
10th Grade — — — — — — — — — — — — — — — — — — — — — — — — — — — —
12th Grade 1.4 1.4 1.4 1.6 1.8 2.6 2.3 2.1 1.8 2.3 1.8 1.1 1.3 0.7 1.3 0.7 0.9 1.1 1.0 1.0 1.3 0.9 0.7 0.8 1.4 1.3 1.0 -0.3
8th Grade, original — — — — 2.3 2.3 1.8 1.7 3.1 3.5 2.9 2.1 1.7 1.7 1.4 1.5 1.7 1.3 2.4 1.7 1.1 1.1 0.9 — — — —
Revised — — — — — — — — — — — — — — — — — — — — — — 1.5 1.4 1.0 0.9 -0.1
10th Grade,original — — — — 4.6 3.9 3.3 4.4 5.4 6.2 4.9 3.0 2.4 2.6 2.8 3.5 2.9 3.7 4.7 4.5 3.0 3.6 2.3 — — — —
Revised — — — — — — — — — — — — — — — — — — — — — — 3.8 2.4 1.8 1.7 -0.0
12th Grade, original — — — — 4.6 4.0 3.6 5.6 8.2 9.2 7.4 4.5 4.0 3.0 4.1 4.5 4.3 4.3 4.5 5.3 3.8 4.0 3.6 — — — —
Revised — — — — — — — — — — — — — — — — — — — — — — 5.0 3.6 2.7 2.6 -0.1
8th Grade — — — — — — — — — — — — — — — — — — — 1.7 1.6 1.4 1.2 0.6 0.7 0.9 0.4 -0.6 s
10th Grade — — — — — — — — — — — — — — — — — — — 3.7 3.9 2.5 2.3 1.8 1.2 0.9 0.9 0.0
12th Grade — — — — — — — — — — — — — — — — — — 5.7 5.5 5.9 4.4 3.4 1.8 1.9 1.8 1.5 -0.2
(Entries are percentages.)
2016–
2017change
Hallucinogens b,f
TABLE 2 (cont.)Trends in Annual Prevalence of Use of Various Drugs
in Grades 8, 10, and 12
(Table continued on next page.)
LSD b
Hallucinogens other than LSD b
PCP e
Ecstasy (MDMA) g
Salvia n,o

1991 1992 1993 1994 1995 1996 1997 1998 1999 2000 2001 2002 2003 2004 2005 2006 2007 2008 2009 2010 2011 2012 2013 2014 2015 2016 2017
8th Grade 1.1 1.5 1.7 2.1 2.6 3.0 2.8 3.1 2.7 2.6 2.5 2.3 2.2 2.0 2.2 2.0 2.0 1.8 1.6 1.6 1.4 1.2 1.0 1.0 0.9 0.8 0.8 0.0
10th Grade 2.2 1.9 2.1 2.8 3.5 4.2 4.7 4.7 4.9 4.4 3.6 4.0 3.3 3.7 3.5 3.2 3.4 3.0 2.7 2.2 1.9 2.0 1.9 1.5 1.8 1.3 1.4 +0.1
12th Grade 3.5 3.1 3.3 3.6 4.0 4.9 5.5 5.7 6.2 5.0 4.8 5.0 4.8 5.3 5.1 5.7 5.2 4.4 3.4 2.9 2.9 2.7 2.6 2.6 2.5 2.3 2.7 +0.5
8th Grade 0.7 0.9 1.0 1.3 1.6 1.8 1.7 2.1 1.8 1.8 1.7 1.6 1.6 1.3 1.4 1.3 1.3 1.1 1.1 1.0 0.9 0.6 0.6 0.7 0.5 0.5 0.5 0.0
10th Grade 0.9 0.9 1.1 1.4 1.8 2.1 2.2 2.5 2.4 2.2 1.8 2.3 1.6 1.7 1.7 1.3 1.3 1.3 1.2 1.0 0.9 0.8 0.8 0.5 0.7 0.4 0.6 +0.2
12th Grade 1.5 1.5 1.5 1.9 2.1 2.1 2.4 2.5 2.7 2.2 2.1 2.3 2.2 2.3 1.9 2.1 1.9 1.6 1.3 1.4 1.0 1.2 1.1 1.1 1.1 0.8 1.0 +0.2
Cocaine other than Crack h
8th Grade 1.0 1.2 1.3 1.7 2.1 2.5 2.2 2.4 2.3 1.9 1.9 1.8 1.6 1.6 1.7 1.6 1.5 1.4 1.3 1.3 1.1 1.0 0.8 0.8 0.8 0.6 0.6 0.0
10th Grade 2.1 1.7 1.8 2.4 3.0 3.5 4.1 4.0 4.4 3.8 3.0 3.4 2.8 3.3 3.0 2.9 3.1 2.6 2.3 1.9 1.7 1.8 1.6 1.3 1.5 1.1 1.2 +0.1
12th Grade 3.2 2.6 2.9 3.0 3.4 4.2 5.0 4.9 5.8 4.5 4.4 4.4 4.2 4.7 4.5 5.2 4.5 4.0 3.0 2.6 2.6 2.4 2.4 2.4 2.1 2.0 2.3 +0.3
8th Grade 0.7 0.7 0.7 1.2 1.4 1.6 1.3 1.3 1.4 1.1 1.0 0.9 0.9 1.0 0.8 0.8 0.8 0.9 0.7 0.8 0.7 0.5 0.5 0.5 0.3 0.3 0.3 +0.1
10th Grade 0.5 0.6 0.7 0.9 1.1 1.2 1.4 1.4 1.4 1.4 0.9 1.1 0.7 0.9 0.9 0.9 0.8 0.8 0.9 0.8 0.8 0.6 0.6 0.5 0.5 0.3 0.2 -0.1
12th Grade 0.4 0.6 0.5 0.6 1.1 1.0 1.2 1.0 1.1 1.5 0.9 1.0 0.8 0.9 0.8 0.8 0.9 0.7 0.7 0.9 0.8 0.6 0.6 0.6 0.5 0.3 0.4 +0.1
8th Grade — — — — 0.9 1.0 0.8 0.8 0.9 0.6 0.7 0.6 0.6 0.7 0.6 0.5 0.6 0.5 0.5 0.6 0.5 0.4 0.3 0.4 0.2 0.2 0.2 0.0
10th Grade — — — — 0.6 0.7 0.7 0.8 0.6 0.5 0.4 0.6 0.5 0.5 0.5 0.5 0.5 0.5 0.6 0.5 0.5 0.4 0.5 0.4 0.2 0.3 0.2 -0.1
12th Grade — — — — 0.5 0.5 0.5 0.4 0.4 0.4 0.3 0.4 0.4 0.4 0.5 0.5 0.4 0.4 0.3 0.7 0.6 0.4 0.4 0.5 0.3 0.3 0.2 0.0
8th Grade — — — — 0.8 1.0 0.8 0.8 0.9 0.7 0.6 0.6 0.6 0.6 0.5 0.5 0.5 0.6 0.4 0.5 0.4 0.3 0.3 0.2 0.2 0.2 0.3 +0.1
10th Grade — — — — 0.8 0.9 1.1 1.0 1.1 1.1 0.7 0.8 0.5 0.7 0.7 0.6 0.6 0.6 0.6 0.6 0.5 0.4 0.4 0.3 0.3 0.2 0.1 0.0
12th Grade — — — — 1.0 1.0 1.2 0.8 1.0 1.6 0.8 0.8 0.8 0.7 0.8 0.6 1.0 0.5 0.6 0.8 0.7 0.4 0.4 0.5 0.4 0.3 0.2 -0.1
TABLE 2 (cont.)Trends in Annual Prevalence of Use of Various Drugs
in Grades 8, 10, and 12(Entries are percentages.)
2016–
Without a Needle j
(Table continued on next page.)
2017change
Cocaine
Crack
Heroin I,j
With a Needle j

1991 1992 1993 1994 1995 1996 1997 1998 1999 2000 2001 2002 2003 2004 2005 2006 2007 2008 2009 2010 2011 2012 2013 2014 2015 2016 2017
8th Grade — — — — — — — — — — — — — — — — — — — — — — — — — — — —
10th Grade — — — — — — — — — — — — — — — — — — — — — — — — — — — —
12th Grade 3.5 3.3 3.6 3.8 4.7 5.4 6.2 6.3 6.7 7.0 6.7‡ 9.4 9.3 9.5 9.0 9.0 9.2 9.1 9.2 8.7 8.7 7.9 7.1 6.1 5.4 4.8 4.2 -0.5
8th Grade — — — — — — — — — — — 1.3 1.7 1.7 1.8 2.6 1.8 2.1 2.0 2.1 1.8 1.6 2.0 1.0 0.8 0.9 0.8 -0.1
10th Grade — — — — — — — — — — — 3.0 3.6 3.5 3.2 3.8 3.9 3.6 5.1 4.6 3.9 3.0 3.4 3.0 2.6 2.1 2.2 +0.1
12th Grade — — — — — — — — — — — 4.0 4.5 5.0 5.5 4.3 5.2 4.7 4.9 5.1 4.9 4.3 3.6 3.3 3.7 3.4 2.7 -0.7
8th Grade — — — — — — — — — — — 2.5 2.8 2.5 2.6 3.0 2.7 2.9 2.5 2.7 2.1 1.3 1.4 1.0 0.9 0.8 0.7 -0.2
10th Grade — — — — — — — — — — — 6.9 7.2 6.2 5.9 7.0 7.2 6.7 8.1 7.7 5.9 4.4 4.6 3.4 2.5 1.7 1.5 -0.3
12th Grade — — — — — — — — — — — 9.6 10.5 9.3 9.5 9.7 9.6 9.7 9.7 8.0 8.1 7.5 5.3 4.8 4.4 2.9 2.0 -1.0 ss
8th Grade 6.2 6.5 7.2 7.9 8.7 9.1 8.1 7.2 6.9 6.5 6.7 5.5 5.5 4.9 4.9 4.7 4.2 4.5 4.1 3.9 3.5 2.9‡ 4.2 4.3 4.1 3.5 3.5 0.0
10th Grade 8.2 8.2 9.6 10.2 11.9 12.4 12.1 10.7 10.4 11.1 11.7 10.7 9.0 8.5 7.8 7.9 8.0 6.4 7.1 7.6 6.6 6.5‡ 7.9 7.6 6.8 6.1 5.6 -0.5
12th Grade 8.2 7.1 8.4 9.4 9.3 9.5 10.2 10.1 10.2 10.5 10.9 11.1 9.9 10.0 8.6 8.1 7.5 6.8 6.6 7.4 8.2 7.9‡ 9.2 8.1 7.7 6.7 5.9 -0.8
Ritalin k,n,o
8th Grade — — — — — — — — — — 2.9 2.8 2.6 2.5 2.4 2.6 2.1 1.6 1.8 1.5 1.3 0.7 1.1 0.9 0.6 0.8 0.4 -0.4 s
10th Grade — — — — — — — — — — 4.8 4.8 4.1 3.4 3.4 3.6 2.8 2.9 3.6 2.7 2.6 1.9 1.8 1.8 1.6 1.2 0.8 -0.4
12th Grade — — — — — — — — — — 5.1 4.0 4.0 5.1 4.4 4.4 3.8 3.4 2.1 2.7 2.6 2.6 2.3 1.8 2.0 1.2 1.3 +0.1
Adderall k,n,o
8th Grade — — — — — — — — — — — — — — — — — — 2.0 2.3 1.7 1.7 1.8 1.3 1.0 1.5 1.3 -0.3
10th Grade — — — — — — — — — — — — — — — — — — 5.7 5.3 4.6 4.5 4.4 4.6 5.2 4.2 4.0 -0.2
12th Grade — — — — — — — — — — — — — — — — — — 5.4 6.5 6.5 7.6 7.4 6.8 7.5 6.2 5.5 -0.6
TABLE 2 (cont.)Trends in Annual Prevalence of Use of Various Drugs
in Grades 8, 10, and 12(Entries are percentages.)
Vicodin k,n,v
Amphetamines k,m
(Table continued on next page.)
2016–
2017change
Narcotics other than Heroin k,l
OxyContin k,n,v

1991 1992 1993 1994 1995 1996 1997 1998 1999 2000 2001 2002 2003 2004 2005 2006 2007 2008 2009 2010 2011 2012 2013 2014 2015 2016 2017
Methamphetamine n,o
8th Grade — — — — — — — — 3.2 2.5 2.8 2.2 2.5 1.5 1.8 1.8 1.1 1.2 1.0 1.2 0.8 1.0 1.0 0.6 0.5 0.4 0.5 +0.1
10th Grade — — — — — — — — 4.6 4.0 3.7 3.9 3.3 3.0 2.9 1.8 1.6 1.5 1.6 1.6 1.4 1.0 1.0 0.8 0.8 0.4 0.4 -0.1
12th Grade — — — — — — — — 4.7 4.3 3.9 3.6 3.2 3.4 2.5 2.5 1.7 1.2 1.2 1.0 1.4 1.1 0.9 1.0 0.6 0.6 0.6 -0.1
8th Grade — — — — — — — — — — — — — — — — — — — — — — — — — — — —
10th Grade — — — — — — — — — — — — — — — — — — — — — — — — — — — —
12th Grade 1.4 1.3 1.7 1.8 2.4 2.8 2.3 3.0 1.9 2.2 2.5 3.0 2.0 2.1 2.3 1.9 1.6 1.1 0.9 0.9 1.2 0.8 1.1 0.8 0.5 0.8 0.8 0.0
Bath salts (synthetic stimulants) n,o
8th Grade — — — — — — — — — — — — — — — — — — — — — 0.8 1.0 0.5 0.4 0.9 0.5 -0.4
10th Grade — — — — — — — — — — — — — — — — — — — — — 0.6 0.9 0.9 0.7 0.8 0.4 -0.3
12th Grade — — — — — — — — — — — — — — — — — — — — — 1.3 0.9 0.9 1.0 0.8 0.6 -0.1
Sedatives (Barbiturates) k,p
8th Grade — — — — — — — — — — — — — — — — — — — — — — — — — — — —
10th Grade — — — — — — — — — — — — — — — — — — — — — — — — — — — —
12th Grade 3.4 2.8 3.4 4.1 4.7 4.9 5.1 5.5 5.8 6.2 5.7 6.7 6.0 6.5 7.2 6.6 6.2 5.8 5.2 4.8 4.3 4.5 4.8 4.3 3.6 3.0 2.9 -0.1
8th Grade 1.8 2.0 2.1 2.4 2.7 3.3 2.9 2.6 2.5 2.6‡ 2.8 2.6 2.7 2.5 2.8 2.6 2.4 2.4 2.6 2.8 2.0 1.8 1.8 1.7 1.7 1.7 2.0 +0.3
10th Grade 3.2 3.5 3.3 3.3 4.0 4.6 4.9 5.1 5.4 5.6‡ 7.3 6.3 5.3 5.1 4.8 5.2 5.3 4.6 5.0 5.1 4.5 4.3 3.7 3.9 3.9 4.1 4.1 0.0
12th Grade 3.6 2.8 3.5 3.7 4.4 4.6 4.7 5.5 5.8 5.7‡ 6.9 7.7 6.7 7.3 6.8 6.6 6.2 6.2 6.3 5.6 5.6 5.3 4.6 4.7 4.7 4.9 4.7 -0.2
8th Grade — — — — — — — — — — — — — — — — — — — — — — — — — — — —
10th Grade — — — — — — — — — — — — — — — — — — — — — — — — — — — —
12th Grade — — — — — — — — — — — — — — 17.1 16.8 15.8 15.4 14.4 15.0 15.2 14.8‡ 15.9 13.9 12.9 12.0 10.9 -1.0
TABLE 2 (cont.)Trends in Annual Prevalence of Use of Various Drugs
in Grades 8, 10, and 12
Tranquilizers b,k
Any Prescription Drug q
(Table continued on next page.)
(Entries are percentages.)
2016–
2017change
Crystal Methamphetamine (Ice) o
1991 1992 1993 1994 1995 1996 1997 1998 1999 2000 2001 2002 2003 2004 2005 2006 2007 2008 2009 2010 2011 2012 2013 2014 2015 2016 2017
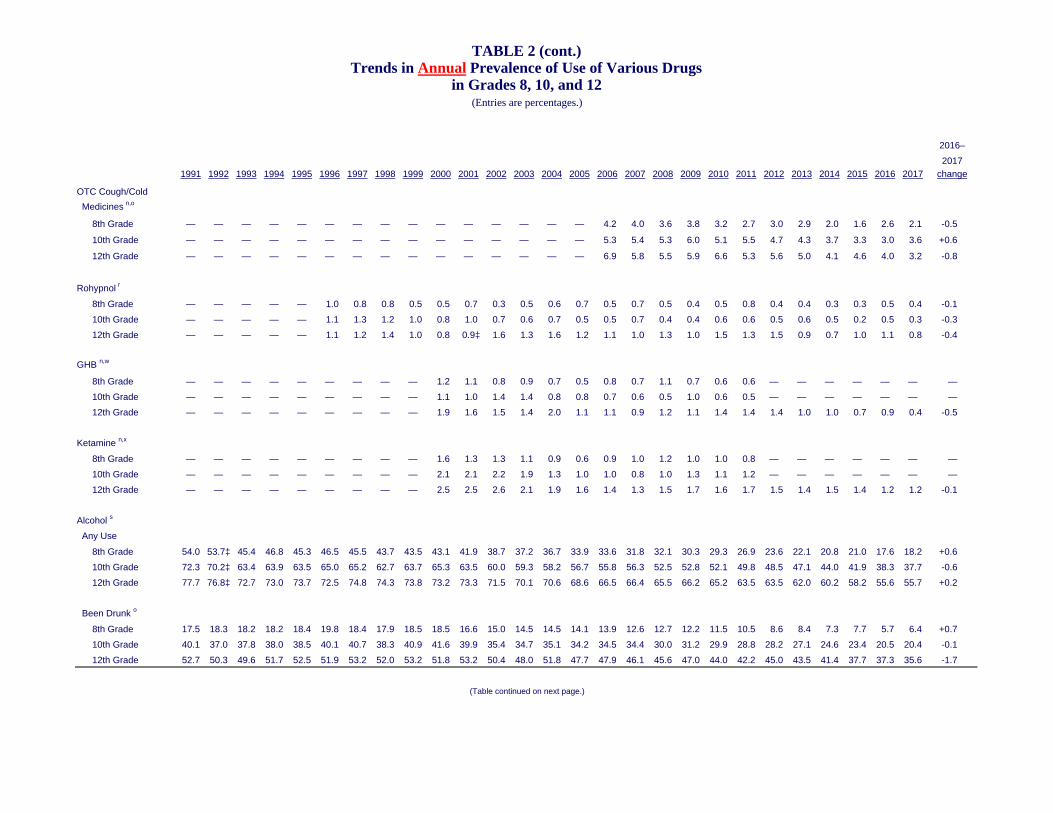
8th Grade — — — — — — — — — — — — — — — 4.2 4.0 3.6 3.8 3.2 2.7 3.0 2.9 2.0 1.6 2.6 2.1 -0.5
10th Grade — — — — — — — — — — — — — — — 5.3 5.4 5.3 6.0 5.1 5.5 4.7 4.3 3.7 3.3 3.0 3.6 +0.6
12th Grade — — — — — — — — — — — — — — — 6.9 5.8 5.5 5.9 6.6 5.3 5.6 5.0 4.1 4.6 4.0 3.2 -0.8
8th Grade — — — — — 1.0 0.8 0.8 0.5 0.5 0.7 0.3 0.5 0.6 0.7 0.5 0.7 0.5 0.4 0.5 0.8 0.4 0.4 0.3 0.3 0.5 0.4 -0.1
10th Grade — — — — — 1.1 1.3 1.2 1.0 0.8 1.0 0.7 0.6 0.7 0.5 0.5 0.7 0.4 0.4 0.6 0.6 0.5 0.6 0.5 0.2 0.5 0.3 -0.3
12th Grade — — — — — 1.1 1.2 1.4 1.0 0.8 0.9‡ 1.6 1.3 1.6 1.2 1.1 1.0 1.3 1.0 1.5 1.3 1.5 0.9 0.7 1.0 1.1 0.8 -0.4
GHB n,w
8th Grade — — — — — — — — — 1.2 1.1 0.8 0.9 0.7 0.5 0.8 0.7 1.1 0.7 0.6 0.6 — — — — — — —
10th Grade — — — — — — — — — 1.1 1.0 1.4 1.4 0.8 0.8 0.7 0.6 0.5 1.0 0.6 0.5 — — — — — — —
12th Grade — — — — — — — — — 1.9 1.6 1.5 1.4 2.0 1.1 1.1 0.9 1.2 1.1 1.4 1.4 1.4 1.0 1.0 0.7 0.9 0.4 -0.5
8th Grade — — — — — — — — — 1.6 1.3 1.3 1.1 0.9 0.6 0.9 1.0 1.2 1.0 1.0 0.8 — — — — — — —
10th Grade — — — — — — — — — 2.1 2.1 2.2 1.9 1.3 1.0 1.0 0.8 1.0 1.3 1.1 1.2 — — — — — — —
12th Grade — — — — — — — — — 2.5 2.5 2.6 2.1 1.9 1.6 1.4 1.3 1.5 1.7 1.6 1.7 1.5 1.4 1.5 1.4 1.2 1.2 -0.1
8th Grade 54.0 53.7‡ 45.4 46.8 45.3 46.5 45.5 43.7 43.5 43.1 41.9 38.7 37.2 36.7 33.9 33.6 31.8 32.1 30.3 29.3 26.9 23.6 22.1 20.8 21.0 17.6 18.2 +0.6
10th Grade 72.3 70.2‡ 63.4 63.9 63.5 65.0 65.2 62.7 63.7 65.3 63.5 60.0 59.3 58.2 56.7 55.8 56.3 52.5 52.8 52.1 49.8 48.5 47.1 44.0 41.9 38.3 37.7 -0.6
12th Grade 77.7 76.8‡ 72.7 73.0 73.7 72.5 74.8 74.3 73.8 73.2 73.3 71.5 70.1 70.6 68.6 66.5 66.4 65.5 66.2 65.2 63.5 63.5 62.0 60.2 58.2 55.6 55.7 +0.2
8th Grade 17.5 18.3 18.2 18.2 18.4 19.8 18.4 17.9 18.5 18.5 16.6 15.0 14.5 14.5 14.1 13.9 12.6 12.7 12.2 11.5 10.5 8.6 8.4 7.3 7.7 5.7 6.4 +0.7
10th Grade 40.1 37.0 37.8 38.0 38.5 40.1 40.7 38.3 40.9 41.6 39.9 35.4 34.7 35.1 34.2 34.5 34.4 30.0 31.2 29.9 28.8 28.2 27.1 24.6 23.4 20.5 20.4 -0.1
12th Grade 52.7 50.3 49.6 51.7 52.5 51.9 53.2 52.0 53.2 51.8 53.2 50.4 48.0 51.8 47.7 47.9 46.1 45.6 47.0 44.0 42.2 45.0 43.5 41.4 37.7 37.3 35.6 -1.7
TABLE 2 (cont.)Trends in Annual Prevalence of Use of Various Drugs
in Grades 8, 10, and 12
Medicines n,o
Rohypnol r
Ketamine n,x
Alcohol s
Any Use
Been Drunk o
(Entries are percentages.)
2016–
2017change
OTC Cough/Cold
(Table continued on next page.)

1991 1992 1993 1994 1995 1996 1997 1998 1999 2000 2001 2002 2003 2004 2005 2006 2007 2008 2009 2010 2011 2012 2013 2014 2015 2016 2017
Flavored Alcoholic
8th Grade — — — — — — — — — — — — — 30.4 27.9 26.8 26.0 25.0 22.2 21.9 19.2 17.0 15.7 13.4 13.4 11.2 10.8 -0.5
10th Grade — — — — — — — — — — — — — 49.7 48.5 48.8 45.9 43.4 41.5 41.0 38.3 37.8 35.6 33.2 31.4 26.1 28.3 +2.3
12th Grade — — — — — — — — — — — — 55.2 55.8 58.4 54.7 53.6 51.8 53.4 47.9 47.0 44.4 44.2 43.6 42.8 40.0 39.6 -0.4
Alcoholic Beverages containing Caffeine n,o,z
8th Grade — — — — — — — — — — — — — — — — — — — — 11.8 10.9 10.2 9.5 8.4 6.5 5.6 -0.9
10th Grade — — — — — — — — — — — — — — — — — — — — 22.5 19.7 16.9 14.3 12.8 10.6 9.9 -0.8
12th Grade — — — — — — — — — — — — — — — — — — — — 26.4 26.4 23.5 20.0 18.3 17.0 16.9 -0.1
Tobacco using a Hookah e
8th Grade — — — — — — — — — — — — — — — — — — — — — — — — — — — —
10th Grade — — — — — — — — — — — — — — — — — — — — — — — — — — — —
12th Grade — — — — — — — — — — — — — — — — — — — 17.1 18.5 18.3 21.4 22.9 19.8 13.0 10.1 -2.9 s
Small cigars e
8th Grade — — — — — — — — — — — — — — — — — — — — — — — — — — — —
10th Grade — — — — — — — — — — — — — — — — — — — — — — — — — — — —
12th Grade — — — — — — — — — — — — — — — — — — — 23.1 19.5 19.9 20.4 18.9 15.9 15.6 13.3 -2.4
Dissolvable Tobacco Products e,n
8th Grade — — — — — — — — — — — — — — — — — — — — — 1.0 1.1 1.1 0.9 0.7 0.6 0.0
10th Grade — — — — — — — — — — — — — — — — — — — — — 1.6 1.2 1.3 1.1 0.9 0.6 -0.3
12th Grade — — — — — — — — — — — — — — — — — — — — 1.5 1.6 1.9 1.1 1.4 1.1 1.4 +0.3
Snus e,n
8th Grade — — — — — — — — — — — — — — — — — — — — — 2.4 2.0 2.2 1.9 2.2 1.1 -1.0 ss
10th Grade — — — — — — — — — — — — — — — — — — — — — 6.9 5.2 4.5 4.0 3.0 2.6 -0.4
12th Grade — — — — — — — — — — — — — — — — — — — — 7.9 7.9 7.7 5.8 5.8 5.8 4.2 -1.6
2017change
Beverages e,n,y
(Table continued on next page.)
TABLE 2 (cont.)Trends in Annual Prevalence of Use of Various Drugs
in Grades 8, 10, and 12(Entries are percentages.)
2016–

1991 1992 1993 1994 1995 1996 1997 1998 1999 2000 2001 2002 2003 2004 2005 2006 2007 2008 2009 2010 2011 2012 2013 2014 2015 2016 2017
Any Vapingbb
8th Grade — — — — — — — — — — — — — — — — — — — — — — — — — — 13.3 —
10th Grade — — — — — — — — — — — — — — — — — — — — — — — — — — 23.9 —
12th Grade — — — — — — — — — — — — — — — — — — — — — — — — — — 27.8 —
Vaping Nicotinebb
8th Grade — — — — — — — — — — — — — — — — — — — — — — — — — — 7.5 —
10th Grade — — — — — — — — — — — — — — — — — — — — — — — — — — 15.8 —
12th Grade — — — — — — — — — — — — — — — — — — — — — — — — — — 18.8 —
Vaping Marijuanabb
8th Grade — — — — — — — — — — — — — — — — — — — — — — — — — — 3.0 —
10th Grade — — — — — — — — — — — — — — — — — — — — — — — — — — 8.1 —
12th Grade — — — — — — — — — — — — — — — — — — — — — — — — — — 9.5 —
Vaping Just Flavoringbb
8th Grade — — — — — — — — — — — — — — — — — — — — — — — — — — 11.8 —
10th Grade — — — — — — — — — — — — — — — — — — — — — — — — — — 19.3 —
12th Grade — — — — — — — — — — — — — — — — — — — — — — — — — — 20.6 —
8th Grade 1.0 1.1 0.9 1.2 1.0 0.9 1.0 1.2 1.7 1.7 1.6 1.5 1.4 1.1 1.1 0.9 0.8 0.9 0.8 0.5 0.7 0.6 0.6 0.6 0.5 0.5 0.6 +0.1
10th Grade 1.1 1.1 1.0 1.1 1.2 1.2 1.2 1.2 1.7 2.2 2.1 2.2 1.7 1.5 1.3 1.2 1.1 0.9 0.8 1.0 0.9 0.8 0.8 0.8 0.7 0.7 0.7 0.0
12th Grade 1.4 1.1 1.2 1.3 1.5 1.4 1.4 1.7 1.8 1.7 2.4 2.5 2.1 2.5 1.5 1.8 1.4 1.5 1.5 1.5 1.2 1.3 1.5 1.5 1.7 1.0 1.1 0.0
TABLE 2 (cont.)Trends in Annual Prevalence of Use of Various Drugs
Steroids k,u
in Grades 8, 10, and 12(Entries are percentages.)
2016–
2017change
(Table continued on next page.)

1991 1992 1993 1994 1995 1996 1997 1998 1999 2000 2001 2002 2003 2004 2005 2006 2007 2008 2009 2010 2011 2012 2013 2014 2015 2016 2017
Previously surveyed drugs that have been dropped.
8th Grade — — — — — — — — — — — — — — — — — — — — — — — — — — — —
10th Grade — — — — — — — — — — — — — — — — — — — — — — — — — — — —
12th Grade 0.9 0.5 0.9 1.1 1.1 1.6 1.2 1.4 0.9 0.6 0.6 1.1 0.9 0.8 0.6 0.5 0.8 0.6 0.9 — — — — — — — — —
Provigil k,o
8th Grade — — — — — — — — — — — — — — — — — — — — — — — — — — — —
10th Grade — — — — — — — — — — — — — — — — — — — — — — — — — — — —
12th Grade — — — — — — — — — — — — — — — — — — 1.8 1.3 1.5 — — — — — — —
8th Grade — — — — — — — — — — — — — — — — — — — — — — — — — — — —
10th Grade — — — — — — — — — — — — — — — — — — — — — — — — — — — —
12th Grade 0.5 0.6 0.2 0.8 0.7 1.1 1.0 1.1 1.1 0.3 0.8 0.9 0.6 0.8 0.9 0.8 0.5 0.5 0.6 0.3 0.3 0.4 — — — — — —
Bidis n,o
8th Grade — — — — — — — — — 3.9 2.7 2.7 2.0 1.7 1.6 — — — — — — — — — — — — —
10th Grade — — — — — — — — — 6.4 4.9 3.1 2.8 2.1 1.6 — — — — — — — — — — — — —
12th Grade — — — — — — — — — 9.2 7.0 5.9 4.0 3.6 3.3 2.3 1.7 1.9 1.5 1.4 — — — — — — — —
Kreteks n,o
8th Grade — — — — — — — — — — 2.6 2.6 2.0 1.9 1.4 — — — — — — — — — — — — —
10th Grade — — — — — — — — — — 6.0 4.9 3.8 3.7 2.8 — — — — — — — — — — — — —
12th Grade — — — — — — — — — — 10.1 8.4 6.7 6.5 7.1 6.2 6.8 6.8 5.5 4.6 2.9 3.0 1.6 1.6 — — — —
Source. The Monitoring the Future study, the University of Michigan.
Note: See footnotes following Table 4.
Nitrites e
Methaqualone e,k
TABLE 2 (cont.)Trends in Annual Prevalence of Use of Various Drugs
in Grades 8, 10, and 12(Entries are percentages.)
2016–
2017change

1991 1992 1993 1994 1995 1996 1997 1998 1999 2000 2001 2002 2003 2004 2005 2006 2007 2008 2009 2010 2011 2012 2013 2014 2015 2016 2017
8th Grade 5.7 6.8 8.4 10.9 12.4 14.6 12.9 12.1 12.2 11.9 11.7 10.4 9.7 8.4 8.5 8.1 7.4 7.6 8.1 9.5 8.5 7.7‡ 8.7 8.3 8.1 6.9 7.0 +0.1
10th Grade 11.6 11.0 14.0 18.5 20.2 23.2 23.0 21.5 22.1 22.5 22.7 20.8 19.5 18.3 17.3 16.8 16.9 15.8 17.8 18.5 19.2 18.6‡ 19.2 18.5 16.5 15.9 17.2 +1.3
12th Grade 16.4 14.4 18.3 21.9 23.8 24.6 26.2 25.6 25.9 24.9 25.7 25.4 24.1 23.4 23.1 21.5 21.9 22.3 23.3 23.8 25.2 25.2‡ 25.2 23.7 23.6 24.4 24.9 +0.4
Any Illicit Drug other
8th Grade 3.8 4.7 5.3 5.6 6.5 6.9 6.0 5.5 5.5 5.6‡ 5.5 4.7 4.7 4.1 4.1 3.8 3.6 3.8 3.5 3.5 3.4 2.6‡ 3.6 3.3 3.1 2.7 2.7 0.0
10th Grade 5.5 5.7 6.5 7.1 8.9 8.9 8.8 8.6 8.6 8.5‡ 8.7 8.1 6.9 6.9 6.4 6.3 6.9 5.3 5.7 5.8 5.4 5.0‡ 4.9 5.6 4.9 4.4 4.5 +0.1
12th Grade 7.1 6.3 7.9 8.8 10.0 9.5 10.7 10.7 10.4 10.4‡ 11.0 11.3 10.4 10.8 10.3 9.8 9.5 9.3 8.6 8.6 8.9 8.4‡ 8.2 7.7 7.6 6.9 6.3 -0.6
including Inhalants a,c
8th Grade 8.8 10.0 12.0 14.3 16.1 17.5 16.0 14.9 15.1 14.4 14.0 12.6 12.1 11.2 11.2 10.9 10.1 10.4 10.6 11.7 10.5 9.5‡ 10.0 9.5 9.3 7.9 8.6 +0.8
10th Grade 13.1 12.6 15.5 20.0 21.6 24.5 24.1 22.5 23.1 23.6 23.6 21.7 20.5 19.3 18.4 17.7 18.1 16.8 18.8 19.4 20.1 19.3‡ 20.0 19.1 17.1 16.4 18.0 +1.5
12th Grade 17.8 15.5 19.3 23.0 24.8 25.5 26.9 26.6 26.4 26.4 26.5 25.9 24.6 23.3 24.2 22.1 22.8 22.8 24.1 24.5 26.2 25.2‡ 26.5 24.3 24.7 24.6 25.7 +1.1
8th Grade 3.2 3.7 5.1 7.8 9.1 11.3 10.2 9.7 9.7 9.1 9.2 8.3 7.5 6.4 6.6 6.5 5.7 5.8 6.5 8.0 7.2 6.5 7.0 6.5 6.5 5.4 5.5 0.0
10th Grade 8.7 8.1 10.9 15.8 17.2 20.4 20.5 18.7 19.4 19.7 19.8 17.8 17.0 15.9 15.2 14.2 14.2 13.8 15.9 16.7 17.6 17.0 18.0 16.6 14.8 14.0 15.7 +1.7 s
12th Grade 13.8 11.9 15.5 19.0 21.2 21.9 23.7 22.8 23.1 21.6 22.4 21.5 21.2 19.9 19.8 18.3 18.8 19.4 20.6 21.4 22.6 22.9 22.7 21.2 21.3 22.5 22.9 +0.4
8th Grade 4.4 4.7 5.4 5.6 6.1 5.8 5.6 4.8 5.0 4.5 4.0 3.8 4.1 4.5 4.2 4.1 3.9 4.1 3.8 3.6 3.2 2.7 2.3 2.2 2.0 1.8 2.1 +0.4
10th Grade 2.7 2.7 3.3 3.6 3.5 3.3 3.0 2.9 2.6 2.6 2.4 2.4 2.2 2.4 2.2 2.3 2.5 2.1 2.2 2.0 1.7 1.4 1.3 1.1 1.2 1.0 1.1 +0.1
12th Grade 2.4 2.3 2.5 2.7 3.2 2.5 2.5 2.3 2.0 2.2 1.7 1.5 1.5 1.5 2.0 1.5 1.2 1.4 1.2 1.4 1.0 0.9 1.0 0.7 0.7 0.8 0.8 0.0
8th Grade 0.8 1.1 1.2 1.3 1.7 1.9 1.8 1.4 1.3 1.2‡ 1.6 1.2 1.2 1.0 1.1 0.9 1.0 0.9 0.9 1.0 1.0 0.6 0.8 0.5 0.6 0.6 0.5 -0.1
10th Grade 1.6 1.8 1.9 2.4 3.3 2.8 3.3 3.2 2.9 2.3‡ 2.1 1.6 1.5 1.6 1.5 1.5 1.7 1.3 1.4 1.6 1.4 1.2 1.1 1.2 0.9 0.9 1.1 +0.2
12th Grade 2.2 2.1 2.7 3.1 4.4 3.5 3.9 3.8 3.5 2.6‡ 3.3 2.3 1.8 1.9 1.9 1.5 1.7 2.2 1.6 1.9 1.6 1.6 1.4 1.5 1.6 1.4 1.6 +0.1
Inhalants c,d
TABLE 3Trends in 30-Day Prevalence of Use of Various Drugs
in Grades 8, 10, and 12
Percentage who used in last 30 days 2016–
2017change
Any Illicit Drug a
than Marijuana a,b
Any Illicit Drug
Marijuana/Hashish
Hallucinogens b,f
(Table continued on next page.)

1991 1992 1993 1994 1995 1996 1997 1998 1999 2000 2001 2002 2003 2004 2005 2006 2007 2008 2009 2010 2011 2012 2013 2014 2015 2016 2017
LSD b
8th Grade 0.6 0.9 1.0 1.1 1.4 1.5 1.5 1.1 1.1 1.0 1.0 0.7 0.6 0.5 0.5 0.4 0.5 0.5 0.5 0.6 0.5 0.3 0.5 0.3 0.4 0.4 0.3 -0.1
10th Grade 1.5 1.6 1.6 2.0 3.0 2.4 2.8 2.7 2.3 1.6 1.5 0.7 0.6 0.6 0.6 0.7 0.7 0.7 0.5 0.7 0.7 0.5 0.6 0.6 0.6 0.7 0.8 +0.1
12th Grade 1.9 2.0 2.4 2.6 4.0 2.5 3.1 3.2 2.7 1.6 2.3 0.7 0.6 0.7 0.7 0.6 0.6 1.1 0.5 0.8 0.8 0.8 0.8 1.0 1.1 1.0 1.2 +0.2
Hallucinogens other than LSD b
8th Grade 0.3 0.4 0.5 0.7 0.8 0.9 0.7 0.7 0.6 0.6‡ 1.1 1.0 1.0 0.8 0.9 0.7 0.7 0.7 0.7 0.8 0.7 0.5 0.5 0.4 0.3 0.3 0.3 0.0
10th Grade 0.4 0.5 0.7 1.0 1.0 1.0 1.2 1.4 1.2 1.2‡ 1.4 1.4 1.2 1.4 1.3 1.3 1.4 1.0 1.1 1.2 1.1 0.9 0.8 0.8 0.6 0.5 0.6 +0.0
12th Grade 0.7 0.5 0.8 1.2 1.3 1.6 1.7 1.6 1.6 1.7‡ 1.9 2.0 1.5 1.7 1.6 1.3 1.4 1.6 1.4 1.5 1.2 1.3 1.0 1.0 0.9 0.7 1.0 +0.2
8th Grade, original — — — — 1.0 1.0 0.9 0.8 1.4 1.8 1.4 0.7 0.8 0.6 0.7 0.6 0.8 0.6 1.1 0.6 0.5 0.5 0.4 — — — —
Revised — — — — — — — — — — — — — — — — — — — — — — 0.7 0.5 0.3 0.4 0.0
10th Grade,original — — — — 1.8 1.3 1.3 1.8 2.6 2.6 1.8 1.1 0.8 1.0 1.2 1.2 1.1 1.3 1.9 1.6 1.0 1.2 0.8 — — — —
Revised — — — — — — — — — — — — — — — — — — — — — — 1.1 0.9 0.5 0.5 0.0
12th Grade, original — — — — 2.0 1.6 1.5 2.5 3.6 2.8 2.4 1.3 1.2 1.0 1.3 1.6 1.8 1.8 1.4 2.3 0.9 1.5 1.4 — — — —
Revised — — — — — — — — — — — — — — — — — — — — — — 1.5 1.1 0.9 0.9 0.0
8th Grade 0.5 0.7 0.7 1.0 1.2 1.3 1.1 1.4 1.3 1.2 1.2 1.1 0.9 0.9 1.0 1.0 0.9 0.8 0.8 0.6 0.8 0.5 0.5 0.5 0.5 0.3 0.4 +0.1
10th Grade 0.7 0.7 0.9 1.2 1.7 1.7 2.0 2.1 1.8 1.8 1.3 1.6 1.3 1.7 1.5 1.5 1.3 1.2 0.9 0.9 0.7 0.8 0.8 0.6 0.8 0.4 0.5 +0.1
12th Grade 1.4 1.3 1.3 1.5 1.8 2.0 2.3 2.4 2.6 2.1 2.1 2.3 2.1 2.3 2.3 2.5 2.0 1.9 1.3 1.3 1.1 1.1 1.1 1.0 1.1 0.9 1.2 +0.3
8th Grade 0.3 0.5 0.4 0.7 0.7 0.8 0.7 0.9 0.8 0.8 0.8 0.8 0.7 0.6 0.6 0.6 0.6 0.5 0.5 0.4 0.5 0.3 0.3 0.3 0.3 0.2 0.3 +0.1
10th Grade 0.3 0.4 0.5 0.6 0.9 0.8 0.9 1.1 0.8 0.9 0.7 1.0 0.7 0.8 0.7 0.7 0.5 0.5 0.4 0.5 0.4 0.4 0.4 0.3 0.3 0.2 0.3 +0.1
12th Grade 0.7 0.6 0.7 0.8 1.0 1.0 0.9 1.0 1.1 1.0 1.1 1.2 0.9 1.0 1.0 0.9 0.9 0.8 0.6 0.7 0.5 0.6 0.6 0.7 0.6 0.5 0.6 +0.1
Cocaine other than Crack h
8th Grade 0.5 0.5 0.6 0.9 1.0 1.0 0.8 1.0 1.1 0.9 0.9 0.8 0.7 0.7 0.7 0.7 0.6 0.6 0.7 0.5 0.6 0.3 0.3 0.4 0.4 0.3 0.3 0.0
10th Grade 0.6 0.6 0.7 1.0 1.4 1.3 1.6 1.8 1.6 1.6 1.2 1.3 1.1 1.5 1.3 1.3 1.1 1.0 0.8 0.7 0.6 0.7 0.7 0.5 0.7 0.3 0.4 +0.1
12th Grade 1.2 1.0 1.2 1.3 1.3 1.6 2.0 2.0 2.5 1.7 1.8 1.9 1.8 2.2 2.0 2.4 1.7 1.7 1.1 1.1 1.0 1.0 0.9 0.9 1.1 0.6 1.1 +0.5 ss
(Table continued on next page.)
TABLE 3 (cont.)Trends in 30-Day Prevalence of Use of Various Drugs
in Grades 8, 10, and 12
Percentage who used in last 30 days 2016–
2017change
Ecstasy (MDMA) g
Cocaine
Crack

1991 1992 1993 1994 1995 1996 1997 1998 1999 2000 2001 2002 2003 2004 2005 2006 2007 2008 2009 2010 2011 2012 2013 2014 2015 2016 2017
8th Grade 0.3 0.4 0.4 0.6 0.6 0.7 0.6 0.6 0.6 0.5 0.6 0.5 0.4 0.5 0.5 0.3 0.4 0.4 0.4 0.4 0.4 0.2 0.3 0.3 0.1 0.2 0.2 0.0
10th Grade 0.2 0.2 0.3 0.4 0.6 0.5 0.6 0.7 0.7 0.5 0.3 0.5 0.3 0.5 0.5 0.5 0.4 0.4 0.4 0.4 0.4 0.4 0.3 0.4 0.2 0.2 0.1 -0.1
12th Grade 0.2 0.3 0.2 0.3 0.6 0.5 0.5 0.5 0.5 0.7 0.4 0.5 0.4 0.5 0.5 0.4 0.4 0.4 0.4 0.4 0.4 0.3 0.3 0.4 0.3 0.2 0.3 +0.1
8th Grade — — — — 0.4 0.5 0.4 0.5 0.4 0.3 0.4 0.3 0.3 0.3 0.3 0.2 0.3 0.3 0.3 0.3 0.2 0.2 0.2 0.2 0.1 0.1 0.2 0.0
10th Grade — — — — 0.3 0.3 0.3 0.4 0.3 0.3 0.2 0.3 0.2 0.3 0.3 0.3 0.3 0.2 0.3 0.2 0.2 0.2 0.2 0.3 0.1 0.2 0.1 -0.1
12th Grade — — — — 0.3 0.4 0.3 0.2 0.2 0.2 0.2 0.3 0.3 0.2 0.3 0.3 0.2 0.2 0.1 0.4 0.4 0.3 0.2 0.3 0.2 0.2 0.2 0.0
8th Grade — — — — 0.3 0.4 0.4 0.3 0.4 0.3 0.4 0.3 0.3 0.3 0.2 0.2 0.2 0.2 0.2 0.2 0.2 0.1 0.2 0.1 0.1 0.1 0.2 0.0
10th Grade — — — — 0.3 0.3 0.4 0.5 0.5 0.4 0.2 0.4 0.2 0.3 0.3 0.3 0.2 0.3 0.2 0.3 0.2 0.2 0.2 0.2 0.2 0.1 0.1 0.0
12th Grade — — — — 0.6 0.4 0.6 0.4 0.4 0.7 0.3 0.5 0.4 0.3 0.5 0.3 0.4 0.2 0.3 0.4 0.4 0.2 0.2 0.4 0.3 0.1 0.2 0.0
8th Grade — — — — — — — — — — — — — — — — — — — — — — — — — — — —
10th Grade — — — — — — — — — — — — — — — — — — — — — — — — — — — —
12th Grade 1.1 1.2 1.3 1.5 1.8 2.0 2.3 2.4 2.6 2.9 3.0‡ 4.0 4.1 4.3 3.9 3.8 3.8 3.8 4.1 3.6 3.6 3.0 2.8 2.2 2.1 1.7 1.6 -0.1
8th Grade 2.6 3.3 3.6 3.6 4.2 4.6 3.8 3.3 3.4 3.4 3.2 2.8 2.7 2.3 2.3 2.1 2.0 2.2 1.9 1.8 1.8 1.3‡ 2.3 2.1 1.9 1.7 1.7 0.0 10th Grade 3.3 3.6 4.3 4.5 5.3 5.5 5.1 5.1 5.0 5.4 5.6 5.2 4.3 4.0 3.7 3.5 4.0 2.8 3.3 3.3 3.1 2.8‡ 3.3 3.7 3.1 2.7 2.5 -0.2 12th Grade 3.2 2.8 3.7 4.0 4.0 4.1 4.8 4.6 4.5 5.0 5.6 5.5 5.0 4.6 3.9 3.7 3.7 2.9 3.0 3.3 3.7 3.3‡ 4.2 3.8 3.2 3.0 2.6 -0.4
Methamphetamine n,o
8th Grade — — — — — — — — 1.1 0.8 1.3 1.1 1.2 0.6 0.7 0.6 0.6 0.7 0.5 0.7 0.4 0.5 0.4 0.2 0.3 0.3 0.2 -0.1
10th Grade — — — — — — — — 1.8 2.0 1.5 1.8 1.4 1.3 1.1 0.7 0.4 0.7 0.6 0.7 0.5 0.6 0.4 0.3 0.3 0.2 0.1 -0.1
12th Grade — — — — — — — — 1.7 1.9 1.5 1.7 1.7 1.4 0.9 0.9 0.6 0.6 0.5 0.5 0.6 0.5 0.4 0.5 0.4 0.3 0.3 +0.1
Amphetamines k,m
TABLE 3 (cont.)Trends in 30-Day Prevalence of Use of Various Drugs
in Grades 8, 10, and 12
Percentage who used in last 30 days 2016–
2017change
Heroin I,j
With a Needle j
Without a Needle j
Narcotics other than Heroin k,l
(Table continued on next page.)

1991 1992 1993 1994 1995 1996 1997 1998 1999 2000 2001 2002 2003 2004 2005 2006 2007 2008 2009 2010 2011 2012 2013 2014 2015 2016 2017
8th Grade — — — — — — — — — — — — — — — — — — — — — — — — — — — —
10th Grade — — — — — — — — — — — — — — — — — — — — — — — — — — — —
12th Grade 0.6 0.5 0.6 0.7 1.1 1.1 0.8 1.2 0.8 1.0 1.1 1.2 0.8 0.8 0.9 0.7 0.6 0.6 0.5 0.6 0.6 0.4 0.8 0.4 0.3 0.4 0.5 0.0
Sedatives (Barbiturates) k,p
8th Grade — — — — — — — — — — — — — — — — — — — — — — — — — — — —
10th Grade — — — — — — — — — — — — — — — — — — — — — — — — — — — —
12th Grade 1.4 1.1 1.3 1.7 2.2 2.1 2.1 2.6 2.6 3.0 2.8 3.2 2.9‡ 2.9 3.3 3.0 2.7 2.8 2.5 2.2 1.8 2.0 2.2 2.0 1.7 1.5 1.4 0.0
8th Grade 0.8 0.8 0.9 1.1 1.2 1.5 1.2 1.2 1.1 1.4‡ 1.2 1.2 1.4 1.2 1.3 1.3 1.1 1.2 1.2 1.2 1.0 0.8 0.9 0.8 0.8 0.8 0.7 0.0
10th Grade 1.2 1.5 1.1 1.5 1.7 1.7 2.2 2.2 2.2 2.5‡ 2.9 2.9 2.4 2.3 2.3 2.4 2.6 1.9 2.0 2.2 1.9 1.7 1.6 1.6 1.7 1.5 1.5 0.0
12th Grade 1.4 1.0 1.2 1.4 1.8 2.0 1.8 2.4 2.5 2.6‡ 2.9 3.3 2.8 3.1 2.9 2.7 2.6 2.6 2.7 2.5 2.3 2.1 2.0 2.1 2.0 1.9 2.0 +0.2
Any Prescription Drug q
8th Grade — — — — — — — — — — — — — — — — — — — — — — — — — — — —
10th Grade — — — — — — — — — — — — — — — — — — — — — — — — — — — —
12th Grade — — — — — — — — — — — — — — 8.6 8.1 7.8 7.2 7.3 6.9 7.2 7.0‡ 7.1 6.4 5.9 5.4 4.9 -0.5
8th Grade — — — — — 0.5 0.3 0.4 0.3 0.3 0.4 0.2 0.1 0.2 0.2 0.4 0.3 0.1 0.2 0.2 0.6 0.1 0.1 0.2 0.1 0.2 0.1 -0.1
10th Grade — — — — — 0.5 0.5 0.4 0.5 0.4 0.2 0.4 0.2 0.3 0.2 0.2 0.2 0.2 0.3 0.3 0.3 0.2 0.1 0.4 0.1 0.3 0.0 -0.3 s
12th Grade — — — — — 0.5 0.3 0.3 0.3 0.4 0.3 — — — — — — — — — — — — — — — — —
8th Grade 25.1 26.1‡ 24.3 25.5 24.6 26.2 24.5 23.0 24.0 22.4 21.5 19.6 19.7 18.6 17.1 17.2 15.9 15.9 14.9 13.8 12.7 11.0 10.2 9.0 9.7 7.3 8.0 +0.7
10th Grade 42.8 39.9‡ 38.2 39.2 38.8 40.4 40.1 38.8 40.0 41.0 39.0 35.4 35.4 35.2 33.2 33.8 33.4 28.8 30.4 28.9 27.2 27.6 25.7 23.5 21.5 19.9 19.7 -0.2
12th Grade 54.0 51.3‡ 48.6 50.1 51.3 50.8 52.7 52.0 51.0 50.0 49.8 48.6 47.5 48.0 47.0 45.3 44.4 43.1 43.5 41.2 40.0 41.5 39.2 37.4 35.3 33.2 33.2 -0.1
Alcohol s
TABLE 3 (cont.)Trends in 30-Day Prevalence of Use of Various Drugs
in Grades 8, 10, and 12
Percentage who used in last 30 days 2016–
2017change
Crystal Methamphetamine (Ice) o
Tranquilizers b,k
Rohypnol r
Any Use
(Table continued on next page.)

1991 1992 1993 1994 1995 1996 1997 1998 1999 2000 2001 2002 2003 2004 2005 2006 2007 2008 2009 2010 2011 2012 2013 2014 2015 2016 2017
8th Grade 7.6 7.5 7.8 8.7 8.3 9.6 8.2 8.4 9.4 8.3 7.7 6.7 6.7 6.2 6.0 6.2 5.5 5.4 5.4 5.0 4.4 3.6 3.5 2.7 3.1 1.8 2.2 +0.5 s
10th Grade 20.5 18.1 19.8 20.3 20.8 21.3 22.4 21.1 22.5 23.5 21.9 18.3 18.2 18.5 17.6 18.8 18.1 14.4 15.5 14.7 13.7 14.5 12.8 11.2 10.3 9.0 8.9 -0.1
12th Grade 31.6 29.9 28.9 30.8 33.2 31.3 34.2 32.9 32.9 32.3 32.7 30.3 30.9 32.5 30.2 30.0 28.7 27.6 27.4 26.8 25.0 28.1 26.0 23.5 20.6 20.4 19.1 -1.3
Flavored Alcoholic Beverages e,n
8th Grade — — — — — — — — — — — — — 14.6 12.9 13.1 12.2 10.2 9.5 9.4 8.6 7.6 6.3 5.7 5.5 4.0 4.4 +0.4
10th Grade — — — — — — — — — — — — — 25.1 23.1 24.7 21.8 20.2 19.0 19.4 15.8 16.3 15.5 14.0 12.8 11.0 12.9 +1.9
12th Grade — — — — — — — — — — — — — 31.1 30.5 29.3 29.1 27.4 27.4 24.1 23.1 21.8 21.0 19.9 20.8 18.3 20.2 +1.9
8th Grade 14.3 15.5 16.7 18.6 19.1 21.0 19.4 19.1 17.5 14.6 12.2 10.7 10.2 9.2 9.3 8.7 7.1 6.8 6.5 7.1 6.1 4.9 4.5 4.0 3.6 2.6 1.9 -0.7 ss
10th Grade 20.8 21.5 24.7 25.4 27.9 30.4 29.8 27.6 25.7 23.9 21.3 17.7 16.7 16.0 14.9 14.5 14.0 12.3 13.1 13.6 11.8 10.8 9.1 7.2 6.3 4.9 5.0 +0.2
12th Grade 28.3 27.8 29.9 31.2 33.5 34.0 36.5 35.1 34.6 31.4 29.5 26.7 24.4 25.0 23.2 21.6 21.6 20.4 20.1 19.2 18.7 17.1 16.3 13.6 11.4 10.5 9.7 -0.8
8th Grade 6.9 7.0 6.6 7.7 7.1 7.1 5.5 4.8 4.5 4.2 4.0 3.3 4.1 4.1 3.3 3.7 3.2 3.5 3.7 4.1 3.5 2.8 2.8 3.0 3.2 2.5 1.7 -0.8 s
10th Grade 10.0 9.6 10.4 10.5 9.7 8.6 8.9 7.5 6.5 6.1 6.9 6.1 5.3 4.9 5.6 5.7 6.1 5.0 6.5 7.5 6.6 6.4 6.4 5.3 4.9 3.5 3.8 +0.3
12th Grade — 11.4 10.7 11.1 12.2 9.8 9.7 8.8 8.4 7.6 7.8 6.5 6.7 6.7 7.6 6.1 6.6 6.5 8.4 8.5 8.3 7.9 8.1 8.4 6.1 6.6 4.9 -1.7 s
Large Cigars bb
8th Grade — — — — — — — — — — — — — — — — — — — — — — — 1.9 2.4 1.5 1.5 0.0
10th Grade — — — — — — — — — — — — — — — — — — — — — — — 3.9 3.4 2.3 2.6 +0.4
12th Grade — — — — — — — — — — — — — — — — — — — — — — — 6.4 7.0 6.5 5.6 -0.9
Flavored Little Cigars bb
8th Grade — — — — — — — — — — — — — — — — — — — — — — — 4.1 4.1 2.8 2.6 -0.2
10th Grade — — — — — — — — — — — — — — — — — — — — — — — 6.9 6.1 4.9 4.0 -1.0
12th Grade — — — — — — — — — — — — — — — — — — — — — — — 11.9 11.4 9.5 10.1 +0.6
Smokeless Tobacco t
TABLE 3 (cont.)Trends in 30-Day Prevalence of Use of Various Drugs
in Grades 8, 10, and 12
Percentage who used in last 30 days 2016–
2017change
Been Drunk o
Cigarettes
Any Use
(Table continued on next page.)

1991 1992 1993 1994 1995 1996 1997 1998 1999 2000 2001 2002 2003 2004 2005 2006 2007 2008 2009 2010 2011 2012 2013 2014 2015 2016 2017
Regular Little Cigars bb
8th Grade — — — — — — — — — — — — — — — — — — — — — — — 2.5 3.3 1.9 1.6 -0.2
10th Grade — — — — — — — — — — — — — — — — — — — — — — — 4.4 3.8 3.0 3.0 0.0
12th Grade — — — — — — — — — — — — — — — — — — — — — — — 7.0 7.8 6.1 6.6 +0.4
Any Vaping bb
8th Grade — — — — — — — — — — — — — — — — — — — — — — — — 8.0 6.2‡ 6.6 —
10th Grade — — — — — — — — — — — — — — — — — — — — — — — — 14.2 11.0‡ 13.1 —
12th Grade — — — — — — — — — — — — — — — — — — — — — — — — 16.3 12.5‡ 16.6 —
Vaping Nicotine bb
8th Grade — — — — — — — — — — — — — — — — — — — — — — — — — — 3.5 —
10th Grade — — — — — — — — — — — — — — — — — — — — — — — — — — 8.2 —
12th Grade — — — — — — — — — — — — — — — — — — — — — — — — — — 11.0 —
Vaping Marijuana bb
8th Grade — — — — — — — — — — — — — — — — — — — — — — — — — — 1.6 —
10th Grade — — — — — — — — — — — — — — — — — — — — — — — — — — 4.3 —
12th Grade — — — — — — — — — — — — — — — — — — — — — — — — — — 4.9 —
Vaping Just Flavoring bb
8th Grade — — — — — — — — — — — — — — — — — — — — — — — — — — 5.3 —
10th Grade — — — — — — — — — — — — — — — — — — — — — — — — — — 9.2 —
12th Grade — — — — — — — — — — — — — — — — — — — — — — — — — — 9.7 —
Tobacco Using a Hookah bb
8th Grade — — — — — — — — — — — — — — — — — — — — — — — — — 2.8 2.5 -0.4
10th Grade — — — — — — — — — — — — — — — — — — — — — — — — — 4.0 3.0 -0.9 s
12th Grade — — — — — — — — — — — — — — — — — — — — — — — — — 6.1 5.0 -1.1
TABLE 3 (cont.)Trends in 30-Day Prevalence of Use of Various Drugs
in Grades 8, 10, and 12
Percentage who used in last 30 days 2016–
2017change
(Table continued on next page.)

1991 1992 1993 1994 1995 1996 1997 1998 1999 2000 2001 2002 2003 2004 2005 2006 2007 2008 2009 2010 2011 2012 2013 2014 2015 2016 2017
8th Grade 0.4 0.5 0.5 0.5 0.6 0.4 0.5 0.5 0.7 0.8 0.7 0.8 0.7 0.5 0.5 0.5 0.4 0.5 0.4 0.3 0.4 0.3 0.3 0.2 0.3 0.3 0.3 0.0
10th Grade 0.6 0.6 0.5 0.6 0.6 0.5 0.7 0.6 0.9 1.0 0.9 1.0 0.8 0.8 0.6 0.6 0.5 0.5 0.5 0.5 0.5 0.4 0.4 0.4 0.4 0.3 0.3 -0.1
12th Grade 0.8 0.6 0.7 0.9 0.7 0.7 1.0 1.1 0.9 0.8 1.3 1.4 1.3 1.6 0.9 1.1 1.0 1.0 1.0 1.1 0.7 0.9 1.0 0.9 1.0 0.7 0.8 +0.1
Previously surveyed drugs that have been dropped.
8th Grade — — — — — — — — — — — — — — — — — — — — — — — — — — — —
10th Grade — — — — — — — — — — — — — — — — — — — — — — — — — — — —
12th Grade 0.4 0.3 0.6 0.4 0.4 0.7 0.7 1.0 0.4 0.3 0.5 0.6 0.7 0.7 0.5 0.3 0.5 0.3 0.6 — — — — — — — — —
PCP e
8th Grade — — — — — — — — — — — — — — — — — — — — — — — — — — — —
10th Grade — — — — — — — — — — — — — — — — — — — — — — — — — — — —
12th Grade 0.5 0.6 1.0 0.7 0.6 1.3 0.7 1.0 0.8 0.9 0.5 0.4 0.6 0.4 0.7 0.4 0.5 0.6 0.5 0.8 0.8 0.5 0.4 — — — — —
8th Grade — — — — — — — — — — — — — — — — — — — — — — — — — — — —
10th Grade — — — — — — — — — — — — — — — — — — — — — — — — — — — —
12th Grade 0.2 0.4 0.1 0.4 0.4 0.6 0.3 0.6 0.4 0.2 0.5 0.3 0.4 0.5 0.5 0.4 0.4 0.2 0.3 0.2 0.2 0.3 — — — — — —
Source. The Monitoring the Future study, the University of Michigan.
Note: See footnotes following Table 4.
Nitrites e
Methaqualone e,k
TABLE 3 (cont.)Trends in 30-Day Prevalence of Use of Various Drugs
in Grades 8, 10, and 12
Percentage who used in last 30 days 2016–
2017change
Steroids k,u

1991 1992 1993 1994 1995 1996 1997 1998 1999 2000 2001 2002 2003 2004 2005 2006 2007 2008 2009 2010 2011 2012 2013 2014 2015 2016 2017
Daily aa
8th Grade 0.2 0.2 0.4 0.7 0.8 1.5 1.1 1.1 1.4 1.3 1.3 1.2 1.0 0.8 1.0 1.0 0.8 0.9 1.0 1.2 1.3 1.1 1.1 1.0 1.1 0.7 0.8 0.0 10th Grade 0.8 0.8 1.0 2.2 2.8 3.5 3.7 3.6 3.8 3.8 4.5 3.9 3.6 3.2 3.1 2.8 2.8 2.7 2.8 3.3 3.6 3.5 4.0 3.4 3.0 2.5 2.9 +0.4 12th Grade 2.0 1.9 2.4 3.6 4.6 4.9 5.8 5.6 6.0 6.0 5.8 6.0 6.0 5.6 5.0 5.0 5.1 5.4 5.2 6.1 6.6 6.5 6.5 5.8 6.0 6.0 5.9 -0.1
Any Daily Use 8th Grade 0.5 0.6‡ 1.0 1.0 0.7 1.0 0.8 0.9 1.0 0.8 0.9 0.7 0.8 0.6 0.5 0.5 0.6 0.7 0.5 0.5 0.4 0.3 0.3 0.3 0.2 0.2 0.2 0.0 10th Grade 1.3 1.2‡ 1.8 1.7 1.7 1.6 1.7 1.9 1.9 1.8 1.9 1.8 1.5 1.3 1.3 1.4 1.4 1.0 1.1 1.1 0.8 1.0 0.9 0.8 0.5 0.5 0.6 0.0 12th Grade 3.6 3.4‡ 3.4 2.9 3.5 3.7 3.9 3.9 3.4 2.9 3.6 3.5 3.2 2.8 3.1 3.0 3.1 2.8 2.5 2.7 2.1 2.5 2.2 1.9 1.9 1.3 1.6 +0.2
8th Grade 0.1 0.1 0.2 0.3 0.2 0.2 0.2 0.3 0.4 0.3 0.2 0.3 0.2 0.2 0.2 0.2 0.2 0.2 0.2 0.2 0.1 0.1 0.1 0.1 0.1 0.0 0.0 0.0
10th Grade 0.2 0.3 0.4 0.4 0.6 0.4 0.6 0.6 0.7 0.5 0.6 0.5 0.5 0.4 0.4 0.5 0.5 0.3 0.4 0.3 0.2 0.4 0.3 0.3 0.1 0.1 0.2 +0.1
12th Grade 0.9 0.8 0.9 1.2 1.3 1.6 2.0 1.5 1.9 1.7 1.4 1.2 1.6 1.8 1.5 1.6 1.3 1.4 1.1 1.6 1.3 1.5 1.3 1.1 0.8 0.8 1.1 +0.3
5+ Drinks in a Row
8th Grade 10.9 11.3 11.3 12.1 12.3 13.3 12.3 11.5 13.1 11.7 11.0 10.3 9.8 9.4 8.4 8.7 8.3 8.1 7.8 7.2 6.4 5.1 5.1 4.1 4.6 3.4 3.7 +0.3 10th Grade 21.0 19.1 21.0 21.9 22.0 22.8 23.1 22.4 23.5 24.1 22.8 20.3 20.0 19.9 19.0 19.9 19.6 16.0 17.5 16.3 14.7 15.6 13.7 12.6 10.9 9.7 9.8 +0.1 12th Grade 29.8 27.9 27.5 28.2 29.8 30.2 31.3 31.5 30.8 30.0 29.7 28.6 27.9 29.2 27.1 25.4 25.9 24.6 25.2 23.2 21.6 23.7 22.1 19.4 17.2 15.5 16.6 +1.1
Cigarettes Any Daily Use 8th Grade 7.2 7.0 8.3 8.8 9.3 10.4 9.0 8.8 8.1 7.4 5.5 5.1 4.5 4.4 4.0 4.0 3.0 3.1 2.7 2.9 2.4 1.9 1.8 1.4 1.3 0.9 0.6 -0.3 s 10th Grade 12.6 12.3 14.2 14.6 16.3 18.3 18.0 15.8 15.9 14.0 12.2 10.1 8.9 8.3 7.5 7.6 7.2 5.9 6.3 6.6 5.5 5.0 4.4 3.2 3.0 1.9 2.2 +0.4 12th Grade 18.5 17.2 19.0 19.4 21.6 22.2 24.6 22.4 23.1 20.6 19.0 16.9 15.8 15.6 13.6 12.2 12.3 11.4 11.2 10.7 10.3 9.3 8.5 6.7 5.5 4.8 4.2 -0.5
Daily o,aa
TABLE 4Trends in 30-Day Prevalence of Daily Use of Various Drugs
in Grades 8, 10, and 12(Entries are percentages.)
2016–2017
change
Marijuana/Hashish
Alcohol s,aa
Been Drunk
in Last 2 Weeks
(Table continued on next page.)

1991 1992 1993 1994 1995 1996 1997 1998 1999 2000 2001 2002 2003 2004 2005 2006 2007 2008 2009 2010 2011 2012 2013 2014 2015 2016 2017
1/2 Pack+/Day 8th Grade 3.1 2.9 3.5 3.6 3.4 4.3 3.5 3.6 3.3 2.8 2.3 2.1 1.8 1.7 1.7 1.5 1.1 1.2 1.0 0.9 0.7 0.6 0.7 0.5 0.4 0.3 0.2 -0.1 10th Grade 6.5 6.0 7.0 7.6 8.3 9.4 8.6 7.9 7.6 6.2 5.5 4.4 4.1 3.3 3.1 3.3 2.7 2.0 2.4 2.4 1.9 1.5 1.5 1.2 1.0 0.6 0.7 0.0 12th Grade 10.7 10.0 10.9 11.2 12.4 13.0 14.3 12.6 13.2 11.3 10.3 9.1 8.4 8.0 6.9 5.9 5.7 5.4 5.0 4.7 4.3 4.0 3.4 2.6 2.1 1.8 1.7 -0.1
8th Grade 1.6 1.8 1.5 1.9 1.2 1.5 1.0 1.0 0.9 0.9 1.2 0.8 0.8 1.0 0.7 0.7 0.8 0.8 0.8 0.9 0.8 0.5 0.5 0.5 0.8 0.6 0.4 -0.2 10th Grade 3.3 3.0 3.3 3.0 2.7 2.2 2.2 2.2 1.5 1.9 2.2 1.7 1.8 1.6 1.9 1.7 1.6 1.4 1.9 2.5 1.7 2.0 1.9 1.8 1.6 1.0 0.6 -0.4 12th Grade — 4.3 3.3 3.9 3.6 3.3 4.4 3.2 2.9 3.2 2.8 2.0 2.2 2.8 2.5 2.2 2.8 2.7 2.9 3.1 3.1 3.2 3.0 3.4 2.9 2.7 2.0 -0.7 Source. The Monitoring the Future study, the University of Michigan.
Note. See footnotes following Table 4.
Daily t
TABLE 4 (cont.)Trends in 30-Day Prevalence of Daily Use of Various Drugs
in Grades 8, 10, and 12(Entries are percentages.)
2016–2017
change
Smokeless Tobacco

ApproximateWeighted N s 1991 1992 1993 1994 1995 1996 1997 1998 1999 2000 2001 2002 2003 20048th Graders 17,500 18,600 18,300 17,300 17,500 17,800 18,600 18,100 16,700 16,700 16,200 15,100 16,500 17,00010th Graders 14,800 14,800 15,300 15,800 17,000 15,600 15,500 15,000 13,600 14,300 14,000 14,300 15,800 16,40012th Graders 15,000 15,800 16,300 15,400 15,400 14,300 15,400 15,200 13,600 12,800 12,800 12,900 14,600 14,600
ApproximateWeighted N s 2005 2006 2007 2008 2009 2010 2011 2012 2013 2014 2015 2016 20178th Graders 16,800 16,500 16,100 15,700 15,000 15,300 16,000 15,100 14,600 14,600 14,400 16,900 15,30010th Graders 16,200 16,200 16,100 15,100 15,900 15,200 14,900 15,000 12,900 13,000 15,600 14,700 13,50012th Graders 14,700 14,200 14,500 14,000 13,700 14,400 14,100 13,700 12,600 12,400 12,900 11,800 12,600
Notes. Level of significance of difference between the two most recent classes: s = .05, ss = .01, sss = .001. ' — ' indicates data not available. ' ‡ ' indicates that the question changed in the following year. See relevant footnote for that drug. Any apparent inconsistency between the change estimate and the prevalence estimates for the two most recent years is due to rounding.
aFor 12th graders only: Use of any illicit drug includes any use of marijuana, LSD, other hallucinogens, crack, cocaine other than crack, or heroin; or any use of narcotics other than heroin, amphetamines, sedatives (barbiturates), or tranquilizers not under a doctor’s orders. For 8th and 10th graders only: The use of narcotics other than heroin and sedatives (barbiturates) has been excluded because these younger respondents appear to overreport use (perhaps because they include the use of nonprescription drugs in their answers). Due to changesin the amphetamines questions 2013 data for all grades for any illicit drug use, any illicit drug use other than marijuana and 8th and 10th grade any illicit drug use including inhalants are based on one half of the N indicated. 12th grade any illicit drug use including inhalants data are based on one form; N is one sixth of N indicated. 2014 data are based on all forms. See the amphetamine note for details.bIn 2001 the question text was changed on half of the questionnaire forms for each age group. Other psychedelics was changed to other hallucinogens and shrooms was added to the list of examples. For the tranquilizer list of examples, Miltown was replaced with Xanax. For 8th, 10th, and 12th graders: The 2001 data presented here are based on the changed forms only; N is one half of N indicated. In 2002 the remaining forms were changed to the new wording. The data are based on all forms beginning in 2002. Data for any illicit drug other than marijuana and data for hallucinogens are also affected by these changes and have been handled in a parallel manner. Hallucinogens,LSD, and hallucinogens other than LSD are based on five of six forms beginning in 2014; N is five sixths of N indicated.cFor 12th graders only: Data based on five of six forms in 1991–1998; N is five sixths of N indicated. Data based on three of six forms beginning in 1999; N is three sixths of N indicated. For 8th and 10th graders only, beginning in 2014 data based on two thirds of N indicated.dInhalants are unadjusted for underreporting of amyl and butyl nitrites.eFor 12th graders only: Data based on one of six forms; N is one sixth of N indicated. In 2011 for flavored alcoholic beverages Skyy Blue andZima were dropped from the list of examples. An examination of the data did not show any effect from the wording change. In 2014 the PCP usequestions were dropped; annual PCP use was moved to another form. In 2016 a question on use of tobacco using a hookah was added totwo additional forms; N is three sixths of N indicated.fHallucinogens are unadjusted for underreporting of PCP.gFor 8th and 10th graders only: Data based on one of two forms in 1996; N is one half of N indicated. Data based on one third of N indicated in 1997–2001 due to changes in the questionnaire forms. Data based on two of four forms beginning in 2002; N is one half of N indicated. In 2014 a revised question on use of ecstasy (MDMA) including "Molly" was added to one form. The 2013 and 2014 "Original wording"data reported here are for only the questionnaires using the original question wording; N is one half of N indicated. Beginning in 2014 data
Footnotes for Tables 1 through 4
(Footnote continued on next page.)

reported here for the "Revised wording" are for only the questionnaires which include "Molly;" N is two sixths of N indicated in 2014 andfive sixths of the N indicated in 2015. For 12th graders only: Data based on one of six forms in 1996–2001; N is one sixth of N indicatedData based on two of six forms beginning in 2002; N is two sixths of N indicated. In 2014 a revised question on use of ecxtasy (MDMA) including"Molly" was added to one form. The 2013 and 2014 "Original wording" data reported here are for only the questionnaires using the originalquestion wording; N is two sixths of N indicated. Beginning in 2014 data reported for the "Revised wording" are for only the questionnaires which include "Molly."; N is one sixth of the N indicated in 2014 and three sixths of the N indicated in 2015.hFor 12th graders only: Data based on four of six forms; N is four sixths of N indicated.iIn 1995 the heroin question was changed in one of two forms for 8th and 10th graders and in three of six forms for 12th graders. Separate questions were asked for use with and without injection. In 1996, the heroin question was changed in the remaining 8th- and 10th-grade forms. Data presented here represent the combined data from all forms.jFor 8th and 10th graders only: Data based on one of two forms in 1995; N is one half of N indicated. Data based on all forms in 1996 through 2014. In 2015 the question was dropped from 1 form; N is four sixths of N indicated. For 12th graders only: Data based on three of six forms; N is three sixths of N indicated. kOnly drug use not under a doctor’s orders is included here.lIn 2002 the question text was changed in half of the questionnaire forms. The list of examples of narcotics other than heroin was updated: Talwin, laudanum, and paregoric—all of which had negligible rates of use by 2001—were replaced with Vicodin, OxyContin, and Percocet. The 2002 data presented here are based on the changed forms only; N is one half of N indicated. In 2003, the remaining forms were changed to the new wording. The data are based on all forms beginning in 2003. In 2013 the list of examples was changed on one form: MS Contin, Roxycodone, Hydrocodone (Lortab, Lorcet, Norco), Suboxone, Tylox, and Tramadol were addedto the list. An examination of the data did not show any effect from the wording change. mFor 8th, 10th, and 12th graders: In 2009, the question text was changed slightly in half of the forms. An examination of the data did not show any effect from the wording change. In 2010 the remaining forms were changed in a like manner. In 2011 the question text was changed slightly in one form; bennies, Benzedrine and Methadrine were dropped from the list of examples. An examination of the data did not show any effect from the wording change. In 2013 the question wording was changed slightly in two of the 8th and 10th grade questionnaires and in three of the 12th grade questionnaires. The new wording in 2013 asked "On how many occasions (if any) havetaken amphetamines or other prescription stimulant drugs…" In contrast, the old wording did not include the text highlighted in red.Results in 2013 indicated higher prevalence in questionnaires with the new wording as compared to the old wording; it was proportionally61% higher in 8th grade, 34% higher in 10th grade, and 21% higher in 12th grade. 2013 data are based on the changed forms only; for8th, 10th, and 12th graders N is one half of N indicated. Beginning in 2014 all questionnaires included the new, updated wording.nFor 8th and 10th graders only: Data based on one of four forms; N is one third of N indicated. See text for detailed explanation. In 2011 for flavored alcoholic beverages: Skyy Blue and Zima were dropped from the list of examples. An examination of the data did not show any effect from the wording change. Annual synthetic marijuana use questions asked of one third of N indicated.oFor 12th graders only: Data based on two of six forms; N is two sixths of N indicated. Bidis and kreteks based on one of six forms beginning in 2009; N is one sixth N indicated.pFor 12th graders only: In 2004 the barbiturate question text was changed on half of the questionnaire forms. Barbiturates was changed to sedatives including barbiturates, and “have you taken barbiturates . . . ” was changed to “have you taken sedatives . . . ” In the list of examples downs, downers, goofballs, yellow, reds, blues, rainbows were changed to downs, or downers, and include Phenobarbital, Tuinal, Nembutal, and Seconal. An examination of the data did not show any effect from the wording change. In 2005 the remaining forms were changed in a like manner. In 2013 the question text was changed in all forms: Tuinal, Nembutal, and Seconal were replacedwith Ambien, Lunesta, and Sonata. In one form the list of examples was also changed: Tuinal was dropped from the list and Dalmane,Restoril, Halcion, Intermezzo, and Zolpimist were added. An examination of the data did not show any effect from the wording change.
Footnotes for Tables 1 through 4 (cont.)
(Footnote continued on next page.)

qThe use of any prescription drug includes use of any of the following: amphetamines, sedatives (barbiturates), narcotics other than heroin, or tranquilizers “…without a doctor telling you to use them.”rFor 8th and 10th graders only: Data based on one of two forms in 1996; N is one half of N indicated. Data based on three of four forms in 1997–1998; N is two thirds of N indicated. Data based on two of four forms in 1999–2001; N is one third of N indicated. Data based on one of four forms beginning in 2002; N is one sixth of N indicated. See text for detailed explanation. For 12th graders only: Data based on one of six forms in 1996–2001; N is one sixth of N indicated. Data based on two of six forms in 2002–2009; N is two sixths of N indicated. Data for 2001 and 2002 are not comparable due to changes in the questionnaire forms. Data based on one of six forms beginning in 2010; N is one sixth of N indicated. sFor 8th, 10th, and 12th graders: In 1993, the question text was changed slightly in half of the forms to indicate that a drink meant more than just a few sips. The 1993 data are based on the changed forms only; N is one half of N indicated for these groups. In 1994 the remaining forms were changed to the new wording. The data are based on all forms beginning in 1994. In 2004, the question text was changed slightly in half of the forms. An examination of the data did not show any effect from the wording change. The remaining forms were changed in 2005.tFor 8th and 10th graders only: Data based on one of two forms for 1991–1996 and on two of four forms beginning in 1997; N is one half of N indicated. For 12th graders only: Data based on one of six forms; N is one sixth of N indicated. For all grades in 2011: snus and dissolvable tobacco were added to the list of examples. An examination of the data did not show any effect from the wording change. uFor 8th and 10th graders only: In 2006, the question text was changed slightly in half of the questionnaire forms. An examination of the data did not show any effect from the wording change. In 2007 the remaining forms were changed in a like manner. In 2008 the question text was changed slightly in half of the questionnaire forms. An examination of the data did not show any effect from the wording change. In 2009 the remaining forms were changed in a like manner. For 12th graders only: Data based on two of six forms in 1991–2005; N is two sixths of N indicated. Data based on three of six forms beginning in 2006; N is three sixths of N indicated. In 2006 a slightly altered version of the question was added to a third form. An examination of the data did not show any effect from the wording change. In 2007 the remaining forms were changed in a like manner. In 2008 the question text was changed slightly in two of the questionnaire forms. An examination of the data did not show any effect from the wording change. In 2009 the remaining form was changed in a like manner.vFor 12th graders only: Data based on two of six forms in 2002–2005; N is two sixths of N indicated. Data based on three of six forms beginning in 2006; N is three sixths of N indicated. wFor 12th graders only: Data based on two of six forms in 2000; N is two sixths of N indicated. Data based on three of six forms in 2001; N is three sixths of N indicated. Data based on one of six forms beginning in 2002; N is one sixth of N indicated. xFor 12th graders only: Data based on two of six forms in 2000; N is two sixths of N indicated. Data based on three of six forms in 2001–2009; N is three sixths of N indicated. Data based on two of six forms beginning in 2010; N is two sixths of N indicated. yThe 2003 flavored alcoholic beverage data were created by adjusting the 2004 data to reflect the change in the 2003 and 2004 alcopops data.zFor 8th and 10th graders only: Data based on one of four forms; N is one third of N indicated. See text for detailed explanation. For 12th graders only: Data based on two of six forms; N is two sixths of N indicated. For all grades: In 2011 the question text was “…had an alcoholic beverage containing caffeine (like Four Loko or Joose).” In 2012 the question text was changed to “…had an alcoholic beverage mixed with an energy drink (like Red Bull).” An examination of the data did not show any effect from the wording changes.aaDaily use is defined as use on 20 or more occasions in the past 30 days except for cigarettes and smokeless tobacco, for which actual daily use is measured, and for 5+ drinks, for which the prevalence of having five or more drinks in a row in the last two weeks is measured.bb8th and 10th grade data based on one third of N indicated. 12th grade data based on two of six forms; N is two sixths of N indicated.ccIn 2017, the surveys switched from asking about vaping in general to asking separately about vaping nicotine, marijuana, and just flavoring. Beginning in 2017, data presented for any vaping are based on these new questions.
Footnotes for Tables 1 through 4 (cont.)

1991 1992 1993 1994 1995 1996 1997 1998 1999 2000 2001 2002 2003 2004 2005
Try marijuana once or twice b 40.4 39.1 36.2 31.6 28.9 27.9 25.3 28.1 28.0 29.0 27.7 28.2 30.2 31.9 31.4Smoke marijuana occasionally b 57.9 56.3 53.8 48.6 45.9 44.3 43.1 45.0 45.7 47.4 46.3 46.0 48.6 50.5 48.9Smoke marijuana regularly b 83.8 82.0 79.6 74.3 73.0 70.9 72.7 73.0 73.3 74.8 72.2 71.7 74.2 76.2 73.9Try synthetic marijuana once or twice c — — — — — — — — — — — — — — —Take synthetic marijuana occasionally c — — — — — — — — — — — — — — —Try inhalants once or twice d 35.9 37.0 36.5 37.9 36.4 40.8 40.1 38.9 40.8 41.2 45.6 42.8 40.3 38.7 37.5Take inhalants regularly d 65.6 64.4 64.6 65.5 64.8 68.2 68.7 67.2 68.8 69.9 71.6 69.9 67.4 66.4 64.1Take LSD once or twice e — — 42.1 38.3 36.7 36.5 37.0 34.9 34.1 34.0 31.6 29.6 27.9 26.8 25.8Take LSD regularly e — — 68.3 65.8 64.4 63.6 64.1 59.6 58.8 57.5 52.9 49.3 48.2 45.2 44.0Try ecstasy (MDMA) once or twice f — — — — — — — — — — 35.8 38.9 41.9 42.5 40.0Take ecstasy (MDMA) occasionally f — — — — — — — — — — 55.5 61.8 65.8 65.1 60.8Try salvia once or twice c — — — — — — — — — — — — — — —Take salvia occasionally c — — — — — — — — — — — — — — —Try crack once or twice d 62.8 61.2 57.2 54.4 50.8 51.0 49.9 49.3 48.7 48.5 48.6 47.4 48.7 49.0 49.6Take crack occasionally d 82.2 79.6 76.8 74.4 72.1 71.6 71.2 70.6 70.6 70.1 70.0 69.7 70.3 70.4 69.4Try cocaine powder once or twice d 55.5 54.1 50.7 48.4 44.9 45.2 45.0 44.0 43.3 43.3 43.9 43.2 43.7 44.4 44.2Take cocaine powder occasionally d 77.0 74.3 71.8 69.1 66.4 65.7 65.8 65.2 65.4 65.5 65.8 64.9 65.8 66.0 65.3
Try heroin once or twice without using a needle e — — — — 60.1 61.3 63.0 62.8 63.0 62.0 61.1 62.6 62.7 61.6 61.4
Take heroin occasionally without using a needle e — — — — 76.8 76.6 79.2 79.0 78.9 78.6 78.5 78.5 77.8 77.5 76.8Try OxyContin once or twice c — — — — — — — — — — — — — — —Take OxyContin occasionally c — — — — — — — — — — — — — — — Table continued on next page.Try Vicodin once or twice c — — — — — — — — — — — — — — —Take Vicodin occasionally c — — — — — — — — — — — — — — —Try Adderall once or twice c — — — — — — — — — — — — — — —Take Adderall occasionally c — — — — — — — — — — — — — — —
Try bath salts (synthetic stimulants) once or twice c — — — — — — — — — — — — — — —
Take bath salts (synthetic stimulants) occasionally c — — — — — — — — — — — — — — —Try cough/cold medicine once or twice c — — — — — — — — — — — — — — —Take cough/cold medicine occasionally c — — — — — — — — — — — — — — —
Try one or two drinks of an alcoholic beverage (beer, wine, liquor) b 11.0 12.1 12.4 11.6 11.6 11.8 10.4 12.1 11.6 11.9 12.2 12.5 12.6 13.7 13.9Take one or two drinks nearly every day b 31.8 32.4 32.6 29.9 30.5 28.6 29.1 30.3 29.7 30.4 30.0 29.6 29.9 31.0 31.4
Have five or more drinks once or twice each weekend b 59.1 58.0 57.7 54.7 54.1 51.8 55.6 56.0 55.3 55.9 56.1 56.4 56.5 56.9 57.2Smoke one to five cigarettes per day c — — — — — — — — 26.9 28.9 30.5 32.8 33.4 37.0 37.5
Smoke one or more packs of cigarettes per day g 51.6 50.8 52.7 50.8 49.8 50.4 52.6 54.3 54.8 58.8 57.1 57.5 57.7 62.4 61.5
Use electronic cigarettes (e-cigarettes) regularly h — — — — — — — — — — — — — — —Vape an e-liquid with nicotine ocasionally c — — — — — — — — — — — — — — —Vape an e-liquid with nicotine regularly c — — — — — — — — — — — — — — —Smoke little cigars or cigarillos regularly c — — — — — — — — — — — — — — —
Use smokeless tobacco regularly 35.1 35.1 36.9 35.5 33.5 34.0 35.2 36.5 37.1 39.0 38.2 39.4 39.7 41.3 40.8Take dissolvable tobacco regularly c — — — — — — — — — — — — — — —Take snus regularly c — — — — — — — — — — — — — — —Take steroids i 64.2 69.5 70.2 67.6 — — — — — — — — — — —
Approximate weighted N = 17,400 18,700 18,400 17,400 17,500 17,900 18,800 18,100 16,700 16,700 16,200 15,100 16,500 17,000 16,800
How much do you think people risk harming themselves (physically or in other ways), if they . . .
TABLE 5
Percentage saying great risk
a
Trends in Harmfulness of Drugs as Perceived by 8th Graders

2006 2007 2008 2009 2010 2011 2012 2013 2014 2015 2016 2017Try marijuana once or twice b 32.2 32.8 31.1 29.5 29.5 28.2 26.0 24.1 23.0 23.0 22.8 22.0 -0.7 Smoke marijuana occasionally b 48.9 50.2 48.1 44.8 44.1 43.4 41.7 37.2 36.7 36.8 36.8 34.0 -2.8 ssSmoke marijuana regularly b 73.2 74.3 72.0 69.8 68.0 68.3 66.9 61.0 58.9 58.0 57.5 54.8 -2.7 sTry synthetic marijuana once or twice c — — — — — — 24.4 24.2 23.9 26.0 27.5 23.0 -4.4 sssTake synthetic marijuana occasionally c — — — — — — 36.8 36.2 32.4 33.5 35.4 30.4 -5.0 sssTry inhalants once or twice d 35.8 35.9 33.9 34.1 35.5 34.7 34.2 33.7 34.5 33.7 32.0 31.5 -0.5 Take inhalants regularly d 62.1 61.9 59.2 58.1 60.6 59.0 59.0 56.7 55.3 54.1 52.1 50.0 -2.1 Take LSD once or twice e 23.8 22.8 21.9 21.4 23.6 21.7 19.9 19.6 20.0 22.2 22.6 23.1 +0.5 Take LSD regularly e 40.0 38.5 36.9 37.0 38.6 37.8 35.0 34.5 33.7 37.0 36.8 37.9 +1.1 Try ecstasy (MDMA) once or twice f 32.8 30.4 28.6 26.0 27.0 25.4 23.6 24.1‡ 46.1 45.5 42.5 43.3 +0.7 Take ecstasy (MDMA) occasionally f 52.0 48.6 46.8 43.9 45.0 43.7 41.0 42.1‡ 59.7 58.5 54.0 54.6 +0.7 Try salvia once or twice c — — — — — — 9.5 8.5 — — — — —Take salvia occasionally c — — — — — — 16.1 14.6 — — — — —Try crack once or twice d 47.6 47.3 47.1 46.6 49.6 48.1 47.0 47.1 48.3 49.6 48.9 49.3 +0.4 Take crack occasionally d 68.7 68.3 67.9 66.6 68.4 67.7 67.8 66.5 65.5 65.7 65.7 66.9 +1.1 Try cocaine powder once or twice d 43.5 43.5 42.7 42.3 45.7 43.3 42.8 43.5 43.9 44.3 44.3 44.5 +0.3 Take cocaine powder occasionally d 64.0 64.2 62.7 62.3 64.2 63.5 63.3 62.7 61.8 61.6 62.4 62.7 +0.3 Try heroin once or twice without using a needle e 60.4 60.3 60.8 60.0 62.3 61.7 59.1 59.8 60.9 61.4 59.2 62.9 +3.7 ssTake heroin occasionally without using Table continued on next page. a needle e 75.3 76.4 75.5 74.0 76.7 75.9 75.1 73.4 73.2 72.7 70.3 74.7 +4.4 sssTry OxyContin once or twice c — — — — — — 21.9 19.9 22.1 20.2 21.3 21.0 -0.3 Take OxyContin occasionally c — — — — — — 35.3 32.6 34.4 32.5 33.5 32.6 -0.9 Try Vicodin once or twice c — — — — — — 17.5 15.0 18.4 16.9 18.3 17.1 -1.2 Take Vicodin occasionally c — — — — — — 29.4 26.2 28.2 26.7 28.8 26.7 -2.1 Try Adderall once or twice c — — — — — — 17.6 16.5 20.7 19.2 21.4 20.4 -1.0 Take Adderall occasionally c — — — — — — 29.9 28.3 32.5 32.0 35.9 33.8 -2.1 Try bath salts (synthetic stimulants) once or twice c — — — — — — 24.9 39.3 36.8 33.9 31.8 32.0 +0.1 Take bath salts (synthetic stimulants) occasionally c — — — — — — 38.8 51.9 49.1 45.5 42.5 43.1 +0.6 Try cough/cold medicine once or twice c — — — — — — 21.2 20.1 22.9 20.9 23.5 21.2 -2.3 sTake cough/cold medicine occasionally c — — — — — — 38.8 37.3 37.9 37.3 38.6 35.2 -3.4 sTry one or two drinks of an alcoholic beverage (beer, wine, liquor) b 14.2 14.9 13.5 14.4 14.9 14.5 13.9 13.7 14.8 15.3 14.7 14.2 -0.5 Take one or two drinks nearly every day b 31.3 32.6 31.5 31.5 32.3 31.8 31.4 30.6 31.0 30.9 30.7 30.0 -0.7 Have five or more drinks once or twice each weekend b 56.4 57.9 57.0 55.8 57.2 58.4 58.2 55.7 54.3 53.9 53.4 53.7 +0.3 Smoke one to five cigarettes per day c 37.0 38.6 38.6 38.6 38.2 37.4 40.4 42.8 41.9 41.7 43.2 41.9 -1.3 Smoke one or more packs of cigarettes per day g 59.4 61.1 59.8 59.1 60.9 62.5 62.6 62.4 62.1 63.0 61.2 62.1 +0.9 Use electronic cigarettes (e-cigarettes) regularly h — — — — — — — — 14.5 18.5 21.3 20.3 -1.0 Vape an e-liquid with nicotine ocasionally c — — — — — — — — — — — 21.4 —Vape an e-liquid with nicotine regularly c — — — — — — — — — — — 38.2 —Smoke little cigars or cigarillos regularly c — — — — — — — — 28.8 31.0 32.5 30.8 -1.7 Use smokeless tobacco regularly 39.5 41.8 41.0 40.8 41.8 40.8 37.8 36.2 34.5 36.6 35.1 34.8 -0.3 Take dissolvable tobacco regularly c — — — — — — 34.8 32.2 33.5 33.0 34.3 31.9 -2.4 Take snus regularly c — — — — — — 42.2 38.9 38.3 37.7 37.9 36.4 -1.5 Take steroids i — — — — — — — — — — — — —
Approximate weighted N = 16,500 16,100 15,700 15,000 15,300 16,000 15,100 14,600 14,600 14,400 16,900 15,300
How much do you think people risk harming themselves (physically or in other ways), if they . . .
2016–2017
change
Percentage saying great risk a
TABLE 5 (cont.)Trends in Harmfulness of Drugs as Perceived by 8th Graders

Source. The Monitoring the Future study, the University of Michigan.Notes. Level of significance of difference between the two most recent classes: s = .05, ss = .01, sss = .001. ' — ' indicates data not available. Any apparent inconsistency between the
change estimate and the prevalence estimates for the two most recent years is due to rounding. ''‡' indicates that the question changed the following year.aAnswer alternatives were: (1) No risk, (2) Slight risk, (3) Moderate risk, (4) Great risk, and (5) Can’t say, drug unfamiliar.bBeginning in 2012 data based on two thirds of N indicated.cData based on one third of N indicated.dBeginning in 1997, data based on two thirds of N indicated due to changes in questionnaire forms.eData based on one of two forms in 1993–1996; N is one half of N indicated. Beginning in 1997, data based on one third of N indicated due to changes in questionnaire forms.f Beginning in 2014 data are based on the revised question which included "Molly," N is one third of N indicated in 2014 and two thirds of N indicated in 2015. 2014 and 2015 data are not comparable to earlier years due to the revision of the question text.gBeginning in 1999, data based on two thirds of N indicated due to changes in questionnaire forms.hE-cigarette data based on two thirds of N indicated. Little cigars or cigarillos data based on one third N indicated.I Data based on two forms in 1991 and 1992. Data based on one of two forms in 1993 and 1994; N is one half of N indicated.
TABLE 5 (cont.)Trends in Harmfulness of Drugs as Perceived by 8th Graders

1991 1992 1993 1994 1995 1996 1997 1998 1999 2000 2001 2002 2003 2004 2005
Try marijuana once or twice b 30.0 31.9 29.7 24.4 21.5 20.0 18.8 19.6 19.2 18.5 17.9 19.9 21.1 22.0 22.3Smoke marijuana occasionally b 48.6 48.9 46.1 38.9 35.4 32.8 31.9 32.5 33.5 32.4 31.2 32.0 34.9 36.2 36.6Smoke marijuana regularly b 82.1 81.1 78.5 71.3 67.9 65.9 65.9 65.8 65.9 64.7 62.8 60.8 63.9 65.6 65.5Try synthetic marijuana once or twice c — — — — — — — — — — — — — — —Take synthetic marijuana occasionally c — — — — — — — — — — — — — — —Try inhalants once or twice d 37.8 38.7 40.9 42.7 41.6 47.2 47.5 45.8 48.2 46.6 49.9 48.7 47.7 46.7 45.7Take inhalants regularly d 69.8 67.9 69.6 71.5 71.8 75.8 74.5 73.3 76.3 75.0 76.4 73.4 72.2 73.0 71.2Take LSD once or twice e — — 48.7 46.5 44.7 45.1 44.5 43.5 45.0 43.0 41.3 40.1 40.8 40.6 40.3Take LSD regularly e — — 78.9 75.9 75.5 75.3 73.8 72.3 73.9 72.0 68.8 64.9 63.0 63.1 60.8Try ecstasy (MDMA) once or twice f — — — — — — — — — — 39.4 43.5 49.7 52.0 51.4Take ecstasy (MDMA) occasionally f — — — — — — — — — — 64.8 67.3 71.7 74.6 72.8Try salvia once or twice c — — — — — — — — — — — — — — —Take salvia occasionally c — — — — — — — — — — — — — — —Try crack once or twice d 70.4 69.6 66.6 64.7 60.9 60.9 59.2 58.0 57.8 56.1 57.1 57.4 57.6 56.7 57.0Take crack occasionally d 87.4 86.4 84.4 83.1 81.2 80.3 78.7 77.5 79.1 76.9 77.3 75.7 76.4 76.7 76.9Try cocaine powder once or twice d 59.1 59.2 57.5 56.4 53.5 53.6 52.2 50.9 51.6 48.8 50.6 51.3 51.8 50.7 51.3Take cocaine powder occasionally d 82.2 80.1 79.1 77.8 75.6 75.0 73.9 71.8 73.6 70.9 72.3 71.0 71.4 72.2 72.4
Try heroin once or twice without using a needle e — — — — 70.7 72.1 73.1 71.7 73.7 71.7 72.0 72.2 70.6 72.0 72.4
Take heroin occasionally without using a needle e — — — — 85.1 85.8 86.5 84.9 86.5 85.2 85.4 83.4 83.5 85.4 85.2Try OxyContin once or twice c — — — — — — — — — — — — — — —Take OxyContin occasionally c — — — — — — — — — — — — — — — Table continued on next page.Try Vicodin once or twice c — — — — — — — — — — — — — — —Take Vicodin occasionally c — — — — — — — — — — — — — — —Try Adderall once or twice c — — — — — — — — — — — — — — —Take Adderall occasionally c — — — — — — — — — — — — — — —
Try bath salts (synthetic stimulants) once or twice c — — — — — — — — — — — — — — —
Take bath salts (synthetic stimulants) occasionally c — — — — — — — — — — — — — — —Try cough/cold medicine once or twice c — — — — — — — — — — — — — — —Take cough/cold medicine occasionally c — — — — — — — — — — — — — — —
Try one or two drinks of an alcoholic beverage (beer, wine, liquor) b 9.0 10.1 10.9 9.4 9.3 8.9 9.0 10.1 10.5 9.6 9.8 11.5 11.5 10.8 11.5Take one or two drinks nearly every day b 36.1 36.8 35.9 32.5 31.7 31.2 31.8 31.9 32.9 32.3 31.5 31.0 30.9 31.3 32.6
Have five or more drinks once or twice each weekend b 54.7 55.9 54.9 52.9 52.0 50.9 51.8 52.5 51.9 51.0 50.7 51.7 51.6 51.7 53.3Smoke one to five cigarettes per day c — — — — — — — — 28.4 30.2 32.4 35.1 38.1 39.7 41.0
Smoke one or more packs of cigarettes per day g 60.3 59.3 60.7 59.0 57.0 57.9 59.9 61.9 62.7 65.9 64.7 64.3 65.7 68.4 68.1
Use electronic cigarettes (e-cigarettes) regularly h — — — — — — — — — — — — — — —Vape an e-liquid with nicotine ocasionally c — — — — — — — — — — — — — — —Vape an e-liquid with nicotine regularly c — — — — — — — — — — — — — — —Smoke little cigars or cigarillos regularly c — — — — — — — — — — — — — — —
Use smokeless tobacco regularly 40.3 39.6 44.2 42.2 38.2 41.0 42.2 42.8 44.2 46.7 46.2 46.9 48.0 47.8 46.1Take dissolvable tobacco regularly c — — — — — — — — — — — — — — —Take snus regularly c — — — — — — — — — — — — — — —Take steroids i 67.1 72.7 73.4 72.5 — — — — — — — — — — —
Approximate weighted N = 14,700 14,800 15,300 15,900 17,000 15,700 15,600 15,000 13,600 14,300 14,000 14,300 15,800 16,400 16,200
How much do you think people risk harming themselves (physically or in other ways), if they . . .
TABLE 6Trends in Harmfulness of Drugs as Perceived by 10th Graders
Percentage saying great risk a

2006 2007 2008 2009 2010 2011 2012 2013 2014 2015 2016 2017Try marijuana once or twice b 22.2 22.2 23.1 20.5 19.9 19.3 17.2 15.7 15.2 15.8 16.4 14.8 -1.6 Smoke marijuana occasionally b 35.6 36.0 37.0 32.9 30.9 30.1 26.8 25.1 23.9 24.7 24.4 21.9 -2.5 sSmoke marijuana regularly b 64.9 64.5 64.8 59.5 57.2 55.2 50.9 46.5 45.4 43.2 44.0 40.6 -3.4 ssTry synthetic marijuana once or twice c — — — — — — 24.6 24.1 25.0 26.3 26.8 25.1 -1.7 Take synthetic marijuana occasionally c — — — — — — 34.9 32.8 30.7 31.7 31.8 29.2 -2.5 Try inhalants once or twice d 43.9 43.0 41.2 42.0 42.5 42.4 42.4 43.0 43.1 43.1 40.7 37.9 -2.8 ssTake inhalants regularly d 70.2 68.6 66.8 66.8 67.1 66.2 66.1 65.9 64.7 63.1 59.7 57.7 -2.1 Take LSD once or twice e 38.8 35.4 34.6 34.9 33.9 34.2 34.7 34.7 34.5 36.4 34.4 31.6 -2.8 sTake LSD regularly e 60.7 56.8 55.7 56.7 56.1 54.9 56.4 55.9 54.8 58.3 55.2 53.0 -2.2 Try ecstasy (MDMA) once or twice f 48.4 45.3 43.2 38.9 36.3 37.2 36.2 36.0‡ 53.2 54.8 54.2 55.4 +1.2 Take ecstasy (MDMA) occasionally f 71.3 68.2 66.4 62.1 59.2 60.8 59.8 58.6‡ 69.0 70.1 69.3 68.6 -0.7 Try salvia once or twice c — — — — — — 12.2 10.7 — — — — —Take salvia occasionally c — — — — — — 20.3 17.1 — — — — —Try crack once or twice d 56.6 56.4 56.5 57.7 58.1 59.5 59.0 60.2 61.4 62.5 61.3 60.7 -0.7 Take crack occasionally d 76.2 76.0 76.5 75.9 76.2 76.5 76.7 77.8 76.4 77.5 75.2 75.1 -0.1 Try cocaine powder once or twice d 50.2 49.5 49.8 50.8 52.9 53.0 53.4 54.5 54.1 54.8 54.6 52.5 -2.1 sTake cocaine powder occasionally d 71.3 70.9 71.1 71.0 72.2 72.0 72.6 72.8 71.7 72.6 70.9 70.4 -0.5 Try heroin once or twice without using a needle e 70.0 70.5 70.8 72.2 73.0 72.9 72.6 73.2 72.6 74.1 73.3 72.2 -1.0 Take heroin occasionally without using a needle e 83.6 84.2 83.1 83.3 84.8 83.4 84.4 84.0 82.5 83.3 82.2 81.4 -0.8 Try OxyContin once or twice c — — — — — — 30.9 29.4 29.7 29.9 28.7 27.8 -1.0 Take OxyContin occasionally c — — — — — — 48.3 44.7 44.4 43.7 41.4 41.3 -0.1 Table continued on next page.Try Vicodin once or twice c — — — — — — 23.2 21.0 22.5 24.1 21.8 22.1 +0.3 Take Vicodin occasionally c — — — — — — 40.3 36.0 36.4 35.4 32.6 32.0 -0.6 Try Adderall once or twice c — — — — — — 19.7 17.6 22.2 22.9 22.5 21.6 -0.9 Take Adderall occasionally c — — — — — — 34.3 30.5 37.0 37.0 35.8 36.4 +0.6 Try bath salts (synthetic stimulants) once or twice c — — — — — — 32.3 50.1 49.6 49.1 42.7 42.5 -0.2 Take bath salts (synthetic stimulants) occasionally c — — — — — — 44.9 61.8 61.1 60.4 53.0 51.5 -1.5 Try cough/cold medicine once or twice c — — — — — — 23.6 21.6 22.9 24.0 24.0 21.8 -2.3 sTake cough/cold medicine occasionally c — — — — — — 40.4 37.3 38.3 38.2 37.6 36.4 -1.2 Try one or two drinks of an alcoholic beverage (beer, wine, liquor) b 11.1 11.6 12.6 11.9 11.9 12.3 11.3 11.3 11.6 12.4 13.3 12.5 -0.8 Take one or two drinks nearly every day b 31.7 33.3 35.0 33.8 33.1 32.9 31.8 30.6 31.3 31.2 32.2 30.9 -1.4 Have five or more drinks once or twice each weekend b 52.4 54.1 56.6 54.2 54.6 55.5 52.8 52.3 54.0 54.5 54.5 52.0 -2.5 sSmoke one to five cigarettes per day c 41.3 41.7 43.5 42.8 41.4 44.8 49.1 47.7 52.0 52.9 53.0 50.0 -3.0 sSmoke one or more packs of cigarettes per day g 67.7 68.2 69.1 67.3 67.2 69.8 71.6 70.8 72.0 72.9 71.5 69.8 -1.7 Use electronic cigarettes (e-cigarettes) regularly h — — — — — — — — 14.1 17.0 19.1 19.4 +0.3 Vape an e-liquid with nicotine ocasionally c — — — — — — — — — — — 18.8 —Vape an e-liquid with nicotine regularly c — — — — — — — — — — — 33.3 —Smoke little cigars or cigarillos regularly c — — — — — — — — 31.0 34.9 35.3 34.0 -1.3 Use smokeless tobacco regularly 45.9 46.7 48.0 44.7 43.7 45.7 42.9 40.0 39.9 42.5 43.0 40.7 -2.3 Take dissolvable tobacco regularly c — — — — — — 33.3 31.3 32.0 35.6 34.2 32.7 -1.6 Take snus regularly c — — — — — — 41.0 38.9 38.8 41.8 39.9 38.1 -1.8 Take steroids i — — — — — — — — — — — — —
Approximate weighted N = 16,200 16,100 15,100 15,900 15,200 14,900 15,000 12,900 13,000 15,600 14,700 13,500
2017change
How much do you think people risk harming themselves (physically or in other ways), if they . . .
2016–
TABLE 6 (cont.)Trends in Harmfulness of Drugs as Perceived by 10th Graders
Percentage saying great risk a

Source. The Monitoring the Future study, the University of Michigan.
Notes. Level of significance of difference between the two most recent classes: s = .05, ss = .01, sss = .001. ' — ' indicates data not available. Any apparent inconsistency between the change estimate and the prevalence estimates
for the two most recent years is due to rounding. '‡' indicates that the question changed the following year.aAnswer alternatives were: (1) No risk, (2) Slight risk, (3) Moderate risk, (4) Great risk, and (5) Can’t say, drug unfamiliar
bBeginning in 2012 data based on two thirds of N indicated.cData based on one third of N indicated.dBeginning in 1997, data based on two thirds of N indicated due to changes in questionnaire forms.eData based on one of two forms in 1993–1996; N is one half of N indicated. Beginning in 1997, data based on one third of N indicated due to changes in questionnaire forms.f Beginning in 2014 data are based on the revised question which included "Molly," N is one third of N indicated in 2014 and two thirds of N indicated in 2015. 2014 and 2015 data are not comparable to earlier years due to the revision
of the question text.gBeginning in 1999, data based on two thirds of N indicated due to changes in questionnaire forms.hE-cigarette data based on two thirds of N indicated. Little cigars or cigarillos data based on one third N indicated.iData based on two forms in 1991 and 1992. Data based on one of two forms in 1993 and 1994; N is one half of N indicated.
Trends in Harmfulness of Drugs as Perceived by 10th GradersTABLE 6 (cont.)

1975 1976 1977 1978 1979 1980 1981 1982 1983 1984 1985 1986 1987 1988 1989 1990Try marijuana once or twice 15.1 11.4 9.5 8.1 9.4 10.0 13.0 11.5 12.7 14.7 14.8 15.1 18.4 19.0 23.6 23.1Smoke marijuana occasionally 18.1 15.0 13.4 12.4 13.5 14.7 19.1 18.3 20.6 22.6 24.5 25.0 30.4 31.7 36.5 36.9Smoke marijuana regularly 43.3 38.6 36.4 34.9 42.0 50.4 57.6 60.4 62.8 66.9 70.4 71.3 73.5 77.0 77.5 77.8Try synthetic marijuana once or twice — — — — — — — — — — — — — — — —Take synthetic marijuana occasionally — — — — — — — — — — — — — — — —Try LSD once or twice 49.4 45.7 43.2 42.7 41.6 43.9 45.5 44.9 44.7 45.4 43.5 42.0 44.9 45.7 46.0 44.7Take LSD regularly 81.4 80.8 79.1 81.1 82.4 83.0 83.5 83.5 83.2 83.8 82.9 82.6 83.8 84.2 84.3 84.5Try PCP once or twice — — — — — — — — — — — — 55.6 58.8 56.6 55.2Try ecstasy (MDMA) once or twice b — — — — — — — — — — — — — — — —Try salvia once or twice c — — — — — — — — — — — — — — — —Take salvia occasionally — — — — — — — — — — — — — — — —Try cocaine once or twice 42.6 39.1 35.6 33.2 31.5 31.3 32.1 32.8 33.0 35.7 34.0 33.5 47.9 51.2 54.9 59.4Take cocaine occasionally — — — — — — — — — — — 54.2 66.8 69.2 71.8 73.9Take cocaine regularly 73.1 72.3 68.2 68.2 69.5 69.2 71.2 73.0 74.3 78.8 79.0 82.2 88.5 89.2 90.2 91.1Try crack once or twice — — — — — — — — — — — — 57.0 62.1 62.9 64.3Take crack occasionally — — — — — — — — — — — — 70.4 73.2 75.3 80.4Take crack regularly — — — — — — — — — — — — 84.6 84.8 85.6 91.6Try cocaine powder once or twice — — — — — — — — — — — — 45.3 51.7 53.8 53.9Take cocaine powder occasionally — — — — — — — — — — — — 56.8 61.9 65.8 71.1Take cocaine powder regularly — — — — — — — — — — — — 81.4 82.9 83.9 90.2Try heroin once or twice 60.1 58.9 55.8 52.9 50.4 52.1 52.9 51.1 50.8 49.8 47.3 45.8 53.6 54.0 53.8 55.4Take heroin occasionally 75.6 75.6 71.9 71.4 70.9 70.9 72.2 69.8 71.8 70.7 69.8 68.2 74.6 73.8 75.5 76.6Take heroin regularly 87.2 88.6 86.1 86.6 87.5 86.2 87.5 86.0 86.1 87.2 86.0 87.1 88.7 88.8 89.5 90.2Try heroin once or twice without using a needle — — — — — — — — — — — — — — — —Take heroin occasionally without using a needle — — — — — — — — — — — — — — — —Try any narcotic other than heroin (codeine, Vicodin, Table continued on next page. OxyContin, Percocet, etc.) once or twice — — — — — — — — — — — — — — — —Take any narcotic other than heroin occasionally — — — — — — — — — — — — — — — —Take any narcotic other than heroin regularly — — — — — — — — — — — — — — — —Try amphetamines once or twice d 35.4 33.4 30.8 29.9 29.7 29.7 26.4 25.3 24.7 25.4 25.2 25.1 29.1 29.6 32.8 32.2Take amphetamines regularly d 69.0 67.3 66.6 67.1 69.9 69.1 66.1 64.7 64.8 67.1 67.2 67.3 69.4 69.8 71.2 71.2Try Adderall once or twice e — — — — — — — — — — — — — — — —Try Adderall occasionally e — — — — — — — — — — — — — — — —Try crystal methamphetamine (ice) once or twice — — — — — — — — — — — — — — — —Try bath salts (synthetic stimulants) once or twice — — — — — — — — — — — — — — — —Take bath salts (synthetic stimulants) occasionally — — — — — — — — — — — — — — — —Try sedatives (barbiturates) once or twice f 34.8 32.5 31.2 31.3 30.7 30.9 28.4 27.5 27.0 27.4 26.1 25.4 30.9 29.7 32.2 32.4Take sedatives (barbiturates) regularly f 69.1 67.7 68.6 68.4 71.6 72.2 69.9 67.6 67.7 68.5 68.3 67.2 69.4 69.6 70.5 70.2Try one or two drinks of an alcoholic beverage (beer, wine, liquor) 5.3 4.8 4.1 3.4 4.1 3.8 4.6 3.5 4.2 4.6 5.0 4.6 6.2 6.0 6.0 8.3Take one or two drinks nearly every day 21.5 21.2 18.5 19.6 22.6 20.3 21.6 21.6 21.6 23.0 24.4 25.1 26.2 27.3 28.5 31.3Take four or five drinks nearly every day 63.5 61.0 62.9 63.1 66.2 65.7 64.5 65.5 66.8 68.4 69.8 66.5 69.7 68.5 69.8 70.9Have five or more drinks once or twice each weekend 37.8 37.0 34.7 34.5 34.9 35.9 36.3 36.0 38.6 41.7 43.0 39.1 41.9 42.6 44.0 47.1Smoke one or more packs of cigarettes per day 51.3 56.4 58.4 59.0 63.0 63.7 63.3 60.5 61.2 63.8 66.5 66.0 68.6 68.0 67.2 68.2Use electronic cigarettes (e-cigarettes) regularly g — — — — — — — — — — — — — — — —Vape an e-liquid with nicotine ocasionally g — — — — — — — — — — — — — — — —Vape an e-liquid with nicotine regularly g — — — — — — — — — — — — — — — —Smoke little cigars or cigarillos regularly — — — — — — — — — — — — — — — —
— — — — — — — — — — — 25.8 30.0 33.2 32.9 34.2Take steroids — — — — — — — — — — — — — — 63.8 69.9
Approximate weighted N = 2,804 2,918 3,052 3,770 3,250 3,234 3,604 3,557 3,305 3,262 3,250 3,020 3,315 3,276 2,796 2,553
TABLE 7Trends in Harmfulness of Drugs as Perceived by 12th Graders
How much do you think people risk harming themselves (physically or in other ways), if they . . .
Use smokeless tobacco regularly
Percentage saying great risk a

1991 1992 1993 1994 1995 1996 1997 1998 1999 2000 2001 2002 2003 2004 2005Try marijuana once or twice 27.1 24.5 21.9 19.5 16.3 15.6 14.9 16.7 15.7 13.7 15.3 16.1 16.1 15.9 16.1Smoke marijuana occasionally 40.6 39.6 35.6 30.1 25.6 25.9 24.7 24.4 23.9 23.4 23.5 23.2 26.6 25.4 25.8
Smoke marijuana regularly 78.6 76.5 72.5 65.0 60.8 59.9 58.1 58.5 57.4 58.3 57.4 53.0 54.9 54.6 58.0
Try synthetic marijuana once or twice — — — — — — — — — — — — — — —
Take synthetic marijuana occasionally — — — — — — — — — — — — — — —
Try LSD once or twice 46.6 42.3 39.5 38.8 36.4 36.2 34.7 37.4 34.9 34.3 33.2 36.7 36.2 36.2 36.5Take LSD regularly 84.3 81.8 79.4 79.1 78.1 77.8 76.6 76.5 76.1 75.9 74.1 73.9 72.3 70.2 69.9
Try PCP once or twice 51.7 54.8 50.8 51.5 49.1 51.0 48.8 46.8 44.8 45.0 46.2 48.3 45.2 47.1 46.6Try ecstasy (MDMA) once or twice b — — — — — — 33.8 34.5 35.0 37.9 45.7 52.2 56.3 57.7 60.1Try salvia once or twice c — — — — — — — — — — — — — — —
Take salvia occasionally — — — — — — — — — — — — — — —
Try cocaine once or twice 59.4 56.8 57.6 57.2 53.7 54.2 53.6 54.6 52.1 51.1 50.7 51.2 51.0 50.7 50.5
Take cocaine occasionally 75.5 75.1 73.3 73.7 70.8 72.1 72.4 70.1 70.1 69.5 69.9 68.3 69.1 67.2 66.7
Take cocaine regularly 90.4 90.2 90.1 89.3 87.9 88.3 87.1 86.3 85.8 86.2 84.1 84.5 83.0 82.2 82.8
Try crack once or twice 60.6 62.4 57.6 58.4 54.6 56.0 54.0 52.2 48.2 48.4 49.4 50.8 47.3 47.8 48.4
Take crack occasionally 76.5 76.3 73.9 73.8 72.8 71.4 70.3 68.7 67.3 65.8 65.4 65.6 64.0 64.5 63.8
Take crack regularly 90.1 89.3 87.5 89.6 88.6 88.0 86.2 85.3 85.4 85.3 85.8 84.1 83.2 83.5 83.3
Try cocaine powder once or twice 53.6 57.1 53.2 55.4 52.0 53.2 51.4 48.5 46.1 47.0 49.0 49.5 46.2 45.4 46.2
Take cocaine powder occasionally 69.8 70.8 68.6 70.6 69.1 68.8 67.7 65.4 64.2 64.7 63.2 64.4 61.4 61.6 60.8
Take cocaine powder regularly 88.9 88.4 87.0 88.6 87.8 86.8 86.0 84.1 84.6 85.5 84.4 84.2 82.3 81.7 82.7
Try heroin once or twice 55.2 50.9 50.7 52.8 50.9 52.5 56.7 57.8 56.0 54.2 55.6 56.0 58.0 56.6 55.2
Take heroin occasionally 74.9 74.2 72.0 72.1 71.0 74.8 76.3 76.9 77.3 74.6 75.9 76.6 78.5 75.7 76.0
Take heroin regularly 89.6 89.2 88.3 88.0 87.2 89.5 88.9 89.1 89.9 89.2 88.3 88.5 89.3 86.8 87.5
Try heroin once or twice without using a needle — — — — 55.6 58.6 60.5 59.6 58.5 61.6 60.7 60.6 58.9 61.2 60.5
Take heroin occasionally without using a needle — — — — 71.2 71.0 74.3 73.4 73.6 74.7 74.4 74.7 73.0 76.1 73.3
Try any narcotic other than heroin (codeine, Vicodin, Table continued on next page. OxyContin, Percocet, etc.) once or twice — — — — — — — — — — — — — — —
Take any narcotic other than heroin occasionally — — — — — — — — — — — — — — —
Take any narcotic other than heroin regularly — — — — — — — — — — — — — — —Try amphetamines once or twice d 36.3 32.6 31.3 31.4 28.8 30.8 31.0 35.3 32.2 32.6 34.7 34.4 36.8 35.7 37.7Take amphetamines regularly d 74.1 72.4 69.9 67.0 65.9 66.8 66.0 67.7 66.4 66.3 67.1 64.8 65.6 63.9 67.1Try Adderall once or twice e — — — — — — — — — — — — — — —Try Adderall occasionally e — — — — — — — — — — — — — — —
Try crystal methamphetamine (ice) once or twice 61.6 61.9 57.5 58.3 54.4 55.3 54.4 52.7 51.2 51.3 52.7 53.8 51.2 52.4 54.6
Try bath salts (synthetic stimulants)
once or twice — — — — — — — — — — — — — — —
Take bath salts (synthetic stimulants)
occasionally — — — — — — — — — — — — — — —Try sedatives (barbiturates) once or twice f 35.1 32.2 29.2 29.9 26.3 29.1 26.9 29.0 26.1 25.0 25.7 26.2 27.9‡ 24.9 24.7Take sedatives (barbiturates) regularly f 70.5 70.2 66.1 63.3 61.6 60.4 56.8 56.3 54.1 52.3 50.3 49.3 49.6‡ 54.0 54.1
Try one or two drinks of an alcoholic beverage
(beer, wine, liquor) 9.1 8.6 8.2 7.6 5.9 7.3 6.7 8.0 8.3 6.4 8.7 7.6 8.4 8.6 8.5
Take one or two drinks nearly every day 32.7 30.6 28.2 27.0 24.8 25.1 24.8 24.3 21.8 21.7 23.4 21.0 20.1 23.0 23.7
Take four or five drinks nearly every day 69.5 70.5 67.8 66.2 62.8 65.6 63.0 62.1 61.1 59.9 60.7 58.8 57.8 59.2 61.8
Have five or more drinks once or twice
each weekend 48.6 49.0 48.3 46.5 45.2 49.5 43.0 42.8 43.1 42.7 43.6 42.2 43.5 43.6 45.0
Smoke one or more packs of cigarettes per day 69.4 69.2 69.5 67.6 65.6 68.2 68.7 70.8 70.8 73.1 73.3 74.2 72.1 74.0 76.5
Use electronic cigarettes (e-cigarettes) regularly g — — — — — — — — — — — — — — —Vape an e-liquid with nicotine ocasionally g — — — — — — — — — — — — — — —Vape an e-liquid with nicotine regularly g — — — — — — — — — — — — — — —
Smoke little cigars or cigarillos regularly — — — — — — — — — — — — — — —
37.4 35.5 38.9 36.6 33.2 37.4 38.6 40.9 41.1 42.2 45.4 42.6 43.3 45.0 43.6
Take steroids 65.6 70.7 69.1 66.1 66.4 67.6 67.2 68.1 62.1 57.9 58.9 57.1 55.0 55.7 56.8
Approximate weighted N = 2,549 2,684 2,759 2,591 2,603 2,449 2,579 2,564 2,306 2,130 2,173 2,198 2,466 2,491 2,512
TABLE 7 (cont.) Trends in Harmfulness of Drugs as Perceived by 12th Graders
How much do you think people risk harming themselves (physically or in other ways), if they . . .
Percentage saying great risk a
Use smokeless tobacco regularly

2006 2007 2008 2009 2010 2011 2012 2013 2014 2015 2016 2017Try marijuana once or twice 17.8 18.6 17.4 18.5 17.1 15.6 14.8 14.5 12.5 12.3 12.9 11.9 -1.1 Smoke marijuana occasionally 25.9 27.1 25.8 27.4 24.5 22.7 20.6 19.5 16.4 15.8 17.1 14.1 -3.0 sSmoke marijuana regularly 57.9 54.8 51.7 52.4 46.8 45.7 44.1 39.5 36.1 31.9 31.1 29.0 -2.1 Try synthetic marijuana once or twice — — — — — — 23.5 25.9 32.5 33.0 35.6 33.0 -2.6 Take synthetic marijuana occasionally — — — — — — 32.7 36.2 39.4 40.9 43.9 40.0 -3.9 Try LSD once or twice 36.1 37.0 33.9 37.1 35.6 34.7 33.1 34.9 35.5 33.2 31.7 30.0 -1.7 Take LSD regularly 69.3 67.3 63.6 67.8 65.3 65.5 66.8 66.8 62.7 60.7 58.2 56.1 -2.1 Try PCP once or twice 47.0 48.0 47.4 49.7 52.4 53.9 51.6 53.9 53.8 54.4 55.1 53.6 -1.5 Try ecstasy (MDMA) once or twice b 59.3 58.1 57.0 53.3 50.6 49.0 49.4 47.5‡ 47.8 49.5 48.8 49.1 +0.3 Try salvia once or twice c — — — — 39.8 36.7‡ 13.8 12.9 14.1 13.1 13.0 10.2 -2.8 Take salvia occasionally — — — — — — 23.1 21.3 20.0 17.6 16.3 13.8 -2.5 Try cocaine once or twice 52.5 51.3 50.3 53.1 52.8 54.0 51.6 54.4 53.7 51.1 52.7 49.5 -3.2 Take cocaine occasionally 69.8 68.8 67.1 71.4 67.8 69.7 69.0 70.2 68.1 66.3 68.6 64.6 -4.0 sTake cocaine regularly 84.6 83.3 80.7 84.4 81.7 83.8 82.6 83.3 80.6 79.1 78.3 74.9 -3.5 Try crack once or twice 47.8 47.3 47.5 48.4 50.2 51.7 52.0 55.6 54.5 53.6 53.9 51.6 -2.3 Take crack occasionally 64.8 63.6 65.2 64.7 64.3 66.2 66.5 69.5 68.5 67.8 66.2 65.3 -0.9 Take crack regularly 82.8 82.6 83.4 84.0 83.8 83.9 84.0 85.4 82.0 81.2 81.9 79.8 -2.2 Try cocaine powder once or twice 45.8 45.1 45.1 46.5 48.2 48.0 48.1 49.9 49.9 49.0 49.3 45.1 -4.1 sTake cocaine powder occasionally 61.9 59.9 61.6 62.6 62.6 64.2 62.6 65.4 64.8 62.8 62.9 60.1 -2.8 Take cocaine powder regularly 82.1 81.5 82.5 83.4 81.8 83.3 83.3 83.9 81.5 80.1 80.7 78.8 -1.9 Try heroin once or twice 59.1 58.4 55.5 59.3 58.3 59.1 59.4 61.7 62.8 64.0 64.5 63.0 -1.5 Take heroin occasionally 79.1 76.2 75.3 79.7 74.8 77.2 78.0 78.2 77.9 78.0 78.7 74.6 -4.1 sTake heroin regularly 89.7 87.8 86.4 89.9 85.5 87.9 88.6 87.6 85.7 84.8 85.4 83.3 -2.2 Try heroin once or twice without using a needle 62.6 60.2 60.8 61.5 63.8 61.1 63.3 64.5 65.3 62.5 66.1 64.6 -1.5 Take heroin occasionally without using a needle 76.2 73.9 73.2 74.8 76.2 74.7 76.1 76.4 73.6 71.1 74.6 72.7 -1.9 Try any narcotic other than heroin (codeine, Vicodin, Table continued on next page. OxyContin, Percocet, etc.) once or twice — — — — 40.4 39.9 38.4 43.1 42.7 44.1 43.6 42.0 -1.6 Take any narcotic other than heroin occasionally — — — — 54.3 54.8 53.8 57.3 59.0 58.5 55.7 55.5 -0.2 Take any narcotic other than heroin regularly — — — — 74.9 75.5 73.9 75.8 72.7 73.9 72.4 70.8 -1.6 Try amphetamines once or twice d 39.5 41.3 39.2 41.9 40.6‡ 34.8 34.3 36.3 34.1 34.0 31.1 31.9 +0.8 Take amphetamines regularly d 68.1 68.1 65.4 69.0 63.6‡ 58.7 60.0 59.5 55.1 54.3 51.3 50.0 -1.3 Try Adderall once or twice e — — — — 33.3 31.2 27.2 31.8 33.6 34.3 32.5 32.0 -0.5 Try Adderall occasionally e — — — — 41.6 40.8 35.3 38.8 41.5 41.6 40.9 40.6 -0.3 Try crystal methamphetamine (ice) once or twice 59.1 60.2 62.2 63.4 64.9 66.5 67.8 72.2 70.2 70.0 70.0 69.3 -0.6 Try bath salts (synthetic stimulants) once or twice — — — — — — 33.2 59.5 59.2 57.5 54.9 51.3 -3.6 Take bath salts (synthetic stimulants) occasionally — — — — — — 45.0 69.9 68.8 67.4 64.2 61.5 -2.7 Try sedatives (barbiturates) once or twice f 28.0 27.9 25.9 29.6 28.0 27.8 27.8 29.4 29.6 28.9 27.4 26.9 -0.5 Take sedatives (barbiturates) regularly f 56.8 55.1 50.2 54.7 52.1 52.4 53.9 53.3 50.5 50.6 47.0 44.0 -3.0 Try one or two drinks of an alcoholic beverage (beer, wine, liquor) 9.3 10.5 10.0 9.4 10.8 9.4 8.7 9.9 8.6 10.3 9.5 9.3 -0.2 Take one or two drinks nearly every day 25.3 25.1 24.2 23.7 25.4 24.6 23.7 23.1 21.1 21.5 21.6 21.6 +0.1 Take four or five drinks nearly every day 63.4 61.8 60.8 62.4 61.1 62.3 63.6 62.4 61.2 59.1 59.1 58.7 -0.4 Have five or more drinks once or twice each weekend 47.6 45.8 46.3 48.0 46.3 47.6 48.8 45.8 45.4 46.9 48.4 45.7 -2.7 Smoke one or more packs of cigarettes per day 77.6 77.3 74.0 74.9 75.0 77.7 78.2 78.2 78.0 75.9 76.5 74.9 -1.6 Use electronic cigarettes (e-cigarettes) regularly g — — — — — — — — 14.2 16.2 18.2 16.1 -2.1 Vape an e-liquid with nicotine ocasionally g — — — — — — — — — — — 16.4 —Vape an e-liquid with nicotine regularly g — — — — — — — — — — — 27.0 —Smoke little cigars or cigarillos regularly — — — — — — — — 38.3 39.7 39.5 38.2 -1.3
45.9 44.0 42.9 40.8 41.2 42.6 44.3 41.6 40.7 38.5 38.1 38.4 +0.2 Take steroids 60.2 57.4 60.8 60.2 59.2 61.1 58.6 54.2 54.6 54.4 54.5 49.1 -5.4 ss
Approximate weighted N = 2,407 2,450 2,389 2,290 2,440 2,408 2,331 2,098 2,067 2,174 1,988 1,919
How much do you think people risk harming themselves (physically or in other ways), if they . . .
2016 – 2017 change
Trends in Harmfulness of Drugs as Perceived by 12th Graders
Percentage saying great risk a
Use smokeless tobacco regularly
TABLE 7 (cont.)

Source. The Monitoring the Future study, the University of Michigan.
Notes. Level of significance of difference between the two most recent classes: s = .05, ss = .01, sss = .001. ' — ' indicates data not available. ' ‡ ' indicates that the question changed the following year. See relevant
footnote for that drug. Any apparent inconsistency between the change estimate and the prevalence estimates for the two most recent years is due to rounding.
b Beginning in 2014 data are based on the revised question which included "Molly." 2014 and 2015 data are not comparable to earlier years due to the revision of the question text.cIn 2011 the question on perceived risk of using salvia once or twice appeared at the end of a form. In 2012 the question was moved to an earlier section of the same form. A question on perceived risk of using salvia
occasionally was also added following the question on perceived risk of trying salvia once or twice. These changes likely explain the discontinuity in the 2012 results.
eIn 2014 "(without a doctor's orders)" added to the questions on perceived risk of using Adderall.
discontinuity in the 2004 results.gBased on two of six forms; N is two times the N indicated.
fIn 2004 the question text was changed from barbiturates to sedatives/barbiturates and the list of examples was changed from downers, goofballs, reds, yellows, etc. to just downers. These changes likely explain the
aAnswer alternatives were: (1) No risk, (2) Slight risk, (3) Moderate risk, (4) Great risk, and (5) Can’t say, drug unfamiliar.
dIn 2011 the list of examples was changed from uppers, pep pills, bennies, speed to uppers, speed, Adderall, Ritalin, etc. These changes likely explain the discontinuity in the 2011 results.
TABLE 7 (cont.) Trends in Harmfulness of Drugs as Perceived by 12th Graders

Do you disapprove of people who . . .1991 1992 1993 1994 1995 1996 1997 1998 1999 2000 2001 2002 2003 2004 2005
Try marijuana once or twice b 84.6 82.1 79.2 72.9 70.7 67.5 67.6 69.0 70.7 72.5 72.4 73.3 73.8 75.9 75.3Smoke marijuana occasionally b 89.5 88.1 85.7 80.9 79.7 76.5 78.1 78.4 79.3 80.6 80.6 80.9 81.5 83.1 82.4Smoke marijuana regularly b 92.1 90.8 88.9 85.3 85.1 82.8 84.6 84.5 84.5 85.3 84.5 85.3 85.7 86.8 86.3Try inhalants once or twice c 84.9 84.0 82.5 81.6 81.8 82.9 84.1 83.0 85.2 85.4 86.6 86.1 85.1 85.1 84.6Take inhalants regularly
c 90.6 90.0 88.9 88.1 88.8 89.3 90.3 89.5 90.3 90.2 90.5 90.4 89.8 90.1 89.8Take LSD once or twice d — — 77.1 75.2 71.6 70.9 72.1 69.1 69.4 66.7 64.6 62.6 61.0 58.1 58.5Take LSD regularly
d — — 79.8 78.4 75.8 75.3 76.3 72.5 72.5 69.3 67.0 65.5 63.5 60.5 60.7Try ecstasy (MDMA) once or twice e — — — — — — — — — — 69.0 74.3 77.7 76.3 75.0Take ecstasy (MDMA) occasionally
e — — — — — — — — — — 73.6 78.6 81.3 79.4 77.9Try crack once or twice c 91.7 90.7 89.1 86.9 85.9 85.0 85.7 85.4 86.0 85.4 86.0 86.2 86.4 87.4 87.6Take crack occasionally c 93.3 92.5 91.7 89.9 89.8 89.3 90.3 89.5 89.9 88.8 89.8 89.6 89.8 90.3 90.5Try cocaine powder once or twice c 91.2 89.6 88.5 86.1 85.3 83.9 85.1 84.5 85.2 84.8 85.6 85.8 85.6 86.8 87.0Take cocaine powder occasionally c 93.1 92.4 91.6 89.7 89.7 88.7 90.1 89.3 89.9 88.8 89.6 89.9 89.8 90.3 90.7 Table continued on next page.Try heroin once or twice without using a needle d — — — — 85.8 85.0 87.7 87.3 88.0 87.2 87.2 87.8 86.9 86.6 86.9
Take heroin occasionally without using a needle d — — — — 88.5 87.7 90.1 89.7 90.2 88.9 88.9 89.6 89.0 88.6 88.5
Try one or two drinks of an alcoholic beverage (beer, wine, liquor) b 51.7 52.2 50.9 47.8 48.0 45.5 45.7 47.5 48.3 48.7 49.8 51.1 49.7 51.1 51.2Take one or two drinks nearly every day b 82.2 81.0 79.6 76.7 75.9 74.1 76.6 76.9 77.0 77.8 77.4 78.3 77.1 78.6 78.7
Have five or more drinks once or twice each weekend b 85.2 83.9 83.3 80.7 80.7 79.1 81.3 81.0 80.3 81.2 81.6 81.9 81.9 82.3 82.9Smoke one to five cigarettes per day
e — — — — — — — — 75.1 79.1 80.4 81.1 81.4 83.1 82.9
Smoke one or more packs of cigarettes per day
f 82.8 82.3 80.6 78.4 78.6 77.3 80.3 80.0 81.4 81.9 83.5 84.6 84.6 85.7 85.3
Use electronic cigarettes (e-cigarettes) regularly e — — — — — — — — — — — — — — —Vape an e-liquid with nicotine ocasionally e — — — — — — — — — — — — — — —Vape an e-liquid with nicotine regularly e — — — — — — — — — — — — — — —Use smokeless tobacco regularly b 79.1 77.2 77.1 75.1 74.0 74.1 76.5 76.3 78.0 79.2 79.4 80.6 80.7 81.0 82.0Take steroids g 89.8 90.3 89.9 87.9 — — — — — — — — — — —
Approximate weighted N = 17,400 18,500 18,400 17,400 17,600 18,000 18,800 18,100 16,700 16,700 16,200 15,100 16,500 17,000 16,800
(Table continued on next page.)
Percentage who disapprove or strongly disapprove a
TABLE 8Trends in Disapproval of Drug Use in Grade 8

Do you disapprove of people who . . .2006 2007 2008 2009 2010 2011 2012 2013 2014 2015 2016 2017
Try marijuana once or twice b 76.0 78.7 76.6 75.3 73.5 74.4 75.1 72.0 70.5 70.3 70.1 67.3 -2.8 sSmoke marijuana occasionally b 82.2 84.5 82.6 81.9 79.9 81.1 81.6 78.8 77.7 77.5 77.5 75.5 -2.1 Smoke marijuana regularly b 86.1 87.7 86.8 85.9 84.3 85.7 85.6 83.8 82.2 82.2 82.3 81.2 -1.1 Try inhalants once or twice c 83.4 84.1 82.3 83.1 83.1 82.9 83.1 81.6 80.7 80.6 78.3 77.4 -0.8 Take inhalants regularly
c 89.0 89.5 88.5 88.4 88.9 88.5 88.6 86.8 85.5 85.4 83.3 82.8 -0.5 Take LSD once or twice d 53.9 53.5 52.6 53.2 53.7 55.4 51.8 52.0 52.8 56.0 55.2 56.1 +0.8 Take LSD regularly
d 55.8 55.6 54.7 55.7 55.8 57.6 54.1 53.6 54.8 58.1 57.6 58.2 +0.6 Try ecstasy (MDMA) once or twice e 66.7 65.7 63.5 62.3 62.4 64.2 60.2 60.9 61.0‡ 68.2 64.8 63.0 -1.8 Take ecstasy (MDMA) occasionally
e 69.8 68.3 66.5 65.7 65.9 67.5 63.2 63.4 64.1‡ 71.7 67.5 65.8 -1.7 Try crack once or twice c 87.2 88.6 87.2 88.4 89.1 88.5 89.0 88.1 88.0 87.5 87.0 87.5 +0.5 Take crack occasionally c 90.0 91.2 90.3 91.0 91.5 91.0 91.2 90.3 89.8 89.8 88.8 89.6 +0.8 Try cocaine powder once or twice c 86.5 88.2 86.8 88.1 88.4 88.3 88.6 88.0 87.7 87.5 86.8 86.8 0.0 Take cocaine powder occasionally c 90.2 91.0 90.1 90.7 91.4 91.3 91.5 90.6 90.1 90.1 89.3 90.0 +0.6 Table continued on next page.Try heroin once or twice without using a needle d 87.2 88.4 86.9 88.6 89.5 87.5 86.8 87.2 87.1 87.1 85.6 87.9 +2.4 s
Take heroin occasionally without using a needle d 88.5 89.7 88.2 90.1 90.6 89.0 87.7 88.2 88.1 88.0 86.7 88.7 +2.0
Try one or two drinks of an alcoholic beverage (beer, wine, liquor) b 51.3 54.0 52.5 52.7 54.2 54.0 54.1 53.3 53.3 53.7 52.6 51.0 -1.6 Take one or two drinks nearly every day b 78.7 80.4 79.2 78.5 79.5 80.7 81.3 80.2 79.6 79.7 79.1 79.5 +0.4
Have five or more drinks once or twice each weekend b 82.0 83.8 83.2 83.2 83.6 84.8 86.0 85.0 84.9 85.4 84.9 84.7 -0.2 Smoke one to five cigarettes per day
e 83.5 85.3 85.0 83.6 84.7 86.8 — — — — — — —
Smoke one or more packs of cigarettes per day
f 85.6 87.0 86.7 87.1 87.0 88.0 88.8 88.0 87.5 88.8 88.1 88.8 +0.7
Use electronic cigarettes (e-cigarettes) regularly e — — — — — — — — 58.4 65.0 66.6 — —Vape an e-liquid with nicotine ocasionally e — — — — — — — — — — — 72.0 —Vape an e-liquid with nicotine regularly e — — — — — — — — — — — 79.8 —Use smokeless tobacco regularly b 81.0 82.3 82.1 81.5 81.2 82.6 82.7 81.5 80.2 82.5 81.1 81.3 +0.3 Take steroids g — — — — — — — — — — — — —
Approximate weighted N = 16,500 16,100 15,700 15,000 15,300 16,000 15,100 14,600 14,600 14,400 16,900 15,300
(Table continued on next page.)
change2016–2017
Percentage who disapprove or strongly disapprove a
TABLE 8 (cont.)Trends in Disapproval of Drug Use in Grade 8

Source. The Monitoring the Future study, the University of Michigan.
Notes. Level of significance of difference between the two most recent classes: s = .05, ss = .01, sss = .001. ' — ' indicates data not available. Any apparent inconsistency between the
change estimate and the prevalence estimates for the two most recent years is due to rounding. ' ‡ ' indicates that the question changed the following year. aAnswer alternatives were: (1) Don’t disapprove, (2) Disapprove, (3) Strongly disapprove, and (4) Can’t say, drug unfamiliar. Percentages are shown for categories (2) and (3) combined.bBeginning in 2012, data based on two thirds of N indicated. cBeginning in 1997, data based on two thirds of N indicated due to changes in questionnaire forms.dData based on one of two forms in 1993–1996; N is one half of N indicated. Beginning in 1997, data based on one third of N indicated due to changes in questionnaire forms.eData based on one third of N indicated. For MDMA "Molly" was added to the question text in 2015; 2014 and 2015 data are not comparable due to this change.fBeginning in 1999, data based on two thirds of N indicated due to changes in questionnaire forms.gData based on two forms in 1991 and 1992. Data based on one of two forms in 1993 and 1994; N is one half of N indicated.
TABLE 8 (cont.)Trends in Disapproval of Drug Use in Grade 8

Do you disapprove of people who . . .1991 1992 1993 1994 1995 1996 1997 1998 1999 2000 2001 2002 2003 2004 2005
Try marijuana once or twice b 74.6 74.8 70.3 62.4 59.8 55.5 54.1 56.0 56.2 54.9 54.8 57.8 58.1 60.4 61.3Smoke marijuana occasionally b 83.7 83.6 79.4 72.3 70.0 66.9 66.2 67.3 68.2 67.2 66.2 68.3 68.4 70.8 71.9Smoke marijuana regularly b 90.4 90.0 87.4 82.2 81.1 79.7 79.7 80.1 79.8 79.1 78.0 78.6 78.8 81.3 82.0Try inhalants once or twice c 85.2 85.6 84.8 84.9 84.5 86.0 86.9 85.6 88.4 87.5 87.8 88.6 87.7 88.5 88.1Take inhalants regularly
c 91.0 91.5 90.9 91.0 90.9 91.7 91.7 91.1 92.4 91.8 91.3 91.8 91.0 92.3 91.9Take LSD once or twice d — — 82.1 79.3 77.9 76.8 76.6 76.7 77.8 77.0 75.4 74.6 74.4 72.4 71.8Take LSD regularly
d — — 86.8 85.6 84.8 84.5 83.4 82.9 84.3 82.1 80.8 79.4 77.6 75.9 75.0Try ecstasy (MDMA) once or twice e — — — — — — — — — — 72.6 77.4 81.0 83.7 83.1Take ecstasy (MDMA) occasionally
e — — — — — — — — — — 81.0 84.6 86.3 88.0 87.4Try crack once or twice c 92.5 92.5 91.4 89.9 88.7 88.2 87.4 87.1 87.8 87.1 86.9 88.0 87.6 88.6 88.8Take crack occasionally
c 94.3 94.4 93.6 92.5 91.7 91.9 91.0 90.6 91.5 90.9 90.6 91.0 91.0 91.8 91.8Try cocaine powder once or twice c 90.8 91.1 90.0 88.1 86.8 86.1 85.1 84.9 86.0 84.8 85.3 86.4 85.9 86.8 86.9 Table continued on next page.Take cocaine powder occasionally
c 94.0 94.0 93.2 92.1 91.4 91.1 90.4 89.7 90.7 89.9 90.2 89.9 90.4 91.2 91.2
Try heroin once or twice without using a needle d — — — — 89.7 89.5 89.1 88.6 90.1 90.1 89.1 89.2 89.3 90.1 90.3
Take heroin occasionally without using a needle d — — — — 91.6 91.7 91.4 90.5 91.8 92.3 90.8 90.7 90.6 91.8 92.0
Try one or two drinks of an alcoholic beverage (beer, wine, liquor) b 37.6 39.9 38.5 36.5 36.1 34.2 33.7 34.7 35.1 33.4 34.7 37.7 36.8 37.6 38.5Take one or two drinks nearly every day b 81.7 81.7 78.6 75.2 75.4 73.8 75.4 74.6 75.4 73.8 73.8 74.9 74.2 75.1 76.9
Have five or more drinks once or twice each weekend b 76.7 77.6 74.7 72.3 72.2 70.7 70.2 70.5 69.9 68.2 69.2 71.5 71.6 71.8 73.7Smoke one to five cigarettes per day
e — — — — — — — — 67.8 69.1 71.2 74.3 76.2 77.5 79.3
Smoke one or more packs of cigarettes per day
f 79.4 77.8 76.5 73.9 73.2 71.6 73.8 75.3 76.1 76.7 78.2 80.6 81.4 82.7 84.3
Use electronic cigarettes (e-cigarettes) regularly e — — — — — — — — — — — — — — —Vape an e-liquid with nicotine ocasionally e — — — — — — — — — — — — — — —Vape an e-liquid with nicotine regularly e — — — — — — — — — — — — — — —Use smokeless tobacco regularly b 75.4 74.6 73.8 71.2 71.0 71.0 72.3 73.2 75.1 75.8 76.1 78.7 79.4 80.2 80.5Take steroids g 90.0 91.0 91.2 90.8 — — — — — — — — — — —
Approximate weighted N = 14,800 14,800 15,300 15,900 17,000 15,700 15,600 15,000 13,600 14,300 14,000 14,300 15,800 16,400 16,200
TABLE 9Trends in Disapproval of Drug Use in Grade 10
Percentage who disapprove or strongly disapprove a

Do you disapprove of people who . . .2006 2007 2008 2009 2010 2011 2012 2013 2014 2015 2016 2017
Try marijuana once or twice b 62.5 63.9 64.5 60.1 59.2 58.5 56.2 53.2 53.8 52.7 52.6 48.1 -4.6 sssSmoke marijuana occasionally b 72.6 73.3 73.6 69.2 68.0 67.9 65.7 62.1 62.9 62.6 61.9 58.1 -3.8 ssSmoke marijuana regularly b 82.5 82.4 83.0 79.9 78.7 78.8 77.3 73.8 74.6 74.3 73.5 70.2 -3.3 ssTry inhalants once or twice c 88.1 87.6 87.1 87.0 86.5 86.9 85.7 86.1 85.9 84.1 83.3 80.7 -2.6 sTake inhalants regularly
c 92.2 91.8 91.6 91.1 90.8 90.9 90.0 89.7 89.7 88.3 87.1 85.4 -1.8 Take LSD once or twice d 71.2 67.7 66.3 67.8 68.2 68.5 68.3 69.1 67.8 70.3 69.5 66.9 -2.7 Take LSD regularly
d 74.9 71.5 69.8 72.2 72.9 72.5 73.0 74.2 73.3 76.5 74.9 74.5 -0.4 Try ecstasy (MDMA) once or twice e 81.6 80.0 78.1 76.5 75.5 76.1 75.3 75.4 74.4‡ 78.0 76.8 74.7 -2.1 Take ecstasy (MDMA) occasionally
e 86.0 84.3 83.0 81.3 81.3 82.2 81.2 81.3 80.4‡ 84.0 81.7 80.0 -1.7 Try crack once or twice c 89.5 89.5 90.8 90.4 90.3 90.9 91.0 90.6 90.6 90.1 89.7 88.4 -1.3 Take crack occasionally
c 92.0 92.7 92.9 92.8 92.4 93.0 93.0 92.4 92.4 92.1 91.1 90.0 -1.0 Try cocaine powder once or twice c 87.3 87.7 88.6 88.4 89.0 89.4 89.3 88.7 88.9 87.9 87.9 86.1 -1.8 sTake cocaine powder occasionally
c 91.4 92.0 92.1 92.1 92.2 92.5 92.4 91.8 91.9 91.8 90.8 89.9 -0.9 Table continued on next page.Try heroin once or twice without using a needle d 91.1 90.7 91.4 91.6 91.4 91.6 91.9 91.3 91.9 91.7 90.2 89.7 -0.5
Take heroin occasionally without using a needle d 92.5 92.5 92.5 93.0 92.4 92.4 92.9 92.3 92.7 92.7 90.9 90.5 -0.5
Try one or two drinks of an alcoholic beverage (beer, wine, liquor) b 37.8 39.5 41.8 39.7 40.3 41.5 39.6 38.5 40.7 40.0 41.8 39.3 -2.5 sTake one or two drinks nearly every day b 76.4 77.1 79.1 77.6 77.6 80.0 78.0 77.1 77.9 78.2 78.6 77.7 -0.9
Have five or more drinks once or twice each weekend b 72.9 74.1 77.2 75.1 75.9 77.3 77.5 77.8 79.5 79.6 80.8 80.1 -0.7 Smoke one to five cigarettes per day
e 80.2 79.7 82.5 80.0 80.6 82.1 — — — — — — —
Smoke one or more packs of cigarettes per day
f 83.2 84.7 85.2 84.5 83.9 85.8 86.0 86.1 88.0 88.3 88.5 87.8 -0.8
Use electronic cigarettes (e-cigarettes) regularly e — — — — — — — — 54.6 59.9 65.0 — —Vape an e-liquid with nicotine ocasionally e — — — — — — — — — — — 64.2 —Vape an e-liquid with nicotine regularly e — — — — — — — — — — — 73.9 —Use smokeless tobacco regularly b 80.5 80.9 81.8 79.5 78.5 79.5 79.5 77.7 78.7 80.1 81.2 80.7 -0.5 Take steroids g — — — — — — — — — — — — —
Approximate weighted N = 16,200 16,100 15,100 15,900 15,200 14,900 15,000 12,900 13,000 15,600 14,700 13,500
Percentage who disapprove or strongly disapprove a
2016–2017change
TABLE 9 (cont.)Trends in Disapproval of Drug Use in Grade 10

Source. The Monitoring the Future study, the University of Michigan.
Notes. Level of significance of difference between the two most recent classes: s = .05, ss = .01, sss = .001. ' — ' indicates data not available. Any apparent inconsistency between the
change estimate and the prevalence estimates for the two most recent years is due to rounding. ' ‡ ' indicates that the question changed the following year.aAnswer alternatives were: (1) Don’t disapprove, (2) Disapprove, (3) Strongly disapprove, and (4) Can’t say, drug unfamiliar. Percentages are shown for categories (2) and (3) combined.bBeginning in 2012, data based on two thirds of N indicated.cBeginning in 1997, data based on two thirds of N indicated due to changes in questionnaire forms.dData based on one of two forms in 1993–1996; N is one half of N indicated. Beginning in 1997, data based on one third of N indicated due to changes in questionnaire forms. eData based on one third of N indicated. For MDMA "Molly" was added to the question text in 2015; 2014 and 2015 data are not comparable due to this change.fBeginning in 1999, data based on two thirds of N indicated due to changes in questionnaire forms.gData based on two forms in 1991 and 1992. Data based on one of two forms in 1993 and 1994; N is one half of N indicated.
TABLE 9 (cont.)Trends in Disapproval of Drug Use in Grade 10

1975 1976 1977 1978 1979 1980 1981 1982 1983 1984 1985 1986 1987 1988 1989 1990
Trying marijuana once or twice 47.0 38.4 33.4 33.4 34.2 39.0 40.0 45.5 46.3 49.3 51.4 54.6 56.6 60.8 64.6 67.8
Smoking marijuana occasionally 54.8 47.8 44.3 43.5 45.3 49.7 52.6 59.1 60.7 63.5 65.8 69.0 71.6 74.0 77.2 80.5
Smoking marijuana regularly 71.9 69.5 65.5 67.5 69.2 74.6 77.4 80.6 82.5 84.7 85.5 86.6 89.2 89.3 89.8 91.0
Trying LSD once or twice 82.8 84.6 83.9 85.4 86.6 87.3 86.4 88.8 89.1 88.9 89.5 89.2 91.6 89.8 89.7 89.8
Taking LSD regularly 94.1 95.3 95.8 96.4 96.9 96.7 96.8 96.7 97.0 96.8 97.0 96.6 97.8 96.4 96.4 96.3Trying ecstasy (MDMA) once or twice c — — — — — — — — — — — — — — — —
Trying cocaine once or twice 81.3 82.4 79.1 77.0 74.7 76.3 74.6 76.6 77.0 79.7 79.3 80.2 87.3 89.1 90.5 91.5
Taking cocaine regularly 93.3 93.9 92.1 91.9 90.8 91.1 90.7 91.5 93.2 94.5 93.8 94.3 96.7 96.2 96.4 96.7
Trying crack once or twice — — — — — — — — — — — — — — — 92.3
Taking crack occasionally — — — — — — — — — — — — — — — 94.3
Taking crack regularly — — — — — — — — — — — — — — — 94.9
Trying cocaine powder once or twice — — — — — — — — — — — — — — — 87.9
Taking cocaine powder occasionally — — — — — — — — — — — — — — — 92.1
Taking cocaine powder regularly — — — — — — — — — — — — — — — 93.7 Table continued on next page.Trying heroin once or twice 91.5 92.6 92.5 92.0 93.4 93.5 93.5 94.6 94.3 94.0 94.0 93.3 96.2 95.0 95.4 95.1
Taking heroin occasionally 94.8 96.0 96.0 96.4 96.8 96.7 97.2 96.9 96.9 97.1 96.8 96.6 97.9 96.9 97.2 96.7
Taking heroin regularly 96.7 97.5 97.2 97.8 97.9 97.6 97.8 97.5 97.7 98.0 97.6 97.6 98.1 97.2 97.4 97.5
Trying heroin once or twice without using a needle — — — — — — — — — — — — — — — —
Taking heroin occasionally without using a needle — — — — — — — — — — — — — — — —Trying amphetamines once or twice d 74.8 75.1 74.2 74.8 75.1 75.4 71.1 72.6 72.3 72.8 74.9 76.5 80.7 82.5 83.3 85.3Taking amphetamines regularly d 92.1 92.8 92.5 93.5 94.4 93.0 91.7 92.0 92.6 93.6 93.3 93.5 95.4 94.2 94.2 95.5Trying sedatives (barbiturates) once or twice e 77.7 81.3 81.1 82.4 84.0 83.9 82.4 84.4 83.1 84.1 84.9 86.8 89.6 89.4 89.3 90.5Taking sedatives (barbiturates) regularly e 93.3 93.6 93.0 94.3 95.2 95.4 94.2 94.4 95.1 95.1 95.5 94.9 96.4 95.3 95.3 96.4
Trying one or two drinks of an alcoholic beverage
(beer, wine, liquor) 21.6 18.2 15.6 15.6 15.8 16.0 17.2 18.2 18.4 17.4 20.3 20.9 21.4 22.6 27.3 29.4
Taking one or two drinks nearly every day 67.6 68.9 66.8 67.7 68.3 69.0 69.1 69.9 68.9 72.9 70.9 72.8 74.2 75.0 76.5 77.9
Taking four or five drinks nearly every day 88.7 90.7 88.4 90.2 91.7 90.8 91.8 90.9 90.0 91.0 92.0 91.4 92.2 92.8 91.6 91.9
Having five or more drinks once or twice
each weekend 60.3 58.6 57.4 56.2 56.7 55.6 55.5 58.8 56.6 59.6 60.4 62.4 62.0 65.3 66.5 68.9
Smoking one or more packs of cigarettes per day 67.5 65.9 66.4 67.0 70.3 70.8 69.9 69.4 70.8 73.0 72.3 75.4 74.3 73.1 72.4 72.8Vape an e-liquid with nicotine ocasionally f — — — — — — — — — — — — — — — —Vape an e-liquid with nicotine regularly f — — — — — — — — — — — — — — — —
Taking steroids — — — — — — — — — — — — — — — 90.8
Approximate weighted N = 2,677 2,957 3,085 3,686 3,221 3,261 3,610 3,651 3,341 3,254 3,265 3,113 3,302 3,311 2,799 2,566
TABLE 10Trends in Disapproval of Drug Use in Grade 12
Percentage who disapprove or strongly disapprove b
Do you disapprove of people (who are 18 or older) doing each of the following?a

1991 1992 1993 1994 1995 1996 1997 1998 1999 2000 2001 2002 2003 2004 2005
Trying marijuana once or twice 68.7 69.9 63.3 57.6 56.7 52.5 51.0 51.6 48.8 52.5 49.1 51.6 53.4 52.7 55.0
Smoking marijuana occasionally 79.4 79.7 75.5 68.9 66.7 62.9 63.2 64.4 62.5 65.8 63.2 63.4 64.2 65.4 67.8
Smoking marijuana regularly 89.3 90.1 87.6 82.3 81.9 80.0 78.8 81.2 78.6 79.7 79.3 78.3 78.7 80.7 82.0
Trying LSD once or twice 90.1 88.1 85.9 82.5 81.1 79.6 80.5 82.1 83.0 82.4 81.8 84.6 85.5 87.9 87.9
Taking LSD regularly 96.4 95.5 95.8 94.3 92.5 93.2 92.9 93.5 94.3 94.2 94.0 94.0 94.4 94.6 95.6Trying ecstasy (MDMA) once or twice c — — — — — — 82.2 82.5 82.1 81.0 79.5 83.6 84.7 87.7 88.4
Trying cocaine once or twice 93.6 93.0 92.7 91.6 90.3 90.0 88.0 89.5 89.1 88.2 88.1 89.0 89.3 88.6 88.9
Taking cocaine regularly 97.3 96.9 97.5 96.6 96.1 95.6 96.0 95.6 94.9 95.5 94.9 95.0 95.8 95.4 96.0
Trying crack once or twice 92.1 93.1 89.9 89.5 91.4 87.4 87.0 86.7 87.6 87.5 87.0 87.8 86.6 86.9 86.7
Taking crack occasionally 94.2 95.0 92.8 92.8 94.0 91.2 91.3 90.9 92.3 91.9 91.6 91.5 90.8 92.1 91.9
Taking crack regularly 95.0 95.5 93.4 93.1 94.1 93.0 92.3 91.9 93.2 92.8 92.2 92.4 91.2 93.1 92.1
Trying cocaine powder once or twice 88.0 89.4 86.6 87.1 88.3 83.1 83.0 83.1 84.3 84.1 83.3 83.8 83.6 82.2 83.2
Taking cocaine powder occasionally 93.0 93.4 91.2 91.0 92.7 89.7 89.3 88.7 90.0 90.3 89.8 90.2 88.9 90.0 89.4 Table continued on next page.Taking cocaine powder regularly 94.4 94.3 93.0 92.5 93.8 92.9 91.5 91.1 92.3 92.6 92.5 92.2 90.7 92.6 92.0
Trying heroin once or twice 96.0 94.9 94.4 93.2 92.8 92.1 92.3 93.7 93.5 93.0 93.1 94.1 94.1 94.2 94.3
Taking heroin occasionally 97.3 96.8 97.0 96.2 95.7 95.0 95.4 96.1 95.7 96.0 95.4 95.6 95.9 96.4 96.3
Taking heroin regularly 97.8 97.2 97.5 97.1 96.4 96.3 96.4 96.6 96.4 96.6 96.2 96.2 97.1 97.1 96.7
Trying heroin once or twice without using a needle — — — — 92.9 90.8 92.3 93.0 92.6 94.0 91.7 93.1 92.2 93.1 93.2
Taking heroin occasionally without using a needle — — — — 94.7 93.2 94.4 94.3 93.8 95.2 93.5 94.4 93.5 94.4 95.0Trying amphetamines once or twice d 86.5 86.9 84.2 81.3 82.2 79.9 81.3 82.5 81.9 82.1 82.3 83.8 85.8 84.1 86.1Taking amphetamines regularly d 96.0 95.6 96.0 94.1 94.3 93.5 94.3 94.0 93.7 94.1 93.4 93.5 94.0 93.9 94.8Trying sedatives (barbiturates) once or twice e 90.6 90.3 89.7 87.5 87.3 84.9 86.4 86.0 86.6 85.9 85.9 86.6 87.8‡ 83.7 85.4Taking sedatives (barbiturates) regularly e 97.1 96.5 97.0 96.1 95.2 94.8 95.3 94.6 94.7 95.2 94.5 94.7 94.4‡ 94.2 95.2
Trying one or two drinks of an alcoholic beverage
(beer, wine, liquor) 29.8 33.0 30.1 28.4 27.3 26.5 26.1 24.5 24.6 25.2 26.6 26.3 27.2 26.0 26.4
Taking one or two drinks nearly every day 76.5 75.9 77.8 73.1 73.3 70.8 70.0 69.4 67.2 70.0 69.2 69.1 68.9 69.5 70.8
Taking four or five drinks nearly every day 90.6 90.8 90.6 89.8 88.8 89.4 88.6 86.7 86.9 88.4 86.4 87.5 86.3 87.8 89.4
Having five or more drinks once or twice
each weekend 67.4 70.7 70.1 65.1 66.7 64.7 65.0 63.8 62.7 65.2 62.9 64.7 64.2 65.7 66.5
Smoking one or more packs of cigarettes per day 71.4 73.5 70.6 69.8 68.2 67.2 67.1 68.8 69.5 70.1 71.6 73.6 74.8 76.2 79.8Vape an e-liquid with nicotine ocasionally f — — — — — — — — — — — — — — —Vape an e-liquid with nicotine regularly f — — — — — — — — — — — — — — —
Taking steroids 90.5 92.1 92.1 91.9 91.0 91.7 91.4 90.8 88.9 88.8 86.4 86.8 86.0 87.9 88.8
Approximate weighted N = 2,547 2,645 2,723 2,588 2,603 2,399 2,601 2,545 2,310 2,150 2,144 2,160 2,442 2,455 2,460
TABLE 10 (cont.)Trends in Disapproval of Drug Use in Grade 12
Percentage who disapprove or strongly disapprove b
Do you disapprove of people (who are 18 or older) doing each of the following?a

Percentage who disapprove or strongly disapprove b
2006 2007 2008 2009 2010 2011 2012 2013 2014 2015 2016 2017
Trying marijuana once or twice 55.6 58.6 55.5 54.8 51.6 51.3 48.8 49.1 48.0 45.5 43.1 39.0 -4.1 s
Smoking marijuana occasionally 69.3 70.2 67.3 65.6 62.0 60.9 59.1 58.9 56.7 52.9 50.5 46.7 -3.8
Smoking marijuana regularly 82.2 83.3 79.6 80.3 77.7 77.5 77.8 74.5 73.4 70.7 68.5 64.7 -3.9 s
Trying LSD once or twice 88.0 87.8 85.5 88.2 86.5 86.3 87.2 86.6 85.0 81.7 82.4 78.0 -4.4 s
Taking LSD regularly 95.9 94.9 93.5 95.3 94.3 94.9 95.2 95.3 94.7 92.5 92.4 92.7 +0.3 Trying ecstasy (MDMA) once or twice c 89.0 87.8 88.2 88.2 86.3 83.9 87.1 84.9‡ 83.1 84.5 84.0 85.1 +1.2
Trying cocaine once or twice 89.1 89.6 89.2 90.8 90.5 91.1 91.0 92.3 90.0 89.0 88.4 88.0 -0.4
Taking cocaine regularly 96.1 96.2 94.8 96.5 96.0 96.0 96.8 96.7 96.3 95.2 94.8 94.8 -0.1
Trying crack once or twice 88.8 88.8 89.6 90.9 89.8 91.4 92.8 91.4 89.3 90.2 90.1 89.7 -0.4
Taking crack occasionally 92.9 92.4 93.3 94.0 92.6 93.9 95.0 93.6 91.9 92.5 92.0 91.8 -0.1
Taking crack regularly 93.8 93.6 93.5 94.3 93.1 94.4 95.4 94.1 92.4 92.8 92.6 92.5 0.0
Trying cocaine powder once or twice 84.1 83.5 85.7 87.3 87.0 88.1 88.7 88.2 85.5 86.4 86.6 85.5 -1.2
Taking cocaine powder occasionally 90.4 90.6 91.7 92.3 91.0 92.2 93.0 91.7 90.4 91.3 90.6 90.3 -0.3
Taking cocaine powder regularly 93.2 92.6 92.8 93.9 92.6 93.8 95.0 94.1 91.7 92.4 92.0 92.2 +0.2 Trying heroin once or twice 93.8 94.8 93.3 94.7 93.9 94.3 95.8 95.6 94.7 94.2 94.1 93.7 -0.4 Table continued on next page.Taking heroin occasionally 96.2 96.8 95.3 96.9 96.2 96.3 97.0 96.9 96.6 95.3 95.5 95.5 0.0
Taking heroin regularly 96.9 97.1 95.9 97.4 96.4 96.7 97.4 97.4 97.1 96.4 95.7 95.9 +0.2
Trying heroin once or twice without using a needle 93.7 93.6 94.2 94.7 93.2 92.6 95.2 93.7 92.5 92.6 93.8 93.3 -0.6
Taking heroin occasionally without using a needle 94.5 94.9 95.3 95.5 94.5 94.1 95.9 94.6 93.5 92.8 94.0 93.8 -0.2 Trying amphetamines once or twice d 86.3 87.3 87.2 88.2 88.1‡ 84.1 83.9 84.9 83.1 81.4 82.1 81.9 -0.2Taking amphetamines regularly d 95.3 95.4 94.2 95.6 94.9‡ 92.9 93.9 93.2 93.0 92.2 92.2 92.0 -0.2
Trying sedatives (barbiturates) once or twice e 85.3 86.5 86.1 87.7 87.6 87.3 88.2 88.9 88.5 87.4 86.5 85.9 -0.5 Taking sedatives (barbiturates) regularly e 95.1 94.6 94.3 95.8 94.7 95.1 96.1 95.8 95.0 94.7 94.8 94.4 -0.4
Trying one or two drinks of an alcoholic beverage
(beer, wine, liquor) 29.0 31.0 29.8 30.6 30.7 28.7 25.4 27.3 29.2 28.9 28.8 27.2 -1.6
Taking one or two drinks nearly every day 72.8 73.3 74.5 70.5 71.5 72.8 70.8 71.9 71.7 71.1 71.8 70.8 -1.1
Taking four or five drinks nearly every day 90.6 90.5 89.8 89.7 88.8 90.8 90.1 90.6 91.9 89.7 91.1 90.7 -0.3
Having five or more drinks once or twice
each weekend 68.5 68.8 68.9 67.6 68.8 70.0 70.1 71.6 72.6 71.9 74.2 72.5 -1.7
Smoking one or more packs of cigarettes per day 81.5 80.7 80.5 81.8 81.0 83.0 83.7 82.6 85.0 84.1 85.3 86.6 +1.3 Vape an e-liquid with nicotine ocasionally f — — — — — — — — — — — 62.0 —Vape an e-liquid with nicotine regularly f — — — — — — — — — — — 71.8 —
Taking steroids 89.4 89.2 90.9 90.3 89.8 89.7 90.4 88.2 87.5 87.8 86.7 88.5 +1.8 Approximate weighted N = 2,377 2,450 2,314 2,233 2,449 2,384 2,301 2,147 2,078 2,193 2,000 1,870
Do you disapprove of people (who are 18 or older) doing each of the following?a
2016–2017 change
TABLE 10 (cont.) Trends in Disapproval of Drug Use in Grade 12

Source. The Monitoring the Future study, the University of Michigan.
Notes. Level of significance of difference between the two most recent classes: s = .05, ss = .01, sss = .001. ' —' indicates data not available. ' ‡ ' indicates that the question
changed the following year. See relevant footnote for that drug. Any apparent inconsistency between the change estimate and the prevalence estimates for the
two most recent years is due to rounding.
cBeginning in 2014 "molly" was added to the question on disapproval of using MDMA once or twice. 2014 and 2015 data are not comparable to earlier years due to this change.dIn 2011 the list of examples was changed from upper, pep pill, bennie, speed to upper, speed, Adderall, Ritalin, etc. These changes likely explain the discontinuity in the
2011 results.
just downers. These changes likely explain the discontinuity in the 2004 results. fBased on two of six forms; N is two times the N indicated.
aThe 1975 question asked about people who are 20 or older.bAnswer alternatives were: (1) Don’t disapprove, (2) Disapprove, and (3) Strongly disapprove. Percentages are shown for categories (2) and (3) combined.
eIn 2004 the question text was changed from barbiturates to sedatives/barbiturates and the list of examples was changed from downers, goofballs, reds, yellows, etc. to
TABLE 10 (cont.) Trends in Disapproval of Drug Use in Grade 12

1991 1992 1993 1994 1995 1996 1997 1998 1999 2000 2001 2002 2003 2004 2005
Marijuana — 42.3 43.8 49.9 52.4 54.8 54.2 50.6 48.4 47.0 48.1 46.6 44.8 41.0 41.1
LSD — 21.5 21.8 21.8 23.5 23.6 22.7 19.3 18.3 17.0 17.6 15.2 14.0 12.3 11.5PCP b — 18.0 18.5 17.7 19.0 19.6 19.2 17.5 17.1 16.0 15.4 14.1 13.7 11.4 11.0MDMA (e.g. ecstasy, "Molly") b — — — — — — — — — — 23.8 22.8 21.6 16.6 15.6
Crack — 25.6 25.9 26.9 28.7 27.9 27.5 26.5 25.9 24.9 24.4 23.7 22.5 20.6 20.8
Cocaine powder — 25.7 25.9 26.4 27.8 27.2 26.9 25.7 25.0 23.9 23.9 22.5 21.6 19.4 19.9
Heroin — 19.7 19.8 19.4 21.1 20.6 19.8 18.0 17.5 16.5 16.9 16.0 15.6 14.1 13.2Narcotics other than Heroin b,c — 19.8 19.0 18.3 20.3 20.0 20.6 17.1 16.2 15.6 15.0 14.7 15.0 12.4 12.9 Table continued on next page.Amphetamines d — 32.2 31.4 31.0 33.4 32.6 30.6 27.3 25.9 25.5 26.2 24.4 24.4 21.9 21.0Crystal methamphetamine (ice) b — 16.0 15.1 14.1 16.0 16.3 15.7 16.0 14.7 14.9 13.9 13.3 14.1 11.9 13.5
Sedatives (barbiturates) — 27.4 26.1 25.3 26.5 25.6 24.4 21.1 20.8 19.7 20.7 19.4 19.3 18.0 17.6
Tranquilizers — 22.9 21.4 20.4 21.3 20.4 19.6 18.1 17.3 16.2 17.8 16.9 17.3 15.8 14.8
Alcohol — 76.2 73.9 74.5 74.9 75.3 74.9 73.1 72.3 70.6 70.6 67.9 67.0 64.9 64.2
Cigarettes — 77.8 75.5 76.1 76.4 76.9 76.0 73.6 71.5 68.7 67.7 64.3 63.1 60.3 59.1Vaping device e — — — — — — — — — — — — — — —E-liquid with nicotine (for vaping) e — — — — — — — — — — — — — — —
Steroids — 24.0 22.7 23.1 23.8 24.1 23.6 22.3 22.6 22.3 23.1 22.0 21.7 19.7 18.1Approximate weighted N = 8,355 16,775 16,119 15,496 16,318 16,482 16,208 15,397 15,180 14,804 13,972 15,583 15,944 15,730
Percentage saying fairly easy or very easy to get a
TABLE 11Trends in Availability of Drugs as Perceived by 8th Graders
How difficult do you think it would be for you to get each of the following types of drugs, if you wanted some?

2006 2007 2008 2009 2010 2011 2012 2013 2014 2015 2016 2017
Marijuana 39.6 37.4 39.3 39.8 41.4 37.9 36.9 39.1 36.9 37.0 34.6 35.2 +0.6
LSD 10.8 10.5 10.9 10.0 10.0 9.3 7.5 7.4 6.9 6.6 6.9 6.3 -0.6 PCP b 10.5 9.5 10.1 9.1 8.0 7.9 6.7 5.8 5.5 5.1 4.8 4.6 -0.1 MDMA (e.g. ecstasy, "Molly") b 14.5 13.4 14.1 13.1 12.9 12.0 9.6 9.5 10.1 9.6 8.7 8.0 -0.7
Crack 20.9 19.7 20.2 18.6 17.9 15.7 14.4 13.7 12.0 11.3 11.1 10.2 -0.9
Cocaine powder 20.2 19.0 19.5 17.8 16.6 14.9 14.1 13.5 11.9 11.6 11.0 10.4 -0.6
Heroin 13.0 12.6 13.3 12.0 11.6 9.9 9.4 10.0 8.6 7.8 8.9 8.1 -0.8 Narcotics other than Heroin b,c 13.0 11.7 12.1 11.8‡ 14.6 12.3 10.6 9.7 9.2 8.8 8.9 8.9 -0.1 Amphetamines d 20.7 19.9 21.3 20.2 19.6‡ 15.0 13.4 12.8 12.1 11.8 12.1 11.0 -1.1 Crystal methamphetamine (ice) b 14.5 12.1 12.8 11.9 10.9 9.6 8.8 8.5 7.7 6.9 6.6 6.6 0.0 Sedatives (barbiturates) e 17.3 16.8 17.5 15.9 15.3 12.6 11.1 10.6 10.0 9.0 9.3 9.2 -0.1
Tranquilizers 14.4 14.4 15.4 14.1 13.7 12.0 10.5 10.4 9.8 9.8 11.4 11.8 +0.4
Alcohol 63.0 62.0 64.1 61.8 61.1 59.0 57.5 56.1 54.4 53.6 52.7 53.2 0.5
Cigarettes 58.0 55.6 57.4 55.3 55.5 51.9 50.7 49.9 47.2 47.0 45.6 46.2 0.6 Vaping device e — — — — — — — — — — — 44.1 —E-liquid with nicotine (for vaping) e — — — — — — — — — — — 37.2 —
Steroids 17.1 17.0 16.8 15.2 14.2 13.3 12.5 12.9 11.8 11.6 12.6 11.6 -0.9 Approximate weighted N = 15,502 15,043 14,482 13,989 14,485 15,233 14,235 13,605 13,208 13,494 15,628 14,042
Source. The Monitoring the Future study, the University of Michigan.
Notes. Level of significance of difference between the two most recent classes: s = .05, ss = .01, sss = .001. ' — ' indicates data not available. ' ‡ ' indicates that the
question changed the following year. See relevant footnote for that drug. Any apparent inconsistency between the change estimate and the prevalence
estimates for the two most recent years is due to rounding. aAnswer alternatives were: (1) Probably impossible, (2) Very difficult, (3) Fairly difficult, (4) Fairly easy, (5) Very easy, and (6) Can't say, drug unfamiliar. bBeginning in 1993, data based on one of two of forms; N is one half of N indicated. Beginning in 2014 data based on one sixth of N indicated. For MDMA only: In 2014
the question text was changed in one form to include "Molly." In 2015 a second from was changed to including "Molly;" data based on one sixth of N indicated in 2014 and
on one half of N indicated in 2015. An examination of the data did not show any effect from this wording change.cIn 2010 the list of examples for narcotics other than heroin was changed from methadone, opium to Vicodin, OxyContin, Percocet, etc. This change likely explains the
discontinuity in the 2010 results.
the discontinuity in the 2012 results.eBeginning in 2017, data based on one half of N indicated.
dIn 2011 the list of examples for amphetamines was changed from uppers, pep pills, bennies, speed to uppers, speed, Adderall, Ritalin, etc. These changes likely explain
2016–2017
Percentage saying fairly easy or very easy to get a
TABLE 11 (cont.)Trends in Availability of Drugs as Perceived by 8th Graders
How difficult do you think it would be for you to get each of the following types of drugs, if you wanted some? change

1991 1992 1993 1994 1995 1996 1997 1998 1999 2000 2001 2002 2003 2004 2005
Marijuana — 65.2 68.4 75.0 78.1 81.1 80.5 77.9 78.2 77.7 77.4 75.9 73.9 73.3 72.6
LSD — 33.6 35.8 36.1 39.8 41.0 38.3 34.0 34.3 32.9 31.2 26.8 23.1 21.6 20.7PCP b — 23.7 23.4 23.8 24.7 26.8 24.8 23.9 24.5 25.0 21.6 20.8 19.4 18.0 18.1MDMA (e.g. ecstasy, "Molly") c — — — — — — — — — — 41.4 41.0 36.3 31.2 30.2
Crack — 33.7 33.0 34.2 34.6 36.4 36.0 36.3 36.5 34.0 30.6 31.3 29.6 30.6 31.0 Table continued on next page.
Cocaine powder — 35.0 34.1 34.5 35.3 36.9 37.1 36.8 36.7 34.5 31.0 31.8 29.6 31.2 31.5
Heroin — 24.3 24.3 24.7 24.6 24.8 24.4 23.0 23.7 22.3 20.1 19.9 18.8 18.7 19.3Narcotics other than Heroin b — 26.9 24.9 26.9 27.8 29.4 29.0 26.1 26.6 27.2 25.8 25.4 23.5 23.1 23.6Amphetamines d — 43.4 46.4 46.6 47.7 47.2 44.6 41.0 41.3 40.9 40.6 39.6 36.1 35.7 35.6Crystal methamphetamine (ice) b — 18.8 16.4 17.8 20.7 22.6 22.9 22.1 21.8 22.8 19.9 20.5 19.0 19.5 21.6
Sedatives (barbiturates) — 38.0 38.8 38.3 38.8 38.1 35.6 32.7 33.2 32.4 32.8 32.4 28.8 30.0 29.7
Tranquilizers — 31.6 30.5 29.8 30.6 30.3 28.7 26.5 26.8 27.6 28.5 28.3 25.6 25.6 25.4
Alcohol — 88.6 88.9 89.8 89.7 90.4 89.0 88.0 88.2 87.7 87.7 84.8 83.4 84.3 83.7
Cigarettes — 89.1 89.4 90.3 90.7 91.3 89.6 88.1 88.3 86.8 86.3 83.3 80.7 81.4 81.5Vaping device e — — — — — — — — — — — — — — —E-liquid with nicotine (for vaping) e — — — — — — — — — — — — — — —
Steroids — 37.6 33.6 33.6 34.8 34.8 34.2 33.0 35.9 35.4 33.1 33.2 30.6 29.6 29.7
Approximate weighted N = 7,014 14,652 15,192 16,209 14,887 14,856 14,423 13,112 13,690 13,518 13,694 15,255 15,806 15,636
TABLE 12
Percentage saying fairly easy or very easy to get aHow difficult do you think it would be for you to get each of the following types of drugs, if you wanted some?
Trends in Availability of Drugs as Perceived by 10th Graders

2006 2007 2008 2009 2010 2011 2012 2013 2014 2015 2016 2017
Marijuana 70.7 69.0 67.4 69.3 69.4 68.4 68.8 69.7 66.9 65.6 64.0 64.6 +0.6
LSD 19.2 19.0 19.3 17.8 18.3 16.6 14.9 16.3 14.8 15.5 15.2 15.9 +0.7 PCP b 15.8 15.4 14.4 13.4 12.6 12.0 10.2 9.4 8.3 9.0 7.6 7.1 -0.4 MDMA (e.g. ecstasy, "Molly") c 27.4 27.7 26.7 25.6 25.7 24.8 21.0 20.7 20.4 19.3 16.3 15.0 -1.3
Crack 29.9 29.0 27.2 23.9 22.5 19.7 18.4 17.1 15.1 14.4 13.9 13.8 -0.1
Cocaine powder 30.7 30.0 28.2 24.7 22.6 20.6 19.2 18.3 16.4 16.1 14.9 15.0 +0.1
Heroin 17.4 17.3 17.2 15.0 14.5 13.2 11.9 11.9 10.9 11.0 10.6 10.6 +0.0 Narcotics other than Heroin b 22.2 21.5 20.3 18.8‡ 28.7 25.0 24.3 22.5 18.8 19.2 16.8 17.7 +1.0 Amphetamines d 34.7 33.3 32.0 31.8 32.6‡ 28.5 27.3 26.5 25.2 27.3 22.9 24.2 +1.4 Crystal methamphetamine (ice) b 20.8 18.8 15.8 14.0 13.3 11.8 10.7 10.0 9.8 8.9 8.2 8.0 -0.2 Sedatives (barbiturates) e 29.9 28.2 26.9 25.5 24.9 22.0 20.2 18.3 16.7 16.6 14.2 15.1 +0.9
Tranquilizers 25.1 24.9 24.1 22.3 21.6 20.8 19.7 18.3 17.5 19.4 20.5 23.3 +2.8 s
Alcohol 83.1 82.6 81.1 80.9 80.0 77.9 78.2 77.2 75.3 74.9 71.1 71.5 +0.3
Cigarettes 79.5 78.2 76.5 76.1 75.6 73.6 72.9 71.4 69.0 66.6 62.9 62.5 -0.5 Vaping device e — — — — — — — — — — — 66.3 —E-liquid with nicotine (for vaping) e — — — — — — — — — — — 60.8 —
Steroids 30.2 27.7 24.5 20.8 20.3 18.8 18.0 17.2 16.5 17.0 15.3 15.0 -0.2
Approximate weighted N = 15,804 15,511 14,634 15,451 14,827 14,509 14,628 12,601 12,574 15,186 14,126 12,901
Source. The Monitoring the Future study, the University of Michigan.
Notes. Level of significance of difference between the two most recent classes: s = .05, ss = .01, sss = .001. ' — ' indicates data not available. ' ‡ ' indicates
that the question changed the following year. See relevant footnote for that drug. Any apparent inconsistency between the change estimate and the
prevalence estimates for the two most recent years is due to rounding.aAnswer alternatives were: (1) Probably impossible, (2) Very difficult, (3) Fairly difficult, (4) Fairly easy, (5) Very easy, and (6) Can't say, drug unfamiliar. bBeginning in 1993, data based on one of two forms; N is one half of N indicated. Beginning in 2014 data based on one sixth of N indicated.cBeginning in 1993, data based on one of two of forms; N is one half of N indicated. Beginning in 2014 data based on one sixth of N indicated for MDMA only:
In 2014 the question text was changed in one form to include "Molly." In 2015 a second from was changed to including "Molly;" data based on one sixth of N
indicated in 2014 and on one half of N indicated in 2015. An examination of the data did not show any effect from this wording change.dIn 2011 the list of examples for amphetamines was changed from uppers, pep pills, bennies, speed to uppers, speed, Adderall, Ritalin, etc. These changes
Percentage saying fairly easy or very easy to get aHow difficult do you think it would be for you to get each of the following types of drugs, if you wanted some?
2016–2017change
eBeginning in 2017, data based on one half of N indicated.
TABLE 12 (cont.)Trends in Availability of Drugs as Perceived by 10th Graders
likely explain the discontinuity in the 2011 results.

1975 1976 1977 1978 1979 1980 1981 1982 1983 1984 1985 1986 1987 1988 1989 1990Marijuana 87.8 87.4 87.9 87.8 90.1 89.0 89.2 88.5 86.2 84.6 85.5 85.2 84.8 85.0 84.3 84.4Amyl/butyl nitrites — — — — — — — — — — — — 23.9 25.9 26.8 24.4LSD 46.2 37.4 34.5 32.2 34.2 35.3 35.0 34.2 30.9 30.6 30.5 28.5 31.4 33.3 38.3 40.7Some other hallucinogen b 47.8 35.7 33.8 33.8 34.6 35.0 32.7 30.6 26.6 26.6 26.1 24.9 25.0 26.2 28.2 28.3PCP — — — — — — — — — — — — 22.8 24.9 28.9 27.7MDMA (e.g. ecstasy, "molly") c — — — — — — — — — — — — — — 21.7 22.0Cocaine 37.0 34.0 33.0 37.8 45.5 47.9 47.5 47.4 43.1 45.0 48.9 51.5 54.2 55.0 58.7 54.5Crack — — — — — — — — — — — — 41.1 42.1 47.0 42.4 Table continued on next page.Cocaine powder — — — — — — — — — — — — 52.9 50.3 53.7 49.0Heroin 24.2 18.4 17.9 16.4 18.9 21.2 19.2 20.8 19.3 19.9 21.0 22.0 23.7 28.0 31.4 31.9Some other narcotic (including methadone) d 34.5 26.9 27.8 26.1 28.7 29.4 29.6 30.4 30.0 32.1 33.1 32.2 33.0 35.8 38.3 38.1Amphetamines e 67.8 61.8 58.1 58.5 59.9 61.3 69.5 70.8 68.5 68.2 66.4 64.3 64.5 63.9 64.3 59.7Crystal methamphetamine (ice) — — — — — — — — — — — — — — — 24.1Sedatives (barbiturates) f 60.0 54.4 52.4 50.6 49.8 49.1 54.9 55.2 52.5 51.9 51.3 48.3 48.2 47.8 48.4 45.9Tranquilizers 71.8 65.5 64.9 64.3 61.4 59.1 60.8 58.9 55.3 54.5 54.7 51.2 48.6 49.1 45.3 44.7Alcohol — — — — — — — — — — — — — — — —Cigarettes g — — — — — — — — — — — — — — — —Vaping device g — — — — — — — — — — — — — — — —E-liquid with nicotine (for vaping) g — — — — — — — — — — — — — — — —Steroids — — — — — — — — — — — — — — — —
Approximate weighted N = 2,627 2,865 3,065 3,598 3,172 3,240 3,578 3,602 3,385 3,269 3,274 3,077 3,271 3,231 2,806 2,549
Trends in Availability of Drugs as Perceived by 12th GradersTABLE 13
How difficult do you think it would be for you to get each of the following types of drugs, if you wanted some?
Percentage saying fairly easy or very easy to get a

1991 1992 1993 1994 1995 1996 1997 1998 1999 2000 2001 2002 2003 2004 2005Marijuana 83.3 82.7 83.0 85.5 88.5 88.7 89.6 90.4 88.9 88.5 88.5 87.2 87.1 85.8 85.6Amyl/butyl nitrites 22.7 25.9 25.9 26.7 26.0 23.9 23.8 25.1 21.4 23.3 22.5 22.3 19.7 20.0 19.7LSD 39.5 44.5 49.2 50.8 53.8 51.3 50.7 48.8 44.7 46.9 44.7 39.6 33.6 33.1 28.6Some other hallucinogen b 28.0 29.9 33.5 33.8 35.8 33.9 33.9 35.1 29.5 34.5‡ 48.5 47.7 47.2 49.4 45.0PCP 27.6 31.7 31.7 31.4 31.0 30.5 30.0 30.7 26.7 28.8 27.2 25.8 21.9 24.2 23.2MDMA (e.g. ecstasy, "Molly") c 22.1 24.2 28.1 31.2 34.2 36.9 38.8 38.2 40.1 51.4 61.5 59.1 57.5 47.9 40.3Cocaine 51.0 52.7 48.5 46.6 47.7 48.1 48.5 51.3 47.6 47.8 46.2 44.6 43.3 47.8 44.7Crack 39.9 43.5 43.6 40.5 41.9 40.7 40.6 43.8 41.1 42.6 40.2 38.5 35.3 39.2 39.3 Table continued on next page.Cocaine powder 46.0 48.0 45.4 43.7 43.8 44.4 43.3 45.7 43.7 44.6 40.7 40.2 37.4 41.7 41.6Heroin 30.6 34.9 33.7 34.1 35.1 32.2 33.8 35.6 32.1 33.5 32.3 29.0 27.9 29.6 27.3Some other narcotic (including methadone) d 34.6 37.1 37.5 38.0 39.8 40.0 38.9 42.8 40.8 43.9 40.5 44.0 39.3 40.2 39.2Amphetamines e 57.3 58.8 61.5 62.0 62.8 59.4 59.8 60.8 58.1 57.1 57.1 57.4 55.0 55.4 51.2Crystal methamphetamine (ice) 24.3 26.0 26.6 25.6 27.0 26.9 27.6 29.8 27.6 27.8 28.3 28.3 26.1 26.7 27.2Sedatives (barbiturates) f 42.4 44.0 44.5 43.3 42.3 41.4 40.0 40.7 37.9 37.4 35.7 36.6 35.3‡ 46.3 44.4Tranquilizers 40.8 40.9 41.1 39.2 37.8 36.0 35.4 36.2 32.7 33.8 33.1 32.9 29.8 30.1 25.7Alcohol — — — — — — — — 95.0 94.8 94.3 94.7 94.2 94.2 93.0Cigarettes g — — — — — — — — — — — — — — —Vaping device g — — — — — — — — — — — — — — —E-liquid with nicotine (for vaping) g — — — — — — — — — — — — — — —Steroids 46.7 46.8 44.8 42.9 45.5 40.3 41.7 44.5 44.6 44.8 44.4 45.5 40.7 42.6 39.7
Approximate weighted N = 2,476 2,586 2,670 2,526 2,552 2,340 2,517 2,520 2,215 2,095 2,120 2,138 2,391 2,169 2,161
Percentage saying fairly easy or very easy to get a
How difficult do you think it would be for you to get each of the following types of drugs, if you wanted some?
TABLE 13 (cont.)Trends in Availability of Drugs as Perceived by 12th Graders

2006 2007 2008 2009 2010 2011 2012 2013 2014 2015 2016 2017Marijuana 84.9 83.9 83.9 81.1 82.1 82.2 81.6 81.4 81.3 79.5 81.0 79.8 -1.1 Amyl/butyl nitrites 18.4 18.1 16.9 15.7 — — — — — — — — —LSD 29.0 28.7 28.5 26.3 25.1 25.1 27.6 24.5 25.9 26.5 28.0 26.3 -1.7 Some other hallucinogen b 43.9 43.7 42.8 40.5 39.5 38.3 37.8 36.6 33.6 31.4 32.5 28.4 -4.0 PCP 23.1 21.0 20.6 19.2 18.5 17.2 14.2 15.3 11.1 13.8 12.6 10.6 -2.0 MDMA (e.g. ecstasy, "Molly") c 40.3 40.9 41.9 35.1 36.4 37.1 35.9 35.1 36.1 37.1 32.5 29.3 -3.2 Cocaine 46.5 47.1 42.4 39.4 35.5 30.5 29.8 30.5 29.2 29.1 28.6 27.3 -1.3 Crack 38.8 37.5 35.2 31.9 26.1 24.0 22.0 24.6 20.1 22.0 19.8 18.1 -1.7 Cocaine powder 42.5 41.2 38.9 33.9 29.0 26.4 25.1 28.4 22.3 25.8 22.9 21.3 -1.6 Heroin 27.4 29.7 25.4 27.4 24.1 20.8 19.9 22.1 20.2 20.4 20.0 19.1 -0.9 Some other narcotic (including methadone) d 39.6 37.3 34.9 36.1‡ 54.2 50.7 50.4 46.5 42.2 39.0 39.3 35.8 -3.5 Amphetamines e 52.9 49.6 47.9 47.1 44.1‡ 47.0 45.4 42.7 44.5 41.9 41.1 38.0 -3.2 Crystal methamphetamine (ice) 26.7 25.1 23.3 22.3 18.3 17.1 14.5 17.2 13.7 15.3 14.5 13.6 -0.9 Sedatives (barbiturates) f 43.8 41.7 38.8 37.9 36.8 32.4 28.7 27.9 26.3 25.0 25.7 23.4 -2.3 Tranquilizers 24.4 23.6 22.4 21.2 18.4 16.8 14.9 15.0 14.4 14.9 15.2 14.9 -0.3 Alcohol 92.5 92.2 92.2 92.1 90.4 88.9 90.6 89.7 87.6 86.6 85.4 87.1 +1.7 Cigarettes g — — — — — — — — — — — 77.9 —Vaping device g — — — — — — — — — — — 78.2 —E-liquid with nicotine (for vaping) g — — — — — — — — — — — 75.0 —Steroids 41.1 40.1 35.2 30.3 27.3 26.1 25.0 28.5 22.0 23.7 21.3 20.1 -1.2
Approximate weighted N = 2,131 2,420 2,276 2,243 2,395 2,337 2,280 2,092 2,066 2,181 1,958 1,882Source. The Monitoring the Future study, the University of Michigan.
Notes. Level of significance of difference between the two most recent classes: s = .05, ss = .01, sss = .001. ' — ' indicates data not available. ' ‡ ' indicates that the question
changed the following year. See relevant footnote for that drug. Any apparent inconsistency between the change estimate and the prevalence estimates for the two
most recent years is due to rounding.aAnswer alternatives were: (1) Probably impossible, (2) Very difficult, (3) Fairly difficult, (4) Fairly easy, and (5) Very easy.bIn 2001 the question text was changed from other psychedelics to other hallucinogens and shrooms was added to the list of examples. These changes likely explain the
discontinuity in the 2001 results.cBeginning in 2014 "molly" was added to the question on availability of Ecstasy (MDMA). An examination of the data did not show any effect from this wording change.dIn 2010 the list of examples for narcotics other than heroin was changed from methadone, opium to Vicodin, OxyContin, Percocet, etc. This change likely explains the
discontinuity in the 2010 results.
the 2011 results.fIn 2004 the question text was changed from barbiturates to sedatives/barbiturates and the list of examples was changed from downers, goofballs, reds, yellows, etc. to just
downers. These changes likely explain the discontinuity in the 2004 results. gData based on 2 of 6 forms. N is twice the N indicated.
TABLE 13 (cont.) Trends in Availability of Drugs as Perceived by 12th Graders
eIn 2011 the list of examples was changed from uppers, pep pills, bennies, speed to uppers, speed, Adderall, Ritalin, etc. These changes likely explain the discontinuity in
How difficult do you think it would be for you to get each of the following types of drugs, if you wanted some?
2016–2017 change
Percentage saying “fairly easy” or “very easy” to get a
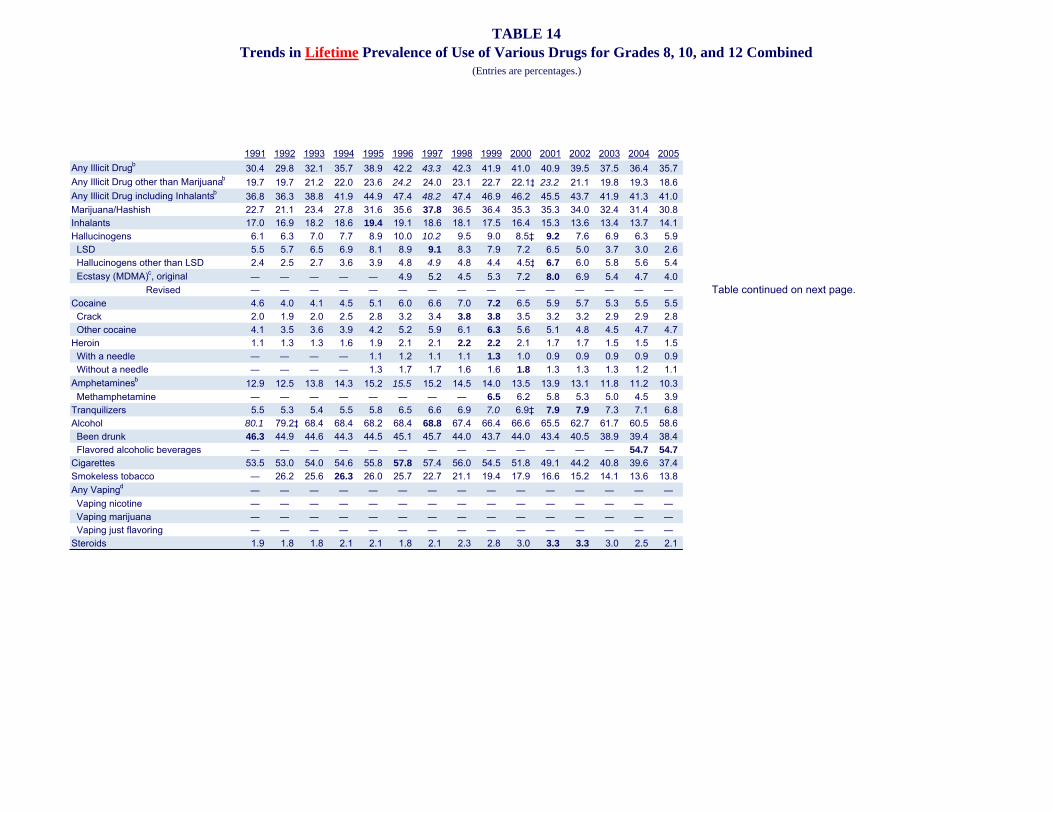
1991 1992 1993 1994 1995 1996 1997 1998 1999 2000 2001 2002 2003 2004 2005Any Illicit Drugb 30.4 29.8 32.1 35.7 38.9 42.2 43.3 42.3 41.9 41.0 40.9 39.5 37.5 36.4 35.7Any Illicit Drug other than Marijuanab 19.7 19.7 21.2 22.0 23.6 24.2 24.0 23.1 22.7 22.1‡ 23.2 21.1 19.8 19.3 18.6Any Illicit Drug including Inhalantsb 36.8 36.3 38.8 41.9 44.9 47.4 48.2 47.4 46.9 46.2 45.5 43.7 41.9 41.3 41.0Marijuana/Hashish 22.7 21.1 23.4 27.8 31.6 35.6 37.8 36.5 36.4 35.3 35.3 34.0 32.4 31.4 30.8Inhalants 17.0 16.9 18.2 18.6 19.4 19.1 18.6 18.1 17.5 16.4 15.3 13.6 13.4 13.7 14.1Hallucinogens 6.1 6.3 7.0 7.7 8.9 10.0 10.2 9.5 9.0 8.5‡ 9.2 7.6 6.9 6.3 5.9 LSD 5.5 5.7 6.5 6.9 8.1 8.9 9.1 8.3 7.9 7.2 6.5 5.0 3.7 3.0 2.6 Hallucinogens other than LSD 2.4 2.5 2.7 3.6 3.9 4.8 4.9 4.8 4.4 4.5‡ 6.7 6.0 5.8 5.6 5.4 Ecstasy (MDMA)c, original ― ― ― ― ― 4.9 5.2 4.5 5.3 7.2 8.0 6.9 5.4 4.7 4.0 Revised ― ― ― ― ― ― ― ― ― ― ― ― ― ― ― Table continued on next page.Cocaine 4.6 4.0 4.1 4.5 5.1 6.0 6.6 7.0 7.2 6.5 5.9 5.7 5.3 5.5 5.5 Crack 2.0 1.9 2.0 2.5 2.8 3.2 3.4 3.8 3.8 3.5 3.2 3.2 2.9 2.9 2.8 Other cocaine 4.1 3.5 3.6 3.9 4.2 5.2 5.9 6.1 6.3 5.6 5.1 4.8 4.5 4.7 4.7Heroin 1.1 1.3 1.3 1.6 1.9 2.1 2.1 2.2 2.2 2.1 1.7 1.7 1.5 1.5 1.5 With a needle ― ― ― ― 1.1 1.2 1.1 1.1 1.3 1.0 0.9 0.9 0.9 0.9 0.9 Without a needle ― ― ― ― 1.3 1.7 1.7 1.6 1.6 1.8 1.3 1.3 1.3 1.2 1.1Amphetaminesb 12.9 12.5 13.8 14.3 15.2 15.5 15.2 14.5 14.0 13.5 13.9 13.1 11.8 11.2 10.3 Methamphetamine ― ― ― ― ― ― ― ― 6.5 6.2 5.8 5.3 5.0 4.5 3.9Tranquilizers 5.5 5.3 5.4 5.5 5.8 6.5 6.6 6.9 7.0 6.9‡ 7.9 7.9 7.3 7.1 6.8Alcohol 80.1 79.2‡ 68.4 68.4 68.2 68.4 68.8 67.4 66.4 66.6 65.5 62.7 61.7 60.5 58.6 Been drunk 46.3 44.9 44.6 44.3 44.5 45.1 45.7 44.0 43.7 44.0 43.4 40.5 38.9 39.4 38.4 Flavored alcoholic beverages ― ― ― ― ― ― ― ― ― ― ― ― ― 54.7 54.7Cigarettes 53.5 53.0 54.0 54.6 55.8 57.8 57.4 56.0 54.5 51.8 49.1 44.2 40.8 39.6 37.4Smokeless tobacco ― 26.2 25.6 26.3 26.0 25.7 22.7 21.1 19.4 17.9 16.6 15.2 14.1 13.6 13.8Any Vapingd ― ― ― ― ― ― ― ― ― ― ― ― ― ― ― Vaping nicotine ― ― ― ― ― ― ― ― ― ― ― ― ― ― ― Vaping marijuana ― ― ― ― ― ― ― ― ― ― ― ― ― ― ― Vaping just flavoring ― ― ― ― ― ― ― ― ― ― ― ― ― ― ―Steroids 1.9 1.8 1.8 2.1 2.1 1.8 2.1 2.3 2.8 3.0 3.3 3.3 3.0 2.5 2.1
TABLE 14Trends in Lifetime Prevalence of Use of Various Drugs for Grades 8, 10, and 12 Combined
(Entries are percentages.)

2006 2007 2008 2009 2010 2011 2012 2013 2014 2015 2016 2017Any Illicit Drugb 34.0 32.7 32.6 33.2 34.4 34.7 34.1 36.0‡ 34.9 34.3 32.6 33.4 +0.8 -1.5 -4.4 +0.8 +2.3Any Illicit Drug other than Marijuanab 18.2 17.7 16.8 16.5 16.8 16.1 15.5 16.8‡ 15.8 15.1 14.3 14.0 -0.3 -1.8 s -11.5 ― ―Any Illicit Drug including Inhalantsb 39.3 38.0 37.9 37.9 38.8 38.7 37.9 39.3‡ 37.9 37.4 34.9 36.5 +1.6 s -1.5 -3.9 +1.6 s +4.6Marijuana/Hashish 28.9 27.9 27.9 29.0 30.4 31.0 30.7 32.0 30.5 30.0 28.6 29.3 +0.7 -8.5 sss -22.4 +1.4 +5.1Inhalants 13.7 13.5 13.1 12.5 12.1 10.6 10.0 8.9 8.8 7.5 6.5 6.7 +0.2 -12.7 sss -65.7 +0.2 +2.7Hallucinogens 5.7 5.8 5.6 5.3 5.8 5.7 5.0 5.0 4.3 4.3 4.3 4.2 -0.1 -5.0 sss -54.2 ― ― LSD 2.5 2.6 2.7 2.5 2.8 2.7 2.5 2.6 2.4 2.8 3.1 3.1 0.0 -6.0 sss -66.2 +0.7 s +27.0 Hallucinogens other than LSD 5.2 5.1 4.8 4.7 5.0 4.9 4.3 4.1 3.5 3.1 3.0 2.9 -0.1 -3.7 sss -56.2 ― ― Ecstasy (MDMA)c, original 4.3 4.5 4.1 4.6 5.5 5.5 4.6 4.7 3.5 ― ― ― ― ― ― ― ― Revised ― ― ― ― ― ― ― ― 5.0 4.0 3.1 3.0 -0.1 -2.0 sss -40.3 ― ―Cocaine 5.3 5.2 4.8 4.2 3.8 3.4 3.3 3.1 2.9 2.7 2.3 2.5 +0.1 -4.7 sss -65.7 +0.1 +5.5 Crack 2.6 2.5 2.2 2.0 1.9 1.6 1.5 1.5 1.3 1.3 1.0 1.1 +0.1 -2.8 sss -71.7 +0.1 +6.2 Other cocaine 4.7 4.6 4.1 3.7 3.4 3.1 2.9 2.7 2.5 2.3 2.1 2.1 0.0 -4.2 sss -66.6 0.0 +0.8Heroin 1.4 1.4 1.3 1.4 1.4 1.2 1.0 1.0 0.9 0.7 0.6 0.6 0.0 -1.6 sss -73.4 ― ― With a needle 0.9 0.8 0.8 0.8 0.9 0.8 0.6 0.7 0.7 0.5 0.4 0.4 0.0 -0.9 sss -70.8 ― ― Without a needle 1.0 1.0 0.9 0.9 1.0 0.9 0.7 0.7 0.6 0.5 0.4 0.4 0.0 -1.4 sss -77.8 ― ―Amphetaminesb 10.1 9.5 8.6 8.6 8.9 8.6 8.3 10.5‡ 9.7 9.1 8.1 7.7 -0.5 -2.0 sss -20.9 ― ― Methamphetamine 3.4 2.5 2.5 2.2 2.2 1.8 1.6 1.5 1.4 1.1 0.8 0.9 0.0 -5.7 sss -86.6 0.0 +5.0Tranquilizers 7.0 6.7 6.3 6.5 6.6 6.0 5.8 5.2 5.3 5.2 5.5 5.6 +0.1 -2.2 sss -28.5 +0.4 -28.5Alcohol 57.0 56.3 55.1 54.6 53.6 51.5 50.0 48.4 46.4 45.2 41.9 41.7 -0.2 -27.0 sss -39.3 ― ― Been drunk 37.6 36.6 35.1 35.9 34.2 32.5 32.8 31.7 29.2 28.2 26.4 26.0 -0.4 -20.3 sss -43.9 ― ― Flavored alcoholic beverages 53.1 51.3 49.3 47.9 46.7 44.5 42.7 41.1 38.8 37.4 33.8 33.5 -0.3 -21.1 sss -38.7 ― ―Cigarettes 35.0 33.3 31.3 31.2 30.9 28.7 27.0 25.6 22.9 21.1 18.2 17.0 -1.2 s -40.8 sss -70.5 ― ―Smokeless tobacco 13.3 12.9 12.3 13.5 14.5 13.8 13.5 12.8 12.1 11.3 10.3 8.7 -1.6 s -17.6 sss -66.9 ― ―Any Vapingd ― ― ― ― ― ― ― ― ― 29.9 26.6‡ 28.2 ― ― ― ― ― Vaping nicotine ― ― ― ― ― ― ― ― ― ― ― 18.9 ― ― ― ― ― Vaping marijuana ― ― ― ― ― ― ― ― ― ― ― 8.5 ― ― ― ― ― Vaping just flavoring ― ― ― ― ― ― ― ― ― ― ― 24.9 ― ― ― ― ―Steroids 2.0 1.8 1.6 1.5 1.5 1.5 1.4 1.5 1.4 1.5 1.3 1.2 0.0 -2.0 sss -62.0 ― ―Source. The Monitoring the Future study, the University of Michigan.
Notes. ' – ' indicates data not available. ' ‡ ' indicates a change in the question text. When a question change occurs, peak levels after that change are used to calculate the peak year to current year difference.
Values in bold equal peak levels since 1991. Values in italics equal peak level before wording change. Underlined values equal lowest level since recent peak level.
Level of significance of difference between classes: s = .05, ss = .01, sss = .001.
Any apparent inconsistency between the change estimate and the prevalence estimates for the two most recent years is due to rounding.aThe proportional change is the percent by which the most recent year deviates from the peak year [or the low year] for the drug in question. So, if a drug was at 20% prevalence in the peak year and declined to 10% prevalence in the
most recent year, that would reflect a proportional decline of 50%.bIn 2013, for the questions on the use of amphetamines, the text was changed on two of the questionnaire forms for 8th and 10th graders and four of the questionnaire forms for 12th graders. This change also impacted the any illicit drug indices. Data presented here include only the changed forms beginning in 2013.cIn 2014, the text was changed on one of the questionnaire forms for 8th, 10th, and 12th graders to include "molly" in the description. The remaining forms were changed in 2015. Data for both versions of the question are presented here.dIn 2017, the surveys switched from asking about vaping in general to asking separately about vaping nicotine, marijuana, and just flavoring. Beginning in 2017, data presented for any vaping are based on these new questions.
TABLE 14 (continued)Trends in Lifetime Prevalence of Use of Various Drugs for Grades 8, 10, and 12 Combined
(Entries are percentages.)
change change change (%) a change change
Peak year–2017 change Low year–2017 change2016–2017 Absolute Proportional Absolute Proportional

1991 1992 1993 1994 1995 1996 1997 1998 1999 2000 2001 2002 2003 2004 2005Any Illicit Drugc 20.2 19.7 23.2 27.6 31.0 33.6 34.1 32.2 31.9 31.4 31.8 30.2 28.4 27.6 27.1Any Illicit Drug other than Marijuanac 12.0 12.0 13.6 14.6 16.4 17.0 16.8 15.8 15.6 15.3‡ 16.3 14.6 13.7 13.5 13.1Any Illicit Drug including Inhalantsc 23.5 23.2 26.7 31.1 34.1 36.6 36.7 35.0 34.6 34.1 34.3 32.3 30.8 30.1 30.1Marijuana/Hashish 15.0 14.3 17.7 22.5 26.1 29.0 30.1 28.2 27.9 27.2 27.5 26.1 24.6 23.8 23.4 Synthetic marijuana ― ― ― ― ― ― ― ― ― ― ― ― ― ― ―Inhalants 7.6 7.8 8.9 9.6 10.2 9.9 9.1 8.5 7.9 7.7 6.9 6.1 6.2 6.7 7.0Hallucinogens 3.8 4.1 4.8 5.2 6.6 7.2 6.9 6.3 6.1 5.4‡ 6.0 4.5 4.1 4.0 3.9 LSD 3.4 3.8 4.3 4.7 5.9 6.3 6.0 5.3 5.3 4.5 4.1 2.4 1.6 1.6 1.5 Hallucinogens other than LSD 1.3 1.4 1.7 2.2 2.7 3.2 3.2 3.1 2.9 2.8‡ 4.0 3.7 3.6 3.6 3.4 Ecstasy (MDMA)d, original ― ― ― ― ― 3.1 3.4 2.9 3.7 5.3 6.0 4.9 3.1 2.6 2.4 Revised ― ― ― ― ― ― ― ― ― ― ― ― ― ― ― Salvia ― ― ― ― ― ― ― ― ― ― ― ― ― ― ―Cocaine 2.2 2.1 2.3 2.8 3.3 4.0 4.3 4.5 4.5 3.9 3.5 3.7 3.3 3.5 3.5 Crack 1.0 1.1 1.2 1.5 1.8 2.0 2.1 2.4 2.2 2.1 1.8 2.0 1.8 1.7 1.6 Other cocaine 2.0 1.8 2.0 2.3 2.8 3.4 3.7 3.7 4.0 3.3 3.0 3.1 2.8 3.1 3.0 Table continued on next page.Heroin 0.5 0.6 0.6 0.9 1.2 1.3 1.3 1.2 1.3 1.3 0.9 1.0 0.8 0.9 0.8 With a needle ― ― ― ― 0.7 0.7 0.7 0.7 0.7 0.5 0.5 0.5 0.5 0.5 0.5 Without a needle ― ― ― ― 0.9 0.9 1.0 0.9 1.0 1.1 0.7 0.7 0.6 0.7 0.7 OxyContin ― ― ― ― ― ― ― ― ― ― ― 2.7 3.2 3.3 3.4 Vicodin ― ― ― ― ― ― ― ― ― ― ― 6.0 6.6 5.8 5.7Amphetaminesc 7.5 7.3 8.4 9.1 10.0 10.4 10.1 9.3 9.0 9.2 9.6 8.9 8.0 7.6 7.0 Ritalin ― ― ― ― ― ― ― ― ― ― 4.2 3.8 3.5 3.6 3.3 Adderall ― ― ― ― ― ― ― ― ― ― ― ― ― ― ― Methamphetamine ― ― ― ― ― ― ― ― 4.1 3.5 3.4 3.2 3.0 2.6 2.4 Bath salts (synthetic stimulants) ― ― ― ― ― ― ― ― ― ― ― ― ― ― ―Tranquilizers 2.8 2.8 2.9 3.1 3.7 4.1 4.1 4.4 4.4 4.5 ‡ 5.5 5.3 4.8 4.8 4.7OTC Cough/Cold Medicines ― ― ― ― ― ― ― ― ― ― ― ― ― ― ―Rohypnol ― ― ― ― ― 1.1 1.1 1.1 0.8 0.7 0.9‡ 0.8 0.8 0.9 0.8GHBb ― ― ― ― ― ― ― ― ― 1.4 1.2 1.2 1.2 1.1 0.8Ketamine b ― ― ― ― ― ― ― ― ― 2.0 1.9 2.0 1.7 1.3 1.0Alcohol 67.4 66.3‡ 59.7 60.5 60.4 60.9 61.4 59.7 59.0 59.3 58.2 55.3 54.4 54.0 51.9 Been drunk 35.8 34.3 34.3 35.0 35.9 36.7 36.9 35.5 36.0 35.9 35.0 32.1 31.2 32.5 30.8 Flavored alcoholic beverages ― ― ― ― ― ― ― ― ― ― ― ― ― 44.5 43.9 Alcoholic beverages containing caffeine ― ― ― ― ― ― ― ― ― ― ― ― ― ― ―Any Vaping ― ― ― ― ― ― ― ― ― ― ― ― ― ― ― Vaping nicotine ― ― ― ― ― ― ― ― ― ― ― ― ― ― ― Vaping marijuana ― ― ― ― ― ― ― ― ― ― ― ― ― ― ― Vaping just flavoring ― ― ― ― ― ― ― ― ― ― ― ― ― ― ―Dissolvable tobacco products ― ― ― ― ― ― ― ― ― ― ― ― ― ― ―Snus ― ― ― ― ― ― ― ― ― ― ― ― ― ― ―Steroids 1.2 1.1 1.0 1.2 1.3 1.1 1.2 1.3 1.7 1.9 2.0 2.0 1.7 1.6 1.3
TABLE 15Trends in Annual Prevalence of Use of Various Drugs for Grades 8, 10, and 12 Combined
(Entries are percentages.)

2006 2007 2008 2009 2010 2011 2012 2013 2014 2015 2016 2017Any Illicit Drugc 25.8 24.8 24.9 25.9 27.3 27.6 27.1 28.6‡ 27.2 26.8 25.3 26.5 +1.2 -0.7 -2.6 +1.2 +4.6Any Illicit Drug other than Marijuanac 12.7 12.4 11.9 11.6 11.8 11.3 10.8 11.4‡ 10.9 10.5 9.7 9.4 -0.3 -1.5 ss -14.2 ― ―Any Illicit Drug including Inhalantsc 28.7 27.6 27.6 28.5 29.7 29.8 29.0 30.5‡ 28.5 28.4 26.3 28.3 +2.0 ss -0.2 -0.6 +2.0 ss +7.7Marijuana/Hashish 22.0 21.4 21.5 22.9 24.5 25.0 24.7 25.8 24.2 23.7 22.6 23.9 +1.3 s -6.2 sss -20.6 +2.5 sss +11.8 Synthetic marijuana ― ― ― ― ― ― 8.0 6.4 4.8 4.2 3.1 2.8 -0.4 s -5.2 sss -65.4 ― ―Inhalants 6.9 6.4 6.4 6.1 6.0 5.0 4.5 3.8 3.6 3.2 2.6 2.9 +0.2 -7.3 sss -71.9 +0.2 +8.1Hallucinogens 3.6 3.8 3.8 3.5 3.8 3.7 3.2 3.1 2.8 2.8 2.8 2.7 0.0 -3.2 sss -54.1 ― ― LSD 1.4 1.7 1.9 1.6 1.8 1.8 1.6 1.6 1.7 1.9 2.0 2.1 +0.1 -4.3 sss -67.5 +0.6 ss +46.1 Hallucinogens other than LSD 3.3 3.3 3.2 3.0 3.3 3.1 2.7 2.5 2.1 1.9 1.8 1.8 0.0 -2.3 sss -56.3 ― ― Ecstasy (MDMA)d, original 2.7 3.0 2.9 3.0 3.8 3.7 2.5 2.8 2.2 ― ― ― ― ― ― ― ― Revised ― ― ― ― ― ― ― ― 3.4 2.4 1.8 1.7 -0.1 -1.6 sss -48.9 ― ― Salvia ― ― ― ― 3.5 3.6 2.7 2.3 1.4 1.2 1.2 0.9 -0.3 ss -2.7 sss -74.2 ― ―Cocaine 3.5 3.4 2.9 2.5 2.2 2.0 1.9 1.8 1.6 1.7 1.4 1.6 +0.2 -2.9 sss -64.5 +0.2 +12.2 Crack 1.5 1.5 1.3 1.2 1.1 1.0 0.9 0.8 0.7 0.8 0.6 0.7 +0.1 -1.7 sss -70.7 +0.1 +20.1 Other cocaine 3.1 2.9 2.6 2.1 1.9 1.7 1.7 1.5 1.5 1.5 1.2 1.3 +0.1 -2.7 sss -66.3 +0.1 +8.8Heroin 0.8 0.8 0.8 0.8 0.8 0.7 0.6 0.6 0.5 0.4 0.3 0.3 0.0 -1.0 sss -75.4 0.0 +8.9 With a needle 0.5 0.5 0.5 0.5 0.6 0.5 0.4 0.4 0.4 0.3 0.3 0.2 0.0 -0.5 sss -69.5 ― ― Without a needle 0.6 0.7 0.6 0.5 0.6 0.5 0.4 0.4 0.3 0.3 0.2 0.2 0.0 -0.9 sss -81.4 0.0 +6.5 OxyContin 3.5 3.5 3.4 3.9 3.8 3.4 2.9 2.9 2.4 2.3 2.1 1.9 -0.2 -2.0 sss -51.6 ― ― Vicodin 6.3 6.2 6.1 6.5 5.9 5.1 4.3 3.7 3.0 2.5 1.8 1.3 -0.5 -5.2 sss -79.6 ― ―Amphetaminesc 6.8 6.5 5.8 5.9 6.2 5.9 5.6 7.0‡ 6.6 6.2 5.4 5.0 -0.4 -1.6 sss -24.1 ― ― Ritalin 3.5 2.8 2.6 2.5 2.2 2.1 1.7 1.7 1.5 1.4 1.1 0.8 -0.2 -3.4 sss -80.5 ― ― Adderall ― ― ― 4.3 4.5 4.1 4.4 4.4 4.1 4.5 3.9 3.5 -0.3 -0.5 s -10.3 ― ― Methamphetamine 2.0 1.4 1.3 1.3 1.3 1.2 1.0 1.0 0.8 0.6 0.5 0.5 0.0 -3.6 sss -88.2 ― ― Bath salts (synthetic stimulants) ― ― ― ― ― ― 0.9 0.9 0.8 0.7 0.8 0.5 -0.3 s -0.4 s -43.6 ― ―Tranquilizers 4.6 4.5 4.3 4.5 4.4 3.9 3.7 3.3 3.4 3.4 3.5 3.6 +0.1 -1.9 sss -35.1 +0.2 +7.5OTC Cough/Cold Medicines 5.4 5.0 4.7 5.2 4.8 4.4 4.4 4.0 3.2 3.1 3.2 3.0 -0.2 -2.4 sss -44.4 ― ―Rohypnol 0.7 0.8 0.7 0.6 0.8 0.9 0.7 0.6 0.5 0.5 0.7 0.5 -0.2 s -0.5 sss -50.4 ― ―GHBb 0.9 0.7 0.9 0.9 0.8 0.8 ― ― ― ― ― ― ― ― ― ― ―Ketamine b 1.1 1.0 1.2 1.3 1.2 1.2 ― ― ― ― ― ― ― ― ― ― ―Alcohol 50.7 50.2 48.7 48.4 47.4 45.3 44.3 42.8 40.7 39.9 36.7 36.7 0.0 -24.7 sss -40.2 0.0 +0.1 Been drunk 30.7 29.7 28.1 28.7 27.1 25.9 26.4 25.4 23.6 22.5 20.7 20.4 -0.3 -16.5 sss -44.8 ― ― Flavored alcoholic beverages 42.4 40.8 39.0 37.8 35.9 33.7 32.5 31.3 29.4 28.8 25.3 25.9 +0.5 -18.6 sss -41.9 +0.5 +2.1 Alcoholic beverages containing caffeine ― ― ― ― ― 19.7 18.6 16.6 14.3 13.0 11.2 10.6 -0.6 -9.1 sss -46.1 ― ―Any Vaping ― ― ― ― ― ― ― ― ― ― ― 21.5 ― ― ― ― ― Vaping nicotine ― ― ― ― ― ― ― ― ― ― ― 13.9 ― ― ― ― ― Vaping marijuana ― ― ― ― ― ― ― ― ― ― ― 6.8 ― ― ― ― ― Vaping just flavoring ― ― ― ― ― ― ― ― ― ― ― 17.2 ― ― ― ― ―Dissolvable tobacco products ― ― ― ― ― ― 1.4 1.4 1.2 1.1 0.9 0.9 0.0 -0.5 -35.1 ― ―Snus ― ― ― ― ― ― 5.6 4.8 4.1 3.8 3.6 2.6 -1.0 sss -3.0 sss -53.9 ― ―Steroids 1.3 1.1 1.1 1.0 0.9 0.9 0.9 0.9 0.9 1.0 0.8 0.8 0.0 -1.2 sss -61.3 0.0 +2.9Source. The Monitoring the Future study, the University of Michigan.Notes. ' – ' indicates data not available. ' ‡ ' indicates a change in the question text. When a question change occurs, peak levels after that change are used to calculate the peak year to current year difference.
Values in bold equal peak levels since 1991. Values in italics equal peak level before wording change. Underlined values equal lowest level since recent peak level.
Level of significance of difference between classes: s = .05, ss = .01, sss = .001.
Any apparent inconsistency between the change estimate and the prevalence estimates for the two most recent years is due to rounding.aThe proportional change is the percent by which the most recent year deviates from the peak year [or the low year] for the drug in question. So, if a drug was at 20% prevalence in the peak year and declined to 10% prevalence in the
most recent year, that would reflect a proportional decline of 50%.bQuestion was discontinued among 8th and 10th graders in 2012.cIn 2013, for the questions on the use of amphetamines, the text was changed on two of the questionnaire forms for 8th and 10th graders and four of the questionnaire forms for 12th graders. This change also impacted the any illicit drug indices. Data presented here include only the changed forms beginning in 2013.dIn 2014, the text was changed on one of the questionnaire forms for 8th, 10th, and 12th graders to include "molly" in the description. The remaining forms were changed in 2015. Data for both versions of the question are presented here.
TABLE 15 (continued)Trends in Annual Prevalence of Use of Various Drugs for Grades 8, 10, and 12 Combined
(Entries are percentages.)
change change change (%) a change change
Peak year–2017 change Low year–2017 change2016–2017 Absolute Proportional Absolute Proportional

1991 1992 1993 1994 1995 1996 1997 1998 1999 2000 2001 2002 2003 2004 2005Any Illicit Drugb 10.9 10.5 13.3 16.8 18.6 20.6 20.5 19.5 19.5 19.2 19.4 18.2 17.3 16.2 15.8Any Illicit Drug other than Marijuanab 5.4 5.5 6.5 7.1 8.4 8.4 8.4 8.2 7.9 8.0‡ 8.2 7.7 7.1 7.0 6.7Any Illicit Drug including Inhalantsb 13.0 12.5 15.4 18.9 20.7 22.4 22.2 21.1 21.1 21.0 20.8 19.5 18.6 17.5 17.5Marijuana/Hashish 8.3 7.7 10.2 13.9 15.6 17.7 17.9 16.9 16.9 16.3 16.6 15.3 14.8 13.6 13.4Inhalants 3.2 3.3 3.8 4.0 4.3 3.9 3.7 3.4 3.3 3.2 2.8 2.7 2.7 2.9 2.9Hallucinogens 1.5 1.6 1.9 2.2 3.1 2.7 3.0 2.8 2.5 2.0‡ 2.3 1.7 1.5 1.5 1.5 LSD 1.3 1.5 1.6 1.9 2.8 2.1 2.4 2.3 2.0 1.4 1.5 0.7 0.6 0.6 0.6 Hallucinogens other than LSD 0.5 0.5 0.7 1.0 1.0 1.2 1.2 1.2 1.1 1.1‡ 1.4 1.4 1.2 1.3 1.2 Ecstasy (MDMA)c, original ― ― ― ― ― 1.5 1.3 1.2 1.6 2.4 2.4 1.8 1.0 0.9 0.9 Revised ― ― ― ― ― ― ― ― ― ― ― ― ― ― ―Cocaine 0.8 0.9 0.9 1.2 1.5 1.7 1.8 1.9 1.9 1.7 1.5 1.6 1.4 1.6 1.6 Crack 0.4 0.5 0.5 0.7 0.8 0.9 0.8 1.0 0.9 0.9 0.9 1.0 0.8 0.8 0.8 Table continued on next page. Other cocaine 0.7 0.7 0.8 1.1 1.2 1.3 1.5 1.6 1.7 1.4 1.3 1.3 1.2 1.4 1.3Heroin 0.2 0.3 0.3 0.4 0.6 0.6 0.6 0.6 0.6 0.6 0.4 0.5 0.4 0.5 0.5 With a needle ― ― ― ― 0.3 0.4 0.3 0.4 0.3 0.3 0.3 0.3 0.3 0.3 0.3 Without a needle ― ― ― ― 0.4 0.4 0.5 0.4 0.4 0.4 0.3 0.4 0.3 0.3 0.3Amphetaminesb 3.0 3.3 3.9 4.0 4.5 4.8 4.5 4.3 4.2 4.5 4.7 4.4 3.9 3.6 3.3 Methamphetamine ― ― ― ― ― ― ― ― 1.5 1.5 1.4 1.5 1.4 1.1 0.9Tranquilizers 1.1 1.1 1.1 1.3 1.6 1.7 1.7 1.9 1.9 2.1 ‡ 2.3 2.4 2.2 2.1 2.1Alcohol 39.8 38.4‡ 36.3 37.6 37.8 38.8 38.6 37.4 37.2 36.6 35.5 33.3 33.2 32.9 31.4 Been drunk 19.2 17.8 18.2 19.3 20.3 20.4 21.2 20.4 20.6 20.3 19.7 17.4 17.7 18.1 17.0 Flavored alcoholic beverages ― ― ― ― ― ― ― ― ― ― ― ― ― 23.0 21.6Cigarettes 20.7 21.2 23.4 24.7 26.6 28.3 28.3 27.0 25.2 22.6 20.2 17.7 16.6 16.1 15.3Smokeless tobacco ― 9.2 9.1 9.7 9.6 8.5 8.0 7.0 6.3 5.8 6.1 5.2 5.3 5.1 5.3Any Vapingd ― ― ― ― ― ― ― ― ― ― ― ― ― ― ― Vaping nicotine ― ― ― ― ― ― ― ― ― ― ― ― ― ― ― Vaping marijuana ― ― ― ― ― ― ― ― ― ― ― ― ― ― ― Vaping just flavoring ― ― ― ― ― ― ― ― ― ― ― ― ― ― ―Large Cigars ― ― ― ― ― ― ― ― ― ― ― ― ― ― ―Flavored Little Cigars ― ― ― ― ― ― ― ― ― ― ― ― ― ― ―Regular Little Cigars ― ― ― ― ― ― ― ― ― ― ― ― ― ― ―Tobacco using a hookah ― ― ― ― ― ― ― ― ― ― ― ― ― ― ―Steroids 0.6 0.6 0.6 0.7 0.6 0.5 0.7 0.7 0.9 0.9 0.9 1.0 0.9 0.9 0.7
TABLE 16Trends in 30-Day Prevalence of Use of Various Drugs for Grades 8, 10, and 12 Combined
(Entries are percentages.)

2006 2007 2008 2009 2010 2011 2012 2013 2014 2015 2016 2017Any Illicit Drugb 14.9 14.8 14.6 15.8 16.7 17.0 16.8 17.3‡ 16.5 15.9 15.5 16.1 +0.6 -0.4 -2.4 +0.6 +3.9Any Illicit Drug other than Marijuanab 6.4 6.4 5.9 5.7 5.7 5.7 5.2 5.4‡ 5.4 5.1 4.6 4.4 -0.1 -1.0 sss -18.2 ― ―Any Illicit Drug including Inhalantsb 16.5 16.5 16.1 17.3 18.0 18.3 17.6 18.4‡ 17.3 16.8 16.0 17.2 +1.2 s -0.1 -0.7 +1.2 s +7.2Marijuana/Hashish 12.5 12.4 12.5 13.8 14.8 15.2 15.1 15.6 14.4 14.0 13.7 14.5 +0.7 -3.4 sss -19.2 +2.1 sss +17.0Inhalants 2.7 2.6 2.6 2.5 2.4 2.1 1.7 1.5 1.4 1.3 1.2 1.3 +0.2 -3.0 sss -68.9 +0.2 +14.3Hallucinogens 1.3 1.4 1.4 1.3 1.4 1.3 1.1 1.1 1.0 1.0 1.0 1.0 +0.1 -1.2 sss -54.5 +0.1 +6.6 LSD 0.6 0.6 0.7 0.5 0.7 0.7 0.5 0.6 0.6 0.7 0.7 0.8 +0.1 -2.0 sss -72.1 +0.2 s +40.8 Hallucinogens other than LSD 1.1 1.1 1.1 1.0 1.2 1.0 0.9 0.8 0.7 0.6 0.5 0.6 +0.1 -0.8 sss -56.9 +0.1 +16.1 Ecstasy (MDMA)c, original 1.0 1.1 1.2 1.2 1.5 1.4 0.8 1.0 0.8 ― ― ― ― ― ― ― ― Revised ― ― ― ― ― ― ― ― 1.1 0.8 0.6 0.6 0.0 -0.5 s -46.1 0.0 +5.8Cocaine 1.6 1.4 1.3 1.0 0.9 0.8 0.8 0.8 0.7 0.8 0.5 0.7 +0.1 -1.2 sss -64.0 +0.1 +27.6 Crack 0.7 0.7 0.6 0.5 0.5 0.5 0.4 0.4 0.4 0.4 0.3 0.4 +0.1 -0.6 sss -64.2 +0.1 28.6 Other cocaine 1.4 1.1 1.1 0.8 0.8 0.7 0.7 0.6 0.6 0.7 0.4 0.6 +0.2 s -1.1 sss -65.7 +0.2 s +42.3Heroin 0.4 0.4 0.4 0.4 0.4 0.4 0.3 0.3 0.3 0.2 0.2 0.2 0.0 -0.4 sss -63.5 0.0 +2.7 With a needle 0.3 0.3 0.3 0.2 0.3 0.3 0.2 0.2 0.3 0.1 0.2 0.1 0.0 -0.2 sss -63.2 0.0 +0.3 Without a needle 0.3 0.3 0.2 0.2 0.3 0.3 0.2 0.2 0.2 0.2 0.1 0.1 0.0 -0.3 sss -73.0 0.0 +6.9Amphetaminesb 3.0 3.2 2.6 2.7 2.7 2.8 2.5 3.2‡ 3.2 2.7 2.5 2.2 -0.2 -0.9 sss -29.2 ― ― Methamphetamine 0.7 0.5 0.7 0.5 0.6 0.5 0.5 0.4 0.3 0.3 0.3 0.2 -0.1 -1.3 sss -87.2 ― ―Tranquilizers 2.1 2.0 1.9 1.9 1.9 1.7 1.5 1.5 1.5 1.5 1.4 1.4 +0.1 -1.0 sss -40.4 +0.1 +4.5Alcohol 31.0 30.1 28.1 28.4 26.8 25.5 25.9 24.3 22.6 21.8 19.8 19.9 +0.1 -18.9 sss -48.7 +0.1 +0.7 Been drunk 17.4 16.5 14.9 15.2 14.6 13.5 14.7 13.5 11.9 11.0 10.1 9.8 -0.3 -11.4 sss -53.8 ― ― Flavored alcoholic beverages 21.7 20.4 18.6 17.9 17.0 15.2 14.9 14.0 12.9 12.8 10.9 12.3 +1.4 ss -10.7 sss -46.6 +1.4 ss +13.1Cigarettes 14.4 13.6 12.6 12.7 12.8 11.7 10.6 9.6 8.0 7.0 5.9 5.4 -0.5 -22.9 sss -80.9 ― ―Smokeless tobacco 5.1 5.2 4.9 6.0 6.5 5.9 5.6 5.7 5.4 4.7 4.1 3.5 -0.7 -6.2 sss -64.3 ― ―Any Vapingd ― ― ― ― ― ― ― ― ― 12.8 9.9‡ 12.0 ― ― ― ― ― Vaping nicotine ― ― ― ― ― ― ― ― ― ― ― 7.5 ― ― ― ― ― Vaping marijuana ― ― ― ― ― ― ― ― ― ― ― 3.6 ― ― ― ― ― Vaping just flavoring ― ― ― ― ― ― ― ― ― ― ― 8.0 ― ― ― ― ―Large Cigars ― ― ― ― ― ― ― ― 3.9 4.2 3.3 3.2 -0.1 -1.0 sss -24.4 ― ―Flavored Little Cigars ― ― ― ― ― ― ― ― 7.4 7.1 5.6 5.4 -0.2 -2.0 sss -27.4 ― ―Regular Little Cigars ― ― ― ― ― ― ― ― 4.5 4.9 3.6 3.6 +0.1 -1.3 sss -25.9 +0.1 +1.5Tobacco using a hookah ― ― ― ― ― ― ― ― ― ― 4.3 3.4 -0.8 -0.8 -18.6 ― ―Steroids 0.7 0.6 0.6 0.6 0.6 0.5 0.5 0.6 0.5 0.5 0.4 0.4 0.0 -0.6 sss -58.8 ― ―Source. The Monitoring the Future study, the University of Michigan.
Notes. ' – ' indicates data not available. ' ‡ ' indicates a change in the question text. When a question change occurs, peak levels after that change are used to calculate the peak year to current year difference.
Values in bold equal peak levels since 1991. Values in italics equal peak level before wording change. Underlined values equal lowest level since recent peak level.
Level of significance of difference between classes: s = .05, ss = .01, sss = .001.
Any apparent inconsistency between the change estimate and the prevalence estimates for the two most recent years is due to rounding.aThe proportional change is the percent by which the most recent year deviates from the peak year [or the low year] for the drug in question. So, if a drug was at 20% prevalence in the peak year and declined to 10% prevalence in the
most recent year, that would reflect a proportional decline of 50%.bIn 2013, for the questions on the use of amphetamines, the text was changed on two of the questionnaire forms for 8th and 10th graders and four of the questionnaire forms for 12th graders. This change also impacted the any illicit drug indices.
Data presented here include only the changed forms beginning in 2013.cIn 2014, the text was changed on one of the questionnaire forms for 8th, 10th, and 12th graders to include "molly" in the description. The remaining forms were changed in 2015. Data for both versions of the question are presented here.dIn 2017, the surveys switched from asking about vaping in general to asking separately about vaping nicotine, marijuana, and just flavoring. Beginning in 2017, data presented for any vaping are based on these new questions.
2016–2017 Absolute Proportional Absolute ProportionalPeak year–2017 change Low year–2017 change
TABLE 16 (continued)Trends in 30-Day Prevalence of Use of Various Drugs for Grades 8, 10, and 12 Combined
(Entries are percentages.)
change change change (%) a change change

1991 1992 1993 1994 1995 1996 1997 1998 1999 2000 2001 2002 2003 2004 2005Marijuana 0.9 0.9 1.2 2.1 2.7 3.2 3.4 3.4 3.5 3.5 3.7 3.5 3.4 3.0 2.9Alcohol 1.7 1.6‡ 2.0 1.8 1.9 2.0 2.1 2.2 2.0 1.7 2.0 1.9 1.7 1.5 1.5 5+ drinks in a row in last 2 weeks 20.0 19.0 19.5 20.3 21.1 21.9 21.9 21.5 21.7 21.2 20.4 18.9 18.6 18.8 17.5 Been drunk 0.4 0.4 0.5 0.6 0.7 0.7 0.9 0.8 0.9 0.8 0.7 0.6 0.7 0.7 0.6 Table continued on next page.Cigarettes 12.4 11.9 13.5 14.0 15.5 16.8 16.9 15.4 15.0 13.4 11.6 10.2 9.3 9.0 8.0 1/2 pack+/day 6.5 6.1 6.9 7.2 7.9 8.7 8.6 7.9 7.6 6.4 5.7 4.9 4.5 4.1 3.7Smokeless tobacco ― 3.0 2.7 2.9 2.5 2.3 2.5 2.1 1.7 1.9 2.0 1.4 1.6 1.7 1.6
TABLE 17Trends in Daily Prevalence of Use of Selected Drugs and Heavy Use of Alcohol and Tobacco
for Grades 8, 10, and 12 Combined(Entries are percentages.)

2006 2007 2008 2009 2010 2011 2012 2013 2014 2015 2016 2017Marijuana 2.8 2.7 2.8 2.8 3.4 3.6 3.6 3.7 3.3 3.3 3.0 3.1 +0.1 -0.5 ss -14.9 +0.4 s +15.0Alcohol 1.5 1.6 1.4 1.3 1.4 1.0 1.2 1.1 1.0 0.8 0.7 0.7 +0.1 -1.4 sss -65.9 +0.1 +11.5 5+ drinks in a row in last 2 weeks 17.4 17.2 15.5 16.1 14.9 13.6 14.3 13.2 11.7 10.7 9.4 9.9 +0.5 -12.1 sss -55.1 +0.5 +5.0 Been drunk 0.7 0.6 0.6 0.5 0.6 0.5 0.6 0.5 0.5 0.3 0.3 0.4 +0.1 s -0.5 sss -54.4 +0.1 s +36.8Cigarettes 7.6 7.1 6.4 6.4 6.4 5.7 5.2 4.7 3.6 3.2 2.5 2.3 -0.2 -14.6 sss -86.4 ― ― 1/2 pack+/day 3.4 3.0 2.7 2.6 2.5 2.1 1.9 1.8 1.4 1.1 0.9 0.8 -0.1 -7.9 sss -90.6 ― ―Smokeless tobacco 1.5 1.6 1.6 1.8 2.1 1.8 1.9 1.7 1.8 1.7 1.4 1.0 -0.4 -2.0 sss -67.2 ― ―Source. The Monitoring the Future study, the University of Michigan.Notes. ' – ' indicates data not available. ' ‡ ' indicates a change in the question text. When a question change occurs, peak levels after that change are used to calculate the peak year to current year difference.
Values in bold equal peak levels since 1991. Values in italics equal peak level before wording change. Underlined values equal lowest level since recent peak level.
Level of significance of difference between classes: s = .05, ss = .01, sss = .001.
Any apparent inconsistency between the change estimate and the prevalence estimates for the two most recent years is due to rounding.aThe proportional change is the percent by which the most recent year deviates from the peak year [or the low year] for the drug in question. So, if a drug was at 20% prevalence in the peak year and declined to 10% prevalence in the
most recent year, that would reflect a proportional decline of 50%.
2016–2017 Absolute Proportional Absolute ProportionalPeak year–2017 change Low year–2017 change
TABLE 17 (continued)Trends in Daily Prevalence of Use of Selected Drugs and Heavy Use of Alcohol and Tobacco
for Grades 8, 10, and 12 Combined(Entries are percentages.)
change change change (%) a change change