taal final report - aquaculture.asiaaquaculture.asia/files/d8_emma_taal_final_report.pdf ·...
TRANSCRIPT

Rapporttittel /Report title
Final Report – Taal Lake
Environmental Monitoring and modelling of aquaculture in risk areas of the Philippines (EMMA)
Forfatter(e) / Author(s) Akvaplan-niva rapport nr / report no: Patrick White APN-2415.04 Guttorm N. Christensen Dato / Date: Rune Palerud 00/00/00 Tarzan Legovic Westly R. Rosario Antall sider / No. of pages Nelson Lopez 39 Regino R. Regpala Distribusjon / Distribution Suncana Gecek Jocelyn Hernandez Begrenset/Restricted Oppdragsgiver / Client Oppdragsg. ref. / Client ref. NIFTDC- BFAR Sammendrag / Summary
Final report of monitoring and modelling of aquaculture impact in Taal Lake Emneord: Key words:
Philippines Aquaculture Environmental survey Training Participatory workshops Prosjektleder / Project manager Kvalitetskontroll / Quality control
Patrick White Anton Giæver
© 2007 Akvaplan-niva The client has permission to copy the complete report, without omissions. It is not allowed to copy, or
use in other ways, parts of the report (texts, figures, conclusion, etc.) without written consent from Akvaplan-niva AS:
9296 Tromsø, Norway Tel. +47 77 75 03 00 Faks +47 77 75 03 01
BFAR-NIFTDC Bonuan-Binloc Dagupan City, Philippines

Final Report – Taal Lake Environmental Monitoring and modelling of aquaculture in risk areas of the Philippines (EMMA)
2
Table of contents Environmental Monitoring and modelling of aquaculture in risk areas of the Philippines (EMMA) ....................................................................................................................................1 1 Introduction and area description............................................................................................3 2 Summary of survey results......................................................................................................4
2.1 Study area .....................................................................................................................4 2.2 Bathymetry ...................................................................................................................5 2.3 Current meters ..............................................................................................................6
2.3.1 Water quality parameters .........................................................................................10 2.3.2 Water column sampling with the CTDO-probe .......................................................14 2.3.3 Sediment sampling (Benthic stations)......................................................................17
3 Registration of Fish Farm structures in Taal Lake (March 2006) ........................................22 4 Modelling carrying capacity .................................................................................................25 5 Recommendations.................................................................................................................27
5.1 Food conversion rate ..................................................................................................27 5.2 Fish culture distribution - 1 ........................................................................................30 5.3 Fish culture distribution - 2 ........................................................................................31 5.4 Increasing carrying capacity by combining with extractive species ..........................32 5.5 Limiting land based nutrient sources..........................................................................34 5.6 Disposal of dead fish ..................................................................................................34 5.7 Cleaning fish nets .......................................................................................................35 5.8 Early warning and possibly forecasting fish kills.......................................................35 5.9 Co-management of the lake........................................................................................36
6 Participatory Workshop ........................................................................................................36 6.1 Participatory Workshop..............................................................................................37

Final Report – Taal Lake Environmental Monitoring and modelling of aquaculture in risk areas of the Philippines (EMMA)
3
1 Introduction and area description Lakes are important aquatic resources in the Philippines. They cover about 200,000 ha in total area nationwide (Philippine Fisheries Profile 1994). Majority of these lakes provide livelihood to the surrounding communities. However, because they are considered a common property, they have been overexploited.
Taal Lake is the third largest lake in the Philippines. Fishing is an important economic activity of the surrounding population in the lake (Figure 1). It is located in the province of Batangas. It covers an aggregate area of 26,750 ha but about 2,493.6 ha are occupied by the Volcano Island, thus the water area is only 24,256.4 ha. In the middle of the Volcano Island is a 190 ha craterlake. The entire lake is the crater of a big volcano surrounded by Tagaytay Ridge and mountains as its caldera wall which covers about 37,790 ha. The lake is roughly oval in shape with rugged and step slope along the western and eastern shore and relatively low plains along the northeast and south
It is relatively a deep lake with the deepest portion as much as 180 meters and an average depth of about 65 meters. The lake has an extensive watershed of about 68,373 ha which extends through the provinces of Batangas and Cavite including Tagaytay City. The watershed is used by the surrounding communities for various uses ranging from agriculture, poultry raising and recently for touristic and housing projects.
The lake has 38 small rivers and streams as inlets but only four of these bodies of water flows throughout the year, namely: Bagbag River, Polsara River and Lipote River in Balete, Municipality and Buga-an in Laurel Batangas. There is one major outlet, the Pansipit River that flows to Balayan Bay. Through this, migratory species from the sea comes and grow in the lake then goes back to the sea to spawn.
The lake provides livelihood to a large number of sustenance fishermen and supplies fishery products to the lakeshore inhabitants. There are 11 municipalities surrounding it. The exploitation of the lake has been intensifying while poverty among its lakeshore communities has been increasingly becoming evident. Marginalized lakeshore inhabitants tend to have low educational attainment. Barely 50% had only reached elementary level (UPLB Foundation, Inc. 1996), thus limiting their opportunities to obtain more lucrative employment elsewhere. Likewise, there are limited livelihood opportunities around the lake. At present, fish cage development has been overcrowding the lake bringing about conflicts between municipal fisherfolk and fish cage operators.

Final Report – Taal Lake Environmental Monitoring and modelling of aquaculture in risk areas of the Philippines (EMMA)
4
2 Summary of survey results
2.1 Study area The whole Taal Lake was included in this study. However, most of the sampling sites were located in areas with high aquaculture activity.
Figure 1. Upper: Satellite image of the Taal Lake (Google earth). Lower: digitalised map of the area.

Final Report – Taal Lake Environmental Monitoring and modelling of aquaculture in risk areas of the Philippines (EMMA)
5
2.2 Bathymetry Detailed knowledge about the bathymetry in an area is vital information for being able to model the water movements and water exchange in an area. Information about currents is important in lakes even though the general water movement (currents) is expected to be not as large as in the marine system. However, river running in and out of a lake can have large impact on the water movement. Wind and waves will also have important influence on the water movement in a lake. There exist maps with depth recording for the Taal Lake. However, more information about depth was needed especially were intense aquaculture activity is located. Therefore a Garmin echo-sounder which contains a GPS and a chart plotter (GPSmap 178C sounder) was set up on one of the BFAR boats so that we could collect more depth readings from the area. This setup measures and stores automatically the depth and tracks tagged with the date and time of creation, as well as water temperature. This setup is part of the equipment that is donated to BFAR for use in future projects. All the collected data were used for the modelling. In Figure 2 transects of the new depth recordings are illustrated. The data collected can be put straight into the model or be used for making new bathymetry maps for the area. A detailed map of the soundings is shown in Figure 3.
Figure 2. Map of Taal Lake demonstrating the new depth recordings. Dark blue illustrates deep areas while light blue illustrates shallower areas.

Final Report – Taal Lake Environmental Monitoring and modelling of aquaculture in risk areas of the Philippines (EMMA)
6
120.94 120.96 120.98 121.00 121.02 121.04 121.06 121.08
13.90
13.92
13.94
13.96
13.98
14.00
14.02
14.04
14.06
14.08
5152535455565758595105115125135145155165175
Figure 3. Detailed bathymetry map of the sound in Taal Lake. Dark blue illustrates deep areas while light blue illustrates shallower areas.
2.3 Current meters Information about the currents (speed, direction, volume) in an area is vital for doing the modelling. This information is used for modelling water exchange which again give information about how often fresh oxygenated water are coming in to an area, how the waste from the aquaculture activity is dispersed, etc.
The current meter model RCM 9 LW from Aanderaa in Norway, was used in these surveys (Figure 4). The RCM 9 LW (Light Weight) utilizes the well-known Doppler Shift principle as basis for its measurements. Four transducers transmit short pulses (pings) of acoustic energy along narrow beams. The same transducers receive backscattered signals from scatters that are present in the beams, which are used for calculation of the current speed and direction. The scattering particles are normally plankton, gas bubbles, organisms and particles stemming from man-made activity.
Two of these current meters have additional sensors to measure conductivity, turbidity, oxygen and pressure (depth).
The current meters were programmed to measure temperature, current-speed and current-direction every 5 minutes. Ideally the current meters should be recording between 10 – 34 days per station to get a really good picture of the current in an area. However due to time limitation most of the current meters were approximately 24 hours at each station. The area is

Final Report – Taal Lake Environmental Monitoring and modelling of aquaculture in risk areas of the Philippines (EMMA)
7
quite shallow so only one current meter were used at each station. For most of the stations the current meters were placed in the middle of the water column.
A typical mooring (set up) for the current meter rig is illustrated in Figure 5. The set up is dependent on the depth on the station. When the depth is less than 10 meters usually only one current meter is mounted in the rig (6 meter depth). For areas with 15 meter depth usually two current meters are mounted at respectively 3.5 meter and 7.5 meter from the surface. At 20 meter depth the current meters are mounted at respectively 5 meters and 10 meters from the surface.
Figure 4. Aanderaa RCM 9 LW current meters equipped with sensors for measuring conductivity, turbidity, oxygen and pressure (depth).
Final Report – Taal Lake Environmental Monitoring and modelling of aquaculture in risk areas of the Philippines (EMMA)
8
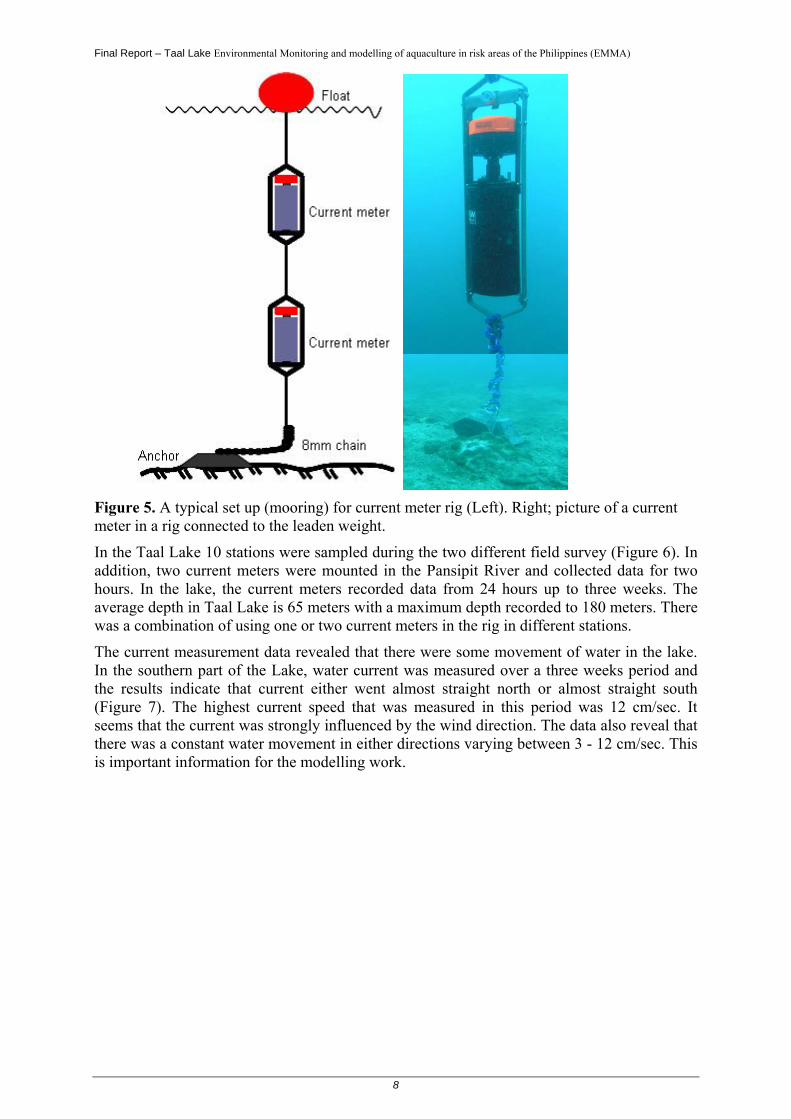
Figure 5. A typical set up (mooring) for current meter rig (Left). Right; picture of a current meter in a rig connected to the leaden weight.
In the Taal Lake 10 stations were sampled during the two different field survey (Figure 6). In addition, two current meters were mounted in the Pansipit River and collected data for two hours. In the lake, the current meters recorded data from 24 hours up to three weeks. The average depth in Taal Lake is 65 meters with a maximum depth recorded to 180 meters. There was a combination of using one or two current meters in the rig in different stations.
The current measurement data revealed that there were some movement of water in the lake. In the southern part of the Lake, water current was measured over a three weeks period and the results indicate that current either went almost straight north or almost straight south (Figure 7). The highest current speed that was measured in this period was 12 cm/sec. It seems that the current was strongly influenced by the wind direction. The data also reveal that there was a constant water movement in either directions varying between 3 - 12 cm/sec. This is important information for the modelling work.

Final Report – Taal Lake Environmental Monitoring and modelling of aquaculture in risk areas of the Philippines (EMMA)
9
Figure 6. Map illustrating the 11 different current meter stations that was used during the two cruises in 2005 and 2006. Station CM01 is indicated with a number.
Lake Taal CM01 (13.5 m depth)water transport (l/(s*m^2))
0123456
015
3045
60
75
90
105
120135
150165
180195
210225
240
255
270
285
300315
330345

Final Report – Taal Lake Environmental Monitoring and modelling of aquaculture in risk areas of the Philippines (EMMA)
10
Lake Taal CM01 (13,5 m depth)
0
45
90
135
180
225
270
315
360
03.09
.06 9:
53
03.11
.06 9:
53
03.13
.06 9:
53
03.15
.06 9:
53
03.17
.06 9:
53
03.19
.06 9:
53
03.21
.06 9:
53
03.23
.06 9:
52
03.25
.06 9:
52
03.27
.06 9:
52
Time
Dire
ctio
n
0
3
6
9
12
15
03.09
.06 9:
53
03.11
.06 9:
53
03.13
.06 9:
53
03.15
.06 9:
53
03.17
.06 9:
53
03.19
.06 9:
53
03.21
.06 9:
53
03.23
.06 9:
52
03.25
.06 9:
52
03.27
.06 9:
52
Time
Spee
d (c
m/s
ec)
Figure 7. Current measurements from station CM01 southern part of sound between the Volcano Island and the mainland in the western part of Taal Lake. Upper: Current-“rose” illustrating current direction (0-360 degrees) and water transport (l/sec per m2). Middle: illustrates the current direction (0-360 degrees). Lower: Illustrates the current speed (cm per sec).
2.3.1 Water quality parameters The Secchi-depth was measured with a standard Secchi-disk (diameter 25 cm). Water samples were taken with Rutner water sampler at 2 meters depth. The stations that were used are the same as being used by BFAR Region 4 in their monitoring program and in addition some new stations were sampled. Two sampling trips were carried out during the project (April 2005 and February/March 2006). The samples were analysed at the laboratory of the BFAR Region 4 Ambulong Station. The parameters that the laboratory can analyse are: dissolved oxygen (DO). pH, CO2, NO2, NH3, H2S. Temperature and wind direction are also parameters that were included in the monitoring program. NH3, NO3
-, PO4-3 and Chlorophyll-a are parameters
that are important for evaluating the water quality.

Final Report – Taal Lake Environmental Monitoring and modelling of aquaculture in risk areas of the Philippines (EMMA)
11
Turbidity sampling (Secchi-depth) The use of a Secchi-disk is a very well known method for measuring the water-transparency and the colour of the water (Figure 8). These data gives information about the amount of particles in the water. The particles are either related to production in the water column (phytoplankton) or particles which come from the drainage area or sediments (sand, dust). The Secchi-depth was measured at all benthic and CTDO stations.
The Secchi-depth varied from 0.8 meter to more than 4 meters (Figure 9). The Secchi-depth was generally lower in the sound and in areas with high aquaculture activity. The reason for this might be caused by increased production of phytoplankton in areas with aquaculture activity due to higher levels of nutrients in the water because of feed spill (overfeeding). In areas with little or no aquaculture activity like in the southern part of the lake, the Secchi depth was overall more than four meters.
Figure 8. Secchi-disk readings.

Final Report – Taal Lake Environmental Monitoring and modelling of aquaculture in risk areas of the Philippines (EMMA)
12
Figure 9. Secchi-disk measurements from the Taal Lake April 2006. The colour of the dot indicates the Secchi-depth (see legend in Figure).
Figure 10. Water sampling in Taal Lake.

Final Report – Taal Lake Environmental Monitoring and modelling of aquaculture in risk areas of the Philippines (EMMA)
13
Two of the most important water quality parameters related to aquaculture and fish kills are the chlorophyll-a and phosphate levels in the water. Chlorophyll is a green photosynthetic pigment found in most plants, algae, and cyanobacteria. Chlorophyll-a level tells something about the production in an area. Production is again closely related to available nutrients in the water.
The BFAR laboratory in Region 4 don’t have the equipment to analyse the water samples for Chlorophyll-a. However the CTDO probe that was used during the two fieldtrips is equipped with a sensor that measures chlorophyll.
The recorded Chlorophyll levels in the surface water (2 meters depth) collected with the CTDO probe ranged from less that 2 μg/l to 22 μg/l (Figure 11). The lowest levels recorded were clearly in areas with little or no aquaculture activity in the southern part of the lake. The reason for this is quite clear and is related to higher levels of nutrients in areas close to the aquaculture activities. Higher nutrient levels results in increased production of phytoplankton.
Figure 11. Chlorophyll-a measurements in the Taal Lake in April 2006. Green dot indicates sampling stations and the size of the dots indicates levels (see legend in figure).

Final Report – Taal Lake Environmental Monitoring and modelling of aquaculture in risk areas of the Philippines (EMMA)
14
2.3.2 Water column sampling with the CTDO-probe Information about conductivity, temperature, salinity and oxygen in the water column is important parameters for understanding the condition and the dynamic of an area. In addition these parameters are sensual for the modelling work. These hydrographic data was measured with an electronic CTDO-probe (Sensordata). The probe that was donated to BFAR has sensor for measuring conductivity (salinity), temperature, depth, chlorophyll, turbidity and oxygen. These are all important parameters for evaluating the conditions of the water column.
During sampling the probe was lowered slowly to the bottom and slowly pulled back to the surface. The probe was programmed to take measurements every 5 seconds. The measured parameters will have seasonal and day – night changes. All the CTDO readings (approximately 110) are plotted in Figure 13.
Figure 12. Sampling with the CTDO-probe.
The CTDO measurements carried out in Taal Lake in April 2005 and March 2006 clearly reveals that the Taal Lake is stratified with a thermocline (metalimnion) ranging from 10 to 20 meters depth. The temperature differences in April 2005 vary between 30.5C˚ in the surface water dropping to less than 26 C˚ in deeper water (below 20 meters). The thermocline leads to big differences in some of the measured parameters between the water layer above (epilimnion) and below (hypolimnion) this thermocline (metalimnion).
In March/April 2005 the oxygen level in the surface were close to 10 mg/l, and drops quickly to less than 4 mg/l below 10 meters depth (in the metalimnion). In this period there was almost no oxygen in the water column below 20 meters at the two stations in the northern part of the sound between the Volcano Island and the mainland. The oxygen level in deeper water at the reference station in the southern part of the lake (CTDO07) was considerably higher

Final Report – Taal Lake Environmental Monitoring and modelling of aquaculture in risk areas of the Philippines (EMMA)
15
compared to areas with high aquaculture activity. In March 2006 almost the same picture was observed with low levels of oxygen in water column below 10 meters.
The Chlorophyll levels followed much the same patterns as for oxygen with high levels in the epilimnion (above the thermocline) and low levels in the hypolimnion (below the thermocline). Some of the measurements indicate a lower level of chlorophyll in the surface (upper 1 meter) which is probably due to strong sun and wave activity. The chlorophyll levels were generally higher in areas with high aquaculture activity. The reason for this is increased phytoplankton production due to higher levels of nutrient in the water close to the fish farms. The higher level of nutrients is caused by feed spill.
Figure 13. CTDO readings in Taal Lake carried out in April 2005 and March 2006.

Final Report – Taal Lake Environmental Monitoring and modelling of aquaculture in risk areas of the Philippines (EMMA)
16
26 27 28 29 30 31
Temperature (°C)
80
60
40
20
0
0 0.4 0.8 1.2 1.6 2
Salinity (PSU)0 2 4 6 8 10
Oxygen (mg/l)0 4 8 12
Chlorophyll - F (µg/l)
CTDO01Lake Taal 10.04.05.
26 27 28 29 30 31
Temperature (°C)
80
60
40
20
0
0 0.4 0.8 1.2 1.6 2
Salinity (PSU)0 2 4 6 8 10
Oxygen (mg/l)0 4 8 12
Chlorophyll - F (µg/l)
CTDO06Lake Taal 10.04.05.
Figure 14. CTDO-profile from station CTDO01 and CTDO06 in Taal Lake, April 2005. Green line indicates chlorophyll, light green - oxygen, blue line - salinity and red line - temperature.
26 27 28 29 30 31
Temperature (°C)
50
40
30
20
10
0
0 0.4 0.8 1.2 1.6 2
Salinity (PSU)0 2 4 6 8 10
Oxygen (mg/l)0 4 8 12
Chlorophyll - F (µg/l)
CTDO07Lake Taal 03.29.05.
Figure 15. CTDO-profile from station CTDO07 in Taal Lake, March 2006. Green line indicates chlorophyll, light green - oxygen, blue line - salinity and red line - temperature.

Final Report – Taal Lake Environmental Monitoring and modelling of aquaculture in risk areas of the Philippines (EMMA)
17
26 27 28 29 30 31
Temperature (°C)
100
80
60
40
20
0
0 0.4 0.8 1.2 1.6 2
Salinity (PSU)0 2 4 6 8 10
Oxygen (mg/l)0 4 8 12
Chlorophyll - F (µg/l)
CTDO17Lake Taal 03.30.06.
26 27 28 29 30 31
Temperature (°C)
100
80
60
40
20
0
0 0.4 0.8 1.2 1.6 2
Salinity (PSU)0 2 4 6 8 10
Oxygen (mg/l)0 4 8 12
Chlorophyll - F (µg/l)
CTDO07Lake Taal 03.31.06.
Figure 16. CTDO-profile of station CTDO17 and CTDO07 from Taal Lake in March 2006. Green line indicates chlorophyll, light green - oxygen, blue line - salinity and red line - temperature.
2.3.3 Sediment sampling (Benthic stations) Sediments are often used as indicators for evaluating the environmental status of an area. It takes much longer time to change the condition of the sediments compared to the water quality parameters. Water quality parameters give a snap shot of the conditions while sediments tell you how the conditions have developed over a longer time period. Therefore sediment samples are very good indicators of the environmental condition.
Sampling was carried out with a 0.05 m2 modified van Veen grab (Figure 17). The grab had hinged and lockable inspection flaps constructed of 0.5 mm mesh. The upper side of each flap was covered by additional rubber flap allowing water to pass freely through the grab during lowering, yet closing the grab to prevent the sediment surface being disturbed by water currents during hauling.
At each station one chemical and one biological grab sample were taken (Figure 18). Sub-samples for analyses of grain size, total organic carbon (TOC) and total nitrogen (TN) were taken from the chemical samples. Each sample was visually inspected to ensure there was no sediment disturbance. Sediment for the grain size, TOC and TN analysis was taken from the upper 2 cm layer. The samples were frozen at -20°C.

Final Report – Taal Lake Environmental Monitoring and modelling of aquaculture in risk areas of the Philippines (EMMA)
18
The volume of the sediment that contained the biological samples was recorded and gently sieved through a 1mm round hole sieve immersed in sea water. The fauna for the semi-quantitative sample were then preserved in 4 % formaldehyde solution stained with rose bengal and neutralized with borax.
Each sediment sample was described with respect to sediment type, smell, colour, larger living animals and any other obvious features (i.e. visible organic layer, bacteria, feces, fish food etc.). Further samples were taken for chemical analysis, grain size and fauna analysis.
Figure 17. Illustration of the van Veen grab and picture of lowering the grab into the water.

Final Report – Taal Lake Environmental Monitoring and modelling of aquaculture in risk areas of the Philippines (EMMA)
19
Figure 18. The grab sample is inspected by through the lid on top of the grab. A sample for chemical analysis is taken from the upper surface (2 cm).
Figure 19. Biological samples gently sieved through a 1mm round hole sieve immersed in sea water

Final Report – Taal Lake Environmental Monitoring and modelling of aquaculture in risk areas of the Philippines (EMMA)
20
In Taal Lake all the sediment samples where evaluated visually and by smelling the sample. In areas with bad environmental conditions the sediments had high organic content and smelled H2S (Figure 20). In these samples there were no recorded live animals. Stations with bad sediment conditions were often related to areas with high fish farming activity (Figure 21). In areas with less fish farming there were no H2S smell or high organic content and there were also recorded live animals. None of the grab stations were evaluated to have sediments with “very good” conditions. The reason for that was the relatively high organic content at all stations. Even the reference station in the southern part of Taal Lake where there was no aquaculture activity had high organic content in the sediments.
The distribution and abundance of organisms, numbers of species and community structure were analysed as a pilot faunal registration. These measurements give good indications of the environmental state of the area. Fifteen samples were collected in Taal Lake.
High organic content- close to a fish cage
Low organic content- far away from a fish cage
Figure 20. Sediment samples from sites with different environmental conditions. The left picture is of sediments close to a fish cage; the sediments have high organic content, no live animals and smelling H2S. Right picture is from an area far away from a fish cage; where the sediment is in good conditions (picture is not from Taal Lake but used as an illustration of “very good” sediment conditions).

Final Report – Taal Lake Environmental Monitoring and modelling of aquaculture in risk areas of the Philippines (EMMA)
21
Figure 21. Illustration of the sediment conditions on 15 stations in Taal Lake March 2006. Green dot indicates “Very good” conditions while red dot indicates “Very bad” conditions.
Final Report – Taal Lake Environmental Monitoring and modelling of aquaculture in risk areas of the Philippines (EMMA)
22
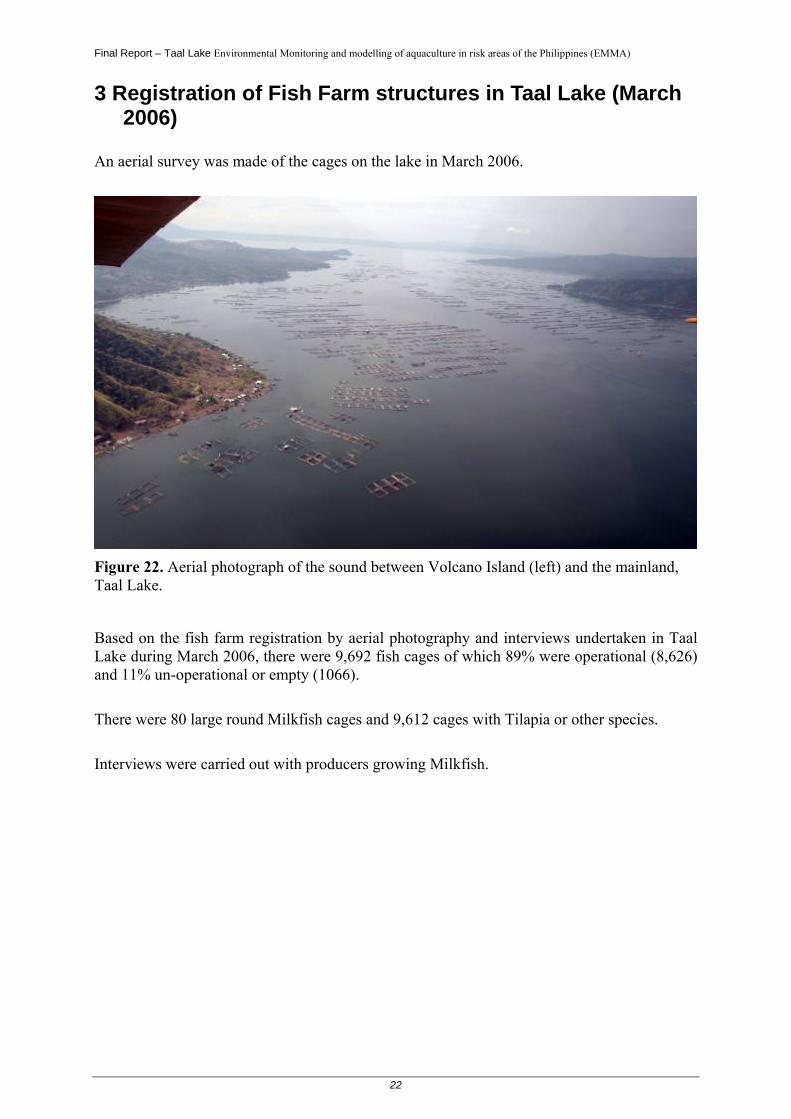
3 Registration of Fish Farm structures in Taal Lake (March 2006)
An aerial survey was made of the cages on the lake in March 2006.
Figure 22. Aerial photograph of the sound between Volcano Island (left) and the mainland, Taal Lake.
Based on the fish farm registration by aerial photography and interviews undertaken in Taal Lake during March 2006, there were 9,692 fish cages of which 89% were operational (8,626) and 11% un-operational or empty (1066).
There were 80 large round Milkfish cages and 9,612 cages with Tilapia or other species.
Interviews were carried out with producers growing Milkfish.

Final Report – Taal Lake Environmental Monitoring and modelling of aquaculture in risk areas of the Philippines (EMMA)
23
Taal Lake milkfish cages - Range and averaged figures Taal – Fish Cage Range Average Date 30 March 2006 Type Fish Cage - round Net Volume (m3) 1000 to 1508 1177 Species Bangus Bangus Stocking Density (fry/m3) 12 to 34.5 20.3 Present Density (kg/m3) 3.34 to 8.6 4.10 Present Size (g) 2 to 250 225 Present biomass 4,826 kg Final market size (g) 250g to 500 336 Survival (%) 50 to 96 84 Culture period (months) 5.5 to 6 5.67 Final density 5 to 9.9 5.72 Feed given (kg/day) 75 to 300 144 Feeding rate 1.45 to 4.45%/day 2.98%/day FCR 1.67 to 2.5:1 2.14:1
Figure 23. Map illustrating all the aquaculture activity in Taal Lake in 2005/2006. Grey colorized areas indicate fish farm areas. Light blue colorations indicate areas with fish ponds. The number of cages for each area is given as numbers in the illustration.

Final Report – Taal Lake Environmental Monitoring and modelling of aquaculture in risk areas of the Philippines (EMMA)
24
There were a total of 71 operational Milkfish cages with a total volume of 83,567 m3. There were 1,696,410 fry stocked at two grams size and were grown to a market size of 336 grams in 5.67 months.
The cages are presently stocked with 1,524,440 fish with an average size of 225 grams and have a stocking density of 4.10 kg/m3. The standing stock was 343 tonnes of fish. The fish are fed at 2.98% per day using 10,250 kg of feed per day.
A production cycle from stocking fry to harvest size is 5.67 months giving 2.11 crops per year per cage. The average market size is 336 grams. The total production per cycle is 479 tonnes and the total production per year from cage culture is 1,014 tonnes.
Interviews were carried out with Tilapia fish cage operators.
Taal Fish Cage - Range and averaged figures Taal – Fish Cage Range Average Date 30 March 2006 Type Fish Cage - square Net Volume (m3) 700 to 1000 837.5 Species Tilapia Tilapia Stocking Density (fry/m3) 62 to 214 153.8 Present Density (kg/m3) 0.62 to 7.5 4.14 Present Size (g) 50 to 500 221.5 Present Biomass (kg) 2,467 Final market size (g) 225g to 500 311.75 Survival (%) 4.3 to 50 16.9 Culture period (months) 4 to 7 5.75 Final density 2.5 to 10 7.45 Feed given (kg/day) 5 to 100 60.5 Feeding rate 1.45 to 4.45%/day 2.45%/day FCR 2.14 to 2.5:1 2.22:1 A total of 8,555 operational Tilapia cages with a total volume of 7,164,813 m3 were recorded. There were 1,101,948,162 fry stocked at 0.5 gram size and were grown to a market size of 312 grams in 5.75 months.
The cages are presently stocked with 95,277,650 fish with an average size of 221.5 grams and have a stocking density of 4.14 kg/m3. The standing stock was 21,104 tonnes of fish. The fish were fed at 2.45% per day using 517,558kg of feed per day.
A production cycle from stocking fry to harvest size is 5.75 months giving 2.09 crops per year per cage. The average market size is 312 grams. The total production per cycle is 53,376 tonnes and the total production per year from cage culture is 111,393 tonnes.
Total The total operational fish cages have a volume of 7,248,380 m3 and are stocked with tilapia (99.5%) and milkfish. There are 1,103,644,572 fry stocked at between 0.5 and 2g size per crop and were grown to a market size of 315 grams in 5.75 months.
The cages are presently stocked with 96,802,090 fish with an average size of 222 grams and have a stocking density of 4.14 kg/m3. The present standing stock is 21,447 tonnes. The fish were fed at 2.85% per day using 529,078 kg of feed per day.

Final Report – Taal Lake Environmental Monitoring and modelling of aquaculture in risk areas of the Philippines (EMMA)
25
A production cycle from stocking fry to harvest size is 5.75 months giving 2.09 crops per year per cage. The average market size is 315 grams. The total production per cycle is 53,855 tonnes and the total production per year from cage culture is 112,408 tonnes.
In total in March 2006 there was a standing stock of 21,447 tonnes of fish giving an annual production of 112,408 tonnes of fish. During April an average of 529 tonnes of fish feed was fed per day.
The surface area on Taal lake is 234,000,000 m2 (not including the island) i.e. 23,400 ha. Therefore there was production of 4.8 tonnes of fish per ha.
4 Modelling carrying capacity Volume of the receiving body of water is V = 2.43 109 m3. This volume is derived from the surface area of the Taal Lake, which is 2.43 108 m2 and the depth of the upper 10 m.
Average yearly rainfall is 1882.9 mm and average evaporation is 116.75 mm, so the net water layer entering the Lake is 1766.15 mm over the watershed and the lake. In addition to the lake, the watershed is 4.2 108 m2. Hence the yearly inflow is 1.2 109 m3.
D = (inflow=outflow)/V = 0.494 1/year.
The lake needs two years to renew one volume of water to the depth of ten meters.
The net inflow of aquacultures is: Fn = 2.13 103 kg (phosphorus)/day = 770 t/y.
(White, 2006 a). This value may be compared to 816 t/y reported by Vista et al., 2006.
Hence, the contribution of fish cultures to the nutrient concentration in phytoplankton is:
Ia = 777 103 (kg_P/y) / 0.494 (1/y) * 2.43 109 m3 = 730 103 (kg_P/y) / (1.2 109 (m3/y)) = 608 (mg_P/ m3 = μg_P/l) According to the Florida Lakewatch relationship: Log10 (μg Chl-a/l) = – 0.369 + 1.053 Log10 (μg TP/l) The value of total phosphorus translates to 365 μg Chl-a/l. From the above calculation it would appear that the carrying capacity of the Taal Lake has been overcome due to fish cultures alone by a factor of 3.7.
Let us now assume that nitrogen is limiting.
Input of nitrogen to the water column from aquacultures is 26 259.56 kg/day (White, 2006 a).
Ia = 9.6 106 (kg_N/y) / 1.2 109 (m3/y) = 4 (g N/m3) = 8000 (μg_N/l).

Final Report – Taal Lake Environmental Monitoring and modelling of aquaculture in risk areas of the Philippines (EMMA)
26
Now using the Lakewater relationship between Total Nitrogen and Chl-a: Log (μg Chl-a-l) = -2.42 + 1.206 log (μg TN-l) we obtain 193 μg Chl-a/l. We conclude that if nitrogen were limiting, and other sources of nitrogen are negligible, the carrying capacity for aquacultures in the Taal lake would be overcome by a factor of 2.
Finally, with N/P of 13.13 (by weight) simultaneous limitation of N and P can not be ruled out. In this case the following relationship would hold (Lakewatch, part 2, page 16):
Chl-a = 0.628 TP - 2.402 For the Taal lake the resulting chlorophyll-a would be: 379 ugChl-a/l.
Discussion Vista et al. (2006) report following values and ranges found in Taal from 1973 to 2000: 67000, 10-230, 40-270, 50 and 80 (μg P/l). Assuming the first value to be an outlier, we can conclude that measured values are in the range from 10 to 270 (μg P/l). A value above 170 indicates that the carrying capacity has been overcome. However, our computed value exceeds the upper value of the measurement range, hence a discussion is necessary.
1) In the above model sinking of material emitted from aquacultures is not included. If
half of the material sinks to the bottom, we end up with a half of the above calculated value.
2) Some phytoplankton is eaten by both wild and cultured fish. This proportion translates into a decrease of Chl-a hence a decrease of unfiltered total phosphorus.
3) It is also assumed that the emission from aquacultures is constant throughout the year and homogeneously distributed in the lake. Even if that were the case, violent storms are clearing the lake of phytoplankton through flushing. However in between the storms, especially in the dry season, phytoplankton may grow as dictated by the aquaculture emission of nutrients since aquacultures are a dominant source of nutrients in Taal Lake. Hence, phytoplankton may grow to densities which are detrimental to fish.
4) Finally the above resulting Chl-a concentration is calculated from fish culture sources only. Contribution of phosphorus from land based sources is not included. It has been estimated that about 20 % of the sources from fish culture represents a contribution from land based sources (Vista et al., 2006). Although, this may be an overestimate about 60 to 100 kg P/day is possible.
Conclusions Given the existing data, one conclusion is apparent: total present aquacultures are almost double the carrying capacity of the Taal Lake. Calculation of carrying capacity based on contribution of fish aquacultures and input from other sources indicate that the lake can support at most about 20 000 t of fish stock. As aquaculture production is already above this value actions must be taken to improve food conversion rate and disperse aquaculture so that they get more oxygen from nearby water. In addition, it would be useful to move aquacultures away from the coast on the windward side so that they would have safer production. Finally,

Final Report – Taal Lake Environmental Monitoring and modelling of aquaculture in risk areas of the Philippines (EMMA)
27
installing shellfish or hydroponic cultures would increase carrying capacity for fish cultures in the lake.
5 Recommendations In order to continue and possibly to increase fish production, the following measures are recommended.
5.1 Food conversion rate It is urgently necessary to organize a comprehensive education program for fish caretakers and fish owners into lowering the feeding of fish. At present fish caretakers appear to over feed the fish by at least 30 %. By less intensive feeding they would get the same production which costs less and would cause less environmental damage. Thereby they would increase carrying capacity of the Taal lake for fish production. Traditional hand-feeding uses feed tables and the experienced eye of the operator to adjust the feed quantity to suit the needs of the stock. However, the operator tends to overfeed especially in cages which have become larger and deeper so that accurate visual observations of the stock have become more difficult. There is a relatively simple method of improving information feedback of feed consumption, by means of a feeding tray. A small feeding tray is made from split bamboo and mosquito mesh similar to the ones used in shrimp ponds
. This has a sting long enough to reach from the bottom of the cage to the surface. The tray is lowered to the bottom of the cage before feeding and then the operator stats to feed. After some time of feeding the tray is lifted out of the water to see if there are any pellets caught on the mesh. If there are pellets then freed would have been escaping from the bottom of the net with being eaten. If there are no pellets, then the tray is lowered again and feeding recommenced. This action is repeated until pellets are found on the tray at which time feeding is stopped for at least one hour.

Final Report – Taal Lake Environmental Monitoring and modelling of aquaculture in risk areas of the Philippines (EMMA)
28
The tray could be fitted with a long bamboo to make the lifting easier.
A more sophisticated method is to use airlift pumps. Feed may is given until a significant number of pellets are observed being drawn up through the airlift pump by the operators. Feeding is then stopped. Feed is the most important variable production cost. A simple objective is therefore to minimize waste from uneaten food, which has the added benefit of reducing the risk of environmental degradation. Food conversion rate in farms is around 2.2:1 for Tilapia but depends on the feeding strategy and strict feeding management. This over feeding results in excess nutrients entering the aquatic ecosystem as organic sediments or dissolved nutrients in the water column. Reported waste loading rates per 1,000 kg of harvested shrimp have ranged widely, from 10 to 117 kg for N and 9 to 46 kg for P, depending upon FCR. For example, according to the Asian Shrimp Culture Council (Anon 1993a), the calculated waste loading rates per 1,000 kg of harvested shrimp would be as follows:
FCR Organic Nitrogen Phosphorus
Fish feed

Final Report – Taal Lake Environmental Monitoring and modelling of aquaculture in risk areas of the Philippines (EMMA)
29
Matter 1 500 26 13
1.5 875 56 212 1250 87 28
2.5 1625 117 38 By improving the food conversion rate from 2.5:1 to 2.0:1, the organic matter, nitrogen and phosphorus will be reduced by 30.0%, 34.5% and 35.7% respectively. Figure
Discharge of nutrients with increasing FCR
0
20
40
60
80
100
120
140
1 1.5 2 2.5
fcr :1
kg p
er 1
000
kg s
hrim
ps p
rodu
ced
0
200
400
600
800
1000
1200
1400
1600
1800
Nitrogen Phosphorus Organic Matter Using modelling the reduction of impact on the sediment can be demonstrated.

Final Report – Taal Lake Environmental Monitoring and modelling of aquaculture in risk areas of the Philippines (EMMA)
30
100 150 200 250 300 350 400200
250
300
350
400
450
0A5A10A25A
50A
100 150 200 250 300 350 400Easting (m)
200
250
300
350
400
450
Nor
thin
g (m
)
0A5A10A25A
50A
N
50 m
500
2500
5000
10000
30000
Solids flux (g m yr )-2 -1
a. FCR 1.6:1 (efficient)
b. FCR 2.0:1 (less efficient)
The figure shows the effect between cages with a FCR of 1.6:1 (FI = 111.6 kg cage-1 d-1) and 2.0:1 (FI = 139.5 kg cage-1 d-1). A depth of 15 m was used.
5.2 Fish culture distribution - 1 It appears that massive fish kills are linked to the direction of intensive seasonal winds. Fish kills occur at the side of wind blowing (windward). At this side one expects thinning, while on the opposite (leeward) side one expects thickening, of the layer above the thermocline. When the upper layer is very thin, the lower sulphide rich water may occupy most of the water column in which fish is found. In that case, fish kill would be imminent. The solution is to move fish cages away from the coast.

Final Report – Taal Lake Environmental Monitoring and modelling of aquaculture in risk areas of the Philippines (EMMA)
31
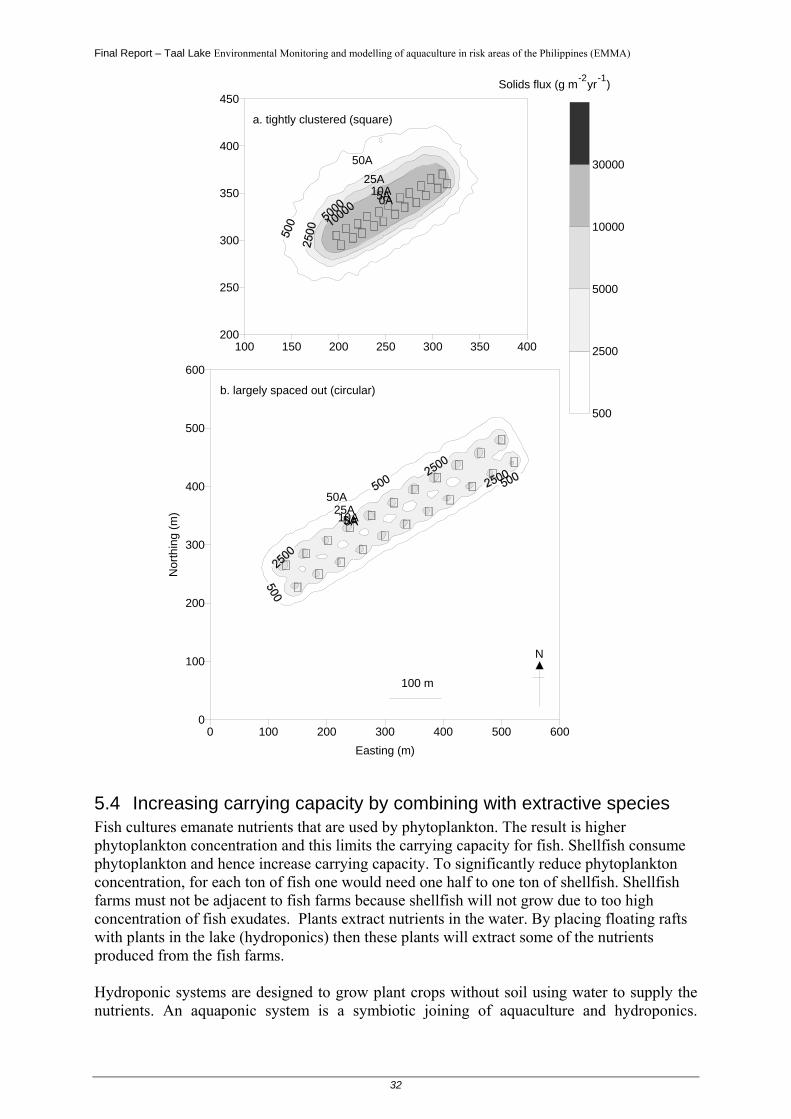
5.3 Fish culture distribution - 2 Movement of water which is not very intensive in periods of calm, since it is mainly wind driven, means that water exchange through fish farms is limited. Water exchange is needed since higher dissolved oxygen is expected outside each farm. In addition the impact on the lake bed is less if cages are further apart. Hence, fish farms must not be clumped but dispersed. When cages are placed close together, there are areas of continuous impact below the cages and if production is high, then continuous azoic areas (See figure). However if the cages are spaced apart from each other there are pockets of less impacted areas where benthic organisms can survive which improve the ability of the sediment to assimilate the organic matter and recolonise the impacted areas (See figure below). Figure 2. Model predictions of flux (g m-2 yr-1) showing the significant difference in deposition footprint severity and extent when tightly clustered square cages are replaced by circular cages spaced by 30 m. For the spaced out cages, areas of lower flux are shown in between lines of cages which will tend to assist sediment processes (MERAMED).
Final Report – Taal Lake Environmental Monitoring and modelling of aquaculture in risk areas of the Philippines (EMMA)
32
100 150 200 250 300 350 400200
250
300
350
400
450
0A5A10A25A
50A
N
a. tightly clustered (square)
b. largely spaced out (circular)
Solids flux (g m yr )-2 -1
100 m
0 100 200 300 400 500 600Easting (m)
0
100
200
300
400
500
600
Nor
thin
g (m
)
0A5A10A25A50A
500
2500
5000
10000
30000
5.4 Increasing carrying capacity by combining with extractive species Fish cultures emanate nutrients that are used by phytoplankton. The result is higher phytoplankton concentration and this limits the carrying capacity for fish. Shellfish consume phytoplankton and hence increase carrying capacity. To significantly reduce phytoplankton concentration, for each ton of fish one would need one half to one ton of shellfish. Shellfish farms must not be adjacent to fish farms because shellfish will not grow due to too high concentration of fish exudates. Plants extract nutrients in the water. By placing floating rafts with plants in the lake (hydroponics) then these plants will extract some of the nutrients produced from the fish farms. Hydroponic systems are designed to grow plant crops without soil using water to supply the nutrients. An aquaponic system is a symbiotic joining of aquaculture and hydroponics.

Final Report – Taal Lake Environmental Monitoring and modelling of aquaculture in risk areas of the Philippines (EMMA)
33
Nitrogen waste from fish metabolites provides needed nutrients to the vegetable or plant crops. By removing these wastes the vegetables remove nutrients from the water improving the environment for the fish promoting faster growth and healthier fish. In aquaponics, nutrient wastes produced by the fish are used to fertilize hydroponics floating production beds. This is good for the fish because plant roots and associated rhizosphere bacteria remove nutrients from the water. These nutrients - generated from fish waste, algae, and decomposing fish feed - are contaminants that would otherwise build up to toxic levels in the water, but instead serve as liquid fertilizer to hydroponically grown plants. In turn, the hydroponics beds function as a biofilter. Most plants can be grown in hydroponics. This includes trees, shrubs, flowers, herbs, strawberries and most major crops. The most economical crops grown in Australia are lettuce, tomatoes, cucumbers, capsicums, strawberries, egg plants and flowers such as carnations, roses, gypsophilia, chrysanthemums, orchids also a wide range of herbs are grown hydroponically. In China, floating bed hydroponics has been developed for a number of plants and vegetables.
Plants that will do well in any aquaponics system: • any leafy lettuce • pak choi • spinach • arugula • basil • mint
Rice plants cultivated on the surface of a fishpond
Canna and umbrella sedge on floating beds
Flowers grown on floating beds

Final Report – Taal Lake Environmental Monitoring and modelling of aquaculture in risk areas of the Philippines (EMMA)
34
• watercress • chives • most common house plants There is already a primitive type of aquaponics being practiced on Taal lake for coconut trees and abandoned cages filled with grasses and floating water hyacinth.
A small trial was set up to test the viability of aquaponics in Taal lake using feed sacks, bamboo and coconut matting made into a small floating bed and then a variety of vegetables inserted into the floating structure.
5.5 Limiting land based nutrient sources Land based nutrient sources contribute to the nutrient input into the Taal lake. Decreasing these sources will increase carrying capacity for fish farms. During field trips we have seen garbage dumps near the lakeshore. These must be moved away from the shore and garbage properly deposited. Lake shore must be free from any garbage. Deposition of garbage near the shore must be strictly forbidden and enforced. This is easy to do by posting appropriate signs at visible places and by educating young people.
5.6 Disposal of dead fish During site visits we have seen dead fish in water inside or near fish farms. It should be forbidden to leave any dead fish in water. Dead fish are decomposed in water. Decomposition process consumes oxygen and releases nutrients into the water column. Both processes decrease carrying capacity for fish farms.

Final Report – Taal Lake Environmental Monitoring and modelling of aquaculture in risk areas of the Philippines (EMMA)
35
5.7 Cleaning fish nets Due to fouling of fish nets it is essential to periodically clean the nets. However, nets must not be treated with antifouling paints.
5.8 Early warning and possibly forecasting fish kills It is very important to document, maintain and analyze occurrence of fish kills: times, localities, weather conditions, water parameters and extent of fish kills. These data are needed to develop early warning and possibly forecasting systems. Both early warning and forecasting systems are very important in order to give fish caretakers time to organize themselves and collect fish that will die otherwise. There is a definite link between rainfall and fish kills (See the 2 figures below).
Rainfall in Taal Lake
0
50
100
150
200
250
300
Jan Feb Mar April May Jun Jul Aug Sep oct Nov Dec
Months
mm
per
mon
th
Rainfall

Final Report – Taal Lake Environmental Monitoring and modelling of aquaculture in risk areas of the Philippines (EMMA)
36
Number of fish kills per month in Taal lake
0
5
10
15
20
25
30
January February March April May June July August September October November December
Monthly number of fish kills in Taal lake between 1997 and 2005. In April after the first heavy rains there are much higher levels of nutrients entering the lake. After the dry season there has been a build up of nutrients in the soil. This coupled with disturbance of the soil from building and land clearance means that during the first heavy rains these nutrients are flushed into the lake. Although the rains continue, the amount of nutrients entering the lake decreases with time. The increase in nutrients entering the lake in effect reduces the carrying capacity of the lake fro aquaculture. This knowledge allows fish farmers to avoid the periods of high risk from fish kills by harvesting before May, stocking fish to avoid high biomass during May, etc.
5.9 Co-management of the lake The LGUs are not cooperating with the planning and management of the lake as one ecosystem. Therefore a framework must be set up to allow coordinated and co-management of the planning and management of aquaculture in Taal lake by all LGUs in the watershed. Some possible solutions are;
• Use PAMB as a basis for integrated management planning • Strengthen fisheries and aquaculture inputs to PAMB • Scientific understanding of the ecosystem • Estimate carrying capacity in different parts of the bay • Zoning for most suitable areas for aquaculture • Co-management of production • Co-enforcement of regulations • Co- survey of environmental impact
6 Participatory Workshop A participatory workshop on Environmental Monitoring and Modelling of Aquaculture was undertaken at Taal Lake on 28 – 29 November 2006

Final Report – Taal Lake Environmental Monitoring and modelling of aquaculture in risk areas of the Philippines (EMMA)
37
6.1 Participatory Workshop A participatory workshop on Environmental Monitoring and Modelling of Aquaculture was undertaken at Taal Lake on 28 – 29 November 2006 Part I. Implementors and planners Workshop Date: 28 November 2006 Composition of participants:
• Local government: provincial and municipal agriculturist offices, local government unit
• Government agency: BFAR Total participants: 17 A. PROPOSED MANAGEMENT STRATEGIES
1. Zoning and lay-outing of cages. Fish cage zone includes Mataas na kahoy, Agoncillo, San Nicolas and Laurel. Each cluster will be composed of 4 cages laid out in single file, with 1 m distance in between cages and 20 m space in between clusters. There will be 5 to 6 clusters per ha.
2. Reduction of inputs (feeds) 3. Optimization of farm operation 4. Reduction of outputs 5. Co-management of ecosystem – involvement of concerned municipalities in the
management of Taal Lake 6. Prediction of risk periods 7. Rationalization of data management
• creation and setting-up of a centralized database that will be hosted at BFAR-Ambulong
8. Maximise the carrying capacity of the area • construction of cages in areas with high carrying capacity
9. Feed conversion ratio • increase the carrying capacity by 56% by changing the FCR ratio from 2.2:1 to
1.5:1 10. Feeding demand
• right way of feeding with considerations of effects of shadow, predator, feeding time, etc. 11. Integrated aquaculture
• shellfish production, e.g. freshwater pearl. Brown mussel culture was tried but unsuitable.
• hydroponics, e.g. using floating raft, etc. 12. Declustering of cages/pens 13. Fine-tuning of the carrying capacity model 14. Aerial photography as a monitoring tool 15. Conduct of a study on the relationship of volcanic activity to fish kill 16. Fill in some data gaps for carrying capacity computation and modelling, i.e. nutrient
concentration in river systems (tributaries), flux from 4 major rivers, Pansipit river

Final Report – Taal Lake Environmental Monitoring and modelling of aquaculture in risk areas of the Philippines (EMMA)
38
outflow, and water level. A pole can be installed at the Pansipit river to regularly measure the water level.
17. Regulations include: registration of fish cages using color coding; a unified collection of fees; training of caretakers; prescribed stocking density; choice of materials to be used for cages; and a need for all the researches done by the academe to be passed thru PAMB (Protected Area Management Board).
The PAMB has come up with a Unified Rules and Regulations for Taal Lake covering the aquaculture industry, wherein the zoning plan is already available. The draft will be presented during the public hearing on 13-14 Dec and at the general assembly on last week of January. All mayors have already signed the Covenant on Conservation and Protection of Taal Lake.
B. Issue: Two sanctuaries were already declared but were not enforced. Fish cages are presently occupying the area. Part II. Stakeholders’ Workshop Date: 29 November 2006 Composition of participants:
• Local government: Provincial Agriculturist Office, Provincial Environment and Natural Resources Office, Provincial Planning and Development Office, Integrated Fisheries and Aquatic Resources Management Council, GSO and LGU
• Government agency: Laguna Lake and Development Authority, Philvolcs, DENR and DA-BFAR
• NGO: Tanggol Kalikasan • Academe: University of the Philippines-Los Banos, De La Salle University,
University of the Philippines-Diliman, University of Batangas, Ateneo de Manila • Fish cage operators
Total no of participants: 60 Discussion:
1. Policy such as regulating the number of licenses that will be issued depending on the carrying capacity of the lake can be considered.
2. Flushing has minimal effect in measuring the carrying capacity of the lake 3. The distribution of sampling stations was uneven because the basis used in choosing
the sampling site was based on the objective of the project, i.e. impact of aquaculture, thus sampling stations were placed near the fish cages.
4. Calculation of carrying capacity was limited to 10 m depth since the distribution of chlorophyll-a was put into consideration. One variable that should be incorporated into the model is the nutrient contribution from domestic wastes (which is 70%).
5. The project was commended for the knowledge transfer component, re: methods used in monitoring and the donation of equipments.
6. Follow-up projects/activities identified were buying of monitoring equipment that will measure DO and chlorophyll-a to gather long term information about the lake and use as a basis for early warning system.

Final Report – Taal Lake Environmental Monitoring and modelling of aquaculture in risk areas of the Philippines (EMMA)
39
ACTION PLAN
1. Feeding practice a. Training of trainers on feeding practice
BFAR has available training materials already and has conducted trainings before. It only needs to revive the activity, and review some information re: proper stocking density needs to be changed since it is not applicable anymore now. The following will be included in the planning of activities of BFAR for 2007: re-orientation training, training of caretakers and operators, and training for technicians. An observer from BFAR Taal (1 person) can be sent to Bolinao in March during the Training of Trainers.
b. Presentation of the EMMA output before the PAMB to aid (i.e. amend or add)
their drafted regulations, before it will be presented at the public hearing. Public hearing is on 13 and 14 Dec. Due to time constraints, Patrick has recommended that APN can just make some comments on the drafted Unified Rules and regulation (URR) of TVLP.
2. Extractive Species
Production trial of freshwater pearls. Seedstock should come from Sampaloc Lake 3. Carrying capacity Modelling. Data gaps include river flow, human contribution, flux
of Pansipit river. Dir. Macas has suggested to include the DENR in this activity because Taal Lake is also under their jurisdiction.
4. Explore the relationship between volcanic activity and fish kill.
5. Issues on the effect of fish traps/fish corral in the water flow. Water flow will not be
affected by these structures, it is the fish cages in deeper areas that will. Fish corrals cant be banned because it is allowed under the fishery laws, one option can be its regulation.