t. rowe price tramx pramx i classindividual.troweprice.com/gcfiles/pdf/srame.pdfoperations. we took...
TRANSCRIPT

Proof #5
April 30, 2017
SEMIANNuAlREPORT
Africa & Middle East Fund
Africa & Middle East Fund– I Class
T. RowE PRICE
The fund invests in companies in the rapidly developing Africa and Middle East region.
TRAMX
PRAMX

Proof #5
REPORTS ON THE WEB
Sign up for our Email Program, and you can begin to receive updated fund reports and prospectuses online rather than through the mail. Log in to your account at troweprice.com for more information.
HIGHLIGHTS
• StocksinAfricanandMiddleEasternmarketsgenerallyroseinthesix-monthperiodendedApril30,2017.
• Yourfundfaredslightlybetterthanitsbenchmark.Goodstockselectioninseveralcountriescontributedtoourrelativeperformance,butstockselectioninSaudiArabiadetracted.
• IntheGulfCooperationCouncil,banksaresomeofourmostimportantinvestments.InAfrica,weareunderweightingSouthAfricabuthaveboostedourEgyptexposure.Wehaveseveralsmallinvestmentsinsub-SaharanAfricancountriestohelpusdiversifytheportfolio.
• Wehavearobustlong-termoutlookforAfricaandtheMiddleEast,asfundamentalsremainfavorableandeconomiesshouldbesupportedbyattractivedemographics,risingurbanization,andinfrastructureinvestment,aswellasastrongbaseofnaturalresources.
T. Rowe Price Africa & Middle East Fund
The views and opinions in this report were current as of April 30, 2017.They are not guarantees of performance or investment results andshouldnotbe takenas investmentadvice. Investmentdecisionsreflectavarietyof factors,and themanagers reserve the right tochange theirviews about individual stocks, sectors, and the markets at any time.As a result, the views expressed should not be relied upon as a fore-castof the fund’s future investment intent.Thereport iscertifiedunderthe Sarbanes-Oxley Act, which requiresmutual funds and other publiccompanies to affirm that, to the best of their knowledge, the informa-tionintheirfinancialreportsisfairlyandaccuratelystatedinallmaterialrespects.

Proof #5
T. Rowe Price Africa & Middle East Fund
Manager’s Letter
1
Fellow Shareholders
Stocks in African and Middle Eastern markets generally rose in the six-month period
ended April 30, 2017. Saudi Arabia and Kuwait advanced more than 16%, as oil prices
stabilized around $50 per barrel, helped by an OPEC production cut that took effect
at the beginning of 2017. In Africa, Egyptian shares slumped more than 29% in U.S.
dollar terms, as the central bank devalued its currency in November and inflation
spiked. South African shares rose 7%, even though the economy remained anemic
under unpopular President Jacob Zuma and the country was downgraded below
investment grade late in our reporting period. Sub-Saharan markets were mixed.
PERFORMANCE COMPARISON
Your fund returned 8.70% in the first half of our fiscal year. As shown in the Performance Comparison table, the fund fared slightly better than its benchmark. Good stock selection in the United Arab
Emirates (UAE) and Egypt contributed the most to our relative performance, but stock selection in the UK and South Africa was also helpful. On the other hand, our stock selection in Saudi Arabia detracted from our results. Also,
our performance would have been even better if we had had larger positions in our UK, Egyptian, and Kuwaiti holdings, which generally did better than their peers in the benchmark.
Six-MonthPeriodEnded4/30/17 TotalReturn
Africa&MiddleEastFund 8.70%
S&PEmerging/FrontierME&AfricaBMIexIL 8.42
Performance Comparison
Proof #5
2
PORTFOLIO REVIEW
GULF COOPERATION COUNCIL (GCC)
Saudi ArabiaStocks in Saudi Arabia rose about 17% in the last six months. The Saudi economy has been improving gradually with more stable oil prices, but there are still some fiscal pressures on the government and various corporations. Credit growth is slow, but liquidity is expected to continue improving on the heels of a $9 billion bond issuance in April and possible future bond issuances. The kingdom is proceeding with its plan to diversify its economy and reduce reliance on oil and is expected to begin privatizing various state-run assets later this year.
Banks remain important investments, and we are encouraged by trends in the industry, such as balance sheet deleveraging, improving liquidity, and better-than-expected first-quarter earnings. Cheap valuations, attractive dividend yields, and rising U.S. interest rates—to which Saudi rates are tied—are additional positives. We particularly like Banque Saudi Fransi, which was a solid performer in the last six months, given its balance sheet strength and management quality, but we also have stakes in Saudi British Bank, National
Commercial Bank, and Samba Financial. (Please refer to the portfolio of investments for a complete list of holdings and the amount each represents in the portfolio.)
Another solid performer in the kingdom was hospital operator Al Mouwasat Medical Services. The Saudi health ministry is planning to privatize all state-run hospitals by creating new companies to own and operate the
medical facilities. In addition, there are plans for all Saudi nationals to be covered by health insurance prior to the privatizations. We believe this will be a positive catalyst for Bupa Arabia for Cooperative Insurance. A significant contributor to our six-month performance was food and dairy company Almarai, helped by expectations for
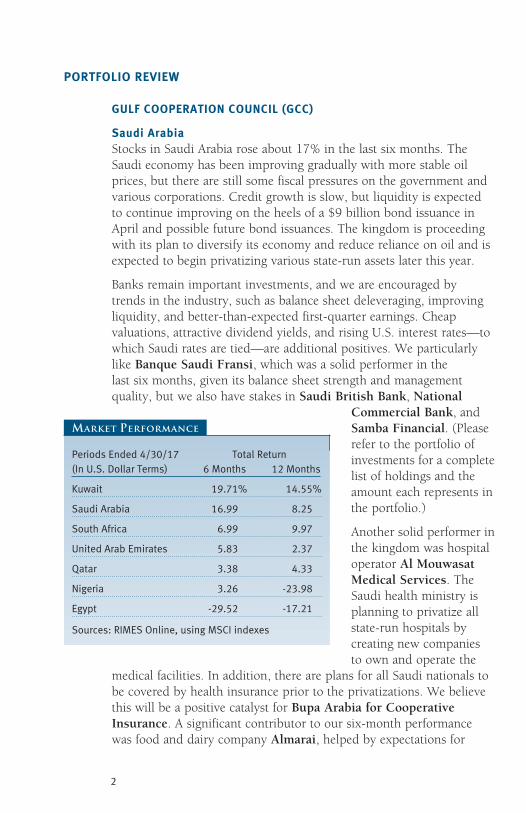
PeriodsEnded4/30/17 TotalReturn(InU.S.DollarTerms) 6Months 12Months
Kuwait 19.71% 14.55%
SaudiArabia 16.99 8.25
SouthAfrica 6.99 9.97
UnitedArabEmirates 5.83 2.37
Qatar 3.38 4.33
Nigeria 3.26 -23.98
Egypt -29.52 -17.21
Sources:RIMESOnline,usingMSCIindexes
Market Performance

Proof #5
3
an improving Saudi economy and a better outlook for its poultry operations. We took some profits from our Almarai stake and started a position in Savola, a food manufacturer and grocery store operator that has a sizable stake in Almarai and seemed more attractively valued. We also added Saudi Arabian Mining to the portfolio. The company focuses on gold, phosphate, and aluminum, and we believe it could benefit from the rising price of aluminum, especially as China seeks to reduce aluminum production in an effort to control pollution.
United Arab Emirates (UAE)The UAE stock market returned about 6% in the last six months. The UAE has a more diversified economy compared with other GCC economies, as it remains an important regional hub for tourism, trade, and transportation. We are overweighting the country versus the benchmark due to the attractiveness of its investment opportunities, particularly in these sectors.
One of our top contributors in the portfolio was Aramex, a Middle East logistics company whose management has significant ambitions to expand in Africa and Asia. Shares were driven by strong financial results and expectations for GCC logistics markets to strengthen, and we took some profits. Two other good contributors were global ports operator DP World and oil services company Lamprell, which we believe remains undervalued—as long as oil prices do not return to their early-2016 lows, as that may delay the recovery in oil service projects. Shares of Emaar Properties were lackluster, but the company remains a high-quality real estate player taking market share in the UAE.
The UAE banks have solid fundamentals and our position in First Gulf Bank, which was merged with National Bank of Abu Dhabi (NBAD) to form the largest bank in the UAE, made a strong contribution to our results. We believe the market is underestimating the synergies that will come from the merger, and we increased our stake in the combined entity NBAD. Abu Dhabi Commercial Bank and Emirates NBD, both of which recently reported solid earnings, also produced gains and could benefit from additional industry consolidation.
Kuwait and QatarWhile shares in Kuwait rose almost 20% in the last six months, we continue to have difficulty finding well-managed companies there. Our position in National Bank of Kuwait, the country’s largest bank,

Proof #5
4
continues to grow steadily and produced good returns; the company has a strong capital position and an attractive valuation and dividend yield. A new holding was Humansoft Holding Company, which we added to the portfolio late in our reporting period. The company owns and operates two educational institutions that are affiliated with Purdue University in the U.S. and should benefit from growth
in private education. While the company partly depends on the Kuwaiti government, public education is sacrosanct in Kuwait, so cuts in education spending are unlikely, even in a weak oil price environment.
In Qatar, our investments were mostly lackluster, and we have slowly been reducing our overall exposure. The country’s buildout in anticipation of the 2022 World Cup soccer tournament
has become painfully slow. We have been reducing our profitable investment in logistics provider and freight forwarding company Gulf Warehousing, as we believe that much of its growth is now behind it. Qatar National Bank’s earnings were hurt by the company’s exposure to Egypt and Turkey, whose currencies have been very weak in the last few months.
South AfricaDespite a stalled economy, South African stocks rose about 7% in the last six months. While the rand rose less than 1% versus the U.S. dollar, it was very weak at times in response to rising U.S. interest rates and domestic political uncertainty. President Jacob Zuma remains unpopular, and his recent dismissal of respected Finance Minister Pravin Gordhan prompted credit rating agencies S&P Global and Fitch to downgrade the sovereign debt—unsurprisingly—to junk status in early April. Several large South African banks were also dropped to below investment grade.
Egypt6%
United ArabEmirates14%
Qatar3%
UnitedKingdom
4%South Africa37%
Other andReserves7%
Kuwait5%
Saudi Arabia24%
Based on net assets as of 4/30/17.
Note: Country classification reflects location oflisting exchange.
Geographic Diversification

Proof #5
5
While South Africa is our largest country allocation in absolute terms, it remains our largest underweight versus the benchmark. We reduced our allocation slightly over the last six months, in part through eliminations of mining company AngloGold Ashanti and Telkom and profitable reductions of pay-TV operator Naspers and insurer Sanlam. We expect to maintain an underweight for the near future, as an expected upswing in the economy in the second half of 2017 may now take longer to manifest. We are cautiously optimistic that Zuma’s time in office is limited and hopeful that new leadership will lift sentiment and implement needed reforms to jump-start the economy. For the time being, we have tilted our exposure toward high-quality growth companies with offshore earnings, as well as companies whose earnings do not depend so much on the domestic economy.
One of our contributors was Bid, the world’s largest food service provider outside the U.S., with operations in more than 30 countries. The company, which was spun off from BidVest in 2016, features healthy cash flow generation, a strong balance sheet, and an excellent track record of international mergers and acquisitions. Despite strong earnings-driven gains in the last six months, we believe the market continues to undervalue the company’s relative insulation from economic downturns and its ability to grow meaningfully over many years. Diversified financial services provider FirstRand, which is looking to expand across the African continent, reported good financial results in early March despite the domestic economic malaise. We trimmed our position in FirstRand and in other financial stocks in recent months, in part because of Zuma’s rhetoric and allegations against major financial players.
Pharmaceutical company Aspen Pharmacare Holdings was disappointing in the last six months. We are not yet seeing Aspen’s recent acquisitions, integration, and streamlining work and new product development translating into better earnings growth. However, we are confident—especially following a recent discussion with management—that the company’s longer-term strategy and prospects are solid, so we are maintaining our position.
Sub-Saharan AfricaTo help us diversify the portfolio, we have several small investments in countries such as Uganda and Botswana. While the long-term prospects for many of these countries seem favorable—based on rising incomes and an apparent shift away from natural resource dependence for growth—many of our sub-Saharan investments sagged in the
Proof #5
6
last six months. We recently traveled to Zambia in search of new investment ideas and are cautiously optimistic that its economy will do better this year on the back of lower interest rates, higher copper prices, and possible International Monetary Fund (IMF) financial assistance. We also visited Tanzania, where a government crackdown on corruption and tax evasion could hinder near-term growth, although the crackdown is a longer-term positive for the country.
Nigeria’s economy continues to struggle due in part to capital controls and reduced liquidity, and we are unlikely to make additional invest-ments at least until the central bank adjusts the currency exchange rate. While we eliminated SEPLAT Petroleum Development, we maintained small positions in a few companies, such as Nigerian Breweries and Nestle Foods Nigeria. Meanwhile, Kenya’s economy and banks are struggling with the unintended consequences of last year’s decision to cap interest rates. At the end of April, we only owned shares of Safaricom, which we trimmed, and ARM Cement.
EgyptEgypt’s stock market tumbled over 29% in dollar terms in the last six months. The decline reflects an IMF-recommended devaluation
of the currency—the central bank allowed it to free float last November—and the government has agreed to implement reforms in order to procure financial assistance. While the economy is currently under significant stress from high inflation, the lower exchange rate should encourage foreign investments to return. If inflation recedes as we expect, 2018 should be a much better year for the economy.
In the last six months, we boosted our Egypt exposure by adding several companies to the portfolio, mainly those
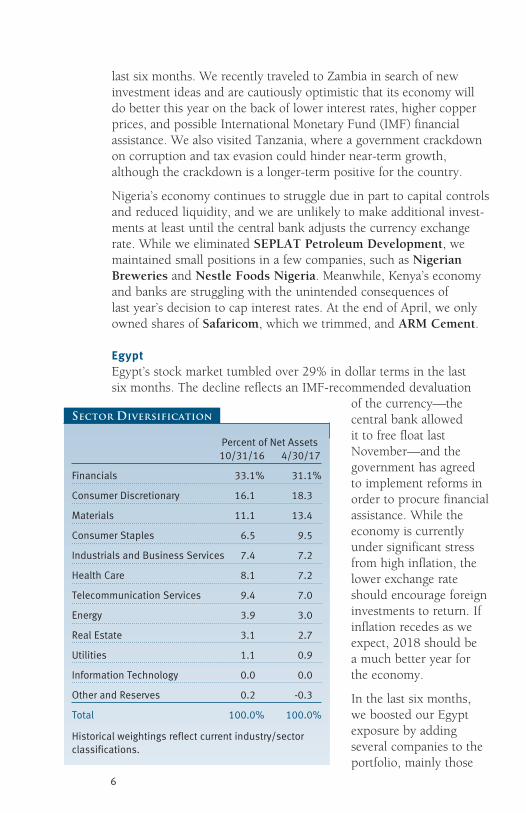
PercentofNetAssets 10/31/16 4/30/17
Financials 33.1% 31.1%
ConsumerDiscretionary 16.1 18.3
Materials 11.1 13.4
ConsumerStaples 6.5 9.5
IndustrialsandBusinessServices 7.4 7.2
HealthCare 8.1 7.2
TelecommunicationServices 9.4 7.0
Energy 3.9 3.0
RealEstate 3.1 2.7
Utilities 1.1 0.9
InformationTechnology 0.0 0.0
OtherandReserves 0.2 -0.3
Total 100.0% 100.0%
Historicalweightingsreflectcurrentindustry/sectorclassifications.
Sector Diversification

Proof #5
7
whose revenues benefit from the depreciated currency, including investment bank Egyptian Financial Group—Hermes Holding; cable manufacturer Elsewedy Electric; and Telecom Egypt. Many of these companies are reasonably priced, if not cheap, and should benefit from an improving economy going forward. We also added Netherlands-based fertilizer company OCI, which has operations in Egypt, and it was one of our largest contributors. We maintained a stake in Commercial International Bank Egypt, which has ample liquidity and is well positioned to benefit from an economic recovery. We are likely to add further to companies that have domestic exposure as we grow confident that reforms and an easing of this year’s inflation spike lead to a pickup in the economy in 2018.
UK companies operating in Africa and the Middle EastWe continued to own a few UK companies that have significant operations or assets in our investment universe. Gold-mining company Centamin, whose primary asset is the Sukhari gold mine in Egypt, was one of our better-performing UK holdings. In contrast, Petra Diamonds, which has four of its five mines in South Africa, sagged. However, Petra’s expected ramp-up in volumes remains on track. We eliminated Hikma Pharmaceuticals and Mediclinic International in the last six months but added Tullow Oil, which we felt was undervalued. The company has operations in Europe, Africa, South Asia, and South America, and we believe it should do well in a more stable environment for oil prices.
OUTLOOK
African and Middle Eastern markets are on better footing, helped by strong regional growth, meaningful political and economic improvements in certain countries, and steadier oil prices as global growth increases and demand picks up. While global supply is likely to keep pressure on oil prices for some time, we are encouraged that various governments and policymakers have adapted to the new oil price reality. Of course, oil is just one factor in this fascinating region of burgeoning long-term investment opportunities. We continue to have a robust long-term outlook, as fundamentals remain favorable and economies should be supported by attractive demographics, rising urbanization, and infrastructure investment, as well as a strong base of natural resources.

Proof #5
8
In the Middle East, Saudi Arabia is ramping up its Vision 2030 plans to diversify the kingdom away from oil. New bond issuance, privatiza-tion of state-owned assets, and structural reforms are likely to be more visible in the next few years. The UAE’s diversified economy continues to thrive as tourists flock to Dubai and avoid riskier destinations in the region.
South African assets have been volatile due to political uncertainty and credit rating concerns, both of which are restraining the economy and keeping investors from focusing on longer-term corporate fundamentals. South African companies actually have some of the best management teams in the entire emerging markets universe, and we are watching closely for compelling buying opportunities. Given the political risks under the Zuma administration, selectivity is crucial.
Elsewhere in Africa, Egypt has great long-term potential that has been suppressed by the political and economic turmoil of the last few years. While 2017 will be a difficult year of adjustment, we are looking forward to what we believe will be a better economic environment in 2018. In sub-Saharan Africa, we are seeing signs of a growth uptick in several countries that could accelerate in 2018. Nigeria remains in a challenging state, but a recent reform plan, if carried out, could lead to the sale of some state assets and a more flexible exchange rate—both of which could help jump-start the economy.
As always, we would like to remind our investors that this fund has a high risk/return profile. Because of its narrow geographic focus and relatively small number of holdings, this fund can be extremely volatile and should represent only a small portion of a long-term investor’s well-diversified portfolio.
Respectfully submitted,
Oliver BellPortfolio manager
May 12, 2017
The portfolio manager has day-to-day responsibility for managing the portfolio and works with committee members in developing and executing the fund’s investment program.
Proof #5
9
T. Rowe Price Africa & Middle East Fund
Risks of International Investing
Investinginthesecuritiesofnon-U.S.issuersinvolvesspecialrisksnottypicallyassociatedwithinvestinginU.S.issuers.InternationalsecuritiestendtobemorevolatileandlessliquidthaninvestmentsinU.S.securitiesandmaylosevaluebecauseofadverselocal,political,social,oreconomicdevelopmentsoverseas,orduetochangesintheexchangeratesbetweenforeigncurrenciesandtheU.S.dollar.Inaddition,internationalinvestmentsaresubjecttosettlementpracticesandregulatoryandfinancialreportingstandardsthatdifferfromthoseoftheU.S.
Therisksofinternationalinvestingareheightenedforsecuritiesofissuersinemergingmarketcountries.Emergingmarketcountriestendtohaveeconomicstructuresthatarelessdiverseandmature,andpoliticalsystemsthatarelessstable,thanthoseofdevelopedcountries.Inadditiontoalloftherisksofinvestingininternationaldevelopedmarkets,emergingmarketsaremoresusceptibletogovernmentalinterference,localtaxesbeingimposedoninternationalinvestments,restrictionsongainingaccesstosalesproceeds,andlessliquidandlessefficienttradingmarkets.
Frontiermarketsgenerallyhavesmallereconomiesandlessmaturecapitalmarketsthanemergingmarkets.Asaresult,therisksofinvestinginemergingmarketcountriesaremagnifiedinfrontiermarketcountries.Frontiermarketsaremoresusceptibletoabruptchangesincurrencyvalues,lessmaturemarketsandsettlementpractices,andlowertradingvolumesthatcouldleadtogreaterpricevolatilityandilliquidity.
Glossary
S&P Emerging/Frontier ME & Africa BMI ex IL:Anindexthatincludesallofthedailypriced,free-floatmarketcapthatS&PcoversacrosstheMiddleEastandAfrica,excludingIsrael.
Note:MSCImakesnoexpressorimpliedwarrantiesorrepresentationsandshallhavenoliabilitywhatsoeverwithrespecttoanyMSCIdatacontainedherein.TheMSCIdatamaynotbefurtherredistributedorusedasabasisforotherindicesoranysecuritiesorfinancialproducts.Thisreportisnotapproved,reviewed,orproducedbyMSCI.
Proof #5
10
T. Rowe Price Africa & Middle East Fund
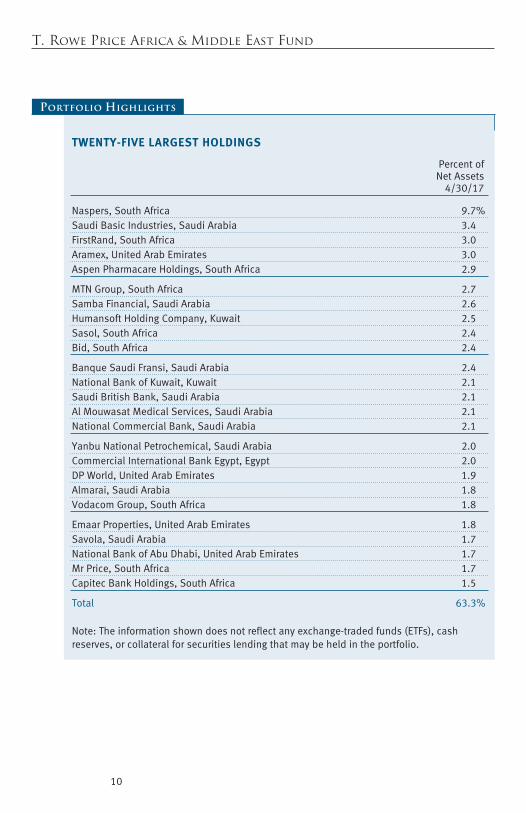
TWENTY-FIVE LARGEST HOLDINGS
Percentof NetAssets 4/30/17
Naspers,SouthAfrica 9.7%SaudiBasicIndustries,SaudiArabia 3.4FirstRand,SouthAfrica 3.0Aramex,UnitedArabEmirates 3.0AspenPharmacareHoldings,SouthAfrica 2.9
MTNGroup,SouthAfrica 2.7SambaFinancial,SaudiArabia 2.6HumansoftHoldingCompany,Kuwait 2.5Sasol,SouthAfrica 2.4Bid,SouthAfrica 2.4
BanqueSaudiFransi,SaudiArabia 2.4NationalBankofKuwait,Kuwait 2.1SaudiBritishBank,SaudiArabia 2.1AlMouwasatMedicalServices,SaudiArabia 2.1NationalCommercialBank,SaudiArabia 2.1
YanbuNationalPetrochemical,SaudiArabia 2.0CommercialInternationalBankEgypt,Egypt 2.0DPWorld,UnitedArabEmirates 1.9Almarai,SaudiArabia 1.8VodacomGroup,SouthAfrica 1.8
EmaarProperties,UnitedArabEmirates 1.8Savola,SaudiArabia 1.7NationalBankofAbuDhabi,UnitedArabEmirates 1.7MrPrice,SouthAfrica 1.7CapitecBankHoldings,SouthAfrica 1.5
Total 63.3%
Note:Theinformationshowndoesnotreflectanyexchange-tradedfunds(ETFs),cashreserves,orcollateralforsecuritieslendingthatmaybeheldintheportfolio.
Portfolio Highlights
Proof #5
11
T. Rowe Price Africa & Middle East Fund
Performance and Expenses
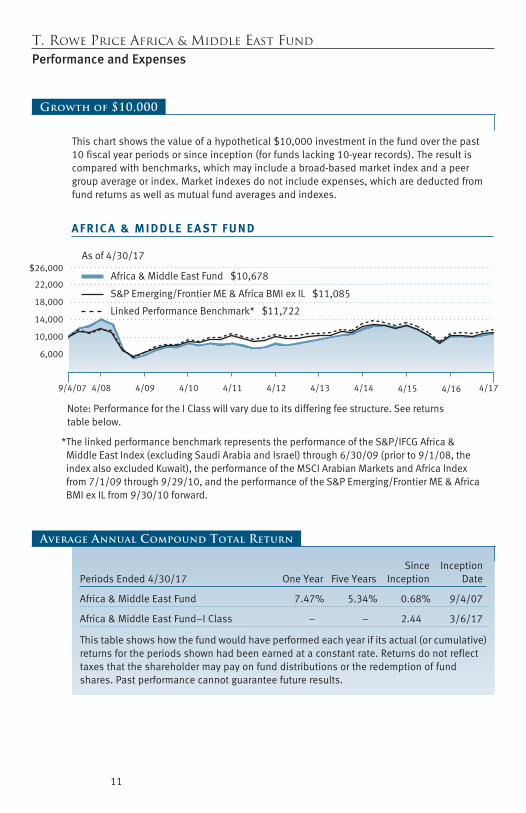
S&P Emerging/Frontier ME & Africa BMI ex IL $11,085
Africa & Middle East Fund $10,678
As of 4/30/17
9/4/07 4/134/124/114/104/094/08 4/174/14 4/15 4/16
A F R I C A & M I D D L E E A ST F U N D
Linked Performance Benchmark* $11,722
6,000
10,000
14,000
18,000
22,000
$26,000
*The linked performance benchmark represents the performance of the S&P/IFCG Africa & Middle East Index (excluding Saudi Arabia and Israel) through 6/30/09 (prior to 9/1/08, the index also excluded Kuwait), the performance of the MSCI Arabian Markets and Africa Index from 7/1/09 through 9/29/10, and the performance of the S&P Emerging/Frontier ME & Africa BMI ex IL from 9/30/10 forward.
Note: Performance for the I Class will vary due to its differing fee structure. See returnstable below.
Growth of $10,000
Thischartshowsthevalueofahypothetical$10,000investmentinthefundoverthepast10fiscalyearperiodsorsinceinception(forfundslacking10-yearrecords).Theresultiscomparedwithbenchmarks,whichmayincludeabroad-basedmarketindexandapeergroupaverageorindex.Marketindexesdonotincludeexpenses,whicharedeductedfromfundreturnsaswellasmutualfundaveragesandindexes.
Since InceptionPeriodsEnded4/30/17 OneYear FiveYears Inception Date
Africa&MiddleEastFund 7.47% 5.34% 0.68% 9/4/07
Africa&MiddleEastFund–IClass – – 2.44 3/6/17
Thistableshowshowthefundwouldhaveperformedeachyearifitsactual(orcumulative)returnsfortheperiodsshownhadbeenearnedataconstantrate.Returnsdonotreflecttaxesthattheshareholdermaypayonfunddistributionsortheredemptionoffundshares.Pastperformancecannotguaranteefutureresults.
Average Annual Compound Total Return

Proof #5
12
T. Rowe Price Africa & Middle East Fund
Fund Expense Example
Asamutualfundshareholder,youmayincurtwotypesofcosts:(1)transactioncosts,suchasredemptionfeesorsalesloads,and(2)ongoingcosts,includingmanagementfees,distribu-tionandservice(12b-1)fees,andotherfundexpenses.Thefollowingexampleisintendedtohelpyouunderstandyourongoingcosts(indollars)ofinvestinginthefundandtocomparethesecostswiththeongoingcostsofinvestinginothermutualfunds.Theexampleisbasedonaninvestmentof$1,000investedatthebeginningofthemostrecentsix-monthperiodandheldfortheentireperiod.
Pleasenotethatthefundhastwoshareclasses:Theoriginalshareclass(InvestorClass)chargesnodistributionandservice(12b-1)fee,andtheIClasssharesarealsoavailabletoinstitutionallyorientedclientsandimposeno12b-1oradministrativefeepayment.Eachshareclassispresentedseparatelyinthetable.
Actual ExpensesThefirstlineofthefollowingtable(Actual)providesinformationaboutactualaccountvaluesandexpensesbasedonthefund’sactualreturns.Youmayusetheinformationonthisline,togetherwithyouraccountbalance,toestimatetheexpensesthatyoupaidovertheperiod.Simplydivideyouraccountvalueby$1,000(forexample,an$8,600accountvaluedividedby$1,000=8.6),thenmultiplytheresultbythenumberonthefirstlineundertheheading“ExpensesPaidDuringPeriod”toestimatetheexpensesyoupaidonyouraccountduringthisperiod.
Hypothetical Example for Comparison PurposesTheinformationonthesecondlineofthetable(Hypothetical)isbasedonhypotheticalaccountvaluesandexpensesderivedfromthefund’sactualexpenseratioandanassumed5%peryearrateofreturnbeforeexpenses(notthefund’sactualreturn).Youmaycomparetheongoingcostsofinvestinginthefundwithotherfundsbycontrastingthis5%hypotheticalexampleandthe5%hypotheticalexamplesthatappearintheshareholderreportsoftheotherfunds.Thehypotheticalaccountvaluesandexpensesmaynotbeusedtoestimatetheactualendingaccountbalanceorexpensesyoupaidfortheperiod.
Note:T.RowePricechargesanannualaccountservicefeeof$20,generallyforaccountswithlessthan$10,000.ThefeeiswaivedforanyinvestorwhoseT.RowePricemutualfundaccountstotal$50,000ormore;accountselectingtoreceiveelectronicdeliveryofaccountstatements,transactionconfirmations,prospectuses,andshareholderreports;oraccountsofaninvestorwhoisaT.RowePricePreferredServices,PersonalServices,orEnhancedPersonalServicesclient(enrollmentintheseprogramsgenerallyrequiresT.RowePriceassetsofatleast$100,000).Thisfeeisnotincludedintheaccompanyingtable.Ifyouaresubjecttothefee,keepitinmindwhenyouareestimatingtheongoingexpensesofinvestinginthefundandwhencomparingtheexpensesofthisfundwithotherfunds.
Youshouldalsobeawarethattheexpensesshowninthetablehighlightonlyyourongoingcostsanddonotreflectanytransactioncosts,suchasredemptionfeesorsalesloads.Therefore,thesecondlineofthetableisusefulincomparingongoingcostsonlyandwillnothelpyoudeterminetherelativetotalcostsofowningdifferentfunds.Totheextentafundchargestransactioncosts,however,thetotalcostofowningthatfundishigher.

Proof #5
13
T. Rowe Price Africa & Middle East Fund
Beginning Ending ExpensesPaid AccountValue AccountValue DuringPeriod 11/1/16 4/30/17 11/1/16to4/30/171
Investor ClassActual $1,000.00 $1,087.00 $7.66
Hypothetical(assumes5%returnbeforeexpenses) 1,000.00 1,017.46 7.40
3/7/172 4/30/17 3/7/17to4/30/172,3
I ClassActual $1,000.00 $1,024.40 $1.68
11/1/162 4/30/17 11/1/16to4/30/172,4
Hypothetical(assumes5%returnbeforeexpenses) 1,000.00 1,019.34 5.51
1Expensesareequaltothefund’sannualizedexpenseratioforthe6-monthperiod(1.48%),multipliedbytheaverageaccountvalueovertheperiod,multipliedbythenumberofdaysinthemostrecentfiscalhalfyear(181),anddividedbythedaysintheyear(365)toreflectthehalf-yearperiod.
2Theactualexpenseexampleisbasedontheperiodsincetheclass’sstartofoperationson3/7/17,onedayafterinception;thehypotheticalexpenseexampleisbasedonthehalf-yearperiodbeginning11/1/16,asrequiredbytheSEC.
3Expensesareequaltotheclass’sannualizedexpenseratiofortheperiod,multipliedbytheaverageaccountvalueovertheperiod,multipliedbythenumberofdaysintheperiod(55),anddividedbythedaysintheyear(365)toreflecttheperiodsincetheclass’sstartofoperations.TheannualizedexpenseratiooftheIClasswas1.10%.
4Expensesareequaltotheclass’sannualizedexpenseratiofortheperiod,multipliedbytheaverageaccountvalueovertheperiod,multipliedbythenumberofdaysinthemostrecentfiscalhalfyear(181),anddividedbythedaysintheyear(365)toreflectthehalf-yearperiod.TheannualizedexpenseratiooftheIClasswas1.10%.
Africa & Middle East Fund
Fund Expense Example (continued)
Proof #5
14
T. Rowe Price Africa & Middle East Fund
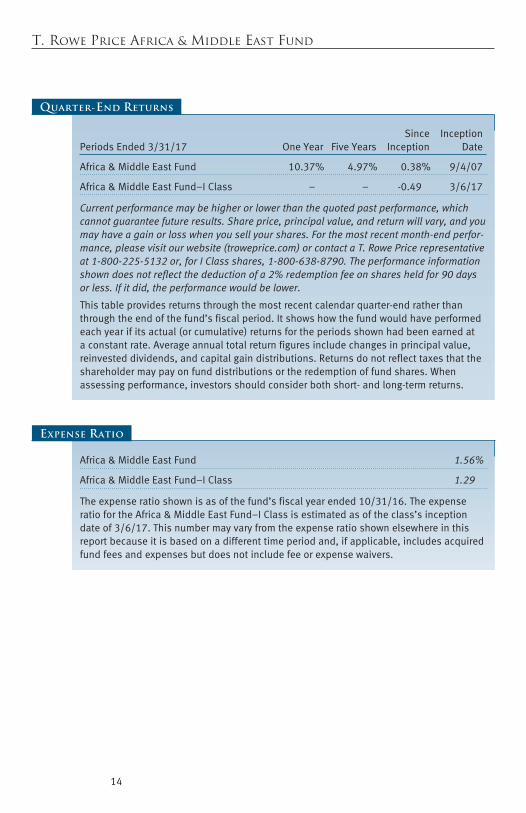
Since InceptionPeriodsEnded3/31/17 OneYear FiveYears Inception Date
Africa&MiddleEastFund 10.37% 4.97% 0.38% 9/4/07
Africa&MiddleEastFund–IClass – – -0.49 3/6/17
Current performance may be higher or lower than the quoted past performance, which cannot guarantee future results. Share price, principal value, and return will vary, and you may have a gain or loss when you sell your shares. For the most recent month-end perfor-mance, please visit our website (troweprice.com) or contact a T. Rowe Price representative at 1-800-225-5132 or, for I Class shares, 1-800-638-8790. The performance information shown does not reflect the deduction of a 2% redemption fee on shares held for 90 days or less. If it did, the performance would be lower.
Thistableprovidesreturnsthroughthemostrecentcalendarquarter-endratherthanthroughtheendofthefund’sfiscalperiod.Itshowshowthefundwouldhaveperformedeachyearifitsactual(orcumulative)returnsfortheperiodsshownhadbeenearnedataconstantrate.Averageannualtotalreturnfiguresincludechangesinprincipalvalue,reinvesteddividends,andcapitalgaindistributions.Returnsdonotreflecttaxesthattheshareholdermaypayonfunddistributionsortheredemptionoffundshares.Whenassessingperformance,investorsshouldconsiderbothshort-andlong-termreturns.
Quarter-End Returns
Africa&MiddleEastFund 1.56%
Africa&MiddleEastFund–IClass 1.29
Theexpenseratioshownisasofthefund’sfiscalyearended10/31/16.TheexpenseratiofortheAfrica&MiddleEastFund–IClassisestimatedasoftheclass’sinceptiondateof3/6/17.Thisnumbermayvaryfromtheexpenseratioshownelsewhereinthisreportbecauseitisbasedonadifferenttimeperiodand,ifapplicable,includesacquiredfundfeesandexpensesbutdoesnotincludefeeorexpensewaivers.
Expense Ratio
Proof #5
15
T. Rowe Price Africa & Middle East FundUnaudited
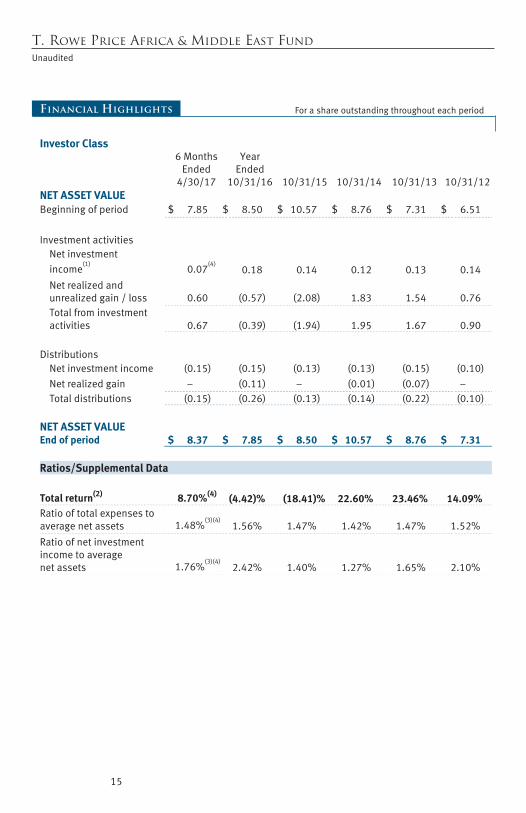
Financial Highlights For a share outstanding throughout each period
Investor Class
6 Months Ended
4/30/17
Year Ended
10/31/16 10/31/15 10/31/14 10/31/13 10/31/12 NET ASSET VALUE
Beginning of period
$ 7.85 $ 8.50 $ 10.57 $ 8.76 $ 7.31
$ 6.51
Investment activities
Net investment income
(1) 0.07
(4) 0.18
0.14
0.12
0.13
0.14
Net realized and unrealized gain / loss
0.60
(0.57)
(2.08)
1.83
1.54
0.76
Total from investment activities
0.67
(0.39)
(1.94)
1.95
1.67
0.90
Distributions
Net investment income
(0.15) (0.15) (0.13) (0.13) (0.15)
(0.10)
Net realized gain
– (0.11) – (0.01) (0.07)
–
Total distributions
(0.15) (0.26) (0.13) (0.14) (0.22)
(0.10)
NET ASSET VALUE
End of period $ 8.37 $ 7.85 $ 8.50 $ 10.57 $ 8.76 $ 7.31
Ratios/Supplemental Data Total return(2) 8.70%(4) (4.42)% (18.41)% 22.60% 23.46% 14.09%
Ratio of total expenses to average net assets
1.48%
(3)(4) 1.56%
1.47%
1.42%
1.47%
1.52%
Ratio of net investment income to average net assets
1.76%
(3)(4) 2.42%
1.40%
1.27%
1.65%
2.10%

Proof #5
16
T. Rowe Price Africa & Middle East FundUnaudited
Financial Highlights For a share outstanding throughout each period
The accompanying notes are an integral part of these financial statements.
6 Months Ended
4/30/17
Year Ended
10/31/16 10/31/15 10/31/14 10/31/13 10/31/12 Ratios/Supplemental Data (continued) Portfolio turnover rate
38.0% 82.5% 60.4% 59.3% 56.1%
65.0%
Net assets, end of period
(in thousands)
$ 131,932 $ 121,144 $ 156,688 $ 223,910 $ 181,556
$ 149,791
(1) Per share amounts calculated using average shares outstanding method. (2) Total return reflects the rate that an investor would have earned on an investment in the fund
during each period, assuming reinvestment of all distributions and payment of no redemption or account fees. Total return is not annualized for periods less than one year.
(3) Annualized (4) Excludes expenses waived related to the waiver of fund-level expenses ratably across all classes
in accordance with SEC rules.

Proof #5
17
T. Rowe Price Africa & Middle East FundUnaudited
Financial Highlights
The accompanying notes are an integral part of these financial statements.
Forashareoutstandingthroughouttheperiod
I Class
3/6/17(1)
Through 4/30/17
NET ASSET VALUE
Beginning of period
$ 8.18
Investment activities
Net investment income(2)
0.10(3)
Net realized and unrealized gain / loss 0.10
Total from investment activities 0.20
NET ASSET VALUE
End of period $ 8.38
Ratios/Supplemental Data Total return(4) 2.44%(3)
Ratio of total expenses to average net assets
1.10%(3)(5)
Ratio of net investment income to average net assets
7.95%(3)(5)
Portfolio turnover rate
38.0%
Net assets, end of period (in thousands) $ 260
(1) Inception date (2) Per share amounts calculated using average shares outstanding method. (3) See Note 6. Excludes expenses waived (0.33% of average net assets) related to the contractual
operating expense limitation in effect through 2/28/19. (4) Total return reflects the rate that an investor would have earned on an investment in the fund
during each period, assuming reinvestment of all distributions and payment of no redemption or account fees. Total return is not annualized for periods less than one year.
(5) Annualized
Proof #5
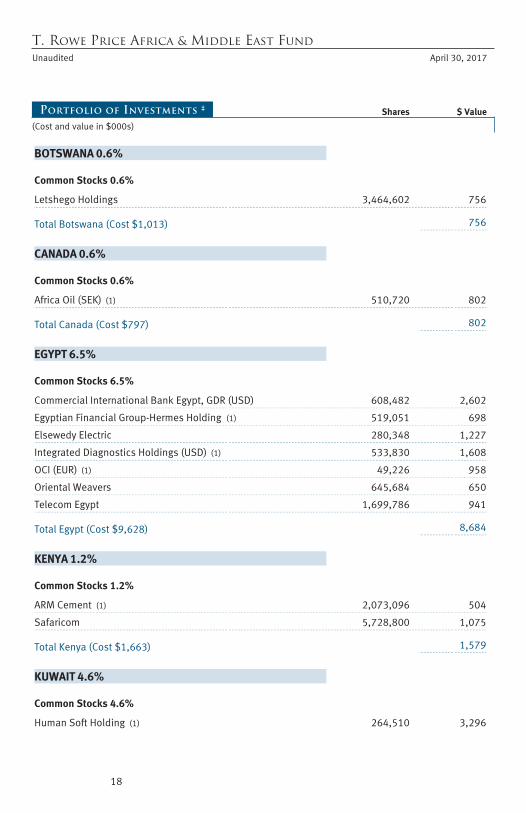
T. Rowe Price Africa & Middle East FundUnaudited April 30, 2017
Portfolio of Investments ‡ Shares $ Value
(Cost and value in $000s)
18
BOTSWANA 0.6%
Common Stocks 0.6%
Letshego Holdings 3,464,602 756
Total Botswana (Cost $1,013) 756
CANADA 0.6%
Common Stocks 0.6%
Africa Oil (SEK) (1) 510,720 802
Total Canada (Cost $797) 802
EGYPT 6.5%
Common Stocks 6.5%
Commercial International Bank Egypt, GDR (USD) 608,482 2,602
Egyptian Financial Group-Hermes Holding (1) 519,051 698
Elsewedy Electric 280,348 1,227
Integrated Diagnostics Holdings (USD) (1) 533,830 1,608
OCI (EUR) (1) 49,226 958
Oriental Weavers 645,684 650
Telecom Egypt 1,699,786 941
Total Egypt (Cost $9,628) 8,684
KENYA 1.2%
Common Stocks 1.2%
ARM Cement (1) 2,073,096 504
Safaricom 5,728,800 1,075
Total Kenya (Cost $1,663) 1,579
KUWAIT 4.6%
Common Stocks 4.6%
Human Soft Holding (1) 264,510 3,296

Proof #5
T. Rowe Price Africa & Middle East Fund
Shares $ Value
(Cost and value in $000s)
19
National Bank of Kuwait 1,262,260 2,822
Total Kuwait (Cost $5,401) 6,118
MOROCCO 0.8%
Common Stocks 0.8%
Attijariwafa Bank 24,642 1,016
Total Morocco (Cost $979) 1,016
NIGERIA 2.0%
Common Stocks 2.0%
Dangote Cement (1) 1,753,034 929
Guaranty Trust Bank 10,695,083 930
Nestle Foods Nigeria 109,957 262
Nigerian Breweries 1,352,799 545
Total Nigeria (Cost $3,593) 2,666
QATAR 3.1%
Common Stocks 3.1%
Gulf Warehousing 77,845 1,122
Ooredoo QSC 45,040 1,283
Qatar National Bank 42,221 1,667
Total Qatar (Cost $3,565) 4,072
SAUDI ARABIA 23.7%
Common Stocks 23.7%
Almarai 120,480 2,352
Banque Saudi Fransi 446,717 3,117
Bupa Arabia For Cooperative Insurance 57,552 1,792
Herfy Food Services 86,419 1,842
Mouwasat Medical Services 72,365 2,745
National Commercial Bank 261,918 2,721
Proof #5
T. Rowe Price Africa & Middle East Fund
Shares $ Value
(Cost and value in $000s)
20
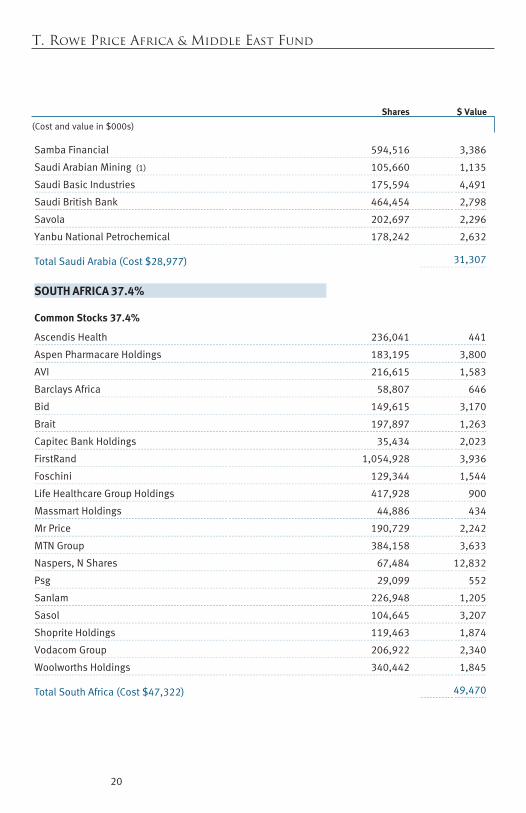
Samba Financial 594,516 3,386
Saudi Arabian Mining (1) 105,660 1,135
Saudi Basic Industries 175,594 4,491
Saudi British Bank 464,454 2,798
Savola 202,697 2,296
Yanbu National Petrochemical 178,242 2,632
Total Saudi Arabia (Cost $28,977) 31,307
SOUTH AFRICA 37.4%
Common Stocks 37.4%
Ascendis Health 236,041 441
Aspen Pharmacare Holdings 183,195 3,800
AVI 216,615 1,583
Barclays Africa 58,807 646
Bid 149,615 3,170
Brait 197,897 1,263
Capitec Bank Holdings 35,434 2,023
FirstRand 1,054,928 3,936
Foschini 129,344 1,544
Life Healthcare Group Holdings 417,928 900
Massmart Holdings 44,886 434
Mr Price 190,729 2,242
MTN Group 384,158 3,633
Naspers, N Shares 67,484 12,832
Psg 29,099 552
Sanlam 226,948 1,205
Sasol 104,645 3,207
Shoprite Holdings 119,463 1,874
Vodacom Group 206,922 2,340
Woolworths Holdings 340,442 1,845
Total South Africa (Cost $47,322) 49,470
Proof #5
T. Rowe Price Africa & Middle East Fund
Shares $ Value
(Cost and value in $000s)
21
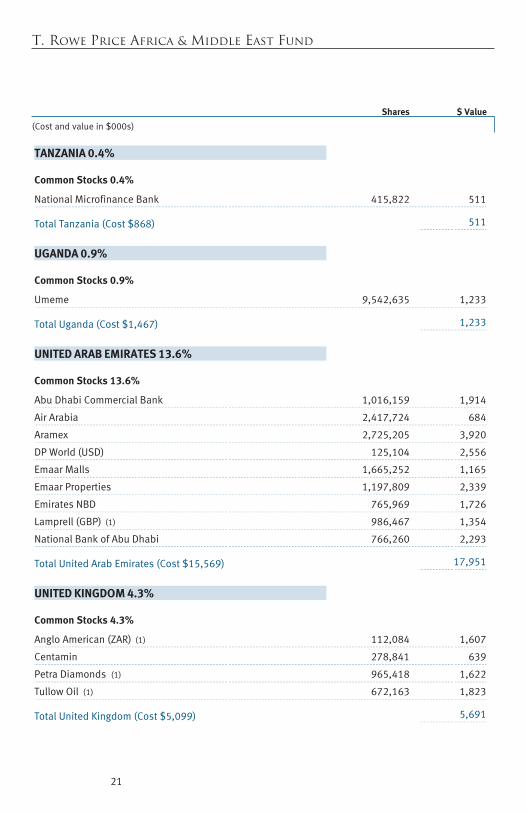
TANZANIA 0.4%
Common Stocks 0.4%
National Microfinance Bank 415,822 511
Total Tanzania (Cost $868) 511
UGANDA 0.9%
Common Stocks 0.9%
Umeme 9,542,635 1,233
Total Uganda (Cost $1,467) 1,233
UNITED ARAB EMIRATES 13.6%
Common Stocks 13.6%
Abu Dhabi Commercial Bank 1,016,159 1,914
Air Arabia 2,417,724 684
Aramex 2,725,205 3,920
DP World (USD) 125,104 2,556
Emaar Malls 1,665,252 1,165
Emaar Properties 1,197,809 2,339
Emirates NBD 765,969 1,726
Lamprell (GBP) (1) 986,467 1,354
National Bank of Abu Dhabi 766,260 2,293
Total United Arab Emirates (Cost $15,569) 17,951
UNITED KINGDOM 4.3%
Common Stocks 4.3%
Anglo American (ZAR) (1) 112,084 1,607
Centamin 278,841 639
Petra Diamonds (1) 965,418 1,622
Tullow Oil (1) 672,163 1,823
Total United Kingdom (Cost $5,099) 5,691

Proof #5
T. Rowe Price Africa & Middle East Fund
Shares $ Value
(Cost and value in $000s)
22
ZAMBIA 0.6%
Common Stocks 0.6%
Standard Chartered Bank Zambia 3,893,177 789
Total Zambia (Cost $846) 789
SHORT-TERM INVESTMENTS 0.0%
Money Market Funds 0.0%
T. Rowe Price Government Reserve Fund, 0.72% (2)(3) 1,524 2
Total Short-Term Investments (Cost $2) 2
Total Investments in Securities
100.3% of Net Assets (Cost $126,789) $ 132,647
‡
Country classifications are generally based on MSCI categories or another unaffiliated third party data provider; Shares are denominated in the currency of the country presented unless otherwise noted.
(1) Non-income producing (2) Seven-day yield (3) Affiliated Company
EUR Euro GBP British Pound GDR Global Depository Receipts SEK Swedish Krona USD U.S. Dollar ZAR South African Rand

Proof #5
T. Rowe Price Africa & Middle East Fund
23
The accompanying notes are an integral part of these financial statements.
Affiliated Companies
($000s)
The fund may invest in certain securities that are considered affiliated companies. As defined by the 1940 Act, an affiliated company is one in which the fund owns 5% or more of the outstanding voting securities, or a company which is under common ownership or control. The following securities were considered affiliated companies for all or some portion of the six months ended April 30, 2017. Purchase and sales cost and investment income reflect all activity for the period then ended. Affiliate
PurchaseCost
SalesCost
InvestmentIncome
Value4/30/17
Value10/31/16
T. Rowe Price Government Reserve Fund ¤ ¤ $ 1 $ 2 $ 1
Totals $ 1 $ 2 $ 1
¤ Purchase and sale information not shown for cash management funds.
Amounts reflected on the accompanying financial statements include the following amounts related to affiliated companies: Investment in securities, at cost $ 2
Dividend income 1 Interest income -
Investment income $ 1
Realized gain (loss) on securities $ -
Capital gain distributions from mutual funds $ -

Proof #5
24
T. Rowe Price Africa & Middle East FundUnaudited April 30, 2017
The accompanying notes are an integral part of these financial statements.
($000s, except shares and per share amounts)
Statement of Assets and Liabilities
Assets
Investments in securities, at value (cost $126,789) $ 132,647
Foreign currency (cost $854) 853
Dividends receivable 512
Receivable for shares sold 39
Due from affiliates 21
Other assets 77
Total assets 134,149
Liabilities
Payable for shares redeemed 209
Investment management fees payable 112
Due to affiliates 41
Other liabilities 1,595
Total liabilities 1,957
NET ASSETS $ 132,192 Net Assets Consist of:
Undistributed net investment income $ 838
Accumulated undistributed net realized loss (227,433)
Net unrealized gain 5,858
Paid-in capital applicable to 15,789,739 shares of $0.01 par value capital stock outstanding; 18,000,000,000 shares of the Corporation authorized 352,929
NET ASSETS $ 132,192 NET ASSET VALUE PER SHARE
Investor Class ($131,931,642 / 15,758,646 shares outstanding) $ 8.37
I Class ($260,488 / 31,093 shares outstanding) $ 8.38
Proof #5
T. Rowe Price Africa & Middle East FundUnaudited
($000s)
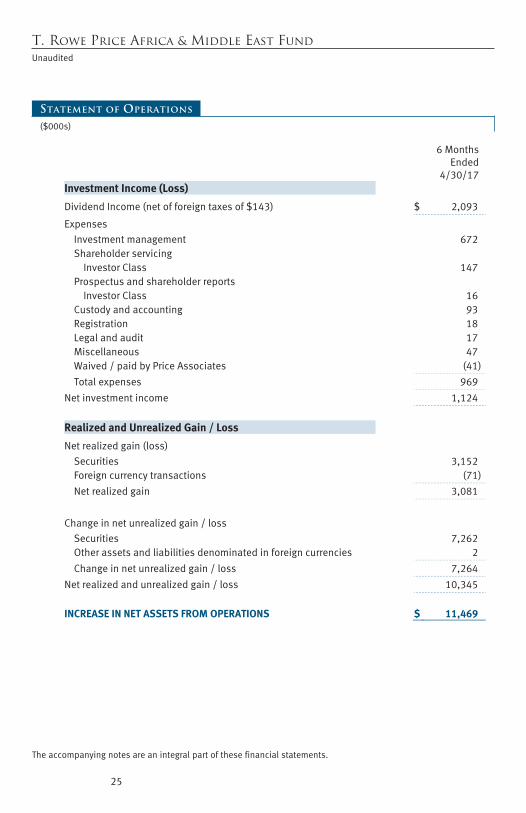
Statement of Operations
25
The accompanying notes are an integral part of these financial statements.
6 Months Ended
4/30/17Investment Income (Loss)
Dividend Income (net of foreign taxes of $143) $ 2,093
Expenses Investment management 672 Shareholder servicing
Investor Class 147 Prospectus and shareholder reports
Investor Class 16 Custody and accounting 93 Registration 18 Legal and audit 17 Miscellaneous 47 Waived / paid by Price Associates (41)
Total expenses 969
Net investment income 1,124
Realized and Unrealized Gain / Loss
Net realized gain (loss) Securities 3,152 Foreign currency transactions (71)
Net realized gain 3,081
Change in net unrealized gain / loss
Securities 7,262 Other assets and liabilities denominated in foreign currencies 2
Change in net unrealized gain / loss 7,264
Net realized and unrealized gain / loss 10,345
INCREASE IN NET ASSETS FROM OPERATIONS $ 11,469

Proof #5
T. Rowe Price Africa & Middle East FundUnaudited
($000s)
26
Statement of Changes in Net Assets
6 Months Ended
4/30/17
Year Ended
10/31/16Increase (Decrease) in Net Assets
Operations Net investment income $ 1,124 $ 3,101 Net realized gain (loss) 3,081 (15,437) Change in net unrealized gain / loss 7,264 4,091
Increase (decrease) in net assets from operations 11,469 (8,245)
Distributions to shareholders
Net investment income Investor Class (2,480) (2,668)
Net realized gain Investor Class – (1,956)
Decrease in net assets from distributions (2,480) (4,624)
Capital share transactions*
Shares sold Investor Class 17,351 13,214 I Class 255 –
Distributions reinvested Investor Class 2,307 4,161
Shares redeemed Investor Class (17,858) (40,057)
Redemption fees received 4 7 Increase (decrease) in net assets from capital share transactions 2,059 (22,675)
Net Assets
Increase (decrease) during period 11,048 (35,544) Beginning of period 121,144 156,688
End of period $ 132,192 $ 121,144
Undistributed net investment income 838 2,194

Proof #5
T. Rowe Price Africa & Middle East FundUnaudited
27
The accompanying notes are an integral part of these financial statements.
Statement of Changes in Net Assets
(000s)
6 Months Ended
4/30/17
Year Ended
10/31/16 *Share information
Shares sold Investor Class 2,250 1,762 I Class 31 –
Distributions reinvested Investor Class 300 559
Shares redeemed Investor Class (2,230) (5,325)
Increase (decrease) in shares outstanding 351 (3,004)

Proof #5
28
T. Rowe Price Africa & Middle East FundUnaudited April 30, 2017
Notes to Financial Statements
T. Rowe Price International Funds, Inc. (the corporation), is registered under the Investment Company Act of 1940 (the 1940 Act). The Africa & Middle East Fund (the fund) is a nondiversified, open-end management investment company established by the corporation. The fund seeks long-term growth of capital by investing primarily in the common stocks of companies located (or with primary operations) in Africa and the Middle East. The fund has two classes of shares: the Africa & Middle East Fund (Investor Class) and the Africa & Middle East Fund–I Class (I Class). I Class shares generally are available only to investors meeting a $1,000,000 minimum investment or certain other criteria. Each class has exclusive voting rights on matters related solely to that class; separate voting rights on matters that relate to both classes; and, in all other respects, the same rights and obligations as the other class.
NOTE 1 - SIGNIFICANT ACCOUNTING POLICIES
Basis of Preparation The fund is an investment company and follows accounting and reporting guidance in the Financial Accounting Standards Board (FASB) Accounting Standards Codification Topic 946 (ASC 946). The accompanying financial statements were prepared in accordance with accounting principles generally accepted in the United States of America (GAAP), including, but not limited to, ASC 946. GAAP requires the use of estimates made by management. Management believes that estimates and valuations are appropriate; however, actual results may differ from those estimates, and the valuations reflected in the accompanying financial statements may differ from the value ultimately realized upon sale or maturity.
Investment Transactions, Investment Income, and Distributions Income and expenses are recorded on the accrual basis. Dividends received from mutual fund investments are reflected as dividend income; capital gain distributions are reflected as realized gain/loss. Dividend income and capital gain distributions are recorded on the ex-dividend date. Income tax-related interest and penalties, if incurred, would be recorded as income tax expense. Investment transactions are accounted for on the trade date. Realized gains and losses are reported on the identified cost basis. Income distributions are declared and paid by each class annually. Distributions to shareholders are recorded on the ex-dividend date. Capital gain distributions are generally declared and paid by the fund annually.

Proof #5
29
T. Rowe Price Africa & Middle East Fund
Currency Translation Assets, including investments, and liabilities denominated in foreign currencies are translated into U.S. dollar values each day at the prevailing exchange rate, using the mean of the bid and asked prices of such currencies against U.S. dollars as quoted by a major bank. Purchases and sales of securities, income, and expenses are translated into U.S. dollars at the prevailing exchange rate on the date of the transaction. The effect of changes in foreign currency exchange rates on realized and unrealized security gains and losses is reflected as a component of security gains and losses.
Class Accounting Shareholder servicing, prospectus, and shareholder report expenses incurred by each class are charged directly to the class to which they relate. Expenses common to both classes, investment income, and realized and unrealized gains and losses are allocated to the classes based upon the relative daily net assets of each class.
Redemption Fees A 2% fee is assessed on redemptions of fund shares held for 90 days or less to deter short-term trading and to protect the interests of long-term shareholders. Redemption fees are withheld from proceeds that shareholders receive from the sale or exchange of fund shares. The fees are paid to the fund and are recorded as an increase to paid-in capital. The fees may cause the redemption price per share to differ from the net asset value per share.
New Accounting Guidance In October 2016, the Securities and Exchange Commission (SEC) issued a new rule, Investment Company Reporting Modernization, which, among other provisions, amends Regulation S-X to require standardized, enhanced disclosures, particularly related to derivatives, in investment company financial statements. Compliance with the guidance is effective for financial statements filed with the SEC on or after August 1, 2017; adoption will have no effect on the fund’s net assets or results of operations.
NOTE 2 - VALUATION
The fund’s financial instruments are valued and each class’s net asset value (NAV) per share is computed at the close of the New York Stock Exchange (NYSE), normally 4 p.m. ET, each day the NYSE is open for business. However, the NAV per share may be calculated at a time other than the normal close of the NYSE if trading on the NYSE is restricted, if the NYSE closes earlier, or as may be permitted by the SEC.

Proof #5
30
T. Rowe Price Africa & Middle East Fund
Fair Value The fund’s financial instruments are reported at fair value, which GAAP defines as the price that would be received to sell an asset or paid to transfer a liability in an orderly transaction between market participants at the measurement date. The T. Rowe Price Valuation Committee (the Valuation Committee) is an internal committee that has been delegated certain responsibilities by the fund’s Board of Directors (the Board) to ensure that financial instruments are appropriately priced at fair value in accordance with GAAP and the 1940 Act. Subject to oversight by the Board, the Valuation Committee develops and oversees pricing-related policies and procedures and approves all fair value determinations. Specifically, the Valuation Committee establishes procedures to value securities; determines pricing techniques, sources, and persons eligible to effect fair value pricing actions; oversees the selection, services, and performance of pricing vendors; oversees valuation-related business continuity practices; and provides guidance on internal controls and valuation-related matters. The Valuation Committee reports to the Board and has representation from legal, portfolio management and trading, operations, risk management, and the fund’s treasurer.
Various valuation techniques and inputs are used to determine the fair value of financial instruments. GAAP establishes the following fair value hierarchy that categorizes the inputs used to measure fair value:
Level 1 – quoted prices (unadjusted) in active markets for identical financial instruments that the fund can access at the reporting date
Level 2 – inputs other than Level 1 quoted prices that are observable, either directly or indirectly (including, but not limited to, quoted prices for similar financial instruments in active markets, quoted prices for identical or similar financial instruments in inactive markets, interest rates and yield curves, implied volatilities, and credit spreads)
Level 3 – unobservable inputs
Observable inputs are developed using market data, such as publicly available information about actual events or transactions, and reflect the assumptions that market participants would use to price the financial instrument. Unobservable inputs are those for which market data are not available and are developed using the best information available about the assumptions that market participants would use to price the financial instrument. GAAP requires valuation tech-niques to maximize the use of relevant observable inputs and minimize the use of unobservable inputs. When multiple inputs are used to derive fair value, the

Proof #5
31
T. Rowe Price Africa & Middle East Fund
financial instrument is assigned to the level within the fair value hierarchy based on the lowest-level input that is significant to the fair value of the financial instrument. Input levels are not necessarily an indication of the risk or liquidity associated with financial instruments at that level but rather the degree of judgment used in determining those values.
Valuation Techniques Equity securities listed or regularly traded on a securities exchange or in the over-the-counter (OTC) market are valued at the last quoted sale price or, for certain markets, the official closing price at the time the valu-ations are made. OTC Bulletin Board securities are valued at the mean of the closing bid and asked prices. A security that is listed or traded on more than one exchange is valued at the quotation on the exchange determined to be the primary market for such security. Listed securities not traded on a particular day are valued at the mean of the closing bid and asked prices for domestic securities and the last quoted sale or closing price for international securities.
For valuation purposes, the last quoted prices of non-U.S. equity securities may be adjusted to reflect the fair value of such securities at the close of the NYSE. If the fund determines that developments between the close of a foreign market and the close of the NYSE will, in its judgment, materially affect the value of some or all of its portfolio securities, the fund will adjust the previous quoted prices to reflect what it believes to be the fair value of the securities as of the close of the NYSE. In deciding whether it is necessary to adjust quoted prices to reflect fair value, the fund reviews a variety of factors, including developments in foreign markets, the performance of U.S. securities markets, and the performance of instruments trading in U.S. markets that represent foreign securities and baskets of foreign securities. The fund may also fair value securities in other situations, such as when a particular foreign market is closed but the fund is open. The fund uses outside pricing services to provide it with quoted prices and information to evaluate or adjust those prices. The fund cannot predict how often it will use quoted prices and how often it will determine it necessary to adjust those prices to reflect fair value. As a means of evaluating its security valuation process, the fund routinely compares quoted prices, the next day’s opening prices in the same markets, and adjusted prices.
Actively traded equity securities listed on a domestic exchange generally are categorized in Level 1 of the fair value hierarchy. Non-U.S. equity securities generally are categorized in Level 2 of the fair value hierarchy despite the availability of quoted prices because, as described above, the fund evaluates and determines whether those quoted prices reflect fair value at the close of the

Proof #5
32
T. Rowe Price Africa & Middle East Fund
NYSE or require adjustment. OTC Bulletin Board securities, certain preferred securities, and equity securities traded in inactive markets generally are categorized in Level 2 of the fair value hierarchy.
Investments in mutual funds are valued at the mutual fund’s closing NAV per share on the day of valuation and are categorized in Level 1 of the fair value hierarchy. Assets and liabilities other than financial instruments, including short-term receivables and payables, are carried at cost, or estimated realizable value, if less, which approximates fair value.
Thinly traded financial instruments and those for which the above valuation procedures are inappropriate or are deemed not to reflect fair value are stated at fair value as determined in good faith by the Valuation Committee. The objective of any fair value pricing determination is to arrive at a price that could reasonably be expected from a current sale. Financial instruments fair valued by the Valuation Committee are primarily private placements, restricted securities, warrants, rights, and other securities that are not publicly traded.
Subject to oversight by the Board, the Valuation Committee regularly makes good faith judgments to establish and adjust the fair valuations of certain securities as events occur and circumstances warrant. For instance, in determining the fair value of an equity investment with limited market activity, such as a private placement or a thinly traded public company stock, the Valuation Committee considers a variety of factors, which may include, but are not limited to, the issuer’s business prospects, its financial standing and performance, recent investment transactions in the issuer, new rounds of financing, negotiated transactions of significant size between other investors in the company, relevant market valuations of peer companies, strategic events affecting the company, market liquidity for the issuer, and general economic conditions and events. In consultation with the investment and pricing teams, the Valuation Committee will determine an appropriate valuation technique based on available information, which may include both observable and unobservable inputs. The Valuation Committee typically will afford greatest weight to actual prices in arm’s length transactions, to the extent they represent orderly transactions between market participants, transaction information can be reliably obtained, and prices are deemed representative of fair value. However, the Valuation Committee may also consider other valuation methods such as market-based valuation multiples; a discount or premium from market value of a similar, freely traded security of the same issuer; or some combination. Fair value determinations are reviewed on a regular basis and updated as information becomes available, including actual purchase and
Proof #5
33
T. Rowe Price Africa & Middle East Fund
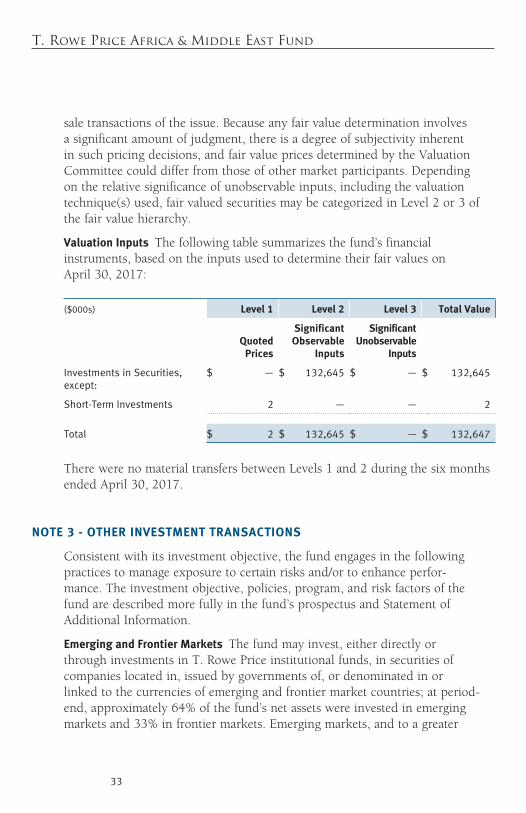
sale transactions of the issue. Because any fair value determination involves a significant amount of judgment, there is a degree of subjectivity inherent in such pricing decisions, and fair value prices determined by the Valuation Committee could differ from those of other market participants. Depending on the relative significance of unobservable inputs, including the valuation technique(s) used, fair valued securities may be categorized in Level 2 or 3 of the fair value hierarchy.
Valuation Inputs The following table summarizes the fund’s financial instruments, based on the inputs used to determine their fair values on April 30, 2017:
($000s) Level 1 Level 2 Level 3 Total Value
Quoted Prices
Significant Observable
Inputs
Significant Unobservable
Inputs
InvestmentsinSecurities,except:
$ — $ 132,645 $ — $ 132,645
Short-TermInvestments 2 — — 2
Total $ 2 $ 132,645 $ — $ 132,647
There were no material transfers between Levels 1 and 2 during the six months ended April 30, 2017.
NOTE 3 - OTHER INVESTMENT TRANSACTIONS
Consistent with its investment objective, the fund engages in the following practices to manage exposure to certain risks and/or to enhance perfor-mance. The investment objective, policies, program, and risk factors of the fund are described more fully in the fund’s prospectus and Statement of Additional Information.
Emerging and Frontier Markets The fund may invest, either directly or through investments in T. Rowe Price institutional funds, in securities of companies located in, issued by governments of, or denominated in or linked to the currencies of emerging and frontier market countries; at period-end, approximately 64% of the fund’s net assets were invested in emerging markets and 33% in frontier markets. Emerging markets, and to a greater

Proof #5
34
T. Rowe Price Africa & Middle East Fund
extent frontier markets, generally have economic structures that are less diverse and mature, and political systems that are less stable, than developed countries. These markets may be subject to greater political, economic, and social uncertainty and differing regulatory environments that may potentially impact the fund’s ability to buy or sell certain securities or repatriate proceeds to U.S. dollars. Such securities are often subject to greater price volatility, less liquidity, and higher rates of inflation than U.S. securities. Investing in frontier markets is significantly riskier than investing in other countries, including emerging markets.
Participation Notes The fund may invest in participation notes, through which a counterparty provides exposure to common stock, in the form of an unsecured interest, in markets where direct investment by the fund is not possible or preferable. Participation notes provide the economic benefit of common stock ownership to the fund, while legal ownership and voting rights are retained by the counterparty. Although participation notes are usually structured with a defined maturity or termination date, early redemption may be possible. Participation notes are valued using the same pricing methodology as the underlying common stock with valuation being equivalent to the last quoted sale price or, for certain markets, the official closing price at the time the valuation was made. Similar to a non-U.S. equity security, the last quoted price may be adjusted to reflect the fair value of such security at the close of the NYSE, if the fund determines that developments between the close of the foreign market and the close of the NYSE will affect the value of the security. Risks associated with participation notes include the possible failure of a counterparty to perform in accordance with the terms of the agreement, inability to transfer or liquidate the notes, potential delays or an inability to redeem before maturity under certain market conditions, and no legal recourse against the issuer of the underlying common stock.
Other Purchases and sales of portfolio securities other than short-term securities aggregated $49,976,000 and $48,688,000, respectively, for the six months ended April 30, 2017.
NOTE 4 - FEDERAL INCOME TAxES
No provision for federal income taxes is required since the fund intends to continue to qualify as a regulated investment company under Subchapter M of the Internal Revenue Code and distribute to shareholders all of its taxable

Proof #5
35
T. Rowe Price Africa & Middle East Fund
income and gains. Distributions determined in accordance with federal income tax regulations may differ in amount or character from net investment income and realized gains for financial reporting purposes. Financial reporting records are adjusted for permanent book/tax differences to reflect tax character but are not adjusted for temporary differences. The amount and character of tax-basis distributions and composition of net assets are finalized at fiscal year-end; accordingly, tax-basis balances have not been determined as of the date of this report.
The fund intends to retain realized gains to the extent of available capital loss carryforwards. Because the fund is required to use capital loss carryforwards that do not expire before those with expiration dates, all or a portion of its capital loss carryforwards subject to expiration could ultimately go unused. As of October 31, 2016, the fund had $230,396,000 of available capital loss carryforwards, which expire as follows: $186,525,000 in fiscal 2017 and $27,387,000 in fiscal 2019; $16,484,000 have no expiration.
At April 30, 2017, the cost of investments for federal income tax purposes was $126,944,000. Net unrealized gain aggregated $5,703,000 at period-end, of which $14,323,000 related to appreciated investments and $8,620,000 related to depreciated investments.
NOTE 5 - FOREIGN TAxES
The fund is subject to foreign income taxes imposed by certain countries in which it invests. Additionally, certain foreign currency transactions are subject to tax, and capital gains realized upon disposition of securities issued in or by certain foreign countries are subject to capital gains tax imposed by those countries. All taxes are computed in accordance with the applicable foreign tax law, and, to the extent permitted, capital losses are used to offset capital gains. Taxes attributable to income are accrued by the fund as a reduction of income. Taxes incurred on the purchase of foreign currencies are recorded as realized loss on foreign currency transactions. Current and deferred tax expense attributable to capital gains is reflected as a component of realized or change in unrealized gain/loss on securities in the accompanying financial statements. At April 30, 2017, the fund had no deferred tax liability attributable to foreign securities and no foreign capital loss carryforwards.
Proof #5
36
T. Rowe Price Africa & Middle East Fund
NOTE 6 - RELATED PARTY TRANSACTIONS
The fund is managed by T. Rowe Price Associates, Inc. (Price Associates), a wholly owned subsidiary of T. Rowe Price Group, Inc. (Price Group). Price Associates has entered into a sub-advisory agreement(s) with one or more of its wholly owned subsidiaries, to provide investment advisory services to the fund. The investment management agreement between the fund and Price Associates provides for an annual investment management fee, which is computed daily and paid monthly. The fee consists of an individual fund fee, equal to 0.75% of the fund’s average daily net assets, and a group fee. The group fee rate is calculated based on the combined net assets of certain mutual funds sponsored by Price Associates (the group) applied to a graduated fee schedule, with rates ranging from 0.48% for the first $1 billion of assets to 0.270% for assets in excess of $500 billion. The fund’s group fee is determined by applying the group fee rate to the fund’s average daily net assets. At April 30, 2017, the effective annual group fee rate was 0.29%.
The I Class is subject to an operating expense limitation (I Class limit) pursuant to which Price Associates is contractually required to pay all operating expenses of the I Class, excluding management fees, interest, expenses related to borrowings, taxes, brokerage, and other non-recurring expenses permitted by the investment management agreement, to the extent such operating expenses, on an annualized basis, exceed 0.05% of average net assets. This agreement will continue until February 28, 2019, and may be renewed, revised, or revoked only with approval of the fund’s Board. The I Class is required to repay Price Associates for expenses previously paid to the extent the class’s net assets grow or expenses decline sufficiently to allow repayment without causing the class’s operating expenses to exceed the I Class limit in effect at the time of the waiver. However, no repayment will be made more than three years after the date of a payment or waiver.
Pursuant to this agreement, $41,000 of expenses were waived/paid by Price Associates during the six months ended April 30, 2017 and remain subject to repayment by the fund.
In addition, the fund has entered into service agreements with Price Associates and two wholly owned subsidiaries of Price Associates (collectively, Price). Price Associates provides certain accounting and administrative services to the fund. T. Rowe Price Services, Inc., provides shareholder and administrative services in its capacity as the fund’s transfer and dividend-disbursing agent. T. Rowe Price Retirement Plan Services, Inc., provides subaccounting and recordkeeping
Proof #5
37
T. Rowe Price Africa & Middle East Fund
services for certain retirement accounts invested in the Investor Class and I Class. For the six months ended April 30, 2017, expenses incurred pursuant to these service agreements were $42,000 for Price Associates; $100,000 for T. Rowe Price Services, Inc.; and $1,000 for T. Rowe Price Retirement Plan Services, Inc. The total amount payable at period-end pursuant to these service agreements is reflected as Due to Affiliates in the accompanying financial statements.
The fund is also one of several mutual funds sponsored by Price Associates (underlying Price funds) in which the T. Rowe Price Spectrum Funds (Spectrum Funds) may invest. The Spectrum Funds do not invest in the underlying Price funds for the purpose of exercising management or control. Pursuant to special servicing agreements, expenses associated with the operation of the Spectrum Funds are borne by each underlying Price fund to the extent of estimated savings to it and in proportion to the average daily value of its shares owned by the Spectrum Funds. Expenses allocated under these agreements are reflected as shareholder servicing expense in the accompanying financial statements. For the six months ended April 30, 2017, the fund was allocated $3,000 of Spectrum Funds’ expenses. Of these amounts, $2,000 related to services provided by Price. At period-end, the amount payable to Price pursuant to these agreements is reflected as Due to Affiliates in the accompanying financial statements. Additionally, redemption fees received by the Spectrum Funds are allocated to each underlying Price fund in proportion to the average daily value of its shares owned by the Spectrum Funds. Less than $1,000 of redemption fees reflected in the accompanying financial statements were received from the Spectrum Funds. At April 30, 2017, approximately 5% of the outstanding shares of the Investor Class were held by the Spectrum Funds.
The fund may invest in the T. Rowe Price Government Reserve Fund, the T. Rowe Price Treasury Reserve Fund, or the T. Rowe Price Short-Term Fund (collectively, the Price Reserve Funds), open-end management investment companies managed by Price Associates and considered affiliates of the fund. The Price Reserve Funds are offered as short-term investment options to mutual funds, trusts, and other accounts managed by Price Associates or its affiliates and are not available for direct purchase by members of the public. The Price Reserve Funds pay no investment management fees.
As of April 30, 2017, T. Rowe Price Group, Inc., or its wholly owned subsidiaries owned 30,562 shares of the I Class, representing 98% of the I Class’s net assets.

Proof #5
38
T. Rowe Price Africa & Middle East Fund
The fund may participate in securities purchase and sale transactions with other funds or accounts advised by Price Associates (cross trades), in accordance with procedures adopted by the fund’s Board and Securities and Exchange Commission rules, which require, among other things, that such purchase and sale cross trades be effected at the independent current market price of the security. During the six months ended April 30, 2017, the fund had no purchases or sales cross trades with other funds or accounts advised by Price Associates.
NOTE 7 - SUBSEQUENT EVENT
Effective May 1, 2017, Price Associates will implement an additional tier in the graduated fee schedule for the group fee rate, whereby a rate of 0.265% will be applied for combined net assets of the group in excess of $650 billion.
Proof #5
39
T. Rowe Price Africa & Middle East Fund
Information on Proxy Voting Policies, Procedures, and Records
AdescriptionofthepoliciesandproceduresusedbyT.RowePricefundsandportfoliostodeterminehowtovoteproxiesrelatingtoportfoliosecuritiesisavailableineachfund’sStatementofAdditionalInformation.Youmayrequestthisdocumentbycalling1-800-225-5132orbyaccessingtheSEC’swebsite,sec.gov.
Thedescriptionofourproxyvotingpoliciesandproceduresisalsoavailableonourcorporatewebsite.Toaccessit,pleasevisitthefollowingWebpage:
https://www3.troweprice.com/usis/corporate/en/utility/policies.html
Scrolldowntothesectionnearthebottomofthepagethatsays,“ProxyVotingPolicies.”ClickontheProxyVotingPolicieslinkintheshadedbox.
Eachfund’smostrecentannualproxyvotingrecordisavailableonourwebsiteandthroughtheSEC’swebsite.ToaccessitthroughT.RowePrice,visitthewebsitelocationshownabove,andscrolldowntothesectionnearthebottomofthepagethatsays,“ProxyVotingRecords.”ClickontheProxyVotingRecordslinkintheshadedbox.
How to Obtain Quarterly Portfolio Holdings
ThefundfilesacompletescheduleofportfolioholdingswiththeSecuritiesandExchangeCommissionforthefirstandthirdquartersofeachfiscalyearonFormN-Q.Thefund’sFormN-QisavailableelectronicallyontheSEC’swebsite(sec.gov);hardcopiesmaybereviewedandcopiedattheSEC’sPublicReferenceRoom,100FSt.N.E.,Washington,DC20549.FormoreinformationonthePublicReferenceRoom,call1-800-SEC-0330.

Proof #5
40
Approval of Investment Management Agreement and Subadvisory Agreement
Eachyear,thefund’sBoardofDirectors(Board)considersthecontinuationoftheinvestmentmanagementagreement(AdvisoryContract)betweenthefundanditsinvestmentadvisor,T.RowePriceAssociates,Inc.(Advisor),aswellasthecontinuationoftheinvestmentsubadvisoryagreement(SubadvisoryContract)thattheAdvisorhasenteredintowithT.RowePriceInternationalLtd(Subadvisor)onbehalfofthefund.Inthatregard,atanin-personmeetingheldonMarch6–7,2017(Meeting),theBoard,includingamajorityofthefund’sindependentdirectors,approvedthecontinuationofthefund’sAdvisoryContractandSubadvisoryContract.AttheMeeting,theBoardconsideredthefactorsandreachedtheconclusionsdescribedbelowrelatingtotheselectionoftheAdvisorandSubadvisorandtheapprovaloftheAdvisoryContractandSubadvisoryContract.TheindependentdirectorswereassistedintheirevaluationoftheAdvisoryContractandSubadvisoryContractbyindependentlegalcounsel,fromwhomtheyreceivedseparatelegaladviceandwithwhomtheymetseparately.
InprovidinginformationtotheBoard,theAdvisorwasguidedbyadetailedsetofrequestsforinformationsubmittedbyindependentlegalcounselonbehalfoftheindependentdirectors.InconsideringandapprovingtheAdvisoryContractandSubadvisoryContract,theBoardconsideredtheinformationitbelievedrelevant,includingbutnotlimitedtotheinformationdiscussedbelow.TheBoardconsiderednotonlythespecificinformationpresentedinconnectionwiththeMeetingbutalsotheknowledgegainedovertimethroughinteractionwiththeAdvisorandSubadvisoraboutvarioustopics.TheBoardmeetsregularlyand,ateachofitsmeetings,coversanextensiveagendaoftopicsandmaterialsandconsidersfactorsthatarerelevanttoitsannualconsiderationoftherenewaloftheT.RowePriceFunds’advisorycontracts,includingperformanceandtheservicesandsupportprovidedtothefundsandtheirshareholders.
Services Provided by the Advisor and SubadvisorTheBoardconsideredthenature,quality,andextentoftheservicesprovidedtothefundbytheAdvisorandSubadvisor.Theseservicesincluded,butwerenotlimitedto,directingthefund’sinvestmentsinaccordancewithitsinvestmentprogramandtheoverallmanagementofthefund’sportfolio,aswellasavarietyofrelatedactivitiessuchasfinancial,investmentoperations,andadministrativeservices;compliance;maintainingthefund’srecordsandregistrations;andshareholdercommunications.TheBoardalsoreviewedthebackgroundandexperienceoftheAdvisor’sandSubadvisor’sseniormanagementteamsandinvestmentpersonnelinvolvedinthemanagementofthefund,aswellastheAdvisor’scompliancerecord.TheBoardconcludedthatitwassatisfiedwiththenature,quality,andextentoftheservicesprovidedbytheAdvisorandSubadvisor.
T. Rowe Price Africa & Middle East Fund

Proof #5
41
Investment Performance of the FundTheBoardtookintoaccountdiscussionswiththeAdvisorandreportsthatitreceivesthroughouttheyearrelatingtofundperformance.InconnectionwiththeMeeting,theBoardreviewedthefund’snetannualizedtotalreturnsfortheone-,two-,three-,four-,andfive-yearperiodsasofSeptember30,2016,andcomparedthesereturnswiththeperformanceofapeergroupoffundswithsimilarinvestmentprogramsandawidevarietyofotherpreviouslyagreed-uponcomparableperformancemeasuresandmarketdata,includingthosesuppliedbyBroadridge,whichisanindependentproviderofmutualfunddata.
OnthebasisofthisevaluationandtheBoard’songoingreviewofinvestmentresultsandfactoringintherelativemarketconditionsduringcertainoftheperformanceperiods,theBoardconcludedthatthefund’sperformancewassatisfactory.
Costs, Benefits, Profits, and Economies of ScaleTheBoardrevieweddetailedinformationregardingtherevenuesreceivedbytheAdvisorundertheAdvisoryContractandotherbenefitsthattheAdvisor(anditsaffiliates,includingtheSubadvisor)mayhaverealizedfromitsrelationshipwiththefund,includinganyresearchreceivedunder“softdollar”agreementsandcommission-sharingarrangementswithbroker-dealers.TheBoardconsideredthattheAdvisorandSubadvisormayreceivesomebenefitfromsoft-dollararrangementspursuanttowhichresearchisreceivedfrombroker-dealersthatexecutethefund’sportfoliotransactions.TheBoardreceivedinformationontheestimatedcostsincurredandprofitsrealizedbytheAdvisorfrommanagingtheT.RowePriceFunds.TheBoardalsoreviewedestimatesoftheprofitsrealizedfrommanagingthefundinparticular,andtheBoardconcludedthattheAdvisor’sprofitswerereasonableinlightoftheservicesprovidedtothefund.
TheBoardalsoconsideredwhetherthefundbenefitsunderthefeelevelssetforthintheAdvisoryContractfromanyeconomiesofscalerealizedbytheAdvisor.UndertheAdvisoryContract,thefundpaysafeetotheAdvisorforinvestmentmanagementservicescomposedoftwocomponents—agroupfeeratebasedonthecombinedaveragenetassetsofmostoftheT.RowePriceFunds(includingthefund)thatdeclinesatcertainassetlevelsandanindividualfundfeeratebasedonthefund’saveragedailynetassets—andthefundpaysitsownexpensesofoperations(subjecttoanexpenselimitationagreedtobytheAdvisorwithrespecttothefund’sIClass).AttheMeeting,theBoardapprovedanadditional0.005%breakpointtothegroupfeeschedule,effectiveMay1,2017.Withthenewbreakpoint,thegroupfeeratewilldeclineto0.265%whenthecombinedaveragenetassetsoftheapplicableT.RowePriceFundsexceed$650billion.UndertheSubadvisoryContract,theAdvisormaypaytheSubadvisorupto60%oftheadvisoryfeethattheAdvisorreceivesfromthefund.TheBoardconcludedthattheadvisoryfeestructureforthefundcontinuedtoprovideforareasonablesharingofbenefitsfromanyeconomiesofscalewiththefund’sinvestors.
T. Rowe Price Africa & Middle East Fund
Approval of Investment Management Agreement and Subadvisory Agreement (continued)

Proof #5
42
Fees and ExpensesTheBoardwasprovidedwithinformationregardingindustrytrendsinmanagementfeesandexpenses.Amongotherthings,theBoardrevieweddataforpeergroupsthatwerecompiledbyBroadridge,whichcompared:(i)contractualmanagementfees,totalexpenses,actualmanagementfees,andnonmanagementexpensesoftheInvestorClassofthefundtoagroupofcompetitorfundsselectedbyBroadridge(InvestorClassExpenseGroup);and(ii)totalexpenses,actualmanagementfees,andnonmanagementexpensesoftheInvestorClassofthefundtoabroadersetoffundswithintheLipperinvestmentclassification(ExpenseUniverse).TheBoardconsideredthefund’scontractualmanagementfeerate,actualmanagementfeerate(whichreflectsthemanagementfeesactuallyreceivedfromthefundbytheAdvisorafteranyapplicablewaivers,reductions,orreimbursements),operatingexpenses,andtotalexpenses(whichreflectthenettotalexpenseratioofthefundafteranywaivers,reductions,orreimbursements)incomparisonwiththeinformationfortheBroadridgepeergroups.Broadridgegenerallyconstructedthepeergroupsbyseekingthemostcomparablefundsbasedonsimilarinvestmentclassificationsandobjectives,expensestructure,assetsize,andoperatingcomponentsandattributes,andrankedfundsintoquintiles,withthefirstquintilerepresentingthefundswiththelowestrelativeexpensesandthefifthquintilerepresentingthefundswiththehighestrelativeexpenses.TheinformationprovidedtotheBoardindicatedthatthefund’scontractualmanagementfeerankedinthefourthquintile(InvestorClassExpenseGroup),thefund’sactualmanagementfeeraterankedinthefifthquintile(InvestorClassExpenseGroup)orfourthquintile(ExpenseUniverse),andthefund’stotalexpensesrankedinthefourthquintile(InvestorClassExpenseGroup)andthirdorfourthquintile(ExpenseUniverse).TheBoardrequestedadditionalinformationfrommanagementwithrespecttothefund’srelativecontractualmanagementfee,actualmanagementfee,andtotalexpensesrankinginthefourthandfifthquintilesforboththeInvestorClassExpenseGroupandExpenseUniverse.TheBoardreviewedandconsideredtheinformationprovidedrelatingtothefund,otherfundsinthepeergroups,andotherfactorsthattheBoarddeterminedtoberelevant.
TheBoardalsoreviewedthefeeschedulesforinstitutionalaccountsandprivateaccountswithsimilarmandatesthatareadvisedorsubadvisedbytheAdvisoranditsaffiliates.ManagementprovidedtheBoardwithinformationabouttheAdvisor’sresponsibilitiesandservicesprovidedtosubadvisoryandotherinstitutionalaccountclients,includinginformationabouthowtherequirementsandeconomicsoftheinstitutionalbusinessarefundamentallydifferentfromthoseofthemutualfundbusiness.TheBoardconsideredinformationshowingthattheAdvisor’smutualfundbusinessisgenerallymorecomplexfromabusinessandcomplianceperspectivethanitsinstitutionalaccountbusinessandconsideredvariousrelevantfactors,suchasthebroaderscopeofoperationsandoversight,moreextensiveshareholdercommunicationinfrastructure,greaterassetflows,heightenedbusinessrisks,anddifferencesinapplicablelawsandregulationsassociatedwiththeAdvisor’sproprietarymutualfundbusiness.Inassessingthereasonablenessof
T. Rowe Price Africa & Middle East Fund
Approval of Investment Management Agreement and Subadvisory Agreement (continued)

Proof #5
43
thefund’smanagementfeerate,theBoardconsideredthedifferencesinthenatureoftheservicesrequiredfortheAdvisortomanageitsmutualfundbusinessversusmanagingadiscretepoolofassetsasasubadvisortoanotherinstitution’smutualfundorforaninstitutionalaccountandthattheAdvisorgenerallyperformssignificantadditionalservicesandassumesgreaterriskinmanagingthefundandotherT.RowePriceFundsthanitdoesforinstitutionalaccountclients.
Onthebasisoftheinformationprovidedandthefactorsconsidered,theBoardconcludedthatthefeespaidbythefundundertheAdvisoryContractarereasonable.
Approval of the Advisory Contract and Subadvisory ContractAsnoted,theBoardapprovedthecontinuationoftheAdvisoryContractandSubadvisoryContract.Nosinglefactorwasconsideredinisolationortobedeterminativetothedecision.Rather,theBoardconcluded,inlightofaweightingandbalancingofallfactorsconsidered,thatitwasinthebestinterestsofthefundanditsshareholdersfortheBoardtoapprovethecontinuationoftheAdvisoryContractandSubadvisoryContract(includingthefeestobechargedforservicesthereunder).
T. Rowe Price Africa & Middle East Fund
Approval of Investment Management Agreement and Subadvisory Agreement (continued)

Proof #5
This page intentionally left blank.

Proof #5
This page intentionally left blank.
Proof #5
F168-051 6/17
STOCK FUNDSDomestic Blue Chip GrowthCapital Appreciation‡
Capital OpportunityDiversified Mid-Cap GrowthDividend GrowthEquity IncomeEquity Index 500Extended Equity Market IndexFinancial ServicesGrowth & IncomeGrowth StockHealth Sciences‡
Media & TelecommunicationsMid-Cap Growth‡
Mid-Cap Value‡
New America GrowthNew EraNew Horizons‡
QM U.S. Small & Mid-Cap Core EquityQM U.S. Small-Cap Growth EquityQM U.S. Value EquityReal EstateScience & TechnologySmall-Cap Stock‡
Small-Cap ValueTax-Efficient Equity Total Equity Market IndexU.S. Large-Cap CoreValue
ASSET ALLOCATION FUNDSBalanced Global AllocationPersonal Strategy BalancedPersonal Strategy GrowthPersonal Strategy IncomeReal AssetsSpectrum GrowthSpectrum IncomeSpectrum InternationalTarget Date Fundsˆ
BOND FUNDSDomestic TaxableCorporate IncomeCredit OpportunitiesFloating RateGNMA High Yield‡
Inflation Protected BondLimited Duration Inflation
Focused BondNew IncomeShort-Term BondTotal ReturnUltra Short-Term BondU.S. Bond Enhanced IndexU.S. High YieldU.S. Treasury IntermediateU.S. Treasury Long-Term
Domestic Tax-FreeCalifornia Tax-Free BondGeorgia Tax-Free BondIntermediate Tax-Free High YieldMaryland Short-Term Tax-Free BondMaryland Tax-Free BondNew Jersey Tax-Free BondNew York Tax-Free BondSummit Municipal IncomeSummit Municipal IntermediateTax-Free High YieldTax-Free IncomeTax-Free Short-IntermediateVirginia Tax-Free Bond
MONEY MARKET FUNDSTaxableCash Reserves1
Government Money2
U.S. Treasury Money2
MONEY MARKET FUNDS (cont.)Tax-FreeCalifornia Tax-Free Money1
Maryland Tax-Free Money1
New York Tax-Free Money1
Summit Municipal Money Market1
Tax-Exempt Money1
INTERNATIONAL/GLOBAL FUNDSStockAfrica & Middle EastAsia OpportunitiesEmerging EuropeEmerging Markets StockEmerging Markets Value StockEuropean Stock Global ConsumerGlobal Growth StockGlobal IndustrialsGlobal Real EstateGlobal StockGlobal TechnologyInternational Concentrated EquityInternational DiscoveryInternational Equity IndexInternational StockInternational Value EquityJapanLatin AmericaNew AsiaOverseas StockQM Global Equity
BondDynamic Global BondEmerging Markets BondEmerging Markets Corporate BondEmerging Markets Local Currency BondGlobal High Income BondGlobal Multi-Sector BondInternational Bond
T.RowePriceInvestmentServices,Inc.100EastPrattStreetBaltimore,MD21202
Thispagecontainssupplementaryinformationthatisnotpartoftheshareholderreport.
T. Rowe Price Mutual Funds
201706-158311
Call 1-800-225-5132 to request a prospectus or summary prospectus; each includes investment objectives, risks, fees, expenses, and other information that you should read and consider carefully before investing.‡ClosedtonewinvestorsexceptforadirectrolloverfromaretirementplanintoaT.RowePriceIRAinvestedinthisfund.
ˆTheTargetDateFundsareinclusiveoftheRetirementFunds,theTargetFunds,andtheRetirementBalancedFund.
1 Retail Funds: You could lose money by investing in the Fund. Although the Fund seeks to preserve the value of your investment at $1.00 per share, it cannot guarantee it will do so. Beginning October 14, 2016, the Fund may impose a fee upon the sale of your shares or may temporarily suspend your ability to sell shares if the Fund’s liquidity falls below required minimums because of market conditions or other factors. An investment in the Fund is not insured or guaranteed by the Federal Deposit Insurance Corporation or any other government agency. The Fund’s sponsor has no legal obligation to provide financial support to the Fund, and you should not expect that the sponsor will provide financial support to the Fund at any time.
2 Government Funds: You could lose money by investing in the Fund. Although the Fund seeks to preserve the value of your investment at $1.00 per share, it cannot guarantee it will do so. An investment in the Fund is not insured or guaranteed by the Federal Deposit Insurance Corporation or any other government agency. The Fund’s sponsor has no legal obligation to provide financial support to the Fund, and you should not expect that the sponsor will provide financial support to the Fund at any time.