t pelagia research … · the development of recording techniques compatible with the application...
TRANSCRIPT
Available online at www.pelagiaresearchlibrary.com
Pelagia Research Library
Advances in Applied Science Research, 2012, 3 (2):656-670
ISSN: 0976-8610 CODEN (USA): AASRFC
656 Pelagia Research Library
Mathematical modelling of petrophysical parameters for reservoir characterization using well log data
Egbai J.C.1 and Aigbogun, C.O.2
1Dept. of Physics, Delta State University, Abraka, Nigeria 2Dept. of Physics, University of Benin, Benin City, Nigeria
______________________________________________________________________________ ABSTRACT In petroleum industry, well logs play a vital role in oil and gas exploration and reservoir evaluation. A well in Mid-west oil and Gas Company in Imusadege Marginal Oil Field, Kwale, Nigeria was used for the research. The fundamental concepts of open wireline logging which evaluate petrophysical parameter such as porosity, water and hydrocarbon saturation and, irreducible water saturation and permeability were highlighted. The well contains eleven reservoirs, eight of which were hydrocarbon bearing while three were water bearing. These reservoirs were evaluated using gamma ray, neutron, resistivity and density logs. The evaluated well are characterized by high porosity and permeability with low clay content which is an indication for active or productive reservoir. Key word: Well logs, porosity, permeability, reservoir, resistivity, hydrocarbon. ______________________________________________________________________________
INTRODUCTION
In petroleum industry, well logs play a vital role in oil and gas exploration and reservoir evaluation. When a well drilling is finished, a decision must be made as to whether to complete the well or abandon it. Well logs often provide the data that help make the correct decision. Well logs can sometimes be used to identify the prescene of hydrocarbon where the quantity of the reservoir rock is so good that nearly all traces of hydrocarbons have been flushed from the drilling cuttings circulated to the surface by the drilling fluid. Well logs are used to calculate the amount of oil and gas in the ground. A well log is a graph of depth in well versus some characteristics or properties of the rock. The rock properties is derived from measurements made when instruments are lowered into the well on an electrical wireline or cable. Most measurements are actually recorded as the instruments are raised to the surface from the bottom depth in the well. Once a well is drilled, the only economical means of finding out what is down there is with a well log. The well logs utilized included gamma ray, resistivity, caliper, density, neutron and sonic logs. The gamma ray log was used to estimate bed boundaries, determine lithology with local knowledge and estimate shale content. The resistivity log was used to correlate and determine bed boundaries, true formation resistivity, and porosity, prescience of hydrocarbon and oil-water contact. The caliper log was used to check for borehole rugosity

Egbai J.C. et al Adv. Appl. Sci. Res., 2012, 3(2):656-670 _____________________________________________________________________________
657 Pelagia Research Library
while the density and neutron log was used to calculate for porosity, matrix density and determine hydrocarbon type (gas or oil). The quality of well logs can vary significantly from one well to the next. The type of log used in a well may also change from one well to another. Each type of log has its own volume of investigation within which it responds to the rock property it measures. The development of recording techniques compatible with the application of computers in well log interpretation has removed a large number of earlier assumptions and general estimates from well log computations. The result has been a change from a correlation tool for geologists to an indispensable data source for the oil industry. A successful logging program, along with core analysis, can supply data for subsurface structural mapping, define the lithology, identify the productive zones and accurately described their depth and thickness, distinguishes between oil and gas, and permits a valid quantitative and qualitative interpretation of reservoir characteristics, such as fluid saturation, porosity, and permeability. Unfortunately, these petrophysical properties cannot be measured directly and, therefore, they must be inferred from the measurement of other parameters of the reservoir rock, such as the resistivity of the rock, the bulk density, the interval transit time, spontaneous potential, the natural radioactivity, and the hydrogen content of the rock [1]. The aims and objectives of this research work include (a) To determining the lithological sequence using Gamma Ray (GR) logs (b) To distinguish between permeable, porous formation and impermeable non-porous formation. (c) To identify hydrocarbon bearing zone and non-hydrocarbon bearing zones (d) To determine the thickness of each reservoir sand and the zones occupied by different fluids, (e) To determine or evaluate the petrophysical parameters of each reservoir and (f) To evaluate the production capabilities of reservoir formation to make economic decisions based on result. All sedimentary deposits however, have an in homogeneity caused by distribution in time and space of sedimentary facies and by compaction, cementation and the nature of pore filling fluids. [2]. One of the essential potentials for commercial accumulation of hydrocarbon is the existence of a reservoir. Prediction of reservoir parameters is an integral part of petroleum exploration geology. Such estimates are especially critical in evaluating prospects and potentials where reserves and productivity are considered for economic success. [3]. Information about the porosity of the formation is also important in oil exploration because of the relationship between effective porosity and permeability of the formation [4]. Porosity is a dimensionless quantity expressed as a decimal fraction or percentage [5]. Effective porosity can also be expressed as a ratio of the volume of water that can flow by gravity to the volume of the soil or rock. The definition accounts for the free circulation of fluid in porous consolidated materials of rocks and soil respectively [6]. The weathered of fractured rocks are often good aquifers provided they have low clay content. This suggests the reason why aquifers in the basement rocks are found along the fractured or weathered zones [7]. Successful exploration, exploitation and management of groundwater or hydrocarbon require a good knowledge of the spatial distribution of aquifer hydraulic parameters such as lithology, thickness usable capacity and other hydraulic properties [8]. GEOLOGY OF THE STUDY AREA Stratigraphy of Niger-Delta. The tertiary stratigraphy of Niger-Delta has been described and defined by [9], who recognized three distinct facies belt (formations). These are prodelta facies (Akata formation), paralic delta front facies (Agbada formation) and the continental delta top facies (Benin formation). AKATA FORMATION Akata formation is the lower most units made of uniform shale consisting of dark grey sandy, silty shale with plant remains at the top. It is believed to have been deposited in a front of the advancing delta and ranges from Eocene to Recent. It is over 4000ft thick. This is as shown in Figure 1 AGBADA FORMATION The Agbada formation consists of a sequence of sandstones and shales. The formation is rich in microfauna at the base decreasing upward and thus indicating an increasing rate of deposition in the delta front (figure 1). It is over 10,000ft thick and range from Eocene in the north to Pliocene in the south and Recent in the delta surface. Major hydrocarbon accumulations are found in the intervals between Eocene and Pliocene age.

Egbai J.C. et al Adv. Appl. Sci. Res., 2012, 3(2):656-670 _____________________________________________________________________________
658 Pelagia Research Library
BENIN FORMATION Benin formation extends from the west across the whole Niger delta area and southward beyond the present coastline (Figure 1). It is over 90% sandstone with shale intercalations. It is coarse grained, gravelly, locally fine grained, poorly sorted, sub-angular to well rounded and bears lignite streaks and wood fragments. In the subsurface, it is of Oligocene age becoming progressively younger southward. In general, it ranges from Miocene to Recent. The thickness is variable but generally exceeds 6000ft. The formation is associated with little hydrocarbon accumulation.
Figure 1: Structure of the Niger Delta. High bulk density Benin squeezes Akala Formation shale seaward. At
outcrop the shale rises diapirically. LOCATION The study area Kwale is located in Ndokwa West Local Government Area of Delta State, Nigeria. It is part of the Niger Delta Basin where Imusadege Marginal Oil field is located. It lies within longitudes 50 351 and 50401N, and latitudes 60 251 and 60301 E. It is bounded to the north by Ika South and Aniocha South Local Government Area to the west by Ethiope East Government Area and to the south by Ughelli North and Isoko North Local Government Area. River Niger forms the eastern boundary. The well drilled by Mid-West Oil and Gas Company was located in Imusadege Marginal Oil Field in Kwale, Nigeria.
METHODOLOGY AND ANALYSIS
Open hole wireline logs were used for this research. Wireline electrical logging is done from a logging truck sometimes referred to as a ‘mobile laboratory’. The truck carries the down-hole measurements, the electrical cable and winch (a pulley arrangement) needed to lower the instruments into the borehole. The truck also carries the surface instrumentation needed to power the down hole instruments and to receive and process their signals and equipment needed to make a permanent recording of the log. The download measurement instruments are usually composed of two components, (a) the sensors used in making the measurement called the Sonde. The type of sensor depends upon the nature of the measurement; (b) the other component of the downhole tool is the cartridge. The cartridge contains the electronics that power the sensors, process the resulting measurement signals and transmit the signals up the cable to the truck. Logs are normally recorded when the cable is being rolled upward with the Sonde for easy depth control. The cable is used to transmit the electrical power from the surface to the down hole tools. The surface instrumentation provides the electrical power to the down hole tool, processes and analyses the signals. The desired signals are sent to a magnetic tape in digital form and to a cathode ray tube and photographic film in analog form. The photographic film is processed and printed on paper as the composite log [10]. Most logging tools

Egbai J.C. et al Adv. Appl. Sci. Res., 2012, 3(2):656-670 _____________________________________________________________________________
659 Pelagia Research Library
are readily combinable. This implies that the Sondes and cartridge of several tools can be connected to form one tool and thereby make many measurements and logs on a single and decent into ascent from the borehole. The Gamma Ray (GR) log calibrated in (0-150) API units was used to describe the entire lithologic sequence. The gamma ray log which responds to the amount of radioactive element in the formation shows two basic signatures associated with sand and shale based on the geology of the Niger Delta. The sand line with low GR value (30-45) API units was establishly followed by the shale line with higher GR value of 120API on the scale. A cut-off line between the two extremes was established. Well production tests combined with reservoir simulations also play an important role in determining the extent of a reservoir. It is fair to say that in general the reservoir area is one of the most uncertain factors in the determination of the hydrocarbon volume [11]. A well was drilled in Imusadege Marginal Oil field in Kwale. Eleven reservoir structures were encountered between the depths of 2330m and 2346m. The data collected have shown that Gamma ray, Density, Resistivity and sonic logs run in the well. In Imusadege Oil Field, some reservoir properties were analyses. These include the porosity, fluid saturation; shale content, permeability etc are calculated for the various reservoirs in the determination of hydrocarbon in place. FORMATION FACTOR AND POROSITY DETERMINATION The porosity Ø of the hydrocarbon bearing zone is given using
ØD= (1)
where ØD = porosity from density log
b = bulk density
f = density of the fluid
ma = matrix density
The matrix density ( ma) for sandstone in the Niger Delta is 2.65g/km2 [10]. Bulk density, b is taken from the tract
4 of the composite log reading scale and the density of the fluid f either oil or gas is used.
[12] proposed a formula relating porosity Ø and formation factor F. The relationship according to [10] is F = a/Øm (2) M = cementation factor or exponent varies between 1.3 and 3.0. The cementation and the constant “a” are determined empirically. The response equation for the neutron porosity log according to [13] is as shown below
ØN = e × Sxo × NW (water term)
+ e × (1 –Sxo) × Nh ( hydrocarbon term)
+ Vsh × Nsh (shale term)
+ (1-Vsh – e) × sum ( Vi × Ni ) (Matrix term) (3)

Egbai J.C. et al Adv. Appl. Sci. Res., 2012, 3(2):656-670 _____________________________________________________________________________
660 Pelagia Research Library
Figure 2A: Composite Log of Well.

Egbai J.C. et al Adv. Appl. Sci. Res., 2012, 3(2):656-670 _____________________________________________________________________________
661 Pelagia Research Library
Figure 2B: Composite Log of Well showing Reservoirs R1-R3

Egbai J.C. et al Adv. Appl. Sci. Res., 2012, 3(2):656-670 _____________________________________________________________________________
662 Pelagia Research Library
Figure 2C: Composite Log for Well showing Reservoirs R4-R5

Egbai J.C. et al Adv. Appl. Sci. Res., 2012, 3(2):656-670 _____________________________________________________________________________
663 Pelagia Research Library
Figure 2D: Composite Log showing Reservoirs R6-R7

Egbai J.C. et al Adv. Appl. Sci. Res., 2012, 3(2):656-670 _____________________________________________________________________________
664 Pelagia Research Library
Figure 2E: Composite Log showing Reservoirs R8-R10

Egbai J.C. et al Adv. Appl. Sci. Res., 2012, 3(2):656-670 _____________________________________________________________________________
665 Pelagia Research Library
Figure 2F: Composite Log showing Reservoir of R11
This equation is with the assumption that ØNw = ØNh =1.0, ØNi = 0.0, Sxo =1.0 and that ØNsh and Vsh are known .
Egbai J.C. et al Adv. Appl. Sci. Res., 2012, 3(2):656-670 _____________________________________________________________________________
666 Pelagia Research Library
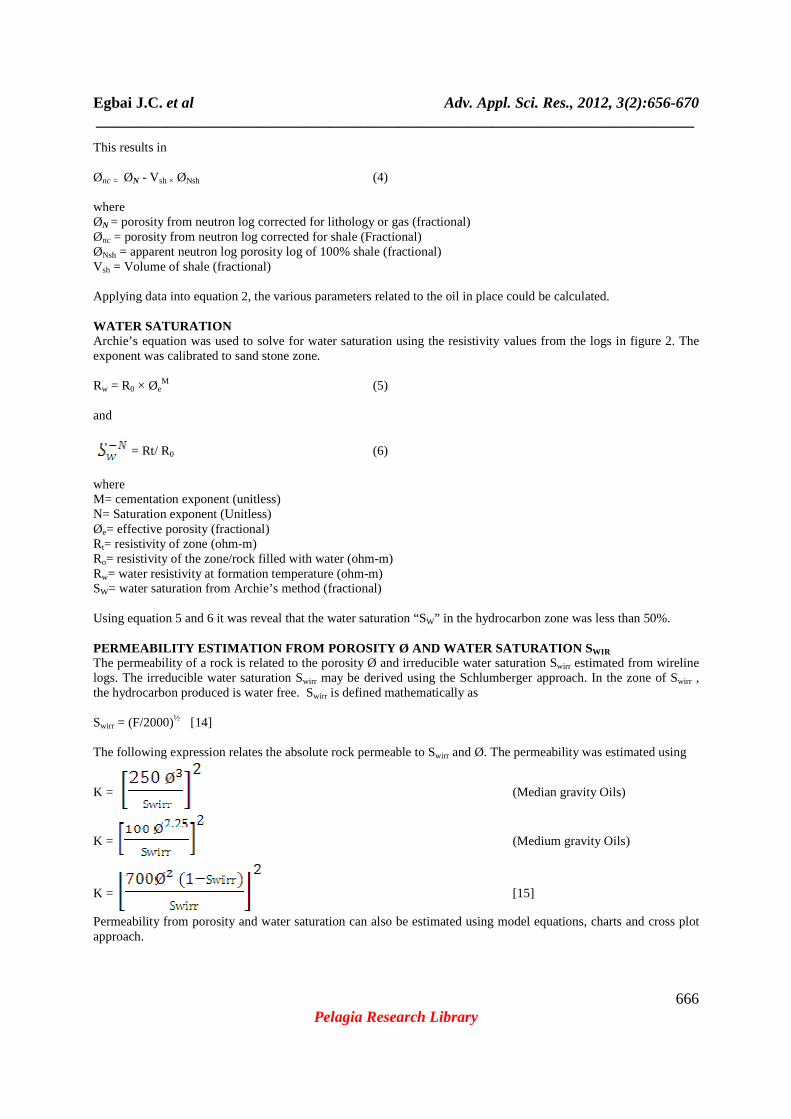
This results in Ønc = ØN - Vsh × ØNsh (4) where ØN = porosity from neutron log corrected for lithology or gas (fractional) Ønc = porosity from neutron log corrected for shale (Fractional) ØNsh = apparent neutron log porosity log of 100% shale (fractional) Vsh = Volume of shale (fractional) Applying data into equation 2, the various parameters related to the oil in place could be calculated. WATER SATURATION Archie’s equation was used to solve for water saturation using the resistivity values from the logs in figure 2. The exponent was calibrated to sand stone zone. Rw = R0 × Øe
M (5) and
= Rt/ R0 (6)
where M= cementation exponent (unitless) N= Saturation exponent (Unitless) Øe= effective porosity (fractional) Rt= resistivity of zone (ohm-m) Ro= resistivity of the zone/rock filled with water (ohm-m) Rw= water resistivity at formation temperature (ohm-m) SW= water saturation from Archie’s method (fractional) Using equation 5 and 6 it was reveal that the water saturation “SW” in the hydrocarbon zone was less than 50%. PERMEABILITY ESTIMATION FROM POROSITY Ø AND WATER S ATURATION S WIR The permeability of a rock is related to the porosity Ø and irreducible water saturation Swirr estimated from wireline logs. The irreducible water saturation Swirr may be derived using the Schlumberger approach. In the zone of Swirr , the hydrocarbon produced is water free. Swirr is defined mathematically as Swirr = (F/2000)½ [14] The following expression relates the absolute rock permeable to Swirr and Ø. The permeability was estimated using
K = (Median gravity Oils)
K = (Medium gravity Oils)
K = [15]
Permeability from porosity and water saturation can also be estimated using model equations, charts and cross plot approach.

Egbai J.C. et al Adv. Appl. Sci. Res., 2012, 3(2):656-670 _____________________________________________________________________________
667 Pelagia Research Library
Several equation have been proposed in order to estimate permeability from measurements of porosity and irreducible water saturation. This was documented by [16] and was found to be convenient that is
K=
Where porosity, Ø and irreducible water saturation Swirr are in percentage, K is in md.
Table 1: Lithological identification of Well A
Reservoir Name
Depth Interval (m)
Reservoir Thickness (m)
Lithology (Inference)
R1 1632-1639 7.00 Shaly sands R2 1647-1651 4.00 Shaly sands R3 1653-1666 13.00 Shaly sands R4 1720-1728 8.00 Shaly sands R5 1745-1744 10.00 Shaly sands R6 1913-1918 5.00 Shaly sands R7 1949-1952 3.00 Shaly sands R8 2063-2094 31.00 Sand R9 2100-2103 3.00 Shaly sands R10 2163-2182 19.00 Sand R11 2330-2346 16.00 Sand
Table 2: Determination of Porosity, Ø and formation factor of Well A
Reservoir Name
ØD (P.U) ØN (P.U) Ø = Ø2 Ø% F=
R1 0.3590 0.1100 0.2345 0.0550 23.45 14.73 R2 0.3205 0.3400 0.3303 0.1091 33.03 7.42 R3 0.3173 0.3300 0.3236 0.1047 32.36 7.73 R4 0.2524 0.2200 0.2362 0.0558 23.62 14.52 R5 0.2946 0.2550 0.2748 0.0755 27.48 10.73 R6 0.2973 0.3000 0.2987 0.0892 29.87 9.08 R7 0.2308 0.2475 0.2391 0.0572 23.91 14.16 R8 - - - - - - R9 0.2628 0.2100 0.2364 0.0559 23.64 14.49 R10 - - - - - - R11 - - - - - -
Efficiency rating of the porosity of the reservoir based on the neutron-density porosity values show that Ø<5% low, 5 %, > Ø < 10%
median 10% < Ø < 12% Average, 20% < Ø < 30% Good, 30% < Ø < 40% Excellent.
Table 3: Determination of fluid saturation (Sn, Sw) of Well A
Reservoir Name
Depth Interval(m)
Rt (Ωm)
Rw (Ωm)
Ø (%)
Sw Ø (%)
Sn (%)
F Fluid
Content R1 1632-1639 696.67 0.1358 23.45 5.36 94.64 14.73 1638.50 R2 1647-1651 365.00 0.2695 33.03 7.40 92.60 7.42 1650.50 R3 1653-1666 398.33 0.2587 32.36 7.08 92.92 7.73 166.00 R4 1720-1728 47.50 0.1377 23.62 20.52 79.48 14.52 1727.50 R5 1745-1755 257.50 0.1864 27.48 8.82 91.18 10.73 1954.25 R6 1913-1918 41.67 0.2203 29.87 21.91 78.09 9.08 1917.50 R7 1949-1952 30.00 0.1412 23.91 25.82 74.18 14.16 1952.00 R8 2063-2014 - - - 100.00 - - - R9 2103-2106 80.00 0.1380 23.64 15.81 84.19 14.49 2106.00 R10 2163-2182 - - - 100.00 - - - R11 2330-2346 - - - 100.00 - - -
R0 =2.0Ωm

Egbai J.C. et al Adv. Appl. Sci. Res., 2012, 3(2):656-670 _____________________________________________________________________________
668 Pelagia Research Library
Table 4: Reservoir Permabilities using K= approach of Well A
Reservoir
Name F
Sw (%)
Swirr Ø (P.U) Swirr (%)
Ø (%) Permeability
K (md) R1 14.73 14.73 0.08058 0.2345 8.58 23.45 1973.30 R2 7.42 7.42 0.06090 0.3303 6.07 33.03 17680.80 R3 7.73 7.73 0.62200 0.3236 6.22 32.36 15480.00 R4 14.52 14.52 0.08520 0.2362 8.52 23.62 2065.81 R5 10.52 10.73 0.07320 0.2748 7.32 27.48 5447.41 R6 9.08 9.08 0.06740 0.2987 6.74 29.87 9273.16 R7 14.16 14.16 0.08410 0.2391 8.41 83.91 2237.16 R8 - - - - - - - R9 14.49 14.49 0.08510 0.2364 8.51 23.64 2078.39 R10 - - - - - - - R11 - - - - - - -
Table 5: Summary result of parameters estimated for well
Reservoir
Name Depth
Interval Reservoir thickness
Rt (Ωm)
Rw (Ωm)
Ø (%)
F Sw (%)
Swirr (%)
Permeability K (md)
Sn (%)
Lithology (Inference)
R1 1632-1639 7.00 696.67 0.1358 23.45 14.73 5.36 8.58 1973.30 94.64 Hydrocarbon R2 1647-1651 4.00 365.00 0.2695 33.03 7.42 7.40 7.07 17680.80 92.80 Hydrocarbon R3 1652-1666 13.00 398.33 0.2587 32.36 7.73 7.08 5.22 15480.00 92.92 Hydrocarbon R4 1720-1728 8.00 47.50 0.1377 23.62 14.52 20.52 8.52 2065.81 79.48 Hydrocarbon R5 1745-1755 10.00 257.50 0.1864 27.48 10.73 8.82 7.32 5447.41 91.18 Hydrocarbon R6 1913-1918 5.00 41.67 0.2203 29.87 9.08 21.91 6.74 9237.16 74.18 Hydrocarbon R7 1949-1952 3.00 30.00 0.1412 82.91 14.16 25.82 8.41 2237.16 74.18 Hydrocarbon R8 2063-2094 31.00 - - - - 100.00 - - - Water R9 2103-2106 3.00 80.00 0.1380 23.64 14.49 15.81 9.51 2078.39 84.19 Hydrocarbon R10 2162-2182 19.00 - - - - 100.00 - - - Water R11 2330-2346 16.00 - - - - 100.00 - - - Water
Table 6: Fluid- Types and Contents in Well A
Depth
Interval (m)
Reservoir Name
Density Bulk 1.95-2.95 (Fkm-3)
Neutron Porosity 0-0.15-0.45( P.U)
Inference
1632-1639 R1 Pb curve deflected to its lower values (LHS)
N curve deflected to its negative value (RHS) Gas filled reservoir sand
1647-1651 R2 Pb curve deflected to its LHS N curve deflected to its RHS The reservoir thickness is small (4m) and is oil field
1653-1666 R3 Pb curve deflected to its LHS and at 1655m it cross to the RHS
N curve is deflected to its RHS and at 1655m it deflects to the LHS
1653-1655 is gas filled 1656-1666 is oil filled
1720-1728 R4 Pb curve deflected to its LHS N curve deflected it its RHS Gas filled small reservoir with predominantly shale in the middle
1745-1755 R5 Pb curve curve deflected to its LHS and at 1745m, it deflected to its RHS.
N curve deflected to RHS and 1747.5, it deflects to its LHS
Gas filled between (1745-1747). GOC at 1847.5. (1747.5-1754.5) is oil filled.
1913-1981 R6 Pb curve deflect to its LHS and at1915m, it deflects to its RHS
N curve deflected to RHS and at 1915m,it deflects to it LHS
Gas filled between (1913-1915)m. GOC at 1915. (1915-1918)m is oil filled
1949-1952 R7 Pb curve deflected to its LHS N curve deflected to its RHS Reservoir thickness is 3m with gas filled
2103-2106 R9 Pb curve deflected to its LHS Neutron, porosity curve deflected to its RHS
Gas filled reservoir
The curve deflections and log data of the various reservoirs is as shown in figures 2 (A-F)
DISCUSSION The research is based on the effectiveness of open-hole wirelogs in evaluating reservoir petrophysical parameters. A well of eleven reservoirs were petrophysically evaluated. Table 3 shows that Rt generally have high values at various depth indicating the prescence of hydrocarbons. This is supported by the moderately low water saturation which corresponds to high hydrocarbon saturation except at

Egbai J.C. et al Adv. Appl. Sci. Res., 2012, 3(2):656-670 _____________________________________________________________________________
669 Pelagia Research Library
reservoirs R8, R10 and R11 in the well. These three reservoirs are water bearing sand zone with very low values of true resistivity (Rt). This is shown in Table 5. Reservoir, R1 of the well shows that sand occurs at depth (1632-1639)m with sand thickness of 7.0m, showing low GR response. The reservoir is gas bearing with low shale intercalation. The resistivity (Rt ) response is high, 696.67Ωm producing sh of 94.64%, sw of 5.36% and Swirr of 8.58%. The hydrocarbon saturation, permeability, and porosity are relatively high indicating good production of hydrocarbon. Table 5 shows that reservoir R2 to R7 and R9 have high Rt, Sn and high permeability. These reservoirs have high hydrocarbon saturation, porosity with low shale intercalation. The analyses indicate that reservoirs R1-R7 and R9 have low water cut between (5.36-25.82) %. R8, R10 and R11 have water cut of 100% that is water saturation with no hydrocarbon. Based on this, R1-R7 and R9 are active hydrocarbon reservoirs while R8, R10 and R11 are water productive zone.
CONCLUSION
The study shows that eleven sand reservoirs (or zones) were observed in the well of which eight wells of the reservoirs are hydrocarbon bearing while the remaining three are water bearing zones. The porosity value of the well is between (23.36 – 33.03) % while hydrocarbon bearing sand, ø ranges between (9-40) %. This is a productive reservoir, [17] and [18]. This shows from the porosity value obtained from the data, we can conclude that the reservoirs are productive except R8, R10 and R11. Most of the reservoirs in the well are gas bearing. The hydrocarbon saturation Sh of all the hydrocarbon bearing zones ranges from (74.18 – 94.64) % in the well with water saturation while water bearing zones have the value of Sw= 100%. High resistivity, Rt values in all the hydrocarbon bearing zones were observed from the data. Thus, from the petrophysical analysis results, high quality reservoir characteristics, porosity and permeable sand were highly observed in the well. Acknowledgement The authors wish to appreciate the part played by Mid-West Oil and Gas Company for the data and faculties provided which made this research possible. The part played by Mr. Akporotu Richard Onoriode during the Field work is equally appreciated.
REFERENCES
[1] Schlumberger, Log Interpretation Principle/Application Schlumberger Educational Services, Houston, TX, 1987, 198pp. [2] Okiotor, M.E, Imasuen, I.O. and Etobro A.A.I. Adv. In App. Sc. Research, 2011, 2 (3) 114-126 [3] Okiotor, M.E, Imasuen, I.O. and Etobro A.A.I. Adv. In App. Sc. Research, 2011, 2 (3) 114-126 [4] Archie G.E, Trans; Am. Inst. Mm. Metal and Petr. Eng; (1942) 146, 54-62 [5] Niwas, S., de-Lima, O.A.L Groundwater (2003), 41(1), 94-99. [6] George,N.J., Obianwu V.I. and Obot,I.B Advance in App. Sc. Res, 2011, (1): 153-162 [7] George,N.J., Obianwu V.I. and Obot,I.B Advance in App. Sc. Res,, 2011, (1): 153-162 [8] ] George,N.J., Obianwu V.I. and Obot,I.B Advance in App. Sc. Res,, 2011, (1): 153-162 [9] Short,K.C and Stauble,A.J. Outline of geology of Niger Delta, Am. Assoc. Petroleum Geologists. 1967, Bull, Vol. 51, p. 761-779. [10] Schlumberger, Log Interpretation Principle/Application. 1999, Vol. 4 p30. [11] Fanchi, J.R., Principles of Applied Reservoir Simulation, 2001, 2nd Gulf Professional Publishing, Houston, TX. [12] Archie E.E., Pet. Tech. 1942, Vol. 5 p. 52. [13] Crain, R., 2008, Hand book of Petrophysics Internet books.

Egbai J.C. et al Adv. Appl. Sci. Res., 2012, 3(2):656-670 _____________________________________________________________________________
670 Pelagia Research Library
[14] Schlumberger,Log Interpretation Principle/Application. 1977, Schlumberger Educational Services 5000 Gulf Freeway, Houston, Texas 77023. [15] Coates, E.R., A new approach to improved log derived permeability. The log Analyst 1973, Vol. 15 p. 20. [16] Atlas Dresser, Log Review -1 Dresser Ind. Inc. 1974. [17] Etu-Efeotor, John., Fundamentals of Petroleum Geology, 1997, Paragraphic Publication,Port-Harcourt, Nigeria. [18] Schlumberger, Log Interpretation Principle/Application,1987, Schlumberger Educational Services 5000 Gulf Freeway, Houston, Texas 77023.