t·· .j',i,
TRANSCRIPT

CONHYD 00382C
ELSEVIER Journal of Contaminant Hydrology 17 (1995) 000-000
JOURNAL OF
contaminant Hydrology
Stepwise pumping approach to improve free phase light hydrocarbon recovery from unconfined aquifers
GrantS. Cooper, Jr.•, Richard C. Peralta", Jagath J. Kaluarachchib 4 Utah State University, Departments of Biological and Irrigation Engineering, Logan,
Utah 84322·4105, USA bCivil and Environmental Engineering, lAgan, Utah 84322-4105, USA
Received 25 April 1994; revision accepted 28 October 1994
Abstract
A stepwise, time-varying pumping approach is developed to improve free phase oil recovery of light non-aqueousphase.liquids{LNAPL) from a homogeneous, unconfined aquifer. Stepwise pumping is used to contain the floating oil plume and obtain efficient free oil recovery. The pumping approach is developed using detailed simulations, multiple linear regression and graphical plots. The approach uses ARMOS10, an areal two-dimensional multi phase flow, finite-element simulation model. Systematic simulations of f~ oil area changes to pumping rates are analyzed. Pumping rates are determined that achieve LNAPL plume coD.tairim.ent at different times (i.e. 90, 180 and 360 days) for a planning period of 360 days. These pumping rates are used in reverse order as a stepwise (monotonically increasing) pumping strategy. This stepwise pumping strategy is analyzed further by performing additional simulations at different pumping rates for the last pumping period. The final stepwise pumping strategy is varied by factors of -25% and +30% to evaluate sensitivity in the free oil recovery process. Stepwise pumping is compared to steady pumping rates to determine the best free oil recovery strategy. Stepwise pumping is shown to improve oil recovery by increasing recovered oil volume (II%) and decreasing residual oil (15%) when compared with traditional steady pumping strategies. The best stepwise pumping strategy recovers more free oil by reducing the amount of residual oil left in the system due to pumping-drawdown. This stepwise pumping approach can be used to enhance free oil recovery and provide for cost-effective design and management ofLNAPL cleanup.
1. Introduction
Hydrocarbon contamination sites associated with light non-aqueous phase liquids (LNAPL) are widespread in the U.S.A. and represent difficult cleanup problems
0169-7722/94/$07.00 © 1994- Elsevier Science B.V. All rights reserved SSDI 0 169-7722(94)00047-6
Wednesday 1st February 1995, 14:51 CONHYD Compuscript- 382 (ch098) adm Typeset from disc
.,:
.J',i, :; ''-· ~\
i :: r ·, t·· ... ~· .

2 G.S. Cooper. Jr. et al.f Journal ofConraminQJlt Hydrology 00 (1995) 000~000
(Gangadharan, 1988). Contamination sites result from underground storage tank leaks, spills at aboveground tank farms, pipeline leaks, and spills involving vehicles and railroad tank cars carrying hydrocarbons. Contaminated sites cause numerous environmental problems that will exist for years to come. The long-term effects of hydrocarbon contamination have rendered water from many aquifers unsuitable for culinary consumption and other uses.
When groundwater contamination is detected, necessary cleanup actions are formulated based on soil and water quality standards established by regulation. Appropriate efforts include three components: (I) site characterization is performed to identify, locate and quantify the contamination; (2) cleanup methods appropriate for the site are identified and selected; and (3) an action plan is developed to outline the sequence of remediation steps necessary to achieve desired environmental standards.
Typically, cleanup of a LNAPL spill includes: plume contaimnent, free product recovery, pump-and-treat of soluble phases and in situ remediation. Contaimnent involves i=obilizing and preventing the spread of contamination in the aquifer. Free product recovery involves extracting LNAPL product floating on the water table. Pump-and-treat includes extraction of contaminated water using pumping wells and aboveground treatment of the water. In situ remediation includes remediating the residual or entrapped contaminants in the aquifer that cannot be removed by other methods. These methods include soil venting (Johnson eta!., 1990), enhanced bioremediation, or natural bin-attenuation.
Cleanup of LNAPL spills has required the development of computer models to simulate, predict and analyze multiphase flow. Models have been used to evaluate the effectiveness of various remediation methods and to improve their efficiency. Modeling work has been presented for multiphase flow and transport using finitedifference methods (Abriola and Pinder, 1985; Faust, 1985; Falta and Javandel, 1987) and finite-element methods (Huyakorn and Pinder, 1978; Osborne and Sykes, 1986; Kuppusamy et a!., 1987; Ka!uarachchi and Parker, 1989, 1990). But, many of the models had limited applicability for the analysis of field problems, because of the complex geometrY and boundary conditions encountered by designers (Parker and Lenhard, 1989).
Kaluarachchi et a!. (1990) devised a new numerical method that greatly improved the efficiency and accuracy of modeling LNAPL multiphase flow and oil recovery. The corresponding finite-element model, Areal Multiphase Organic Simulator (ARMas©), was developed (ES&T, 1991). ARMas© shnulation abilities have been presented previously (Kaluarachchi et a!., 1990; Parker et a!., 1990, 1994). An overview of ARMos©•s development is su=arized by Cooper (1994). ARMOs(D Version 3.0 (ES&T, 1991) is currently used for analysis and design of remediation systems for LNAPL problems.
Current free oil recovery in the field includes many different extraction methods. One established oil recovery method described here can be simulated by ARMOS©. Free oil recovery of light hydrocarbons is accomplished via a recovery well that: (I) pumps water to cause water table drawdown and hydrocarbon phase flow towards the well; and (2) the simultaneous pumping of hydrocarbon from the same well using
Wednesday 1st February 1995, 14:52 CONHYD Compuscript- 382 (ch098) adm Typeset from disc

G.S. Cooper, Jr. et al./ Journal of Contaminant Hydrology 00 ( 1995) 000-000 3
a separate oil extraction pump. This pumping system is recommended because field experience has shown that free product recovery is improved by controlled depression of the watertable through groundwater pumping (de Albuquerque eta!., 1993). When designing such an operation, a number of factors must be considered to assure efficient free oil recovery. These may include the rate of pumping at the well, length of time for remediation, steady vs. time-varying pumping rates, pumping well locations and other design issues related to system operation.
The difference between steady vs. time-varying pumping rates has not been previously addressed. The concept of stepped pumping to reduce oil entrapment due to drawdown was briefly discussed by Parker et a!. (1990). Cited papers on ARMOs<rl dealing with free oil recovery use only steady pumping rates for a specified planning period (Kaluarachchi and Parker, 1990; Kalnarachchi eta!., 1990; Parker et a!., 1990, 1994). Peralta and Kowalski (1986) demonstrated that temporally increasing pumping rates can better achieve hydraulic targets and aquifer heads than any steady rates that can be computed. The potential benefit of stepped pumping merits further examination.
In this paper we focus on the task of hnproving LNAPL free product recovery by implementing stepwise pumping strategies. Free product recovery is important in the overall cleanup effort, because LNAPL free product is a significant source of contamination. Recovery of as much free product as possible reduces total contamination and lessens required remediation efforts for remaining contaminants. In this work, we illustrate how to increase free oil recovery and reduce residual oil volume by developing a stepwise (monotonically increasing) pumping. strategy. It is shown that the proposed stepwise pumping strategy is an hnprovement over the best steady water pumping strategy that can be developed by simulation alone.
2. Theory development
2.1. Multiphasej/ow analysis
A numerical model is described that shnulates multiphase flow for water and separate LNAPL in a porons media system of an unconfined aquifer. The numerical model employs the simplifying assumptions of near-equilibrium vertical conilitions and negligible gas pressure grailients to rednce the ilimensionality of the problem from three-ilimensional to two-dimensional areal multiphase flow (Parker and Lenhard, 1989). The use of vertically integrated flow equations reduces the severe noulinearity associated with three-phase constitutive relationships. It is assumed that vertical fluids reilistribute quickly enough such that vertical pressure distributions constantly approximate hydrostatic conilitions (i.e. 81/Jwf8z = 0 and 81/J0 /8z = 0). In other words, vertical liquid velocities are relatively small compared to horizontal velocities. Based on hydrostatic conditions, the following equations are written (Parker and Lenhard, 1989):
1/Jw = hw + z (Ia)
Wednesday 1st February 1995, 14:52 CONHYD Compuscript- 382 (ch098) adm Typeset from disc

4 G.S. Cooper, Jr. er a/.f Journal of Contaminant Hydrology 00 (1995) 000-000
(I b)
where ..Pw and ..Po are water and oil piezometric heads, respectively [L]; z is elevation above an arbitrary datnm [L]; hw and h0 are water height-eqnivalent pressure beads in water and oil, respectively, of the form hp = Pp/ Pwg (p = w, o) [L] (Pp is the p-pbase
1f/ pressure [M L -IT-2], Pw is the density of water [M L - 3
], g is the gravitational constant -,l",tJL2r 1
]); and Pw IS the ratio of oil to water densi~J..H· In such a system, vertical pressure distributions can be characterized for all phases
in terms of various fluid "table" elevations. The oil lens is described by an air-oil table elevation, z80 , at which point the gauge oil pressure is zero, and an oil-water table elevation, Z0 w, at which water and oil pressures are equal. A hypothetical airwater table elevation, Z8w, is also defined within the oil lens at which location gauge water pressure is zero. This locally hydrostatic system is depicted in Fig. I. It shows a hypothetical screened well and the respective fluid phase distributions and interfaces for z80 aud Zow· The various fluid "table" elevations are defined (Parker and Lenhard, 1989) as:
(2a)
(2b}
(2c)
where ..Pw = Z8 w, ..Po= PmZao [L]; Pm is the ratio of oil to water density[-]; and H0 is the apparent" oil thickness or piezometric oil height [L].
The vertically integrated governing flow equations for the two-fluid phase system are defined in an areal two-dimensional domain as:
8Vw = .!!._ (T. Bz•w) .!!._ (T. Bzaw) y 8t 8x w 8x + By w By + w
(3a)
AIR
z •• z 0
~ ~ OIL z.w
WATER
0 SATURATION ,·
Fig. I. Fluid phase distributions for oil and water in equilibrium with the well.
'fi'/~ a...u.. ~ 4, M1 L ~ /~ '*.(. ~ !M.fA 6 ~L. ~/ko ~q ~ ~
Wednesday 1st February 1995, 14:52 CONHYD Compuscript- 382 (ch098) adm <1!.. ~ , ~n. Typeset from disc _ .• AJ . 11 70 M 0 ,t . .'' :""VIA-
~ tAJI'K:> <:::f'-VL ~ I / A.; f ~ ~
~ ~ M.l<. ~&H.

G.S. Cooper, Jr. era/.! Journal of Contaminant Hydrology 00 ( 1995) 000-000 5
av. =~(T 8z,0) +~(T az,.) +J (3b)
8t 8x o 8x By o By o
where V w and V0 are the water and oil volumes per horizontal area [L3 L - 2],
respectively, at a location in the x-y plane; Tw and T0 are water and oil transmissivities, respectively [L2 T-1]; lw and 10 are vertically integrated source-sink terms for water and oil, respectively [L3 L - 2 T-1
]; x and y are Cartesian horizontal-spatial coordinates [L]; and t is time [T].
The saturation-capillary pressure model used in the multi phase flow analysis is an extension of the van Genuchten (VG) model (Parker and Lenhard, 1989). The three-phase VG model is defined as (this model does not include fluid entrapment):
Sw =(I - Sm)(1 + (et./30whowl"l-m + Sm (4a)
(4b)
where Sw is water saturation; S1 is total liquid saturation which includes water and oil; Sm is the water saturation at "field capacity"; how= (1- Pro)(z- Z0w) is the oilwater capillary head [L]; h,0 = Pco(z- z,0 ) is the air-oil capillary head [L]; a [L -I] and n [-]are VG model parameters specific to the soil medium with m = 1 - 1/n; {3,0
is a scaling parameter that is approximated by the ratio of water surface tension to oil surface tension; and f3ow is another scaling parameter approximated by the ratio of water surface tension to oil-water interfacial tension.
The VG model is modified to include the mechanisms for fluid entrapment. Residual oil in the saturated and unsaturated zones is determined to allow for the effects of drawdown and water table fluctuation on the free oil recovery. The rising and lowering of the water table and associated fluid "table" interfaces affect residual oil values. Initial infiltration and redistribution events at the spill site will also impact oil entrapment (Kaluarachchi and Parker, 1992). Total oil specific volume is 1ccounted for in the system (Parker eta!., 1990) as:
v. = v.r+ v., + v •• (5)
where v. is the total oil specific volume per unit area [L3 L - 2]; V0 r is the free oil specific volume [L3 L - 2
]; V01 is the residual oil specific volume in the saturated zone caused by oil entrapment during water imbibition (i.e. rising water table) [L3 L - 2
];
and V08 is the residual oil specific volume in the unsaturated zone due to retention after gravity drainage [L3 L - 2
]. Total residual oil volume is the sum of V01 and V08 •
The respective residual oil quantities are determined from the fluid entrapment model of Parker el at. (1990) by numerical integration via the following empirical functions:
(6a)
(6b)
where q, is the porosity [L3 L - 3]; s., is the maximum entrapped oil saturation in the
saturated zone; Fis a factor that provides a measure of total oil specific volume prior
Wednesday 1st February 1995, 14:53 CONHYD Compuscript- 382 (cb098) adm Typeset from disc

6 G.S. Cooper, Jr. et al./ Journal of Contaminant Hydrology 00 ( 1995) 000-000
to water imbibition and varies between F = 0 (small oil volume) and F = I (large oil volume) [-]; z~" is the historical minimum oil-water table elevation since oil has reached a given areal location; S0 g is the residual oil saturation in the unsaturated zone; Z:oax is the historical maximum air-oil table elevation since oil has reached a given areal location; and Z0 w and z,0 are the current oil-water and air-oil table elevations at a given location, respectively. Typical values for S0 , range between 0.2 to 0.4 and values for S0 g between 0.04 to 0.08 (Parker et al., 1990).
2.2. Improving fi'ee oil recovery
To understand the oil recovery process, first examine the effects of pumping on oil flow for a steady rate of water pumping in the center of a floating plume. Oil flow toward the cone of depression increases at first, as drawdown in the water table increases the hydraulic gradient toward the well. After some time, oil flow diminishes as oil removal allows a rise in the water table (oil-water interface). This rise in the water table slows down oil flow and recovery. If higher pumping and greater drawdown is provided, then a gradient is created once again toward the recovery well and oil recovery increases. Under these conditions more free oil is recovered, but the higher pumping causes a larger cone of depression and more free oil is smeared in the area of drawdown as residual oil. This residual oil cannot be removed by pumping, reducing free oil available for recovery.
Considering steady (constant) pumping rates of different magnitudes further illustrates how oil flow and recovery is gmtrolled by drawdown and water table gradients. At low pumping rates, further lateral spreading of the plume occurs, leading to increased residual oil as free oil moves away from the well. At higher pumping rates, recovery and capture is achieved, but higher pumping increases drawdown and associated residual oil in the unsaturated zone. Therefore, a tradeoff exists between lateral spreading at low pumping rates vs. capture and a larger cone of depression at higher pumping. Previous work has shown this to be true. Parker et al. (1990, 1994) determined that one steady water pumping rate will be better than all others at recovering free oil. As pumping is increased above the best steady rate, free oil recovery decreases and entrapped residual oil exceeds recovered oil.
An alternative approach to steady pumping is to increase water pumping gradually, in steps, to reduce residual oil and improve oil extraction. Stepped pumping rates are used to achieve containment of the floating plume and also to provide for proper drawdown to cause oil flow towards the recovery well. Containment is desired to prevent expansion and migration of free oil away from the recovery well. Drawdown is necessary to provide for efficient oil recovery by maintaining an adequate gradient toward the recovery well. In other words, oil entrapment can be reduced by increasing · pumping in steps (less residual oil and more free oil for recovery).
The stepwise pumping approach is developed using a combined analysis of oil recovery and plume containment. The analysis is performed for a specified planning period and selected containment times. For example, steady water pumping rates that achieve containment at different times (i.e. 120, 240 and 360 days) are determined. Containment time is defined as the time required for simultaneous steady water
Wednesday 1st February 1995, 14:53 CONHYD Compuscript- 382 (ch098) adm Typeset from disc

G.S. Cooper, Jr. eta/. f Journal of Contaminant Hydrology 00 ( 1995; 000-000 7
pumping and oil recovery to prevent further expansion of the floating plume. Achieving containment within 120 days requires a greater steady pumping rate than achieving it after 240 or 360 days. Required steady pumping rates decrease as time to containment increases, because oil recovery is continuous and less oil is present in the system as time passes. But, as explained previously, pumping should increase with time to enhance oil recovery. Therefore, an increasing, stepwise pumping strategy is proposed. The pumping strategy would begin with the lowest required pumping rate (smallest drawdown) that achieves containment of the oil plume within the specified planning period. This pumping is followed by the required pumping rate that achieves containment at say 240 days and so on. Thus, drawdown is increased in steps by higher pumping rates. We propose that free oil containment with simultaneous oil recovery can be used as a modeling approach to compute stepwise pumping strategies that improve free oil recovery.
3. Application and methodology
3.1. Example problem description
A LNAPL recovery problem was posed consisting of a plume lying in a single layer, unconfined aquifer (Fig. 2). The study area is 160m x 160m with a single pumping well located at the center of the plume. The finite-element mesh in ARMos© has varied spacing consisting of 361 nodes, and is symmetrical about the well. The mesh has its finest spacing of 3 m near the well. The initial water table gradient is ~ 0.312%
160 ,------------------------------------.
140
120
..,.. :0 100 .., • 5
80
rn
~ 60 ;...
40
20
Water To.ble Gradient
LEGEND
Pumping Well- .t.
oL-~L-~~~~~~~~~~~~~ 0 ~ W M M 100 1~ IW IM
X -AXIS (meters)
Fig. 2. Site plan of LNAPL plume at initial conditions: contours of total oil specific volume in meters.
Wednesday 1st February 1995, 14:53 CONHYD Compuscript- 382 (ch098) adm Typeset from disc

8 G.S. Cooper, Jr. era!./ Journal of Contaminant Hydrology 00 (1995} 000-000
Table I Fluid and soil properties
Fluid properties
Pow= 0.80 TJow = 2.00 l3ao = 3.20 /3,. = 1.45
Soil properties
K!iW = 10m day- 1
~ = 0.41 "= 6.00 n = 2.70 Sm =0.20 S01 = 0.08 Sor = 0.21
Pow =ratio of oil to water density; fJow =ratio of oil to water absolute viscosity; f3ao =ratio of water surface tension to oil surface tension; flow= ratio of water surface tension to oil-water interfacial tension; Ksw = saturated hydraulic conductivity; ,P =porosity; a =van Genuchtenmodelcurve parameter, n = van Genuchten model exponent; Sm =irreducible water saturation; S08 =unsaturated zone residual oil saturation; Sor =saturated zone residual oil saturation.
(0.50 m/160 m). Initially the oil plume is floating on the water table. The study area is large enough so that the oil plume never reaches the boundaries. Constant-bead boundary conditions are used on all sides of the study area. Soil and fluid properties are assumed to be homogeneous and isotropic (Table I) and appropriate for a gasoline spill in a medium sand aqnifer.
The gasoline spill volume in the problem is ~ 164 m3• Initial conditions for the
floating plume (Fig. 2) represent observed product thickness in monitoring wells on site. The study area has not experienced fluctuations in the water table. Simulation results indicated that negligible residual oil exists in the system initially. The initial total LNAPL spill area predicted by ARMas© at time= 0.0 is 4475 m2
.
3.2. Development of stepwise pumping strategies
ARMas© simulations were performed for steady pumping rates to determine system response to pumping, pumping bounds and time discretization suitable for developing the stepwise pumping strategy. The unmanaged scenario (no pumping) and steady water pumping rates ranging from 15 to 240m3 day-1 were simulated by ARMos© for a time period of 420 days. A total of 14 simulations were run in ~ 4.5 h on a SUN® SPARCfiPX work station. It was observed from the simulations that oil recovery did not improve significantly above the 240-m3-day-1 pumping rate, and oil recovery reached a maximum threshold after ~ 360 days of pumping (Fig. 3). Time reqnired for the oil plume to begin decreasing in size and not increase thereafter was observed to be ~ 90-100 days at lower pumping rates of 70-90 m3 day-1• Thus, a maximum pumping rate of 240 m3 day-1 and a 360-day planning period consisting of three 120-day pumping periods were selected for stepwise strategy development. The !-year planning period and 120-day pumping periods were considered reasonable and practical for implementation in the field.
Results for free oil area (F03 ) changes vs. pumping rates were taken from the above simulations. Data were summarized and analyzed for simulation times ranging from
Wednesday 1st February 1995, 14:53 CONHYD Compuscript- 382 (ch098) adm Typeset from disc

G.S, Cooper, Jr. et al./ Journal o/Comaminant Hydrology 00 (1995) 000-000 9
80 50
70 40
M' 60 .s 0 • E 50 0
a: 30 0;
0 > 40 i5
> 0 0 • 0:
u
~ 30 > 0 0
20 • 0:
20 E • ~ 0.
10
10
,~------.---r---r---r--.r--.--~--~---+0 25 50 75 100 125 150 175 200 225 250
Water Pumping Rate (m 3Jday)
-s- Time = 90 days ---+-- Time = 120 days --?+E- Time - 180 days
--*-- Time = 240 days --£- Time = 360 days ---+-- Time = 420 days
Fig. 3. Oil recovery vs. pumping rates for simulation times of90-420 days.
8000
7000
X ~ X
" 5000 .s " ~ 4000 « * 0 * I
" 3000 X
\ 3!. x
2000
1000 I
I
0 I 0 25 50 75 100 125 150 175 200 225 250 Water Pumping Rate (m3/day)
* 90 days X 120 days -+- Regression Eq.
Fig. 4. Free oil area regression plot for simulation times of 90 and 120 days.
Wednesday 1st February 1995, 14:53 CONHYD Compnscript- 382 (ch098) adm Typeset from disc

10 G.S. Cooper, Jr. et al.f Journal of Contaminant Hydrology 00 (1995) 000-000
" .s "' !"
"' i5 " " u:
" .s "' " .;;: 0 " !" "-
8000
7000
X
6000
5000
4000
3000
2000
1000
0 0 25 50
* 180days
Initial Free Oil Area
•
X
X
X
X
75 100 125 150 175 200 225 250 ' Water Pumping Ra1e (m3/day)
x 240 days -+-- Regression Eq.
Fig. 5. Free oil area regression plot for simulation times of 180 and 240 days.
8000
7000
6000·
5000
4000
3000
2
1000
0 0 25 50
I * 360days
* Initial Free Oil Area
t ~ Point of Intersection
X * X
" X
,. X
75 100 125 150 175 200 225 Water Pumping Rate (m3/day)
x 420 days -+- Regression Eq.
Fig. 6. Free oil area regression plot for simulation times of 360 and 420 days.
I I I I
2so 1 I
I
Wednesday 1st February 1995, 14:53 CONHYD Compuscript- 382 (ch098) adm Typeset from disc

G.S. Cooper, Jr. et al./ Journal of Contaminant HydrologyOO (1995} 000-000 :I
90 to 420 days. Three multiple linear regression plots were developed for FO, \'S. ti::e and water pumping rate. FO, plots were made by combining data of differe~: ;imulation times for 90 and 120 days, 180 and 240 days, and 360 and 420 daY; ':1
Figs. 4, 5, and 6, respectively. Different simulation times (i.e. 90 and 120 days) wece analyzed together to provide sensitivity to the regression analysis. Multiple linear regression equations plotted in Figs. 4, 5 and 6 are given respectively as:
FO, = 6208.3- 0.360(T)- 12.457(Pw)
FO, = 8266.0- 4.943(T)- 28.125(Pw)
FO. = 8829.4- 3.697(T)- 40.993(Pw)
Ca)
Cb)
(ic)
where FO. is the free oil area [L2]; Tis the containment time [T]; P w is the water
pumping rate [L3 T-1]. The shortest containment time for each regression equation
was utilized to develop the plots (T = 90 days in Eq. 7a, T = 180 days in Eq. 7b, T = 360 days in Eq. 7c). Coefficients of determination for the above equations are 0.942, 0.973 and 0.976, respectively.
Required steady pumping rates for approximate containment times were identified at the point of intersection between the regression line and the dashed initial free oil area line (Figs. 4-6). Pumping rates from Figs. 4, 5 and 6 were estimated to be 137, 104 and 74m3 day-t, respectively. Pumping rates were also calculated directly from the multiple linear regression equations for a selected containment time and free oil area E4475 m2). Computed pumping rates from the three regression equations are 136.5 m3 day-1 for a containment time of90 days, 103.2 m3 day-1 for 180 days and 73.8 m3 day-1 for 360 days. These computed pumping rates are used subsequently.
System response to the above steady pumping rates was simulated by ARMos© for 360 days. Simulation results were checked to verify that containment was achie,·ed within the required time for each pumping rate. Containment is achieved when the floating oil plume is prevented from expanding further. A plot of free oil area vs. time shows that containment was obtained within required times for each steady pumping rate (Fig. 7).
The increasing, stepwise pumping strategy was developed using required steady pumping rates for longer contaimnent times in reverse order. The pumping strategy first begins with the required pumping rate for contaimnent at 360 days (73.8 m3 day-1
), followed by requiredpnmping for 240 days (103.2 m3 day-1) and the pumping rate for 120 days (136.5 m3 day-1). This pumping sequence is identified as Strategy A. Initially, stepwise pumping utilizes the lowest required pumping (smallest drawdown) that achieves containment within the specified planning period of 360 days. This rate is applied during pumping period I from 0 to 120 days. Pumping period 2 from 121 to 240 days utilizes a higher pumping rate that increases the water table gradient toward the recovery well and continues oil recovery. Lastly, required pumping for containment at 120 days (the highest pumping rate) is used during pumping period 3 from 241 to 360 days. Thus, a monotonically, increasing pumping strategy is implemented.
To examine possible time effects on the oil recovery process, the pumping rate for
Wednesday 1st February 1995, 14:53 CONHYD Compuscript- 382 (ch098) adm Typeset from disc

12 G.S. Cooper, Jr. eta!./ Journal of Contaminant Hydrology 00 (1995) 000-000
6000
Initial Free Oil Area ,
5000 \
"' 4000
E. "' ill ;, 3000
0 ill ill u: 2000
1000
o+---~--~----~~~--~--~~~~--i 0 50 1 00 150 200 250 800 850 400 '
Time (days) '
(....,.._ 186.5 m3jday ...,.,_ 108.2 m8/day-+- 78.8 m3Jday \
Fig. 7. Free oil area vs. time (360 days) for steady pumping rates used in the stepwise pumping strategy.
period 3 was analyzed further. Additional simulations were performed and pumping rates for period 3 were varied between 122 and 170 m3 day-l (required pumping equals 136.5 m3 day-1
). Pumping in periods 1 and 2 remained unchanged at 73.8 and 103.2 3 day- 1
, respectively. Seven stepwise pumping strategies were simulated (Table 2). The pumping rate for period 3 was determined based upon the oil recovery ratio of recovered oil to residual oil volumes. The ratio is a good indicator of oil recovery efficiency. The best pumping rate was identified as the one with the highest oil recovery ratio. The pumping rate of 143.7 m3 day-1 had the highest oil recovery
Table 2 Simulations for different pumping rates in period 3
Simulation Pumping rate Recovered Residual No. period 3 oil volume oil volume
(m' day-1) Vro Vn (m') (m')
I 122.9 66.53 63.03 2 129.7 67.74 62.98 3 136.5 68.98 62.21 4 143.7 71.06 61.04 5 151.7 71.38 63.30 6 160.6 71.74 64.20 7 17o.6 72.67 65.22
Pumping rates for periods 1 and 2 are 73.8 and 103.2 m3 day-1, respectively.
1.055 1.075 l.l09 I.I64 l.l28 l.ll7 l.ll4
Wednesday 1st February 1995, 14:53 CONHYD Compuscript- 382 (ch098) adm Typeset from disc

G.S. Cooper, Jr. er al.f Journal of Contaminant Hydrology 00 (1995) 000-000 l3
Tabie 3 Stepwise pumping strategies
Strategy
B c D
Percent change (%)
00.0 -25.0 +30.0
Pumping rate (m3 day- 1)
period 1 period 2
73.8 103.2 55.4 77.4
105.4 147.4
Planning period is 360 days with three 120-day pumping periods.
period 3
143.7 107.8 205.3
ratio (Table 2). Pumping rates of 73.8, 103.2 and 143.7 m3 day- 1 (Strategy B) were used as the stepwise, monotonically increasing, pumping strategy (three pumping periods of 120 days for 360 days).
Two additional stepwise pumping strategies ( C and D) were developed by decreasing and increasing the pumping rates of Strategy B by a factor of -25% and +30%, respectively. These stepwise pumping strategies were calculated to provide a range of values. The stepwise pumping strate~es are summarized in Table 3. These pumping rates (Table 3) were input to ARMOS for final simulation runs.
This stepwise monotonically, increasing pumping approach is shown to provide adequate gradient control toward the well, so that containment is achieved and oil recovery is improved. This is discussed in more detail by making a comparison between stepwise vs. steady pumping strategies and examining the effects on recovered oil and residual oil volumes.
4. Results and discussion
4.1. Comparison of stepwise vs. steady pumping strategies
To evaluate free oil recovery, stepwise pumping vs. steady pumping strategies were compared. This was done because steady pumping is the current choice for LNAPL recovery. System response for steady pumping rates between 74 and 210 m3 day-1
was simulated by ARMOS©. Resulting recovered oil, residual oil and free oil volumes were compared against those for stepwise pumping. The best pumping strategy was identified as having the highest recovered oil volume when forcing free oil volume to a small fraction of initial total oil in the system.
Overall performance of oil recovery is first evaluated by plotting final percent recovered oil vs. percent residual oil for both stepwise and steady pumping strategies (Fig. 8). The highest oil recovery is identified for stepwise and steady pumping. The best stepwise strategy has pumping rates of 105.4, 147.4 and 205.3 m3 day- 1 (Table 3, D). The best steady pumping rate is 168.4 m3 day- 1
• The best stepwise pumping strategy bas the highest percentage of recovered oil (49%) or volume (80.54 m\ In fact, all stepwise pumping strategies have a higher ratio of oil recovery to residual oil when compared to steady pumping (Fig. 8).
Wednesday 1st February 1995, 14:53 CONHYD Compuscript- 382 (ch098) adm Typeset from disc

14 G.S. Cooper, Jr. et at. I Journal of Comaminam Hydrology 00 ( 1995) 000·-000
6 '0 ~
" > 0 u
" a: E " ~ " D..
50
I v: Best S epwise ~ ( ---~ Pumpinp Strategy I
' ' ---,---'7 / .-;::, v r 1/ / Best Stea y!
/ umping Str tegy
45
40
35
,/
30
25 25 30 35 40 45 50
Percent Residual Oil
I
I ""' "s
55
-~
60
Fig. 8. Plot of percent recovered oil vs. percent residual oil (360 days} for comparison of stepwise pumping vs. steady pumping strategies.
Final ARMOS© simulation results for the best strategies considered are given in Table 4. The best stepwise strategy has I 1% more recovered oil and I 5% less residuaL oil than the best steady pumping strategy. Free oil volume is 7% of total oil volume for the best stepwise strategy compared to 4% for the best steady strategy. Oil-water cuts also show that stepwise pumping is more efficient in the oil recovery process than steady pumping (Fig. 9). Oil-water cut is a ratio of recovered oil volume to total water pumped. The best stepwise pumping strategy pumps less total water in 360 days (44,800 m3
) than the best steady pumping strategy (49,400 m3).
Next, the effects of pumping on total oil volumes are examined. Three steady and. three stepwise pumping strategies are taken from Fig. 8. Final oil volumes for the six strategies are shown in Fig. 10. At lower pumping rates free oil volumes are high (33% of total oil volume) for both steady and stepwise pumping. As pumping rates increase
Table 4 Final simulation results for best pumping strategies
Scenario
Best steady Best stepwise
Pumping rate (m3 day-1)
168.40 105, 147, 205
Recovered oil volume (m')
12.45 80.54
Residual Free oil Free oil oil volume volume area (m') (m') (m')
85.38 6.57 712 12.53 11.33 1,004
Values shown are results after simulating for 360 days at given pumping rate(s}. Initial free oil area = 4475 m2. Total oil volume= 164.4 m3.
Wednesday 1st February 1995, 14:53 CONHYD Compuscript- 382 (ch098) adm Typeset from disc

G.S.
5.0
4.5
4.0
M' ' 3.5 0
~ 3.0 ~ 1i
2.5 ::: B 6
2.0
~ 1.5 a:
1.0
0.5
0.0 0
Cooper, Jr. et al./ Journal ofConraminantl{ydrology 00 (1995) 000-000 15
50
/. Best Stepwise / Pumping Strategy
Best Steady~ Pumping Strategy
100 150 200 . 250 nme (days)
300
I-+- 105;147;205 m3/day __.,._ 168m3/day
350 400
Fig. 9. Oil-water cuts vs. time {360 days) for best stepwise and best steady pumping strategies.
"' .s ~
"' E 0 0 > 0
74
Best Steady
168 210 55,77 73,103, &107 &143
Water Pumping Rates (m3/day)
- Recovered Oil BiJ Residual Oil llll!ll!il Free Oil
Bast Ster:mise
105,147, &205
"' E 0 0 > 0 c "' t' "' CL
Fig. 10. Total oil volumes after oil recovery (360 days) for selected steady and stepwise pumping strategies.
Wednesday 1st February 1995, 14:53 CONHYD Compuscript- 382 (ch098) adm Typeset from disc

16 G.S. Cooper. Jr. et a/. / Jourr..al of Cor.tamir~=:: Hydro;~··gy 00 (1995) 000-000
100
80
M
.§.
"' E 60 ~
0 > 6 D l" 4
"' > 0 0
"' a:
60
i 50
Bes: Steady ~
Pum:J•ng Strategy~ -40
.· 30 / / /
z/~ Bes:Stepwise 20 . Pumpng Strategy .
/ 10
·¥C---4~o~~so~--~1T20~~160~--~200~--2~4~0~~280~·~· ~~3~2~o~~3~6~o~-.:±o;8 nme (days)
6 D
"' '" > 0 0
"' a: C' "' ~ "' a.
Fig. 11. Recovered oil volumes vs. time {360 days) for best .ttepwise i!nd best steady pumping strategies.
and oil recovery improves, free oil decreases and residnal oil increases. At higher pumping rates, stepwise pumping provides the best oil recovery and less residual oil (Fig. 10).
The difference between stepwise and steady pumping strategies can be explained by examining changes in recovered oil (Vm) and residual oil (V,.) volumes vs. time. Figs.
"' .§.
"' E => 0 > 0
" => " ·;;;
"' a:
100>,----------------------------------------------r•60
80
60
40
20
Pumping Strategy BeS1 Steady ~
~ Best Stepwise Pumping Strategy
50
40 6. o;. .g;
30 ~II C'l <O'
I! I 20 & 1
I
10
0·~--~--~---c---c--='-~~~~~~~~~-±.o 0 40 80 120 160 200 240 280 320 360 400
nme (days)
Fig. 12. Residual oil volumes vs. time {360 days) for best stepwise and best steady pumping strategies
Wednesday 1st February 1995, 14:53 CONHYD Compuscript- 382 (ch098) adm Typeset from disc
G.S. Coopa, Jr. eta(. /Journal of Contamina11t Hydrology 00 ( 1995) 000-000 17
II and 12 show time-varying changes in V, and V", respectively, for the best stepwise and best steady pumping strategies. The rate of oil recovery is initially slower for ltepwise pumping, but final free oil recovery is higher for the best stepwise strategy (Fig. II). Stepwise pumping improves oil recovery by creating less residual oil during the entire pumping period which allows for more free oil to be recovered (Fig. 12).
It is believed that stepwise pumping has better free oil recovery because: (1) the plume is captured and gradually drawn into the recovery well; (2) the proper water table gradient is maintained with stepwise pumping by compensating for decreasing free oil volume and a rising water table (oil-water interface); (3) the stepped drawdown does not create excessive residual oil due to a large cone of depression.
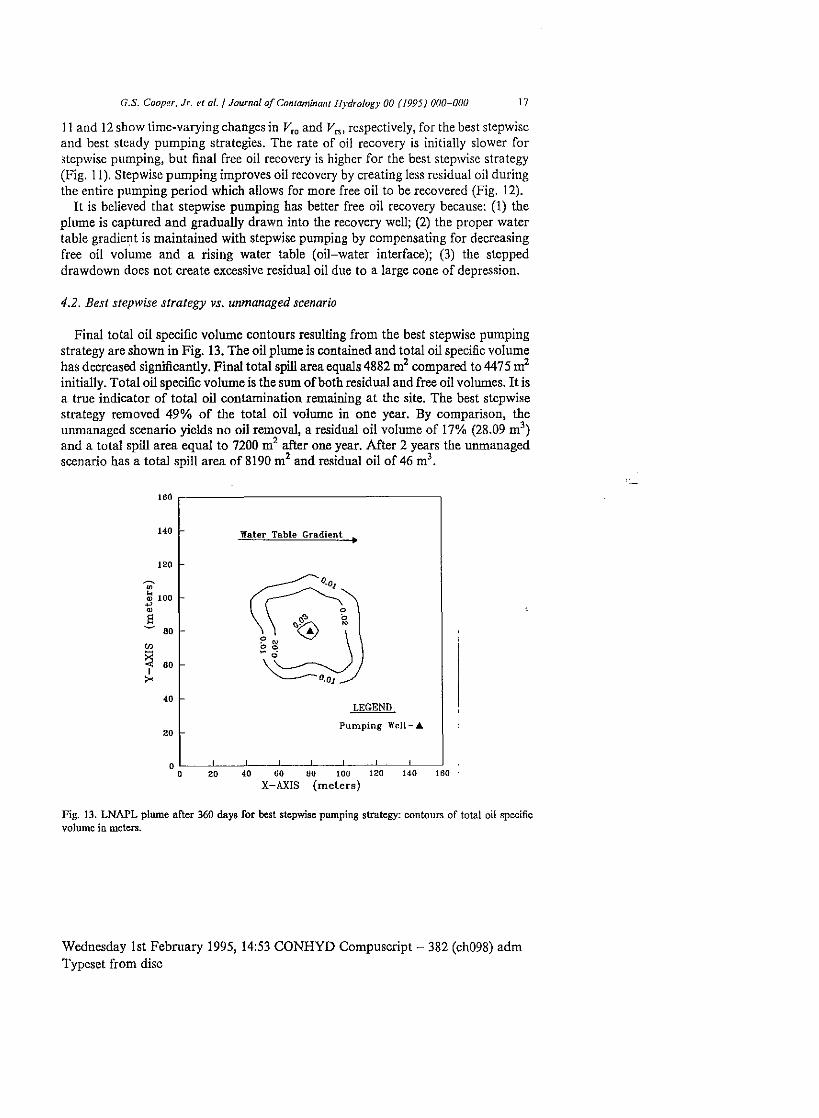
4.2. Best stepwise strategy vs. unmanaged scenario
Final total oil specific volume contours resulting from the best stepwise pumping strategy are shown in Fig. 13. The oil plume is contained and total oil specific volume has decreased significantly. Final total spill area equals 4882 m2 compared to 447 5m2
initially. Total oil specific volume is the sum of both residual and free oil volumes. It is a true indicator of total oil contamination remaining at the site. The best stepwise strategy removed 49% of the total oil volume in one year. By comparison, the unmanaged scenario yields no oil removal, a residual oil volume of 17% (28.09 m3
)
and a total spill area equal to 7200 m2 after one year. After 2 years the unmanaged scenario has a total spill area of 8190 m2 and residual oil of 46m3
•
160
140 lfaler Table Gradient
120
m
~ 100 ., ~
E 80
"' ~ 60 I
>< 40
LEGEND
20 Pumping Well- .4
oL-~L__J~~--~--~--~--~~ o 20 40 60 ao too 120 140 160
X-AXIS {meters)
Fig. 13. LNAPL plume after 360 days for best stepwise pumping strategy: contours of total oil specific volume in meters.
Wednesday 1st February 1995, 14:53 CONHYD Compuscript- 382 (ch098) adm Typeset from disc

18 G.S. Cooper. Jr. et al.f JourTUJ.l of Contaminant Hydrology 00 (1995) 000-000
5. Summary and conclusions
Increasing stepwise pumping is shown to improve free oil (LNAPL) recovery in a homogeneous, unconfined aquifer. The stepwise pumping approach involves a combined analysis of oil recovery and plume containment. The multiphase flow simulations are performed by ARMos©. Multiple linear regression equations and graphical plots are developed to analyze changes in free oil area vs. pumping rates. Steady pumping rates are determined from the analysis that achieve containment of a floating oil plume for different containment times. These pnmping rates are used as a monotonically, increasing stepwise pnmping strategy from which additional stepwise pumping strategies are developed.
A comparison between stepwise vs. steady pumping strategies shows that stepwise pumping provides the highest oil recovery and less residnal oil for a specified planning period. Less residual oil is left subsurface by controlling drawdown through timevarying pumping. This stepwise pumping approach can improve free oil recovery and provide for cost-effective design and management of LNAPL remediation.
The proposed modeling approach should he applicable to other free oil recovery problems. Subsurface heterogeneous conditions should always he considered in the applying the approach to other problems. Notwithstanding, it is believed that the fundamental approach developed herein will demonstrate its effectiveness in applications with varying hydrogeologic conditions.
Acknowledgements
This work was supported by a USDA National Needs Graduate Fellowship in Water Science and Engineering, a U.S. Geological Survey 104-03 research project, "Decision Support System for Optimal Remediation of Hydrocarbon Contaminated Aquifers" and the Utah Agricultural Experiment Station Gournal paper No. 0000).
References
Abriola, L. and Pinder, G.F., 1985. Amultiphaseapproach to the modeling of porous media contamination by organic compounds. Water Resour. Res., 21: 11-18.
Cooper, G.S., 1994. Optimal containment and recovery of light hydrocarbons in contaminated unconfined aquifers. Ph.D. Dissertatio~ Department of Biological and Irrigation Engineering, Utah State University, Logan, UT, 120 pp.
de Albuquerque, J.S., Hopkins, H.H., Sale, T.C., Glass, J.P., Zannos. J.A., Kremesec, V J. and Hockman, B., 1993. An overview of pump and treat: thepetroleumindustryperspective. Proc. Symp. on Petroleum Hydrocarbons and Organic Chemicals in Ground Water: Preventio~ Detectio~ and RestoratioD:,. Natl.:.Ground Water Assoc.-Am. Pet. Inst., Nov. 10-12, 1993, Housto~ TX, pp. 253-270.
ES&T (Environmental Systems & Technologies, Inc.), 1991. ARMOS User's Guide Version 3.0. Environ. Systems & Technol, Inc., Blacksburg, VA.
Falta, R.W. and Javandel, I., 1987. A numerical method for multiphase multicomponent contaminant transport in groundwater systems. Eos (Trans. Am. Geophys. Union), 68(44): 1284 (abstract).
Faust, C.R., 1985. Transport of immiscible fluids within and below the unsaturated zone: A numerical model. Water Resour. Res., 21: 587-596.
Wednesday 1st February 1995, 14:53 CONHYD Compuscript- 382 (ch098) a elm Typeset from disc
t .l ~ ~ I'I_J'"AI 4.? ~ ~~ tJWl -~ !?d ~fl ~~/~~Mk ~MJU~

G.S. Cooper, Jr. et al.f Journal ofComwnitlanC Hydrology 00 (/995) 000-000 !9
Gangadharan, A. C., !988. Leak Prevention and Corrective Action Technology for Underground Storage Tanks. Noyes Data Corp., Park Ridge, NJ, 1st eel.
Huyakom, P.S. and Pinder, G.F., 1978. New finite element technique for the solution of two-phase flow through porous media. Adv. Wate~ No. I, pp. 285-298.
Johnson, P.C., Kemblowski, M.K. and Colthart, J.D., 1990. Quantitative analysis for the cleanup of hydrocarbon contaminated soils by in-situ soil venting. Ground Water, 28(3): 1-29.
Kaluarachchi, J.J. and Parker, J.C., 1989. An efficient finite element method for modeling multi phase flow. Water Resour. Res., 25(1): 43-54.
Kaluarachchi, J.J. and Parker, J.C., 1990. Modeling multicomponent organic chemical transport in threefluid-phase porous media. J. Contam. Hydro!., 5: 349-374.
Kaluarachchi, J.J. and Parker, J.C., 1992. Multiphase flow in porous media with a simplified model for oil entrapment. Transport Porous Media, 7: 1-14.
Kaluarachchi, J.J., Parker, J.C. and Lenhard, R.J., 1990. A numerical model for areal migration of water and light hydrocarbon in unconfined aquifers. Adv. Water:=:::;::.
( Resour, 13(1): 29=40. 1t~7ppu'Samy, T.J., Sheng, J.J., Parker, J.C. and Lenhard, R.J., 1987. Finite element analysis ofmultiphase
immiscible flow through soils. Water Resour. Res., 23: 625-631. Osborne, M. and Sykes, J., 1986. Numerical modeling of immiscible organic transport at the Hyde Park
landfill. Water Resour. Res., 22(1): 25-33. Parker, J.C. and Lenhard, R.J., 1989. Vertical integration of three phase flow equations for analysis of light
hydrocarbon plume movement. Transport Porous Media, 5: 187-206. Parker, J.C., Kaluarachchi, JJ., Kremesec, V.J. and Hockman, E.L.,1990. Modeling free product recovery
at hydrocarbon spill sites. Proc. Symp. on Petroleum Hydrocarbons and Organic Chemicals in Ground Water: Prevention. Detection, and Restoration, Natl. Ground Water Assoc.-Am. Pet. Inst., Houston, TX, Oct. 31-Nov. 2, 1990, Houston, TX, 4: 641-655.
Parker, J.C., Zhu, J.L., Johnson, T.G., Kremesec, V J. and Hockman. E.L., 1994. Modeling free product migration and recovery at hydrocarbon spill sites. Ground Water, 32(1): 119-128.
Peralta, R.C. and Kowalski, K.G., 1986 .. Optimizing_the rapid_ evolution _of_ target__ groundwater·potentiometric surfaces. Trans. Am. Soc. Agric. Eng., 29(4): 940-947.
Wednesday 1st February 1995, 14:53 CONHYD Compuscript- 382 (ch098) adm Typeset from disc
~I
? ,