t ed 137 560 - eric · t. ed 137 560. ce 01. author white, estelle e.; boone, edgar 3. title...
TRANSCRIPT

DOCUMENT RESUME-t
ED 137 560 CE 01
AUTHOR White, Estelle E.; Boone, Edgar 3.TITLE Decision-Making and Communication Patterns of
Disadvantaged Farm Families in the North CarolinaCoastal Plains Area. Technical Bulletin No. 245.
INSTITUTIOU North Carolina State Univ., Raleigh. Dept. of Adultand Community Coll. \Education.
SPONS AGENCY Worth Carolina State Agricultural Extension Service,Raleigh.; North Carolina State Duiv., Raleigh.Agricultural Experiment StatiOn.
PUB DATE Dec 76NOTE 186p.; Not available in hard copy due to small print
throughout original
EDRS PRICE MF-$0.83 Plus Postage. MC Not Available from-HDRS.DESCRIPTORS Behavior Patterns; *Communication Thought Tran\sfe
*Decision Making; *Disadvantaged Greups; *FamilCharacteristics; Interpersonal 2elationship; MaMedia; Media Research; Rural Familv;"*Rural FarResidents; Sociocultural Patterns; Serveys
IDENTIFIERS *North Carolina
'ABSTRACT,
To determine the decisionMaking and communicationpatterns of disadvantaged-farm_families_ lair) and=the linkage betIceeninterpersonal sources of information used by them and researchLPasedinformation sourcesg a pilot study was conducted with the following
Ifocus questions:/ (1) Exo are North Carolina's DFFand- what are,their,characteristics? (2) What kirAs of,Tarm and home decisions are'DFPmaking and how rational are the processes utilizedby them in Makingthese dealsions? (3) What.communication media are available to Dir,the major sources utilized by them in making.farm and home decisiens,and what credibility they assign to these sources7 (4) What/is thoi\degree of linkar between interpersonal information sources, used, byDFF in making f rm and home decisions'and research-based iprmationsources? and (5) What is the relationship between selectesociopsychologiCal variables and the degree/of rationality/indecisionmaking;\the availability, usage, and credibility of media,(i.e., interpersenal, mass, publications); and the degree i3f linkagebetween interperional information sources used and research-basedinformation souies. The population was drawn from DFF reiding inthree northeaste7 North Carolina\counties-land was screenid to obtaina sample that mei the criteria for income,isize of farm, and faMily.A research instrument was constructed, and'data gathered by interviewteams were analyzed through the,use of several statistica
i
procedures. The rePort includes (1) summari, implications andrecommendations; (2) technical report (background, method logy, andresults); (3) list Of references and glossary; and (4) ap endixes,which contain reseach questionnaires, categories and defanitions ofDFF decisions and additional data. (WL)
Documents acquired by ERIC include many informal unpublished materials not available from ther sources. ERIC makes everyeffort to obtain the best co0 available. Neverdifless, items of marginal reproducibility, are often ,Ocountered and this affects thequality of 1, the microfiche and hardcopy reproductions ERIC makes avaable via the ERIC Document Reproduction Service (EDRS).EDRS is not responsible for the quality of the ori ' al document. Reproductic)ns supplied by EDRS are the best that can be blade from
A

,Tech. Boh Np. *45-
ION-MAKING ATIQN P
'§ADVANTA'IMES IN THE NoOLINA COASTAL
AREA
NDTTERNS
ARM
PL
Associate Pri..)fessor of Adult and Community College Educa ion,North Carolina State Univerfaity ot R.aleigh
Edgar .1. BoonProfessor and Head of Adult and Commun ty ColNorth Carolina State University at Raleigh
North Carolina Agrièul
dueation,
U.S. OEPART -NT OF HEALTH,.
EDUCATION WELFARENATIONAL INSTITUTE OF
EDuCATiON
THIS -DOCUMENT-HAS BEEN ._REPRO.OUC ED EXACTLLY A$ RECEIVED FROMTHE PERSON OR ORGANIZATION ORIGIN.ATING IT_ POINTS OF VIEW OR OPINIONS1TATED DO NOT NECESSARILY REPRE.SENT OFFICIAL NATIONAL INSTITUTE OF -EDUCATION PO$ITION OR POLICY.
ml Experiment Station
2

PREFACE
In the spring of 1971, the Agricultural Experiment Statibn at North Caro-lina State University, Raleigh, unproved a research proposal entitled"Decision-Making and Communication Patterns of Disadvantaged FarmFamilies in the North Carolina Coastal Plains Area." The yesearch is a co-operative arrangement between the North Carolina Agricultural ExperimentStation, the North Carolina Agricultural Extension Service, and the Depart-ment of Adult and Community College Education. To date, four doctoraldissertations have been completed focusing-on various aspects of the largerresearch project. The major purpose of ,this technical bulletin is to bringtogether in one publication the major findings and ilinplications of the totalresearch project (No. 13325) and make recommendations for further research.
This study _is a pilot effort as no- other study to our knowledge haspreviously been conducted to determine the decision-making and communica-tion patterns of disadvantaged farm families (DFF) and the linkage betweeninterpersonal sourcei of information used by/ them and research-basedinforMation sources. The present document 5feseries such a study andinterprets its findings. ,1
The major focus of this _y_esearch was to determine: (I) who are NorthCarolina's DFF and what are their- characteristics; (2) what kinds of farmand home decisions are DFF making and how rational are the processesutilized by them in making these decisions; (3) what communication mediaare available to DFF, the major sotirces utilized by them in making farrn andhome deeisions, and what credibility they assign to these_sources: (4)
:-what is the degree of linkage between interpersonal information sources usedby DFF.in making farm and home decisions and research-based informationsources; and (5) what is the relationship between selected socicipsychologicalvariables and the (a) degree of rationality in deeision-maldng,,(b) availability;usag,,, and credibility of media (i.e., interpersonal,- mass, publications),
ancl.---(6)-degres- oftinkake-betweeninterpersonal information doureerasa andresearch-based information sources. Involving -130 DFF (130 farm operatorsand 130 homemakers) in three northeastern North Carolina counties (Bertie,Halifax, arid Northainpton), this report. documents DFF's degree of ration-ality ln,.decision-making, communication patternsf and degree of linkage-between sources of information used and research-based information sources.
The report consists of three parts. BART I presents a Summaryejmpti-cations, and Recommendations. The general purpose of this section is tosummarize succinctly for the reader the major findings of the study. It focuseaon: (1) the purposes of the research, .(2) an interpretive summary -and dis-cussion of results,-(3) conclusions and implications, and (4) recommendationsfor further research.
FART= II,. Tichnical Report,.presents a detailed description of the stuely!,-e---design and a presentation and interpretation of study findings.
PART List of References and Glossary, includes: (1) the major refer-- ences employed in designing, implementing, and evaluating the research
study and (2) definitions of important terminology bmployed throughout thereport for use by analytical readers. The terms defined are arranged alpha-betically to facilitate easli reference bythe reader,
The researchers trust that the findings of this study prove to be helpful to

educational organizations miding. and evaluatiug future profamily.
NCSURaleighMay 1976
cies flit ioflwj&k , -thinning. implement-that qiii-iadvantaged farm
Estell E. NrhitePloject Leader

ACKNOWLEDGE ENTS
- The Department of Adult arid Community College Education and theauthors P.ratefully acknowledge the financial support and cooperation pro-Med for the conduct of this research by the North Carolina AgriculturalExperiment Station and the North Carolina Agricultural Extension Service.The continued nterest and support exhibited by these two organizations inrural de5..elo-pment research made =this technical bulletin possible.
Many people at the state, district, and county levels-vvere =involved over anextended period df time in conducting this study.lt is inipossible to identifyall those who contributed toward the realization of the finaV,research report.However, special thanks are extended to the North Carolina AgriculturalStabilization and Conservation Service and the North Carolh;ti Departmentof Social Services for their assistance in selecting the population for thisresearch.
Appreciation is also expressed to the research assistants, SolomonHuddlOston, Warren Gwynn Mitchell, and Benjamin Harrison V4ddle, Jr.,who contributed many hours of their time in the early.stages of the) researchproject and for their contribution to the ioterviewing and data collectionstages.
A special word of gratitude is extended to Rex Clay, post-doctoral studentin the Department of Adult and Community College Education, for hisassistance in the preparation of this report. His contributions to the finaiversion were of infinite value:
Special appreciation is also expressed to Robert J. Monroe for his effortsin assisting -with the processing and analysis of the data. For his time,patience, and able guidance devoted to establishing statistical treatmentsrelevant to this research and his review of the final draft of thiS report, theresearchers are most appreciative.
A special word of thanks is extended td all state Extension personnel,------i.eassistant-directorarstate-agents-,--district-personneli-subjece.mattr-spe--
cialists. county Extension agents, and professors in the Department of Adultand Community College Education, who participated in collecting the datafor this study la addition, appreciation is express'ed to the 130 farm operatorsand 130 'homemakers in Bertie, Halifair, and Northampton counties whofreely gave of their time in resporidi0=.to queitiOns'rilfrtalking---with_theiriterviewer- teams. The authors trust -that the findings are accurately =re-fleeted and that they -will=prove_to be helpful to educational organizationsand agencies in achies.ing thebasie-PurPoses_undergirding this research.-
To the Halifax County Technical-Institatei--Weldon, arid,its President, Phillip W. Taylot,-- special apprediation-is -expressed= for provid-ing space, equipment, and facilities for training the ,interviewers and servingas headquarters for them during the data collection phase.
A word of gratitude is extended to the reviewers of this manuscript whowere so helpful in providing objective ideas, comments, and review's, namely:Professors T. C. Blalock, George Hyatt, Jr., C. Paul Marsh, R. J., Monroe,and J. C. Williamson, Jr.
Acknowledgements are extended to Donnan 1, Robbins and Adele P.Covington for their protessional tyliing and edhing service rendered through-
. out the research study. Special appreciation goes to Mrs. Robbins for her
V

interest in and contributioñ to the preparation of the final draft.Finally. acknowledgement must a so be made to a great number ,of people
unknown to the directors of this researci., as many people contributed insome way to the developrnent an I completiOn of the !L1 irch study. To allthese the researchers extend appreciations.

PREFACE
CONTENTSPage
iii
A :K1rWLEDGEMENTS,LISSOF TABLES ix
LIST OF FIGURES xi
PART I. SUMMARY, IMPLICATIONS, AND RECOMMENDATIONS .
A. Purpose and Perspective . . . . . .. .
B. Interpretive Summary and DiScussion= of Results ...Characteristics of Disadvantaged Farm Families ....... .
2. Kinds of Decisions Made by Disadvantaged Farm Families .-3. Rationality of Decision-Making4. Availability. Usage. and Cmidibility of Media and Information
Sources in Those Media5. Linkkige Between Interpersonal Information Sourees Used
by Disadvantaged Farm Families in Making Decisions andReseakh-Based Information Sources ................ ... . 4
6. Relationships of Selected Sociopsychological Variables toDegree of Rationality in Decision-Making; Availability,Usage, and Credibility of Media; and Degree of LinkageBetween Interpersonal Information Sources Used andResearch-Baied Information Sources
3
C. Conclusions and Implications ...... . . . ...... 6
D. Recommendations for Further Research 10
PART IL, TECHNICAL REPORT 12
A..-13-itai-erouffd---61: the btU-d-y
1. The Rural Poor SubcultufeA Commitment . . . . . . . 2 122. Nrposes and Objectives of the Project .......... . . . . 14
3. Conceptual Framework 15
The ConcePt of Poverty 15
The Nature of Poverty in the United StatesThe Relitionship Between the Larger Society and the
Disadvantaged : . . .. 17Characteristics of the Disadvaniaged ... . ....... . . . . . 19
Social Characteristics . . . . , . 20.Psychological-Characteristics
. Political Characteristics 24Economic Characteristics 25
The Concept of Decision-Making 28The Concept of Communication .. . . . . 31The Concept of Linkage . ...... . . . . . . . 35,
7

1. Research Desiwn2. Identifying- the Disadvantaged Area3_ Population and Sample4. Desig-ning the Researeh Instr-ument5. Data Collection6. Data Analysis7. Limitations
38for Study 36
4144495052
C. Results
Who Are the Diail antagel Farm Families and \VIII it AreTheir Charaeterktics? 3
2. Kifids of Farm and Home Decisions Made by DisadvantagedFarin Families ,
3. Rationality Of Decision-Making4. Availability, Usao_ and Credibility of
Media/Information Sources 615, Degree of Linkage Between Interpersonal Information
Sources Used by -Disadvantageil Farm Families in MakingDecisiorls and Research-Based/Information Sources 78
6. The Relationships of Selected Sociopsychological Variables toDegree of Rationality in DecisW-Making; Availability,Usage, and Credibility of Mediii; and Degree of LinkageBetween Interpersonal infor-mation Sources Used andResearch-Based Information Sources .... ......... _
FART III- LIST .OF REFERENCES AND GLOSSARA
A. List of ReferencesB. Glossary 102
APPENDICES 105
Appendix A: Reareh Questionnaires 106.Apprtuilx_13:- Kinds of Decisions Made IT Disadvantaged Fru
`FarailiesCategories and Definitions 161Appe i indx C: RatonalitY 'of Decision-Making--
Additional Data . . .. . ....... ... .170Appendix Linkage Patterns .. . . . . .....

LIST OF TABLES
1. reequency distribution of social characteristics of the disadvantagin the USA by selected individual characteristics, 1973
2. Frequency distribution of social characteristics o advantagedin the USA by selected family characteristics, 22
_...----
3. Frequency distribution of econornive<racteristicS. of thedisadvantaged in the USAby5iiected individual and familycharacteristics, 1973 __---- --26
4. Dstribuj.ionfrespondent disadvantaged farm families, by county 43
Judges' agreement with research team's categorization of samplefarm and home decisions 46
6. Frequency distribution of social characteristics of disadvantagedfarrn operators. and homemakers 54
7. Frequency distribution of psychological characteristics ofdisadvantaged farm operators and homemak -s 55
S. Frequency distribution of political characteristics of disadvantagedfarm operators and homemakers 55
9. Frequency distribuiion of socioeconoMic characteristics ofdisadvantaged farm families . . ..... 56
10. Frequency distribution of major farm and home decisions reported .by disadvantaged farm families ... . ..... ...........
_
Frequency distribution of rationality of decision-making scores for=farm_ operators and homemakers 61
12. Combinations of media used by farm operators and homemakers- inmaking a major decision ... . . ... . . . . . . 65
The degree of linkage between research-based inforination sourcesand those interpersonal sources used by disadvantaged farmfamilies as a, basis for making farm or home decisions . . ... ...
14. Frequency distribution of disadvantaged farm operators andtheir interpersonal information sources by selected chatacteri . 82
15. Chi-square tests for significant differences between selectedcharacteristics of disadvantaged farm operators and theirstage A interpersonal source of information . . . ..... . .
16. Chi-square tests for significant differences between selectedcharacteristics of disadvantaged farm operators stage A, B,and C interpersonal information sources 84
17. Frequency distribution of disadvantaged homemakers and theirinterpersonal information sources by selected characteristics 85

18._Chi-sciaari1ts for significant differences between selectedcharacteristics of disadvantagol homemakers and their stage Ainterpersonal source of information 86
19. Chi-square-testg-ar significant differences between selected-,i-----chifracteristics of disadvantaged homemakers' stage A, B.
and C interpersonal information sources
20._Frequency distribution of interpersonal farm informationdied by-disadvantaged farrif Opel attirs ccording to._selectsocioeconomic characteristics
Frequeric 2.. distribution of interpersonal IMme information socited by disadvantaged homemakersaccording to selectedsocioeconomic characteristics 90
22. The amount of variance in rationality of decision-making-amongdisadvantaged fm7n hmilies explained h the selected independentvariables 92
Relationship between Selected variables and the variability inrationality of _decision-making for farm 6perators and honwthakers 99
23. Chi-square tests for significant Mationships hetween selectedsociopsychological variables and media availabil ity 93
ChiSquare tests for significant relationships between selectedsociopsychological variables- and media usage.----- 95
26, Chi-square tests for sigTifictint relat4shipsbetween selectedsociopsychological variables and Med a credibility 97
0-_1. Mean values by degree of linkage,b elected soutps\ choloLiralvariables
1 0

LIST OF F GURESPage
chema for con e I ualizi lig the iidvantagcil farm family IS
2. Schema illustrating- the interactiim between economic, psychol icalsocial, and pont-teal characterist ics 19,.
37-1---Schefriafic representation of the decision-making prncess and_ _factors related to OFF's degree of rationality in making
farmThome decisin
An adaptat(19711 corn
29
1 of Rerlo (1960) and Rogers and Shoemakersinicat ion models 33
Diagram illust rating the difficulties involved in croits-culturafcommunication
6. Schematic diagram of possible linkage between a research-basedinformation source and the disailvantaged farm family
7. North Carolina counties eligible for participation in the NorthCar-olina Economic Development Act, July 14. 1971
Location of North Carolina colimties included in the -study 42
Rationality of decision-ma kingsco _for both far operatorsand homemakers
Availability of media mu infurrnat ion aoui es to disadvantagedfarm nimi ies
11. Usage of interpersonal, mass, and publications media and of theinformation sources in those media (farm operatnrs) 63
12. Usage of interpersonal, mass, and publications media and of theinformation sources in thuse media (homemakevs) 64
Credilrility of the interpersonal, mass, and publications mediamid of the informatioti sources in those =di:: (nirm open:tors) 67
14, Credibikity of the interpersonal, mass, amt puldientions media andof the information'sources in thoAe media-(homemakers)-
\,
15 Schematic diagram illustrating a procedure change agents mayutilize in selecting media/informal ion sour-ces as channels forllissemimaing informiu ion to OFF or intervening to effectchange in their decision-making patterns .
\Profiles of the'interpersopal, mass, and puldications media byavailabili\ty, usage; and credibility (farm operators) , 70
69
17. Profiles rif the interpersonal, mass, and publicat4s media byavailability, usage, and redibility.(hornernakersj 71
Profiles of the information sources in the mass media by availability,usage. and credibility (farm o)erators) 72

1 Profiles of the information sources in the mass -_ dia _by availability.usage, and credibility (homemakcra)
20 Profiles of the information sources in the publicaticals media byavailability, usage, "and credibility (farm operators) 74
75
22. Pr- files of the information sources in the interpersonal media by-usa, ind credibility (farm opehitors) 76
23. of the information sources in the interpersonal media byuge and credibility (homemakers) =
77
24. Schematic diagram illustrating the procedure used to deterMinedegree of linkage between interpersonal information sources citedby disadvantaged farm operators/homemakers and research.Liaised sourCes . .......
21. Profile of the information sourcesin the publications media bvavailability, usage, and credibility (homemakers) -
1 2
xii

SUMMARY, IMPUCATIONS, ANDRECOMMENDATIONS1
A.- PURPOSE_Als1D_PERSPECTIVE-.The purpose of the study was to obtain information. that would help North
Carolina educational organizations and agencies (E0A) acquire addedinsights about disabiantaged farm familiea (bFF), and hence improve_theireffectiveness in designing educational programa-for those familigs. Inform-tio considered , essential in serving the educational needs of DFF waside dried and couChed in the context of six research questions that becamethe focus of the study: ,
1 Who are North Carolina's DFF and what are their characteristics?2. -What kinds of-major farm and home deaisions are DFF making? ,3.1 How rational are the/decision-maldng processes utilized by. DFF in
making these decisions? '-
4. What communication media-are available to DFF? What are the-Major,- -sources of, information utilized_by-DFF in making farm and home decisions?
What credibility do DFF assign to their information sources?= 5., What is the degree \of linkage between interp'ersonal infermation sourcesused bY DFF in making farm and home' decisions ,and research-based information
6. What is the relationship between selected-sociopsychological -variablesand the: (a) degree of ilitionality in decision-making; (b) availability, usage;and credibility of media (i.a., interpersonal, mass,' publications) and the infor-'.mation, sources within those media; and (c) degree of linkage between-inter '
personal information f4ources tied by DFF and research-based informationsources? -'
A Systematic, scientific selection method was used .to identify the target'population for this research. That population consisted of DFF .residing inthree northeastern North Carolina counties (Bertie, Halifax, .and North-arnpton). A reaearch instram6nt was conatructed speCifically for this itudy,and .a sample of the population was drawn. The population was screened toobtain a sample that met the criteria for income, size of farm, and family(man and Wife domicil ther). Data gatheieal by interview teams were-
. analyzed thiough the use of several statistical procedures.
_ TERPRETIVE SUMMARY AND DISCUSSIONOF RESULT'S
Characteriotica of Disadvantaeed Farm FamilleaData collected Tegarding characteristics cf DFF yielded information on both_ -
the individual farlii operator and the-Corresponding homemaker, and on familyunits; In some instances data were obtained thMtigh queitions that requirefla simple "yes" Or- ario" answer from the respondent. In other instances scales
I gee putpe 12. Pert 11. TeehnkAl Report for e detalied dieeue n. of suppoi.Sununexy. Implientfons, and Renornreendatione."

wereonstructed4 I easure iaNes. Due to the homogeneity of the' popu-lation, the frequency disti ibution md scores (where scales were employed)
'shoWed little vf.tiation. The screening procedure yielded- a population that- .
was 'Uniform in/ lterms of Siz of -farming operation and incoMe. The findingsi
e. .. tindicated that; the population was strikinglp uniform in social, 'psychological. --
--. --anct-pOlitical-tharacteristics,,as-well-,--------------;-----------=-----------------7________-- Z---Seemingly, those findings indicated that the poor (as argued in the con- '
ceptual framework) share common characteriStics that set them apan,'culture of poverty.
Thg characteristics of the individual farm operators and homemakers in'this study were subsumed ,under..th-ree categories: ,social, psychological and
:political. The data revealed that ,the study's Population was: (1) an olderpopulation with low _levels of formal educational attainment, (2) eithe'r work-ing full time on the farm or keeping,house- full- time, (3) characterized as non-
' participants in organizations,- (4) highlY immobile, (5) moderately to highlyanomie, and (6) pblifically. naive (althoUgh they did -vote). Contrary to the .
theoretical literature, the disadvantaged individuals in this study could notbe, characterized' as either/piesent or future --value-orienteth The findings-indie.ate no clear-cut/tendency toward 'either a present or a future value
) /1orientation. /
Data 'regarding family units were Collapsed into a single categorylabeled"socioeconomie," Uging the data in that category, the DFF unit- was char-acterized as blac/, with a total annual income of less than $6000, in poorh-eulth-andereiving-Tioar-health-carel-The-family--was.:-of-the-nuclear-type--
/averaging 5.? Members, and had .v-iiirios,typep of tenure prrarigements that,
' were consummated' 1,1-t least Hdor mol'e years previous to the time of thisstudy.
A final socioedonoMic measurement used to chardcterize the DFF was aily living (or leyelf-lhring) index. Scores op the index indicated the
extent to which DFF had, acquired such basic amenities of life as automobiles,washing machinei,1TV's and air 'conditioners. Scores on the index weresurprisingly higher than those anticipated. However it was only when thescores of the,disadvantaged, were gonsidered in isolation that they appearedhigh: This study speculated Oat iif -the_ scores of DFF were compared tonorms of the general population, ales- probably would be relatively low. Stjll,the-family living indexindicated that DFF in this _study maintained an,.endurable level of 10.-ing. A Possible contributor to that level of living was theMoViiiion df food stamps and other social service benefits that supplementedthe DFF's resources. i
2. Kinds pf Deci ions' Made hy Dis.advantaged Farm FainiliesThis study sought to ideutify the kinOs of deciSinns- typicallY made by I11 F,
to group thozd decisions into distinct categories, and te define those categories.The DFF respondents engaged in a broad range of farm and home decisions.
'The study assumed:that the'breadth -.of decisions confronting'the DFF wasgreater than commonly believed and, indeed, may be possibly n.co parableto -the .r.ange .of decisions confronting middle-class ?arm families. wo cate-gories wiire employed-to classify decisions: farmcapital investm ni; farmmanage ient,,financial,,leasing arrangeinents, production and marke ing, and"other /oi miscellaneous: and homeclothing, health, home furnishings,home thttnagemeui t, housir g. nutrition, and "other" or miscellaneous:
,
The' largesLnumber _of farm decisiona were grouped intOtel.producttpn-andr,rketing (33 percent) and farm management (32 percer4) qtegories: Indition, the respondents were involved in many other finaleial,,leasingandi al Mvestment decisions. In. general, the nature of the decisions in\all
decision categories requrred considerable technical knowledge and the--ability to -think- logicallyT
As for home decisions, 85 p reent of the ,major deci'sions';'homemakers reported having made were rel ted to home , furnishings, home management,
. and housing. Few major deci ions of the homemakers related to- clothing,family health, and nutrition., As with( farm decisions, home decisions ingeneral deManded that homemakers have specialized technical, lonowledge'and skills in Various areas.
Rationality of Dedision.MakingThis stud) Was designed to determine if I IFF engag-ed in a rational decision-
-Making process.' Such 'a determination would dictate the nature of educe--tional organizations and agenCies' (EPA) intervention in the lives' of -DFF.If the disadvantaged poptilatibn of this stJdy_ were not rational in theirdecision-Making procesa; it wouId be inadVisable/for'EPA to conduct.-uca-tion prog-rama for .such DFF and to dissereiriate information and advice tothem. Rather,snore direct forms Of assistance;:such as welfare benefits, wouldbe indicated., If, however, iti was..fotind .that DFF were ratiOnal 'in theirdecision.making, the reverse would apply..'
Ratidnality of decision-making (RDM) was defineA in this itildy as con-forndty to an -ideal process consisting of, five .srubprocesses. When RDMscoreswere calculated, farm operators and; homemakers scored quite high,
indicating that the:decision-making process in Which they Were engaged wasextremely rational. A' question arises, however, as to whether those highscot-es resajted from the research instrument used to collect the data. At firstglanceone wouktIlassume that the instrument was not-sufficiently sensitive-to-diatingUish variations among the population. However, this-studycontends,that the instrument Validly reflected the-RDM of the respondents. 'Due to the
_ -
s`c re en ing-process used, 'the population studied was homogenous. That home-geneity was reflecte¬-only in the_lack of variatibn in the RDM scale, but
all of the other scales as ,well.-
Availability; Usake; and Credibility of Media andthe Information Sources in ThoseMedia ,
For EPA to intervene in the lives of DFF throUgh-_information disseminationand educational .prog-rams, effective eommunication is vital. This study con7tended that !determinants of --an effective --edminunication ,charinel are itsavailability, the extent to which it iS Used, and its credibility as perceived bytheUsers..To investigate the_availability, usage, and credibility .of eariununi-Catioh channels, three mediaxategories were identifiedinterpersonal, mass,-.and publications.:.-The information sources in those media .were -labeled. as:interP artionalagents. church, dealers, and family-friends-neighbors; massneWsp pers, radio, and -TV;. publicationbulletinspamphlets. the Farmer'sAimaniac; and m'agazines.
Tbi_studjr ,ibund that interperSonal media was used extensively and 'Wasperceived by'sespondents as highly credible (there were no !availability

,
. -measurement's for the -interpersonal media or-the information sources inWith regard to information sources in the interpersonal media, agents3 andfamily-friends-neighbors (in relation to -other- information-- sources in theinterpersonaI media) ranked high.in usage and credibility, whereas the churchranked low in usage and Credibility. Dealers ranked in the medium-low range
credibility-.3The Publications- inedia'ranked low in availabilify-,--usage, and credibility.,
In relation to other informatien sources in the publieations media, bulletins-Pamphlet& ranked high in availability fairly high in usage, and low incredibility. The Farmer'i Althanac ranked high' in availability..and usage
'among both farm operators and homemakers. Farm operators perceived theAlmanac as highly, credible,-but homernOcers ranked it in the middle crecli-bihty range Magazin-ea ranked in a,rniddle range in availability- and -high o
.in usage. Farm operators ranked magazines in the medium-credibility; eate-gory; homemakers ranked them high-in credibility,
Linkage Between Interpersonak Information Sources-Used byDisadvantaged. Farm Families in ,Makinit Decisions and Re-search.Based Information Sourcew .
,
This study had three specific-concerns regarding linkage between,interper-on-al and retearch-based inforrnatiq sources.; It, determined:. (I) the extent - =
Q Which DFF were removed from research7based sources of information,2)- the`trend-toWird heteroPhily in comparing DFF with their direct interz.-----
.personal sources of infIrmation,-.and (3) the characteristics of persons who--6hanz;-eled intorrnati6 to DFF s-
The extent to which DFF were removed -from research-based sources ofinformation wai established in one of three categories, i.e.. "closely linked,"
."distantly linked," and '`not linked.'" _Thirty-eight percent of the farm deci-sions- trac&I were 'closely linked to a research-based information source, 34.5
,percent were distantly linked, and 27.5 percent were not linked, Lileewise, 39it-Cent of the home decisions were closely linked, 17 percent were distantly
44.,percent were not linfied. Thug, about two-thirds of both farm, and home decisions-were eitherl,distantly linked or pot linked to a research!
;,-based information source.Theilecend spePific concern-of the research on linkage between' ihformatidn
sources :was- the :determination of- whether D-PF were =beterephilic to theirinformation; sources. It was found that a heterophilic relationship existed;i.e., DFF were sighificantly different from their infOrmation spurce A relativeto age, education; ethnic background, inceme, present/future value orienta-tion, and ;social Participation. However;-; information sources A, 'n, and Cwri,rehoMophilic to each ether and were considered to be opinion leaders.4
The final`,concern of the research on linkage Was to deterrnine the charac-
3 See page 102 for definithm of agents.-3 It should be kept in mind that the credibility renking was relative; Le., respondents werepresented with several media/information soure s and asked to NelQCt the one they believedto be the most credible. Most of the respondents perceived either agents or family-friends- ,neighbors as thi single most credible information source..Thus. the results indicate that thechurch lacked 'credibility with OFF, only in relation to'agentsitAd family.friends-neighbors.The Fesults do-not mean that the church was not believed.4 See Glossary. page 104 '. for definition of mairces A, H an I C and page HO for an illustration
oUtheir usage in this study.

teristics of those -persons who ichanneled information to DFF. The inter-.! personal seurces involved in the flow of information to, farm oPerators in this
-study moat 'often were white farm operators or private dealers, less than 50years of age, 'having 8 or More years of education and a farm background,working full tinie off the farm for an annual income of $10,000 or morei and-havineresided in-the-tounty-for20 years or More Ttie7interpersona l-sources---involved in the flow of information to homemakers werd most often less' than
_
,- 50 yearn of age,- having 8 or more years of education rixid- a farm background,residing in the county for 20 years or more, emploYed andl aboutequally likely tohe black as white. The interpersonal Sources of informationfor honiemakers could not be characterized by either income or occupation.
6. Relationships of :Selected Sociopsychological .Variahles . toree -of Rationality in' Decision-Making; Availability,- Us-and Credibilitr. of Media_ (i.e., Interpirsonal; Masa, and
b cations); and Begree of Linkage Between InterPersonak,,,ormation Sources' Used and Regearch-Hased Inforthation
Souices-Tbe researchers suspected that certain sociopsychological variables might
be,ralatedle RUM; to availability, ezage, and Credibility of media; ancLto...degree- of linkage between information' ,sources.' Those 'variables were age, ,
aucation, pres-O-fti /future 1)411e orientation, and -Social -piirticiffaitiOn: Al-though- the study population Vi-aa quite bomegeneotis, there were sufficient' variations within the variables to test for relationships. ' I
Relationships of Selected Sociopsychological Variabka toRationality oDèctsion -Making
Multiple regression equations revealed that the foor variables combiaça--_age, level of eddeation, present/future value -orientation, and social partici-pationwere slinificantly ,related to RDM. However, the limotintif van'ability accounted for was low (6 percent for farm Operators and 10 percent forhomemakers).
When the relationship of each individual variable. to HUM was examined, _the following reaulta were obtainecl: -(1) age was not significantly related.
,the eerie of,eitlier farm operators or homemakers; rx., age, accounted forlittle variation in the RDM scores for either the farm operator or homeni(2) level of education was significantly related only imong hornemakersl. .e.,the higher the education level _of:the homemaker the .higher the RDM scorei(3)presenteuture value orientation was significantly ra)ated to REIM onlyamong hornernakers; i.e., the higher the present/fueure value orientationscore the higher.the RUM score, or the more future oriented thahomemakerthe' higher the; RUM score; and (4) social participation, was significantly ,related to RDM among farm operators; i.e., the lower the- aocial partieipationscore the lower the RUM score.
Relatioaships of Selected Sociopsychologkal Variables toAvailability, Usage, and Credibilitc of Media
Chi-square tests of significance were compiited to test the.relationships of,age, education, present/future 'value orientation, arid social participation

'V'ailibility,-nange and credibility of medi . The relationships of the fore-nnag variables .to the availability ar.cl usage orrnedia were not significant ,-
either farm operators or homemaker's. However, age wis -sign scantlY.cited to,hememakers perception of media crelibility i a, the younger the
hiiirneiraikers, the greater they perceivedJwedia credibility in decision-making;
Relation' eca Selected Sociogsgehologiral VariableeandDegree of LLikage
.Analyais of vriance was used to test for the relationships of the selectedsocioPaychological iltiables to degree of linkage bet, een information sources:No significant relationWps were found.
C. CONCLUSIONS ANsDAMPLICATIONSThe conclusions and irnp!icatkons for this study stemmed from
research questions and are yeesentedsin relation- to those questions.-
ha teristics of North Carat= bisadvantaged Farflies
a disadvantaged population in this study_ exhibited great simi aroda], psychological, political' _gnd ecoribrnic characteristics. T e
irn ication is that DFF ,constitute a eubculture of\psoverty. Because DiFshare -the same culturer-they will probably tend-to have`similar interests_and=-1 =
nee4 Pills, a set of uniforitt strategies -might be tailored that especiallyappeila tb the interestis and need', of pFT.
b. -rhe disadvantaged population 'was overwhelmingly blade. Thus, ap-prozhei\ used by /BOA should speak to the special educational ',needs andint 'Jibs bf that ethnic group. --` .
c. .Members- of DFF- were in Poor.'bealth and received -poor health\care.Thus, EOA should address the health edficational needs of DFF.
d. DFF were characteriied by various types of tenure arrangementNinanfaf which were of the tenant type. In that regard, it should be noted that '\BOA's efforts with an audience of tenant farmers would be influenced heavily '5
by,,,what the landowner allowS his tenant to do. It is not in the purviewof this study to:advocate a land reform program. But it would be well topoint out ; that under the existing social ..,structure, BOA Probably cot&accomplish more with the small landowner hirnself. This is not to say that'BOA should not work with tenantshere are many needs here. Rather, itir merely to point mit the difficulty Of changing the status quo.-.that has .
existed for Many years in the southern states.e. The" farrn 'operator's and homemakers cemstituted an older population,
'Thus, BOA should think in terms pf providing for needs iharacterietie of anoldei,population. The developmental tasks identified_ hy Havighurst (1952)would be a good starting point. Because the population was older a conservil .tive..mature'deliveiT approach is recominended.
f. The disadVentaged farm operator and homemaker,respondents had lowlevels of educational- attainment. Thus, not only are they likely' to be un-informed regarding many problems that greatly affect their- welfare; they
_also are less likely to have the ability to be self-learners. Hence, it is recom .mended that BOA continue to give DFF individualized help (one-on-onebasis) end that this approach Co them mutt be simple and direct
18

g. The focal point of the liVes of the DFF respondents was their farms. jFarm operators worked on their farms full time and homemakere kept house rfull time. They were, highly immobile, had low 'ratei of social participation, ;tended toward- anomie, and had little political awareness'. It is recoMmendedthat BOA make a conseious decision to either-broaden the dultural interests
7.- --of --D-PF-or-riceept-their-presenti=felt-needa -and -;concintrate-oh-meeting themneeds
Aboat one-third of the DFF in thii study were characterized as. future'value,oriented: .Thus, ore out of three farnilies are capable of deferringimmediate gratification ç as to work for a future goal. Programs directed,teward the remainIng two thirds should seek to provide immediate gratiftca-tion, while at the same tiiie helping DFF to recognize and focus on futuregoals.
2. Kinds of Decisions M de by Disadvantaged Farm Families-The findings of this study ippear to'reftite much of the conventienOl wisdian
regardingDFF by indicatin that they do engage in fi broad range of both. _ .
farm and home decisions that require knowledge and expertisein _several-different areas: The scope and difficulty of those decisions make it imperativethat EOA deliver to this clientele locl.h educationel programs end inforreation.
The respondents -were iniblyed- in more farm management deciaions than-this study had assumed: 'Thus, research-based informailon sources shouldnot;only-continue-to-provide-factuaLand--tichnical-information-en-vroduetionand marketing; but also place more emphasis bn Programs dealing with farmmanagement.
HomeMakers appeared td eichibit high ilimdfirds o-1 care' and 'a semi& aipride in their . limes. Therefore; it appears that educational prog+ams
e /de-
signed to fissist homemakers with housing improvements Would be acceptedby MT. Basic progreths concerned with water and sewage Systems, heating
= systerris; remodeling, And money management also are needed, along withprograms to enrich the lives .Of these.familles with-color schemes, draperies,slip covers, .and other "luxuries" often taken for granted by the middle-clasl..population.
Only 2 percent of the ho emnkers reported major decisions relating toclothing, 6 percent to mental' or physical health, and 5 percent to nutritional,decisionsSuch informatio implies an urgent need for_ programs designedto increase homemakers' a areness of the need to bectime more concerned
th their families' basic ii.equirements in the areas of clothing, health, andnutrition.
Rationality of Decision-Making,
The DFF respondents exhibited rationality' in decision-making, whichiMplies that problems addressedlo DFF could:take the form of effective infor-mation dissemination and educational progrhms. The neceisiti for direct -
assistance (welfare) was not indicated.
4. Availability, Usage, and Credibility of Communication Mediaand.Information Sources in'Those Media
of the three communication media studied (interpersonal, mcations), the interpersonal was the most frequently used, and
ost credible to the DFF. The findings' of this study indicate t
cc, and publiperceived asat the inter-

perional--source of information is7an Cireellent coMmunication channel forinfltiencing 'DEF. Especially; Ampertant interpersonal: informatinn sources .-Were agents and family-triends-neighbors pontrarito the researchers antic-noationi, homemakers and farni operators rated the minister low:in .bothcrd)bIliY And usage as arfinfermation source.'7Agpritnary sources -consulted'by-D-FETfarnrand-h-orrre-dealers-rankcd-low-
in usage -ind credibility..HoWeVer, as discussed later in, this section, dealersre proniinent in channeling, information to pFF. They :performed the: role
Of oPinicinieader and influenced interpersonal seurces that DEEconsulted.The 'rnitSs media gave evidence of being a highly,effective communication,.
channel -in influencing DEE4who ranked it-high in availability and in usage..The mass media did hot rank higitin credibility, but, -as Stated earlier, thisdoes not mean that it is not 'believed. 'It, ranked tow in:credibility because
,
interperional and publications media were-perceived as,more credible.Television 'apPears to- be the most appropriate mesa' Media sOurce for pro7amMing aiined.at DEF., and radio the second best, The usefulnesS of news
papers.-is questionable. There is little likelihood that .inass media progiarn,, at_ pFF..audignees, will_ be. ciffered ,by commercial ,--TV. or radio,
stations. ,Educational- TV is the most probable source of such protr4mming,iand efforts -in that direction should be supported. However, radio proerain..ming on a local basis would seem a mucli more likelY;possibility.
The -publications media was ranked low in -availability, usage, and -crecli-'loi red-to---be---a-n-unimpertant=channel'foreenununicatingith
DFF. However, -it ,is possible that printed materiaLespeeially designed farDFF might be useful. The researchers- iielieve that Mar:erial written' withspeeitil atteritio given to DEF's readability level on a wide varidtylot subjeefrmatter would he of interest te this clientele. In those families whese
..
have -a -iirnited education -and find it difficult-to read and eemprehend such:Material,,school age youngsters often are available to help their -parents.-
Of .the Sources in, the pablications media,- the Farmer's Almanac. rankedhigh' in availability, credibility, 'and: usage. Thus, it seems Probable thatbriefly Stated, coneise, reSearch,based 'material displayed in a forthat sir-niterto that oft.he Farnter'8 Almanac might be well received and used- bY the DEE.Subject matter other' than management such as gardening,. nutrition, and
-- animal science, among others, could be offered in Such puhlications.The investigators .recommend ;that E.OA. undertake to put together a
Farmer's Almanac tnoe.of publication that=i-eplaces the- typical content 'With,earch-baSed information :on a .wide 'Variety ofsubject-matter areas. The
weather information And signs information Should be left intact. .
'It appears that bulletins are especially in' need of redesigning inasmuch asDFF.--ranked' them- very- low iii usage and credibility. Level of readability--ishould be given Special attention.
,Linkate Between Interpersonal Information Sources Used by I. hdisadvantaged 'arm ,Families in Making Decisions and Re-
earch-Based Information Sources %.;
The interpersonal infrIrmation .sources used by a ninjority of the disadvan-taged farm /operators arid homemakers_ was not closely 'linked to a research---based schirce, which indicates inadequate communication .between .changeagents and OFF-. The Major reason for those communication barrierS mf.ty_be;.

Ithe existence'of a heterophilic relationship between change agents- and OFF.The difference between the . &lenge agent and OFF in ,.personal and socialcharacteristics may direct the disadvantaged to seek infcirmation from Ind'',viduals with whom they have More in cbmmon than change agents.
Unfortunately, .such homophilic interpersonal refationships\ seldom bring7-aboUrin-exclninge--Of-scientifrcallyThased-information:71M8,-the-re.;, a need for more training pf. individuals &Pm the- disadyantaged population
o serve as intermediate sourca in transferring to, LIT pertinent information:from research-based sources. Such a course of aetion would correspond to'Utilizing the interpersonal communications Media\ that appeamd to be .soimportant to OFF. ..
Another implication stemmed fi:om the desdiption of the 'occupation .coYPicaLstage A,.B, and C information sources/ Such deicriptive information
revealed that even ,when individuals did not /tiurn to research-based sourcesfoil information, there, often were typical sources from Whom they sought
-- adviCe. For example; farm operators-often-cOnsulted.feed,- Seed; and fertilizersalesmen or dealers before making a pure 4se or a farm production,decision.SiMilarly, social 'service_ workerS were One of the nonreiearch-based :infor-mation sources, often cited bY homemakeri.
Many of the foregoing communication/sources appeared to fill the role ofopinion leader. Contrary to the view widely held by a number of authors,thetei opinion leaders were of a higher social status than those they influ-rieed,-7Theseepiniorieaderashoubi beidentiftedmjew eawara ot
research-based inforination, and urged to work toward its application.The finding -that. the. County Agrieultural Extension Agent was the source
most often cited' in ''sthges B and'Clif the eorniciunicatien chtain'implied that,.while the agent' may not have- eommunicated persOnally with the disad4an-taged farm operators,- he was a'. key factor in, getting information .tp, them.The same appeared to be true ,for Home Eeonomied Extension Agents, whoalai" were the most typical' Stage B sonice of inlormation with' regard to thehome portiop of the study.5 /
6. Relationships of Selected Variables' to Rationality of Decision-lilaking; to the fOallability; Usage, and ,Credibility of Media;and to pegree of.Linkage
- / . .Although a few of the, relationThips between the seleeted variables and ROM
were significant, theY were quite weakt-2,Among all the other relationshipsstudiec.L the only Significant, one was a positive one between age of home-maker and PerceivAd media credibility. Two implications emerged from thesefindings. First, the absence/weakness of relationships -indicates.,thati-RDM;the availability,/usage, and credibility of media; and the dqgt:eof of . linkagewere' all reore'elosely relate'd;to; general cultilial forces (i.ct a disadvantaged.subculture) than to -individual variables. Second, beceuse of 'the absence ofsignificant relationships between the, selected variables and 'the-availability,
3Th-is ionclualon is supp.rted by finding! in A Mi9.601-1 study which show that farmers whodo not, receive information from agrieUltural oio.Odei tend io seek information from .ferniers'having :eontact -with the county agent. Herbert -F. Lionberger. Information Seeking Habitsarid cuil'acteristies of fEtni Operators. Columbia:_allsaouri Agricultural Experiment Station. .
Res. Bul. 581. April. Ma. Similar findings were also reported by C, Milton Caughenour.Agricultural Agencies as Information Sources for Farmer's in a RentuacY/County, 10504955; 7Loxioktoo; Kentucky Agriculture] 'Experiment Station,- Progress Report.82.-November 1059.

usage, and credibility of media, EOA might ielect apprelpriate Media with .out having to contend With tbe confoUnding influence of sociOpsychologicalVariables.
Ge_neral Ofiaerva;ionsThere is reason to speculate that homemakers may be the Twist appropriaterget for 'educational .prograrns aimed at improving the qUality of Hiring of
bFF:. Based; en their experience -in the field while gathering data for- this
study, the researchers formed the impression that DFF are strongly matri _
archical and- that homemakers understand better than farm operators thecurrent social situation .and how to.grapple with it. In addition, hornemakerrespondents were younger than the farm' operators, better educated,° andmore-rational in their deision-making. .
The DF'F had problems in maWy. -areai, some of Which are beyond therealm of any one agency. A great need.is- a central coordinating agency todirect DFF to an'uribiased source of information for use in decision-making.
cooperative properly.. conceived an& staffed interagency effOrt to provide .such a clearinghouse for information would 'greatly assist the DFFP . '
As 'pointed out in the conceptual frarnework,- the problenis 'of the .bFFinvolve both personal and structural dimensions. The low level of*ducation,along, with- other personal charaeteristics found among thila Aiopulation," I
illu-stratc-tl-mpergonal-espects-otheproblem.--Equal ly-importint_arethc,_tructural problems indigenous to the D.FF. Thia- poptilation constitutes aportion of the . lower.lower. strata in Anierican society. From the researcilers'vantage point, the lower-lower strata in the U.S. is an ,linevitahle phenome-non. Hence, EcoA engaged in programming for DFF Should face up to both -
. the personal and- structural facets of the problem and seek alternatives thatwill culminate in a higher standard of living for this clientele.
D. RECOMMENDATIONS FOR FURTHER RESEARCHExploratory studies tend to generate new avenues for research, because
they reveal needs, procedures, and insights not previously noted. Such was).the case with this study. Thus, certain recommendations for- birther researchare made: ' -
I. The findings of this study should be- further Validated by replicating thestudy in other North Carolina,counties. .-
2. There should be a Study in which the total-Community iS sampled. Sucha' study would make available norms against which to' compare DFF. Othertarget groups for comparison would include all farm families, all families of .thp. area, DFP from other partS of,North Carolina, Poor-urban families, andnonpoor urban families.-
3 An expanded number of -variables should be used in testing relation-ships with: (I) RDM; (2) aVailability, usage, and credibility Of Media; and(3) degree of linkage between interpersonal and research-baSed informationsoukces.'.The absence of significant relationships should Produce 'further!eVidence of a uniforrii-cultural pattern that transcends indiVidual variablei.
4. There is a need toidevelop more sensitive scales to measure variationmore precisely._.
5 . As a test of study objectivity and as a basis for further research with the.

disadvantaged, results obtained by- us ng peer group personnel as inter-viewers could be compared with results- obtained by using professionals asinterViewers.
6. F'urther research efforts -to measure ROM should utili2e only thosedefining items identified by facter analysiS rather than th& 12-item scaleused herA-n..
7. Additional research is needed to explore more effective and efficientmeans of reaching the rural diSadvantaged population with-research-basedinformation. '
6. Only- 01 of the 260 respondents cited interpersonal information sources..those 91 individuals were used as the population frorn which were selected 41subjects for the study on linkage; thus inferences can be made only to twatpopulation. Information readily available on data cards could be- used tocompareithe eharacterisqCs ot the original-260 subjects with the 47 subjectsof the linkagii ,study. If/the characteristics -c-if the two groups were signifiLcantly similar, the :findings and implicationS of the linkhge study might bemore applic-able to pfie 'entire pepulation of disadvantaged person's,-9.-A principal ,concern of this study_was to determine relationships-of the:
dewee of linkagelbetween_information- sourcei to certain-personal attibutesbf the disadvantaged subject's: It is possible that type of decision and effec--tiveness of the farm/home'.Extension agent had more iMpact on degree' oflinkage than personal characteristics. F'urther research is needed to confirrn'this supposition: -
10.- A stud3 might be conducted to determine any significant relatconshipsween the ratiOnality of decisions made and the degree Of linkage between
Information sourcres.

The technical report of research study on dcrision--making and com-munication'Patterns -of disathiantaged farM farnilie; (DPP') ia presented-Jnthree sections. In section A are Presented the background information, put.,poses, and objectiveS of the research; the coticeptual frarmlworli from whichthe rraeareh was ,designed; and the limitaLions cf the stndy. Section .Bdescribes the methodology used ; in arriving at th,_, decision-making, Com-munication, and linkage patterns, i.e., the research design; identification ofthe disadvantaged -area, popUlation and sampling, instrumentation, datacollection process, and statistical procedures emploYed in analyzing the_data. Section d presents the results and an intvrpratation of the study'sfindings. --A. BACKGROUND'OF THE-STUDY
In this, the most affluent of all nations, mIlions of-people live in poverty.The Jural poor constitute a sizable portion 'of eite poverty stricken,Approxi-matelyi nine years ago,:the President's'Commission on Rural-Poverty--(The
--People -Left Behind, 1967) reported that:aorne .14 million rural -Americanswere at the poverty level. Making that number even more significant is therelate-a1l-1p of-rural poverty to trrb-an-p-ove-rty. M-RligersTantr B-urdge-C1-972-.p. 3,77) pointed -out, ''most-of today's Urban poor are yesterday's rural poor/whoImoved to the city." Thus, the .perpetuating and widespread effect ofrural poverty has rapidly become one okthe Major problems of this nation.
1. The Rural Poor SubeultureA CommitmentA recognized phenomenon is that the rural poor are separated from the
mainstream of national society. The dominant soelety--affluent- and middle--class.--klemarids of all its members skills that will enable them to cope effec-.
With- their environment. Disadvantaged farm families-.1ack such skills.ComPrising afsubcuiture of poverty, DPP are characterized by isolation, lack,.of.parlicipation in organizations, unemployment or underemployment, reced-:mg economic base, poor educatiOn, both geographic and-occupational immo-bility, restrictive values and beliers,anomie, old age, _dilapidated housing,and poor health and health care.
Rural poverty in North Carolina is not:unlike that in other areas of thenation (Brooks, 1964). Many of the State's 'rural farm families are botheronomically and socially disadvantaged. Lacking the educational balcgroundand skills- required to improve their position in society, those individuals,remain fixed in a .socioeconomic class or subculture that hinders bOth Self .improvenient and assistance from others. As these rural people paiticipatein their daily,routines, their subculture of povertY seems to be passed on totheir offspring and, indeed, subsequent generatiens. Thus, poverty -and its-effects appear to continue in a vicious, self-per tutting cycle.
Many educational organizations and agencie (E0A). e.g., the -ExtensionService of the USDA, are dedicated to irnprovi g the plight of both the rural,and drban poor. A joint:report of the USDA and the National Association -
of Land7Grant Colleges and Universities (A P. ople and a Spirit, 1968) stated_

. Irbent of-the e allocated by Extensio. turai Production/spent working with 'disadvantaged farmers. However, in recent years
ere has been an increasing doubt that the aged, the isolated, the minority,
icroup,,member, the -physisally and mentally handicapped, the less highly'motivated,. and those with limited-resources are receiving adequate portionsOf Extension's time and assistance. Because.of that expressed concern for thedoWntiliciden, the North_ Carolina Agricultural_ Extension Service'. and Co-
-,
,. , .
operative Extension Services'elsewhere currently-are focusing More attention,on the DFF.
.
Such a trend was suggestid in Impact ,'76 (1972); the North, Carolina .
Agricultural Extension Servise's long-range program for the next five years.Impact '76 (p. 8) argued that:
. \
Programs to improve the_standard of living and income of clientble in theagricultural, and natural resources industriei need special:attention infuture ulanning. Extension Programs-neia to be,developedto wbrk with.familie occupying.hgricultural units that are either too small or \lack the'''''h
- t productive capacity adeqUAtely to.support-the farm family. In addition,'marginal ineonies _may be due to inadequate- education or skills of the6;imilies involved. Educational prograMs may be needed in cooPerationwith other, agencies to improve the,status of the lovir-income 'groups
. involved in agriculture. Innovative programs for increasing the income ofnonagrieultureerrelatedpnterprisesmarnake
an important contribution.
Other EOA have -exPressed similar concern for DFF. There are two basicreasons tor such concern. Firsti hi technology continues to expan1 '. at anaccelerating rate, it leaves in_its,-wake vast changes in every aspeet of theram! culture. Wbether DFF remain-on-the land or migrate into ihe city, they
,generally, lack the _necessary training arid skills -to -compete -in the .lahormarket,-
.A second reason of concern for the DFF is"the effect.of their problems onthe larger society. Disadvantaged farm families are in no position' to makesignificant contributions fo the general welfare of the total society, just as
, they do not share in all the available rewards. If it were made possible forDFF to share in the total prodUctivity and receive just reWards for theirefforts, the entire so-liety would beriefit.
Rather than- providing, direct ,Monetary assistance (welfare) _.,to OFF,many programs fecusing on OFF -are educatidnal in nature and are basedon the needs-(felt and analyzed) of the people. These programs Are concernedwith altering _the 'behavior(knowledge, attitudes,,walues and skills) deernedessential for the well-being of DFF. Such, knowledge, attitudes, values andskills have a research base, and are valid4e'd. Dissemination of these' pro-grams to -rural areas could bnrich the _lives of the .rural poor. 'However, to
. date, few,such dissemination _efforts appeAr tw.havb had graat-impact.- Wbilerrnieh research--based information has beep -developed to aid OFF, there is
; reason to believe that little of the information reaches them' in' its -original/forni-if it-reaches them at all.iAlsO, much of the research-;based_informatioar7
actually reaChing OFF May be ;Wjeated_by_theni-as inforination on which tobase decisions.-Refore_EOA can= beCome an important factor in- enriching the,=
_lives- of =DFF,- effective =inforrhat,i,:on dissemination, to this -group must beaatered.

140 H2. Purposea and Nectives of the Proiject
This research effort addresses, itself to this problem Of bow the educational-change agent may intervene effectively andieffect change in.the-establishedbehavierr_patterns of DFF In North Carolina.. In that regard the most press-ing need was to reduce the change- agent's inforMation gap concerning:
.
11):the, life styles of this _population to include their sOciak psychologicakr.economic, and politiCal characteristics; (2)- tho ; kinds of major farm andhome, decisione- made by DFF; (3) thi processes utilized by them to arriveat such decisions; (4) the major sources of information and communication .
networkused by DFF in making decisions; (5) the factors, if any, aecoun'ting,for decisione made by DEE!. and -their selection arid use of the various;ination Bouraes; and ,(6) the linkages 'between interpersonal inforrigitionsources crted 'by bFr as a baiis'for decisions and research-based informationaources. '
= h reSearch- appeared to- b'ejustified -in 'that one-third Of 'North 'Caro-ina:s_ rural farm faMilies are Considered both socially and economically
'disadVantaged. Although a wealth of retiearchbaSed-Content reletiVe-t,0'110iand .hotne. living existe- that could be profitably utilized by tiis popnlationin imProving their .sitiniltion, there, is reason to belieVa that little 'Of-thisinformation'reaches`the DPP- and, hi-Aber, they May well reject this liMited':information_..as=a_basis_for_maidng_decisiorisk Paramount to this' dilemma isthe dearth:of information abOlit the DFF. poshessed by the educational :change
_ .
agent. The literature toritaing several Studies on farm and Me *nag mit,'but those were ell geared _to middle,and upper sociocconan f-' rators.FUrther, thd existing body of'iftferniation abottt- decisi on-ma Was largely loriented toward institutional Management. Most of the- conimUnicationresearckto date has be'en .concerned With the adoption -of practices hy middle-aciciciedoaemic farm 'groups. ReSearch about thadeterminants of the behaviorof adulta.has dealt 'withsuch-factors as self-concept, belief systems, internal-external Control ,. anomie, conservatism, value systems, -and- numerons_fixed..stratified variables. 'Although .thefindings of those studies:provided some
sight about the behavior of diaadvantaged adults, the researcherkniade no =empt to relate those and "other,factors to the dicision-making, communica-
:tion, arid_ linkage :patterns utilized by DFF in -decisiop7making.. Thisliofor--rnetion gap in thaeducational .change agenVa-cogaiiiVe map has stymied his-effortate develop'-and implement effective educational -strategies toidentifYing, --relating to, commnnicating with; and effecting chanie, amongthis aggregate of the State's population lience,:the specific objectives con-ceived for this research were to determine: _ ,
1.- Who are North Caropria's DFF and what aratheir characteristics?2. What...kinds of major farm and home deciiiidni aie DFF making?-3 Euw =rational are the. decision.malung processes utilized by DFF in
- making these decisions?4.. What cOmmunication Media are available to DFF? Wliat are the major
sources of information utilized by DFF in making farm' and-home decisions?What credibility do-OFF assign to their information sources?'
5. What' is the degree of linkage between interpersonal information sourcesused. by OFF in making farm and .home decisions and research-baaed infer-
.
mation sources? .
6. 'What .is the relationship between selected sociopsychelogical- variablesarid the:-'(a) degree of rationality in decision-making; (b) availability, usage,

and credibility of media (i.e., interpersonal, mass, and publications) and theinformation sources within those media; and (c) degree of linkage betweeninterpersonal information sources-used by DFF and research-based informa-tion sources? .
-:-..
3. Conceptual Framework---The conceptual perspective of this study was builtiaround decision-making,_ ,
communication, and linkage theory, viith-- special, focus on the decision-making, communication, and linkage patterns of the 'DFF..The major con-cepta treated were_poverty, decision-making, communication and linkage.
The Concept of Poverty.The term "po\terty", is not clearly conceptualized in the literature on that
subject. All too frequently a book or an article .seemingly concerned withpoverty immediately begins to discuss, not "poverty," but "the poor." How-ever, used precisely, "povertr is not synonomous with "poor." Poverty iscondition. Those characterized by that condition are called poor.
. Aceording to Webater's Seventh New Collegiate Dictionary- (1970, p. 66),poverty is synonomous with "want," "scarcity," and "destitution." Mtholigh
! individuals and groups may experience "want," "scarcity," and "destitution"in areas ranging from the need for political freedom to the -need for love;po Jvertymost cam o _ply sugiestadeprivation regarding food, clothing, shelter,
edical care, an other such needs -which determirce level of living. Theuncil of conomic Advisers (1970, p. 11) defined poverty as "the inability
to satisfy minimum ne'eds," and further ruled,that those in poverty are thosewho "lack the earned income, property income and savings, and transferpament to .meet their minimum needs Ivitan -(1973, p.' 241) defipedpoverty as "a lack of, goods and services needed for an 'adequate standardof living.": .
It is difficult, however, to establish a level of deprivation of goods andCservices which constitntes a poverty condition. No' absplute standards exist,for the condition of poverty is a relative one. As Sneden (1970, p..2) pointed
. ,--out:To say that soineone is poor is to compare him with somione else. .The poor in America are better off in some respects than the vast major-ity of people in many of the developing nations; they have a higheraverage income, more facilities, a generally better diet, etc. Those whoilre considered poor in American society are se defined, then, because they.-are relatively Worse off than the rest of those in tbe system.
Compounding the difficulty of establishing a poverty' condition is the factthat a family's needs depend on many factor's, including the size cif the family,the ages of its members, the condition of their health, and the place ofresidence.
Various indicators have been suggested tO measure the aniount of relativedeprivation exiating in society-Sneden (1970, p. '4) lists 16 such criteria:
, 1. The quality of diet2. The quality pf housing3. The quality and extensiveness of clotliing owned
The nuMber of luxuries that can be afforded5 The quality of furnishings for one's place of living_6. The quality of Medical care tbat can be had "=-
7 . The degree of control direr one's overall destiny (soCial power)

8. The Overall quality of one's life-style (how qualitatively valuable it
subjectively)D. The degree to which.physical survival is possible
10. The degree to which one can move- about with facility (the adequacyof transportation facilities)
11. The quality of communications media available12. 'The quality and length of education available13. The quality and length of work available14- The degree to which one has pr,--,ilge within one's- communi y and/or
larger society, 15. e income one has
16. n ome-food expenditure relationship.
Since it is not feasible to measure all of the listed criteria to determinefamily is in a. condition of pdverty, it -would bd -helpful to select the oneindicator that would be the best measure of poverty.
Accordifig to Anderson and Niemi (1969), education is the single mostmportant indicator. They argued that occupation;', income, health, housing,
family size,_ and other such variables are directly dependent on education,Othera would present similar arguments for other indieators of poverty.'However, the most commonly used indicator is income. Webster's (1970, p. 6)defines poverty as a "lack of money.";Sneden (1970),arguing in favor of usingincome as a measure 'of poverty, maintained that income is the, most signifi-cant overall measure of one's rank in American society. He ontended thatincome is the ziost important factor in determiningconiumption of goods andservices, diet, housing, medical care, education, and other criteria frequentlyused to measure-payerty, and was adamant in ,aaserting (Sneden, 1970, p. 6)that "money is probably the most crucial variable in the determination ofpoverty." In addition, he pointed out that income ia easy to measureaCcurately.
'Recognizing th .importanee of income as a dominant factor and a con-venient heuristic device by which to ,measure- poverty, this study usedincome as one of the criteria by which to identify farm families that are in acondition of poverty. While an income criterion is a convenient_ heuristicdevice by which to measure poverty, it is widely recognized that income
aidne is net sufficient to conceptualize such a complex phenomenon. The Task_
Force on -Econoran Growth and Opportunity (1965, p. 5) made such anaffirmation when it dcl.lared that "the more we study poverty the more wefind that it is not just an economic problem. It is'en emotional, cultural, andpolitical problem aCwell."
The Nature of Poverty in the United StatesPoverty in the United States is of a different order from poverty in other
parts of the world where it is a way of life for most inhabitants. Povertyin the U.S involves specific people, famnies:,:and groups and differs frommass chronic poverty. A large body of opinion contends that those in a con-dition of poverty possess'' certain Voverty-linked" characteristics thatgause them to 'constitute a subculture. According to Ferrnan, et al. (1965,p. 5), members of the poverty subculture
. . . share" a distinctive set of values,' behavior traits, and belief COTTIplexes that markedly set them off from the affluent- groups in the society.This set is ,"derivative" of-prolonged economic deprivation, lack of
I.16 2 8

1
adeuate financial resources and- socialization in an environment ofeco omic uncertainty. This "culture of poverty" is characterized by anin irgenerational persistence and transmission to the children of the
Thusi, the poor in the U.S. may be conceptualized as a subculture existingwithin/and interacting.with the larger societal culture (Figure 1). Distinctsocial psychological, political, and economic charaeteristics are associated-with,a. poverty subculture. As depicted in the schema in Figuse 1, povertymay begin with the inaividual and spread through fainilies, communities .and even whOle societies. When it constitutes a sizable portion of the people
_in a society, or increases to the extent that it affects the...effective function-ing of its human resources, it then becomes recognized as a major problem forthe larger society's external environment. Such was the dine necessitatingthe passage of the Econonc Act of 1964, which declared it to be Lhe policy-
' of the US. to obliterate poVerty.
The Relationship Between the Larger Society and the DisadvantagedIn discussing die schema in Figure 1, attention is first focused on the il-11--
tionship between the larger society and the poverty subculture. That relation-ship takes place within, and is determined by, a situation of unequal power. ,The poverty subculture is comprised of an unorganized or ineffectivelyorganized minority that is unable to exert influence in the political spheres social system in which members possess relatively few skills and limitedresources. In contrast, the larger society is immensely Powerful.
Given the difference in the amount of power possessed by the.two cultures,the often acrimonious relationship between them is not surprising. Accordingto Haggstrom (1970, p. 79): ,
On the aVerage, the poor in the Uniteci States have bad reputations.,
They are regartled as responsible -far much physical aggression anddestruction of property; their support is alleged to be a heavy burden onthe rest of the community; and they are said not even to try very hard to'meet community standards of behavior or to be self-supporting. Poverty,it is said, is little enough punishment for people Sainferior and so laCk-:ing- in virtue.
Cm the other hand, HaggstroM argues (p. 80), the disadvantaged harbormuch:
. . . envy and hostility toward those who prosper. There is a feeling ofbeing exploited. . . . The unity of the poor comes about through suspi-
' cion of and resentment toward outsiders. (There is a feeling that) theoutside Vtorld cannot be trusted; it must be defended against.
, The poor often perceive nthemselves as discriminated against and rejected" by the larger society. Thus, they blame their situation on the larger society
and reject its culture.The _condition of uneqnal pewer between the two cultures also determines
.the most basic natuze of the relationshipthe tremendous dependence of the-weaker culture on the stronger. Unable to generate the necessarY resourcesto satisfy their own needflt, the poverty subculture must look to the largersociety to Provide thoie re ources threugh welfare programs.
"t ;
't 'As' Haggstrom . (1970; p . 83-84) pointed out, the (dependency of the sub-culture on the .overwhelmi g.power of the larger culture is also reflected in(1) the prObahility that a poo person is much more likely ta be subject to
:
police interrogation and search or other police action than middle-class_people"; (2) urban renewal projects which berioditally disrupt the neighbor-
, 17

'IET'lMUNITFAMILIES
INDIVIDUALS
._FiL 1. A oh_ _ for conceptualizing the d

hoods of poverty, sCattering the families in various directions;- (3) schoolswhich impose middle-class standards on the poor; (4) the repossession ofgoods bought through high:interest installment financing; (5) rapaciouslandlorda Who exploit the poor:- and (6) the fact that plans and programsdesigned to help--,the poor are initiated and supported by the larger' societyand imposed 'uPort.:the poor.
Cheractdristica of the DisadvantagedTh'i schema in Figure 1 indicates th'at,the poyertyielvulture possesses dis-
tinctive social, psychological, pobliCal; and 4conondc characteristics. Theichenia also-indicatei that there iainteraction betWeen those CharacteristiCs.The earlier mentioned condition of dependency may be taken as typical.demonstration of such interaction (Fgritre 2). 2.
ecoNOMIC:Dependence
POLITICAL:No. or little.'organi-zation for politi CalaetiOn
SOCIAL:Deviancy
Figure 2. Schtma illustrating the interaction betweenlogical, social, and political characteristics
The economic dependence of the poor has been described. The literature onpoverty indicated general consensus that such dependency, has psychologicalrepereussions. The poor come to feel that they are powerless to improve
----- their condition by their owm efforts and,- thus, are ehitracterized by attitudes-of hopelessness and apathy. These -psycliological characteristica,.in turn influ-once their Social_ characteristics. Social condnet is govet4ied by a set ofvalues..Because of their attitudes of hepelessness and apathy, the pootr havea set of values different from.-thoise of the larger society. Although their_may "pay lip service!' to middlelass values, they have n9 concept that suchvgi.z.z_apply to them (Anderson and Niemi, 1669; Lewis, 1969; .11aggetrom,.1970). t'or eitimplei- the middle-class value systern extolls hard work and
1,al irobity These Values are quite functional for the middle class, skite19
PSYCHOLOGICAL:Hopelessness and 'Ap
economic, psycho-

they frequently lead to success andupward mobility. The psychologically -dependent poor, however, believe a value.aystem that incorPorates hard work °
and moral probit.,r is dysfunctional for them.- Thus, they reject those middle-class -values. The value set that they` adopt, however, causes their conduct,by the standards of the larger society, to be socially deviant, Thus, in the'subculture- there is a high crime rate, alcoholism, drug,use,,illegitimacy, andthe like. As a result, kstate of mistrust characterizes the,relationship of the .
_ _
disadvantaged to earh other.=
The impact, of ecOncithie dependency (expreased through psychological andsocial characteristics) also has a tremendous influence on the political Char-,acteriaties of ifie pdor.- Because they consider as.,hopeless any effort on their'
,:-Tegt to alter their situation (psychological) and because of,their mistrust of.,erre another' (social), the disadVantaged' have little or no arganization =forpolitical action. The ,absence of political power, in turn, contributes to their
-° deprivation-, which rierpetnates the condition of econonlic.dependency. '
Soeial Characteristics of therDisadvantagedThe sections that follow treat certain of the social, eeonomic, psychological,
and political characteristics of-the disadVantaged depicted in the interaaionschema (Figure 1). Suppertive data for the discussion of theseeharacteristicswere extracted from current .population reports of the,.U.S. Bureau of theCensus (1975), and -refer to 1973 population cheractiristies. The Bureau ofthe Census used a weighted scale adjusted for-ize of fainily, sex of familyhead, and farm/nonfarm, residence to deterfnine poverty levela. .
The social characteristiCs of DFF ttriat were pertinent to this study were..divided into two categorias :_jndividual and family characteriatics. Individualswere characterized_ according- to: (1) age,. (2) eduCation (of those over 14 '-
years -old), (4) ethnie backvound,. (5) residence; and (6) sex, Families were=7characterized-by: (1) cdridation of family'head (25 years old and over), (2)
sex of family head, and (3) size of family. ,
Individual Characteristics. Age is the first individual characteristic shown inTable -1.,.The data indicate that of the total U.S. population the young (14percent). and the' old (16 percent) had the. greatest likelihood to be dis-advantaged. While the data indicate that only 8 percent' of the total popula7tion in the 16-64 aw° category .We.re disadvantaged, this age caiegory com-prised -48 percent of he disadvantaged population.
Some literature i,a-licates that the disadvantaged hold lower, educationalespirations for their children than do the middle class and, further, that theyare more pessimistic regarding the poSsibility Of their children achievingthose. aspirations, The disadvantaged are disadvantaged largely because 'oftheir lack of education. Table 1 shows that in terms of median years of schoolcompleted, the: disadvantaged -(Over 141years old) had about twe years, lesseducation-than the general population.. Much more revealing, however, wasthe percentage who had not completed high .school. For those over 14 yearsof age, the disadvantaged .who were not high school graduates outnumberedtheir nonpoor counterparts by about 25 -percent, ,
Based pn: the Premise that tfic poWer of whites ia societk is tar strongerthan that of blacks and:other races, it is logical to expect'that proportionatelyfewer whites 'than blacks would be found among, the disadventaged. As shown-br.Table '1 such-was the case..While only 8.4 percent of the total white popu7lation was labeled as disadvantaged,..31.5 percent ofthe total black population

,fell into the dIsadvantaged category. Because whites. far outnumber blacksin the population of the United States, there are about twice as many dis-advantaged whites as disadvantaged blacks (66 percent and 32 percent,respectively).
Marital status of the disadvantaged females (15 years of age and over)was the next individual characteristic shown in Tible L It is generallyaccepted that there is a high incidence of broken homes in the poverty sub-culture. Such a pattern was supported by the data, which show that only 27percent of disadvantaged married females had a husband presenL
Considering place of residence nexL Table 1 shows that the great majorityof the disadvantaged population' (94.4 percent) resided in a nonfarris location.However, the proportionate incidence of disadvantaged among the total U.S.population is greater in a farm location (13.4 percent to 11 percent, respec-tively).
Table 1.in
ency distribution of social characteristics of the disadvantagehe USA by selected individual characteristics, 1973
Age, ,yr.Under 1616-8465 years and over
Education (over 14 years old)Median years of school
completed--Percentage not a high school
graduate
Ethnic backgroundWhiteBlackOthers
Marital status of fem 5'years and over)
TotalHusband presentNo husband, or ha band absent
ResidenceFarmNonfarm:
SexMaleFetnale'
Total -USPopulation
plaadvantapedNumber
, of DNA&vantaged
Pereent.01Total:
Population'
207,621 22,973 11.1
58,746 8,685 14.0128,273 10,9 5 , 8.020,602 3,354 16.0
12.2 9.9
42.4 67.3
181,185- 15,142 8.423,418 7,388 "31.53,018 443 14.0
80,283 9,368 11.747,317 2,5,06 5332,966 6,8'62 20.0
9,546. 1,283 13.4198,075 21,689 11.0
100,634 9,642 9.6106,898 13,816 12.5
Poirent ofNu. Mad.rentaged
38.048.014.0
a_
66.032.02.0
27.073.0
5.5'94.4
42.058.0
I U.S. Bureau of the Census (1975): total in thousands; Stores roundsd to he nearest wholenumber.
21
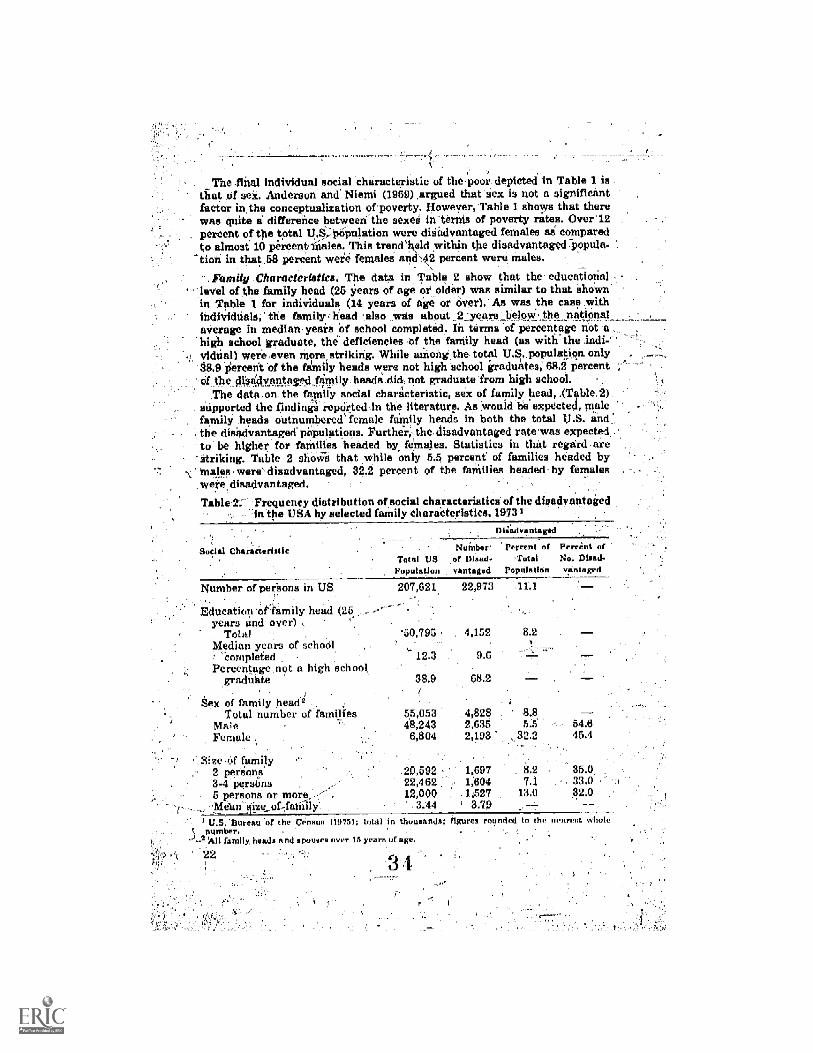
The rmal individual social characteristic of the-poor depicted in Table 1 isthat of sex. Anderson and Niemi (1969) .argued that sex is not a significantfactor in the conceptualization of poverty. Ilowever, Table 1 shows that there
as quite a difference between the sexes in ternis of poverty rates. Over 12percent of the total U.S. pepulation were diaadvantaged females as comparedto almost 10 percent-niales. This trendheld within the disadvantaged popula-'don in that 58 percent were females ands-42 percent were males.
Family Characteristics. The data in Table 2 show that the educationallevel of the family head (25 years of age or older) was similar to that shownin Table 1 for individuals (14 years of age or over), As was the case withindividuals, the family- head also was about 2 years beloW the nationalaverage in median years of school completed. In terms of percentage not ahigh school graduate, the deficiencies Of the family head (as witb` the indi-vidual) were even more, striking. While amongthe total U.S. population only38.9 liercent 'of the firnily heads were not high school graduntes; 68.2 percentof the_clisn.avantadfamily headsi did not graduate from high school.
The data.on the family social characteristic, sex of family head, ,(Table 2)supported the finding; repOrted in the literature. As would be expected, malefamily heads outnumbered female family heads in both the total U.S. andthe disadvantaged potiulations. Further, the disadvantaged rate was expectedto be higher for families headea by. females. Statistics in that regsird arestriking. Table .2 shovis that while only 5.6 percent of families headed bymales were' disadvantaged, 32.2 percent of the families headed- by femaleswere disadvantaged.
Table 2 Frequency distribution of social characteriatics of the disadvantaged= :in the USA by selected family charaCteristics, 19731
Dle'advantaed
Nunther Percent of Percent ofTotal DS of Dieml. -Total No. DWad.
Population vantaged Population rantaged
Number of perSons in US 22,973
Education 'of family head (25years and over) ,.
Total 50,795 4,152 8.2Median years of .schoel
'eompleted-:- 12.3 9.6Percentage .not a high school,
38.9 68.2_graduate;
tex of family head2Total number of families 55,053 4,828 8.8
Male 48,243 2,635 5.5Female ,
,of family
6,804 2,193 32.2
2 perions _20,592 1,691 8.23-4 persi;ns 22,462 1604 7.15 persons' or more, -. 12,000 1527 13.0Mean' size _of-fariiily 3.44 319
U.S..Dureau 'of the Censuoc, number. .
fondly, heada and apoucce ore!,
22
54.6454
35.0.-33.0
32.0
In thousands: froro rciundnd to the nearest whole
years of age.

Anderson and Niemi's (1969) review of the research on the poor disclosedthat the disadvantaged faridly is usually larger tlian average in size. SeveralstUdies reviewed ,by those two researchers revealed that extremely lowincome appeared to be related to bearing and rearihg five or more children.Nevertheless, the -statistics in Table 2 do not.support that conclusion. Accord-ing to the data, the disadvantaged family'.was no more likely to have alarger family than a smaller one. Furthermore the mean size of the dis.- advantaged family (3.79 persens) was only slightly .higher than that of otherfamilies (3.44 persons).
. Additional social characteristics of the disadvantaged treated in this study'bUt not depicted in Tables 1 and 2-were health, housing, and social partici.pation.
Turning first to health, there is substantial evidence that the health 'of the. disadvantaged is clearly inferior to that of the nonpoor. Supportive findings
of this statement.were given by Anderson and Niemi (1969, p. 16):! The Asadvaritaged are' characterized by '11 high incidence- of diseases,,
higher rates of infant mortality, lower life expectancy ,. more chronie--illness, more dental defects and a greeter eVidence of generally poor
physical and mental health. .-: . (They are) also characterized _by lowereXpenditures -for health services, less use of medical facilities, lowerrates of pre.natal care and, lower aeceptance of voluntary health insur-
. ante and prepaid medical coverage.Additional research conducted by the-National Center for Health Statistics
. :supported .Anderson _and NiemPi assertions that the health_ situation of thepoor is inferior to-Aat of the nonpoor (Allen 1974- Profile of American_ _
Health, 1973, 1974)- . .
- Ai for housing, it is only to be expected-that, given their educational andincome- levels, the disadvantaged vi-Eitild live in inadequate, dillipidatedhousing. ,,,,,,:::::. -- - IWith regard to social participation of the disadvantaged, Anderson and-Nierni (1969; p. 34) reported that _"existing research shows only' a very-limited degTee of participation in formal asseciations by the-disadva taged."
Psychological Charaiterisiics the DisadvaatagedVarious authorities have observed that the disadvantaged share, in general,
a distinct set of -psychological characteristics. In 1966, Skene noted that thefollowing characteristics had been identified in the literature (AndersOn.andNierni. 1969):
. The disadvantaged are authoritarian and resort to physical rathei- thanverbal dominance.
.2. 'They are rigidly restrictive, especially if they,hold religious beliefswhich are prohibitive onesi-
3. They are predisposed to intolerance and prejudice and tehd tinva dblack and white thinking,
4. They held anti.intellectual attitudes and are more prone toto reflection. 1'
5.-- They are more: inclined to physical on concrete thinking andthan to impersonal abstract thinking.
6. They are given to resign' themselves to '-'fate."7, They are more likely to reveal hostility, tension, and aggression.Kluckhohn and Strodtbeck ,characteriied the disadvantaged-. as "being.
oriented." Such an- orientation implies (Kluckhohn and Strodtbeck, 1961, p.
23

.,
behavior that tends to be spontaneous and directed toward therealization of immediate needs or interests. This orientation is .con-treated to the "doing" Orientation pattern of middle-class Americansociety in which behavior tenda to be planned and directed toward therealization of objective goals. A -',k_loing" orientation is future-orientedand a "being" orientation is oriented to the present
Since 13FF often-are characterized as "being"-oriented, it is not inconsistenthat they seem unwilling to take the time, effort and expense that an out-
eider might deem necessary to gather enough appropriate information tomake a "future"-oriented deciaion (lauckhohn and Strodtbeck, 1961). Instant/decisions or thoie taldng only a l'ew days are an accepted feature in theirlives, as might be anticipated as a manifestation of ,their "now" (present)orientation (Schomaker and Thorpe, 1963).
ntrary to the foregoing, Rokeach maintained that current findings pro-_ded no support for the widely held helief -that the culture of poverty /is
hedonistie and present-oriented. Neither did the Bridings Supporttheih co
theais that the poor Value immediate gritification more than do the r ch.However, Bokeach (1973, p. 63) modified this statement by saying,
so -obvious that the value differences usually become more pronhe two extremes of poverty and affluence are compared."
The disadvantaged also are characterized by low self-concepts (Andersonand Niemi, 1969; Sneden, 1970). Their dependency, habits of sUbmissio' lackof verbal facility, lack of skills and knowledge, and their ,earliest exekiencesof-failure in school all contribute to thia psychological condition. I
Finally, 'considerable evidence was found that the disadvantaged are moreanomie than the advantaged and have higher incidences of alienatinn (Bell,1957; Moir and Bell, 1959). -Following a Suggestion in Leo Srole's (1956)writing, the term "anorn*" as used in this study, refers to the p nomenonmeasured bY his scale or similar scales to distinguish the ps ,chologicalconcept from the pociological concept of anomie. The former re era to thestate of-an individual and the latter to the condition of a group or aociety.
The evidence Us consistent that anomia results when individualS lack access-.
to meani for the Achievement of societal koala. Such lack of opportunity comesabout largely as a-result -nl an individual'a position in the /Social systemas determined by such factors as (Riddick, 1966): (1) occupation; (2) educa-tional attainment; (3), inceme; (4) age; , (5) sex; (6) ethnicity; (7) maxitalstatus; (8) tyiles 'and degrees of association in both formal organizations andinformal, groups of friends, work associates, neighbors, arid relatives; and(9) degree of commitment to particular beliefs; attitudes, and values.
. ,
Political Characteristics of the DisadvantagedThe . disadvantaged are not predisposed toward political participation.
Brager (1965); from analyzing the reasons for their low participation:rate,advanced the following anises: the characteristics of community life; the --nature of lower-income adults, and the structure of the community organi-zation effort.
With regard to the ,characteristics of community:life, Brager pointed outthAt, at the time of writing, local communities had been inundated by, newmigrants, most of whom were from rural rl'eas and hence unfamiliar withurban life. Brager (1965', p. 510) noted that a public housing project "collectsin one plaee thousands of deprived families/strangers to one another'and tolocal community resources," which results in/ the community failing to
24-

assimilate the newcomers and/or involve them in community, life. Anothercharacteristic o'f community life contributing to the lbw political participationrate of the disadvantaged Brager (1965. P. 510) listed as:
. . The bewildering operations,of massive bureaucratic systems. . . .
The size, impersonality, concentrated power and inflexibility of theselarge organizations. make Open seem to local residents hardly amenableto their influence.
The community charactsristi that Brager (1965. p. 510) thought was mostimportant in deterTing the disadvantaged from participating in communitypolitics wils .'the opposition of already entrenched organization." Heargued that su-ch established groups. as Political -parties,- government agen-cies, and private organizations resist participation by the disadvantaged incommunity' politics because these organizations perceive the disadvantagedas a threat to their vested interesLs.
The second cause Brager advanced to explain the low political participationrate of tha disadvantaged was the nature of disadvantaged adults, Because'of;the circumstances of their existence, Brager argued, the disadvantaged aretoo preoccupied with day-to-day survival problems to be concerned with broadpolitical matters. In addition, disadvantaged persons,(Brager, 1965, p., 510)"lack the verbal or literary requisites for organizational skills; neither dothey tend to be coinfortable with the formal rnethods of doing business inorganizations.- Finallk, the disadvantaged view life, very pessimistically andhaVe little hope of deliverance. Thus (Brager,- 1965, p. 510), '!they tend toretreat from struggle: ... Such defeatism, resulting in a lack of participation,produces a loss of interestin--changing their conditions?'
The third. and _final, cause Brager advanced to explain the lack of politicalparticipation_among .the disadvantaged was 'the structure of community5rkari-4ation; i.e., community organizations are staffed ,by the middle classcausing the disadvantaged to feel dominated in those organizations; conse-quently,.the disadvantaged either withdraw or refuse to join.
I,Eick of political participation among the disadvantaged has. profoundConsequences, -and perhaps is the primarycause of poverty (Ferman, et. al.,1965).- People become _disadvantaged, not because of negative- personalcharacterietics, but because (Ferman, et. al., p. 219) they are -%
. ; . subjected to the action of exterrial forces which deprive 'Ahem ofadequate income. Those external forces determine the availability ofjobs ;and skill training, wage scaleS, size of transfer- parments-, avail-ability of training;:race discrimination, etc. TheY are part of the totalfunctioning of the American political economy.... By and large, (they)receive the smallest share-.of the nation's economic resciurces- and theleast adequate Community resources, They have the weakest voice in thedecision-making processes which govern resource allocation.
Economic Characa.ristics of the Disadvantaged'The literature On the disadvantaged indicated that the' disadvantaged are
deeply embedded in a poverty subculture. Hence, they_ are at a- great dis-advantage in obtaining a favorable economic status. Their level of education,skill level, ..work experienee-,.--previous trainihg, ethnic background, aenierityrecord, occupation, and industrialf,attachment' all combine to limit the labormarket opportunities available to them. Thus, relative to the larger .society,rather grim statistics for the disadvantaged emerge in the ,economic picture.of the nation. Table 3; which compares these economic' charaCteristics of thedisadvantaged versus the total U.S. population, is based on statistics re-

leaaed by the Bureau of Census (Characteristics of the Low-Income popula-tion:. 1973. 1975). Table 3 indicates the total 1973 U.S. population_ compared '
to the .disadvantaged population in terms of employment, status of familyhead source of family inc6me.'and work experience.
------4a---reKar1 to emploment status of family head,. Table 3 reveals that 41, percent of the-Fads-of disadvantaged families were currently employed (1974).
Many of those were undaubtedfr-f-ongaged in only part-time work or tem-porary full-time work (U.S. Bureau of the-Census, 1975).
!Table 3. Frequency distribution of economic characteristics of the disadvan--taged in the USA by selected individual and funny characteristics,19731
"at thararterlatk= Diaaaaantaxed--,-
Number Percent PerieatofTotal US of Maid. of Total, No
Popolatiool ' vantalred popylation aantaped.
Number of persons in US 207,621
Employment status of familyhead (March 1974)
TOtal number of familiesPresently employedPresently unemployedNot in labor force
Armed Forces
55,053 4,828 8.841,780 1,989 4.8 z 41.6
1,345 263 19,5 . 5.411,006 2,560 23.3 53.0
921 16 1.8 .3
Sotirce of family incomeEarnings and other income-Other income only, no earnings
Work experiende (22-64 years)Worked full time, full yearWorked pal-r fu!' earDid not wor':: 1972)
Main vo-kincIll or
trY 5e110.17,P.bk to tio.l:'work
_
torvau ( 1975l:
49,272 2,980 .05,658 . 1,718 ,30.4
104,802 8,174 7.852,624 1,217 . 2.3
4,048 4qp24,745 4 09 165
3,712. 1,224 33.018,626 2,317 12.4
680 - 151 22.2420 148 35.2
in tholloonds
62.036.0
14.00
50.0'
30.057.0
.03
.04minded to the neore Whole
A !arge number of the disadvantaged Were not available for work. Of thosebetween the \ages of 22 and 64, 50 'percent did not work in 1973. Only .04percent of th6se p.-ople Said that they were unable to find work. Similarly, 53._pct-cent of the heads of families 'indicated that-they were not in the liborforce. In the minds ng many there is, a link between laziness and poverty.HoweVer the data in , al& 3 indicate that many of the disadvantaged weresimply not able to wor'.. TI e great majority of those between the ages of 22and 64 who did mit , 1973 were either ill or disabled (30 percent) orwere required to keep hoe. .7? and look after children (57 percent).
The next economic chat,icteristic shown in Table 3 is that of source offamily income. Given the iqeqk irnployment status of the family head, it isnot. surprising that a large 1.1mber (36 percent) of the disadvantaged families

had no earninge in 1073, existing only on,"other income" (welfare).In Tegard to work experience, Table 3 indicatea a far higher rate of
unemployment for the disadvantaged than for the nonpoor. Indeed, a full 50percent of the disadvantaged between 22 and 64 years of age did not work atall in 1972. Anderson and Niemi (1969) and additional statistics of the U.S.Bureau of the Census reported that of those poor who do work a dispropor-tionate -number are limited to-work in semi!skilled and-unskilled categories.-That situatio_n_is reflected in the fact that although 14- per&nt of the dis-advantaged worked full tirW=a11-year-long,--they7-ivere-atilLin a condition ofpoverty. Thus, Or those persons poverty was the result of low-paying-jobs,
Other eeonomic.characteristics of thepOor not-indicated in Table 3 arethephysical environment-, mobility, and-transportation. Cansijering the physicalenvironment 'first; it is only to be eX6ected that the poor will live in anenvironment of ktimbling buildings,11poor facilities, and all the Othersymptoms of a blighted area.
The relationship:of the physical -env, ronment to the poor; however, goesfurtherthan yiroducing onlY unplea&in4' living conditions. Indeed, in anfinflu-eatial work.Gailhraith (1960-):.;:firied the physical environment, along withindividual chaffetergidi, hi explain the causes of poverty, He argued thatthere-tire two types of poverty: (1) ease poverty and (2) insular poverty.
Case poverty" refers to poverty caused by'individual charaCteristica auch asJphysical disabilities, mental disabilities, or some other personal character-
istic that dooms the individual to economic inadequacy. ,"Insular- poverty"2relates to the physical environment in that it refers to widespread povertyin whole communities or whole regions, such as urban ghettOs or the Appala-
.,chians. In such areas,- emplorment opportunities may ia'C nonexistant orlimited to low paid and unskilled jobs. Ferman, et. al. (1965; p. 3) wrote that-
.n such environments:Limited opportunities foster the -outmigration of the young the skilled,and the energetic, leaving the community with unskilled, nnndiversifiedlabor force, a situation that makeS future economic redevelopment of thecommunity even more difficult. _
With regard to the.rmobilitra the disadvantaged,-, one must distinguishbetween the rural and tbe urban poor. In their review of the research onmobility patteriis among the poor, Anderson and Niemi (1969) fouad thatthe disadvantaged in rural areas were generally immobile while, in con.-trust, the urban poor were very mobile.
The mpbility of the rural- poor probably stems from the traditional natureof rural areas. The rural poor are long accustomed to the-distinct local cul-ture and value set. Furthermore, they are rooted to their homes by strongbonds of friendship and kinship ties. Thus, with their focal point on the
-traditional family hoMe, one would assiime that rural disadvantaged familiesire highly imrnobile:
In contrast, the majority of the urban poor are rbotless. Attracted to urbanareas by the opportunities- created by the industrial revolution, the-urbanp6or-have severed their bonds to their traditional- home and, thus,' aremobile;
Transportation is the tinalecenomic characteristic, used to characterizethe poor. In that regard Batchhelder (1971) and the New YorkTimes (Febrii-ry 13, 1976) -argued that the urban and rural poor have 6nsiderably less
access to public and private transportation than do other .segments ofr
3 9

society, and that this lack of transportation imposes severe economic hard-ships. Batehhelder and the Neu:, York Times pointed out that the lack ortransportation not only preVents the poor from finding and commuting tojobs, but also discourages industry from establishing new plants in theirarea.
Thns, distinct social, psychological, political and economic .characteristicscombine to serVe as a ne..,oric of interrelated concepta employed in describ-ing the,cencept of poverty and those who are in a condition ,of poverty (i.e.,the-disadvantaged) as it is conceived and articulated in this research. These ,.four charncteristici were used as criteria to: (1) identify, and screen the-7,..
and sample of the study, (2) characterize DFF, and (3)test-for-relationships between selected dependent variables (RDM, availability,,: usage of medie/information scources, and degree oflinkage\ of interpersonal irifOrmation sources).
The Concept of Dectston-Making -Decision-making in this study was defined as the riroceaa by which DFF
arrive at preferred ends. Decision-making is recognized uniierseilly az anintegral part of human living. -Each individual is involved in a ientinual-
--sequence of decisions from.his first to his last waking moment 'of each day:-Tannenbaum (1950) recognized that unconscious or partially consciouschoices are made, but concluded that decision-makinceis involved when thesedecisions are conscions.
Decisions are either rational -or irrational (Litchfield, 1956). Thosedim'en-sions of decision-making may be viewed as a continaum, with rational, at oneend and irrational at the other. The efforts of the present atudi were toascertain the relative degree of rational/irrational dimensions in DFF's-
_decision4naking.The Psychological process of personal decision7making appears to be ihIL.
perfectly understodd, 'a ..process characterized as unfathomable (MacIver,1943). Yet, decision-making is ad-pernasive and so important to both theindividual and the family thatinuch effort has been expended to understand :the decision-making process and to give it Structure.. A structured processwould be useful in providing plausible progressions in decision-making,organizing facts and resources, defining objectives, and identifying a climac-tic point at which decisions.should be made and actions should be taken.
The process used both to conceptualize and to measure deeision-makingamong DFF ecnompassed a series of actions to include the snbprocesses 'of(1) orientationbeing aware of goals or problems; (2) observationAeekinginformation; (3) analysisanalyzing and choosing alternatives; (4) imple-mentationActing; and (5) 'feedback-- and adjustmentreassessing thechoke and accepting its consequences. The related literature -of decision-making suggested that, more often than not, the DFF.may arrive at deci-sions which are far from rational. For purposes of this study;rationality wasdefined as the degree.of conformity to is process pf decision-makingthe morerational the,. family decision-making, the more closely they were likely tofollow a process involving the five previously cited subprocesses.' .
Figure 3 was designe4 to facilitate understanding of the interrelatednessof the five subproCesses undergirding the decision-making process., DiaLKrammatically,the figure relates the selected psychological- and' social factorsto the rationality of specific major farm and home decisions made by DFF.

e rationality of each farm operabr and- horhemaker'S decision wa&sssumed,to fie 'the result of interiction effects of all'the cu)tural factors_that impinupon ,them at the time that each made the specific '--fairii/homd-decision. Theschema, was based on 7the assuniption that DFF demonstrate a degie or-ratiohality 'ranging toward' the lower end.' of _the rational/irrational cori-
Briefly, this- study purported that specified_farrn/home decisions are madewithin -specifie time' frames. Yet, decisions do notista-nd in isolation,'; Only inanalytic exercises- can a specifiC decision be .plucked from #r milieu, of
T .
c,olevant prior decislons and divored from its Consequences for subiequentMore deciiions. )
Deeision-making is depicted in IFigurC' 3 as a spiraling, circular process
Subctilture of the Disadvantaged FarnliFamilySticraL Psychological. Eionomic, and Political Factors _
_
Ex cruel Tic ors ernal Fac or
Social Factors PayekelogicalPacto
Relevant Prior Decisions
back-AdjuStment
Subsequent ,Decisi
...Orientation
Observatioir"
Analysis
Level of educatfur-2 = Participatiiin in organizations
' P2 = Preientifuture value orientation-
Figii-re 3. Schematic rein-esentation -of the decision-making process and--" factors related to DFF's degree of rationalitY in making farm/
home decisions

Each' rational decisionene-iimpassing the five ,siibprocesses of orients--tion, s) Obierva-finn, (3) analysis,- .(4) implementation, and-.(5) .-feedbaek andadjustment-if foliewedcontributes to:-.4-higher level of understanding forfuture decisions. ' ; .
`.5 'tAlso portrayed in Figure 3 is 'the concept that all -the: subcultural concOmitaiitsof-.the---DFF impinge on-every farin/home ; decipion made- The.Aiumber-;of factors and nature of theiriihtfuenee- are unique for each DFFNevertheless, this enyironmen-Vshapes the quality\ of each decision.
: The number.'-ot .faiOrscon sci °LIB .or tinconscious-,involved,ki each decision perhaps is- infinite;_however, they all may:be divided into stimulating,
-situations outside the individual- and_internal or persorinl factors.cfSpecifiCally- fq1--- this -study, tlfe selected Thators of -level- of education.- and
psxticipation in organizations, poted as social factors, and_the psychologicalfactors:of age and present/future value orientation were isolated and pictUredas significantly impinging orr the 'rationality .of major firmfifonie decisionsmade by a DFE :-:
The discussionXbat folloWs7treati the five subprocesses of deci. _
aroUnd which rationality of DFF- was measured; .
OrientationBased on the reported findings, bFF decision-makers seem to be vaguely
. aware:of problems, restless and uneasy about concerns, but far frein definitiveabout the secitic problems or goals that are the basis for their decision-- ,making (Weller, 1966). Long-range goals seldoin are a part of their repertoire.and 'those ga-Sls verbalized are at' best fuzzy, unclear generalizations ratherthan sbarplyfocuied objetives toward-Which definite steps-might be plannedor taken.
ObservationPhysical Mobility_roserittions and litek of such physical conveniences as .
telephones and electricity, COupled with a jaundiced, often reactional-upder-sfinding of the roles of governmental ageneies and other servicesnow____.,trike-fi -for granted by.:the larger society---,critically: reduce the process -ofn-eeking alternatives for the DFF _(Ttm -People' Left Behind;--1967). Traditionsand "'the sacred" Substitute for-the-scientific, as,theiDyF usethost sourcesreadilY accessible :to them when develiming: potential alternative gohls iud.solutions tn.-their.felt,problems.
The -extended family- (all those persons -defined as being kin and their-several -nuclear' families, Bertrand, 1967,-:p. hai-- al vast storehouse _of ..-ailswers to problems, moat of which haVe been "provenP by the test ot timeand-which-take on-iiiinething of "the sacred" as-they have been perpetuated .
pseudo;k-ncrednesp_dampens any willingness to_shall_enge_ the authority_of elders, in whom this.Storehouse of s'olntions is vested; andalTrecilitributes .
-suhitantively__to the -reluctance_of-disadvantaged families to .turn to newsources hf_information that may challenge the old.
Since`waily. disadvantaged families are functionally illiterate it wouldappear -that printed information Would haVe a.minimal interest or value-to.them. NeWapapers probably would not, be a regular source of information, -farm magazines would be .irregularly-Belivered to their doors, and neitherwould have Significnnt impaCt for.either introducing new-ideas or reinforcingneW ideas gleaned from other sources.
st="4

Television i4o are a part of the. daily life of almost all of dis-advantaged families (1,-.; ri and Greenberg, 1972): However, _the -reception,of informatiOn- from those so distorted and modified by their con-textual screeni, as Mediated bi- 0.,---:--._understanding of their -resources andtheirlpast expe.riengs,_that,the,intendeu-.::leaning often is lost and_the_infor- - -
mational opportunities accordingly reduced.," ''Contacts with adult education agencies and- other i'..-^arch-oriented sourcei
of information often-are severely redueed shch coasid'el-2!iOns as the fact .that work patterns-Of the disadvantaged and their Modes of trzusportationmake it next to impossible for them to contaet these' agencies during regularworking hours. Gulfs are often wide between these/families and, successfulfarmers and homemakers due to-problems of social diaance- and-class struc-ture.. That gulf makei-the--eiCharige -or flow of; informntion from the moreTsuccessful members of society at best only-a minimal trickle of information:
Since.DFF often are characteriied as preaent7oriented; it is not inconsistentthat they seem, unwilling to take the time,' effort,., and expen'se that -an
- outsider may deem necessary to gather appropriate information to make a ,
.satisfactOry decision.
AnalysisAccording to data presented by Schomaker and Thorpe, one may 'conclude
tfia. the DFF give only one Course of:action serious considevation. ThiscoUrse is either-accepted or rejected, and constitutes the extent of the analysismade.-Extensive time is rarely.spent ih the business of analyzing and,weigh-ing any number of relevant alternatives. Instant decisions, or those requiringonly a few-clays,' are an accepted factor in their livesan anticipated mani-festation of their "now" orientation.
-.- I
Irnplenientationt!Icp attempt was 'made to analyze criticall, the process of implementation..
'Th,e decision of a DFF was accepted as given in the sense that a decisionverbalized and further aeknowledged as being relatively iMpOrtant amohgthe decisions made during the past yelir was assumed lo need no furthervalidation: J_
Feedback aud -AdjustmentThe final phase to beVerified and eausidered -for evidence of rationality of.. ,
..DFF deeiSion-making Was feedback and, adjustrnent. Consideriag_ the paucityof information generally sought by the DFF and the minimarpartieipation 'af-others in their decigiaii:Making process, one may' assume that` DFF find"standing beha their decisioni:difficulf (Reeder, 1965; Weller,- 1966). Thetendency-fa toward "buck-passing"_concerning the responsibility for actuallyisking, decisions. This is especially noticeable where the decision is one
that was not satisfactory.e,ra
The Coricept of CornneuhieationThe Model used in this-study to conceptualize the communication liroCeis
was adapted-from models developed by (1960)-and-Rogers and Shoe--maker (1971). As indisated by Figure 4,. the, model conceptualizes communi-.cation as a process that includes the eletherits of: (1) an information "source"that encodes a message, (2) a 'Ynessage" to be transmitted, (3) a -channel" to

transmit that message, 4) a "receiver" to derde the message, and (5) theeffects" of the missage on the,receiver. The entire communication process
-occurs within .an existing social-cultural conte
_Interpretation of the Cortmiunication ModelThe, first major elernent of the communication model (Figure 4) is the
-source. Communication originates with the source, who encodes a message. ;intended for thireeeiver. In this study educational organizations and agencies
(EOA) represent thesource. There are-four factr -rs associated with the sourcgnamely: ,(1) communication' skills, (2) attitude , (3)- knowledge level; andl4position within a social-cultural context. :B rlo (1960) argued that' pibsefaCtors have great influence on the fidelity a d content of the mesSage!
In this study the people 'Comprising the soUrce (BOA) are-the products oftheir social-Cultural context. Thus, the rthmunication skills and/attitudes
Further ,' the knowledge' level EaA represents the/educatIonal. fof--FOA-probably reflect the Of the peoplei'staffinglhein. -,_
, programs/information that the dominant sOcial-cilleural forces deem desir,., able to disseminate.':-"T ,/
The second major element identiOd in Figure 4 is the m ssage. A messageis defined _as the actiial physical .ftoduct of the Source./fn verbal communi-,_ . _
ation the speech is the measage; in written conununication, the wAiting ii---T,
the mesage . In .analyzing the mesSage, fierlo suggested three factors to..
-co icr t essage code, the message content, and.the message treatment .code is a gr of synibols true to be meaningful to a target
audience7(DFF). Mu ing up that c are a, abulary- and a set of pro-, .
cedures (a syntax) foi meaningfully combining tho elements . Meisage con-.,-,tent is the educational program/informationknateria selected by E0A- to be- disseminated to DFF. Message treatment;is---daned s the-decisions which
the communication source makes in selecting-,and,arranging both codes and t
content. There are numerous testimonies that:the manner in which the mes----qsagel's ,treated is_ the result of cultural inflUences (e.g., Schramm, 1965;
Smith-, -1966). Thus, it is to be expegted that, -in treating messages, middle- .-.:_class members who comprise ECU will share common characteristics uniqueto their culture. There is-countless testimony, that the---igabulary and syntaxof the middle-class culture..deviates greatly from that of the poverty sub!.culture (Bernstein. 1960, 1969: Deutsch, 1972). 7-
'The channel is the third Major element of the communication model. Asthe 'medium used.by EOA to transmit the Message to DFF, the channel may:involve either seeing, hetirinm-touching; smelliiig, 'or tasting. Interpersonal,mass,- and publications media are examples of channels.-- Media availability ,is apparently ,. high an-long the disadvantaged. -For example, Dervin and-Greenberg's (1972, p., 6) survey of the communicaticinT-environrnent- of theurban disadvantaged revealed that: . ..
--- -95 percent of the low-income urban households had at least one TV set'Almost 100 percent of the households had at-least one radio
-50_45 percent _ of the households had a. least one daily newspaperavailable regularly_
=The average loW-incorne black family had two black periodicals avail-able regularly-
Thus, one may conclude that, While disadvantaged households art poor theyi.:are,.not_media poor.
\32 \,

.,...SOCIAL=CULTURAL CONTEXT. OF D, ISADVANTAGED FARM FAMIGIES
..
SOUM MESSAg RECEIVER. ----74-IFFE.C.TS
-4 Encode + Mode.
Educational::
'organizations
and agencies
(EOA)
Research.
based
information
I
Interpersonal: Disadvantaged Change:
Changeagents. Farm Families'
Church (DFF) Cognitive
Dealers ,knowledgr.Parnilyilfriends.
neighbors
'intellectual
abilities and
akilla..
Newspapers :
. .
PubliCafions:
'Bulletins,
paritpltlets
farMer's'
Almanac::
MagaLines
Affective
interests,
attitudes,
valuta, appro.
dation and
ladjustment
Psychomotor.
manipulative or
motor skills
(muscular rim
dination)--
IN
1
_ ,
Figure 4, An adaptation oerlo (1960) and Rogers and Shoemaker's (1971):communication'inidels
FARM AND HOME
-DECISION.MAKING :.-

Althdugh the disadvantaged have 'access to a great -variety of electricaland printed channels-of communieation, the interpersonal channel is probablythe most Important to them (Wakening, 1952; Rogers and Beal, 1957; Welk
1, 1966; Anderson.and Niemi, 1969)...-Weller_(1966) offerecr thLfoll6Wing_argument:to--explainWhy. interpers-onal':
:relations are particularly important to the disadvantaged indiVidual. Ac-.
cording to Weller, this individual is generally person-eriented, rather thanobject-oriented; that is, he/she strives to be a perion within 'a groupT_to be .'liked, acCented,' and noticed. Life goals are achieved with relation toother
(=sons and are a product of participation in the group. Such an orientation. , . -.
ems from the limited achievement and advancement opportunitiea availableto.-menihers of the disadvantaged culturerestrictions that force-people backinto- themselvea-to find the rewards of life. .
e receiVer is the .-fourth 'element in the sommunication model: :'Thereceiver (DFF) is the target 'audience_for whom the message is ;intended andwho must decode the message._Aust as communication skills, attitudes, andknowledge lnfluerice- the way, in which EOA encode messages; they also
7 influence the way in:which DFF decade those messages,- .
Ai a result.of their social-sultural cantexL the disadvantaged are_generallyperceiVed as having'poor CoMmunication skills,.Their low levels 6f education,
'their lack of vocabulary and their emphisie on the soniTete and physical .
rath-er than the abstract) combine to prevent them from deieloping adequacywritten and verbal expression. .
Disadvaritaked-Jahn-families attitude toward themselves and the largersociety affects the way that ;DFF decode messages.; -Considering first theattitude of the disadVantaged toward themselves, the- disadvantaged char:acteristically have low self-concepts (Anderson and Niemi, -1969; Sneden,
- 1970). Their dependency, habita 6f-suhmissioa7-lack of Verbal facility, lack ofskills and knowledge; and their early% experience of-failure in school all con-tribute',to that poor self-concept. -As for attitudes ioward thelargerlocietyrthe- disadvantaged, as mentioned -earlier, .eichibit considerable 'distrust andhostility,- to the authority and _power I-ea-filing there.,In addition, the dis--advantaged as Contrasted -with the advantaged generally have higher ratesof antania and more feelings_ Of powerlesSnesa (Meir and Bell,. 1959; Bell,1975),., The amount -of knowledge' that DFF- possess is a factor affeeting the .decoding patterns. Obviously, the greater the knowledge the'greaterability-fo correctly decode messages. It is to be expected that the low levelsof education among (he djsid-Vantaged and their lack of exposure would'cause their knowledge level to be narrow (relative to that Of individuals in ,
the larger society).Social-cultural context of OFF-isalso a 'factor that affects their cornmuni-
cation behavior..Figure 4 reflects" the communication process as occurringwithin the social-cultural contextReale_from_different cultural backgr6undscommunicate differently, which, jn- turn eXerts a -great influence, on itheeffect of the meisage. This study maintains that the diaadvantaged eXist in asocial-cultural context of the poverty subculture'; that members of-that sab-culture are characterized by distinct social, psychological, political andeconomic , characteristics. When a source outside the poverty subculture.attempts to coinmunicate with ,(he -disadvantaged, social-cultural barriersmay arise that impede communication. There is reason to believe that the,soCial-cultural context of 'DFF predisposes them+ to reject new information'and`practices, i.e., to be "laggards."34
4 6

The final element of the communication model is the effect of the messa- son OFF in farm and .home decision-making More specifieally,- does the mes-sagt tiansmitted b EOA result in-some Change (cognitive, affective. psch'unotth ) or overt behavior of _OFF? Do OFF: for example.- accept arid put
0_Iiractice _researeh,based n format ion _when maki ag_Airm_ and _home__ioriN?
concept of Lii!leoge---Irr=cointruiCriii with information that may- oi rna not heclosely:linked to ii, resear4.: base. The term !linkage" is_ueed.to refer to.tbe_,distance selial:ating' the Mformadon sources used by OFF from-a research--based information source.
In researching the linkage' .between interpersonal and research-basedinformatien sonrces among- OFF, the focus of this study, was on the inter-personal Media.' a media establikhed earlier- aa'Theing extremely importantto the disadvantaged. (1970) indicated: that perstinal sonrces of_ infor,
_mation seem to offer the._best means of effectivo educational communication -
with disadvantaged karniers linfortunalely, interpersonal relationships donut always In ing ahout an 'exchange- of::+t-..esearch-based information; In-fact;informationcommunicated through interPersonal Chinnels may be far re-,
moved from a research-based source and irrelevant as a basis- for rationaldecision-making.
The koncepts of hornophily and hoterophily .are of major iMportance inUnderstanding the .flow of cOmmunication through the interperSonal channel.Hornophily --refers. to ,the degree td which interacting pairs of individualsposSesS the same beliefs, valuei education, social status, .and= other .stichattributes. fIeterephhy refers _to the thigree ,to which interacting pairs drindividuals _are different in particular 'attributes. Rogers and .Shopmaker
p. 4) tied th'Ose concepts to communication when they wrote that "oneof the' obvious principles of human''dommunication is that the transfer of ideas&curs most frequently between a source and -a destination,whp are . . .
homophilic_"; that:is. the individual tends to intel-acCwith an indiVidual whOse-, attributes are nearest his own.-When individuals break the hornoPhily- boun-: dary and attempt conimunication with pthers who are quite different , front
themselves, 1 they often experience .ineffective cummimicatitin. Schramm(196.5,P. 6) interpreted the problni as one "in whiehmes-sages are encoded--in 'dile context and decoded in another, describing the problem-by constructing
.- the diagram shown -in Figure 5.
FI.ELn OF'EXPERIENCE
,=Sou ce==
FIELD OF EXPERIENCE
Figure 5- Diagram illustrating the difficulties involv'ed in cross -culturalcommunication (Schramm, 1965) ,

Schramm maintained that for commuiicatiwi to occur, the sourceencoder. :and the, deatination-decoder (Figure 5) must be in ,thine; Le, the source-encoder and the receiver-clecoder are not "in tune" when they have differentfields 'orexperience." Schramm (196) , p 61 explained his diagram of cross-,
ctilturaLcommunication as fol lows ,
The sou'rce -caw:encode; andihe deitination-Can-:dee-tide only ih-terfris- Of 7e- experience-each has had. If we have nefer learned any Russian, 'we
can-neither code nor decode in that lang-uage:-If,an African :tribesmanhas il'ever seen or.heard of an= airplane,:he can only---dee-ode the sight of a,plane in -terms'of whatever-experience he has had. The plane may seemto him:to be a bird and the aviator a god borne on wingir If the circleshave'a large area in common, then communication is easy. Ifthe.circlesdo not meet'`-if there has been ne common experiencethen cornmuni .catichuis impossible. If the Circles have only a small area in coma-ionthat is: if the experiences of source and destination haVe been .strikinglyTtunlikethen it is going- to-be very difficultio get -an intended meaning.across from orie.to the other. _
It is the contention of this- study ±that differences in social,---economie,psychological, and political characteristics make the fields of experience ofthe-poor and the larger society widely divergent (and thus heterophilic).Daniel (1968 ; p. 29). pointed Out' the differences'in those fields of,experience:
In one' set of experiences one has three balanced meals per day and inthe other one is lucky to get one dail y. plate of beans and a pieee of'bread Qne hai individual beds, and the other has to share a bed with twosisters Ind-a brother,,,Dne goes-in for regulaf medical and dental check-ups:- wierens the other views a -doctor's bill as missed meals;:_two -ormore n onths before-you: get a cheap, new pair- of shoes; and -one moremonth! ehirtslon thelight
Because/of ale heterophilic relationship betWeen 'the poverty subeultureand the lger society, formidable harriers exist to the communidation anddiffUsion cu f innovations. That situation has led to the use -of `'change agents"who, acc rding'to Spicer (1952, p. 15), are\"a 'I'm kind Of sPecialist . ._in
spieadin -knowledge 'and practice 'beyond the sMall world of the _college;educate,
Chan e agents attempt to alter traditional wayi--by- dernonstrat'ing theadvandiges of putting into,practice recent innovative discoveries. However,-heterophily exists'when the change agent interacts with the disadvantage43subculture.- A cultural gapleading to comthunication 'barriers arises wherein.additiorial cornmunication seurces are needed to transfer information le) thedisadvantaged afillience; "Opinion leaders" most often- constitute the addi-tional communication sources_ involved in the transfer- of information to atarget audience: The.eharacteristics of opinion leaders are Well defined in-therelevant literature, except foT the issue a social status. Smile writers (Katz,1957, Engel e t ol 1968) inaintain that opinion leaders are of the same socialstatus as .those they influence Others' (Rogers, 1962)- argue that- opinionleaders are of a higher SoCial statu-s. The concept of linkage was Used in thisstudy to examine to what extent.additisnal communication sourcea cause the -= ==.-
disadvantaged 'to .be separated from research-based sources Of information.The concept-was also used as the basis for comparing the characteristics, ofinterpersonal sOnrcea of inforMation (opinion leaders) with those of DFF._
For purposes of this study, linkage is defined as the actual chain of inter-..personal relations that facilitates the transfer- or relay-of informatiop froma source to a destination, AN illustrated 'in 'Figure 6. The -linkage- model

Communica i ChoinInformatien
A
_ge Eurce
age DSource
-.Stage..C'Source
Stage BSource
Stage ASource ,
CommunicationFeedback
,Figtire 6
esearch,BasedInformatioo'Souree
Change Agent Associatedwith Research-BasedInformation Source
Salesman -i3r OtherCommercial Individual
,
Local Opinion Leader
Family-Friends-: Neighbors
DisadVantaged . Rural\Farm Family
Schematic diagram of possible linkage betv)een a research-basedinformation source and the disadvantaged form fainilY
represents those communication sources, or links, that may be itivolved inpassing information from the research-based source ,of DFF (Figure' 6). /
. The word "may. is emphasized since not all of the sources indicaied by thebroken circlea \need be involved. In fact, in some in-stances the informationmay be tranSferied directly from the regearch-based source to the disadVantaged. In othee-situations, avo, three, or other -combinations of soarces may'
in threlay The model WAS:developed to facilitatean understanding of the concept of ItAktige and not to represent its actual Occurrence.Allport and Postman '(1947) contended that after five or six tranamissions ainessage loses a large pecentage ot-its details.
These four concepts iliacussed in this sectionpoverty, decision-making,communication, and linkage=:--served as the bases from which were generatedthe cibjectives and design of thiistudy

". METHODOLOGYThe methodology Used in achieving the purposes d objeatives of the re-
searich study is described in this section. Methods an procedures presentedherein are those used ih: (1) designing th research, ( identifying the dig-
-,-advantaged-area,(3)_designing the-dAta7sollection_instru ents,,(4),cellectingthe data, and (5) analyzing the data.
L Reseffifi. Design_
' The survey methbd of research design was utilized to seek a ers to the, _
study's six .objectives. AccOrding .to Hyman (1955), there Are t o .types ofsui-vey researchdescriptive and explanatory.IThe descriptive su y foeusesupon obtaining preeise meashrements of one .or more dependent.vaome defined population. In brief, it deals with the proper conceptu 1,zatioh
of a given phenomenon to_he. examined. The explanatory survey is ed toarrive at -.generalizations concerning relationships . between variabl bymaking quantitative comparisons of the, data gathered; i.e., (Hyman, 1p. SO) 4.tthe findings of descirtive surveys -are -a guide- to- theorizing
jleacntAtorY. surveys." types of., survey research' were utilized in .th- _
In addition, the researchJxchnique_of .content analysis Was emPloyed inseeking answers to the research objectives. The purpose of conteht analysishi to classify and quantify-unstructured material,in,this instance, kinds of
.major farin and home decisions made by disadirantaged farm families -(DFF)and attempt to analyze its .relationship to the stated research objectives.To accdmplish this eertain categories must be designed on the basii-of the
arelationships of the objectives to the content; the content then is classifiedor cole'd according to the designed categories. Such :.was the case in thisresearch in categoriiing the..kinds of deciSions Made by DEF.
2 Identifying the.Disadyantaged Area for StudyThe disadvantaged area in North Carolina delineated for this study evolved
from a special analysis of -North Carolina countieS: prepared- by the NorthCarolina Economic Development Office. On July 14, 1971; the office releasedri announcement identifying 33 counties in North Carolina as being eligible
for participation iri the Public Works and Economic Development Act of 1965.,\-(EDA) funds under Titles I and IV. Figure 7 shows the location of the coun--
tieS identified as eligible for \such funds under the two titles.Whereas-Title /I of the EDA dealt with "Grants for Public Works and
.Development.,Facilities," Titl'e IV focused oh "Area and District Eligibilityfor Redevelopment Areas." Title- IV provided the hasis for identifying thearea of 'major concentration of North Carolina DFF included in this study.
Area Selection CriteriaTitle IV, Part' A, Sec. 40 , of the EDA of 1995, as arnended, identified seven
. criteria to be utilized in desigmating "redevelopment 'areas." The sevencriteria .Were constricted' from certain socioeconomic characteristics thatundergirded the concept of disadvantaged ahd served as the basis for con.structing the criteria. The seven criteria for area selection identified in' TitleIV were (Public Works, 1971, pp. 11-12): .. .
Those areas where there:ha-a:existed' substantial and.- persistent unern;ployment for, an extended period of time and those areas in which there has

41
ympil UU
uinie
. ' .
;6:-
. 114d0;
Couniies eligible for.
EDA funds
. r.__ ._.! _ _
Stre 7. North Caro a counties eligible for participation in the North
Carolina Economic D'evelopment Act, July 14 19711 '

been a substantial loss of population due to lackufemployment opportunity;i_Those additional areaawhich havedinedianfamily income not in excess
of 50 per centum Of the national median, as determined by the rimA recentavailable statistics for such .areas;
-.72 .7=3 ThoseTikdditionifl-Federalr- Or --,State -Indian- Reservaticins orestricted Indian-owned land areas with greatest deirree of economie distiesson , the --basis of unemployment and income statistics and other., appropriateevidence of economic underdevelopment. -
4,_Those-additional areas Which the- lossremoVal; curtailment-or closingof ,a major source ,of employment has caused' within three years prior to, orthreatena to Leause within three 'years after, thecdate of-the request an un-usual and abrupt rise in unemployment ,rate for the 'area to.the time of _therequeat exceeds.the national iiVerage,or ean reasonabliKbe expected to exCeed
--the national average, by 50 Pep ce-ntum or mere unless assistanee is provided., --75:--AdditionnVereaa which/ were denignated redevelopment areas--under_-_, ;
!ha -Mei-Development 'Act on or after- March-L-1965:-"Provi&a, however,"that the continued eligibility of -such_areas after_the first annual review:eligibility conducted in, accordance With 'Section 402 of this Act,. "AnnuaRevieW of_ Area Eligibility," shall be dependent on their qualificatien fordesignation_ under the standards of economic need_set korth in the -'"AnnualReview of Area Eligibility Criferia.'-' =
6. Those communities or neighborhoods (defined-Without regard to political 2
or other subdIvisione or boundirios) which have 'one of the.,,following eondi-. 'tions: (a) n large eincentration'of loW,income persons); (b):rural areas hiving-substantialtoutmigration; (c),' substantial- unemployment; or (d) an actual orthreatened abrupt rise of imemPloyment due to the closing or curtailMent-ofa major seurce of employment I ,
7. Those areas where per capita employment. has decline& aigaificentlyduring the preceding tea-year period for which appropriate statistics areaVailable.
_
Figure 7 shows that 23 of the 34 counties eligible for EDA funds 'wereloceted in the _Coastal Plains area of Nerth Carolina, with the greatest con-centration in northeastern North Carolina and within 13 continguoui coun-,-ies. Thus the area 'with the greatest Concentration of DFF was in north-
eastern North Carolina. Based on -thin assumption and the criteria employed-by- the North Carolina EDA office in identifying counties eligible' for EDAftinds, northeastern North Carolina was selected as the area to 'he treatedin=thii sticly. The next decision was hoW to select the counties located within
..theareatohe included in the study.
I Pilot Caunty SelectionTo locate the specific counties in northeastern North Carolina to be in-
_ eluded in the study, a rigorOus set of 15 criteria was developed to guide ipcounty- selection. -Theseicriteris, _developed=in -1971,=were_based-on =sociosco-nom ic variables considered relevant for-DFF, and formed the basis on.vihichthe three target countiesBertie, Halifax, and Northamptonwere selectedfor study. These criteria specified that an eligible county have (U.S. 'Depart-
_ _
ment of Commerce,J960)1:1. Thirty-three percent or more families with income below the Social
, -
1 The 1q5 Coleus data were the meat iTeent aeallehle t the devalopid.,
5

ecurity Adminiatratiqn poverty cut offi,
2. An estimated median familYii come of less than 74'pergent of th6- U.S.county standard. .
. 3. Fifty percent a more of families characterized as pocir.--;4.-;'Total unemployrnenth igherthan the natibnal level:-
5.: Median years of education cornpleted by..those 26 and over to be less..,-than the national Median level of 10,6 years.
I . 6; Twenty percent or more of its total population 25 and bver with le-'1 than 5, years of schodling,
7... Fifty percent or more of its housingunits leaking tome or all plumbing: . .
;.facilities or dilapidated.' '--; 8. Seventy-five pert.ent- or more of its population-residing in rural areas,
. ..:' Fifty percent br more of the total pepulation non'-white.
TWenty_!five percent,or more-housing units. with more than 1.01 persons. ,ioom. ,
.
'.-
/11 yr' Twenty percent or more of children under 18 years of age living in,.
broken honies... 12._ Thirty percent orMore of its tetal labor force in agriculture.
13. -Percentage of practicing physiciaha per.- 100,000. population less t an,the national norm.- .'
14. Percentage of_infant deaths- per 100,000 live births. rgreate_national porn
15; An estimated 12- per ent or more_ of out-migration between 1960 and,:.1970.
-
A
Based on these 15 criteria rind eligibility of counties for k:DA funds, data._,v-erc., compiled for._.12_. counties located io. northeastern. Ntn-th CarolinaHertie, Camden, Currituek, Dare,.Gates, Halifax, Hertford, Hyde, Nbrthamp.-ton, Perquimans, Tyrrell, and Washington. Whed,the 12 counties were rankedon the- basis of.the 15 criteria, Bertie, Halifax, and Northariipton fell in the'upper quartile. Fourteen of the 15 criteria were- et by Bertie and Northamp-toncountiea' And 13 bi- Halifax comity. Figure shows the location of thethree counties included inthe study.
3. Bapulation and Sample---A-DPF"waY'defin'eiliTr thini:WITO;-'filid7b1 I wily t gdther
and 'meeting the criteria \-?f: (1) farming a uction,unit of 10 acres or Morefrom .which total receipts Were $50 or re annuallY,-,..or farming a productibnunit of, 9 acres Or less froni which a, t tal annual return of $250 or more wasrealized; and (2) 'having an income b ow the eligibility standard sqt -.1972for the North.Carolina Social Serdces\Food Stamp Prograin'(i.e:, 4,320 per-year for a family of four). .
Since 95 percent of the total bniverse of farnis in the three selected countieswere included on the rolls of the Agricultural Stabilization and ConiervationServi0- (ASCS),- assistance-was-requested from that agehey in drawing theSample for the project. County ASCS office managers ;in the ,three target'.counties supplied a list of all -farmerswho were farming 50 acres or less in
:their respective counties: This list -included the names-. of 1200 farmers inBertie County, 1460' in Halifax county, and 460 in Northampfon County. TheASCS. Office manager and persannel in each counti-assisted .in purging the_ .
list df names- known not -.to meet criteya established for the project.Permission to involve personnel from- the: North Carolina Department of
- .

.
1171'?,
Pilot tonities Included ia the,andy;
Bettie; Ha likx, and:Northampton
lotion of ilorth Carolina connOes included in the study
iLl
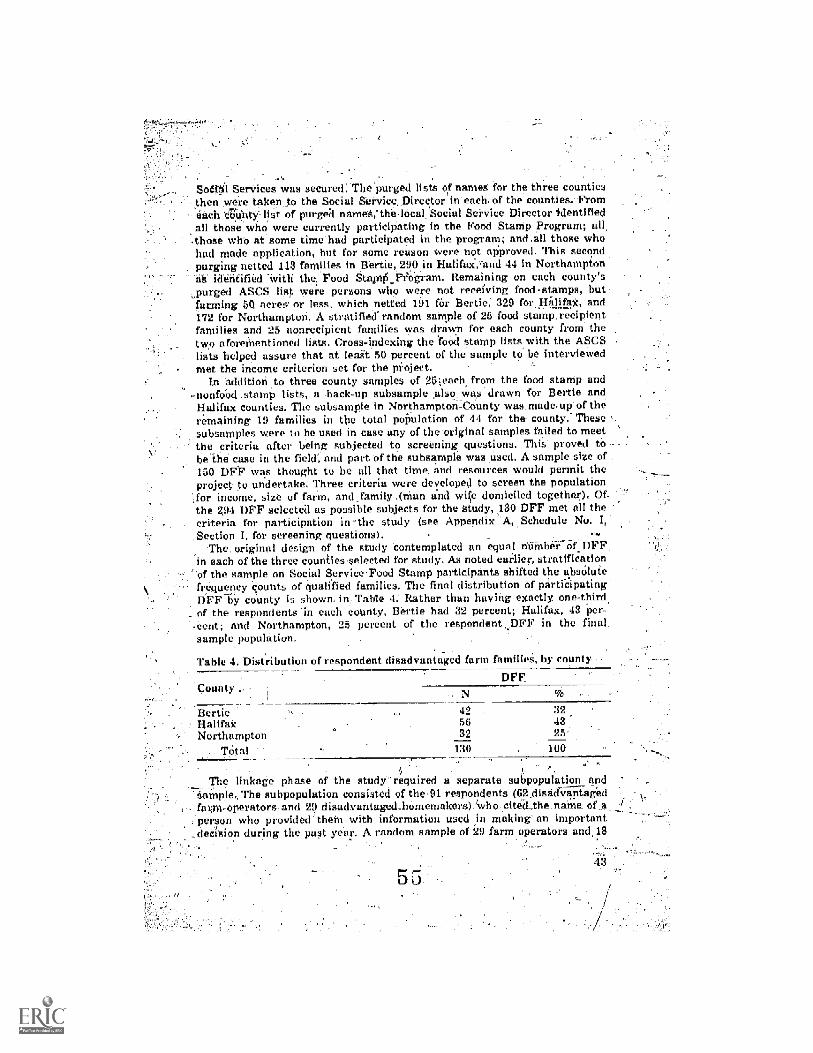
So-431 Services was secured. The purged lists of names for the three countiesthen were taken ,to the Social Service Director'in each- of the counties. Fromeach eilinity- list of purged nameS;the-hical 'Social Service Director tdentifiedall those who were currently participating in the Food Stamp Program; all
-those who at some time had participated in the program; and all those whohad made application, but for some reason were not aPproved. This secondpurging netted 113 families in Bertie, 290 in Halifax,.and 44 in Northampton--di identified With the Food Stapi-O_Feogram. Remaining on each county'spurged ASCS list were persons who were not receiving food.stamps, butfarming 50 acres- or less, which netted 191 few Bertie, 329 for Halifax, and172 for Northampton. A stratified' random sample of 25 food stamp, recipientfamilies and 25 nonrecipient famihes was drawn for each county from thetwo aforenwntioned listS. Cross-indexing the 'food stamp lists with the ASCSlists helped assure that at leait 50 percent of the sample to be interviewedmet the income criterion set for the project.
In addition to three county samples of 25;,each from the food stamp and-nonfood stamp lists, a back-up subsample Also, was drawn for Bertie and
Halifax counties. The subsample in Northampton-Oo'unty was.made.up of theremaining 19 families in the total population of 44 for the county.' Thesesubsamples were to be used in case any of the original samples failed to meetthe criteria after being subjected to screening questions. This proved tobe the case in the field, and part of the subsample was used. A sample size of150 DFF was thought to be all that time and resources would permit theproject to undertake. Three criteria were developed to screen the population
',for income, size of farm, and ,family .(man and wice domiciled together). Ofthe 294 DFF selected as possible subjects for the study, .130 DFF met all thecriteria for participation ia -the study (see Appendix A, Schedule No. 1,
.Section I, for screening questions).The original design of the study contemplated an equal niiniber of -DFF.
in each of the three counties selected for study. As noted earlier, stratifieationof the sample on Social Service-Food Stamp participants shifted the absolutefrequericy counts of qualified families. The final distribution of )MrticipatingDFF by county is shown in Table 4: Rather than having exactly one-third.
. of the respondents 'in each county, Bertie had 32 percent; Halifax, 43 'per--cent; and Northampton, 25 percent of the respondent ,,DFF in the finalsample population.
Table 4. Distribution of respondent disadvantaged farm families, by county
County __
BertieHalifaXNorthampton
Total
DFFN
42 3256 43:
-32 25-
130 100
The linkage phase of the study-required a separate subpopulation andSample. The subpopulation consisted of the-91 respondents (62.distidvantaged
perators-and-29 disadvantaged=homemakers) Who cited_the_name=ofperson who provided theM with information used in making- an importantdeeision during the past year. A random sample of 29 farm operators and,18
55

homemakers w s selected from that population to serve as the bench markfrom which to trace the linkage between interpersonal sources of informationused in making farm And home decisions and research-based informationsources.
4. Designing the Research InstrumentA research instrument, specifkally designed for this stc1t %O5 used to
obtain data regarding the si previously stated research objectives: (1)charactristies of DFF; (2) kinds of decisions made by DFF; (3) rationalityof the DFF's decision-making process; .(4) the availability, usage and credi-bility of media and information sources; (5) the linkage betWeen informationsources DFF used in making decisions and research-based informationsources; and (6) the relations:hip of Aelected sociopsychological variables toratienality in decision-making, to availability, usage, and credibility of
d'a, and to degree of linkage between information sources. A copy of theresearch instrument appears in Appendix A. A description of that, instrtimentfollows.'
Characterialks of Disadraniaged Farm FamIiesSelected characteristics (sociocultural, psychological, and political-char-
acteriStics of individuals and socioecOnomic characteristics of family units)were used in attempting- to characterize the ()FT who comprised the studypopulation. Those characteristics were: socioculturalage, education, employ-ment status, social participaticin,- and years of residence on present farm;psychologicalanomie and present/future value orientation; politicalregis-tered tO vote-voted in 1972-eleCtion, and know elected representatives; andsocioeconomicethnic backgToUral, income level of living, family healthindex, number in household, type of household, tenure arrangements, andyears_in present tenure arrangements. Most of these characteriStics weremeasured by-simple_ '`yes" or ''-no" responses. However, the measurementof level of living. family imalth index-,. social participationLanomie, andPresent/future valu'e orientation i.equired more Sophisticated- iristrumenta,tion.
The level-of-living index was developed by giving a score of 1 to the DFFfor having each of the following items (in working condition): electric or gas
e _ctrie or gas refrigerator, cold l'unning water in the house, hotrunning water in the house, bath or shower, kitchen sink, vacuum cleaner,washing machine, window air conditioner, home freezer, sewing machine,television, radio, and telephone. An additional 1 point each was given if thefamily rreceived these iterhs regularly: daily newspaper, weekly newapaper,farm magazine, and other weekly or monthly magazines. One point was givenif there were more rooms in the house than there Were members of the family.A maximum score of 21 was possible. Data were collapsed by placing approxi-mately equal numbers .of DFF into each of three categories: low = 4.9;medium == 10-14; and high
.The famiTy health index quantified the health of the family and the healthcard that 1,t, teeei veil. This 17-question, index gathered information regardinghandicaps. illnesses and 'dental problems, medical and dental treatment,health insurance, and the amount of money spent annually on family health.Depending on the context of the question, responses were -scored as either
or "3." Data Were collapSed by _placing approxiinStely-equal num-
44

hers of DFF into each of three categories: low = 0-3, medium =- 4-6, andhigh 7-9.
The Moon-McCann (1966) variation of Chapin's (1928) social participation '
scale was used to measure social participation. The scaling procedure calledfor assigning a score of "1" for each membership in an organization, "2" foreach organization in which one-fourth or more of the meetings were attended,and "3" frr each office or commit,tee post held. Thus, any farm operator orhomemaker could earn a maximuniseore of "6" for any one organiiationin which, they participated. The, total scores could range from zero to 36.Three levels were .establishedlow = 0-11, medium = 12-26, and high27-36. r
_
The Moon-McCann (1965) adaptation of the -Guttman-tyw anomie scale; developed by Srole (1956) was used to measure anomie. Six statements were
posed to the respondents, with responses scored: agree 1, don't know ==2, and disagree 3. The minimum possible score was "6," with a possiblemaximum of ".18." The lower the score the higher the- level of anomie prnormlesaness. Three levels of anomie were establishedlow 14-18, medium=-,10-13, and high = 6-0. ;
The instrumentation to measure presentguture value orientation wasadapted from Rosen (1956), who measured time values with a series of care-fully worded statements designed to ascertain an individual's specific timeorientation. Seven of Rosen's statements were adapted to provide a-present/future value orientation scale. The question of response set (Kerlinger, 1964)was considered, and five of the sei?en questions asked (1, 3, 4, 5, andA) werede,sigmed to be answered negatively to offset the tendency to agree or dis-agree =systematically ,with items, regardless of content. The tWo remainingqiiestions were developed to be answered positively. Scoring in .the inter-
- ews -was based on: Agree = 11 Uncertain k= 2; and Disagree -= 3 forn gatively worded items. For positively -Worded items the scoring was based
=o Agree = 3; Uncertain 2; and Disagree -- 1. The scoring limits for theponses were 7 and 21. The higher the score the greater the future value
rientation. Scores were grouped into Low .-- 7-12; Medium --- 13-16; andHigh 17-21 categories.
,
Kinds of Decisions Made by Disadvantaged Farm Families
Drawing from the literature on farm and horne.management, a comprehen- 1
, sive tentative classification of farm and home dedisions was generated anddefined (categories and definitions were finalized only after careful pretestingof the data collection instrument). kter establishing ands-I:Wining the tenta-
\ tive decision categories, two tasks remained: establishing and defning the ,
final categories and determining th reliability and validity of the Categories.Determination of the final categ ries required-that data be generated and
analyzed. Those data were genera d through a field test proCedure thet,hadeach farm operator (husband) .and 'homemaker (wifeNnterviewed state two
,
or three of the most important decisions made in farn;:ig or homemaking',during the past 12 months. Fro.rn the two- or three ecisions identified,respondents were asked to cite the one most important deision.
A randomized sample of, the one most imprirtant farin arid home decision.cited by the respondents in the pretesting of the instrume"ht allowed thetentative categories of decisions to be refined into final categorie\s to be used1;41identifying the kinds of decisions made by DFF. The resulting farm and

home decision categoric's and the definition of each appear in Appendix B,No.
Using the -revised definitions for each category, a panel of judges com-prised of knowledgeable individuals coded a random sample of both farm andhome decisions; the research team also coded the sample. A comparison of thecategorization of the panel with that of the research team iR shown in Table 5.
Table-5. Judges' agreement with research team's cfarm and home decisions
egorization of sample
Judges -
Agreement, %Farm Decisions Home Decisions
A 85.8 85:8
'B 71.6 100.085.8 85.885.8 85.8
Total 82.3 89.4
Average 85.8%
One judge categorized all the home sample of decisions exactly as did theresearch team, His categorizations of farm decisions varied most widely, with71.6 percent agreement., Agreement with home decisions was higher (89.4percent) than with farm decisions (82.3 percent), for an average agreementof 85.8 percent. This high level of congruence supported the claim that thedefinitions for categories used were both reliable and valid. (See Berelson,1952, pp. 169-174, for procedures on validating categories in content analyzis.)
Rationality of Decision-MakingAt the time this study was conducted, to the researchers' knowledge no data
had been gathered to study the rationality of the decisions made by DFF. Toobtain a consistent' measure of ,the RDM of DFF, a heuristic standard wasdeveloped. Within the framework of the decision-making schema,.synthesizedearlier and based on descriptors suggested by Rieck and .Fulver (1962) andSchomaker and Thorpe 1(1963), a set of criteria were developed tO provide abasis for measuring the rationality of the process of decision-making as con-
-ceptualized-herein.To reiterate, rationality, as used in this study, is a measure=of the proceSs
or means used to reach goals. As indicated earlier, the DFF deeision-makingprocess consisted of a series of actions consisting of the five subprocesses oforientation, observation, analysis, implementation, and feedback and adjust-ment. Rationality was measured by ascertaining a score from respondentsto u series of questions which quantified conformity to those subprocesses.
in posing the series of questions regarding rationality, the prOceduresuggested by Ramsey et al. (1959) was adopted: Thoseresearchere cancludedthat each question might better be oriented around the raloptidn or evaluationof specific practices. Adapting, that idea,_two introductory questions weredeveloped to focus interviewees on specific decisions made. The first questionwas "What are two or three Of the most important farrn (home) decisionsthat you have Made during the past 12 months?" The second was: "Of thesedecisions, which one do you consider.to be the most important one you hod
to make?"The most important -farM/home decision' became the central idea outid
5 8

which the rationality scale questions were directed. Those questi-ons werederived from an investigation of relevant -literature and then refined byextensive field lestirkg with some 75 DFF. The scale was reduced to 12 items.Items 1-3 tested for conformity to the subprocess of orientation, 44 forobservatinn, 7-9 for analysis, and 10-12 for feedback and adjustment Items1-12 tested for implementation of the specific decisi n cited by farm operatorsand homemakers. Thus, nd sepaiate items were rquIred to test for imple-mentation. The items were assumed to be uni imensional; that is, allmeasured the same thingRDM.
To contend with the pos_aibility of a response s-thumbers .3, 6, 10, and 12) -Were designed to beeight remaining questions were developed to be anresponse, "doh't know," was included so that respoin either a positive or negative direction. Valuesresponsea were-: positively worded 3.= yes, 2 -=negatively worded 3 no, 2 = don't know, and-11-=- yes. The "don't know"responses were counted as "no responses" when the Idata were collapsed. Theresultant -scale was constructed so that the respondents who answered withthe appropriate eight "yes" answers and appropriate four "no'' answerswould received a maximum (high) rationality score of 36. Since both farm andhome responses were assumed to vary independently from least to mostrational, it was possible to obtain rationality indices ranging from a low of12 to a high- of 36. I
To test the validity of the RDM scalerthe collected data were subjected tofactor analysis,- using the Statistical Analysis System (SAS, Service, 1972)procedures, which include the Kaiservirimax rotation and criterion (Service,1972). Correlation matrices for the Rpm items for farm operators and home-makers appear in Appendix C, Table 1. The factor analysis served a twofoldpurpose: first, it served to check on the a prioli asSignment of items to thescale and, second, it provided the framework for determining the.eigeiwalues;or measure of the'amount of variabilitY due to each designated factor:
. One of the distinguishable bases for determining the number of significantfactors in a scale ih to consider all those factors that meet the statisticalcriterion of an eigenvalue greater than 1.00 (Kaiser, 1960). As a result ofbath the farm operators and homemakers' RDM scale factor analyses, fivefactors emerged _wall critical eigenvalues of more than the discriminatory-constant 1.00 (Appendix' C, Table 2). These five factors were consistent inexplaining 60 percent of the variation of the farm operators' RDM scale and81 -percent of the variation -in the homemakers' RDM scale (Appendix C,Table 2). In this exercise, to amplify variation in loading and to identifydefirdng items, each item was rotated in factor space (Appendix C, Tables 3and 4). Items then were ranked, and thoie that clustered toward the top endof the scores were used to define the factors (Rummel, 1970).
A detailed comparison was made of these grouped items with, the con-ceptual framework derived for this study. The comparison revealed-that factoranalysis had highlighted factorS fairly ,close to the original four processes .plus one additional factor:- Combining the defining iteme identified for bothfarm operators and homemakers revealed that two of the six defining itemsfor factor 1 were identified conceptually with the anslysis subprocess of theREM scale: Another deseriptive term for these items might .be "time."
For factor,2, three of the five defining items were part of the study obser-
t, 4 of the 12 questionsswered negatively. The
wered positively. A thirddents need not be forcedassigned to RUM scale
_on't Imow, and 1 no;

vation subprocess. Descriptively, these iterns-might also be- termed "outsidehelp."
Factor 3 also was defined by three of the four items. These three ,itemsconformed to the study feedback and adjustment subprocess, and might alsobe termed_ "involvement",!....-
Factor 4, identified as explaining some 10 percent of the scale variationsfor both farm operators and homemakers' RDM scale appeered to not con-form to the conceptual design of the study, and was not anticipated. Logically,,there.appears to be merit-in considering this factor as "time ressUres." Thisfactor is certainly an important yet poorly unclerstocidia _
three-of the-fotirlTenvy-rtirdc ing items defining factor 5 were seento conform to the study subprocess, orientation:
Thus, the factor analysis and resultant comparison gave support to thetotal RDM scale/as- it identified factors corresponding to each, subprocessoriginally Outlined for the study fOthough the analysis establis\hed neitherthe unidimensionality of the scale nor that of the scale subprecesses, theresults led to the conclusion that the scale, as designed, had, merit as aheuristic instrument for measuring resPondent RDM.
Reliability, or the capacity of an instrument to consistently measure thesame or a similar set of objects and obtain the same or similar results, wasnot an objective of this study. The heuristic nature of the research instrument-precluded any reliability testing. This must be left to later studies,
Communkation PatternsExamination of the communication patterns of OFF required measurement
of the availability, usage, and credibility ,of media and of the informationsources within those media. Availability Was measured by the number ofOFF having a working TV set or radio in the home and receiving daily news-papers, weekly newspapers, bulletins-pamphlets, the 'Fa i-iner's Almanac, and-magazines.
-Usage was measured by asking eaCh farm operator and homemaker toindicate the various sources they used in making a major' decision.
A forced-choice technique was used to measure credibility of informationsources. First, respondents were asked to choose what they perceived to be-the most credible source in the mass media. Then they chose the mostcredible source in the palications media. Next, they chose the most crediblesource in the interpersonal media. Finally, they were asked to choose between .the mass, publications, and interpersonal media the one source they perceived .
to be the most credible.
,Ginkage,Pattern .
in examining the information source linkage patterns of OFF, this researchwas detigned to measure: (1) the degree of linkage OFF had with research-based_informatio sources, (2) the trend toward heterophily , in comparingOFF with their direct interpersonal source of information, and (3)1 thecharacteristics of rsons who chanael information to DFF.
To measure the extent to which information used by OFF was linked to'research-based soOrces, this study first identified research-based sources,then 'traced the interpersonal sources that pnssed on information used byfarmoperators and homemakers in making important decisions. ,
48
6 0

To identify research-based information sources, a list of interpersonal/sources was drafted and evaluated by a panel of seven judges. From thejudges' responses, a number of sources were identified as either research-based or nonresearch-based (Appendix D).
To trace information sources the respondent was asked to identify thename of his/her information source. Those persons cited by disadvantagedsubject's as interpersonal information sources u.ere traced through five stages(A, B, C, D and E).
The information generated by tracing the interpersonal informationsources of the respondents also served to test for heterophilic relationshipsand to profile persons who channeled information to DFF.
The Relationships of Selected Sociopsychologigal Variables to ROM;To Availability, Usage, and Credibility of Media; and to Degree ar LinkageBetween Information Sources
The instrumentation for measuring the variables concerned with the studyof relationships has been discussed in the'preceeding pages.
5. Data Colie'etionData for the research project were-collected via personal interview from 157
DFF in the 3 counties-during .May, 1973. Prior to initiation of the survey,,the.local ASCS offic,l in each county sent a letter toeach family included in-the sample notifing them that they had been selected to take part in theresearch study and requesting their cooperation. It was felt that such ad .vance'notice of the appearance of the interviewing feams 'Would allaY fearson the -part of DFF of interference with current Participation in any SocialServiees program (e.g, the Food Starnp Program) Such publicjty alsowas viewed as allaying community leaders _concern that additional-govern-ment programs might be implemented in their countiei.
To expedite data collection, maps were secured from the three local ASCSoffices to facilitate the location.of each farm family selected' for interviewing.The original -ASCS list of names from which the sample ,waii drawn. includedbeeide each nanie' a key-code that identified- the location of each farm in thecounty. The county maps also included the same key code as shown on thelist of names, thoS making it possible foil the researchers to transfer thelocation key code number from 'the list Of names inchided in the sample to .their respective location on the County maps.
Individual interviews of approximately one and one-half hours per farmfamily were conducted by 20 two,metnber interviewing teams-Assisting withthe interviews were Extension administration personnel, Extension special-ists, faculty from the Department of -Adult and Community College Educe-tion, graduate research assistants assigneZ toTthe projea, and county Exten-sion agents from the' Northeastern and North Central Extension districts. Aformal, one-clay training session, it'as conductedith the_lnteryiewers prior togoing into the field. The next three days were, spent by these 20 teams inter-viewing in Bertie, Halifax, and Narthampton counties.
Each team was assigned six to- eight DFF to interview. To expedite timeand travel/these families were all located within a specific target area ineach county, and the approximate location was designated on the county mapprovided each team. Each team was responsible for locating and interviewing
6 1

all families assipled to them. A total of 157 DFF were interviewed.After all interviews were completed, a single code number,was assigned to
each DFF. Each instrument then was carefully edited to assure that allquestions had been answered, and that the codes were clearly interpretablefor keniunch operators to transfer the data directly from the instrument todata-processing cards. Twenty-seven instruments were not accurately exe-cuted and were discarded from the study, leaving a total of 130 usable instru-ments.
All raw data were punched into cards before collapsing and categorization.:The procedure was followed to accommodate current and future researcherswho may wish to use the data. The data were keypunched and verified at theNorth Carolina State University 'Computing Center. After verification, thecards were listed for inspection. Following a careful inspection of the listing,the necessary changes were made to correct errors on the permanent datacards.
6. Data AnalysisStatistical procedures used to analyze data and n-esent the findings in-
eluded: (1) frequency dist'ribution, (2) graphs, (3) chi-square analysis, (4)multiple regression, and (5) analysis of variance.
Processing of data and the statistical procedures were carried out at theTriangle Universities Computation Center using the SAS and StatiStical Pack-age for the Social Sciences (SPSS). The first .procedure was screening toidentify the target population as meeting the criteria for DFF. i.e., level of,income, size of farm, and family.
Data analysis to meet the objectives of- the study involved six stages con-forming to the six research questions used to guide the study. Those stages_were: (1) identificatiottof the characteristics of the population; (2) kinds ofdecisions taken by DFF; (1) rationality of the decision-making process ofDFF: (4) the availability, usage, and eredibility of media and informationsources within those media; (5) the degree of linkage between informationsources used by OFF in making decisions and reseath-based informationsources; and (6) the relationship Of selected sociopsychological variables torationality in decision-making; to availability, usage, and credibility -ofmedia; and to degree of-linkage between information sources.
Characteristics of Disadvantaged Farm Familiesh e soCiocultural, psychological, pelitical, and socioeconomic characteristics
used to describe DFF were grouped into tables. The corresponding frequencydistributions and percentages were then used to describe family units, farmoperators and homemakers by those characteristics.
Kinds of Deciaions Made fly Disadvantaged Farm Families'The measurement procedure for identifying the kinds of decisions made by'
OFF involved asking each respondent to indicate iinportant decisions madeduring the past 12 months. Decisicns were then coded into appropriate cat .-----gories which were identified prior to data collection. Raw data then weilegrouPed into frequency distributions and percentages for purposes of daanalysis and presentation.
6 2

lonality of Decision-MakingRationality of decision-making, it will be recalled, was measured by a scale
that quantified the degree to which the decision-making conformed to aprocess involving orientation, observation, analysis, implementation, andfeedback and adjustment. The responses to the scale *gre tallied and scores
_re collapsed into low, medium, and high. Frequency distributions wereused to develop descriptive information regarding farm operators and home-
_ers.
Communscation PatternsRelevant data Were grouped into frequency distributions and Percentages.
Using these distributions, graphs were contrueted to guide the analysis ofdata.
Linkage PatternsLinkage patterns were examined by tracing the chains of interpersonal
information sources used by farm operators and homernakers. The datAregarding those chains were analymed in the followig i-i-ianner. First, the
' number of chains separating the farm operator or homemaker from aresearch-based information source were .counted and based on that number,
. the degree of linkage was calculated and classified as follows:I. CloselY linkedInterpersonal information sources were-traced through
no more than twe communication links (stages A and B) beyond the dis-advantaged subjects before being linked to a research-based informationsource.
2. Distantly linked Interpersonal information sources were traced to stageC Veyond- the disadvantaged subjects before being linked' to a research-based.
-information spurce.3. Not linkedInteiTersonat information sources either (a) were traced
beyond stage C, (b) could not be traced for A specific reason, or (c) were.-traced to a nonresearch-based information source before reaching the filthstage.
Frequency distribution tables were then construdted to illustrate thedegree of linkage that characterized farm olperators and homemakers.
Second, to test for hpterophilic relationships, chi-square analysis was-usedto compare farm operators and homemakers with their direct source of infor.mation, and to compare the interpersonal sources that channeled'informationto farm operators and homemakers. The characteristics of those interpersonalsources were analyzed by the use of tables constructed according to frequencydistributions. '
The Relationship or selected SocioPsychological Variables to Rationality inDecision7Making; to Availability, Usage. and Credibility of Media; and toDegree of Linkage of Information Sources
.
-Data regarding the relationship between the selected variables and RUMwere-analyze'd by the use of two multiple regression equations,--one for farmoperators and one, for homemakers.. Chi-square analysis was used toestablish the statiatical iignificance of relationships of the selected variablesto availability, usage, and credibility of media. The relationships between
6 3
the selected variables and degree of linkage between information sourceswere tested by analysis of varianee. A .10 level of significance was selectedto test for relationships of selected variables to Rpm. A .05 level of signifi .cance was selecteii to test for relationships of selectel characteristics tomedia availability, usage, and credibility, and to degree of linkage.
7. -LimitationsThe press of time, =the searcity of resources, general circumstances, and,
oftentimes, the-absence of previous research to serve as a guide impose aset of limita0ons upon each and every research project. An exploratoryrtudy_ such ri`s-,thii is particularly vulnerable to many of the aforementionedforcds me following were the specific limitations of this rtudy:
a. The number of counties includerd in7the study was limited to those threein North-Caroline that appeared to represent the most severe.conditions ofdeprivation_ No claim isrnade that the-findings can be applitid to other states,other counties, Or other populations.. However, where similar conditionsexist, the extrapolation of the findings of this study is left to the discretionof the individual.
'b. A cultural gap existed between the studY interviewere and the respon-denta. Aa Mon ly (1970) pointed out, the very presince of the interviewer willaffect the'response he gets. Obviously, the likelihood of that type of bias-willbe even greater when a cultural gap is present.
c. The population of this study was highly bomegeneous. The resultinglack of variation might have influenced the tests of ielationships.
d. A .limited number of variables, selected` on the basia-of a revieW of the=literature and the_ experience of the researchers were 'used- 1 o test-for rela-tionshipi. There_is no certainty that those were the_most important variables.
Thel availability figures for billletini-pamphlOts and the Farmir's-Almanac were estimates.
L _Usage waa-measured _only with regard to one decision. Thus, discretionshould be used in generalizing to usage patterns.-
g. Because- the measurement Of credibility forced a ranking of the media/ --.-information sources; responses could be analyzed -only in.relati.,Te terms. Thatis,_the:.data alloWed observations to be made only- with regarci to the ,credi.bility- of one particular media/information2Source relative to snother. Thus,no conclusions were possible.'regarding absolute credibility _L..:
The degree of linkage-was measured only in the_interpersanal mediaiCertain interpersonal_ sources of information Were identified as being
esearch-based rand Were established as the- single criterion in detitinininggrthe deee of linkage:In actuality, t re was no assurance that all information
. .
relayed by those sources was in fact, research-based: Alsio,othei.-individualsnotincludid in the list of reSearch-based information SOurces ma3. have trans-
.
ferred research-based information to the disadvantaged redeivers.. z
The number -of decisiond_traced_in studying linkage patteinit was -small-. =
Only 47 disadvantaged subjects who'''cited interPersonal-informmion-sources=. . - . .
were traced.
RESULTSThis section presents the reiultS of the various analyses of data. The
presentatiön was =guided by the previously stated study objectives'. These

objectives 'sought to determine:1. Who are the isadvantaged farm families (DPP) and what are their
characteristics?2, What hinds of major farm and home decisions are DFF making?3. -How rational are the decision-making processes utilized by DPP in
making decisions?4. What communication media are available to DPP? What are the major
sources of information utilized by DPP in making farm and home-decisions?What ,credibility do DFF assign to their information sources?
5. What is the linkage between interpersonal information sources-used inmaking farm and home decisions and.research-based information sources?
6. What is the relationship between selected sociopsye-hological variablesand the: (a) degree of rationality in decision-making; (b) availability, usage,and credibility of media (i.e., interpersonal, mass, and publications) and theinformation sources' within those media; and. (c) degree of linkage betWeeninterpersonal information sources used and reseat-ch-based informationsources?
An interprctation of data analysis results for each cf the six aforementionedobjectiVes are discussed in the sections that follow.
.1. Who Are the Disadvantaged Farm Families and What AreTheir Characteristics?
,__-
Answers to objective 1 are generated from a sample,of 130 disadvantagedfarm families. Information on the characteristics of those families wasgathered by the personal data section,of the interview schedule. Characteris-tics used to describe DPP were groimed into social, psychological, politicaland socioeconomic categories. The personal data section of ,the interviewschedule yielded information on both individual farm operators/homeniakersand family units_ Tables 6. 7. and 8 show the social-. psychological, and politi-cal characteristics bf disadvantageei farm operators and homemakers of thefamily. units.
Profiles or the Typical Disadvantaged Farm Operator and HomemakerThe aforementioned social, psychological . and political characteristics of
disadvantaged farm operatcirs and homemakers were used to generate profilesof the respondents.
The characteristics of the disadvantaged fami operators and homemakerswere strickingly sirnilar and, thus, are presented simultaneously. With regardto social characteristics (Table 6), they Were an older population (the meanage of farm operators was 53 years, that of homemakers, 50. Only 5 percentof the farm operators and 8 percent of the homemakers were under 35 yearsold). They had low levels of educational attainment (farm operators hadcompleted a mean of 5.9 grades, homemakers,- 8.4 grades. Only, 25 percent offarm operators as ciimpared to 64 percent of the homemakers had completedmore than 8 grades; :36 percent and 8 percent, respectively, had no morethan a fourth grade education). Further, they: devoted the greatest part of
-their energies to the farm (61 percent of the farm operators worked full timeon the farm, and 72 percent of the homemakers kept house full time); tendedliot to participate- in organizations (of a possible score of 36 the mean-social
articipation score was only 6.7 "or farm operators, and 7.7 for homemakers,
53

Table 6. Frequency distribution of social ehfarm operators and homemakers
ristics of disadvantaged
SocialCharacteristic
Age, year,:25-3435-4445-54,5;6465 -or over
. Total
'Education, gra_4 'or less5-78 or more
Total
_Farm Operators Homemakers
Employment status:Work off farm full
time 140 hes/week ormore)
Work off farm parttime (less than 40hrs/week)
Work on farm full_timeOut of work andaooking
for non-farm employmentKeep houseGo to schoolUnable to workRetired
20 15-13 3340 3120 16=
130 100
46 3651 3933 25
130 100
14 11
10 832 2-1
38 2940 3110 . 8
130 100
1036 2884 64
.
770
610
130 100
17
15 12
4 1 92 720 o o 0 m -8 6 1 1
4- 3 0 0
Total 197
'social participationLow OHMedium 12-26High 27-36
Total
Residence on prestyear:
or less571)-
10-1920-29
_14(1 or more
Total
core' :
I Mean xice: farpl liperat,a- rz Mean Kea& erapleted: farpr_
Mean
54
10623
1
130
100
1
127 100
7730 23
0
130 100
14, 8 13 10.16 12 . 1-7 1332 25 34/ 213
29 22 33 _2,542 32 33 25
,._ 130 100 130 100...: iwnierriakee =
7p.1; hi.mernakee = +.1:farm i.peeraiir = 6.7: hiffnemaker
6 6
!

Table 7. Friquency distribation of psychological characteristics of dieadvan-' tagefl farm operators and homemakers
PsychologicalCharacteristic
Farm 0 Homemakers
Anomie score;High 6-9,Mediurrt = 10Low 14-18
Total
4121
130
523315
100
605812
130
4645
9
100
Present/future valueorientation score:
Low 7-12 41 32 42 32.5Medium = 13-16 46 35 42 32.5High = 17-21 43 33 46 35.0
Total 130 100 130 100.0
with 79 percent of the farm operators and 95 percent of the homemakers scor-ing in the lowest social-participation category); and were immobile (54 percentof the 'farm operators and 50 percent of the homemakers had lied on theirpresent farm for over 20 years).
Psychological characteristics' of-DFF examined in this study were anomieand present/future value orientation. A high percentage of both farm opera-tors (85 percent) and homemakers (91 percent) were mbderately to highly.anomie (Table 7) . As for present/future value. orientation almost equalnurnbers of farm operators and homemakers fell into each of the three cate-gorieslo w. medium . and highwith high being the most future-oriented.
As for political Characteristis, Table 8 shows that the farm operator andhomemaker are registered to vote and, indeed, do vote (73 percent of thefarm operators and 74 percent of the homemakers Were registered to vote inthe 1972 election, and 60 pereent of the farm operators and 59 percent of thehomemakers did vote). However they are not knowledgeable about theirelected representatives (a large majority did not know the names of theirelected representatives).
Table 8. Frequency distribution of political characteristics of disadvantagedfarm operators and homemakers
Political CharacteristicFarm Operators Homemakers
%
Registered to vote:Yes 95 73 96 74No 35 `_27 34 36
. Total 130 100 130 100
Voted in 1972 election:Yes 78 60 77No -'. n 18 32 . 25Not appl;cable 29 22 _21 .16
Total 130 100 130 100
6 7

Table 8. (Continued)
Political Characteristic
Know electe'drepresentatives:
County commissioners
Fa rrn Opera t Homemakers
Yes 23 IS 16 12 ,
No 107 82 114 88
Total 130 100 130 100
North Carolina HouseYes 6 4 3
94 126 97_Total 130 100 130 100
North Carolina nateYes 6
No 119 99
Total 130 100 130 100
Table 9. Frequeacy distribution of socioeconomic characteristics of dis-advantaged fr.rm families
Socioeconomic Characteristic
Ethnic background:Black 109 84
White 16 12
Indian (native American) 5 4
Total
come (total hobsehold):
130 100
:$1,000-2991) 68
$3 S)00-5,999 50 39
$6,000-9,999 11- 8$10.000 or _more I 1
Total 130 100
Family living indexLow =- 4-9 311 30
Medium = 10-14 42 32
High = 15-19 49
Total 130 100
Health index score:Low = 0-3 92Medium = 4-6 .36
High = '7-9Total 130 100
6 8

--Table 9. (Continued)-
Socioeconomic CharheteristicFamil ies
5ize4of faMifyl:2
10Tor moreTotal
Type-a household:Nuclear family':Grandparents and grdchildrenGrandparents, grandchildren,
and parentsHusband and wife
,,OtherTotal
Tenure arrangement:. All -owned
Cash renting(Share renting
Otherinadequate info_ -tion
Total
sent tenure arrangementless
5-9, 10 oi nipre
Total
1713
101512
5
130
12 -
9
100
26 2017 13
130 100
42.30-19
8-1
13( 100
14- 27.1
'!65
130 100
n sze Ii fsmily: 5.2 members.2 Husband mut w1fe plus 0-hose ebildren they blehtify thvir'.own,-anil for whom they assume
tlie role'of parents 1Bertrarid, 1967,-p. 369).
Profile of the Typkal Dizadeantaged Farm FmilyTable 9 describes the ()clue c`o nomic charl'aAei . tics of family units by ihe_
variabtes of ethnic background. income, family living index, health index,number in household, type of household, tenure arrangements, find years inpres'ent tenure arrangement. Based on the data in Table 9, the typical DFFmay be described as black;_with a.total annual inconie of less than $3000 .having-itecess-try-many-arnenities-of-life-(as-reflected-by-scores on-tii-e-__farnily_living index), in poor' health and receiving inadequate health care. Dis-advantaged farm families have a mean size of 5.2 members, are More likelyo he of the nuclear ,tyPe, have various types of tenure arrangements with,
the Present tenure arrangement having been in effect f6r ten or more years:
6 57
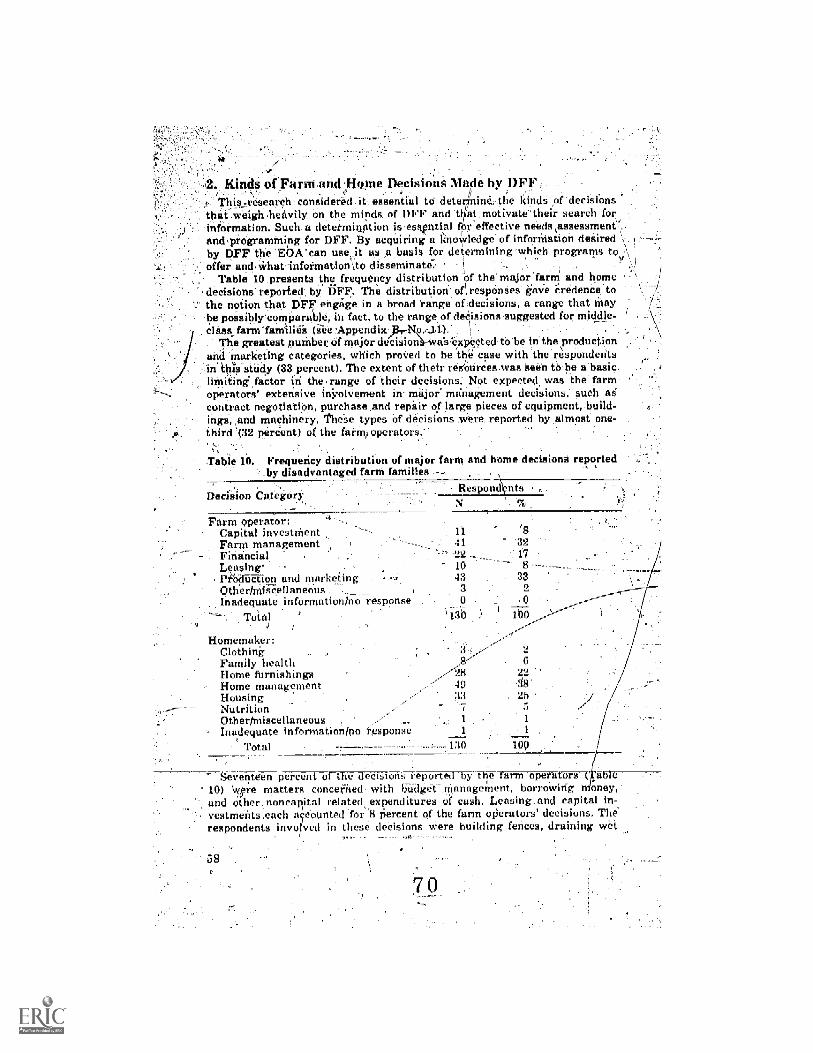
.
2. Kinds of Farm and 'Home Decisions Made by DFF- This -research- considered it essential tO deterMine,-,ae kinds of decisiensthat weigh -heavily on the minds of OFF andl. at motivate their search forinformation. Such a determination is essential f r effective needs tassessment .and programMing for DFF. By acquiring a knoledge of information desiredby DFF the ED/Veen usei it as ,a basis for determining -which programs tooffer and. What' information \to disseminat.
Table 10 presents .the frequency distribution of the' major farm and homedecisions reported. by DFF. The distribution of\ responies gave eredenee tothe notion that DFF engage in a broad range or decisions, a range that Mayhe poisibly'comparahle, in fact, to the range of decisions.suggested for middle-class farm-landlieS (See =Appendix
The greatest nurnber of major dercisionh-wassexpected-to be in theRroductionand marketing categories, which proved to be the case with the respondents
:in'tIas study (33 percent). The extent of their resburces was seen tb, be a basic .limiting factor fri the range of their decisions: Not expected was the farmoperators' extensive ini:olvement in- major management decisions,- such ELScontract negotiation, purchase and repair of large pieces of equipment, build-ings, and machinery. These types of decisions mere reported by ,almost one-third '(32 percent) of the farmi operators.-
Table 10. Frequency distribution of major farm and home decisions reported.by disadvantaged farm families -- .
sDeciSion Category
Respond\nts
Farm operator:Capital investnient `8Farm management '32Financial 22 17
Leasing 10 ----= 8 ---Prbdifetion and markeiing 43 33
Other/Mi.s-Cellaneous . 3 2Inadequate information/no-response 0 0
--'-- T tal 10-0
Homemaker:ClothingFamily healthHome furnishingsHome managementHousingNutritionOther/miscellaneous ,
- Inadequate information/no responseTotal
622
257
1
130 100
Seventeen percent of the decisions reported by Th:Viann operators able10) Were matters concerned- with litidget -roanagement, borrowirig n oney,and other noncapital related expenditures of cash. Leasing and capital in-
,vestments.each accounted for. 8 percent of the farm oPerators' decisions. Therespondents involved in these decisions were building fences, draining wet
58
7 0

land. building such new fee ities as swine feeding-floors and curing barns.I' These small-scale operators were active in decisions related to both land and
allotment renting and the 'agreements re.16ant to such transactions. As,
expected, among the,major 1- ome decisicati: home management deciaions were'the most frequently stated ( 8 percentf by homemakers. These were decisions
;such as obtaining eredit; fTw t,o'&idget the family dollar, and whether, to, ,.
, buy or prepare food or clot ilig at home. , , , . . ,
Hotising was the next-tnost frequently stated major, home decision (25.-,
percent). These decisithis ,4ere concerned with such matters as water and._
s_ age- systems, fieating, p-alriting, repairs, and remodeling. House furnish-ings also accouffted .for a substantial percentage of the wives' decisions (22percent). These decisions w'ere concerned with putting the finishing toucheson .the,liVing area, e.g., interior design, arrangement of furnishings, planning
, color Schemes,draperies, slip covers, and nigs,----The retsponse rate was low for the clothing health imd nutrition categories.Only 2 percent of the hemeimakers reported major decisions, related to theselection, construction, or dire of family clothing. Similarly, only % pereentrepOrted major decisions related-io -either the, mental or physical health oftheir faMilieS, and 5 percent/reported major nutritionardecisions.
-3. Rationality,of Decision-MakingDilany educational organizations and agencies (E0A) continually strlv
_reach an ever.widening circle of clientele with programs based pn the-aSsumption that all individuals are rational. That is:these agencies assumethat if provided with the latOt in technical information they can analyzethe alternatives and select the one most_ appropriate for reaching- theirindiVidual and/or family goals.1
However, there is considerable speculation that the, disadvantaged areunlike _other:sectars of the populition in that they are only occasionallyrational in theii'decisiomMaking2The determination of whether or not OFF-
. n:take rational decisions may have major implications for program develop,rrient by national and state EOA. If OFF are rational, a need may be Indi-
qicated to increase and improve educationar programs and information dis-'.semination: directed at_ this clientele. Rational decision-makers can use theinformation coming from those programs to increase their level of un,der.
_ standiffg and to facilitate their entry into the mainstream of American life.flowing the extent to whith OFF engage in rational decision-making,
ecnicationa =clipringe-agents_can desie programs-geared to the level of under-standing of the OFF' remove structural barriers to program participationby OFF, improve the.process of exchange, and initiate, more readily acceptableedUcati,onal opportunities for this-target audience.
Hoi;vever; if OFF lack rationality in- their decision-making, educationalprogi=ams may not be appropriate: Strong arguments could he advanced for.increased direct assistance programs as the mast judiciotis use of funds ontheir behalf = -
Thp process used in this _study to_conceptuali7e: rationalitmaking was built primarily on-the farm- management work of Johnson' et al.(1961), Riech and Pulver (1962), and the home management study of Scho-maker and Thorpe- (1963). Following the lead of- those authors, this studyfocused on the quality of meani'used tO make decisions and specifically de-fined rationality-as the deg:1.ft of conformity to a process of deeision-making.
7 1

A ftirther Stipulation was that the mote rational the family decision-making,the more closely it would follow-a process involving orientationbeingaware of goals or -problems; (2) observationseeking information; (3)
analysisanalyzing and choosing alternatives; (4) implementationacting;. and (5) feedback and adjustmentreassessing the choice and accepting its
consequences. ,
To detentine thel rationality of decision-makipg-(RDM) scores of DFF,farm operators'and homemakers were asked to respond to a series of questions
24 28_, 401
=_...-RDMSCORE-
Figare 9. Rationalit3t of decision-making scores for both farmhmemakers
7 260
operators and

1 1based on conformity to the fbregoing five-step decision-maldng process. Both1a farm response And a home response were obtained for each farm family
interviewed. Rationality indices were computed that ranged from a !ow of 12a high of 36.For descriptive pu poses, the ROM scores for both farrh operators and -
,
homemakers werp ,assigned to contingency tables in which the scale rangewas divided into three\approximately equal parts. When these scores were-grouped for contingency\tables, skewness was pronounced (Table 11). Farmoperators were clustered in the medium and high range of scores (70 and 20percent, respectively). Tim homemakers' scores were\ also concentrated in
Lthe medium and high range (62 and 34 percent, respectively). -
i
Table 11. etitien6; diStrib tion of rationality of deciiii6n-making scores forrm operators and homemakers----
RationalityScore
Farm Operators%
Low. 12-21Medium 22029High 3046
Total
-- 1 10 770 79 6220 44 34
100 130 10-0.
The distribution of ROM scores mile lated from responses given in thisstudy approlched normal. However, as shown in Figure 9, the scores Werenot skeW-V-d- toward --thelaWe-ndof-4hpscale_Instead _they were skcivjdoward the_high .end for both farm operators and homemakers. Mean scoresere similar, with little difference in relative values (1.49 difference). Farm
operators mean ROM score was 26.02; the mean RDM -score for homemakerswas 27.51.
Availability, Usage, and Credibility of Media/Information--Sources
Although many,E0A offer information and programs that eould improVe thpliving standlirds of OFF, there is reason to su6ect that they are .failing toreach a large number of OFF. In an effort to' determine means by whithcomMunication b'etwioo EOA and OFF might be improved, an examination .was made of the .rnedia/information sourees available to OFF, the extent towhich-they use those Sources; and the credibility that they attach to thoseseources.
In pursuing .the study objective pertaining to availability, usage, and ;
cred.Ybility of Media, information sources were gTouped into one of_three media,: interpersonal media, mass, media, and,' publications media. Fotn- purposes of
this study, mass media refers to newspapers, radio, and Tir; .publicationsmedialo bulletina-pamphlets, the Fa,iner's Almanac, and magazines ;and',thes.interpersonal media to agents (county Extension agents, nutrition aides,._agricultural technicians vocnt'nialteachers, representatives of other governmental agencies, and lending insti-tutions), the church (ministers), farm and home dealers, and family=friends-neigh bors .

1kvaUab#i1y=of Information SourcesThis study assumed that IMO would have abundant access to thi inter-
personal_ media.. Thus,' availabilitV was examind 'only in terms of massmedia and publications med ia.
Availability of information sourees was measured by the number of DF.T'having a working TV set or radio in-the horne and receiving daily neWipapers,weekly newspapers, bulletins-pamphlets, the Farmer's Almanac, .er maga.zines. Results are depicted in Fivre 10.
The- measurements Show that When mass Media availability is comparedto publications Media availability, the difference is pronbunced. The 130 DFFindicated the availability/ of 521 information sources.' Sikty-two percent ofthese responses pertained to mass .medikArid'-only 38 percent to publications
,media.
Relative to the_321 responses regarding information_ sources available in-the mass media, 38Z percent of the responses indicated that TV was avail-able, 34.5 percent. radio, and 2'7 percent newspapers. As for the 200 responsesregarding inforniation sources cited in the publications Media, 39 percent of
Medlalinforsource
Percents f responses indicating DFFhaving medlafinforrnation sources ivllabk
20 " 40Medi
Male 62%
Publicationa.-_Total
InforniatIon5ource.
Masa:Newapapara_.
200 WililiMilEr3W521
27%
34-5%
TV.,Total
PublicaDuL:SulktinA.
pamphlets
Fannees Almanac
Mai:ulnaeTotal
25-5%
200
'There re no cvailabllity mew,urementa for ioterperonclmm1ic -
ccc media
_ .
igure 10. Availability of 'media and information sources to disadvantaged7 farm families

the responses indicated that the Fanner's. Ahnanne- was (available per-.contlitilletins-pamphlets, and 25.5 percent magazineL
..Usage of Information SourcesIn examining the information sources used by DFF this study fodused on
those sources used by farm operators and by homemakera in making onemajor decision. Thus, usage patterns are reflected for only that one decisienand cannot be generalized to decision-making in general.
Usage was measured by ha:ling each farm operator and homemaker indi-cate the veri`ous information sources that,they used in making their decision.
Pert-entice of responsee Indicating nisi* ofMadiafInforniatitn interpersonal . rnaas. and publication. inecli
---`7 and the Information sources in those mediaSource20 . 40
Media
Interpersonal
Maas
PublicationaTotal.
Infornistion' 90Ar
lUteepersonal:Agents
Church,
Delltra
nil Ithaca
TVTotal
Publicatione:Bulletins-
pamphieUi
Paromen Almanac
60 80 100
326
198
115
639
18% ,
123
11
142
326
72
198
31agacin
Tntal
39
43
115
Mass rneds
-PublkaiionA edis
Figtire II. Usage- of interpersonal, mass, and publications mediainformation sources in those media (farm operators)
. .

,
Percentages were calcu s ed on the bases-of the total i-iumber of informationsonices cited by DFF and not on the 130 families' comprising the sample.Figure 11 shows the resulting usage patterns for farm operators and Figure
_12 for .homemakers.In comparing the frequency distributions of usage of the three major media
in_decision-making, Figures 11 and 12 show that for both farm operators_ andhomemakers the interPersonal media was the most used, the mass media
was the second most used, and-the- publications media- was the least used.The decision-making usige patterns were as follows. The 130 farm operatorsused the three media a total of E39 times. The interpersonal Media, the mass
Media/InformationSoureg
ffentega uf reiposu. Inditing usage of-interpersonal, masa, and pubikation. mediaand fife information sourer* in thoa0
20 40
Intememonal
Maas
VublkationaTotal
Information
Interperianal:A1.11111
Church
Dealer*
Family.frienda--neighbors
TMM
Mama:Newspapers
Maclio
TVTo 1
1.-abliestions:8011ctins4amphlets
Farmers Almanac1
MagazinesTotal
231
93167
86 .
20%
NENIZEW 37%
23 7--7.7r!.,1.1046
112
234
33
59,.140
27
24%.
1 42%
311MEZM 299.
Figure 12,
amgMwntodi.
nal Publications media
IIT;sage of,interpersonsi, mass, and pUgliCiiiions media andinformation sourqes in those media (homemakers)
the

media, and the publications Media accounted' for -51, 31,:and 18 percent ofthis total, resiActively. The 130 homemakers used the three media a-total of467 times. The interpersenal media, the mass media, and the publicationamedia)accounted for 50, 30, and 20 percent of this total, respectively.
.Turning to the comparison of the information sources within the respectivemedia, farni operators and homemakers demonstrated similar interpersonalmedia usage Patterns. Both used the family-friends-neighbors category theMost, followed bY change agents, then dealers, and finally, the church. The`patterms were as .follaws. Farm operators used the interpersonal media atotal of 326 times. Fainily4riends-neighbors, agents, dealers, and the_churchaccounted for 44, 38, 15, -and S percent of this total, respectivelY. Home-makers used the interpersonal media a otal of 234 times. Family-friends-neighbors, agents, -dealers, and the churth accounted for 48, 37, 10;' and 5
. percent of this total; respectively.Figures 11 and 12 indiCate that-the mass media usage patterns of farm
operators and, homemakers in making a major decision- were again verysimilar. Both 'used TV the most, followed by radio` and then magazines. TheUsage patterns of information sources within the news Media follow: Farmoperators used themass media a total of 115 times. TV, radio; and newspapersaccouhted for 42, 36, and 22 percent of this total, reipectively. Homemakersused the mass media a total of- .140 times. TV, radio, and newspapersaccantt-d-for-42,---34; aint 24 percent'of this total,, respectively.
Similar usage patte'rris_ by farm operators'and homemakers occurred in thepublicatiehs media.- Both used magazines the most, fellowed by the Farmer's
'.311ntanac and then by bulletins-pamphlets. Only a slight difference was noted--between usage-of-the three sources, as well as between usage by the firm
operator aria the hbmemaker, as illustrated in the usage patterns that follow.Ferm operators used the publications media a total of 115 times. TheFa, kizo's Almanac, bulletins-paMphlets, and Magazines accounted for 37, 34,and 29 percent of this total, respectively: Homemakers used the publica-tions media a total of 93 times. Magazines, the Farmer's- Almanac, andbulletins-pamphlets accounted for 41, 30, and 29 percent of this total,respectively,.
ivii3r6f looking at usage iiatterns 'is t6 examine the.coMbinations-media used in making a: decision. Table 12 illuStrates those combinations
of media used by farm- operators, and homemakers.
Table 12.' Combinations of Media used by farm operators and honiemakers inmaking a major decision = . , -
Homemakers%
1nterperaonal only 29 22 42 32Massanly 1 1 o 0Mass-intel 35 27 19 15masstpublications - o 0 3 2Publications-interpersonal 4 3 12 9Mass-publiFations-interpersonal, 57 ' 4-4 , 47 36
-No-media used 4 3 - 7 5, . _130 100 130 99Total

Table 12 shows that farmoperators Used thiee major combinations. 'Ofhe 130 farm.operators the largest number (57, or 44 percent) used all three
media. The next largest number- (35, or '27 percent) used 'the ,mass-inter-personal media combination. Ranking third in frequency of usage (33 percent)was the interpdrsonal,media alone. It should be noted that the interpersonalMedia was present in each of-the three most frequently used combinations,-of nieda -.
The pattern of media combinations used by homemakers deviated some-what from that of farm operatorS. As with farm operators, the largest per-
--,--centage (36 percent) of the 130 homemakerssused a combination of all three.
media. However, 32 percent Used the interpersonal media only as comparedto 15 percent who used the mass-interpersonal media combination. As withthe' farm operators, the interpersonal media was present in each of the mostfrequently used combinations.
Credibility of Mediallnformation SourcesEducational organizations and agencies consider it vital to determine which
information sources fa.rm operators.and homemakers perceive as most crediblefor use in decision-making.
A measure of media/information source credibility was obtained through .,a forced-choice technique. First, respondents were asked to Choose the onemost credible of the three information sources in the mass media. Then theychose the one-most credibleT-of-the three information -sourees in the publica-tions'media, and, finallY, the one most credible of the several sources' -in theinterpersonal media. Lastly, they were asked to'choose the one most credibleof the mass, publications, and interpersonal media. The results-of the forced-choice technique are presented in-Figures 13 for farm operators and-14 forhomemakers . ,
Figures 13 and.,.'14 show that farm operators and hornemakera perceijecithe interpersonal media to be most credible (by a large margin),, and thepublications media to be more credible thari the maii- media."The scores forfarm operators were: interpersoal media,A:72 percent; publications media,
percent; and inass media,.13 percent. $cores for homemakers were: inter-persOnal media, -76 pefedaWyOblieaffYiii`iiie-dia, 13 Percent; and Mass\ media,
With regard to the information so rces, in .each of the 'three media, FigAire.13 shows that farm.operators perceived change agents to be the rnost-cred-ible --
of the interpersonal media, followed by family-friends-neighbors, then. bydealers, and finally by.sthe church. Homemakers in Figure 14 also perceivedagentito be the most eredible, and family-friends-neighbors to be the second-most credible. However, unlike farm operators, they perceived' the churchto be inpre credible than dealers. The figUres for farm operators were: agents,50 .percent; family-friends-neighbors, 40 percent; dealers, 7 percent;-- andchurch,_3 percent. =Scores for homemakers were: agents, 45 percent; family-friends-neighbors,- 36 percent; chtirch. 14, percent; and dealers, 5 percent.- Among` information sources in the mass media, both farm operators and .
homemakers, perceived TV to -e T e mos ere i reby a widpnwrgi-n-rnews-papers the:second mosto credible, and, radio the least credible., The actualfigures were 111- farm_ operators : TV, 60 'perCent; newsPaperS,, 22. percent;and riadio, 18 percent. The scores foi- homemakerS were: TV, 64 :percent;'newspapers, 24 percent; and radio, 12 percent.
66

Farm operators and hc;inemakers disagreed on the credibility of the Infor-,;nation sources- in thi pUblications media. Farnr,operators perceived the
Farmer's AlManac to be the most credible, by a wide margin, folloWed bYmagazines and then by- bulletins-pamphlets: In .contrast, homemakers per-,calved magazines to be the most credible (also by a wide margin), followed by
- the Fanner's Almanac and then by bulletins-pamphlets. The scores for farm ,operators were: Farmer's. Almailac, 61 percent; magazines,-27-percent; andbulletins-pamphlets; 12 percent Scores for homerdakers were: magazines,48 percent; Farmers Almanac,, 32, percent; and bulletins-pamphlets, 20percent.
Percent that parcelvmaims assume in decredible
20
infer.h* moat
Media
intmerson4
Dealers
Miss:Pi, (wrap*
TVTatal
'Publications:.
pamphletsFarmer's Alman
MapasinisTotal
rporoastal media
Vabliciitians itiOdia
gure-18. Credibility of the interpersonal, mass, and publications media andof the information sources in those media (farm operators) - -

,
Pron.:es of the Media and Their Corresponding information Sources,.11y Availability. Usage, and Credibility
Thus far the availabilitY, usage, and credibility of media and'ethe intor-fruition sources in them have been examined in isolation. It is.now possible topull together the finaings of thdae examinations to gener4ite profiles bygraphically representing the availability, usage, and credibility of media/
.inforTnation sourceS.The flow 'chart shown in Figure .15 illustrates the application of those
profileEi; i.e., it contains the questions that EOA should ask before selecting
Percent that pw Iced the aedli or in;nation source in question as the moatcredible
20 40 60 $0 100
Church
DeRlere
ramify-Mends-nvighborsTotal
Maas: ,
Newspapers
Radio
TV
Total
Publications:Bulktins-pampbleta
Fanner's Almanac
MagninTotal
d
ogg intierocrminal media
Mass media
MIPublications media
Figure 14. Credibility of the interpersonal, mass, and publications media andof the information sources in those media (homemakers) /
68.

Change agents*starting point
Isthe media
or informationsource-readily
available to thetarget audience?
Isthe media
or informationsource frequentlyused by the target
audience in makingdecisions?
re
Isthe media
or information_ source perceived,
-by-thitarget audienceak credible?
e the media orinformatien sou rce
lect anothermedia or informa-tion source
Select anothermedia or informa-tion source
Select anothermema or informa-tion source
,:;Figure Schematic ,diagram llustrating a procedure change agents -may.utilize in selecting media/information sources as channels fordisseminating information to DFF or intervening to effect changein their decision-making patterns
_
. 69

. .
,media/information -sources to use in disseminating niformation to and
ervening to effect change in\`,the- decision-making patterns of DFF. Theow chart demonstrates that EDA should use- the media or inforination
.sources tbat are most available to\DFF only If those media or information'sources are perceived by DFF as crellible and are frequently used. A mediaor information source that is frequentljr\iised but has little credibility would \not beh effective comniunications channel in reaching the DFT.
Profiles of the availability,. usage, and\ credibilitY of media/informationsources are graphically presented in Figures 16-23. As indicated earlier,
400
300
- 200
109
2 3?6
9 19
INN Interpersonal media
Mass media
Publications media
94
7 19
Availability Usage Credibilit
Figure 16, Profiles of the interpersonal, mass, and publications-availability, usage, and-credibility (farm operatOrs)1
---+-Tiarr-arcar.-avaiiabitity-reanAllrea,?na. for_intarpaaa'adi_racsria.
70-
8 2
in by

availability of informafion sources was measured by the numb_er of DFFhaving a working TV set or radio in the home -and receivi,nedaily'news-papers, bulletins-pamphlets, and Farmer's Almanac or,magazines. Usagewas measured by having the farm operators indicate-th6 various informationsourees that they used in making their decision.. Credibility was obtainedthrough a forced-choice technique in which respondents were required torank media/information sources as most credible, second most credible, etc.Comparisons between farm operator and homemaker profiles are summarizedin the narrative that follows the graphs.
400
300
, .
200
100
321
Interpersonal media.
Mass media
Publications media
99
Availability [`saget .
Figure 17. Profiles of the interpersonaN mass, and publications media byavailability, usage, and credibility (homemakers)'
There nre no availability mea.surernents.for interpeunal_media.
Credibility
8 3
71/

Nwspapr
ED RadioTV .----
r.Availabi ity Usage Credibi ity
Figure 18. Profiles of the information sources in the mass media by av 1-
ability; usage, and eredibilit (farm operators)
72

Newspapers
ni RadioTV
Usage
Figure 19 Profiles of the information sources in the mass media by avail-ability, usage, and credibility (homemakers)
73

200
0 100
ri Bulletins.pamphlets
Farmers Almanac
Magazines
7
943
Availablity Usage Credibi ity
Figure 20. Profiles of the information sources in the publications media by /availability, usage, and credibility (fann operators)

Bulletins-pamphlets
Farmer's Almanac
agazines
A'vailnbility Usage
Figure 21r Profiles of the information sourco-, in the 'ubJicatiàn s media byavailability, usage, and credibility (homemakers)
75
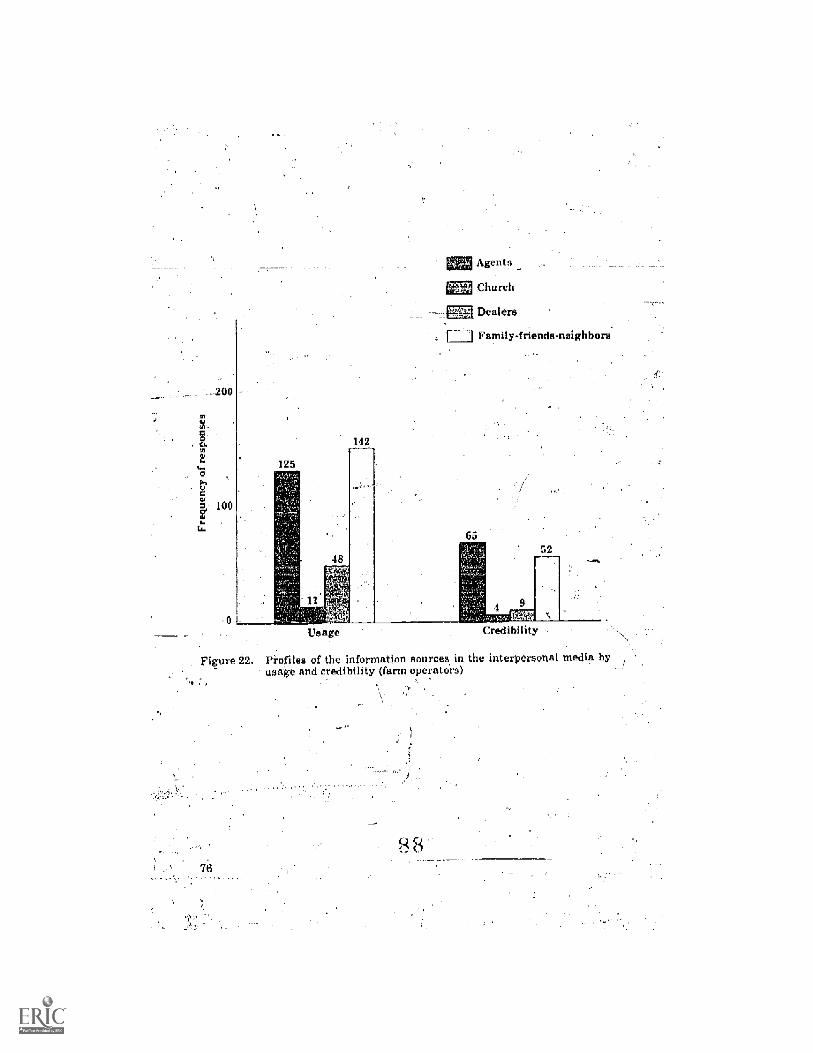
Agents
ETA Church
Dealers
iJ Family.friendsmeighbors
6552
Usage
Figure 22. Profiles of the information sonrces in the interp__ onal media byusag-e and credibility (farm operators)
76
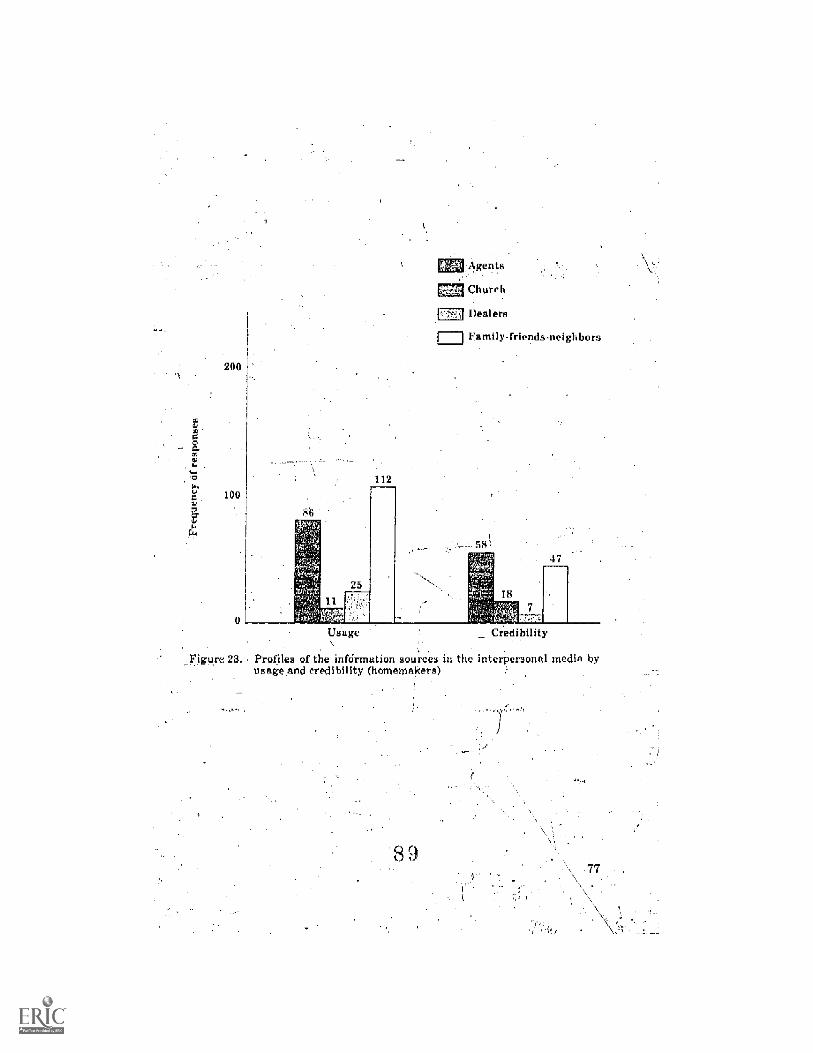
112
ents
Mi Church
1-1 Dealers
family-friends.neighbo-
Credibility
Figure 23. Profiles of the infdrmation sources in the interpersonal media byusage and credibility (homemakers)

The profiles of, the interpersonal, mass, and publications media for farmoperators (Figure 16) and homemakers (Figure 17) were the sante. For bothgroups of respondents the interpersonal media ranked very high in credi-bility and usage (there is no availability measurement for the interpersonal:media). Mass media ranked high in availability, in the middle range inusage, and (relative to- the interpersonal 'media) low in credibility. Thepublications media ranked in the middle range of availabilit-y Midranked
. low in credibility and usage.,The profiles of the information sources in the mass:media again were the
same for farm operators (Figure 18) and homemakers (Figure 19).'Relativeto .other sources.- in the masa media. TV ranked very high in availability,_ ,.
credibility, and usage. Radio ranked high in availability and usage, but lowin credibility. Newspapers ranked low in availability, credibility, and usage.
The profiles of the informattion sources in the publications media for farm-operators (Figure 20) and homeMakers (Figure 21) Were the Same for avail-ability, similar in PrPportion of usage, but differed considerably in credibility_ranking. Relative to other information sources in the publications media,bulletins-pamphlets ranked high in availability, but low_ in creclibilitY andusage by both groups of respondents. The Farmer's Almanac ranked high inavailability, usage, and credibility among the farm operators. Homemakersgave .the same ranking for availability, but use-the Farmer's Almanac less-aiid gave it less credibility_ than the farm operators. Although both farnioperators_and homemakers ranked magazines as mOlium in availability andhigh in usage, homemakers ranked their credibility/Much higher than did thefarm operators. Among the three information soces, farm operdiors gavethe highest credibility to the Farmer's Almanac, Whereas homemakers rankedmagazines highest. Both respondent.groups gaye.low credibility ratings tobulletins-pamphlets.
The profiles of information sources in the interpersonal media for farmoperators (Figure 22) and homemakers (Figure -23) Were the same in thatfamily-friends-neighbors ranked highest in usage and agents were secondhighest- in usage by both respondent groups. The church and dealers rankedlow in both credibility and usage. However, faem operators indicated usingdealers much more often than did homemakers, and 'homemakers gave ahigher credibility rating to the church thandid farm operators.
Leading in'availability to DFF was the-mass media, of which TV was themost used source,- with -radio a close second. The most available publicationsinformation source was the Farmer's Almanac, yet magazines ranked highestin usageAvailability-of interpersonal sources was not measurable; however,family-friends-neighbors ranked highest in usage.
Ranked highest in credibility were: interpersonal media, TV, Faiiner's.41manac, and agentswith family-friends-neighbors a close second, Theleast credible sources were: =Fs media, radio, bulletins-pamphipts, andilcalors.
5. Degree of Linkage Between Interpersonal Information----Sources lised by Disadvantaged Farm -Families in Making
becisions and Research-Based Informati-On SourcesObjective five speaks to.the broad concept of linkage. More specifically, this.
study was concerned with three questions r- -d:ng linkage between infor-mation sources, i.e.: (1). How far removed DFF 'from research-based

information sources? (2) Is there a .heterophilic relationship between DFFand their -direct-interpersonal sources of information? .(3) What are .thecharacteristics-of those persons who channel information to DFF?
Research-based information source in this study refers to a person (spe-cialist 91,- researcher in a specific subject matter area) who represents aprofesiion or institution recognized by the scientific community as possessingimpArtial research information that has been validated empirically hy appli-cation of the scientific method as opposed to value, moral, or ethical judg-ments. In addition, any research information transmitted by these mdividuals in written or publication form will be considered .a research-basedsource of information.
The determination of how far removed DFF are 6om research-based infor-.mation sources should indicate the extent to which BOA are currently reach-ing -DFF. The determination as to whether or-not DFF are heterophilic totheir direct interpersonal information sources (and whether or not inter-personal sources A, B and C are heterophilic to each other) will allow'con-clusions to be drawn about the pattern of information flaw to DFF. A knowl-idge of those patterns should be helpful to EDA-in determining the mostproductiveinforrnation_sources to use in disseminating information to DFF.
Turning first to examining the extent to which DFF are removed- fromresearch-based information sources, a review of the literature indicated thatin general DFF have..no close linkage-to research-based information sources.Diffusion research (the study of.the process by which nevi ideas -spread to
- members of a social system) has shown that all members of a social system do-not adopt an innovation at the same time, and DFF are often "laggards,7of the last to adopt innOvations. The North Central_ Rural Sociology Sub-committee (1961, p. 6) described laggards as
. not only .. . ace last to adopt new ideas; they put faith in ag-ricul-tura! magic and folk helids and have a fear of debt; they have a low levelof education and thus- have difficulty in dealing with abstractions andrelationships; they hold few memberships in social organizations otherthan church; they are of the lowest social class; they have small farms;and their main source of information is their laggard friends andneighbors.
This description of the laggard category (and hy and large the disadvantagedrural population) strongly suggests that informatioa used hy the DFF inmaking decisions is likely to he far removed from a research--based source.
To determine the extent to which information used by DFF is linked toresearch-based sources, this study traced, through five chains if necessary,the interpersonal sources of information used by disadvantaged farhi opera-i6rs and homemakers. If either the first or second source of informationused was research-based, the linkage was categorized_as----"closely linked."
/ If the third source of information used was research-based, the linkage wascategorized as "distantly linked." If a research=hased source of informationwas not detected among the first three sources, the linkage was categorizedas "not linked." Figure 24 illustrates this procedure, and Table 13 presentsthe results yielded by that procedure.
The daca show that 38 and 39 percent of the farm and home decisions,respectively,--were closely linked through interpersonal sources to research-based information: The remainder of the communication chaina were eitherdistantly linked or not linked to the farm and home decisions made.
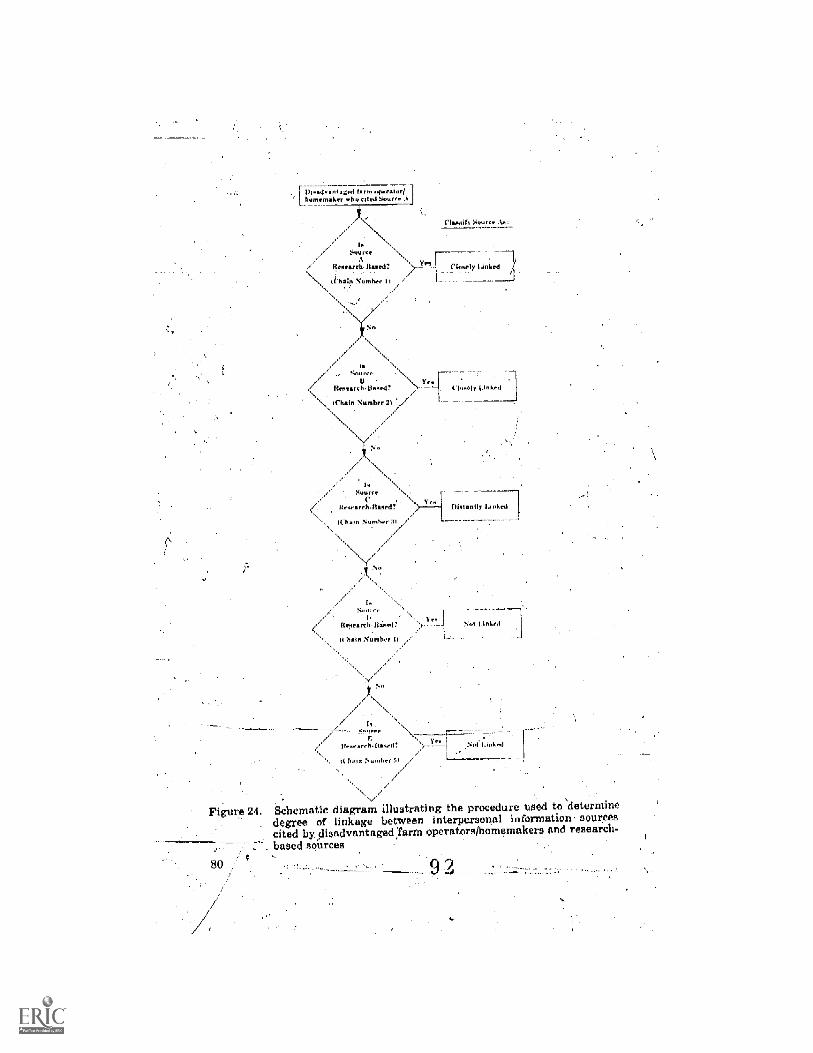
11josit &in agrd ofwAlhurnem*Iwr *tin cited Sourer
IrSonete
:
Chnin oitit c I
isEiourte
IIrt,nenrch.Usned?
sinnihne
Source
lihingenearchitininni.
Nurnknr 3)
ti
I
(Chain II /
/ Itnnnarchinanen?
CI
Clcinnly
Dintantly
Nol Einh etj
Nonk,d I
hnin Number 5)
re 24. Schematic diagram illustrating the procedure used to determinedegree of linkage between interpersonal ififormation- sourcescited by,4isadvantaged farm operators/homemakers and research-
- based sources

The second specific concern of the research on linkage was to determineif there is a heterophilic relationship between DFF and their direct inter-personal source of information. Characteristics used in testing the relation-ship were: (1) age, (2) education, -(3) ethnic. background, (4) income, (5)present/future value orientation, and (6) social participation.
Table 13. The degree of linkage between research-based information sourcesand those interversonal sources used by disadvantaged farm ,
families as a basia for making farm or home decisions
InidnnotionSourees Lroed
Iy Lnked Mot:Hilly Linked Not Linked Tao'N
Farm declsionsHome decisions
No,
38.0 10 34.5 8 27.5_ 2939..0 3 17.0 8 44.0
100100.
chi-square analysis was used to test for significant differences (0.5 levelor greater) between the characteristics. This analytical procedure requiresthe use of ordinate categories (e.g., low, medium and high) with sizablenumbers in each category. However, the low, medium, and high. categoriesused previously for age and social participation were skewed to the extentthat in some instances there were empty cells in the low and high categories.To cope with that difficulty new low, medium, and high categories for ageand social participation were established in such a way as to cause approxi-mately equal numbers to occur in each category. These categories arrived atare used in the tables that follow.
Visual observation of Table 14 indicates pronounced differences betweenfarm operators and their stage N interpersonal information sources- for allcharacteristics other than age and present/future value orientation. Chi-square tests (Table 15) support that observation by indicating significantdifferences for all characteristics . other than agv and present/future valueorientation. Thus, a heterophilic relationship between farm operators and.their direct interpersonal source of information (stage A) is indicated.
Turning next to a comparison of the characteristics of farm operators'A, B, and C interpersonal information sources, visual observation_of Table 14reveals little because of the unequal N's in the three sources. However, chi--square tests (Table 16) clearly show that there are no significant differencesbetween the characteristics of sources A, B, and C. Therefore, the relation-ship between sources A, B, and C is labeled as homonhilic:
In regard to homemakers, Table 17 illustrates their characteristics andthose of their interpersonal information sources. Considering first the dif-ferences between homemakers .and source A, Table 17 shows differences inseveral characteristics. When chi-square tests were mada (Table 18), signifi-cant differences were found for education, income, present/future value
:orientation, and ,social participation. Thus, a heterophilic relationshipbetween homemakers and their direct interpersonal source of information(stage A) is indicated._ .
9 3

Table 14. Frequency distribution of disadvantaged farm operators and theirinterpersonal information sources by selected characteristics
Characteristic
Age, yr:49 or-less50-5960 .Or-more
Total
Education, yr:4 or less5-78 or more
Disadvantaged Stage A Stage El Stage Cfarm operatoñi Sources Sources Sources
N=29 N= 29 N 15 N= 4N % N %1 N %i N
13115
29
45 12 41 338 - la 35- 1
17 7 24 3 20 0 0
100 29 100 15 100 4 100
50 10 2 13 0 0
31 , 10 1 6 0 , 0
17 23 79 12 81 4 100
100 29__ 99 100 4 100
90 7 24 2 13 4 10010 22 76 13 87 0 0
100 29 100 15 100 4 100
66 3 10 2 13 0
31 3 10 0 09 31 2 13 1 25
0 14 48 .11 73_ 75
100 29 99 15 99 4 100
28 6 2ljH3 20 0 018 5 17 1 7 0 ._ __ 0
34 18 62 11,_
73 4 100_100 29 100 ; 15 100 4 100
45 1 ; 3 1 _ 7 0 0
21 2 \ 71 7 0 034 26 ' 90 j , 13 86 4 100
100 29 100 i 15 100 4 100
qua! due t:qroundinii
15 .95
Total 29
Ethnic background:Black 28White 3
Total 29
Income:$3,999 or less 19
-$4,000 to 6,999 9$7,000 to 9,999-$10,000. or more 0--
29Total
sent/futurevalue orientationscore:= Low 7 7-12 8
Medium = 13- 16 11High -= 17-21 10=_._
Total 29
: Social participa-tion score:
Low = 0-3 13Medium = 4-8 6High = 9-36 . 10
Total 29-.,
1 '7,ttii Try,r,ikritilkeS1 1114 nig. al
82

Table 15.`v
Chi-square tests for significant differences between selected char-acteristics of disadvantaged farm operators and their stage Ainterpersonal source of information
Signiricant at
_
CharacteristiDisad-
vantaged StageFarm A Total
Operator Source N dfAge, yr:
49 or less50-5960 or more
1210
Total 29 29
Education,4 or less 15 35-7 9 3
or more 5 23Total 2.9 29
Ethnic background:Black '- 26 7White 3 22
7-T6Th I 29 29
Income:$3,999 or less$4,000-6,999
- $7,000-9,999$10,000 or more 0
Total 29 29
Present/futurevalue orientationscore: -
Low = 7-12 8 6Medium 13-16 11
Illigh = 17-21 10 18
I Total 29 '29(
1
Soeial participation:4core:
Low = 073 13 1
Medium = 4-8 0 2High -.. 9-36 10 ,.._
Totol 29 29
Lh iii yel.
2112
58-
58
3325
58
21210
. 14
; 58
.42
22.56** 1
25.38**
35.04**
1628 .
58 2 4.80
58 19.40",

Table 16- Chi-square testh for significant differences be ween selected char-acteristics of disadvantaged farm operator& stage A, B, and Cinterpersonal inforination sources
StageCharacterist IC
TotalN . di
Age, yr:49 or less 12 9 3 24
50-59 10 3 1 14
60 or more 7 3 0 10
Total,
29 15 4 , 48-
Education, yr:4 or less 3 2 5
5-7 3 1 4
8 or more 23 12 4 39
= Total 29 15 4 48
Ethnie 'bach- und:Black 7 2 0White 29 13 4 39
Total 29 15 48
Income:$3,999 or less 0 1
$4,000-6,999 5 0 7 ,,/$7,090-9,999 = 9 1 12;"
$10,900 or more 14 11 3 28
Total 29 15 4 / 48
Present/future valueorientation score:
Low 7-12Medium =. 13-16Iligh = 17-21 18 11
Total 29 15'
Social partt ipatiowscore:
Low 9-3Medium 4, 8High 9-36 13
Total 29
4
?.96
4 L25
3.91"
96
3348 4 3.05
0 20= 34
4 18 4 .764

Table 17 Frequency diatribution of disadvantaged homemakers and theirinterpengonal information sources by selected characteristics
Disadvantaged Stage A Stage B Stage CHomemakers Sources Sources Sources
N=18 N=18 N=8 N= 3N N N %
Age,49 oil less 6;50-5 860 a- more 4
tal 18
Eauca 0174, yr:4 o- esa 351-7 78 or more 8
Total '18
Ethnic background: ,
'Black , 14 iWilite 4 1
Total I18
11:corne:$3,999 or, less 12$4,000 to 6,999 r$7,000 to 9,999 1$10,000 or more 0
-Total 18
Presentlfuturevalue orientationscore:
Law -.---- 7-12-Medium 13-16 3High ,---- 17-21 9
Total 18
Social paiticipationscore:
= 0-3 7Medium = 4-8 5High = 9-36 6
Total 18
33 11 614-4 4 2222 3 17
09 18 100
17 1 639 2 1144 15 83
I 100 100
78 8 4422 10 56
100 18 100
67 5 2828 4 22
5 4 220 5 28_
100 18 100
33 017 73950 11 61
100 li 100
39 0 028 1 633- 17 94
100 18 100
1
8
0
12
100
0
1
3
0
3399
0 0 0 08 100 3 100
8 100 3 100
, 6 75 1 332 25 2 67 .
8 100 3 100
12 1 330
38 334_ 50 338 100 3 99
0 a , 0 00 0 0 08 100 3 100
8 100 \ 3 100\
,
0 0 01 13 0 0
\ 87 3 100
' 8 100 3 100
I Total pereentagra do not alwairs equid 100 due to rounding error.
85
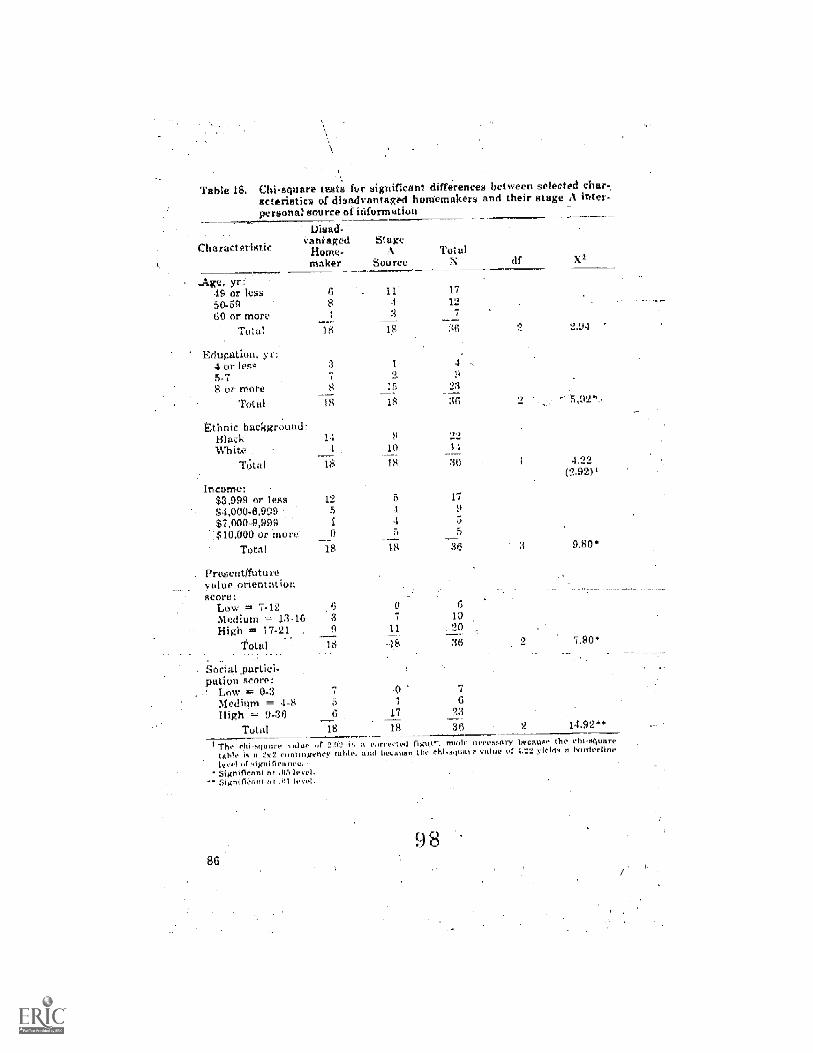
Table 18. Chi-square Lt for sivificant differences between selected char-acteriatics of disadvantaged homemakers and their stage A inter .persona: source a ififomation
CharactriticDisad-
vaniaged StageHorne- A Totalmaker Source N df X2
_Age, yr:49 or le50-5960 or more
Total
Education, yr:4 or less5-78 or more
Total
Ethnic background:BlackWhite
Ta
Inc-ame:$3,999 orless84,000-6,999$7,000-9,999
-$10,000 or moreTotal
Present/futureyalue orientotionscore:
Low = 7-12Medium = 13 16High = 17-21
Total
jal pazdcipatton score:
Low = 0-3Medium 4-8High = 9-36
Total
178 124 7
18 18 36
8 23
18 IS 36
1410 14
18 IS 36 4,09(2.92)'
195
0
15 18 31 3 9.80*
67 10
11 : 20
25 -18 36 7.80'
a 1
8 17
18 18 36 2 14,92"
I The chi,t1unre "t coteertol riitatat abide llert.,stary tteotttRe tho chi-square
tuhle 14 at :N2 Lind bCrlitISP IN' Chi =1111.11r1.* value of 4.2:2 yields a bafficrilne1,.vo 4.1 Agnincanc,i.Significant at _OS level.
tit if)
86

Table 19. Chi-square tests for significant differences between selected char-acteristics of disadvantaged homemakers stage A, 13, and C iater-Personal information sources
Characteristic age TotalX2A
Age, yr:49 or less50-59 260 or more 3 1 1 5
Total 18 8, 3. 29 4
Education, yr:4 or less 1 0 0 1.5-7
=2 0 0 2
8 or more 15 8= 3 26_Total 18 8 3 29 2.04
Ethnic background:Black 10 2 1 13White 8 6 2 16
Total 18 8 2.39
-Income:$3,999 or les 7$4,000-6,999 4 0 0 4$7,000-9,999 4 3 1 8810,000 or more 5 4 10
Total 18 8 3 29 4.40
Present/future valUeorientation sc2.re;
Low = 7-12 1 1 1 3Medium -= 13-16 7 0 0 7High 17-21
Total 118 8 3 29 3 7.11- -
Social participationscore:--Low =-0-3 -0 0 0 0
Medium = 4-8 2 1 0 3High 9-36 16 7 3 26
Totalr_
18 ._8 ___ 3 29 4 .398".. Signitirlint the "1 level
As for the differences between the characteristics of hornemakers' A, B, andC sources, Table 17 is-inconclusive because of the unequal N's in the A, B,and C sources. However, Table 19 clearly shows that, except for socialparticipation, sourees A, B, and C share the,same characteristics. Therefore,the relationship between sources A, B, and't is labeled as homophilic.
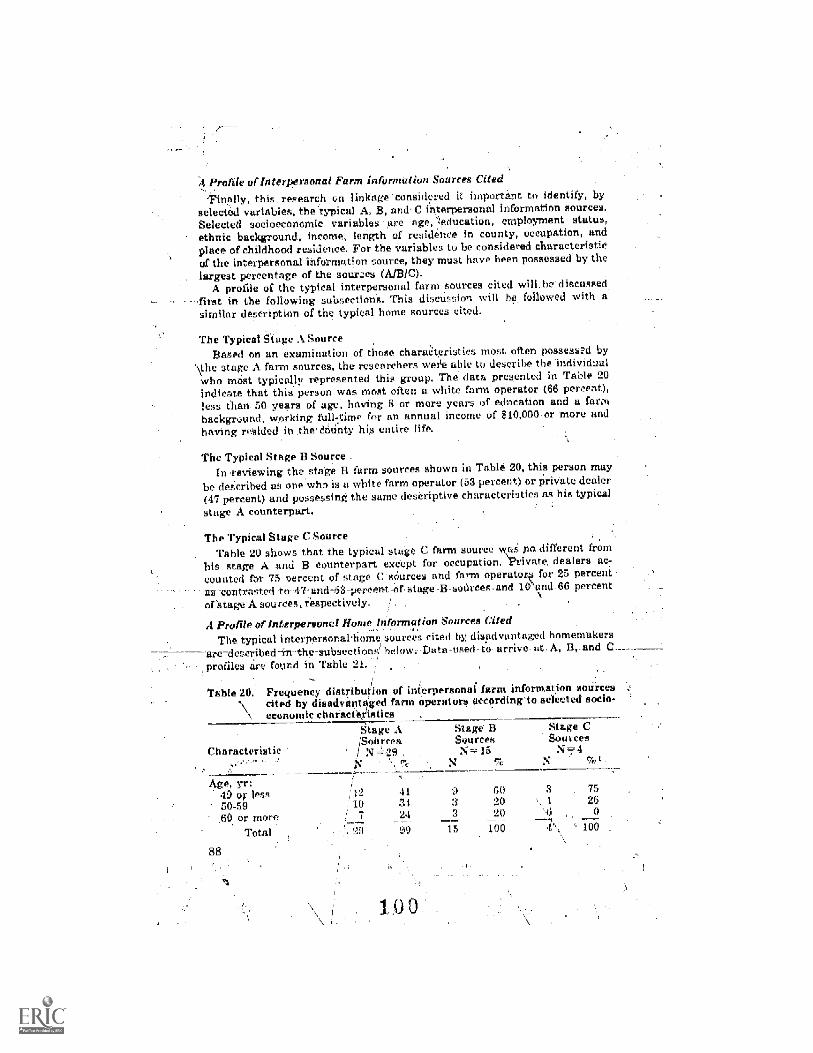
ratile of Interpersonal Farm information Sources Cited'Finally, this research on linkage considered it important to identify, by
selected variables, the typical A, B, and- C interpersonal information sources.Selected socioeconomic variables -are age, 'education, employment status,ethnic background, income, length of residence in county, occupation, andplace of childhood residence. For the variables to be considered characteristiccif the interpersonal informa.tion source, they must have been possessed by thelargest percentage of the sour.zes (A/B/C).
A profile of the typical interpersonal farm sources cited will.be discussedfirst in the following subsections. This discussion will bc followed with asirnilar description of the typical home sources cited.
The Typical Stage SourceBased on an examination of those char often possessal by
\the stage A farm sources, the researchers were able to describe the individ-aalwho most typically represented this group. The data presented in Table 20indicate that this person was most often a white farm operator (66 percent),less than 50 years of age, having S or more years of education and a farmbackground, working fu1l7time for an annual income of $10,000 or more andhaving i-sided in the &Unty his entire life.
The Typical Stage B SourceIn reviewing the. stage B farm sources shown in Table 20, this person may
be described as one who is a white farm operator (53 percent) or private dealer(47 percent) and possessing the same descriptive characteristics aS his typicalstage A counterpart.
The Typical Stage C SourceTable 20 shows that the typical stage C farm source i.kas no different from
his stage A and B counterpart except for occupation. 'Private dealers ac-counted far 75 percent of stage C sources and farm operator, for 25 percent
-contrasted to 47-and-53 percent Of stage B sources and 10-and 66 percentof Stage A sources, respectively.
A Profile -of Interpersonal Home Information -Sources Cited
The typical interpersonal.home sources cited by disadvantaged homemakersare=described in the subsectiona=below.- Data-used to arrive at A, B, and Cprofiles are found in Table 21.
Table 20. Frequency distribution of irierperaonal farm information sourcesN cited by disadvantaged farm operators according to selected socio-
economic characthjiatics
Cburacte istic-
'-
Age, yr:
age B Stage Cpuma _OU rces Sources
1 . N=15 NF-= 4
N (7c N-
N
49 or less . 41 9 60 3 75
50-59 10 31 3 20 25
60 or more ; 7 24 3 20 '-il--I 0
Total 15 100 4', ' 100 .
SS
1.00

Table 20. (Continued
Characteristic
age ASourcesN=29
N.Education, yr:
4 or legs 35-7 3
8 or more 23
Total 29
Employment statuFull time (40
.hrfweck)Unable to workRetired
Total
Ethnic background:BlackWhite 2
Total
Incft,3,1V9. or tess I 3 0 0 o 0
$4,000.6,999 17 . 9 13 0 0
. 87,000-9,999 31 o
$10,000 or more 14 48 11 73
age B Stage _.
ources Sources15 N=4
10 .;) 1330 1 7
79 12 80 4 100
99 15 100 4 100
15 100 4 1000 0 .0 0
3 0 o o 0
90 15 ioo 4 100
2476
29 100
1313 87
15 100
4 100
4 100
Total
Length of residence incounty, yr:
-1-910-192D-29_30 or moreEntire life
Total
29 99 15
Occupationl:Farm operatorGovernment age cyFrivate dealerResearchOther
Total
17
99 4
2575
100
0 0
3 1 7 0 0
7 2. 13 250 0
59 12 80
109 15 100
6610 010 777 0
29 100 15 100
3
4
75
100
1 25.
3 750 0 00 0 0
00
Childhood yesidence:Farm 22 76 14 93 3 75
Town 6 .7 1- 25
City 1 0 0
Total 29 100 15 100 4 100
I Thin! perrenz do.4. rod 141w0P4 +.`,11.4fli I Orl,(1w rounding error.rarrn rerutor farm operai.'ir; C.kf,Prnment iii!ney ASCS "Rice manager. FBA a UPC r.iNor. PCA loan Jfficer vi 1,IIEIiiTkE , dealer, or tieN man ifood. .red fertiliaer.
chernienli.,. farm -,uppli. likErn efinipmenti, twit nui NH,IHrig company notneger; Reoearch*ptciftlist, EVenalon zsgt-s ftwriculture arc! home eennorninah soil ennaarration
teehrileitin, doetarc end Other .4 deputy sheriff and funeral home director.
101
89

Ta le 21. Frequency distribution of interpersonal home information sourcescited by disadvantaged homemakers according to selected socio-`economic characteristics
Charactenistk
-Age, yr:= 111 or less
56-59 ,
00 or moreTotal
Education, ;4 or less5-78 or /no
Total
Employment stitus :Pall time 14
hrfweek)Housetvi0.Unahle u rkRetired
Total
Ethnic 1)1 k nO:BlackWhite=
Total-
Incona):oriess-
,---1:4,000-6,9119$1,000-9,999$1.11.1100 or more
Total 18
Stage ASources
11-1
18
Stage ItSources
N=8
Stage CSourcesN 3
18
Length of residence in .
county, yr:
10-1020-96-30 or moreEntire life
Total
Occum t ion,:HousewifeGovernment agenc}Private dealerResearchOther
Total
11
1 S
100
63 33
12
100 3
0 011 0 0 0 0S3 S 100 3 100
101)
99
5:)
11
100
8 100
751 12
01
1 11II 0
381 51)
01
100
01
12
3 100
00
100
100
I 30 02 0711 0
100 3 100
38
8 100
3333:33
12 2 (37
28 03 1 .= 3316 1 19 0 0
. 0 0 0 011 1 13 0 0
100 8 100 3 100
102

Table 21. (Continued)
Characteriatic.
Stage A Stage B Stage C. Sources Sources. Sources
N=18 N=8N % N
.Juldhood .residence:Farm 14 78 50 3 100
-Town 4 22 38 0
City 0 0 12_ 0 0
Total 18 100 100 3 100
'iota percent dues not always equal KM due to rounding error.2 Housewife = housewife; Government agency = ASCS oirice manager, FOA 5upervisor.-evA loan officer; Fr;vate dealer = banker, dealer or salesman (feed. seed. fertilizer. chemi-cals, farm supplies, farm eiluigraent) , peanut tihelling eompany manager; Research = Eaten-altos specialist, Extension agents (agriculture and hurtle economics). soil conservationtechnician. dilet.frA; 'and Other w deputy sheriff and Funeral hoMie director,
The Typical Stage A SourceData in Table 21 indicate that.the stage A home source was most often a
black housewife (39 percent)i less than 50 years of_ age, having 8 or more_years of edllCation and a farTn background, working full-time and havingresided in the county her entire life. Distinction by annual irkome is not aseasily made for stage A individuals. Twenty-eight percent of stage A sourceshad an annual income of $3,999 or less. Another 28 percent had incomes of$10,000 or more..
The Typical Stage B Source.Table 21 shows that the typical stage B home source was less than 50 years
of_age (63 percent), a white government agent with 8 or more years of educa- .
tion, with a farm background, and employed full-time for an annual salary of$10,000 or more. Thirty-eight percent had resided in the county 1-9 years,an additional 38 percent their entire lives.
The Typical Stage C Sou rceOnly three stage C home sourceS were cited in-the hoMe phase of the study
(Table 21). Two were' housewives and one a vocational agriculture teacher.Allthree bad 8-or more year% oteducation_ii.nd asfarm background Two werewhite, employed full-time, 'one with an annual income of $3,999 or less-and-
o with irfcbmes of $7,000-$9,999.The three imiividuals in .stage C were distributed among three different
categories for age and length of residence in county, Thus, no typical sourcecould be established in relation to those two characteristics.
6. The Relationships of Selected Sociopsychological Variables to-Degree of Rationality in, De,cision-Making; Availability, Us-age, and Credibility of Medii, (Interpersonal, Mass, and Pub-lications); and Degree of Onkage BetvVeen--InterpersonalInformation Sources Used and\ Research-Based InformationSources
This study suspec ed that ctain soCiopsychological variables would be re-lated to rationality in decision making (RDM); to availability, usage, and
0.3

credibility of media; and to degree of linkage between interpersonal informa-tion sources and research-based information sources. Those variables areage; education., present/future value orientation, and social participation,
The Rdationships ot Age , Education, PresentlFuture Value OrientationSocial Participation to Rationalitg in Decision-Making
Each of the selected sociopsychological variables was measured and used tocharacterize the target population. The results of those measurements were
_indicated in Tables 6 and 7. Two multiple regression equations, one for farrnoperators and one for homemakers, were used to determine the cumulativeand individual effects of the se-fated-variables on RDM. Multiple correlationcoefficients (1V-values) were generated foreatrequation. Table 22 Presentsthe RI-value, and its F-value, for the two equations. A .1-5157gr0f---s1gnificaricewas used to test for relationships of selected variables to RDM.
Table 22. The amount of variance in rationt.lity of decision-making amongdisadvantaged farm families explained by the selected independentvariables (N 120)
Depende VrIsble IV-value F-ValueFarm operatorHomemaker
SignifIcAnt a 101evelr-SignifIcarat-ATC-01
.060 1.98*
.096 3.30**
The farm operators F-value (1, siglificant at the .10 level. Thehomemakers' F-value (3,30) was sigii cant at the .01 level. The farm opera-tors' FV-value of .06 indicated that 6 percent of the total variability of RDMfor farm operators was accounted for in the specific variables selected fortesting. Although significant; the amount pf variation-is mall. The home-
/ makers' 10-value of .096 indicated that approximately 10 percent of the totalV measured variability of RDM for homemakers was Accounted for -in the
selected-veriables-of-agerp7esentifuture-value-orientation,-level --ef-edueation,and participationln organizations.
To assess the .relative importance of the four independent variables, theirpartial regression coefficients were exarnMcd for the direction and signifi -cance of their relationship with RDM. Table 23 shows the results- of thac_exam ination.
Table 23. Relationship between selected variabl&rationality of decision--making of farm oper
nd the variability inors and homemakers
,Variable
Farm1.Dperators
130)Homemakers
(N 130)
t-valueAge 0.310Education -0.906 LS42*Present/future value
orientation1.438 1.874*
Social partpation 2.311 1.114
- significant. At .10 ievel; 1111))
_

The t-test value (t) of the regression coefficient shows that the relation--ship between age and RDM was not Statistically significant for either farmoperators or homemakers (Table-23). For level of education the t-value was'.ignificant (.10 level) and positive for homemakers only. The t-value forpresent/future value orientation was positive for both farm operators andhomemmkers but was significant (.10 level) only for homemakers. Finally,for social participation the t-value was positive for farm operators and home-makers, but significant (.10 level) only-for farm operators.
The _Relationship of Selected Sorlopsychological Variobleq to Avallabilit-Usage, and Credibility of Information Media
Chi-square tests of significance were made to test for relationships betweenselected characterics-to availability, usage, and credibility of media. A .05
level of significance was selected to test for relationships. The data in Table24 revealed no iignificantjelationships between the selected sociopsychologi-cal variables and the availability of media for either farm operators orhomemakers. Similarly, the data in Table-25indicate no_slinificant relation-shipi-between the selected sociopsychological variables and mei:lie usage for"ther farm operators or-homemakers. Finally, the d:
that no een the selected sociopsycho--logical variables and farm operators perception of media credibility: How !ever, homemakers' age wag-significantly (.05 level) related to their perception'of media credibility. No significant relationshi!.-i were revealed for theremainder of the 'sociopsychological variables (homemakers' characteristics).
Table 24. Chi-square tests for significant relationships between selectedociepsychological variables and media availability
Media AvailabilityCharacteriat c Mass-
Pub. df3C2.
valueMass
Farm Operator:
4
3.37
8.34
3.89
_ .--Ageryr.49 or less
, 50-59GO or more
Total
1211
01
0
1_
1
1
00
1
372933
99
304227
99
29-35 .35
99
494140
130
465133
130
414643
130
30
5
30
7
30
Education, yr:4 or less5-7n or more
Tota1
Present/futurevalue orientationscore: -
Low 7-12Medium 13-High 17-21
Total
I: 0
93

Table 24. (Continued)
CharacteristicMedia Avail-ability
Mass-MUSS Pub, Pub. df value
Social participa_score:
Low -- 0-3
n
33 53Medium =-- 4-8 7 0 32 39High 9-36 -1 0 34 38
Total 30 1 99 130
Homemaker:Age, yr:
49 or less50-50.60 or more
Total
&location, yr:4 or less5-78 or more
Total
Present/future valut :orientation score:
Low 7-12Medium 13-16High = 17-21
Total
Social participationscore
0-3Medium 4-8High 9-36
Total
13 00
30 1
.1 08 0
18 1
30 1
01
10 01
30 1 1
,
10
6 0
30
3219
09 130
6 1.1)
28 3665 84
99 130
10.64
4 3.04
2.27
33 4230 4236 46_ ,
99 130 4 3,64
3455
130 4 2128
The Relationship f Selected Sociopsychological Variables to Degree ofLinkage
Analysis of variance was ti.ed to test for the relationships between selectedsociopsychological variables and degree of linkage. A .05 lev-el of significancewas used to test for relationships. Table 27 indicates the results -of theanalysis of variance procedure. According to these ilata, there were nosignificant relationships between the selected sociopsychological variablesand the degree of linkage.
1 0

Table 25: 'Chi-square tests for sknificant relationships between selected suciopsycliological variables and media usage
Characteristic
Media Usage
Pub.. _be MaSS.
None Pub. Mass Ias lnt4 Int. Int. All
Farni Operators.:
Age Yr:
49,or less
5059 1
60 or more 1
-Total- 4Education, yr:
4 or 16s
5-7
8 r more
Total
==
MLNI
MESE
MgCli
Al
value
0 10
1
0 5
1 29
13 21 a14 16 41
0 8 20 40
-4 35 7-- 130 10 758--
18 16 46
11 22 51
6 19 33
35 57 130
Pre$entituture value
orientation score:
Low = 7.12 1 11 1 13 13 41
Medium 13=16 1 0 10 1 11 23 46
Iligh -7- 17.21 1 0 8 2 11 21 43
Total
So'cial participation I
score:
Low -4 0.3
Iediuin = 4=8
4igh 9-36
Total
!MEWL 1
1
10 10.75
4 35 57 130 10 6452
10 22 18 53
8 0 6 21 31
0 11 2 7 18 38
1 29 4 35 57 136 10 18,72

Table 25, ( ontinued)
Characteristic
Media Usage
Puh Pub.. Mame
: None Pub, Mass NUS int. Int, int.
Homemakek
Age, yr:
49 or less
50-59
60 or more
Total
'Education, yr:
4 or less
5=7
8 or more
Total
Preontifutute value
orientatian score:
Low a 742
Medium 7 1346
, High =i21 3
0
:
Total
Social partidpation
score: ,
Low 7-0- 4
Medium 4.8 1
sigh .4 946
Total
2
'
=
1 21 9
15 5 7
6 3
12 19
0 3
2 14 4
1 L.5 7
42 12
1 18 3
2 12 4
,=.12 5
42 12
2 =
0 10
1 18
42 12
3
6
10
19
7
7
5
19
8
19
,,
df
XL.
value
=All
24
16
7
45.
-22-
47 0 , 10 , 7:42
36
37 84
47 130 10 9:92
11 42
15 42
21 46
47 130 10 7.83
41
14 34
22 55
47 130 10 760:

Table 26. Chi-square tests for significant relationships betsoCionsychological variables and media credibility
Characteristic
0e, yr:49 or less5 -596or more
Total
Education, yr:4 or less
8 or moreotal
Presen /future vaine-orientation score:
'Low = 7-12 5 4 32 41Medium =- 13-16 7 8 31 46High"= 5
n selected
xz-df value
ator:
,
3 10 . 33 4610 5 36 514 4 -25 133_17_ _. 19 33 130
Total
Social participationscore:
0-3-', Medium
'. High, =, 9-36Total
HOmemaker:
49 or less50-5960 or more
Total
Education, yr:4 a less5-78 or more
Total
' Present/future valueorientation score:
Low = 7-12edium =. 13-16
- High 17-21
Total
17 19 94 130 4
;9 '9 532 66_ 4 28.=
17 19 94 130
8 10 45 634 1 40 , 45
__ 2 , 6 . 14 . 22
14 17' -- .. 99 '130
2 1 7, 104 3 -29 368 13 63 84_
14 17 99 130
3 6 33 42. 4 6 32 42
7 5 34 46
14 17 99 130 4
3,95
L75

26 (Continued)Media Credibility X2-
CI:laracteri c Mass Pub. mt N df !ohm
Social participationscore:
\.Low 0-3Medium 4-8High = 9-36
Total
5
7
14
377
17
332541
99
. 413455
130 3.69Significant at the .0
Ta le 27. Mean values by devariables ,
Variable
Farni operatorS (N = 29)Age'Education ,
.Present/future valueorientatiOn
Social participation0
=,Homemakers (N 18):
AgeEducationPresent/future value
orientationSocial part ipation
ree of linkage, by selec
Degree, of linkage
ociopsychological
Closely Distantly NotLinked Linked Linked
fP5 4
14 15
59
15
50
48
15
NS ,
NSNS
10 NS,
NS6 . NS15= NS
12 7 NS
!The social.particionririn scores were so low that they really do not distinguish between lowand high participation, Thus, no loonehfisions can he drawn regarding the relatbmship betweensocial participation score and degree of linkage.
7

PART Ill LIST OF REFERENCES AND GLOSSARY
A. LIST OF REFERENCES,.
Allen, C. 1974.-The health of\the disadvantaged. Pub.'. Health Rpts. 89(6) :499-503. , ,
Allport, G. W., and L. F. Postman. 194/7. The basic psychology of rumor, pp., 54-65. In E. E. Maccoby,/ T. M. Newcomb and E. L. Hartley (eds.), Rea&ings in Social PsychohigY. Holt, Ripehart and Winston. Inc., New York:
,- . . . e . ,
Anderson, D., and J. Niemi. 1969. Adult Education and the Disadvantag d 'Adult. ERIC Clearinghouse on Adult Education, Syracuse, New York, I
Batehhelder A B 1971 Th EconomieS of poverty John Wiley and Soh, .
. Inc., New York. .
Bel/. W. 1957. Anomie, social isolation and% clan.s structure. -Socionletry20:105-116. _
Berelson, B. 1952. Content Analysis in Communication Research. The Free' Press, Publishers, Glencoe, Illinois..Berlo, D.'I-C., 1960. The Process of 'Cbmmunication. Holt, Rinehart and -Win- !
7 -4
, ston, New York.Bernstein, B. 1960. Language and social class.- British Sociol. 11:271-76.
J Bernstein, B . and D.. Henderson. 1969. Social class differences 'in the rele---Vance,of language to socialization. Sociology 3:1-20.
Bertrand, A. L. 1967. Basic Soeiology Meredith Publishing Company, NewYork.. .Brager, G; 196o, :organizing thetunaffiliated in a low-incOme'_area, pp. 5074
,
512. In L. -A. Ferman, J. L. Kornbluh, and A. Haber (eds.),-Poverti inAmerica. The University of Michigan Press, Ann Arbor.
Brooks, M. P. 1964. The Dimensions of Poverty in North Carolina. The North 'Carolina Fund, Durham, North Carolina.
Chapin, F. S. 1928. 'Measurement of sociability and' socioeconomic status.Sociol. Soc. Research 12:208-217.
Coughenour, C. M. 1959. Agricultural Agencies as Information Sources forFarmen in a Kentucky County, 1950-1955. Progress 'Report- 82, Ken- ...
. tucky Agricultural Experiment Station, University of Kentucky, Lexington.
Conned of Economc Advisers. 1970. The problem of poverty in Ameria, pp.,
7-19. li! L. S.- Sneden II (ed and comp.) Poverty: A Psychosocial Analy- _.......-sis. McCutchan Publishing Corporation, Berkeley, California. i
Daniel, J. L. 1968. Factors in effective communication between professionalS,-nonprofessionals and poor people. Unpublished Phd dissertation, SpeechDepartment, University of Pittsburgh. Pittsburgh, Pennsylvania. ,
Dervin! B., and B. S. Greenberg: 1972. The Communications Environmentof the Urban Poor. Rept. No. -15, Department of Communications,Michigan State University,- East Lansing.
Deli Sch, M. 1963. The Disadvantaged-Child. Basic Books, New York.Erig4l ,' J F., D. T. Kollat, and R. D. Blackwell. 1968. Consumer Behavio
Holt, Rinehart and Winston, In'c., New york.Ferman, L. A. J. H. Kornbluh, sand...A.- Haber. 1965. Poverty in America.
University of Michigan Press, "Ann Arbor.,
1 1 1

Gailbraith, J: 1960. The Alfluent Society: Houihton Mifflin ConipBoston. t
Haggstrem, W. C. 1970. The power of the poor, pp. 79-90. In L C. Sneden II.(ed and_ comp.), Poverty: A Psychosocial Analysis. McCutchan Publish-ing Corporation, Berkeley, California.
Havighurst, R J. 1953. Developmental Tasks and Education:- David McKayCompany, Inc NeW-York.
Hyiran, H H 1955. Survey Design. and Analysis: )Principles, Cases, andPrecedures Free Riess GlencOe Illinois.
Impact '76: A Working Document for North Carolina gricultural Extension. , ,
Service's Lang-Range Program.1972. North Carolina Agricultural Exten-sion Service, Raleigh. ./
Johnsom G. L 1961:Action taking and responsibili,ty bearing, pp. 140-149.In G. L. Johnson, A. N. Halter, and D. W. Thomas (eds.), A Study ofManagerial -Processes of MidWestern Farmers. Iowa State UniversityPress, Ames.
Kaiser, H. F. 1960. The application of electronic computers-to factor analysis:Educational and Psychological Measurement, 20:141-151.
Katz, E. 1957. The two-step flow of communications: An up-to-date report onan hypothesis. Public °Pinion Quarterly 21:61-78
Kerlinger, F. N. 1964. Foundations of Behavioral Research. Holt, Rinehartand Wiriston, Inc., New York.
KlUtkholitVp.- Strodtbeek.,-19617 Variat ions- i n- Value-Orientation-.----Row, Peterson. Publishers, Evanston, Illinois. t
Lazarstield, P. F., B. Berelson, and FL Gabdet. 1944. The People's Choice:# How the Voter Makes Up His Mind in a Presideilitial -Election Campaign.Columbia University Press; Nev.; York.
Lee, R. L. 1970. The flow of information to disadvantaged farmers. Unpub;lished PhD thesis, School of Journalism, Graduate College of the Uni-
t versity of Iowa, Iowa City.Zevitan. S. A. 1973. The poor: Dimensions and strategies. Curr, Hist.
64 (382) :241-246.:Lewis, 0. 1969. The' culture of poverty, pp. 187-200. in D. P. Moynihan (ed.),
On Understanding Poverty. Basic Hooks, Inc, Publishers, New York.Lindsey, R.. February 13, 1973. Transportation cutbacks in rural U.S. mean t,
hardships and decline. NeW York Times, p. 38.Lionberger,. H. F. 1955. Information Seeking Habits and Characteristics of
Farm Operators., Research Bulletin 581, Missouri AgTicultural Experi-ment Station, Columbia.
Litchfield, E. H. 1956. Notes on a general theory of administra ion. Admin.Sci. Quart. 1:3-29.
MacIver, R. M..1943. Social Causation. Ginn and Company, BostOn.Meine; F. J. (ed.).. 1965. Library of Universal Knowledge. Consolidated
Book Publishera, ehicago.Meir, D. L., and W. Bell, 1959. knomia and differential access to the achieve:
ment of life goals. Am. Sociolog. Rev. 24:189-202.Moon, S. G. 1963. A study of factors in the adjustment of rural families in
low-income areas. Unpublished PhD thesis: Sotiology Department, NorthCarolina State University at Raleigh. \
Moon, S. G., and G. C. McCann. 1965: Anomia scale. In C. L Cleland (ed.),Scaling Social Data. Bulletin No. 1,,Snuthern Cooperative Series, U. S.

_ Department of Agriculture, Washihgton, D. C.Moon, S. G., and G. C. McCann.- 1966. Subregional Variability of Adjustment
Factors of Rural Families in the South. Bulletin No. 111, SouthernCooPerative Series, U. S. Department of Agriculture, Washinvon, D. C.
Mouly, G. T. 1970, The Science of Educational Research. Van Nostrand-- Reinhold Com Puny, New York.-Nie, Ni H., D. H. Bent, and C. H. Hull. 1970. Statistical Package for the Social
Sciences, McGraw-Hill. Inc., New York.North Central Rural Sociology Subcommittee for the Study of Diffusion of
Farm Practices. 1961. Adopters of.New Farin Ideas: Characteristics andCommunitions Hehavior. North Central Region: Erten. Publ. 13:4-11.
Ornati, 0. 1964. Affluence and the risk of poverty. Soc. Research 31(3) :1333-346.
K. People and a Spirit., 1968. Printing and Publications Service, ColoradoState University, Fort Collins.
The People 'Left Behind. 1967. Report o'f the President's National AdvisoryCommission eh 'Rural -Poverty. U.S. Government Printing Office, Wash-;
. ington, D. C.Profile of Arneric:rn Health, .1973 19,74. Pub. Health Rpts. 89(6):504-523.Public Works arid EConeMic- Ddvelopnient -Act of 1965, ai,Arnended. 1971.
US. Governmen't Printing Office, Washington, D. C.Ramsey, C. E., ft. A. Poison, and G. E_ Spenser, 1959. Values of the adoption
-of-practices:-Rwral-Sociol. 24:3547.Reeder, R. W. 1965. Factors Influencing Occupational,fiecisions in a Lovii.
Incorrte Areri. Bull. 67.1, Corinell University. Agricultural ExperimentalStation, Ithal=4, NeW,Yorlc.
.
f
Riddick. W. E. 1966. Anomia: Its relationship to rural N.agroes' aWareness ofand contact with public agencies, interest in train im and reluctancy tochange jobs. Unpublished Master's thesis, Department. of Adult Educa-tion, North Carolina State University at Raleigh.
Rieck, R. E., and G. C. Pulver. 1962. An Empirical Measure of Decision-Making in gvaluating Farm and Home Development in Wisconsin. Rsearch Bull. 238,-Agricultural Experiment Station and Cooperative Ex-tensiOn Service, University of Wisconsin, Madia-on.
Rogers, E. M. 1962. Diffusion of Innovations. The Free Press, New York.Rogers, E. M. and G. M. Beat 1957. The importance of personal infiuenc
. the adoption_ of technological change. Social Forces 42(2) :205-215./Rogers, E. itt=rand F. F. Shoemaker. 1971. CothrnuniCation 'of Innovations.
e Free preas, Nev.. York.ogers, E. 5.1., and R. J. Burdge. 1972. Social Change in Rural Societies.
Meredith CorPoration, New york.liokeach, M. 1973. The Nature of Human Values. The Free Press, New. York.Rbsen, B. C. 1956. The achievement Syndroine: A psychocultural dimension
of social stratification-; Am. Sociolog. Rev. 21:203-211.Rummel. R. J. 1970. Applizd Factor Analysis. Northwestern University press,
Evanston. Illinois.Schnmaker, P. IC, and A. C. Thorpe.- 1963. Financial decision_-making as re-
ported ky farm families iri Michigan. Quart./Bull. Mich Agric . Exp. Sta.'46(2):335_352.
Schramm. W. L. 1065. The Proless and EffectS of Mass Communication.University of Illinois Press, Urbana.
101

Service, J. 1972: A User's_ Guide to . slysis System. Student\
Supply Store, North Carolina StateUniverkity Raleigh.
Slone, a L. 1966. The Culturally Dep4ed in'Schoel and Society: Selected
Approaches. Research . Department, Hoard ef Education of the City of
Toronto; Canada.,..k. G. (ed.). 1966. Communicati_on arnj Culture^. RJedings in-the COdes
f Hum,an -Interaction: Holt, Rinehart ar:d Winton-, New York,Sneden, L. S.. II (ed,' and comp.).- 1070. Poverty: A Psychlesocial Analysis.
McCutchan Publishing Corporation, Berkeley, California.1%,,..:
Spicer, E.,1-1: 1952. -Human Problems in Technological Change. John Wiley
and-Sons, Inc., New York. ,
Srole, L. 1956. Social integration and certain corroluri An explanatory
study. Am: Socioleg. Rev. 21:799-716.Tannenbaum, R. 1950. Managerial decision-making. Journal, of Business
- 23:22-34.Task Force on Economic Growth and Opportunity. 1965. The .Concept of
Poverty. Chamber of Commeree_of the United States, Washington, D. C.
: Bureau of:the. qnsus. 1915. Characteristics of the Low-Income Popula--.
tion: 1973. currert Population-Reports, Series P-60, No..98. U.S. Govern-
ment Printing OffiCe, %Washington, P. C.
LLS. Bdreau of the_Cen`sus 19611 . Characteristics of Population. U.S. Goyern.-.-ment-Printing Oflice4Avashington, D. C. -'--
lffelyster's---Seventh--New-Collegiate-Dictionary 1970 G&C.2,14erTiarn Company,
Publishers; Springfield, Ma.ssachusettS.er, J. -8. 1966. Yesterday's People: Life in Contemporary Appalachia.
University of Kentucky, Hress, Lexington. .
lkening, E. A. 1952. Acceptance of improved Farm Practices in ThreeCOastal Plain Counties. Tech. Bull. No. 98, North Carolina Agricultural
Experiment Station, Raleigh,
B. GLOSSARYAgents: those persons concerned -with the disseminMion of information
,and/or tlie alteration- of-behavior of people with whom they interact, e.g.,
-county-Extension agents (agricultural and home economics), nutrition aides,
vocational-agricultural teachers, home- economics teachers, representatives of
gorernmental agencies, and lending institutionsAnomia: a psyclrlogical term referring to the state of mind of one who has
been pulled up from his moral riilits and no longer has any. standards--only
disconnected urges,.
Anomie: a sociological term reerring to a group of people who have been
pulled up from their moral roots And who have lost their sense Of direction:
Communication: a process by,-which messages are transferred from a sourCe
to 3-a receiver. The transfer of ideas from n source with a viewpoint 'of maidify-
ing the behaVior of receivers.Communication patterns: thOse media (interpersonal, mass, or publications)
uaed by disadvantaged farm families as sources of information for farm and
home decision.tnaking: the combinations of media they appear to use.
Credibility: the state of (lfeine, 1965, p. 174) "being worthy of ,cridit,
eliance, or confidence as to truth and correctness:- applied te persons or
hinga."
114

Deciton-roaking: conceived in this study as.the process of arriving apreferred\end by the subprocesses. of .-(1), orientation, (2) observation,analysis, (L.Z implem'entation, and (5). feedback and responsibility as the basisfor future action.
, Disadvantaged fr.rm family (DPF): a man, v.ife, and children (if any).-"demi-Med legether and meetink the criteria eif:-(1) faffning-a production unit :
/ of 10:acres or more from which total annual receipts are _$50- or more, ori farming a production unit of 9 acres or less from which a total annual return
of $250 eir more is reiltized; (2) having an income below the eligibilitystandard set for the MAO Carolina Social Services Food Stamp Program\0.e., $4320 per year for a family of four).
Disadvantaged farm ope ator: any Individual Who earns a living by farmingand meets the criteria est blished in the definition of disadvantaged farmfamily.
Disadvantaged: homemaktr: any individual whose major responsibility iiithat of caring for or manoiting the horne in which she lives and who meetsthe criteria established in tlhe definition of disadvantaged farm:fail-lily.,
Extended family:. thoie:Tersons defined as being kin-and their .nuclearfamilies (Bertrand, 1967).
ileterophily: the degree to which pah-a of individaals differ in riarticulaributes, such ai.beliefs, values, educational level, and age.
HornoPhily: the degree to which pairs of individuals are similar iti par--ticular attributes, such as beliefs, values, educational level, and-age. .
Linkage: the actual chain of interperional relations that faeilitiates thetransfer or relay of information frorha source to a destinatiori. Such 4 com-d.municitron chain, or network, tensists of afiy nurnher of individuals, startingwith a source person arid .sequentially continuing through all of the relatedindividuals who are his direct and Indirect receivers. Essentially, a corn-munication chain or network consists of a number of linked dyads in whichthe receiver in:one is the sou7e in the next.
Media: a generic term encompassing several.,cjistinct information sources-that share common attributes. The various media ancLthe informationsources in them are communication channela through which a message is
nsmitted, conveyed,.or carried on: In this Study, media afe classified aseither interpersonal-, mass
/-Or publications. Information -sources within each'
category are: interpersonalagents, church, dealers, and family-friends-neighbors; massnewspapers, radio, and TV; and publicationsbulletins-pamphlets, Fame r's A Im(y`nrw. and magazines.
Nuclear family: a' husband and Wife plus those children:they identify astheir own and for whOm they assume the role of parent (Bertrand, 1967). //-
Opinion leaden": a person who informally influences other individeals'attitudes or overt behavior with _relative frequency: (Rogers and Shoemaker,1971).
The poor: those in a condition of-peverty (i:e., the disadvantaged).Poverty: conceived in-this stay as a multi-faceted phenomenon which has .,
many distinct social, psychological, economic and political ramifications,Operationalized in thii study by the criteria used to identif disadvantaged i
farm families.Rationality of decision-making (RDM):_conformity to the d-cision-making
process developed for this study.

Reaearch-based information source: a person (specialist or researcher in a
specific subject matter'arca) who represents a profession:or inStitution recog-
nized by the scientific community as possessing impartial research infor.
mation that has been validated empirically by application of the scientific
methpd as opposed to value, moral, or ethical judgments. In addition, any .
research'inforMition-tianiinittbd by these Individuals-in written or-publica - - _
tion formwill be considered lk research-based source of information.
Sourees A, fl, and C: represent, those persona who serve as links in the
chain of information flow to disadVantaged farm families. "A" is.the inter-,.perscinal information source used by the disadvantaged farm farililies; "B"
the interpersonal information source used by,"A";.- and "C" is the inter-;
personal information SOUITO used by "B."Subculture: the total way of life of the disadvantaged farm family', includ .
ing.the legacy of pa-grliuman behavior, and representing the historical accu-
'millation of artifacti.knowledge, beliefs, and values by which they cope with
their world.


iAT2endik:Research QuestionnaireS
Name
Address
Interviewe
Map Number .
A STUDY OF DECISION-MAKING AND COMMUNICATION PATTERNS OF.DISADVANTAGED FARM-FAMILIES IN THENORTH CAROLINA.COASTAL PLAINS AREA
. ,
Experiment Station Rui-al DevelOpment PrOjeCtlioTth Carolina State University, 1971-75
SCHEDULE NO. IHUSBAND AO-RTVE
ication Numb_
Card Number
County: (MARK. COUNTY IN WHICH .FAMILY LIVES)
1 Halifax
2 Northampton',
3- Bertie
,
-
:SECTION I SCREENING QUESTIONS
The purpose of this section is to determineif the family is to be interviewed, that is, if t edefinitions of "farm," "family," and "income"formulated for-this study apply. _

(USE CROSS MARKS (X) FOR RESPONSES. IF "NO7'lS MARKED IN EITHERQUESTION NO. 2 OR QUESTION NT. 3 BELOW, THE'FAMILY DOES NOTQUALIFY'. HOWEVER, CONTINUE THROUGH QUESTION NO S BEFORETERMINATING THE INTERVIEW.)
'First of alI, I would like to ask you a few questions a out.I7,your farm and-family.
How. Many-acres do you farm?
1 0 - 9 -(IF MARKED, ASK QU STION NO. 2 AND SKIPQUESTION NO. 3.)
10 or more (IF MARKED., SKIP TO QUESTION NO.
Did you aell as-much as $25000 worh.of farm -productS.'during- the:%_/ear? .
YES ($250.00 or more)
_ 'NO (Less than $250.00)
Did yo6 sell as much as $50.00 worth of farm -n-oducts duringthe year?
1 YES ($50.00 or more)
Nb, (Cess than, $50.00)
-Are you married?
YEs'
NO
.DO you and your wife bOth live
YES
NO
here
DO you have children or gndchildron 14ving.*T'fil'you inthis hodse?
YES r YES, AK) How many?
Children
Grandchildren.
NO

(ADD NUMBER OP CHILDREN, GRAND'CHILDREN, AND PARENTS TOARRIVE AT THE SIZE OF HOUSEHOLD. BASED ON SIZE,OF HOUSE-
:HOLD, FIND APPROPRIATE MONTHLY INCOME LIMIT IN SCHEDULE,DELOW AND ASK QUESTION NO:' 7, PILLING IN THE BLANK WITHMONTHLY INCOME ALLOWABLE FOR THE 'RESPONDENT'S sun OFFAMILY.)
Maximum Allowable MonthFeb-d7S--EAmp Income Stan
SiXe- of--houaehold
Monthly/income "
222
293
360
427
493
.547
600
65
2
10 706
YearlyinoOme
.2664
3516
4320
5916.
6564
7200
--77836'
8472
Iiousehold having' more than ).0'familymembers, for each addition 1 member-Add$53.00 per month.
-Would you say that c'our total fandly income
do2lars a month or-
YES
NO
falls be ow
a year?
1Based- on-eligibility standards for 1972.
120

8. Would you say that the total_family income received by allmembers of'your family living at home is:
.,
1 'Less than' $L,000'
$-1 999-----
3 $2,000 - $2.,999
11 $3e000 - $3,999
:$4000 - $4,999
$5 $5,999
$6,000 - $6,999
$.'17,000 - $9,999
or more
-(IF_EESPONDENT.MEETS THE CRITERIA FOR'"FARM," FAMILY,"-AN&"INCOME" FORMULATED FOR PURPOSES OF TRIS,STUDY, PROCEEDTO.SECTION II. IF NOT, THANK RESPONDENT FOR THE INFORMA-TION 4ND TERMINATE THE;INTERVIEW.)
A-
,109

SEGTiON II - PERSONAL AND1SOCIAL DATA -(ENTER RESPONSES TO QUESTIONS INCLUDED IN THE FOfLOW,XPG
PARAGRAPH ON FORM-1.FOR ALL P RSONS LIVING IN1HOUSEHOLD*;--
HUSBAND OR WIFE MAY RESPON).)_ -
-ould-ttk-e-Yo'r you to tell me,something aboUt yoursblf,
-ers of your family, and all other people livip with you
in this house;- Starting with yourself (huaband), bywhat name
do your friends call you? Do you mind giving me your age on
your last birthday?! What aboUt-your'school days -7 give me the
7--,highest grade you completed in school? Now'tell me-about your
rk 7- What,havecyou been-doing,for the lest month; that-15 4
-
have you been (READ CODE 2) working off the farm full time
(40 hr week), working.ofE the Earm part time (les than 40'hr
X)ri out of -work snd 'looking for nonfarm employMent; keeping
Onable to work retired.house, going td schbol (include T1
or other? in addition ta your. farming, do yOu give time to
any othet type ork for-which yon receive money?
'Nowhôw about your wife (CONTINUE ACROSS FILLING IN-FORM_
SAME71AS FOR HUSBAND) -- What is her name, 4qe, highest grade
completed in school, availability for work.1
I -,,fould like to talk with you next about your Children
othr liVing with you. (CONTINUE ACROSS, FILLING IN1FORM
FOR EACH CHILD., GRANDCHILD-, AND-ALE PERSONSLIVING IN HOUSE.
:
.REOOND-:FOR EACH OF THESE, "SLX" AND "RELATIONSHIP .T0 FAMILY.")

PERSONS IN 'OUSEHOLD*
Rela-tion-:ship
tofamily
Code-TIT
Sex(M !
orF)
Age at. lastbirth-
day.
Highes_grade
completedin
scheol
Ayail-.abil-
ityforwork
Code2
10
Code 1 Code 2
1 Child (son or daughter) '1 = Work"off farm full time2, Grandchild (40 hr/week or more)3 .= Other child 2 = Work off farm part time4 = Son or daughter-in-law (Less than 40 hr/week)5 = Parent of husband'oryife 3 Out of work and looking for6 Other adult ,nonfarm employment
4 = Keep.house5 = Go to school (include TI)6 = Unable to work7 = Retired8 Other (specify)
9 =aequat6-TH-forma ion*Include:as persons in household all people living in the !household with the family at the time of interview-arid taking !part inihouehold activities (sleeping-and eating) during the last 6:months. '(These persons nead.not be related by blood to the family.)
_
JOOlude children who Are.away in college or boarding schgol.
123ill

(USE CROSS MARKS (X) FOR RESPONSES TO ALL QUESTIONS THROUGHOUT
,THE INSTRUMENT-EXCEPT WHERE FIGURES, NAMES OR CIRCLES ARE
REQUESTED.)
-Next, I would like to talk with you about your present farming
.Operation -end where you have lived. (HUSBAND TO ANSWER
-2-QUESTIONS 10, 11, AND 12.)
10. How would you.describe your present farming arrangements;
,that-is, are yoil an operator, tenan or do you have
other farming arrangement-7'
(MARK (X) TENURE STATUS "a" OR "b" BELOW AND ARRANGEMENTS
WHERE APPROPRIATE),;
Operator (including partnerShip).
All owned; Number acres owned:
Part owned; Number aeres owned:_
Number acres not owned:
112
- A.
A.
(IF "PART OWNED" IS MARKEp (X), ARRANGEMENTS .
BELOW MUST BE MARKED.)
Arrangements regarding pa7t non-owned:
Cash renting
Share renting (including sharecropper)
Other (Describe)
Ten Non-owned)
Arrangements (Total acres
Cash renting
Share renting (including *harec o per)
dither (Describe)
12i

11_ How many years have you opera ed or worked under yourpresent farming arrangements?
Less than 2 years
2 year-
, 3 5 - 9 yearT
4 10 yOarS or more
9 Inadequate inforMation or ne re ponse
12. About how long have you lived on this farm? (MARK (4'130THHUSBAND AND WIFE IN QUESTIONS WHERE-SPACE IS PROVIDED:
HUsband
1, _
2
3
9
2
6
9
Wife
Less than 2 yearS
2 - 4 years
5 - 9 years
10 - 19 years :
20 - 29 years-
30 years or more
inadequate informatiOn"

13, Social Partio ation - Now,1would like to ask aboutorganizations to which ea'ch of you belong', or take part
in. Do you belong tO Or attend church, etc.? (RECORD
1, 2, 3" FOR EACH "YES" RESPONSE. LEAVE "ELANK"--IFRESPONSE IS "NO.")- (RECORD FOR BOTH HUSBAND AND WIFE.1
RESPONSE SCALE_
Code: mbership 1; Atien
,
Name or type of. , ,
organization .in,C DE
Are youa
member?
Do youattend,afourth ofthe t' e?
Do youhOldoffice Orserve oncommittees?
H Husband W = WifeW H
2
-
Church
,Sunday School
Farm organize ions (FarmEureau,'NF0,-Grange, ,
etc.)
School organizations(PTA, Boosters Club,etc.)
Community clubs, (Home°makers Club, VolunteerFiremen etc.-
Other (LIST BELOW)
,
1 2

AT THIS POINT IN THE INTERVIEW,..THE HUSBAND AND WIFE WILLSEPARATE.-TO ANSWER REMAINING QUBSTIONS IN THE INSTRUMENT.
Questions in :Schedule No ages 119 through _128- aie to beanswereaby _he husband
QUeationa in SChedule No. -11 agcs 131 through 147 are to beanswered by the w- _
Paq0-148.is to be 'com_e_leted jointly by_ the two interviewersAFTER _leavin- h residence of family interviewea anaBEFoREinterviewing te next ami
127115

'BEFORE PROEEDING TO
QUESTIONSON
SCHEDULE NO, II.: HUSBAND'ONLY

Interviewer
SCHEDULE NO. IIHUSBAND ONLY
SECTION.III DECISION- OMMUNICATION, AND LINKAGEDATA FOR FARM - INTERVIEW HUSBAND
Next would-Like to talk with You- bout yourareing.
14. What are 2 or 3 of the most-important deci ions atout,your farming that you have made:during the past 12months? (WRITE IN. CODE TO BE DETERMINED'LATER.1
a.
15. -Of-those (READ DECISIONS CITED ABOVE), which onedecision do you consider to be the most important thatyoW had to make; that is, which was the=toughest orhardest one for you to makeT
(CIRCLA,LETTER WHICH. REPRESENTS THE ONE DECISIONCHOSENq:KOM ANSWERS GIVEN TO,QUESTION NO. 14 ABOVE.)
b. c.
r ,Did you talk with anyone outside your family ,aboutthis problem_before you actuaily made Jour decision?(MARK (X) YES OH NO)
1 YES
2 NO (IF NO, SKIP TO UESTIO NO. 18)
NO RESPONSE

17. Did this person help you to make up your ind? (MARK
YES OR NO)
1 YES (IF ,YES, ASK QUESTIONS a, b, c BELOW AND PROBE
FOR ONLY ONE PERSON'S NAMS.)
a What is this person's name? (WRITE IN NAME)
-e doe'J be/She live? (WRITE IN ADDRESS)
what type of wo k does _ do. (WRITE IN)
NO
3 , Not applicable
Inadeouate information or no response
ent - (Relative to "farm" decisioñ&itedin question No. 15)
There -are A few more questions which I wOuld like for
you to answer for me regarding this important farm decision
which you made; that is: (kEPEAT FARM DECISION CIRCLED-IN '
QUESTION. NO. 15.) ,
MARK (X ) ONEDON'T
YES NO 'KNOW
1 2
2. 1 2
120
Rid you knOw what you wanted to da-before yoU made this decision?
pid you put off-making thi decision?
Were you forded to make this de-
cision before:you tlere ready?
d. Did you talk to anyone outSide- your
family about_the problem before you .
actually made your decision?
Dia looking at magAzines or newspaPel
(including ads), college information:,bulletins, TV or radio give you ideas
about what to'do?-'
130

6.
DOW3YES NO KNOW
2
8. 1 2
1 : 2
2
11. 1 2
12.
3 Did -Votr_think about aiiy other way,tha. t you cou1Cgolve
Did you take longer than a week todecide what to do?
Did you leel yOu were takingachance when you made up your-mindto handle the problem this way?,
,Did you talk this over a lot.With,your wife or children
Do you take full.credit for ,makingthis decision?
After doing what you decided, have_, you talked to, or ,heard of, otherpersons who have made thesamekind of decision?
2 3 Would you do.things differently ify-Du could do it all over again?
121

NOw _ wo3,ild like te get.a clearer picture of any other sourceof help\which you got in making up your mind about this mostimportant 7.farm" decision we just talked about; that is:-1-REPEAT FARM DECISION CIRCLED.IN QUESTION-NO 15)
9 'Media/Information Source Usage Did you get any helpin any other way or from any ether source in making upyour mind about;thisfermn problem?
LARK (X) YES OR NO IN COLUMN.)
SOURCE
Newspapers
YES
1
Farm magazines- 1'
COLUMNNO
2
Bulletins or pamphlets
Farmer's Almanac
Radio
1 2
2
2
1
TV 1 2
Government:agencies elfere, 1 2
FRA, SCS, ASCS, etc.)
Agricultural Extension Agent 1 2
Vo7Ag Teacher L. / 2
Dealer or salesman (felize , seed, feed)
1
Lendinv'institutions (PCA, 1 I 2
bankS, ete.)
Friend or neighbor
Family member or re ative 1
Minister of church 1 2
Other (Identify) 2
/

(QUESTION NO. 20 IS NOT RELATED TO A SPECIFIC,FARM PROBLEM,BUT IS'DESIGNED TO DETERMINE HOW MUCH FAITH THE RESPONDENTHAS IN VARIOUS SOURCES OF INFORMATION.)
20. Credribili_ of farm Information Sources (Mass Medi
Publications and In/ - canal
would like to ask you a tew More questions about whereL_you_g.et farming informat,on and how you feel about the truthful-
ness of it.
a. Between TV, radio, dnd bewspapors, which one sourcewould you say gives the most tr6th-fu1andFIght, thatis, accurate farming information? (MANK(X) ONLYONE SOURCE.)
Mass-media sources
TV
2 Radio
3 Newspapers
Inadequate information or no response
1:11: _For information on farming, which one of the following'-sources would you say gives the most truthful and right,that is, accurate infOrmation - farm magazine-S,.bulle-.tins, or the Farmer's Almanac? (MARK (X) ONLY ONE SOURCE.)
.Publication sources
1 Far),M magaz nes
2 Bulletins and pamphlets
Farmer's Almanac
Inad quarte information or n6 response

c. .For help in making farm decisions, which one.sourcewould you say gives the Most truthful and rfght, thatis, accurate information -- friends and neighbors,Agricultural Extension Agent, Vo-Ag_teacher, farm-dealers, family members, representatives of othergovernmental agencies (Welfare, FRA, ASCS, SCS, et ),
minister of church, or leading institutions? (MAR
(X) ONLY ONE SOURCE.)
Interpersonal sources
Friends and neighbors
2 Agricultural Extension Agent
3 Ato-Ag teacher
4 Farm dealers or salesmen
5 Family,members
Representatives of other governmental agenc es(Welfare FHA, ASCS, SCS, etd-.)
7 Minister of church
8 Lending institutions (PCA, banks, etc-i)
9 Inadequate information or no response

a. Of ttiedifferent inforMation sources- you have named, thatis (REPEAT NME OF SOURCES CHECKED IN QUESTIONS a, b,AND o), which one of these three do,you berieve is themost overall truthfUl sou'rce of information' for you?(MARK m ONLY ONE SOURCE.) .
-
Mass Media
Publicat _n_
TVb. Radio
. Newspaper
f
Interpersonal-
* -9 Inadequate dnformetion
or nwresponse
j.k.1.
Farm magazinesBulletins or pamphletsFarmer's Almanac
Friends,..and neighborsAgricultural Extension AgentVo-Ag teacherFarMIdealers orsalesmenFamily membersRepresentatives ef othergovernmental agencies(Welfare, FHA, SCS,ASCS, etc.)Minister of churchLending Institutions-(PCA, banks, etc.)
135125.
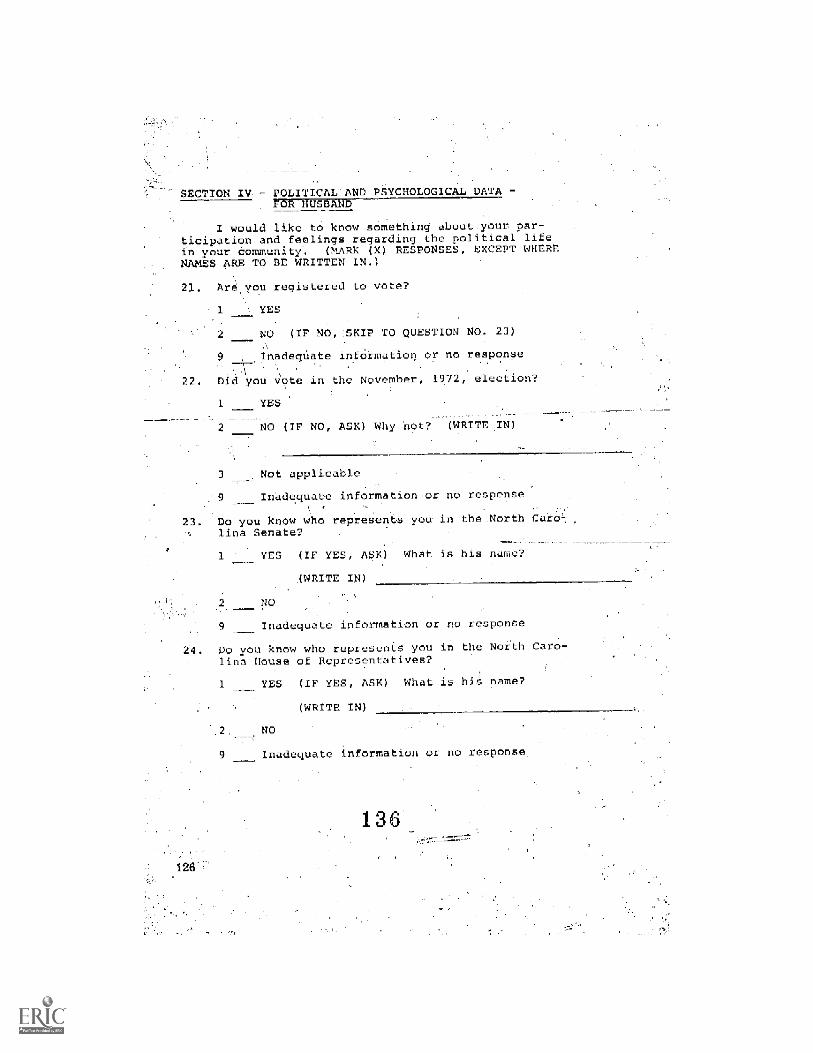
SECTION_IV, - POLITICAL:AND PgYCHOLOGICAL_DATAF R HUSBAND
I would like to know something about your par-ticipation and-feelings regarding the political lifein your Community. (MARX (X) RESPONSES, EXCEPT WHERENAMES ARE TO BE WRITTEN IN.)
21. Areyou registered to vote?
1 YES.
NO (IF NO,:SKIP TO QUESTION NO. 23)
9 ,
Inadequate information or no response
22. Did you Vote in the NoveMber, 1972, election?
1 1ES
NO (IF NO, A'' Why no WRITE IN)
3 Not applicable
'9 Inadequate information or no response+
23. Do you know who represents you in the Northline Senate?
1 YES (IF YES, ASK ) What is his name?
(WRITE IN)
NO
9 Inadequate information or no response
24. -Do you know who represents you in the North Caro-lina House of Representatives?
126'
1 yES (IF YES, ASK) What i hiS name?
(WRITE IN)
2 NO
9 inadequate information or no response.
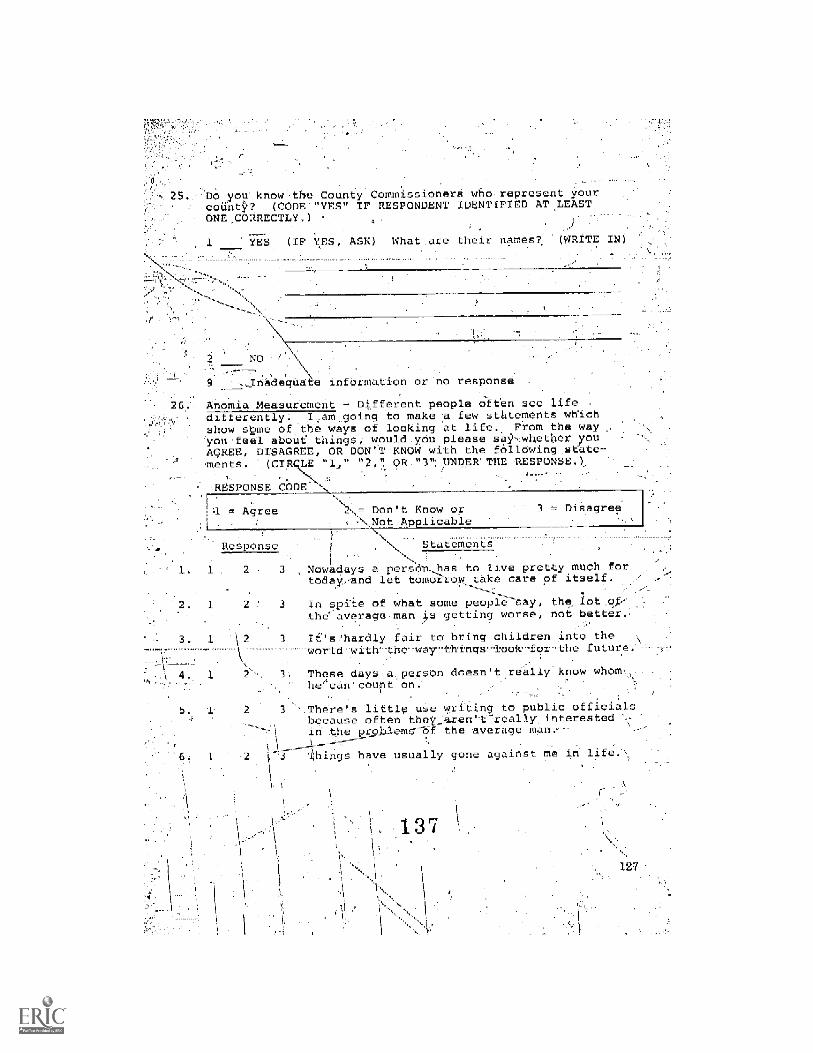
Do you know-the County Commissioners who represent YourcoUneY? (CODE "YES" IF RESPONDENT IDENTIFIED AT LEASTONE,CORRECTLY.)
YES (IF YES, ASK) What.are their names, (WRITE IN)
NO
---,Inadequate information or no response-
Anomie. Measurement Dijferent people often see lifedifferently= I,am_going to make a few sthtements wWichshow sOme of the ways of looking at life. From the way'You feel about thingsi would you please saY,whether youAGREE, DISAGREE, OR DON'T KNOW with the fallowing state-ments. (CIR "I," "2,1 OR "3": DNDEWTHE RESPONSE.),
-RESPONSE C6DE
= Agree = Don't Know orNot Applicable
Response
2
3 .DiS.ag
Statements ,
1
..
: .
Nowadays a persdn-has to live pretty much fortoday,--and let tOMOrrow take care of itself..
----
In spite of what some people "Say, thp lot ,othe' average man is getting worse, not bette-
Ie-s'hardly fair to bring children into the-Id-with-the-way-things-look-for .the future.
4. 1 2.3 These daysaperson doesn
, .
lihings. have usually gone-againstme in life.A,
hecan'coupt on.ally know whom',
There's little use writing to public officialsbecause often they_aren't-really- interestedin the problems6T the average man.
'--

-
-present-Fu on'-- People have different
attltu s owär time, t at is about how they feel,aboutthe present and thelfutue.' From your point,of view,would you say that you AGREE, UNCERTAIN,.0R-DISAGREE with
the seven statements which I will read. CIRCLE THENUMBER "1," "2," OR "3" UNDER RESPONSE THAT BEST DESCRIBESRESPONDENT'S REACTION TO STATEMENTS ON PRESENT 'Vs TUTURE
YALUE_ORIENTATION.)
RESPONSE.CODE
2 Uncertain, 3 .= Disagree:.
2.
.2 I is best: to giye most attentioh.to what
happening now in the-present rather thanheing concernedrv.ith-the..future._
2 Man's life should be guided more by his hopesfor the future.
With things as they are today, .a sensible:-person ought t6 think onAy abOUt the preSent,without worrying About what is going to happen-tomorrow.
4. 1 2 3 It is useless to plah, since one'splans hardly-ever wOrk out.
5" 1 2 3 Nowadays a Person who plans doesn't really
know how to enjoy the present. ---.
2 3 The future is too'uneertain fox a perSon-te-plan';
2 3 The best way to live 4.s to look a long time.
,ahead, work, hard, and give up2many thingsnow so that the future wjll be better.
THANK THE RESPONDENT FOR HIS TIME AND ANS ER

or DECLSION-AFTNC AND 0-iMMUNICATION',RATTFRNS OF DISADVANTAGUi- FARM FAMILIES
ORTH -CAROLINACOASTAL-PLAINS AREA
mept Pi-ojeceGnivorEli 1971-75
6Ctir..DULI,. NO. ill: WITE ONLY
ADDRESS_

SECTION V
1
, .
Interv1ewer
HEPULE NO. IIIWIFE - ONLY
-DECISION-MAKING, COMMUNICATION,DATA FOR OME INTERV[;EW WIFE
you,For-the next few minutabout your home.,
/s I wolld like to talk with,
. /
-28. ,What7a_e 2 or 3 of the most/important dedraiorni about ,
your home that,you have made during the past:12 months?'.(WRITE;IN. CODE TO BE DETERMINED LATER.)
a.
b.
9. Of these (READ DECISION CITED ABOVE) , which onedecision do you consider to be the-most important that;YOU had to Make; that is, which Was the-toughest or
L,hardest one for you to:make?-
(CIRCLE LETTER WHICH REPRESENTS THE ONE DECISION.CHOSEN-FROM-ANSWERS GIVEN IN QUESTION NO. 28 ABOVE.)
a.
30. Did,you talk with anyone outside your family aboutthis problem before you actually made your decision?(MARK (X) YES OR NO.)
YES
'2 NO (IF NO, SKIP TO QUESTION NO. 32
9 -No response
140

31 Did this person, W.YES OR' NO)
-1 YES\
you te maKe up you ind?
(IF YES, ASK QUESTIONS a ,b, c' BELO
FOR ONLY ONE-PERSON S NAME. )
a. Wh'et is this Person s name?
AND PROBE
IDE 1NNAM
Where does: he/She live? WRITE-1N ADDRESS)
c What..type of work
_=
' TE INe he she 'do?
NO
Not applicable
Inadequate information or no resporise
141

. Rationalit Measar ment - (Relative to "home" decisionin question No. 29)
There aro ajew otner questions which' I would like foryou to answer for me regarding this- iMportant home decision,
....Which you made; -that ist-AKEPEAT HOMEADECISION.CIRCLED IN
(K)ONE
YES NODON'T-KNOW T
1 2 3 a. :Did you know clearly what you want.ed,to do before yon made thisdecision?
Did you put off Making this-decision:for a while?
3 c. Werp you forced to-make this-decIsion-befote=you-weree.ready?
-
3 - d.' Did you talk to anyone outside yourfamily about the problem before you!actualrY made your -decision?
-2 3 e. Did looking at magazines or newsPapers,,(including ads). collegainformation:,bulletins, TV and radio give you ideasabout what to do?
Did you think about any otherWaYthat you:could solve thia probloM?,
1
Did yuu take longer than a week todecide what to do?
Did you feel yciu were taking_achance- when-you-maP up your mindto handle the problem this way?
Did you-talk this over a lot withyour husband or children?
Do lou take &II, credit for makingthis decision?
After doing what_you decided, havyou talked,to4 or heard of, other-persons whO-have made the same ,
r kind of decision?-
Would-you do things differently ifyou coOld do it all ever again?
142

-
Now I would like to get a clearer 'picture of -any Other sourceof helpwhich you got in making up your mind-about this most im-portant "home" dpcision wejust talked about; that is: -(REPEATJ.
HOME 4DECISION CIRCLED IN QUESTION NO. 29.1
3-3/.Media/Information Source Usage.- bid you get any help inany other source in making up your mind about-this "home"
..problem? :
(MARK (X).,YES OR NO IN COLUMN.)
SOURCE
NewSpapers
Homo magazines
Bulletins or pamphlets
Farmer's Almanac
_Radio
TV
'Government-agencies Welfae,THA,.ASCS,etc.)
_COLUMN.--YTS_ . NO
_0M-e Economics Extension Ageht
'Nutrition Aide
Home-Economics teachp_r---
HoMe salesman (aP-pliances, furniture--etc.)
Lending-institutions (PCA,banks,,etc.),
Lend or:neighpor.
Family member. Or :relative
Minister of church
'Other (Identify)
1
1
1
1
1
1
1 2
2
1 2
2
2
2
1

-:(QUESTION NO- 34 IS NOT RELATED TO-A SPECIFIC HOME PROBLEM,TOT IS DESIGNED TO DETERMINE HOW MUCH-FAITH THE RESPONDENTTAS IN VARIOUS-SOURCES OF INFORMATION.). '.
. ,
'Credibility of Home Information Sources ,- (Mass Media,
would like to ask you afew more questions about whereyou get homemaking information and haw you feel about thetruthfulness.of it.
-
a, getween TV, radio, and hewspapers, which one sourcewourff ybu say gives.tha most truthful and-Yrght, that-is, accurate homemaking information?, (MARK (X) ONLYONE SOURCE.)
Mass media
-1 TV .
2 Radio
_urces
3 Newspaper.
9 Inadequate information or no response
For information on homemaking, which one of the follow7ing sources would you say gives the most trUthful andrig t , that is accurate information -- home magazines,bul etins, Or.the almanac? (MARK (X) ONLY ONE SOURCE.)
l'cation,_source
Home magazines;
Bulletins or pamphrets
Farmer's Almanac! -
Inadequate'information or no response
1 4

or help in making home decisions, which one sourcenld-youSay gives the most truthful and right, that
isi:accUrate infermation friends and.neighbors,Home. Economics ExtenSion Agent,'Nutrition Aide-, Home'Econemics teacher, home dealeri, family _members-, .representatIves-of-othe-Fgovernmental agencies--(Welfare, FRA, etc.), minister of church, or lendinginstitutions. (MARX (X) ONLY ONE SOURCE'.)
r
Inter ersonal sources
1 Friends and neighbors
2 Home "Economies Fletension Agen
3 Nutrition Aide
4 ' Home Economics teacher-
Home dealers or salesmen
Family members
7 RepresentatiVes of other governmen al agencies(Welfare, FHA, etc.)
13-- Minister of church
Lending institutiOn ome Finance, banks, etc.)
10 Inadequate informatlon orno response-
1 4 5

_Of the different inforTnAtip_ sourcesthat iS (REPEAT NAME-OF-SOURCES CHEC.a; b nd.0, which one bf these threeip the most overall.truthfulRource ofyOu? (MARK (X)-ONLY ONE SOURCE.)
TVais media b. ,Radic
NeWspapers
Publications_ -
nave named,-N QUESTIONS -
you believeformation for
-
-d. Home magaZine,e. ,BulretinS or p
-Farmer's AlmanaC
j-3 Interpers k.
1.
m.
Inadequate infovmati
Frionds and neighbHone Economics Detensi
Nutrition AideHome Economics teachHome dealers br salesFamily nieMbersRePresentatives of othegovernmental a4enoies(Welfare, FHA,,ASCS;-
'Minister.1,ending institutions(Home Finance,.banks,
. etc.)
no response
146

POLITICAL AND PSYCHOLOGICAL DATA - F01-1 WIFE
;1 would like.to know something about'your-particlbation and_-
eelings-regWrdifig the political life _in__your -community. (MARK
..(X) RFSPONS_Rs1 EXQFPT-wl-TERE._13gSPON.SEP_AND_NAMWAIJE.:TO,BE_i__WRITTEN IN.)
. :Are 'you regis ered tO vote?
1 YES
2 NO (IF-N0,- SKIP TO QUESTION NO.
Inadequate informat1on pr pc respolise,
36.. Did you vote in the November, 1972, election
YES
NO (IF NO, ASK) Why Not? (WRITE..IN
Not app1ic4b e_
37. Do you know whO :represents you in the North Carolina Sena
YES IF YES,: ASK) What is him name?, (WRITE IN)
NO
9- Inadequate xn rmabiun--,orno response
e?
'
Do ypu know who-represents you In the Northof Representaaves?
Ca olina Houses
YES (IF YES, ASK) What is his name? WRITE
2 NO
3. Inadequa e nformation or no response

. Do you know the County Commissione s who represeht yourcounty? (CODE "YES" IP RESPONDENT IDENTIFIED AT LgASTONE CORRECTLY.)
YES (IF-'YES,- ASK). ha are-their naMes WiRITE IN)
2 NO
9 Inadequate information,or no respOnse
Anomie Measurement - Different people often_pee life ,differently= I am gping to make:a few statements whichshow some of the ways of,looking at life. Fram the Wayyou,feel-:atcUt things, would you please say whether youAGREE; DISAGREE, OR-,DgN'T SNOW with-.the following state-
nts. (CIRCLE "l," '2," or "3" UNDER RESPONSE=)
RESPONSE CODE-
=-.Agree
EsaaTiis
2
2; Don't Know or-Not App.licable
statements
NoWadays a pe_son has to'live,pretty much fortoday and let tomorrow takenare ofitself.-
In spite of what some people say,-, the lot of -
the average man is getting worse, not better,
It's hardly fair to bring children into theworld with the waY things-look for the future;
---These days'-a person doesn't really know whom
:hd -can count on,
There's little use writing to public offiOiulsbecause often-they aren't really interestedin the problems -of the avPrage man.
Ibings have usually gohe against mn in life.
1 4 8

41. Pkesent-Future 'Value brióntation .- Peop1 have differentattitudes toward time is',:atiout-how _they fee1
abeut the present and thei, future . From your point of
_View, would you say t at you AGREE,.are UNCERTAIN, orD uAGREE with the seven statements which I will .read.
iRcrx THE,HUMBER -q.1,"-"p" OR "3",UNDER'RESPONSE THAT
BEST DESCRIBES RESPONDENT REACTION TO STATEMENTS ON ,
PRESENT-vs_FUTURE VALUE 0 IENTATION.)
RESPONSE CODE
1 = Agree 2 = Uncertain 3 = Disagree
ResE2n!e.
1 2
2. , I 2
a emen
It is_best to giVe most-attention towhat is hapPening noW gin the presentrather than being concerned with thefuture
:Man's life should.be guided more by hishopes for the future.
With things as they are today; a Sensibleperson-ought to think only about_thepresent,without werrying about.what isgoing to happen tomorrow. ,
It is useless to plan,%since one'splans hardly ever work out.
2 3 Nowadays a person who plans doesn'treallY know how trd'enjoy the-Present.
The future is too uncertain for a person-,-to plan.
The-beet way-to live is...to look/Along.time ahead, work haed,-and.give Up-'many 074ngs now-so/that the future-will,be better.'-
e,
SPONDENTJOR:BER TIME AND ANSWERS.

_
SECTION VI - FiNTMILY LIVING AND HEALTH MEASU EMENT
Now I would like to ask you a few questiond abouthome.
-.42. Whloh of the fo,llowing i e- that-are in working-Order, do you lave ?' (MARK (X) ALL THAT APPLY.)---'-
Electric gas.refrigerator
Gas or electric stove,
Cold running wdter in the home
Hot running water in' he home.
Bdth-pr shower
Kitchen sink
Vacuum cleaner
Washing machine_ _
Home freezer
Window air conditioner
machiiie
rfoR OFFICE USE.ONLY
Item Code
Code I, if'markedCode,2, if blank
-
43. Do you-havet in workin_ order a:'(MAPX (X) ALLTHAT APP
Television-
Radio :
--Telophone-
Automobile (Number- ),

44. Which of the following do you receive regularly?
Daily newspaper (Name
.weekly'newspaper (Name
Farm magazine
Other weekly or monthly magazines (Name
45. Do you rent or own your homell
Own
2 Rent
Don't kno
Hew many,rooms not including bathro -) do you have in
your home? .
,(000E ACTUAL NUMBER -.EXCEPT IF MORE THAN NINE CODE 9.)
many rooMs re used for sleeping?
(CODE ACTUAt NUMBER.)r
Whatrtype of heat do you have? (IF COMBINATION RESPONSE IS
GIVEN, RECORD
2
3
4.
Wood
Coal
Oil or gas heater
Oil floor furnace,
Other (Specify)
FOR INTERVIEWER'S USE ONLY
(MARK (x) CoNDITION 0
Good (sound)
Fair (deteriorating)
Poor (dilapidated)
Inadequate information orno response
142
REPAIR)
1 5 1

f am i
would like to ask ou some questions about yourhealth.
49. DL you or your husban
sband
Lime?n illness that troubles you
about your chi en; do any of those living at homean ill- oss hht troubles them all the time? (Chronic)
YES
2 NO
3 Not applicable (have no children
1. Do either you ox your husband have any handicaps or-disabilities that interfere with your working?
Husband
1 1 YES'
2 2 NO (IF BOTH NO TO QUESTION Np. 54)
9 9 No response
Dobs this/do these need continued treatment?
YES
2 NO (IF NO SKIP TO QuEsTION NO, 54)
Not applicable
152
...
14:3

53. IS it being treated?
1 YES
2 NO (IF NO, ASK) Why isn't it? (WRITE IN)
3 Not applicable
About how many weeks during the past year did sickness
injuries keep you from working? (USE CODE BELOW)
Husband
Wife
FOR INTERVIEWER'S USE ONLY
Code for loss of time
None
Less than 1 week
1 week, but less than2 week.-9
2--3. weeks
More than 3 weeks:014,04
Not Applicable .
= Inadequate information or no response
or
55. What about your children; do any of thOse living at _home
--Alave any handicaps or disabilities?
1 YES
2 NO (IF NO, SKIP TO QUESTION NO. 58)
3 Not apelieable .(no children)
'55_ Do these need continued treatment? 1;
YES
2 NO (IF NO, SKIP TO QUESTIO( NO. 511)
144
Not applicable
153

Ake they bein- treated?
1 YES
2 NO (IF NO, A_K ) Why Not? (WRITE IN)
3 Not applicable
58 Do you have a family do o
1 YES
2 NO
59. Who usually treats your family when they are sick?
No one
Members of the farily
Doctor
Neighbor
Druggist
'6 County Health Depar ment
----Other Specify)
60. When was the last time youcheckup or examination?
Husband Wife
1
4
1 . Never
4
. Less. than
-and your husband had a physical
year ago
I year, but less than 2 years ago
2-4 years ago
: 5Morthan 4 years ago
61. Have any members of your familY living at home had anytrouble with their teeth during the last 2 yea s?
.....
YES
154
145

62. When was the last - me that some member of your familyliving at home-went to a dentist?
I Never
2 Less than 1 year ago
3 1-2 years ago
4 --- 2-4 years ago.
5 More than 4 years ago
. Do you ha _ hospitaiiaatioo insurance?
YE'_
2 NO
rtbout how much money have you paid for medical-And dental
'tare (that is, doctors; dentists, drugs,thlospitalisation,-etc.) during the.last 12 montha2,-1;tiould you :say that you
have spent cr paid:
Nothing
Less than $50
1 $ 50 - $ 99'
4 $100 - $199
5 $200 - $299
$300 $499
7 $500 - $749
$750 cr more
9 Inad quate information
146

..=_65. Would you tell me about how much you presentlyhospitals, drugstores, etc.?
1 Nothing,
2 Less than $50
3 $ 50 $ 99
4 $100 $199
5 $200 $299
§ $300 - $499
7 $500 - $749
$750 or more
Inadequate information
we doctors
66.. Have- you had any contact with the County healtT Departmentor the County llealth Nurse: in the past 12 montflq
2
us (IF YES, ASK) For what purpose?
Vaccinatio._ _ _ shots
Pr,snatal care
NO
Chest X-ray
Blood test
Information .(Nut_
Other (Specify)
FOR OFFICE USE ONLY
Code for contact
Code 1, ifmarked.code 2, if blank
n classes, etc.)
1,56
147

=INTERVIEWERS TO COMPLETE JOINTLY AFTER LEAVINGTHE RESIDENCE OF THE FAMILY INTERVIEWED AND
BEFORE INTERVIEWING THE NEXT FAMILY
1. Name of family
2. Address
Ethnic ba- -ncl: MARK (X) EY PROPER RESPONSE)
White
2 Negro
3 Indian
4 Other
9 Inadequate information or no response
4. County
5. InterviewerS names
6. Date of Ist'oall
2nd call
3rd call
7. Werd the resp ndents 7 (CIRCLE MOST APPROPRIATE NUMBEB)
148
Unfriendly 1-
Evasive andcool
Did not skakup freely
4---1 Friendly
-I---2 3 4-- 5-
Open, honest,Warm
Spoke upfreely
Please add any comments you think might have any bear ruj on
the soundness-of the informtion contained in this inter-_--view schedule.

A nxrrszro-xacrxo AND COMMUNICATIONPNTTEP7:5 OF DISADVANTAGED PAR_MPMILIES
tN THE NOPTH CAPr,,LINA COASTAL PIAT,NS AREA
St:Ition.Pur,11 1),,vf)1opment Project,
catTii.flA :-;t.At,J! Univoritv, 1971-75
:-.1,:liEDULE NO. IV:
INTEM,.!-,ONAL C,.M:VNICATIO'N LINKAGE
)

Interviewee
'Address
SCHEDULE NOION LINKAGE -INTERPERSO
Introductory Statement- :
,My name is (int viewer). I am representing the
, Extension Division of, North Carolina State University in a
,Rural Development Research Study. We recently talked ,
to a number of famines ih Halifax, Bertie, and Northamp-
ton counties, North Carolina, to determine the types of'-farm and home decZsions (i.e., problems, purchases,
choices, etc.) thpY were having to make. Also we Were
interested in the soUrces of personal information they-
considered to be Most helpful'in making these deciSions._
You were cited lmy a previous participant in this
study as the person Who provided him/her with lnforma
tion whiCh he/she used in Making certain farm or home.
decisions. Talking With you 'for just a few minutes will bp
most helpful to me in obtaining some additional infor-
'mation needed to complete our study. Of course, what
we talk about,will be kept confidential and W. in no_
way be used in connection with your name.

Identification Number
Card Number
Type of Decision: (Code: 1 = FarmDecision2 Home Decision)
SECTION I - Communication and Linkage Data
-.First-of all, I would like to talk with you aboutthe-information you provided a previous participantin this study concerning
1 2
a r or original decision ted)
From whomdid or do yom receive informationin order to form your opinions concerningthistype!of.decision'on problem area?(WRITE MANSWERS)
A. what this person1-S-name?
What is the address of this person?
C. What is h's person's occupation?
D. By whom is thiS person employed?
Code:FOR OFFICE USE ONLY
l=Nonresearch-Based Source Cited2=Research-Based'Source Cited3=No Interpersonal Source Cited
160

IMPORTANT! IF NO INTERPERSONAL SOURCE IS CITED IN QUESTION--' NUMBER 1, ASK QUESTION NUMBER 2.
2. From where did,Or do you receiVe information in orderto form your opinions concerning such subject matter?(WRITE IN ANSWER)
FOR OFFfCE USE ONLYCode: 1=Nonresearch-Based Source Cited
2=Research-Based Source Cited3=Not Applicahfe
Did you or do you get help from any other source'or ip any_other way in, forming your opinions con-cerning such matters?
MARK (X) YES OR NO)
SoUrce
Newspapers
Farm magazines
Home magazines
Bulletins or pamphlets
Farmer's Almanac
Radio_
TV
Government agencies(Welfare, FHA, SCS,ASCS, etc.)
COLUMNYEs NO
2
1 , 2 ---
1 2
1 2
1 2
I 2
1 2
2
- cOntinued1-
153

SourceCO UMN
NO
2
YEs
Agricultu--al Extension Agent
Ho e Economics Extension Agent
Nutrition aid -
No-Ag teacher 1 2
Home Economics teacher 1 2
Home dealer or salesman(appliances, furniture,etc.)
2
Dealer or:salesmanlizer, seed, feed)
2
Lending intitutions (PCA,banks, etc..)
2
Friend or-neighbor 1 2
Family member orrelative
1 2
Minister of chu ch 2
Other (Iden _y 2
15-1

SECTION II - PERSONAL AND SOCIAL DATA
MARX (X) FOR RESPONSES TO ALL QUESTIONS THROUGHOUTTHE REMAINDER OF THIS INSTRUMENT EXCEPT WHERE NAMESARE REQUESTED.
4. _ How long have yOu lived in
1. Less than 2 years
2. 2-4 years-
3. 5-9 years
4. 9 years
5. 20-29 years
6. 30 years or more
7. Entire life
IF "ENTIRE LIFE" IS MARKED, SXIP TOIF NOT, ANSWER QUESTION NUMBER 5.
5. Where else have you lived? (WRITE IN ANSWER)
What states?
(If in North Carolina) What counties? :
oun y?
QUESTION NU D R 6.
ICE USE ONLYCode 1 = Other states Code 6 = Combination 1, 2 & 3
Code 2 = Adjoining counties- Code 7 = CoMhination 2 & 3
Code 3 = Other N.C. counties Code 8 = Not applicableCode 4 = Combination 1 a 2
Code 5 = Combination 1 a 3
How old were you on your last birthday? years
What was the last grade of elementary or high schoolthat you completed? grade
1
155

Where did you live monfirst 16 years of your
of the time during the-ife?
1. Farm or open count y
Town (under 2500)
3. City (2500 or over
Which one of the following categories best describesyour eMpIoyment status?
1. ,_ Employod-full time (40 hrs/week)
2. Employed ;part ti (less than 40 hrs/week)
3. Out of work and looking for a job
Keep-house
5. Unable to w_-k
Retired
Other,(Spe fy
10. Would you describe the kind'of work you do? Code, p.-160)
156
(IF RETIRED, OUT OF WORK OR UNABLE TO WORK,LIST LAST OCCUPATION AND EMPLOYER.)
A. Occupation
B. Name of employer
Which of the following best describee your family
income level?
1- Less than $1,000 6. $5,000 - $5,999
2. $1,000 - $1,999 7. $6,000 $6,999
1. $2,000 - $2,999 8. $7,000 - $9,999
4. $3,000 - $3,999 9. $10,000 or more
5. $4,000 - $4,999_---
16i

12. Wh ch of the following organizations do you attendOr belong to?- (ResponSe Scale: Membership's= 1;Attend = 2vHold office'or serve on committed =,3)
Are youa
-ember?
Do yOuattend afourth ofthe ti e?
Doyou holdoffice orserve oncommittees?
C DE
_Church
Sunday School
Farm organizatiohs-(Farm Bureau, NFO,Grange, etc.) :It
School oreanizations(PTA,' Boosters Club,-etc.)
1
_
.
COmmunity clubs(Homemakers Club,Volunteer Firemen,
,etc.) .
Other: (LIST BELOW)
165
1.57

13. People have different attitudes toward time, that-is.about_how'they.feel about,the present and the future.From your point of view,,would you say that you-AGREE,ARE UNCERTAIN, OR DISAGREE with the seVen statemontSwhich. I will read? (crlias THE .NUMBER 1, 2, OR 3 ONTHE LEFT THAT BEST DESCRIBES RESPONDENT'S REACTION.)
RESPONSE CODE
= Agree -2 = Uncertain Disagree
Response
1 Z' 3
2
1
Statements
It is best to giVe mostattention to what iShappening_now in the'present rather- thanbeing concerned' with the' future.
-Man's life should be guided more by,his hopesfor the future; b
With things as .they are today, a sensibleperson might to think only\about the present;without worrying about whatlis going to happentomorrow.
It is useless to plan since pe's planshardly ever work out.
Nowadays a p6rson who plans doesn't reallyknow how 'to enjoy the present,
The future is too uncertain for a personto plan.
1 '2 3 Thelbest way to l'iVe is to look'a'11ang 'timeahead, work hard,:and give up many thingsnow so:that the future will be better.
THINS THE RESPONDENT FOR HIS TIME AND ANSWERS.

INTERVIEWER TO COMPLETE AFTER LEAVING RESIDENCE:45FPERSON BEING INTERVIEWED AND BEFORE INTERVIEWING THENEXT COMMUNICATION SOURCE,
1. Race.of person interviewed: (MARK (X) BY PROPERRESPONSE)
1 Wh te
2
4
Negro 7.
Ind1an
Other
Were the respondents - (CIRCLE MOST APPROPRIATENUMBER)
Unfriendly Friendlyrl 2 3 4 5
Evasive and Open,,honeSt,_cool warm
Dia notspdak up,free_i
CoMmUnication Linkage Sae
'Closely linked
Distantly linked
. 3. Not linked'
4- Not ppgrTicable
Pleasd add any comMentS you thlnkmight'have any'lbeating on the soundness of-the information con-tained in this interview schedule,
Spoke up freely
FOR oFFICE USE ONLY
5. Interviewer s Na e
167
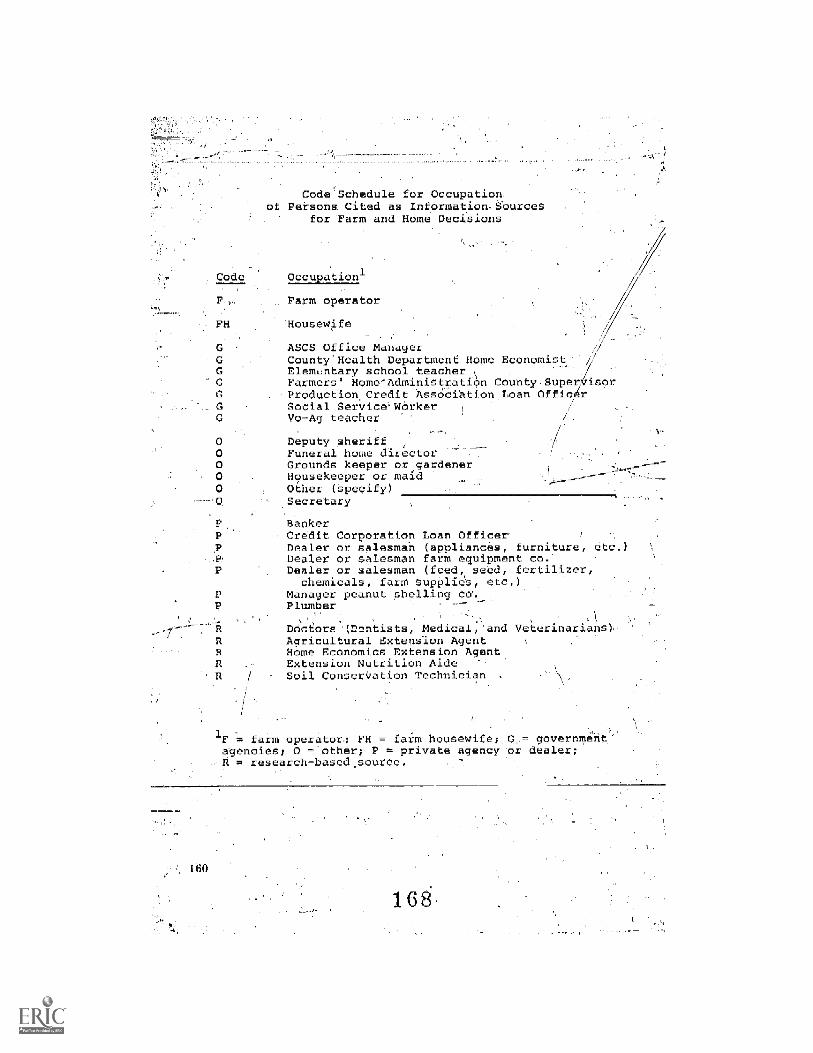
Code'Sehedule for Occupationof Persons Cited as Information-Soure
for Farm and Home Decisions
Code
,
FH
G
0
.._ 0
-Occupation 1
Farm operator
Housewife
ASCS Office ManagerCounty-Health Department Home Economist
--Elem,ntary school teacherFarmers Home-Administration County Superv sorProduction Credit Asseciation Loan OfficerSocial Service' WerkerVo-Ag teacher
Deputy sheriff.Funeral home directorGrounds keeper orgardener
0 Housekeeper or maid0 Other (speCify
Secretary
p
1 60
,BankerCredit Corporation Lean Officer'Dealer or salesman (appliances, furniture, etc.)Dealer Or Salesman farm equipment co.Dealer or salesman (feed, seed, fertilizer,
chemicals, farm supOlie-s, etc.)Manager peanut shelling co%Plumber
t;
DOCtors -;nantists, Medical,'and Veterinarians)--Agricultural Extension AgentHome Economics Extension AgentExtension Nutrition AideSoil ConserVation Technician .
F = farm, operator; FH = faimbousewife;,G, governmentagencies; 0 = other; P = private ageneYer, dealer;g = research-based,source.

ApPendix B: .ki.nds of Decisions Made
by DiSadvantaged FarmFamilies
Farm and home decisionsategOrieS and defini- 'ons ofeach.
Category
a Farm Categoriesa d Definition of Each
Definition
Capital Any decision related to or concerning actualinvestment principal investments in capital assets- such
as-machinery, equipment, buildings, felgods,drainage, etc.
I
Farm Those decisions related to or concerning gen-management eral farm management practices and activi-
ties. This-includes decisions made prior to,engagng in an enterprise or arrangement(e.g., whether to farm or not, whether topUrEhase equipment, etc.) and those.made,to-terminate or continue an enterprise oragreement (e.2., terminate a 'contract or'tenant arrangement, quit farming, -etc.).It does not deal with the management as-.pects bf an enterprise after the originaldecision has been made to engage in it(0.2., when to plan, peanuts, where to selltaacco, etc.). This category else includes .repairs to machinery, equipment, buildings,etc.
Financial DecisionVrelated to or Concerning,noncapi-tal purchases, budgeting matters, borrowingmoney, or other financial aspects of the,farming operation not included under thecaPital investment category.
Leasing Decision.related to land rental and allot-arrangements ment agreements (e.g.-, to rent more tobacco
acreage,-rent farm out, etc'.).
'Production and All decisions related to or concerning themarketing production and marketing of a p'atIcular
crop, or livestock enterprise; or activity.It does not include those initial farm man-agemont.deCisions Of whether or-not. to en-'gage in an enterprise or activity.' !
169

Other_or Refers to all decisions that cannot be cIsc
y-Miscellaneous sified under any of thapreceding fiyefarmhdecision categories or. respondent-
, ,
failedto provide 'enough information for aspecific subject area to be,identified.
Inadequate . This categaras provided to take care 61.
information er all respondents who did not Cite a decision
6o response or gaVe a ,"efon't know"- xesponse':-
Clothing
41e_lth
Herne
furnishings
nary o e Ca go _esand Definition of Each
Ddfinition.
All decisions Felated to or concerned with
clothing the hUman body. It encompasses de-cisions made relative to the selection, construction, and care Of family clothing. It'
does not include decislons concerned with
budgeting or'managing'the clothing dollar.
All decisiOns_concerned with the care, well
being, and health of.the family--bothphysically and mentally.
Those decisions related to'or concerned with
establishing a more favorable.environment.for family flying within the.home.. Includes
,decisions, e.1., about interior design,'planning color schemes, draperies, slip Coy-.
ers, rugs, furniture, and equipment for thehome(stove, refriderator, washing machine,btc.).: it dbes hot ,inbrude\decisions'rel\a-tive to the management of the family's house--turnishing dollar, i.e.., whother topurchaseequipment or furnisiTings, deciding,on kindto buy, and how,to gee items, etc. Theseare considered part of the deciSi0e-ma.kingprocess, hence, must bp Coded under the
-home management category.

Home Those decisions relating te the use ofmanagement available family resources te accomplish
family goals (values) and the way thesegoals can be reached. It pertains to the.decision-making Process or manasement prinCiples that Apply to the home as a whole.For exaMple, it includes such items aswhether to replace, repair, or purchaseequipment; obtaining credit; how to 'budgetthe family clothing, house furnishings,housing, food, education; and health dollar;and whether to make or prepare items t homeor=buy them already prepared;
Housing All decisions concerned with designs, plans,materials, finishes, maintenance,-etc.;-ofthe .family dwelling. It includes both ar-rangement, water and sewage'systems, heat-ing, wiring, painting, repairs, remodeling,otc.
Nutrition Those decisions that deal with the food thebody needs and how the body uses it. Itencompasseadecisions made-relative te theproduction,-preparatien, and conservationof food.
All decisions,that cannot be classified un-der any of the preceding six home de=cisien;:categories, er-respendent failed toprovide enough information for a specificsubject area to be identified.
Other or,miscellanemis
-Inadequ teinformation orno rponse'
This categoryis provided totake care of .
all respendentawhoidid.net,cits a decision,or gave dT!don't know". respense.
II-. Summary Of important farm and home decisions bycategories .
-Capital Investment
Bought a tractorBuilding a new bulk barn for tobacco cu ing
Farm
171 -163

Pick.-up truck\Buy second tra torBuy new ractor (1)New_storage facilityRepayment to 'FHA for-equipment
-Trading for :tractorEquipment payment
Farm Management ,
-Terminatecontract--trouble wi h second-hand tractContinue tenant arrangementMay decide'to get still. another!tenantWhether to have a vegetable gardenWhether to repair,or'buy new-tractoNot to put out.-a tobacco plant-bedDecide-against buying a tractorNot to purchase equipment
---To continue farming or Eake factory jobWhetherPrJPot to raise tobaccoWhetherot=toraise pigsWhether to keep farming or not.'(4)__What crops to plant for the year,Repair traCtor (1)Tb give up farm workWhat crops to plant=Whether to buir sprayer-or-not (1)
.To stop farming he.causa of allergyWhether to rent out land or farm--Decision as to putting in ditchesEecure'some form p'f transportation (no car or truck)How much Money he ould get from land rent
-Not,to plant cotto, this yearTo sell-equipment 'Cr mortgage farm.Whether to change equipMentWhether er not-to plantvtobacCe) due to laberWhether or hoe toA56t ieodrainage, , .1
'Whether to plant cotton... -,-
Repair truCk.Whether.to buy another tractiarNot to set eside land ip,government program
-
Whether to rent 'far , or let son farm .
-Whether to buy Or use own peanutfeectWhether to farM on his own or remain a tanantWhether to-tend tobacco in order to keepallo ent
insecticides
NOmbers in parentheses indicateitem wasrepeated.
er of times the

Financial'
Paying bills and loans'Purchase livestoc:;-Borrowing funds ito farmBUdgeting in order to have' money to pay for farm suppliesHow to pay farm expenses and meet family requirementsMake a decision about making farm paymentHow to pay for land preparation with hired-tractorWhere to borrow operating,capitalHow to cut farming expenses and chemicals to use on peanutsOlt living cost in family .
Borrow money to farm with,Not enough crops or income:= from present farm to meet ex-
' : penses. Land needs draining; doesn't have moneyBarrow to rebuild tobacco barnNot enough money (1)Decide_about repairing equipment:operating capital.How to finahce fertilizerFinance decisions (1)
_Finances hard to getWhether to rent more land 2)
Decide to rent tobacco outTo rent mare tObacco'(1)Rented more tobacco:Whether to rent .farm'(l)Whether to rent additiona obacco
Produa 'as and Marketing
When to begin pulling tobaccoNo way to take produce .to marketLabor for'harvestingLack Of tobacco plants- !
Decide Which -tohacco to put up first landlord 's or mine---97-a1746tY of tobacco to plant (1
1
ergz.""f0cre-rr*Vabaeco .
Decision on'when-peanuts were.ready to dig--Whether to raise mire hogs (had a-shortage)When-to set _out tpbaccoWhen tO house -tabacceVariety of-tobacco-to. plant-What fields to. plant,tobacco in-Obtaining'tobaccouse of insecticides .for !boll weevil 1n-cottonHow to cope with wet weather _in planting CropS
1
173
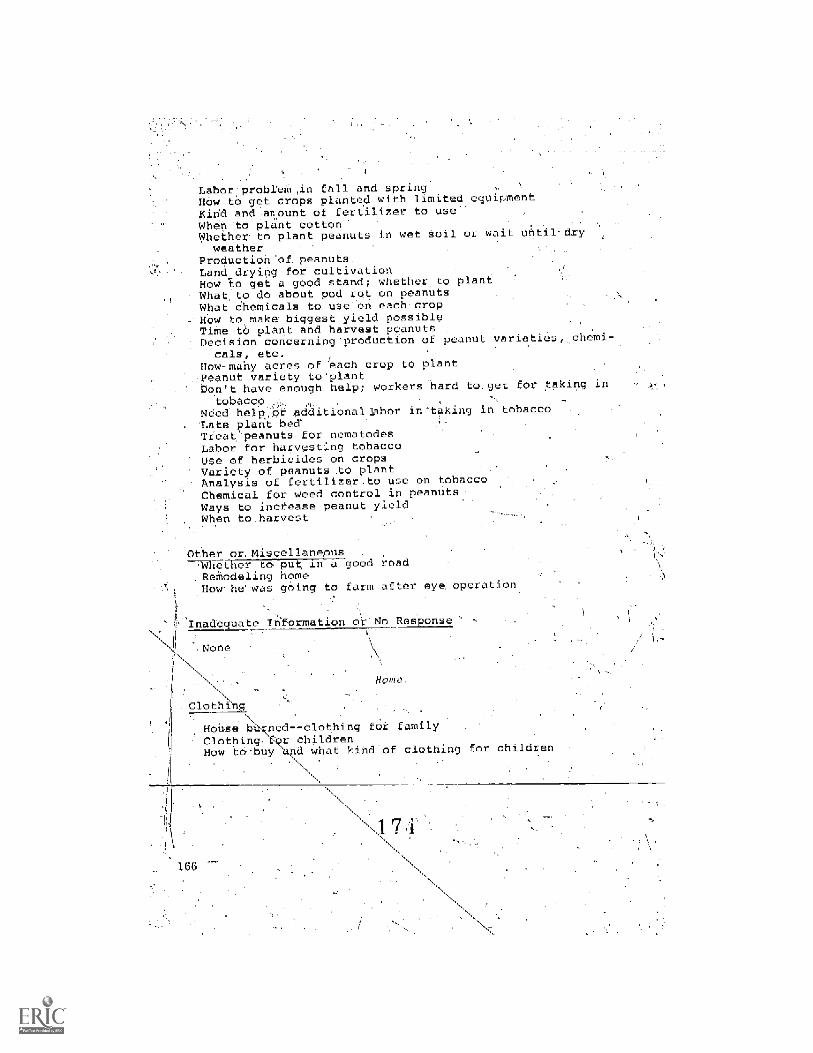
Labor'probrem in fall and springHow to get crops planted with limited equ Jment
Kind and.atount of fertilizer to useWhen'to plant cottonWhether to plant peanuts in wet soil or wait until dry
weatherProduction of. peanutsLand drying for cultiv tionHow lo get a gOod stand whether to plantWhat to do about pod r t on peanutsWpat chemicals to use on each cropHow to make biggest yield possibleTime tb plant and harvest peanutsDecision concerning-production of peanut varie
cals, etc.How-many acres of each crop to plant,Peanut variety to-plantDon't have enough help; workers hard to.get for taking in
:tobaccoNeed help.Or additionallaber in-taking in tobacco
- Late plan't bedTreat peanuts for nematodesIabor for harvpit_Lng tobaccoUse of herbicides on cropsVariety of peanuts to plantAnalysis of fertilizer.to use on tobaccoChemical for weed control in peanutsWays to increase peanut yieldwhen to harvest
chem
Other or. cellaneOusw e e to- put in a good road.ReModeling homeHow he':was going to farm after eye. operation
nadequate In
:None
x
Clothing
House-hPrnedclothing for familyClothing:\Fcr childrenHow to-buy what incFoE clothing for children
No Resoonse -
Home:

Healthi
Taking care of blind mother, Getting medical help for child
Whether to have teeth fixedhether to get teeth pulled,Which doctor tO see for illnessPay pig medical biAlsNot going to doctor becau e no money availablO thinks she
may have tumorNot to-put xetarded child in home
Hame_Furnishing_s
Bought dishesReplaced stove (4)-Bought bedsTo have washing machine repairedBuy refrigerator (2)-
-tPurchase a new washing madfiTne (1)Getting stove repairedGetAnew freezer (1)
Get new mattressBuy a sewing machineColors -of paintBuy washidg_machine and freeze
-Buying rug for sitting roomBuy dining rocimLsetReplacing twa rugsHow to decorate and remodel living roomBuyingrug-,for=kitdrhen I
Purchase a gas-raRge and.refrigeraRepair.washing machineBuy a TV
Home Management
--Obtaining. credit .
Hiring soMeone'tokeep houseGetting:moheY to buy clothes for ChildrenDecidin4 on what kind-of foods _) buy.What,type of new,tefrigerator to buyDeciding pp. pain'tingWhethert-e'pay utility bills -on timeHow to. to replace old one'How ta cift food budget-
': Peking family biils on tune'How to Oay,billsPlanning far son's ochicationNet tp .buy ice box
1 167
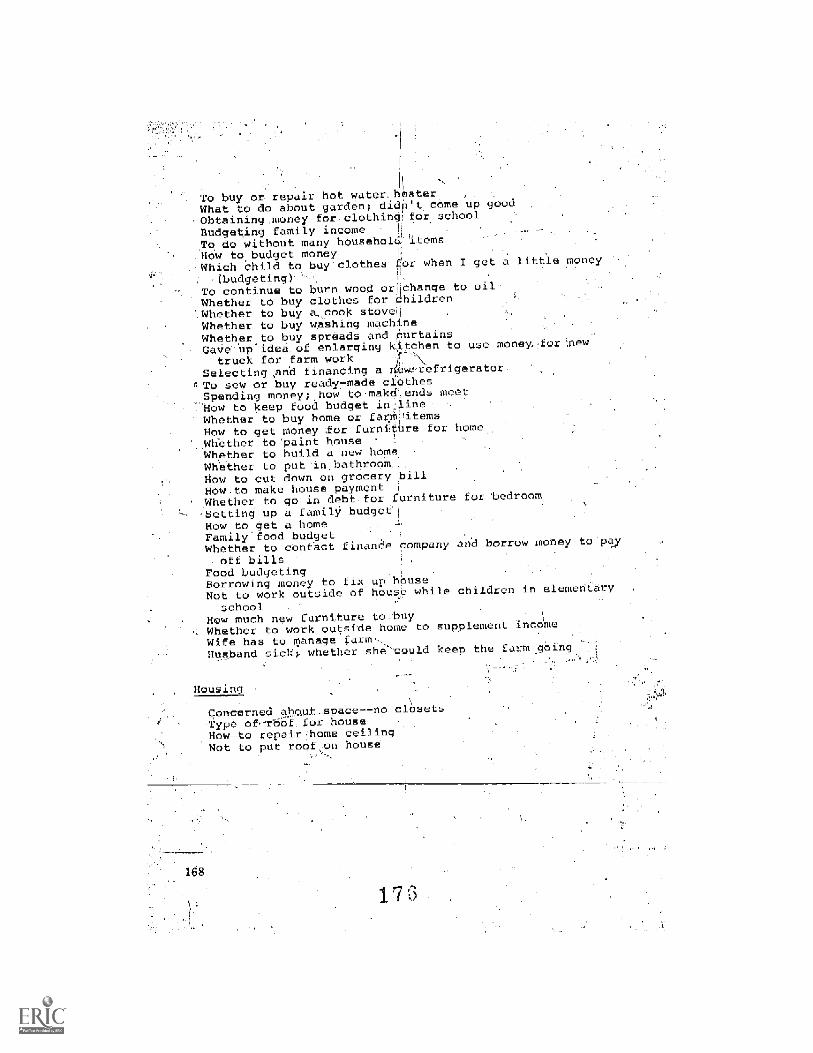
To buy or -repair hot water. heater .
What to do about garden; didn't come up goodQbtaining,money for,clothingrfor. schoolBudgeting family income 1
To do without many householc.-- ItemsHew to budget moneyWhich Child to buy'clothes, 6,1- when I get a li tle money
(budgeting)-To continue to burn wood orfichange to oil'
Whether to buy clothes for children.Whether to buy a,cook stoveiWhether to buy Weshing machineWhether.to buy-spreads and CurtainsGaVeup-ideeof enlarging Kitchen to use money,forTiew
truck for farm workSelecting And financing a 11.CWrefrigerator.
I; To seW or buy readymade ciethesSpending money:,how tomakdends meetHow to keep fooa budget in:lineWhether to buy home or farriwitems
How to get money for furnitUre for home..Wh'ether to'paint houseWhether to build a new home;Whether to put -in.eathroomHHow-to cut down on grocery billHow.to make house paymentWhether to go in debtfor furniture for bedroom
ting up a familY budget'iHow to get a homeFamily'food budgetWhether to centact finande company and borrow money to-pay
off billsFood budgetingBorrowing money to fix=up hOuseNot to work outside of house while children in elementary
school ,
How much new Furniture to.buyWhether to work outside home to supplement incWife has to manage farm!-,..,.Hu.s.band sickp whether she''.;.: ld keep the farm _going
Housing
Concerned atL-o_ut_space--noType ofr6of for houseHowto repair:home ceilinNot to put roof,on house
closets
168
1 7

Get water at home (well),Looking into the decision of build ng a home-,Building a new room to house-Running water--Paint inside of, houseRenovati.On of kitchenMake:.homerepairsHael, i leak underrhouseFix asmall patio.To put-in running waterAdd window.aircOnditioner unitPut in a bathroom (2)Remodel kitchenRemodel house (1)Spray,ing house-for termitesRemodel bedroom (pandling)Where to put ,bathrpomNeeded housing repairsBuying hot-water heateMade deci.sion to save for running water-and hathrOomRepairing homeTo haNie floors sandedTohave all rooms paintedBuilding.shelter foreguip ent in yardPlumbing needed to fi-6 doneWater pump needed repair
Nutrition.
'Begin-Using food stamps ,
_Decided to have--a-gardenObtainins-garden foOd for freez ng
;FOOd.,--6Mount to .consume--=-
LF'circra cost going upWbat beef to cookWhen to-plant garden
other or Misce laneous
To purchase automobile
Inade uate Information or-'nljt_AEalme
None
177
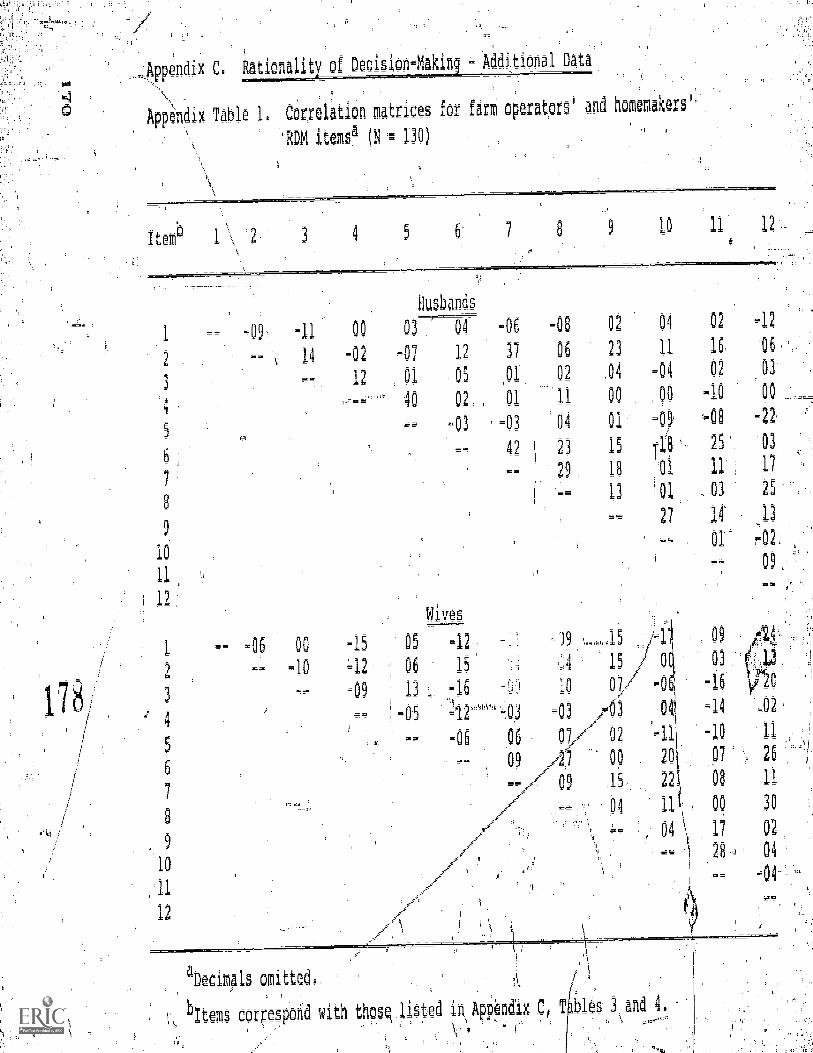
Rationaliti.of Decision-Makin Additlona1 Data
App6n-dix Tab1 1 COrr6l'ation matrices for farM 4erators and homem'akers-
ROM items, (N f 130)
hsbands
2)
-09 -11 00 03 04 -06 -08 02
14 -02 -07 12 37 06 23
312 01 OS ,01 02 ,04
I40 02 01 11 00
-03 =03 '04 01
42 23 15
1 29 18
13
9
10
11
12
6
7
. 9
10
11
12
00 -15
-10 12
-09
Wives
05 -12
06 15
13 . :16
05 12-°""'' 03
-06 06
09
04 02 12
11 16, '06:
-04 02 03'
,00 -10 po
-0", 48 -22,
11F 25 03
11 11' 17
i 01 , 03 25
27 14 13
01- 42.:
09,:
15 09
)11
10 vs -0 -16 OC-03 /03 041 -14 _02
07,/ 02 -11 i -10 11
00 201. 07 26
09 15 22 08 11
04 ,00 30
04 1j 02
-- 28 04
aDecima1s omitted,.
bitems correspond with thosq ljSted in,Appendit.0 T bles 3and 4
't 4

Append ix Ta F ,tor analysis factors with -__lelonvaluos:lances and 1' 'Contages---
tFac torhinenvaluo ' xariance Porcontages
(Doer- .H01110- Oper- Homo- Oper- HOMO°'ator maker a Ler maker a eor maker
1
-2.131.521.25.16
,1.12
2.02-1.571.431.241.06
1.81, _5
1.41.31.2
1.71.71,41.31.3
18 : 17
11 1311 1210 109 9

z
1
i!4
Appendix Table 3. Farm operators' RDM scale item loadings for varimax rotated factors
Item
1: Did you know what you wanted to do befo
. thi5 decision?
2, Did: you put off this decision?
L Were you forced to make this decision before you
were ready?
-e you made ,1q0
:639
.075
4, Did you talk to anyone outside your family about -.034
the problem before you actually madeyour decision?
5. Did-looking at magazines or newspapers (includ n -.052
ads)i college information bulletins TV and radio
give.you ideas about what to do? ,
G.' -W4v_this the only way you figured out to 01\10 .644
; your problem?'N
7, Did you take. longp_r :than a week to deoide what .694
made',up your mind to handle the problem this way?
:220
1808. Did you:feel you were.taking.a, chance, when you
9, bid 'you talk this over-a.lotH:iithsynr wife .346,
,
,, \
or .children? s//
.,,--,
'Do:you...00 full credit for making this dedisio '-'-' .08610.,
;
Factora
:Q06 .3l3 .016 *602
-.068 :064 ;177 -,475
J08 ,107 .104 *706
,784 7.109 *038 .10.5
,811 .146 ,-:086 .011
.097 -.166 -,272 .222, ,
.079 -.369 .049 ,028
,221 7,735---- .008 A78
..."-s
,7f35, 1073 -.599 1148
-.056 '.001 ,,.886 1009
0
4.

Appeil ix Table 3 (conti,nued)
Item Factora
2 .__L 4 5
11. After doin what you decided, have you!talked.to ,528. -,234 415 -.106 .041
or heard of other persons who have made about th'e
same kind of decisions?
12. Would you .do thing differently if you could to k21 -.281 -,726 -.087 449
all: over again?
aUnderlined loadings determined items that define the factors,
181

18 2
rri Wlmomakere RDM scale itom 1odinq s for varimax rotated factors
Itcm
1, Did you know what you wantod todo before you madei -,1081
thi$ decision?
2. D d you puE t, this decision?
3, Were you forced to make 6his de: sin before:you
wore toady?
4. Did you talk to anyone outside your family about
tho problem .before you actually made your deci$ion';'
S. ' Did loding' at .magazinos or nows0apors (including
ads)1 colloge informationbulletinsi TV and radio
give you ideas about what to do?
6. .
Was this th q. only way you figured out to solvo
mur problem?
7, Did you take longer than a wpok to docide what
to-do?
8. Did you fool you were tak* a chance when you
made, up your mind .to handle the brobLa this way?
9, Did you talk this over a lot with your
husband or children?.
10. Do you take, full crodit for making .this deci$1.on?
Factor('
2 3 4
351 -.043 63l 193
\
,886 1068
-.206 .225
. 69 -,186
:182 .124
;,106 ..616
ji39 .065
-.021 I69
.26,6 -.092
.071 :225
.071 .096
:181 -,031 :716
-,020 --774 .056'
373 114 .372
93
-.112 -.110 034
071 :,03.5. ,136
-,412 .166 ..563
.697 -,272 -,067

Appendix Tablo 4 (continud)
Iterci, a1'actor-
1 2 3 4
11: AfWr doio-wht you decHod, have you talked to U38 -,031 -,740 .261 ,026
or hoard 'of othul' r;orsou who have mdo ahout tho
Am kind:of b.63ion?
12 Would you do thinc_15: c.)u could do :118 :709 ;096 ,167 .207
it all ovc1:
Undorlined loauncg uolormind ituis tht dcfined the fartors.
iss

' Appendix inkane_P_atterns
Instructions given and'form used in determining research-
based sources by selected panel members
.The Agricultural Experiment Station funded a research
project designed to d,ter-ne the degree of.-llnka J- between
resea ch-based sources of informat and those interpersonal
.sources.being uSed as a b-sis for making farM and home decisiebs
by disadVantaged farm families.
A researchbased source has beep defined for purposel
of this study as a 'person (specialist or researcher special-
iz_ng in a specific sUbject mattex..- representing a
profe6Sion'oe institution recognie'a by the scientific
community'as possessing impartial research infor ation which
has been validated empirically by application of the scien-.
tific\--method as opposed'to value, moral, or ethical judgmentst-
In addition,,ang_research information transmitted.by these
indiviiduals in written form er publication will also be
_ - - -
considered a research baSed-source of informati n
Based on the specifications of this definition, please
review the following list of role descriptions and determine
ch ones you consider to be research-based sources of.
:irrformation. Place an x in the blank by cacti role descrip-
tions which you consider to rit the s prcifictions but do
not find in the list.
For purpose's oE this study, linkage is de inöd as th
actual chain of interpersonal relations that facilitates.thetransfer or relay of information from a source to a destin-
ation. Such a communication chain, or metwork, consists of a
number of linked dyads in which the receiver-in one is the
source in the next.

List of.Rolo Descriptions from Which Research-Based SourcesAro te Be Soleeteh
, 1. Bublect matter specialists for the CooperativeExtension Service or Agriculture Experiment Station. \
2. Subject matter specialists representing a universityor college which engages in,major research activitiesor projects.
3. Subject matter specialists for the-U.S;D.A
4. Medical doctors, dentists,' or other specialistswith an equivalent degree in the medical'fipld.
Veterinarians or Other,specialists with an equivalentdegree in.,the veterinary medicine_field.
6. Engineers for the Soil Conservation Service.
7. Representatives or specialists for a Carm equipmentcompany.
8. Representatives or specialists for a seed, fertiliser,oCchemical.company..
9. Loan officers for a bank ol loan company.
10. Farmers Home Administration loan officer.
11. Production Credit Association loan officer.
Please list any other role descriptions hot found abovewhich you consider to be a research-based source of information.
Your name
185
-Your position.
177

s; of Sources Selected s Resea-,h-Based- -
I. _octoks (Dontist,; Medical., and ieterinar--
2. Exte.nsion )\gricuture, Agent3. ExtenSion Home Eobnomics Agent4. Extension Nutritipn Aid5. Soil Conservation-TbChnician
)