t e t a d c : t role i p shifting · shifting out of many developing countries and into tax havens...
TRANSCRIPT
TAX EVASION AND TAX AVOIDANCE INDEVELOPING COUNTRIES: THE ROLE
OF INTERNATIONAL PROFIT SHIFTING
Clemens FuestNadine Riedel
OXFORD UNIVERSITY CENTRE FOR
BUSINESS TAXATIONSAID BUSINESS SCHOOL, PARK END STREET
OXFORD OX1 1HP
WP 10/12
Tax Evasion and Tax Avoidance in Developing Countries: The Role of International Profit Shifting*
Clemens Fuest and Nadine Riedel
Oxford University Centre for Business Taxation
This version: June 2010
*An earlier version of this paper was presented at the World Bank Conference on “The Dynamics of Illicit Flows from Developing Countries”, September 14-15 2009, World Bank, Washington, DC.
Oxford University Centre for Business Taxation Said Business School Park End Street Oxford OX1 1 HP Tel. +44 (0)1865 614846 [email protected] [email protected]
I
Tax Evasion and Tax Avoidance in Developing Countries: The Role of
International Profit Shifting
Clemens Fuest and Nadine Riedel
Oxford University Centre for Business Taxation
Abstract
In the debate on the impact of illicit capital flows on developing countries, the view is
widespread that profit shifting to low tax jurisdictions undermines the ability of
developing countries to raise tax revenue. While the shifting of income out of
developed countries is a widely debated issue, empirical evidence on the magnitude of
the problem and on the factors driving income shifting is scarce. This paper reviews
the literature on tax avoidance and evasion through border crossing income shifting
out of developing countries. Moreover, we discuss methods and available datasets
which can be used to gain new insights into the problem of corporate income shifting.
We argue that results of many existing studies on tax avoidance and evasion in
developing countries are difficult to interpret, mainly because the measurement
concepts used have a number of drawbacks. We discuss some alternative methods and
datasets and present some empirical evidence which supports the view that profit
shifting out of many developing countries and into tax havens takes place.

2
1. Introduction
In the debate on the impact of illicit capital flows on developing countries, the view is widespread that
illicit flows undermine the ability of developing countries to raise tax revenue. The reason is that illicit
capital flows may channel resources to the informal economy or to other jurisdictions, in particular to
tax havens, so that they escape taxation. A large part of this activity takes place in the shadow
economy and largely escapes public attention. But parts of the ‘official economy’, in particular
multinational firms, are accused to engage in tax avoidance and tax evasion as well. They are
criticised for shifting income out of developing countries and into tax havens in order to avoid paying
corporate income taxes. Since developing countries frequently lack appropriate legislative and
administrative resources, they are generally seen to be more vulnerable to income shifting than
developed countries.
While the shifting of income out of developed countries is a widely debated issue, empirical evidence
on the magnitude of the problem and on the factors driving income shifting is scarce. This paper
contributes to the debate as follows. Firstly, we review the literature on tax avoidance and evasion
through border crossing income shifting out of developing countries. Secondly, we discuss methods
and available datasets which can be used to gain new insights into the problem of corporate income
shifting.
There is a growing number of empirical studies on corporate profit shifting in OECD countries. Many
of these studies use appropriate data and sophisticated econometric methods, and the results offer
valuable insights into corporate profit shifting. Unfortunately, almost none of these studies include
developing countries. The main reason is that, for developing countries, much less data is available.
There is a number of studies, mostly published by non governmental organisations (NGOs), which try
to estimate income shifting and tax revenue losses suffered by developing countries.1
These studies
have the merit of attracting the attention of a wider public to the issue of income shifting out of
developing countries. But the results of these studies are partly difficult to interpret, mainly because
the measurement concepts used have a number of drawbacks (Fuest and Riedel (2009)).
1 These studies are reviewed in Fuest and Riedel (2009).

3
The setup of the rest of this paper is as follows. In section two, we briefly introduce the concept of
profit shifting by multinational firms and discuss empirical approaches which have been used to detect
profit shifting. In section 3, we review existing studies on profit shifting out of developing countries.
This section builds on and extends our earlier work in Fuest and Riedel (2009). Section 4 discusses the
particular role of tax havens. In section 5, we suggest and discuss the pros and cons of different
econometric identification strategies and datasets which can be used to gain new insights into the
phenomenon of profit shifting out of developing countries. We also provide some evidence from one
of the datasets, which supports the view that a significant amount of profit shifting out of developing
countries and into tax havens does take place. Section 6 concludes.
2. Multinational Firms and the Concept of Profit Shifting2
2.1 Intra Firm Profit Shifting
For purposes of taxation, the profits of a multinational firm have to be allocated to the individual
jurisdictions where the firm files for income taxation. This is usually done through the method of
separate accounting. Each entity (subsidiary or permanent establishment) of the multinational firm
individually calculates the income it has generated. Transactions between different entities of a
multinational firm (controlled transactions) should, in principle, be treated as transactions with third
parties (uncontrolled transactions). However, multinational firms may use controlled transactions to
shift income across countries. For instance, they may shift income from high tax jurisdictions to low
tax jurisdictions using transfer pricing or intra firm debt.
The concept of income shifting raises the question of whether a ‘true’ or ‘objective’ distribution of
profits earned by individual entities of a multinational firm can be identified. Achieving this is
complicated for a number of reasons. In particular, entities of multinational firms typically jointly use
resources specific to the firm like e.g. a common brand name or firm specific know how. Pricing these
resource flows appropriately is difficult because goods traded between unrelated parties are usually
different. It is an important characteristic of many multinational firms that the individual entities
jointly use resources which could not be used in the same way if they were separate firms. If they
could, there would be no reason to create the multinational firm in the first place. For this reason, it is
difficult to establish what a profit distribution in the absence of profit shifting would look like.
2 Sections 2,3 and 4 build upon and extend the analysis in Fuest and Riedel (2009).

4
Most empirical studies on corporate income shifting, however, do not explicitly refer to a hypothetical
distribution of profits which would occur in the absence of income shifting. Instead, they focus on
particular factors which are likely to drive income shifting and try to explore whether these factors
affect the distribution of reported income across countries and, if so, how large these effects are. In
this paper, we focus on tax induced income shifting. Empirical work in this area essentially uses two
types of approaches to investigate whether and to what extent firms shift income to exploit tax
differences across countries. The first approach directly looks at the use of instruments for profit
shifting. For instance, some studies focus on income shifting through debt and ask whether, other
things equal, multinational firms use more debt in high tax countries than in low tax countries (see e.g.
Büttner and Wamser (2007) or Huizinga, Laeven and Nicodeme (2008)). Other instruments which
have been studied in the context of international profit shifting are transfer pricing (see e.g. Clausing
(2003)) and the location of intangible assets (Dischinger and Riedel (2008)).
The second approach focuses on the result of tax induced profit shifting, the overall profitability of
individual entities of multinational firms in different countries. In the presence of tax induced income
shifting, one would expect to observe a negative correlation between reported profitability and tax
levels (see e.g. Grubert and Mutti (1991), Huizinga and Laeven (2008) and Weichenrieder (2009)).
One drawback of this approach is that a negative correlation between pre tax profitability and tax
levels may even emerge in the absence of income shifting. The reason is that the location of economic
activity itself is influenced by taxes. Firms have incentives to locate highly profitable projects in low
tax jurisdictions.
Both approaches deliver estimates of the (marginal) impact of tax differences on income shifting
behaviour. Under certain assumptions, these estimates can be used to calculate a hypothetical profit
distribution across countries which would occur in the absence of tax differences. For instance,
Huizinga and Laeven (2008) analyze a sample of European multinational firms and find that, in 1999,
the corporate tax base of Germany, which was the country with the highest corporate tax rate in
Europe, would have increased by 14% if there had been no tax incentives to shift income to other
countries.3
3 Note that the data used in this study (the Amadeus database) is not representative for all European firms, although it does include most of the large firms. Therefore, the qualitative insight provided by this study, the result that a significant amount of income is shifted to low tax jurisdictions in Europe is probably more robust than the number of 14% for Germany.

5
2.2. Profit shifting and transactions between unrelated parties
Profit shifting as discussed in the previous section takes place through transactions between entities of
multinational firms in different countries. If two corporations located in two different countries belong
to the same multinational firm or are controlled by the same interest, it is uncontroversial that
transactions between these two firms may be used to shift profits across borders. However, some
authors have argued that transactions between unrelated firms may also be used to shift profits across
borders. This is emphasized in particular by Raymond Baker in his book Capitalism's Achilles Heel:
Dirty Money and How to Renew the Free-Market system. There, he quantifies the yearly illicit
financial flows out of developing countries through the business sector with US-$ 500 to 800 billion.
Baker’s book provides a break-down of this number into different activities. The analysis claims that
slightly above 60% of these financial flows is related to legal commercial activities whereas the rest is
assigned to criminal activity. Baker argues that money earned on legal commercial activities leaves
developing countries through three potential channels: the mispricing of goods traded between
independent parties, the distortion of transfer prices charged on goods traded within a multinational
firm, and fake transactions.
With respect to mispricing between unrelated parties, Baker bases his estimate on 550 interviews he
conducted in the early 1990s with officials from trading companies in 11 countries: the United States,
the United Kingdom, France, Netherlands, Germany, Italy, Brazil, India, South Korea, Taiwan and
Hong Kong. Since Baker assured anonymity, he does not make the data publicly available but argues
that the data contains appropriate information on trading practices.
He reports that the interviewees confirmed collusion between importers and exporters to draw money
out of developing countries to be common practice. Specifically, he states that “mispricing in order to
generate kickbacks into foreign bank accounts was treated as a well-understood and normal part of
transactions” (p.169) by the interviewed managers. As a result of this study, Baker estimates that 50%
of foreign trade transactions with Latin American countries are mispriced by on average around 10%
adding to a worldwide average mispricing of goods traded between third parties of 5%. Similar,

6
slightly larger figures are reported for countries in Africa and Asia suggesting mispricing of 5% to
7%.
The possibility of mispricing in uncontrolled transactions plays a role for the interpretation of studies
on income shifting through mispricing and will be discussed further below.
3. Studies on international profit shifting in developing countries
Most existing empirical studies on tax induced profit shifting focus on OECD countries. Studies on
profit shifting in developing countries are scarce. Most studies on tax induced profit shifting (as well
as income shifting motivated by other reasons) in developing countries have been published by NGOs.
Below, we will discuss and criticise some of these studies. It should be emphasized, though, that these
studies have the merit of attracting the attention of a wider public to this important issue.
3.1. The Trade Mispricing Approach
Studies based on the so-called trade mispricing approach start with the idea that firms may manipulate
prices of internationally traded goods in order to shift income across countries. This idea is known
from empirical work on income shifting in developed countries (see Clausing (2003) and the literature
cited there). The key question is how the manipulation of prices is identified. There are different
identification strategies with very different implications.
As mentioned in the preceding section, Baker (2005) uses interviews to estimate the extent of
mispricing in trade transactions with developing countries. He quantifies the income shifted out of
developing countries through mispricing activities by multiplying the low end of his interview based
mispricing estimate (i.e. mispricing of 5% of import and export value respectively) with the sum of
imports and exports of developing countries, which is equal to approximately US-$ 4 trillion. Given
this, he arrives at what he refers to as a lower-bound estimate of capital outflows due to trade of US-$
200 billion.4
4 This number includes third-party and related-party trade.
7
The main disadvantage of Baker's approach to estimate capital outflows is that it is based on a
relatively small number of interviews, and these interviews are confidential. Therefore the results
cannot be replicated.
Another approach to identifying mispricing is used by Pak (2007)5
, who identifies abnormally priced
import and export transactions through the so-called "price filter matrix" approach. The basic idea can
be summarized as follows: trade statistics offer information on the prices of transactions for individual
product groups. For instance, US trade statistics offer information about the prices of fridges which
have been imported into the country in a given year. The price filter approach classifies all
transactions with prices which exceed the average price for imported fridges by a certain amount (for
instance, by being in the upper quartile of the price range) as overpriced while all transactions with
prices sufficiently far below the average price in that product group as underpriced. On this basis,
income shifted into and out of the country is calculated. Pak (2007) does so as follows: “The dollar
amounts are computed by aggregating the amount deviated from lower quartile price for every
abnormally low priced U.S. import and the amount deviated from upper quartile price for every
abnormally high priced U.S. export.”Ibid, p.120)
The analysis in Pak (2007) leads to the result that US imports from all other countries around the
world were underpriced by approximately US-$ 202 billion in 2005, or 12.1% of total imports. The
value of US exports in the same year was overpriced by $ 50 billion or 5.5% of overall exports.
Zdanowicz, Pak and Sullivan (1999) investigate the international merchandise statistics between the
US and Brazil and find that the amount of income shifted due to abnormal pricing is between 11.13%
for under-invoiced exports from Brazil and 15.23 % for overinvoiced imports to Brazil. Pak et al.
(2003) use the same framework to investigate capital outflows from Greece due to mispricing of
internationally traded goods and services. The percentage of income shifted from Greece to the world
varies between 2.04% for underinvoiced exports from Greece and 5.88% for overinvoiced imports to
Greece.
Another study using this approach has been published recently by Christian Aid (2009). They argue
that profit shifting out of developing countries through trade mispricing in the period 2005-2007 was
above one trillion US-$ (Christian Aid (2009), p.5), giving rise to a yearly tax revenue loss of US-$
5 See also Zdanowicz et al. (1999), Pak et al. (2003) and Boyrie et al. (2005).

8
121.8 billion per year.6
Using the same approach, Christian Aid (2008) calculate a tax revenue loss
suffered by developing countries due to trade mispricing of US-$ 160 billion in 2008.
The mispricing approach as employed in these studies has the advantage of being simple and
transparent. It uses publicly available data, and it is straightforward to replicate the results of existing
studies. Unfortunately, the results of this type of analysis are difficult to interpret and effectively
reveal little reliable information about income shifting in the context of tax avoidance and evasion, for
the following reasons.
Firstly, it is likely that, to some extent, price differences within product groups simply reflect quality
differences.7 If there are price differences within product groups, it would be natural to assume that
developing countries tend to export low-end/low-price products whereas developed countries export
high-end products with higher prices. Chinese exports are an example for this pattern, as recently
demonstrated by Schott (2008). How this affects the results of income shifting calculations depends on
whether or not trade volumes of different countries in a given product group are considered jointly to
identify mispricing. If they are considered jointly, and if the quality pattern is as described above, the
mispricing approach systematically overestimates income shifting from developing to developed
countries. If they are considered separately, this cannot happen, but in this case goods which are
classified as overpriced in one country may be counted as underpriced in another country. This is
inconsistent. As long as it is not possible to disentangle quality differences and income shifting, the
interpretation of numbers generated by the mispricing approach is difficult. 8
Secondly, identifying the highest and the lowest quartile of observed prices as abnormal prices implies
that any price distribution with some variance would be diagnosed to include overpricing and
underpricing, even if the observed price differences are small or are driven by factors other than
mispricing. Empirical analysis should normally allow for the possibility that a hypothesis – in this
case, the hypothesis that income is shifted from developing to developed countries – is not supported
by the data. This is excluded by assumption, unless all prices within a commodity group are identical.
6 Some of these estimates are also referred to in TJN (2007,2009). 7 Pak (2007, p.119) does mention that “Abnormally priced imports and exports may be due to heterogeneity of products within a given harmonized commodity code classification…” but he does not discuss the implications this may have for the analysis. 8 Price volatility over time may also be an issue. But this is not specific to the mispricing method discussed here.

9
Thirdly, what makes the results difficult to interpret is that the counterfactual is not clear. Assume
that, in one period, there is only one transaction in the upper quartile price range and one transaction in
the lower quartile price range. All other transactions are priced below the upper quartile price and
above the lower quartile price. In this case, the counterfactual, which is a hypothetical situation
without mispricing, should be that the two mispriced transactions disappear or adjust their prices to be
within the inner quartile price range. But now assume that, in the next period, the two transactions
identified as mispriced in the first period take place at corrected prices, which are between the upper
and lower quartile price identified for the preceding period; everything else remains the same. In this
case, the quartile price ranges for the second period would change, and transactions which were not
identified as mispriced in the previous period are now identified as mispriced. This inconsistency
occurs because there is no well defined counterfactual.
Fourthly, the price filter method by construction identifies overpriced as well as underpriced
transactions, so that it always identifies income shifting in two directions: into and out of the country
under consideration. But many studies using the approach only report income shifting in one direction
and ignore income shifting into the other direction. For instance, Pak (2007) reports underpriced
imports into the US (table 2 p. 121) and overpriced US exports (table 3, p.122), but overpriced imports
and underpriced exports (both of which would shift income out of the US) are neglected.9
A similar
approach is used by Christian Aid (2009) and other studies.
The restriction to one direction of income shifting leads to highly misleading results if the findings are
used to estimate the impact of income shifting on corporate income tax revenue collected by a
particular country or group of countries, as e.g. in Christian Aid (2008, 2009). A meaningful estimate
of the tax revenue effects would have to take into account profit shifting in both directions. To see
this, consider the following simple example: Assume that there are three exporters of a good in
country A. Firm 1 exports the good at a price of 4, firm 2 exports the good at a price of 8 and firm 3
exports the good at a price of 12. The mispricing approach would identify the transaction at a price of
4 as underpriced and the transaction at a price of 12 as overpriced. Assume further that all firms have
costs of 4 in country A which are deductible from the profit tax base in country A. The goods are
exported to country B, where all three are sold at a price of 14 to consumers in country B. 9 GFI (2009) exploits discrepancies in trade volumes reported by exporting and importing countries to identify income shifting (the GER method). This study also reports illicit flows out of developing countries and neglects flows into developing countries. This may lead to biased results. For instance, in cases where the discrepancies are exclusively a result of unsystematic measurement errors, with an expected value of zero, the GER approach would still indicate a capital outflow.
10
In this example, the aggregate corporate income tax base in country A is equal to 12. Firm 1 shifts
income out of country A and firm 3 shifts income into country A. In the absence of trade mispricing,
the tax base in A would be the same. The tax revenue loss of country A due to mispricing is equal to
zero. A method which only takes into account firm 1 and neglects the implications of mispricing by
firm 3 is clearly misleading. The same applies to the impact of income shifting on country B.
What happens if other taxes are considered? For instance, one could be interested in measuring import
duty revenue losses due to avoidance or evasion. Assume that there is a proportional import duty in
country B. In this case, it is easy to check that tax revenue is again the same in the two cases under
consideration, and it is of key importance to take into account both under- and overpriced imports to
B. Note also that, in this case, firms would have an incentive to systematically understate the import
price.10
If this happens, income is shifted into the country. This is another reason why neglecting
income shifting into developing countries is not appropriate in the context of studies on tax avoidance
and evasion. Depending on the question asked, it may be appropriate to consider either net flows or
gross flows, but reporting flows in one direction only and ignoring the flows into the other direction is
not appropriate and may easily lead to misunderstandings.
Pak (2007) defends his approach by claiming that the price filter method he uses is also applied by the
IRS (IRS regulation 482) to deal with transfer pricing issues. This is not correct. IRS regulation 482
stipulates that this method can only be applied to uncontrolled transactions (see section 1.482-1e) iii
(C)), which means that only transactions between unrelated parties can be taken into account when
assessing whether or not a transfer price is acceptable. Transactions within multinational firms must
be excluded. The reason is that transactions between unrelated parties are more likely to reflect
undistorted prices. Effectively, the IRS approach compares transactions between unrelated firms to
transactions between related firms. In contrast, Pak (2007) applies the price filter method to all
transactions, including transactions between related parties. This is fundamentally different.
An approach which does use a method consistent with IRS regulation 482 is used in a study of trade
mispricing by Clausing (2003). This study focuses on US external trade, however, not on developing
countries in particular. Clausing (2003) compares prices of trade transactions between related parties
10 Note that, if all firms in our example cut their price by one unit to avoid paying import duties, revenue from import duties would decline but the mispricing approach would fail to identify any change.

11
to transactions between unrelated parties and shows that the differences are significantly influenced by
tax rate differences. For instance, in transactions between related parties, prices of exports from high
tax countries to low tax countries are higher than prices of transactions between unrelated parties. This
suggests that multinational firms do try to reduce the taxes they have to pay by manipulating transfer
prices. Of course, one could argue that mispricing is also likely to happen in transactions between
unrelated parties. For instance, an exporter located in a low tax country and an importer in a high tax
country could agree to increase the price of the transaction. This agreement could include a payment
the exporter makes to the importer. Such a payment would have to be concealed from the tax
authorities. If this happens, the approach used in Clausing (2003) systematically understates the
impact of tax differences on profit shifting through transfer pricing. However, a mere price
manipulation in a transaction between related parties is much easier than a price manipulation,
combined with a concealed side payment by which the importer would participate in the tax savings.
3.2. Profitability and profit shifting
As mentioned in section 2, a second approach to measuring income shifting directly considers the
profitability of firms and asks whether the observed profitability pattern can be explained as a result of
income shifting. As in the case of mispricing, the insights provided by this type of study depend on
how exactly profit shifting is identified. Oxfam (2000) estimates that tax revenue losses due to
corporate profits shifted out of developing countries are equal to US-$ 50 billion per year. This
number is calculated as follows. Oxfam multiplies the FDI stock in developing countries (US-$ 1219
billion in 1998, retrieved from UNCTAD, 1999) with a Worldbank estimate for the return on FDI in
developing countries of 16 to 18%. The authors argue that the true estimate for the return on FDI is
even higher since the Worldbank figure does not account for profit shifting activities. Thus, they set
the rate of return to 20%. Next, the paper assumes an average tax rate of 35% and thus derives a
hypothetical corporate tax payment of around US-$ 85 billion. Since the actual tax payments received
are around US-$ 50 billion, according to Oxfam (2000), this leaves a tax gap of US-$ 35 billion.
Oxfam (2000) augments this figure with revenue foregone due to the evasion of income from financial
assets held abroad, which is estimated to equal US-$ 15 billion. This leads to the estimated tax
revenue losses of US-$ 50 billion.
This approach raises a number of questions. Firstly, an important weakness of this calculation is to
assume that, with perfect compliance, all income from foreign direct investment would effectively be
12
taxed at a rate of 35%. The issue is not that the average headline corporate tax rate may have been
closer to 30%11
, as Oxfam (2000) recognizes. The key issue is that this approach neglects the
existence of tax incentives for corporate investment. In the developing world, these investment
incentives play a much larger role than in developed countries (see e.g. Klemm (2009) and Keen and
Mansour (2008)). Many developing countries use tax incentives like e.g. tax holidays or free
economic zones which offer low or zero corporate taxes, to attract foreign investment. It is
controversial whether these incentives are efficient from a national or global welfare point of view
(see also OECD 2001), but their revenue impact should be distinguished from the impact of tax
avoidance and evasion. Neglecting this implies that the revenue losses due to evasion and avoidance
are overestimated.
Secondly, the return on FDI is not identical with the corporate tax base. For instance, if foreign direct
investment is financed by debt, it cannot be expected that the contribution of the investment to the
corporate tax base will be 20% of this investment because interest is deductible from the tax base.
Finally, one should note that this type of analysis is purely descriptive and does not investigate the
factors driving profit shifting. Taxation may not be the main factor which causes income shifting out
of developing countries. Other factors like e.g. the threat of expropriation or confiscation of private
property, economic and political uncertainty, fiscal deficits, financial repression or devaluation may be
the real driving forces as pointed out e.g. by Boyrie et al. (2005). Thus, a shortcoming of the estimates
mentioned above, as well as some the approaches discussed in the preceding sections, is that they
reveal nothing about the reasons for profit shifting out of the developing world.
As mentioned in section 2, there is a growing literature which investigates the role played by taxation
as a factor which drives income shifting. Unfortunately most of this work focuses on OECD countries,
rather than developing countries. Grubert and Mutti (1991) do analyse profit shifting of U.S.
multinational firms and use a dataset which includes developed as well as developing countries. They
show that firms systematically report higher taxable profits in countries with lower tax rates. In their
analysis, firms in countries with a tax rate of 40 % would report an average ratio of pre tax profit and
sales of 9.3 per cent whereas firms in countries with a tax rate of 20 per cent would report a profit
11 KPMG (1998) reports an average corporate income tax rate of 35.67 % for OECD countries, 32.30% for non-OECD Asian-Pacific countries and 32.03% for Latin American countries.

13
sales ratio of 15.75 per cent. This suggests that some profit shifting which is motivated by taxation
does occur. 12
In a recent paper, Azemar (2008) investigates how the effectiveness of law enforcement affects profit
shifting. Interacting a summary measure of law enforcement quality and tax profit ratios of firms in
her regressions, she finds that a low quality of law enforcement goes along with a high sensitivity of
tax payments to corporate tax rates. Her interpretation of this observation is that countries with
ineffective law enforcement have greater difficulties to effectively implement anti tax avoidance
measures like e.g. thin capitalization rules or transfer pricing corrections. This suggests that
developing countries are more vulnerable to income shifting than developed countries.
4. The role of tax havens
Tax havens are widely seen as playing a major role for tax avoidance and tax evasion by multinational
firms as well as individual taxpayers. Empirical research about income shifting to tax havens faces the
difficulty that data on economic activity in these countries is scarce. Nevertheless, there are some
studies on tax avoidance and evasion in tax havens and on the impact of tax havens on tax revenue
collection by other countries. Unfortunately, these studies usually do not focus on developing
countries.
Firstly, there are estimates of tax revenues foregone due to the existence of tax havens made by
NGOs. But these are partly related to the potential impact of tax havens on tax rates set by other
countries. For instance, Oxfam (2000) estimates that developing countries as a whole may be losing
annual tax revenues of at least US-$ 50 billion as a result of tax competition and the use of tax havens
(p.6). Oxfam argues that “tax competition, and the implied threat of relocation, has forced developing
countries to progressively lower corporate tax rates on foreign investors. Ten years ago these rates
were typically in the range of 30-35 per cent- broadly equivalent to the prevailing rate in most OECD
countries. Today, few developing countries apply corporate tax rates in excess of 20 per cent.
Efficiency considerations account for only a small part of this shift, suggesting that tax competition
12 Of course, it has to be taken into account that other factors may play a role. For instance, firms might systematically choose low tax countries as locations of profitable, mobile investment projects.
14
has been a central consideration. If developing countries were applying OECD corporate tax rates
their revenues would be at least US-$ 50 billion higher.”13
The issue here is that it is not clear to which extent the decline in corporate income tax rates which has
occurred in both developing and developed countries is caused by tax havens. Tax rate competition
would exist even in the absence of tax havens. In addition, some authors even argue that, under certain
circumstances, tax havens may reduce the intensity of tax competition (Hong and Smart (2009)). Of
course, the empirical relevance of this analysis remains to be investigated.
However, the main critique of tax havens is not that they force other countries to cut taxes. It is the
perception that these countries offer opportunities for tax avoidance or tax evasion to multinational
firms and individual taxpayers residing in other countries, so that other countries suffer tax revenue
losses. One estimate of tax revenue losses due to the existence of tax havens has been published by the
Tax Justice Network (TJN, 2005). TJN starts with estimates of global wealth in financial assets
published by Banks and Consultancy Firms (a report by Merrill Lynch and Cap Gemini for 1998 and a
report by Boston Consulting Group from 2003). This is combined with estimates of the share of
financial assets held offshore by the Bank for International Settlement (which refers to US asset
holdings, though). By combining these numbers, TJN (2005) claims that offshore holdings of financial
assets are approximately US-$ 9.5 trillion. This is augmented by US-$ 2 trillion of non-financial
wealth held offshore like e.g. real estate (no source is given for this number). On this basis, TJN
(2005) estimates that globally approximately US-$ 11.5 trillion of assets are held offshore. Assuming
an average return on these assets of 7.5 percent implies that these offshore assets yield a return of US-
$ 860 billion. Moreover, the TJN assumes that these assets are taxable at 30% and thus calculates a
revenue loss of US-$ 255 billion per year (in 2005).
The analysis in TJN (2005) does not try to estimate which part of these revenue losses occur in
developing countries. Cobham (2005) uses the TJN (2005) results and estimates the share of
developing countries as follows: Since 20% of worldwide GDP is accounted for by middle and low-
income countries and given that offshore wealth holdings are not less likely in the developing world,
20% of the revenue loss can be assigned to these countries, i.e. US-$ 51 billion.
13 Another estimate by Weyzig and van Dijk (2008) argues that the tax haven features of the Netherlands alone lead to a loss of more than € 100 million to developing countries.
15
Other estimates of these revenue losses use similar methods. Oxfam (2000) calculates revenue losses
due to evasion of income from financial assets held abroad of around US-$ 15 billion per year. This
result is mainly driven by an estimate for foreign asset holdings of residents in developing countries
from 1990 (US-$ 700 billion), which is now outdated. In a more recent study, Oxfam (2009) estimates
that US-$ 6.2 trillion of developing country wealth is held offshore by individuals. This leads to an
estimated annual tax loss to developing countries of between US-$ 64 - 124 billion.
It is difficult to interpret these estimates for tax revenue losses due to offshore wealth holdings. They
do not unambiguously over- or underestimate the revenue losses, but they rely on a large number of
strong assumptions. These include the assumptions on the distribution of asset holdings across the
developed and the developing world as well as taxable rates of return and average tax rates. In
addition, there are several open questions which have to be addressed. First, it is unclear whether all
income from offshore wealth holdings is taxable on a residence basis. Some developing countries do
not tax the foreign source income of residents because it may not be administratively efficient to do so
(Howard (2001), p. 259). Second, even if savings income is taxable on a residence basis, taxes paid in
the source country may be deductible from tax in the residence country. Third, it is unlikely that all
income from financial assets held offshore evades taxation in the country of residence of the owners.
There may be other than tax reasons for offshore holdings of financial assets, and it is possible that
owners of these assets declare their income in their countries of residence. To the extent that these
assets generate passive investment income, they will also be subject to Controlled Foreign
Corporations Legislation, which means that this income is excluded from deferral of home country
taxation or exemption granted to active business income.
Here, further research is needed to e.g. determine the causal effect of the presence in tax haven
countries on tax revenues paid by multinational affiliates in the developing world. Such an
investigation should follow work by Desai et al. (2006a, 2006b) and Maffini (2009). These papers
study the role of tax havens for the US and the European Union. In the next section, we discuss
methods and datasets which can be used to do similar work on developing countries.
5. Data Sets and Identification Strategies for Assessing Tax Evasion and Avoidance in
Developing Countries

16
Attempts to assess whether and to what extent (multinational) firms in developing countries engage in
international tax evasion and tax avoidance activities have long been hampered by a lack of
appropriate data. Thus, existing evidence on the issue is largely anecdotal in nature with the exception
of a small number of studies reviewed in the previous section. As many of these papers face
methodological difficulties and the identification strategies partly rely on strong assumptions, more
research is needed to identify and quantify corporate tax avoidance and evasion in the developing
world. In recent years, a number of data sets became available which may suit for this purpose. In the
following, we will review a selection of these data bases and discuss potential identification strategies.
The analysis will focus on micro data sources as we consider these to be better suited to identify
corporate profit shifting activities than macro level data since they are less prone to give rise to
endogeneity problems in the estimation strategy.
5.1. Identification Strategies
The basis for a valid empirical identification strategy is to develop and test hypotheses which derive
effects that are unlikely to capture things other than corporate profit shifting. In the following, we will
discuss two identification strategies that from our point of view largely fulfil this requirement and
which can be applied to micro level data.
The first identification strategy builds on the notion that companies in developing countries differ with
respect to their flexibility and opportunities to shift income out of their host countries. For example,
companies which are part of a multinational group can plausibly undertake profit shifting activities
more easily than firms without affiliates in foreign countries. This is because they can transfer profits
to an affiliated company abroad.14
Moreover, firms which belong to multinational groups with tax
haven affiliates have particularly good opportunities to transfer income out of developing countries.
Thus, they can be expected to engage in even larger profit shifting activities. Consequently, the
identification strategy is to compare profit shifting measures for the treatment group of multinational
firms (with tax haven connections) to a control group of national firms which are expected not to
engage in significant profit shifting activities.
14 As discussed in section 2, there is anecdotal evidence (e.g. by Baker, 2004) that national companies also engage in profit shifting activities by colluding with unrelated parties in foreign countries. However, given the transaction costs of these arrangements, previous academic papers (e.g. Clausing, 2003) consider the associated volumes of multinational profit shifting to be quantitatively minor in comparison to profit shifting activities of multinational groups.
17
To identify profit shifting activities in this context, researchers need detailed information on corporate
ownership structures and on company variables which are expected to capture profit shifting activities.
According to previous empirical studies on corporate shifting activities in the industrialized world (see
e.g. Clausing (2003), Huizinga and Laeven (2008), Buettner and Wamser (2006), Dischinger and
Riedel (2008)), multinational firms use different channels to transfer taxable resources out of
countries, the most important ones being the distortion of intra-firm trade prices and the debt-equity
structure as well as the relocation of profitable assets like corporate patents. To test for this type of
profit shifting thus requires associated information on trade prices, debt levels and patents. As this is
often not available, researchers may also exploit information on corporate pre-tax profits and
corporate tax payments as profit shifting outflows are expected to lower both variables. Thus,
following the above identification strategy, we expect that multinational firms in developing countries
(especially those with a tax haven connection) report lower pre-tax profits per unit of assets, pay lower
taxes per unit of assets and per unit of profit, respectively, hold higher fractions of (intra-firm) debt
and exhibit stronger distortions of intra-firm trade prices (i.e. enlarged import prices and diminished
export prices) than the control group of national firms. The obvious challenge of this identification
strategy is to empirically account for a potential selection of firms with differing characteristics into
the control group (national firms) and the treatment group (multinational firms (with a tax haven
connection)). Strategies to solve this problem have been presented in earlier papers for the developed
world (see e.g. Desai et al. 2006; Maffini, 2009; Egger et al. 2007). If after accounting for all these
issues, no differences between the considered profit shifting variables for national and multinational
firms is found, the profit shifting hypothesis is rejected.
A second identification strategy starts with the question of why companies shift profits out of the
developing world. One motive might be that they want to save on tax payments. A second might be
that they draw their money out of corrupt and politically unstable countries where they are prone to
threats of expropriation. To test for these hypotheses implies to determine whether companies in
countries with a high-tax rate and/or a high corruption rate report lower pre-tax profits per assets, pay
lower taxes on their assets and profits, have higher debt-to-equity ratios and more strongly distorted
intra-firm transfer prices. In this case, again the challenge is to ensure that the identified effect
between taxation/corruption and the profit shifting measures is not driven by an unobserved
heterogeneity of firms which are located in high-tax (high-corruption) countries and low-tax (low-
corruption) countries. This requires including a set of control variables which capture differences
between affiliates and host countries. The most convincing approach here is to include a set of affiliate
18
fixed effects into a panel data regression which implies that the researcher accounts for all time-
constant affiliate differences and the identification is achieved via corporate adjustments to changes in
taxes and/or the corruption level. Again, for this identification strategy to be applied, stringent data
requirements have to be met. Ideally, accounting data on pre-tax profits, tax payments, debt-levels or
intra-firm transfer prices should be available in panel format for several years as should be
information on corporate taxes and/or the level of corruption and political stability.15
5.2. Data Sets
A number of data sets may fulfil the requirements associated with the two identification strategies laid
out above. In the following, we will present a selection of these data bases. In a first step, we will
discuss one of the data sources, ORBIS, in some depth. In a second step, we will briefly describe
alternative databases available for the purpose of testing tax avoidance in the developing world.
5.2.1. ORBIS
The ORBIS data provided by Bureau van Dijk contains information on companies worldwide (see
Table A1 for a description of the data). While the majority of firms in ORBIS are located in
industrialized economies, the data also contains information on countries in the developing world.
ORBIS is available in different versions whereas the largest version of the data set in total comprises
57 million firms. The data is collected from various (partly private and partly official) sources which
may differ between countries. Consequently, it is a well-known problem of the ORBIS data that the
firm coverage differs across countries, with some economies being comparably poorly represented.
Not surprisingly, this problem is especially pronounced in developing countries. While the firm
coverage tends to be particularly small in Africa, information on a sufficiently large number of firms
is reported for several economies in Latin American, South America and Asia. Hence, we think that
focussing on those developing economies for which good information is available allows using the
ORBIS data for the purpose of identifying corporate profit shifting behavior.
15 Moreover, the analysis must comprise time periods in which the host countries included in the sample experienced tax reforms or changes in corruption and political stability.

19
ORBIS provides balance sheet information and data on profit and loss account items. Thus, it contains
detailed information on pre-tax and after-tax profit (both operating profits and financial plus operating
profits) as well as on tax payments and debt variables. Moreover, information on ownership linkages
is included, precisely on linkages to all direct and indirect shareholders of the firm as well as to
subsidiaries within the multinational group. Last, ORBIS provides address information (postcode and
city name) which may allow researchers to determine the location of firms (or at least the headquarter)
within developing countries and thus to identify, for instance, companies located in free economic
zones or to determine the role of taxes levied at the regional level. Like with other data bases provided
by private sources, it is important to stress that there may be issues regarding the quality of the ORBIS
data. In line with previous papers, we however think that these problems can be handled by rigorous
plausibility checks and data cleaning efforts.
In the following, we will present and discuss descriptive statistics for some countries in the ORBIS
data. Note that the ORBIS version available to us contains large and very large firms only. Analysing
the full ORBIS version which also accounts for smaller firms is likely to enhance the firm coverage
compared to our exercise. Moreover, we restrict the analysis to the Asian continent and only employ
data for countries with a sufficient firm coverage. The countries included in the sample are China,
Indonesia, India, Malaysia, Philippines, Pakistan, Thailand and Taiwan. Our final data set is a cross
section of 87,561 firms for the year 2006 (see Table B1 for a country distribution).
As the ORBIS data provides information on ownership connections between firms, it allows us to
pursue the first identification strategy described in the previous section. We define a firm in a
developing country to observe a direct link to a foreign economy if it directly owns a subsidiary in a
foreign country with at least 50% of the ownership shares or if it is directly owned by a parent firm in
a foreign country with at least 50% of the ownership shares.16
16 Note that the information on ownership shares in ORBIS is missing for many cases in the sample. As the ownership information in general suggests that most firms are majority owned in our sample, we follow previous papers which worked with this data (see e.g. Budd et al., 2005) and assume majority ownership if the information on ownership percentages is missing.
Moreover, we adopt a second, less
restrictive definition of a multinational firm which applies if any affiliate within the multinational
group is located in a foreign country (including subsidiaries of the immediate or global ultimate owner
which do not have a direct ownership link to the considered firm). According to these definitions,
2,202 firms in our data set observe a direct ownership link to a foreign affiliate and 2,807 firms belong

20
to a multinational group in the broader sense that at least one affiliate in the group is located in a
foreign country (irrespective of a direct or indirect ownership link).
Here, a comment is in order as we face the potential challenge that information on some affiliates
within the multinational group is missing in the data. If missing affiliates are located in foreign
countries (from the point of view of the considered firm), then we might declare a corporation to be a
national firm which is actually part of a multinational group. This misclassification, however,
introduces noise into our analysis and is expected to bias the results against us. This implies that the
results should be interpreted as a lower bound to the true effect.
The same exercise is undertaken to identify firms with ownership linkages to affiliates in a tax haven
country. A tax haven is defined according to the OECD’s tax haven list. Again, we define a group of
firms to have a direct ownership link to a tax haven country if they directly own a tax haven subsidiary
with at least 50% of the ownership shares or are directly owned by at least 50% of the ownership
shares by a foreign parent firm in a tax haven.17
In a second step, we moreover adopt a broader
definition of tax haven linkages which identifies firms in our data which belong to multinational
groups with a tax haven affiliate (irrespective of a direct or indirect ownership link). According to
these definitions, 207 firms in our data observe a direct ownership link to a tax haven country while
691 corporations belong to groups which observe a tax haven affiliate (directly or indirectly connected
to the considered firm). Thus, according to the broader definition, 25% of the multinational firms in
our sample observe an ownership link to a tax haven country while only 9% of the firms have a direct
ownership link to a foreign tax haven.
Again, we might face the problem that information may not be available for all affiliates which belong
to a multinational group. As a large fraction of multinational firms from industrialized countries is
known to operate subsidiaries in tax haven countries, we run a cross check on the data and restrict the
analysis to firms which are owned by immediate and global ultimate owners (in foreign countries) and
for which information on the owners’ subsidiary list is available. For this subgroup of firms, we find
that 63% belong to multinational groups with a tax haven affiliate.18
17 Again, we consider majority ownership if the ownership information is missing.
Nevertheless, we are again not
too concerned about potential shortcoming of the data in this dimension as missing information on tax
haven connections introduces noise into the estimation and biases our results against us.
18 Desai, Foley and Hines (2006b) find that, in 1999, 59 per cent of US multinationals had affiliates in tax haven countries.

21
Thus, we compare different corporate variables which are expected to capture profit shifting activities
for the subgroup of firms defined above. As mentioned above, the ORBIS data contains information
on a wide range of accounting variables, including the unconsolidated corporate pre-tax profit, tax
payments and debt-levels. In Table B2, we provide descriptive statistics which discriminate between
first, all firms in the data; second, firms which belong to groups that own affiliates in a foreign
country; third, firms which observe a direct ownership link via a parent firm or a subsidiary to a
foreign country (this is thus a subset of the second group of firms); fourth, firms which belong to a
multinational group that observes an affiliate in a tax haven country and fifth, firms which have a
direct ownership link (via a direct parent firm or subsidiary) in a tax haven country. The rationale
behind investigating groups with direct ownership linkages to foreign countries and tax havens
separately is that group affiliates which are connected through direct ownership are presumed to be
closer connected in an economic sense. This is expected to facilitate profit shifting between the
entities.
As table B2 shows, the firms included in the analysis on average have total asset investments of 23.3
million US dollars. Not surprisingly, multinational firms observe larger asset stocks, with 98.1 million
US dollars and 94.9 million US dollars for firms with any link to a foreign affiliate and firms with a
direct link, respectively. Moreover, among the multinational firms, corporations with a tax haven
linkage are reported to have higher total asset investments than other multinational firms with 140.5
million US dollars and 172.3 million US dollars respectively (for firms with any link to a tax haven
country and firms with a direct link to a tax haven respectively). All the differences are statistically
significant as indicated by the 95% confidence intervals around the means.
Moreover, the table presents the pre-tax profit per total assets reported by the companies in our sample
which may be considered as a proxy for the firm’s corporate tax base.19
19 To avoid distortions through outliers, we drop observations with a pre-tax profitability low -1 or a pre-tax profitability above 1. That, however, does not qualitatively affect our results.
The average pre-tax
profitability for the firms in our sample is estimated with 0.092. Interestingly, multinational firms
(irrespective of direct or indirect ownership linkages to foreign countries) observe a lower pre-tax
profitability which is measured to be 0.071 on average and which is thus significantly lower than the
average pre-tax profitability of the full sample as indicated by the 95% confidence interval around the
mean. This result may seem counterintuitive at first sight as multinational firms are commonly found
22
to observe larger productivity rates than national firms (see e.g. Helpman et al., 2004) which would
suggest them to also report larger pre-tax profitability values. However, as indicated above they may
on the other hand side equally face more opportunities to engage in tax avoidance and tax evasion
through international channels which may lower reported pre-tax profits in our sample countries (that
do not comprise any tax haven). Or alternatively, the higher international mobility of their investments
may endow them with a higher bargaining power against host country governments and allow them to
obtain lower tax bases than less mobile national firms.
Interestingly however, firms which belong to multinational groups that include tax haven affiliates do
not report significantly lower profitability rates than national firms. As multinational firms with a tax
haven linkage are presumed to face higher tax avoidance possibilities and probably also a higher
willingness to take up avoidance and evasion opportunities, this suggests that multinationals with a tax
haven connection are more profitable in their operations than other multinational firms. This picture
prevails if we restrict the profitability variable to rates above zero.
Moreover, Table B2 depicts the tax payments per total assets reported by the firms in our sample. The
broad picture resembles the one for the profitability rates. While national firms pay the highest taxes
per total assets reported with an average of 0.018, the tax payments per total assets of multinational
firms are significantly smaller and measured with 0.015 and 0.014 respectively (for firms belonging to
multinational groups in general and firms with a direct ownership link to a foreign country
respectively). The subgroup of multinational firms with a tax haven link does not observe significantly
lower tax payments per total assets than national firms (which is likely driven by the profitability
pattern discussed in the paragraphs above).
Furthermore, we report descriptive statistics for the tax payments per pre-tax profit which are a proxy
for the average tax rate of the observed firm.20
20 In doing so, we restrict our sample to firms which observe a positive pre-tax profit.
The results suggest that again national firms face the
highest average tax rate of 20% which is significantly larger than the average tax rate of multinational
firms which is 16.9% and 16.4% respectively (for firms belonging to multinational groups in general
and firms with a direct ownership link to a foreign country respectively). Among multinationals, the
lowest average tax rate is faced by firms which belong to multinational groups with a tax haven
linkage. Those firms pay 13.2% and 11.2% taxes on their profits (for firms with any tax haven link
and firms with a direct tax haven link respectively) which is again significantly lower than the rates

23
faced by multinationals in general and thus, also significantly lower than the rates faced by national
firms. This strongly suggests that firms with a tax haven connection indeed manage to significantly
reduce their corporate tax burden.
Furthermore, the ORBIS data includes information on corporate debt-ratios (calculated as debt over
total assets). As (a fraction of) interest payments are commonly deductible from the corporate tax
base, firms which want to reduce their corporate tax burden have an incentive to employ comparably
high debt levels. This incentive generally applies to both, national and multinational firm whereas
multinational firms (with a tax haven connection) have the additional opportunity to use intra-firm
lending as a device to shift profits to a foreign country. The descriptive statistics in Table B2 suggest
that multinational firms in fact, however, observe lower debt-ratios than their national counterparts
indicating that debt shifting might not be a major device of multinational firms to transfer income
abroad.
To account for the fact that firms which belong to multinational groups (with tax haven connections)
might differ in characteristics that may equally determine the described profit shifting measures, we
also run a set of regressions which attempt to control for some of the potential source of heterogeneity.
Table B3 presents the result of a simple OLS model which regresses the pre-tax profitability (defined
as pre-tax profits over total assets) of the firms in our sample on two dummy variables indicating
entities that belong to multinational groups in general and those that belong to groups with tax haven
affiliates in particular. In Specifications (1) to (4), these definitions require the firm to have a direct
ownership link to a foreign firm and tax haven affiliate respectively while the multinational and tax
haven definition in Specifications (5) to (8) allows for indirect connections, too. Specification (1)
presents the regression results without any control variables which derives analogous findings to the
descriptive statistics in Table B2. Precisely, the results again suggest that firms which belong to
multinational groups observe significantly lower reported pre-tax profits per total assets than national
firms whereas the pre-tax profitability of firms belonging to multinational groups with a tax haven
affiliation does not statistically differ from national firms.
In Specifications (2) to (4), we include additional control variables to this estimation framework to
account for heterogeneity in other firm characteristics. Precisely, in Specification (2), we add a full set
of country fixed effects which absorbs time constant heterogeneity in the pre-tax profitability of firms
in different sample countries. This renders the coefficient estimate for the dummy variable indicating

24
multinational firms insignificant and suggests that the pre-tax profitability of multinational firms in
general and those with tax haven connections in particular does not differ from the one of national
entities. In Specification (3), we moreover add a full set of two-digit industry dummies to account for
heterogeneity in the profitability ratios of different industries which does not change the results. Last,
Specification (4) additionally controls for the fact that profitability rates may vary with firm size and
includes the logarithm of the firm’s total assets as an additional control variable. The coefficient
estimate for the size effect turns out negative and statistically significant at the 1 percent level. This
indicates decreasing returns to scale, i.e. in our sample, large firms tend to report lower pre-tax
profitability rates than small firms. Accounting for this, in turn derives positive and statistically
significant coefficient estimates for the dummy variables indicating multinational firms (with tax
haven connections). Hence, conditional on their size, multinational firms (with tax haven connections)
report a larger pre-tax profitability than their national counterparts which is in line with previous
evidence in the literature that suggests higher productivity – and in consequence higher profitability -
levels of multinational firms. Specifications (5) to (8) re-estimate the regression model accounting for
multinational firm and tax haven definitions that captures direct and indirect ownership linkages. This
derives comparable results.
In Table B4, we repeat the exercise and determine the connection between multinational ownership
linkages (to tax haven affiliates) and the corporate tax payments per assets. Analogously to the
previous table, Specification (1) regresses the corporate tax payment ratio on dummy variables
indicating direct ownership links to foreign firms (in tax haven countries). Again, the results indicate
that multinational firms in general tend to pay significantly less taxes on their total asset stock than
national firms while the tax payments of multinational firms with a tax haven connection do not
significantly differ. This result prevails if we account for a full set of country fixed effects and
industry fixed effects in Specifications (2) and (3). In Specification (4), we additionally include a size
control (the logarithm of total assets). Similar to the results in the previous table, the coefficient
estimate for the size variable is negative and significant suggesting that the tax payments per total
assets decrease in firm size. Moreover, conditional on firm size, the specifications indicate that
multinational firms in general and especially those with a tax haven connection report larger tax
payments per total assets than national firms. This result again may reflect that multinational firms
tend to observe larger underlying productivity characteristics and hence earn higher profits per total
assets which result in larger tax payments.
25
Last, we assess the difference in the average effective tax rate of national and multinational firms
(with a tax haven connection) as measured by tax payments over the firm’s pre-tax profits. To do so,
we restrict our sample to firms which observe both a positive pre-tax profit and non-negative tax
payments. Specification (1) regresses the average tax burden on dummy variables indicating
multinational firms (with tax haven connections) as determined by direct ownership linkages.
Interestingly, the regression results suggest that multinational firms in general do not observe a lower
average tax rate than their national counterparts while multinational corporations with tax haven
linkages report a 5 percentage point lower average tax rate. Additionally controlling for a full set of
country fixed effects and industry fixed effects equally renders the coefficient estimate for the
multinational dummy negative and statistically significant suggesting that both, multinational firms in
general and those with a tax haven connection pay lower taxes on their reported pre-tax profits
compared to national firms. This result is moreover robust against including a size control into the
model as presented in Specification (4). Quantitatively, the results suggest that multinational firms pay
1 percentage points less taxes on their pre-tax profit than national corporations while multinational
firms with a tax haven connection pay 4.4 percentage points less taxes on their profit. In Specifications
(5) to (8) we rerun the regression accounting for indirect ownership linkages in the definition of the
multinational dummy (with tax haven connections) and find comparable results.
Thus, summing up, the results suggest that multinational firms tend to report higher pre-tax profits and
tax payments per assets than comparable national firms which may reflect that they have a higher
underlying productivity level. However, we also find that multinational firms, and especially those
with a tax haven connection, face a significantly lower average tax burden, i.e. lower average tax
payments per pre-tax profits.
Nevertheless, also note that some caution is warranted when interpreting the results. As discussed
above, an in-depth analysis requires us to account for selection of different firms in the groups of
national corporations, multinationals and multinationals with an ownership link to avoid that the
results are driven by unobserved heterogeneity between groups.21
21 For example, it is not possible to conclude from the descriptive results presented in this paper that a tax haven ownership link causes a reduction in the firm’s average tax rate. It may be the case that firms with many shifting opportunities have a higher tendency to locate in tax haven countries.
One important issue in this respect
is also to assess to what extent the difference in the average tax rates of national firms and
multinationals (with a tax haven connection) is driven by the fact that multinationals tend to benefit
from the location in special economic zones or receive special tax breaks by the countries’

26
governments through other sources. This is methodologically feasible as demonstrated by previous
studies for the industrialized countries (see e.g. Desai et. al., 2006; Maffini, 2009; Egger et al., 2007).
An analogous analysis for the developing world, however, goes beyond the scope of this paper and is
delegated to future research.
Moreover, the structure of the ORBIS data also allows pursuing the second identification strategy, i.e.
to determine how changes in the corporate tax rate and corruption parameters affect profit shifting
variables. This is possible as ORBIS includes rich information on firm and group characteristics which
may be used as control variables and ORBIS is available in a panel structure which allows controlling
for time-constant differences between the affiliates. In the course of this paper, we only determine the
correlation between the corporate statutory tax rate (obtained from various sources) and a corruption
index (obtained from Transparency International) with the profit shifting variables named above and
find small correlations only. Note that this, however, does not necessarily reflect that firms in the
sample do not engage in profit shifting behaviour but in the contrary indicates that profit shifting
measures are determined by several factors that correlate with the tax rate and corruption indices.
These factors have to be accounted for in a regression framework to make meaningful statements
about the effect of taxes/corruption on profit shifting behaviour. This is left to future research.
5.2.2. Other Data Sources
Apart from ORBIS, several other data sets may be used to analyse tax evasion and tax avoidance in
developing economies. A comparable database to ORBIS is COMPUSTAT Global which is provided
by Standard and Poor’s. The data comprises firm level information on balance sheet items and profit
and loss accounts of companies around the world. Thus, information on pre-tax profits, corporate tax
payments, debt levels, interest payments and R&D expenditure is included which allows to identify
corporate profit shifting and to assess the importance of different profit shifting channels out of the
developing world. In total, COMPUSTAT covers more than 30,000 companies in 100 countries,
including several developing countries. The coverage is especially good in the Asian-Pacific region
where information on almost 16,000 firms is available (see Table A2 for a description).
The data has some drawbacks though. First, it lacks ownership information, i.e. it is not possible to
link subsidiaries and parent firms in the data. Consequently, COMPUSTAT does not allow applying
the first identification strategy as foreign firms and tax haven affiliates cannot be systematically
identified. However, as the data is available in panel format for several years, it allows to pursue the
27
second identification strategy and to determine how tax rate changes and changes in the corruption
index affect profit shifting measures. A second drawback of the data is that information is only
provided for companies which are listed on a stock exchange. This imposes a sample restriction
although large (listed) firms are likely to be the main profit shifters and thus profit shifting effects
should nevertheless be identifiable. Third, as already stressed above, the data quality of data sets
provided by private institutions has been criticized in the past.
To address the latter concern, researchers may consider using data sources provided by official
institutions which became available recently and allow for investigating tax avoidance and evasion in
the developing world. These data sets comprise information on outward investments by multinational
firms located in a respective country, the most widely known data sets being the US BEA firm-level
dataset (see Table A3), the German Micro database on Direct Investment (MiDi) (see Table A4), the
UK Annual Inquiry into Foreign Direct Investment (AFDI) (see Table A5). All three data sets
comprise information on multinational parent firms in the respective countries and their foreign
subsidiaries, including subsidiaries in the developing world. The main advantage of these data sources
is that the reporting is mandatory by national law which suggests that the quality of the reported
information is high. Moreover, commonly information on directly and indirectly held affiliates is
available. Only the AFDI data is restricted to information on directly held subsidiaries. Despite some
limitations, the data sets thus allow for studies based on the first identification strategy.
Moreover, the data includes several variables which capture profit shifting behaviour like after-tax
profits, information on tax payments and debt ratios. Nevertheless, the data is somewhat less
comprehensive than in ORBIS or COMPUSTAT. Thus, both AFDI and MiDi include only
information on company profits after taxation, not on pre-tax profits (whereas the former may be less
suited to investigate profit shifting behaviour). MiDi also does not report any information on the
foreign subsidiary’s tax bill in the contrary to AFDI and BEA. Nevertheless, one major advantage of
these data sets is that they include information on intra-firm lending and intra-firm interest flows,
which allows to test for debt shifting activities between affiliates.
Additionally, in the US, researchers of the US treasury have access to confidential US firm-level data
which is not available to the general public. The data includes information on US tax returns (see
Table A6) and includes variables on the tax payments, profits and investments of US multinationals in
the US and information on income and tax payments at foreign controlled companies including

28
subsidiaries in developing economies. Finally, Table A7 lists some other country-specific firm-level
datasets which contain information on foreign activities of domestic companies.
Last, data on international trade prices may be exploited to investigate profit shifting out of developing
countries which takes place through trade mispricing (of multinational firms). Previous studies
reviewed above use the United States Merchandise Trade Databases which contain price data for
import-harmonized commodity codes and for export-harmonized commodity codes. The shortcoming
of this data is that it hardly allows for a clear identification strategy to ferret out profit shifting
behaviour. As the data does not discriminate between trade of related and unrelated parties, our first
identification strategy is not applicable. This shortcoming can however be addressed by using a
different data source: Clausing (2003) exploits data from the International Price Program of the US
Bureau of Labor Statistics which publishes information on 700 aggregate export and import price
indexes. The data differentiates trade between related and unrelated parties which makes the control
group approach feasible. Assuming that profit shifting via trade price distortions is negligible between
third parties (see Clausing, 2003), trade prices of intra-firm trade between multinational affiliates can
be compared to trade pricing between third parties. A different strategy to develop a valid
identification strategy is to exploit the panel dimension of the trade price data which has not been done
in existing studies. Precisely, one might investigate how trade prices are affected by policy reforms
like tax rate changes or changes in the level of law enforcement or political stability in the partner
countries, which implies that the countries without tax reforms serve as a control group.
6. Conclusions
The issue of tax avoidance and evasion through profit shifting out of developing countries is an
important and widely debated issue. Yet, relatively little is known about the magnitude of and the
factors driving profit shifting in the developing world. The main reason is that the available data is
limited in terms of both quality and quantity. The results of most existing empirical studies on
developing countries are difficult to interpret because the methods used to measure income shifting
raise a number of issues. We have suggested and discussed a number of datasets, some of which have
become available recently, and methods to do more research on profit shifting in the developing
world. While these approaches also have their limitations, they do have the potential to improve our
understanding of this important issue and to inform policies directed at crowding back tax avoidance
and evasion in the developing world.

29
References
Azemar, Céline (2008), International Corporate Taxation and US Multinational’s Behaviour: An integrated Approach, Discussion Paper, August 2008. Azemar, Céline and Gregory Corcos (2009), Heterogeneity of Foreign Firms and Asymmetry in Tax Responsiveness: The Role of Transfer Pricing, The World Economy, forthcoming Baker, Raymond (2005), Capitalism’s Achilles Heel: Dirty Money and How to Renew the Free-Market System, John Wiley & Sons Inc. Hoboken, United States Boyrie, Marie, Simon Pak and John Zdanowicz (2005), Estimating the Magnitude of Capital Flight due to Abnormal Pricing in International Trade: The Russia–USA Case, Accounting Forum 29(3), pp. 249-270 Buettner, Thiess and Georg Wamser (2007), "Intercompany Loans and Profit Shifting – Evidence from Company-Level Data", CESifo Working Paper Nr. 1959 Christian Aid (2008), Death and taxes: The true toll of tax dodging, May 2008. Christian Aid (2009), False Profits: robbing the poor to keep the rich tax free, A Christian Aid Report, March 2009. Clausing, Kimberly (2003), Tax-motivated transfer pricing and US intrafirm trade prices, Journal of Public Economics 87, 2207-2223. Desai, M., C.F. Foley and J.R. Hines (2004), Foreign Direct Investment in a World of Multiple Taxes, Journal of Public Economics 88 (12), pp. 2727-2744. Desai, Mihir, Fritz Foley and Jim Hines (2006a), Do Tax Havens Divert Economic Activity? Economics Letters 90(2), pp. 219-224. Desai, Mihir, Fritz Foley and Jim Hines (2006b), The Demand for Tax Haven Operations, Journal of Public Economics 90(3), pp. 513-531 Devereux, Michael (2007), The Impact of Taxation on the Location of Capital, Firms and Profit: A Survey of Empirical Evidence, Oxford University Centre for Business Taxation, Working Paper 07/02 Dharmapala, Dhammika and Jim Hines (2006), Which Countries Become Tax Havens? NBER Working Paper No. 12802. Dischinger, M. and N. Riedel (2008), Corporate Taxes and the Location of Intangible Assets within Multinational Firms, Munich Economics Discussion Papers 2008/15 Egger, P., W. Eggert and H. Winner (2007), Saving Taxes through Foreign Plant Ownership, CESifo Working Paper No. 1887

30
Erard, Brian and Jonathan S. Feinstein (2001), Estimating the Federal Income Tax Gap Using Operational Audit Data, report prepared for the IRS Economic Analysis and Modeling Group Fuest, Clemens and Nadine Riedel (2009), Tax avoidance, tax evasion and tax expenditures in developing countries: a review of the literature, Report for the UK Department for International Development (DFID). GFI (2009), Illicit Financial Flows from Developing Countries 2002-2006, Global Financial Integrity, Washington Grubert, H. and J. Mutti (2000), Do Taxes Influence where U.S. Corporations Invest?, National Tax Journal 53(4), 825-839. Grubert, Harry and John Mutti (2004), Empirical Asymmetries in Foreign Direct Investment and Taxation, Journal of International Economics 62(2), 337-358. Helpman, E., M. Melitz, S.R. Yeaple, 2004, Export versus FDI with Heterogeneous Firms, American Economic Review 94(1), pp. 300-316. Hines, James R. and Eric M. Rice (1994), Fiscal Paradise: Tax Havens and American Business, Quarterly Journal of Economics 109, 149-182. Hong, Qing and Michael Smart (2006), In praise of tax havens. International tax planning and foreign direct investment, forthcoming in European Economic Review.. Howard, Michael (2001), Public Sector Economics for Developing Countries, University Press of West Indies Huizinga, Harry and Luc Laeven (2008), International profit shifting within multinationals: A multi-country-perspective, Journal of Public Economics 92, 1164-1182. Huizinga, Harry, Luc Laeven and Gaetan Nicodeme (2008), Capital Structure and International Debt Shifting, Journal of Financial Economics 88, 80-118. Keen Michael and Mario Mansour (2008), Revenue Mobilisation in Sub-Saharan Africa, IMF Fiscal Affairs Department, 11 August 2008. Klemm, Alexander (2009), Causes, benefits and Risks of Business Tax Incentives, IMF Working Paper 09/21. KPMG (1998), Corporate Tax Rate Survey 2008. Lipponer, A. (2009), Microdatabase Direct Investment – MiDi – A Brief Guide, Deutsche Bundesbank Maffini, Giorgia (2009), Tax Payments of Multinational Groups with Operations in Tax Havens, mimeo Mataloni, R.J. (1995), A Guide to BEA Statistics on U.S. Multinational Companies. Survey of Current

31
Business 75, pp. 38-55. OECD (2001), Corporate Tax Incentives for Foreign Direct Investment, OECD Tax Policy Studies No 4, Paris. Oxfam (2000), Tax Havens – Releasing the Hidden Billions for Poverty Eradication, Oxfam GB Policy Paper Oxfam (2009), Tax haven crackdown could deliver 120 bn a year to reduce poverty - Oxfam, March 13, 2009, http://www.oxfam.org.uk/applications/blogs/pressoffice/?p=3912. Pak, Simon, Stelios Zanakis and John Zdanowicz (2003), Detecting Abnormal Pricing in International Trade: The Greece – USA Case, Interfaces 33(2) pp. 54-64 Pak, Simon (2007), Closing the Floodgates – Collecting Tax to Pay for Development, Commissioned by the Norwegian Ministry of Foreign Affairs and Tax Justice Network. Quijano, A. M. (1990), A Guide to BEA Statistics on Foreign Direct Investment in the United States, Survey of Current Business, pp. 29-37 Schott, Peter K. (2008) The Relative Sophistication of Chinese Exports, Economic Policy 53, 5-49. Shome, Paarthasarathi and Vito Tanzi (1993), A Primer on Tax Evasion, IMF Staff Papers 40, 807-828. Slemrod, Joel and Shlomo Yitzhaki (2002), Tax Avoidance, Evasion and Administration, Handbook of Public Economics, in: A.J. Auerbach and M. Feldstein, Handbook of Public Economics, Edition 1, Volume 3, Chapter 22, pp. 1423-1470 Smarzynska, Beata and Shang-Jin Wei (2000), “Corruption and Composition of Foreign Direct Investment: Firm-level Evidence.” NBER Working Papers: 7969. TJN (2005), The Price of Offshore, Tax Justice Network Briefing Paper. TJN (2007), Closing the Floodgates, Collecting Taxes to Pay for Development, Study Commissioned by the Norwegian Ministry of Foreign Affairs. TJN (2009), Magnitudes: Dirty Money, Lost Taxes and Offshore, http://www.taxjustice.net/cms/front_content.php?idcat=103 UNCTAD (1999), World Investment Report 1999: Foreign Direct Investment and the Challenge of Development, United Nations Conference of Trade and Development, New York and Geneva Wei, Shang-Jin (2000), “How Taxing Is Corruption on International Investors?”, The Review of Economics and Statistics, 82(1), pp. 1-11. Weichenrieder, Alfons (2009), Profit Shifting in the EU: Evidence from germany, International Tax and Public Finance 19, 281-297.

32
Weyzig, Francis and Michiel van Dijk (2008), Tax Haven and Development Partner: Incoherence in Dutch Government Policies, MPRA Paper No. 12526 Zdanowicz, John, Simon Pak and Michael Sullivan (1999), Brazil-United States Trade: Capital Flight through Abnormal Pricing, International Trade Journal XIII(4).
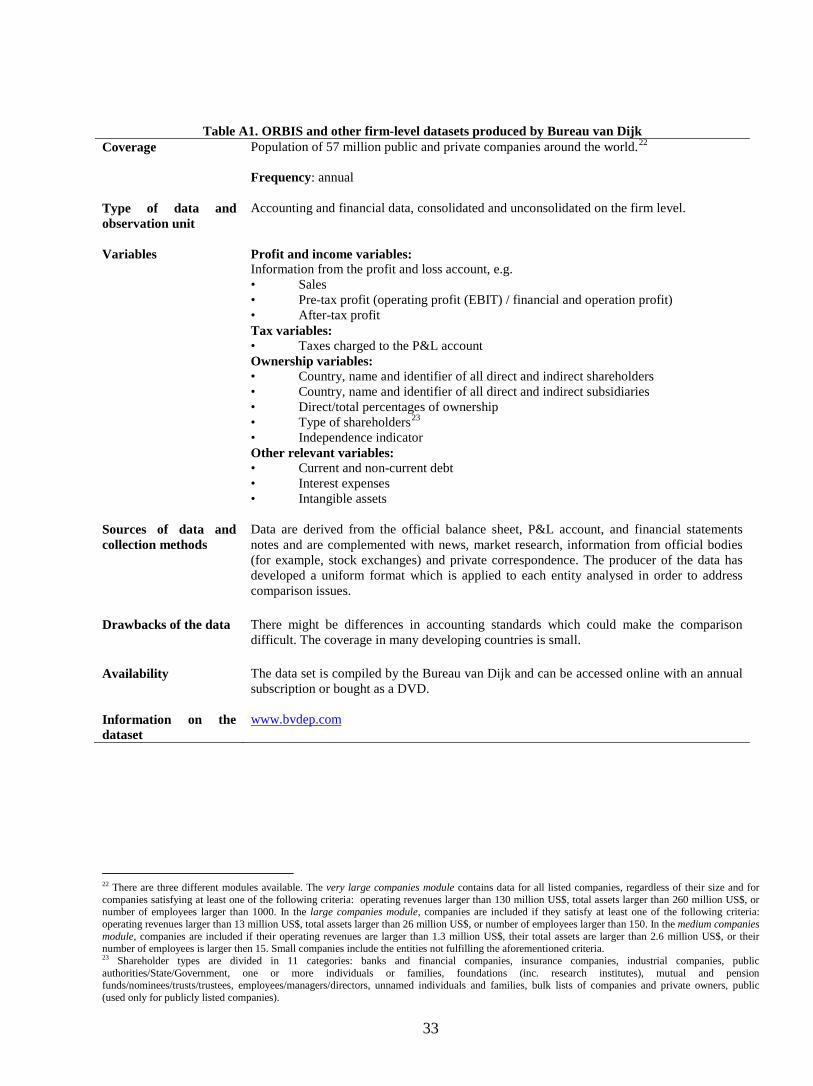
33
Table A1. ORBIS and other firm-level datasets produced by Bureau van Dijk
Coverage Population of 57 million public and private companies around the world.22
Frequency: annual
Type of data and observation unit
Accounting and financial data, consolidated and unconsolidated on the firm level.
Variables Profit and income variables: Information from the profit and loss account, e.g. • Sales • Pre-tax profit (operating profit (EBIT) / financial and operation profit) • After-tax profit Tax variables: • Taxes charged to the P&L account Ownership variables: • Country, name and identifier of all direct and indirect shareholders • Country, name and identifier of all direct and indirect subsidiaries • Direct/total percentages of ownership • Type of shareholders23
• Independence indicator
Other relevant variables: • Current and non-current debt • Interest expenses • Intangible assets
Sources of data and collection methods
Data are derived from the official balance sheet, P&L account, and financial statements notes and are complemented with news, market research, information from official bodies (for example, stock exchanges) and private correspondence. The producer of the data has developed a uniform format which is applied to each entity analysed in order to address comparison issues.
Drawbacks of the data There might be differences in accounting standards which could make the comparison difficult. The coverage in many developing countries is small.
Availability The data set is compiled by the Bureau van Dijk and can be accessed online with an annual subscription or bought as a DVD.
Information on the dataset
www.bvdep.com
22 There are three different modules available. The very large companies module contains data for all listed companies, regardless of their size and for companies satisfying at least one of the following criteria: operating revenues larger than 130 million US$, total assets larger than 260 million US$, or number of employees larger than 1000. In the large companies module, companies are included if they satisfy at least one of the following criteria: operating revenues larger than 13 million US$, total assets larger than 26 million US$, or number of employees larger than 150. In the medium companies module, companies are included if their operating revenues are larger than 1.3 million US$, their total assets are larger than 2.6 million US$, or their number of employees is larger then 15. Small companies include the entities not fulfilling the aforementioned criteria. 23 Shareholder types are divided in 11 categories: banks and financial companies, insurance companies, industrial companies, public authorities/State/Government, one or more individuals or families, foundations (inc. research institutes), mutual and pension funds/nominees/trusts/trustees, employees/managers/directors, unnamed individuals and families, bulk lists of companies and private owners, public (used only for publicly listed companies).

34
Table A2. COMPUSTAT Database
Coverage Compustat Global: non-US and non-Canadian publicly traded companies in more than 80 countries, representing 90 per cent of the world’s market capitalisation. Frequency: annual and quarterly
Type of data Financial and accounting data, consolidated and unconsolidated.
Variables Profit and income variables Information from the profit and loss account, e.g. • Pre-tax earnings • After-tax earnings • Sales from foreign operations to unaffiliated foreign customers Tax variables • Total tax expenses • Cash taxes paid • Foreign taxes paid Other relevant variables • R&D expenditures • Current debt and long-term debt (total, issuance, reduction) • Interest expenses • Exports to unaffiliated foreign customers
Sources of data and collection methods
The producer of the dataset employ original company sources by extracting financial information, removing reporting biases and reconciling data discrepancies. It standardise data by financial statement and by specific data item definition, preparing information that is broadly comparable across companies, industries, time periods and sectors.
Drawbacks of the data Not possible to link parent data with subsidiaries. Only listed companies? The coverage in many developing countries is small. Good coverage of Asian countries.
Availability Created and sold by Standard and Poor’s.
Information on the dataset www.compustat.com
Note Standard and Poor’s also sells the Compustat Global Financial Service file which contains information on the Income Statement, the balance sheet and the flow of funds for financial companies.
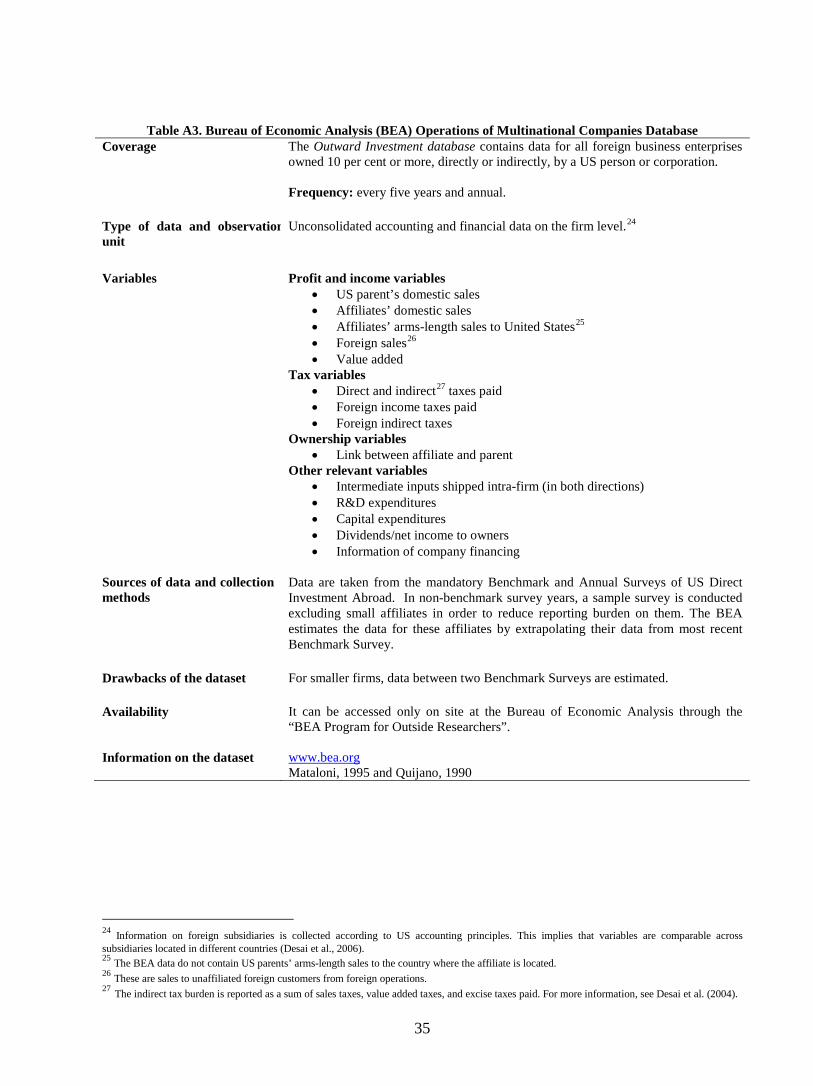
35
Table A3. Bureau of Economic Analysis (BEA) Operations of Multinational Companies Database Coverage The Outward Investment database contains data for all foreign business enterprises
owned 10 per cent or more, directly or indirectly, by a US person or corporation. Frequency: every five years and annual.
Type of data and observation unit
Unconsolidated accounting and financial data on the firm level.24
Variables Profit and income variables
• US parent’s domestic sales • Affiliates’ domestic sales • Affiliates’ arms-length sales to United States25
• Foreign sales
26
• Value added
Tax variables • Direct and indirect27
• Foreign income taxes paid taxes paid
• Foreign indirect taxes Ownership variables
• Link between affiliate and parent Other relevant variables
• Intermediate inputs shipped intra-firm (in both directions) • R&D expenditures • Capital expenditures • Dividends/net income to owners • Information of company financing
Sources of data and collection methods
Data are taken from the mandatory Benchmark and Annual Surveys of US Direct Investment Abroad. In non-benchmark survey years, a sample survey is conducted excluding small affiliates in order to reduce reporting burden on them. The BEA estimates the data for these affiliates by extrapolating their data from most recent Benchmark Survey.
Drawbacks of the dataset For smaller firms, data between two Benchmark Surveys are estimated.
Availability It can be accessed only on site at the Bureau of Economic Analysis through the “BEA Program for Outside Researchers”.
Information on the dataset www.bea.org Mataloni, 1995 and Quijano, 1990
24 Information on foreign subsidiaries is collected according to US accounting principles. This implies that variables are comparable across subsidiaries located in different countries (Desai et al., 2006). 25 The BEA data do not contain US parents’ arms-length sales to the country where the affiliate is located. 26 These are sales to unaffiliated foreign customers from foreign operations. 27 The indirect tax burden is reported as a sum of sales taxes, value added taxes, and excise taxes paid. For more information, see Desai et al. (2004).

36
Table A4. Deutsche Bundesbank Microdatabase on Direct Investment (MiDi)
Coverage Foreign-owned firms based in Germany and directly and indirectly owned foreign affiliates of German parent companies. Time period: Panel data are available from 1996. From 1989 to 2001, only semi-aggregated data by country and (or) by sector are available. Frequency: annual
Type of data and observation unit
Unconsolidated (and sometimes consolidated) balance sheet data on the firm level
Variables Profit and income variables • Profit and loss after tax and before dividend distributions Ownership variables • Link between affiliate and parent Other relevant variables • Liabilities to shareholders and (or) affiliates • Total balance sheet of affiliates and parent • Shares in the assets and liability positions of the non-residents
Sources of data and collection methods
According to the Foreign Trade and Payments Regulation (Außenwirtschaftsverordnung) and the Law on Foreign Trade and Payments (Außenwirtschaftsgesetz), foreign-owned firms based in Germany have to submit answers to an annual stock survey organized by the Deutsche Bundesbank if the enterprise has a balance sheet total of more than €3 million in which a non-resident (or several economically linked non-residents) holds 10 per cent or more of the shares or voting rights, directly or indirectly. Reports are also required if foreign-owned branches or permanent establishments located Germany have operating assets in excess of €3 million. German-owned enterprises have to report their foreign direct investments if either the capital shares or voting rights in the foreign affiliate exceed directly or indirectly some threshold (10 per cent starting in 2002) and (or) the balance sheet total of the foreign affiliate is above a thresholds (3 million EUR starting in 2002).
Drawbacks of the data Data for the foreign parent are scarce: information is restricted to the economic sector and the country in which the firm is active. There are neither income statement items, except for after tax balance sheet profits, or tax data. Threshold for mandatory reporting of data varies over time and therefore the number of firms available every year varies before 2002.
Availability Data are confidential and available only on site at the Research Centre of the Deutsche Bundesbank Central Office in Frankfurt.
Information on the data Lipponer (2008)

37
Table A5. UK Office of National Statistics Annual Inquiry into Foreign Direct Investment (AFDI) Coverage Foreign affiliates of UK entities (Outward Inquiry). It covers all UK firms engaging in
FDI and their directly held foreign affiliates if the investor holds at least 10 per cent of the capital of the recipients. Frequency: annual
Type of data and observation unit
Information on financial flows on the firm level
Variables Profit and income variables • Subsidiary or branch net profit and loss • Subsidiary or branch net earnings Tax variables • Subsidiary tax credits • Subsidiary tax refunds Ownership variables • Link between UK parent and foreign affiliate or branch • Parent identificator which (partly) allows to identify group linkages • Percentage owned Other relevant variables • Interest (net, received, paid) • Branch/head office debt from and to the United Kingdom • Subsidiary interest payment • Subsidiary dividends payment
Sources of data and collection methods
Data are collected through survey forms sent to the head of enterprise groups in the United Kingdom. Firms are sampled from different registers, including HM Customs & Revenue, Dunn & Bradstreet’s “Worldbase” system, and ONS inquiries on Acquisitions & Mergers. The largest firms all receive the survey forms every year, while only a proportion of the smaller firms do.
Drawbacks of the data Information on FDI is not always entered promptly, depending on when the Office of National Statistics learns about the investment from various sources. There are no income statement items, except for after tax balance sheet profits. Only information on directly held affiliates. Only information on “flow” variables, no information on “stock” variables (e.g. investment size).
Availability Data are confidential and available only on site at the Office of National Statistics in London or Newport.
Information on the data www.ons.gov.uk
Note Through the enterprise group reference, the AFDI can be linked to the Annual Respondents Database (ARD) to derive more balance sheet and P&L account information on the domestic- and foreign-owned establishments based in the United Kingdom. Information in ARD includes turnover, costs of intermediate inputs, number of employees, labour costs.

38
Table A6. US Firm-level tax returns Coverage All companies filing tax returns in the United States.
Frequency: annual
Type of data and observation unit Tax return data on the firm level
Variables Profit and income variables: • Income of US parent • Income of controlled foreign company (CFC) Tax variables: • Income taxes paid at the US parent • Foreign taxes paid at the subsidiary Other relevant variables: • Inter-company transactions • R&D expenditures of the parent
Sources of data and collection methods
Data are taken directly from US tax returns Forms 1120, 1118 and 5471. The former is the basic parent corporate income tax return. The second is the form used to claim a foreign tax, and the latter contains the CFC’s income, foreign taxes paid, and transactions with related parties, including the parent company.
Availability Data are confidential and not available to the general public.
Information on the dataset Grubert and Mutti, 2000

39
Table A7. Other firm-level datasets available
Country Name of Dataset Coverage
France Liaison financières (LIFI), annual mandatory survey developed by the Institute National de la Statistique et des Etudes Economiques (INSEE).
Private enterprises with 20 or more employees.
Italy Reprint Database developed at the Department of Economics and Production of the Politecnico di Milano with the support of the ICE (National Institute for Foreign Trade) and CNEL (the Italian National Council for Economy and Labour).
Mining and manufacturing firms based in Italy and controlled by foreign companies or foreign entities controlled by Italian companies.
Japan Annual Survey on Trends in Business Activities of Foreign Affiliates in Japan & on Japanese Investors and their Foreign Affiliates carried out by the Enterprise Statistics Division, Research and Statistics Department and the International Business Affairs Division, Industrial Policy Bureau, MITI.
Majority foreign-owned firms based in Japan (excluding financial, insurance and real estate sector) and Japanese investors abroad.
Sweden Surveys on Swedish owned enterprises abroad conduced by NUTEK.
All Swedish groups having subsidiaries abroad with more than one employee.
Repeated survey (every 4/5 years) prepared by the Research Institute of Industrial Economics (IUI).
Manufacturing Swedish companies with 50 or more employees.

40

41

42

Oxford University Centre for Business Taxation
Working Paper Series
WP10/12 Fuest, Clemens and Nadine Riedel, Tax Evasion and Tax Avoidance inDeveloping Countries: The Role of International Profit Shifting
WP10/11 Wildasin, David E., State Corporation Income Taxation: An EconomicPerspective on Nexus
WP10/10 Becker, Johannes and Marco Runkel, Corporate tax regime and interna-tional allocation of ownership
WP10/09 Simpson, Helen, How do firms’ outward FDI strategies relate to theiractivity at home? Empirical evidence for the UK
WP10/08 Voget, Johannes, Headquarter Relocations and International Taxation
WP10/07 Devereux, Michael P. and Simon Loretz, Evaluating Neutrality Propertiesof Corporate Tax Reforms
WP10/06 Davies, Ronald B. and Lourenco S. Paz, Tariffs Versus VAT in the Pres-ence of Heterogeneous Firms and an Informal Sector
WP10/05 Finke, Katharina, Heckemeyer, Jost H., Reister Timo and ChristophSpengel, Impact of Tax Rate Cut Cum Base Broadening Reforms on Het-erogeneous Firms - Learning from the German Tax Reform 2008
WP10/04 Koh, Hyun-Ju and Nadine Riedel, Do Governments Tax AgglomerationRents?
WP10/03 Dischinger, Matthias and Nadine Riedel, The Role of Headquarters inMultinational Profit Shifting Strategies
WP10/02 Vrijburg, Hendrik and Ruud A. de Mooij, Enhanced Cooperation in anasymmetric model of Tax Competition
WP10/01 Bettendorf, Leon, van der Horst, Albert, de Mooij, Ruud A. and HendrikVrijburg, Corporate tax consolidation and enhanced cooperation in theEuropean Union
WP09/32 Bettendorf, Leon, Devereux, Michael P., van der Horst, Albert, Loretz,Simon and Ruud A. de Mooij, Corporate tax harmonization in the EU
WP09/31 Karkinsky, Tom and Nadine Riedel, Corporate Taxation and the Choiceof Patent Location within Multinational Firms
WP09/30 Becker, Johannes and Clemens Fuest, Transfer Pricing Policy and theIntensity of Tax Rate Competition

WP09/29 de la Feria, Rita, VAT and the EC Internal Market: The Shortcomings ofHarmonisation
WP09/28 Damjanovic, Tatiana and David Ulph, Tax Progressivity, Income Distri-bution and Tax Non-Compliance
WP09/27 Grubert, Harry, MNC Dividends, Tax Holidays and the Burden of theRepatriation Tax: Recent Evidence
WP09/26 Grubert, Harry, Foreign Taxes, Domestic Income, and the Jump in theShare of Multinational Company Income Abroad
WP09/25 Maffini, Giorgia, Tax Haven Activities and the Tax Liabilities of Multi-national Groups
WP09/24 Bach,Laurent and Nicolas Serrano-Velarde, The Power of Dynastic Com-mitment
WP09/23 Dischinger, Matthias and Nadine Riedel, There’s No Place Like Home:The Profitability Gap between Headquarters and their Foreign Subsidiaries
WP09/22 Ulph, David, Avoidance Policies - A New Conceptual Framework
WP09/21 Ulph, Alistair and David Ulph, Optimal Climate Change Policies WhenGovernments Cannot Commit
WP09/20 Maffini, Giorgia and Socrates Mokkas, Profit-Shifting and Measured Pro-ductivity of Multinational Firms
WP09/19 Devereux, Michael P., Taxing Risky Investment
WP09/18 Buettner, Thiess and Georg Wamser, Internal Debt and Multinationals’Profit Shifting - Empirical Evidence from Firm-Level Panel Data
WP09/17 Arulampalam, Wiji, Devereux, Michael P. and Giorgia Maffini, The DirectIncidence of Corporate Income Tax on Wages
WP09/16 Keuschnigg, Christian and Evelyn Ribi, Profit Taxation and Finance Con-straints
WP09/15 Shaviro, Daniel N., Planning and Policy Issues raised by the Structure ofthe U.S. International Tax Rules
WP09/14 Karkinsky, Tom and Nadine Riedel, Corporate Taxation and the Choiceof Patent Location within Multinational Firms
WP09/13 Koh, Hyun-Ju and Nadine Riedel, Assessing the Localization Pattern ofGerman Manufacturing & Service Industries - A Distance Based Approach
WP09/12 Loretz, Simon and Padraig J. Moore, Corporate Tax Competition betweenFirms
WP09/11 Desai, Mihir A. and Dhammika Dharmapala, Dividend Taxes and Inter-national Portfolio Choice