t; de angelis, m h; dikic, i (2010). cin85 regulates
TRANSCRIPT

University of ZurichZurich Open Repository and Archive
Winterthurerstr. 190
CH-8057 Zurich
http://www.zora.uzh.ch
Year: 2010
CIN85 regulates dopamine receptor endocytosis and governsbehaviour in mice
Shimokawa, N; Haglund, K; Hölter, S M; Grabbe, C; Kirkin, V; Koibuchi, N; Schultz,C; Rozman, J; Hoeller, D; Qiu, C H; Londoño, M B; Ikezawa, J; Jedlicka, P; Stein, B;
Schwarzacher, S W; Wolfer, D P; Ehrhardt, N; Heuchel, R; Nezis, I; Brech, A;Schmidt, M H H; Fuchs, H; Gailus-Durner, V; Klingenspor, M; Bogler, O; Wurst, W;
Deller, T; de Angelis, M H; Dikic, I
Shimokawa, N; Haglund, K; Hölter, S M; Grabbe, C; Kirkin, V; Koibuchi, N; Schultz, C; Rozman, J; Hoeller, D;Qiu, C H; Londoño, M B; Ikezawa, J; Jedlicka, P; Stein, B; Schwarzacher, S W; Wolfer, D P; Ehrhardt, N; Heuchel,R; Nezis, I; Brech, A; Schmidt, M H H; Fuchs, H; Gailus-Durner, V; Klingenspor, M; Bogler, O; Wurst, W; Deller,T; de Angelis, M H; Dikic, I (2010). CIN85 regulates dopamine receptor endocytosis and governs behaviour inmice. The EMBO Journal, 29(14):2421-2432.Postprint available at:http://www.zora.uzh.ch
Posted at the Zurich Open Repository and Archive, University of Zurich.http://www.zora.uzh.ch
Originally published at:Shimokawa, N; Haglund, K; Hölter, S M; Grabbe, C; Kirkin, V; Koibuchi, N; Schultz, C; Rozman, J; Hoeller, D;Qiu, C H; Londoño, M B; Ikezawa, J; Jedlicka, P; Stein, B; Schwarzacher, S W; Wolfer, D P; Ehrhardt, N; Heuchel,R; Nezis, I; Brech, A; Schmidt, M H H; Fuchs, H; Gailus-Durner, V; Klingenspor, M; Bogler, O; Wurst, W; Deller,T; de Angelis, M H; Dikic, I (2010). CIN85 regulates dopamine receptor endocytosis and governs behaviour inmice. The EMBO Journal, 29(14):2421-2432.

CIN85 regulates dopamine receptor endocytosis and governsbehaviour in mice
Abstract
Despite extensive investigations of Cbl-interacting protein of 85 kDa (CIN85) in receptor traffickingand cytoskeletal dynamics, little is known about its functions in vivo. Here, we report the study of amouse deficient of the two CIN85 isoforms expressed in the central nervous system, exposing a functionof CIN85 in dopamine receptor endocytosis. Mice lacking CIN85 exon 2 (CIN85(Deltaex2)) showhyperactivity phenotypes, characterized by increased physical activity and exploratory behaviour.Interestingly, CIN85(Deltaex2) animals display abnormally high levels of dopamine and D2 dopaminereceptors (D2DRs) in the striatum, an important centre for the coordination of animal behaviour.Importantly, CIN85 localizes to the post-synaptic compartment of striatal neurons in which it co-clusterswith D2DRs. Moreover, it interacts with endocytic regulators such as dynamin and endophilins in thestriatum. Absence of striatal CIN85 causes insufficient complex formation of endophilins with D2DRsin the striatum and ultimately decreased D2DR endocytosis in striatal neurons in response to dopaminestimulation. These findings indicate an important function of CIN85 in the regulation of dopaminereceptor functions and provide a molecular explanation for the hyperactive behaviour ofCIN85(Deltaex2) mice.
1
Supplementary information
CIN85 regulates dopamine receptor endocytosis and governs
behavior in mice
Noriaki Shimokawa 1, 2, #, Kaisa Haglund 1, 3, 4 #, Sabine M Hölter 5, Caroline Grabbe 1,
Vladimir Kirkin 1, Noriyuki Koibuchi 2, Christian Schultz 6,7, Jan Rozman 8,9, Daniela
Hoeller 1, Chun-Hong Qiu 2, Marina B Londoño 2, Jun Ikezawa 2, Peter Jedlicka 6,
Birgit Stein 1, Stephan W Schwarzacher 6, David P Wolfer 10, Nicole Ehrhardt 8,9,
Rainer Heuchel 11,12, Ioannis Nezis 3,4, Andreas Brech 3,4, Mirko HH Schmidt 1,
Helmut Fuchs 9, Valerie Gailus-Durner 9, Martin Klingenspor 8, Oliver Bogler 13,
Wolfgang Wurst 5, Thomas Deller 6, Martin Hrabé de Angelis 9 and Ivan Dikic 1,14,*

2
Supplementary Materials and Methods
Reagents and antibodies
The rabbit polyclonal anti-CIN85 (CT) antibody was raised against a C-terminal
synthetic peptide of human CIN85 (1:1000 for WB) (Kowanetz et al., 2003), the
affinity purified rabbit polyclonal anti-ratCIN85 antibody (SETA) (1:100 for IF) was
described previously (Chen et al., 2000), the mouse monoclonal anti-synaptophysin
antibody (clone 7.2, 1:200 for IF) was from Synaptic Systems (Göttingen, Germany),
the sheep polyclonal anti-PSD-95 antibody (1:200 for IF) from Zymed Laboratories
(San Francisco, CA), the rabbit polyclonal anti-PSD-95 (1:100 for WB), the rabbit
polyclonal anti-Endophilin (H-300), the goat polyclonal anti-Dynamin II (C-18) and
the goat polyclonal anti-Glutamate receptor-2 (1:1000, N-19) antibodies were from
Santa Cruz Biotechnology (San Francisco, CA), the mouse monoclonal anti-PSD-95
antibody (VAM-PS001, 1:1000 for WB) from StressGen Biotechnologies Corp.
(Victoria, Canada), the rabbit polyclonal anti-D2DR antibody (1:1000 for WB,
AB5084P) from Millipore (Temecula, CA), the rabbit monoclonal D1DR antibody
(1:2000 for WB, 2192-1) from Epitomics Inc (Burlingame, CA), the rabbit polyclonal
anti-β-actin antibody (1:1,000 for WB, #4967) from Cell Signaling Technology
(Beverly, MA), the rabbit anti-p62 antibody (1:1000 for WB) from BIOMOL, the
mouse monoclonal anti-Flag (M5) from Sigma and the rabbit anti-GFP from BD
Living Colours (1:1500 for WB). The Alexa Fluor® 568 phalloidin, goat-anti-rabbit-
Alexa Fluor® 488 and goat-anti-mouse-Alexa 546 were from Molecular Probes
(Eugene, OR).
Preparation and culture of primary neuronal cultures
Primary hippocampal neuronal cultures were prepared from newborn (P0-P1) Sprague
Dawley rats as described (Schultz et al., 2006). Reagents were purchased from Sigma
and from Becton-Dickinson (Heidelberg, Germany) unless otherwise stated. Cells
were maintained in DMEM supplemented with 10% NU®-serum, 2% B-27
supplement (50× concentrate), 2 mM L-glutamine, 20 mM D-glucose, 26.2 mM
sodium bicarbonate. Hippocampal neurons were plated onto poly-L-lysine-coated
cover slips and cultured for 14 days. Primary rat striatal neuronal cultures were
prepared from a striatum of an E18 Sprague Dawley rat according to the instructions

3
of the provider (BrainBits, Springfield, IL). Cells were maintained in Neurobasal
medium (Invitrogen) supplemented with 2% B-27 supplement (Invitrogen) and 0.5
mM Glutamax (Invitrogen). Striatal neurons were plated onto poly-D-lysine-coated
cover slips and cultured for 14 days. Primary mouse striatal neurons were prepared as
described previously (Brami-Cherrier et al., 2002) with some modifications. Briefly,
striata were dissected out from newborn mice within 6 hrs after birth. The
hemispheres were cut with scissors and folded over, to visualize the striatum. To
avoid cortical contamination, the striatal surface close to the neocortex was
systematically eliminated. The striata from mice with identical genotypes were pooled
together and treated with TrypLE Express (stable trypsin replacement, Invitrogen) for
15 min at 37 ºC and then mechanically dissociated by gently pipetting. After
decantation for 5 min, cells were collected by centrifugation at 1,000 g for 3 min. Cell
pellets were resuspended in Neurobasal medium supplemented with B-27 (Invitrogen),
2 mM L-glutamine, 100 µg/ml Kanamycin sulfate (Invitrogen) and then plated onto
Ø10 cm poly-L-lysine-coated dishes (Asahi Techno Glass, Tokyo Japan) at a density
of 1 x 10⁷ cells per dish. The cultures were then maintained at 37 ºC in a humidified
atmosphere of 95% air and 5% CO2 and were used after 10 days in vitro (DIV), when
most of the cells were of neuronal phenotype.
Immunofluorescence of primary neurons
Primary rat hippocampal or striatal neuronal cultures were rinsed, fixed with 4% PFA
and permeabilized with 0.1% Triton X-100. Fixed cultures were incubated with
primary antibodies for 24 h at room temperature (RT). Bound antigens were detected
by sequential addition of secondary antibodies conjugated with either Alexa Fluor®
488 or Alexa Fluor® 546 (Molecular Probes, Invitrogen) for 90 min at RT. Alexa
Fluor® 568 or rhodamine phalloidin (Molecular Probes, Invitrogen) were added for 1
h at RT. Stained cells were mounted in an antifade medium (Dako, Glostrup,
Denmark). For confocal microscopy, a laser-scanning microscope (LSM 510, Carl
Zeiss MicroImaging, Wetzlar, Germany) equipped with a krypton/argon and
helium/neon laser was used.
Isolation of synaptosomes and post-synaptic density fractions
Synaptosomes isolation from the whole mouse brain was performed using a
modification of the previously described Percoll step-gradient method (Huang et al.,

4
2002; Trounce et al., 2000). In short, whole brains from wild-type mice were isolated,
washed in ice-cold PBS and transferred to chilled synaptosome isolation buffer (SIB,
0.32 M sucrose, 2 mM HEPES, pH 7.4, 0.25 mM EDTA) supplemented with 0.25
mM DTT. After 10 min, the tissue was homogenized in 9 vol. SIB using 10 strokes in
a Dounce homogenizer. The 10% homogenate was centrifuged at 1000 g for 10 min
to remove nuclei and unbroken cells. The supernatant was again subjected to
centrifugation at 14,000 g for 10 min to pellet mitochondria and synaptosomes. The
resulting pellet was resuspended in SIB and layered onto a discontinuous Percoll
gradient (23%, 15%, 10%, and 3%) prepared in SIB. The gradient was centrifuged at
32,500 g for 15 min using maximum acceleration and deceleration times. The
synaptosome-containing fraction at the 15/23% Percoll interface was collected and
washed several times with PBS (12,000 g, 5 min). Washed synaptosome preparations
were stored at -20°C or used immediately for analysis. For preparation of PSD (post
synaptic density) fractions, freshly isolated mouse brain synaptosomes were further
processed essentially as described (Cho et al., 1992). Briefly, synaptosomes were
resuspended in ice-cold 50 mM HEPES pH 7.4, 2 mM EDTA supplemented with
protease inhibitors and 0.5% Triton X-100. Following rotation at 4°C for 15 min
samples were centrifuged at 32,000 g for 20 min. Pellets were resuspended in ice-cold
50 mM HEPES pH 7.4, 2 mM EDTA supplemented with protease inhibitors and
subjected to another round of 0.5% Triton X-100 extraction. PSDs were then pelleted
at 200,000 g for 20 min and resuspended in Laemmli sample buffer for analysis.
PSD fractions from dissected mouse striata were isolated according to Carlin
et al. (Carlin et al., 1980) using sucrose density gradient centrifugation. Briefly, 30
mouse striata were homogenized in ice-cold 0.32 M sucrose buffer containing 1 mM
Hepes, 1 mM MgCl2, 1 mM NaHCO3, protease inhibitors and a phosphatase inhibitor
(1 mM PMSF, 2.5 µg/ml leupeptin, 10 µg/ml aprotinin and 1 mM sodium
orthovanadate), and centrifuged at 700g for 10 min. The supernatant was centrifuged
at 1,300 g for 15 min to yield crude synaptosomes and mitochondria. The pellets were
resuspended in ice-cold 0.32 M sucrose buffer, loaded onto a sucrose gradient of 0.85,
1.0, and 1.2 M, and centrifuged at 82,000 g for 2 h. The synaptosome fraction isolated
between 1.0 and 1.2 M was centrifuged at 32,000 g for 30 min. The resulting pellet
was resuspended and centrifuged at 200,000 g for 2 h over a sucrose gradient of 1.0,
1.5, and 2.0 M. The PSD fraction was obtained as the pellet after centrifugation of the
fraction between 1.5 and 2.0 M at 200,000 g for 30 min.
5
Generation of the CIN85Δex2 knockout mice and genotyping
Exon 2 of the mouse CIN85 locus was removed by homologous recombination.
Briefly, the 5’ and 3’ homology regions were cloned from a mouse genomic DNA
library (mouse ES cell line ESGS, Lamda Dash II) and subcloned into the pGNA
vector at the SmaI and ApaI sites, respectively. The targeting vector was linearized by
SmaI digestion and introduced into SvJ/129 ES cells by electroporation. G418-
resistant ES cell clones were analyzed for integration of the targeting vector and
removal of exon 2 by PCR and Southern blot (Figures 2B and S3C). Two double-
positive ES cell clones (D3 and D8) were injected into C57BL/6 blastocysts that were
implanted to pseudopregnant foster mothers. They gave birth to four male chimeras,
two of which were germline transmitters used to establish the CIN85Δex2 knockout
mouse line. All experiments were performed with mice that had been backcrossed at
least ten times to C57BL/6 mice. PCR screening of ES cells was performed using the
primers described in Figures 2A and S3B and the Expand Long Template PCR
System (Roche). For Southern blot, the probe was labeled with 32P-dCTP using the
Rediprime kit (Amersham Pharmacia Biotech) and genomic ES cell DNA was
digested with HindIII. The DNA was transferred to Hybond N+ membranes
(Amersham Pharmacia Biotech) by alkaline transfer and membranes were blocked for
30 minutes in hybridization buffer (1.5xSSPE/10%PEG6000/7%SDS) with 10 µg/ml
salmon sperm DNA. Hybridization of membranes was performed with 2x10⁶ cpm/ml
for 3 hours at 65°C and after washing in 1xSSC/0.1%SDS, the membranes were
exposed to a PhosphoImager plate (Fujifilm, Tokyo, Japan) and analyzed with a
PhosphoImager (BAS 2000, Fujifilm). Genotyping PCR was performed using
genomic DNA from mouse tails. Mouse tails (1-3 mm) were placed in 100 µl
digestion buffer (67 mM Tris, pH 8.8, 166 µM NH4Cl2, 6.5 mM MgCl2, 0.5 % Triton
X-100, 1% β-Mercapto-Ethanol) and boiled for 4 min at 95°C. 1 mM Proteinase K
was added and digestion was performed at 55°C for 1 h. Proteinase K was inactivated
for 4 min at 95°C. The samples were centrifuged for 10 min at 13,000 rpm and 2 µl of
the supernatant were used in the PCR. Primer annealing sites and sequences are
described in Figures 2A and S3A, respectively. Typical genotyping results of
homozygous CIN85Δex2 knockout mice, heterozygous mice and wild-type animals are
shown in Figure 2C. Detailed PCR conditions are available upon request. The

6
expression of the lacZ gene was unfortunately not detected in the CIN85Δex2 knockout
mice.
Immunoprecipitation, GST pull-down and Western blot
Animals were anesthetized with diethyl ether and sacrificed by cervical translocation.
For analysis of the distribution of CIN85 in the mouse or rat brain, whole brains were
removed from wild-type mice, rats or CIN85Δex2 knockout mice, washed in ice-cold
PBS and divided into the following regions: cerebellum, cerebral cortex, hippocampus,
midbrain, striatum and brainstem. The divided tissues were homogenized in ice-cold
lysis buffer containing 10 mM Tris-HCl (pH 7.4), 0.15 M NaCl, 1 mM EDTA, 0.1%
SDS, 0.1% Na-deoxycholate, 1% NP-40 with protease inhibitors (1 mM
phenylmethylsulfonyl fluoride, 2.5 mg/ml of leupeptin, 10 mg/ml of aprotinin), and 1
mM sodium orthovanadate (a phosphatase inhibitor). The tissue lysates were cleared
by centrifugation for 15 minutes at 16,200 g at 4°C and protein concentrations in the
lysates were measured (Bradford protein assay, Bio-Rad, Hercules, CA). Equal
amounts of protein were resolved by SDS-PAGE, transferred to a nitrocellulose filter
and immunoblotted with anti-CIN85 (CT) antibody (1:1000). CIN85 was detected by
chemiluminescence with an ECL system (GE Healthcare, Buckinghamshire, UK) and
visualized with a Lumi-Imager imaging analyzer (Roche, Basel, Switzerland). Blots
were reprobed with an anti-β-actin antibody (1:1,000, #4967, Cell Signaling
Technology, Beverly, MA) to monitor the protein quantity. For analysis of CIN85
levels in brain, thymus and spleen from wild-type and CIN85Δex2 knock-out mice,
organs were homogenized in ice-cold lysis buffer (50 mM Hepes, 150 mM NaCl, 1
mM EDTA, 1 mM EGTA, 10% glycerol, 1% Tx-100 (w/v), 25 mM NaF, 10 µM
ZnCl2, pH 7.5 supplemented with protease inhibitors (1 mM PMSF, 2.5 µg/ml
leupeptin, 10 µg/ml aprotinin) and 1 mM sodium orthovanadate. Lysates were cleared
by centrifugation and protein concentrations measured as above. From each tissue,
200 µg of protein were subjected to immunoprecipitation with anti-CIN85 (CT)
antibodies, followed by SDS-PAGE and Western blot with anti-CIN85 (CT)
antibodies as described (Haglund et al., 2004). For co-immunoprecipitations between
CIN85, D2DR and endocytic regulators, 25 µg of protein of the synaptosome
fractions of mouse striata were mixed with the various antibodies and incubated end-
over-end at 4°C for 90 min. Protein A or G Sepharose 4 fast-flow beads (GE
7
Healthcare) were added for 1 hr and subsequently washed three times in ice-cold lysis
buffer. For the GST-pulldown assay, a construct encoding Flag-tagged p62 was
transfected into HEK293T cells. 48 hours after transfection, cells were lysed and the
cleared lysates incubated overnight with recombinant proteins comprising the
indicated fragments of CIN85 fused to GST, coupled to Glutathione Sepharose beads.
Co-immunoprecipitation of Flag-CIN85 and GFP-p62 expressed in HEK293T cells
was performed with anti-Flag antibodies. After washing, proteins were eluted and
analyzed by SDS-PAGE and Western blot as described (Haglund et al., 2004).
HPLC-EC detection of striatal dopamine contents
Sample preparations were carried out according to the procedure of Kim et al (Kim et
al., 1987). Dissected striata of adult mice were weighed before homogenizing with
perchloric acid (0.2 M) in Teflon/glass homogenizer. The homogenate was
centrifuged at 4 ºC for 15 min at 20,000 g. The supernatant was adjusted to pH 3 with
1M sodium acetate and filtered through a Ø 0.45 µm filter before injecting into the
HPLC system. Dopamine levels and the levels of its metabolites were determined
using HPLC coupled to electro-chemical (HPLC-EC) detection. Ten microliter
samples were injected into a reverse-phase analytical column (Eicompak, SC-5ODS,
3 mm inner diameter, Eicom Corp., Kyoto, Japan) perfused at a flow rate of 0.5
ml/min with a mobile phase containing: 83% 0.1M citric acid-sodium acetate buffer
(pH 3.5), 17% methanol, 170 mg/l octyl sodium sulfate, 5 mg/l EDTA·2NA.
Dopamine, its metabolites and other neurotransmitters were detected with a graphite
carbon detector electrode maintained at +750 mV relative to an Ag/AgCl reference
electrode. The output from the working electrode was integrated using EPC-300
software (Eicom). Chromatographic peaks were identified/quantified by reference to
known concentrations of standards.
Dopamine receptor biotinylation and endocytosis assay
Receptor biotinylation and endocytosis assays were performed by the cleavable biotin
method (Vickery & von Zastrow, 1999) and using a commercial kit (Cell Surface
Protein Isolation Kit, Pierce, Rockford, IL). Primary striatal neurons at 10 DIV were
treated with D2DR agonist dopamine (hydrochloride, 20 µM, Sigma) for 5, 15, 30 or
60 min. After ligand stimulation, cell surfaces were biotinylated with 250 µg/ml

8
cleavable Sulfo-NHS-SS-Biotin for 30 min at 4 °C. Cells were subsequently lysed
with a detergent and disrupted by sonication. Biotin-labelled proteins were isolated
with NeutrAvidin agarose beads from the cell lysates. The bound proteins were
released by incubation with SDS-PAGE sample buffer containing 50 mM DTT.
Biotinylated proteins were resolved by SDS-PAGE, transferred to a nitrocellulose
filter and immunoblotted with an anti-D2DR antibody (1:1000, AB5084P, Millipore,
Temecula, CA) or with an anti-D1DR antibody (1:2000, 2192-1, Epitomics Inc,
Burlingame CA). D1DRs and D2DRs were detected by chemiluminescence with an
ECL system (GE Healthcare, Buckinghamshire, UK). The intensity of immunoblots
was quantified by image analysis software (LumiAnalyst, Roche, Basel, Switzerland).
Blots were re-probed with an anti-Glutamate receptor-2 antibody (1:1000, sc-7611,
Santa Cruz) to monitor of the quantity and integrity of cell surface protein.
Behavioral sensitization to D2DR agonist
Behavioral sensitization was performed essentially as described previously (Culver
and Szechtman, 2003; Culver et al., 2008) with minor modifications. Each group of
mice was administered D2DR agonist quinpirole (hydrochloride, 0.5 mg/kg, s.c.
Sigma, St Louis, MO), or saline every other day until a total of eight injection were
completed. Immediately, following each quinpirole or saline injection, mice were
placed in actimeter (LE8811, 450 x 450 x 200 mm; Panlab S.L., Barcelona, Spain)
and their locomotor activity recorded for 30 min. After the last (8th) measurement of
locomotor activity, mice were euthanized by decapitation and brains rapidly removed,
frozen in liquid nitrogen, and stored –80 °C.
Receptor radioligand binding assay
Binding of the D2DR antagonist [3H]spiperone was performed essentially as
described previously (Heinrich et al., 2006; Levant et al., 1992) with some
modifications. The striatum was dissected from each brain and homogenized for 30 s
with a Polytron (PT1300D, Kinematica AG, Switzerland) setting 15,000 rpm in ice-
cold homogenization buffer (2 mM MgCl2, 50 mM Tris, pH 7.4) and centrifuged at
4,800 g for 10 min. The resulting pellets were resuspended in homogenization buffer
(membrane suspension) and the protein contents were determined by the Lowry
method. Membrane suspensions (12.5 µg/250 µl) were incubated with 50 µl
[3H]spiperone (specific activity 109 Ci/mmol, Batch No.170, GE Healthcare,
9
Buckinghamshire, UK), 150 µl assay buffer (50 mM Tris-HCl, 1.5 mM CaCl2, pH
7.4), and 50 µl H2O or 50 µl D-butaclamol (1 µM, hydrochloride) for nonspecific
binding. Concentrations of [3H]spiperone ranging from 10 pM to 500 pM were used.
Binding was performed end-over-end for 30 min at 37°C. Unbound ligand was
removed by centrifugation (4,800 g, 10 min) and the bound radioactivity in the pellet
was measured with a liquid scintillation counter (LSC-3050, Aloka, Tokyo, Japan).
Specific binding was obtained by subtracting the binding in the presence of D-
butaclamol from the total binding obtained in the presence of vehicle only.
Experiments were performed three times in duplicate.
German Mouse Clinic screen
Mouse mutants entering the GMC are examined in a primary screen according to the
following standard workflow (see Figure S4A) (Gailus-Durner et al, 2005). After the
mice arrive at the GMC, they are acclimatized in the new environment for one week
and subjected to a morphological whole-body analysis in the Dysmorphology Screen.
One week later the Behavior Screen assesses locomotor, exploratory, emotional and
social behaviour as well as object recognition memory by the modified Hole Board
test. At the age of nine weeks, a comprehensive anatomical inspection using X-ray is
performed by the Dysmorphology Screen. Neurological functions are examined by
SHIRPA in the Neurology Screen. One week later the Eye Screen scans for
morphological and functional alterations of the eye by slit lamp biomicroscopy and
electroretinography. When the mice are 12 weeks old, blood is taken, and samples are
distributed to the blood-based screens Clinical Chemistry, Immunology, Allergy.
More than 60 parameters are analysed for clinical-chemical, haematological and
immunological deviations. One week later, pain perception is investigated by the hot
plate test in the Nociceptive Screen. Two weeks after testing of the first blood sample,
a second sample is taken to confirm possible alterations. Spontaneous breathing
pattern is explored by Hole Body Plethysmography in the Lung Function Screen.
Organs are taken for future expression profiling on request by the Molecular
Phenotyping Screen. All other animals go through a DXA scan for bone density and
body composition in the Dysmorphology Screen, which is followed by measurement
of altered body weight regulation, body temperature and energy balance in the
10
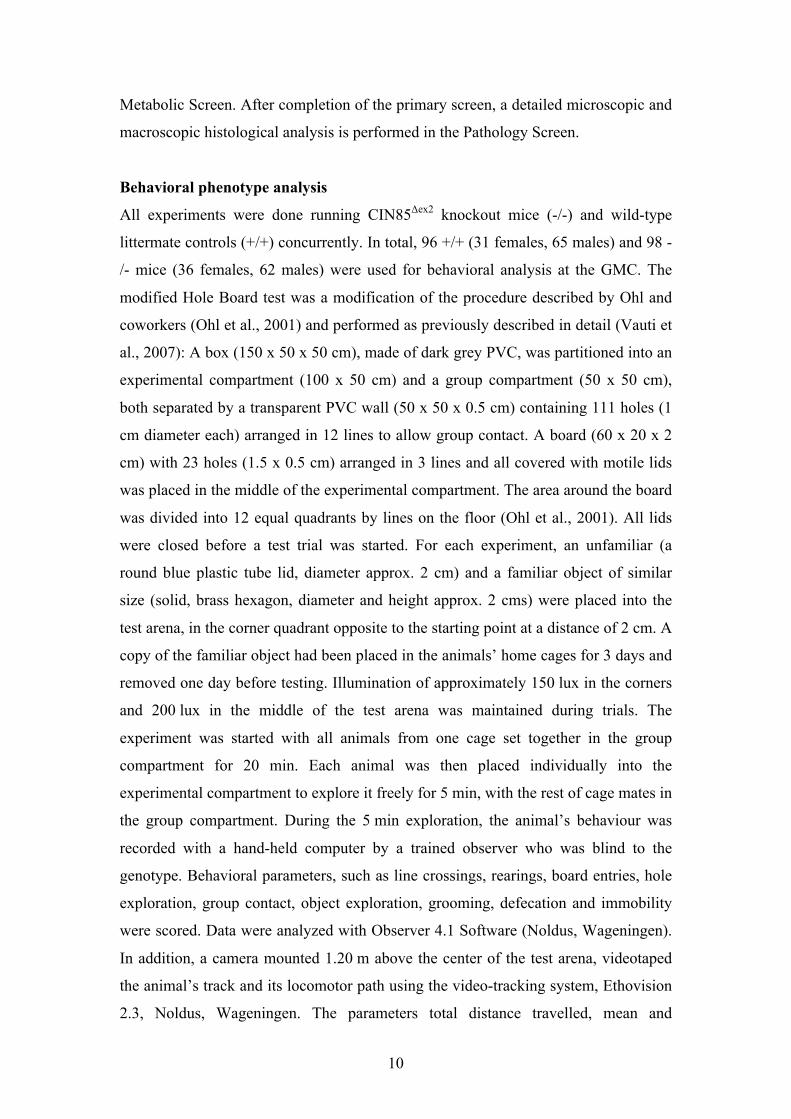
Metabolic Screen. After completion of the primary screen, a detailed microscopic and
macroscopic histological analysis is performed in the Pathology Screen.
Behavioral phenotype analysis
All experiments were done running CIN85Δex2 knockout mice (-/-) and wild-type
littermate controls (+/+) concurrently. In total, 96 +/+ (31 females, 65 males) and 98 -
/- mice (36 females, 62 males) were used for behavioral analysis at the GMC. The
modified Hole Board test was a modification of the procedure described by Ohl and
coworkers (Ohl et al., 2001) and performed as previously described in detail (Vauti et
al., 2007): A box (150 x 50 x 50 cm), made of dark grey PVC, was partitioned into an
experimental compartment (100 x 50 cm) and a group compartment (50 x 50 cm),
both separated by a transparent PVC wall (50 x 50 x 0.5 cm) containing 111 holes (1
cm diameter each) arranged in 12 lines to allow group contact. A board (60 x 20 x 2
cm) with 23 holes (1.5 x 0.5 cm) arranged in 3 lines and all covered with motile lids
was placed in the middle of the experimental compartment. The area around the board
was divided into 12 equal quadrants by lines on the floor (Ohl et al., 2001). All lids
were closed before a test trial was started. For each experiment, an unfamiliar (a
round blue plastic tube lid, diameter approx. 2 cm) and a familiar object of similar
size (solid, brass hexagon, diameter and height approx. 2 cms) were placed into the
test arena, in the corner quadrant opposite to the starting point at a distance of 2 cm. A
copy of the familiar object had been placed in the animals’ home cages for 3 days and
removed one day before testing. Illumination of approximately 150 lux in the corners
and 200 lux in the middle of the test arena was maintained during trials. The
experiment was started with all animals from one cage set together in the group
compartment for 20 min. Each animal was then placed individually into the
experimental compartment to explore it freely for 5 min, with the rest of cage mates in
the group compartment. During the 5 min exploration, the animal’s behaviour was
recorded with a hand-held computer by a trained observer who was blind to the
genotype. Behavioral parameters, such as line crossings, rearings, board entries, hole
exploration, group contact, object exploration, grooming, defecation and immobility
were scored. Data were analyzed with Observer 4.1 Software (Noldus, Wageningen).
In addition, a camera mounted 1.20 m above the center of the test arena, videotaped
the animal’s track and its locomotor path using the video-tracking system, Ethovision
2.3, Noldus, Wageningen. The parameters total distance travelled, mean and

11
maximum velocity, turns, turn angles, angular velocity, meander, maximum duration
on board and distance to wall were calculated from the videotrack data. After the 5
min observation time, the test animal is returned to the group compartment and the
test arena carefully cleaned with a disinfectant. Validation experiments of this test
protocol did not reveal any consistent change of the last animal in a group to be tested
to that of the first. All data are reported as mean + SEM and statistically analysed
either by two-tailed unpaired Student’s t-test or two-factorial Analysis of Variance
(ANOVA). The accepted level of significance was p < 0.05. Data of both sexes were
pooled.
Acute behavioral effects of dopamine receptor ligands
Three cohorts of CIN85Δex2 mutant and wild-type littermate control mice of both
genders were used to assess the acute effects of dopamine receptor ligands on
locomotor activity in three separate experiments, one for each ligand, all purchased
from Merck (VWR), Germany. Animals were either administered the D2DR agonist
quinpirole (hydrochloride, 0.01 mg/kg) or vehicle, the D2DR antagonist haloperidol
(0.5, 0.25 or 0.05 mg/kg) or vehicle, or the D1DR antagonist SCH23390 (0.03 mg/kg)
or vehicle, each time intraperitoneally injected 30 min before being subjected to the
modified Hole Board Test.
Metabolic screen
In the metabolic screen, 27 animals were analyzed (control: seven males and seven
females, CIN85Δex2 mutants: seven males and six females). They were first fed under
ad libitum conditions for two weeks, followed by a period of food restriction to 60%
of ad libitum for seven days to analyze adaptive responses of metabolism. The
metabolic screen focuses on investigation of metabolic demands of mice determining
daily body weight, energy uptake, metabolizable energy and body temperature and
adaptive capacity of metabolic processes. During the different feeding regimes body
weight, food consumption (Fcon), rectal temperature (Tre), daily feces production (Fec),
energy uptake (Eup), energy content of the feces (Efec), metabolizable energy (Emet)
and the food assimilation coefficient (Fass) were recorded. The separation of mice in
single cages allowed collection of feces in three day intervals. Samples of lab chow
and feces (~1 g) were dried at 60°C for two days, homogenized in a coffee grinder
and squeezed to a pill for determination of energy content in a bomb calorimeter (IKA

12
Calorimeter C7000) based on dry measurement principle. Energy uptake is
determined as the product of food consumed and the caloric value of the food. To
obtain metabolizable energy (Emet) the energy content of feces and urine (2% of Eup;)
(Drozdz, 1975) were subtracted from energy uptake. In the statistical analysis all
values are presented as means ± SEM. Two-way-ANOVA (SigmaStat, Jandel
Scientific) was used to test for effects of the factors genotype and sex. The Tukey test
was applied for post hoc multiple comparisons.
Surgery and Electrophysiology
Adult male CIN85∆ex2 knockout mice and wild-type littermates (3 months old) were
anesthetized with an intraperitoneal injection of urethane (Sigma, 1.2 g/kg body
weight; supplemental doses of 0.2-0.8 g/kg as needed). All recordings were made
blind to the genotype. Temperature of mice was monitored constantly through a rectal
probe and kept at 37 °C using a heating pad. A bipolar stimulation electrode (NE-200,
0.5 mm tip separation, Rhodes Medical Instruments, USA) was positioned in the
angular bundle of the perforant path (PP, 2.1 mm lateral and 3.8 mm posterior to the
bregma, 1.8 mm from the brain surface). Tungsten recording electrodes
(TM33A10KT, World Precision Instruments, Sarasota, FL) were placed in the granule
cell layer (GCL) of the dentate gyrus (0.8 mm lateral and 1.6 mm posterior to the
bregma, 1.8 mm from the brain surface (Kienzler et al., 2006)). Voltage pulses (6 - 20
V, 0.1 ms duration) were generated by a Grass S88 stimulator with a Grass stimulus
isolation unit (Quincy, MA). Potentials were amplified by a Grass preamplifier (P55)
and displayed on a computer. Evoked granule cell field excitatory postsynaptic
potentials (fEPSPs) were acquired with a Digidata 1320A interface (sampling rate 10
kHz) and analyzed using pClamp 8.1 software (Molecular Devices, Union City, CA).
Test responses for LTP experiments were evoked by monophasic stimuli set at an
intensity to provide a population spike of 0.5 - 1.5 mV before the tetanus. The
responses were collected every 10 s for 30 min prior to LTP induction and the
averages of 12 consecutive sweeps were used for measurements. Tetanic stimulation
to induce LTP consisted of 4 trains of 15 pulses (0.1 ms width, 200 Hz, 20 V) with an
intertrain interval of 10 s (Freudenthal et al., 2004). A baseline fEPSP slope was
calculated from the average of responses over the 10 min prior to tetanic stimulation.
The potentiation of the fEPSP slope was expressed as a percentage change relative to
the baseline. Stimulus-response relationships were determined using a range of

13
stimulation intensities from 0 to 20 V. Five to ten responses were collected at each
intensity and averaged. To assess paired-pulse facilitation (PPF) of the fEPSP
amplitude, double-pulse stimulation at intensities subthreshold for a population spike
was applied (inter-pulse intervals 15-100 ms). To study paired-pulse inhibition (PPI)
and disinhibition (PPDI) of the population spike, supramaximal double-pulse
stimulation (20 V) was used (inter-pulse intervals 15-150 ms). Five to ten paired-
pulse responses were collected at each inter-pulse interval and averaged. Differences
between groups were statistically analyzed by an unpaired 2-tailed Student’s t-test (p
< 0.05).
Analysis of learning and memory
Animals. 18 CIN85Δex2 knockout (KO) (9 females (F), 9 males (M)) and 13 wild-type
(Wt) (3 F, 10 M) mice were tested in the water-maze place navigation task and then in
the cued and contextual fear conditioning procedure. The age at beginning of the
testing was 3.9 months (3.1-4.1). 2 Wt mice were excluded from analysis of the
water-maze task. One had difficulty to swim and did not complete the task, the other
showed excessive floating and wall hugging (>4 SD from mean) and had to be
classified as non performer. Behavioral testing was carried out under the license
120/2005 issued by the Veterinary Office of the Canton of Zurich. Water-maze.
Place navigation was tested as described previously (Mohajeri et al., 2004). In brief, a
white circular pool (150 cm diameter) contained milky water (24-26°C). Acquisition
training consisted of 18 trials (6 per day, inter-trial interval 30-60 min) during which
the submerged platform (14x14 cm) was left in the same position. Trials lasted a
maximum of 120s. To monitor reversal learning, the platform was moved to the
opposite position for 2 additional days of training (6 trials per day). The first 60s of
the first and second reversal trial served as probe trials to test for spatial retention.
Animals were video-tracked at 4.2 Hz and 256x256/576x768 pixel spatial resolution
using a Noldus EthoVision 1.96/2.30/3.00 system (Noldus Information Technology,
Wageningen NL, www.noldus.com). Raw data were then transferred to public domain
software Wintrack 2.4 (www.dpwolfer.ch/wintrack) for further analysis (Wolfer et al.,
2001). Training performance was assessed using the following measures: swim path
length, escape latency, average distance to goal, Whishaw’s error adapted to mice and
pool size (% path outside a 0.1856 m wide corridor connecting release point and goal)
(Whishaw, 1985), % time spent in a 10 cm wide wall zone, number of wall contacts,

14
time spent floating (episodes of immobility or decelerations with speed minimum <
0.06 m/s), and swim speed (excluding floating episodes). Spatial retention during
probe trials was assessed using % time in quadrant, number of annulus crossings, and
time in a circular target zone comprising 12.5% of the pool surface. For repeated
measures ANOVA, the trained quadrant was compared with the average of the left
and right adjacent quadrant. The opposite quadrant was not considered because it
contained the new goal. A further measure of spatial selectivity for factorial ANOVA
was average distance to trained target (Gallagher et al., 1993). Fear conditioning.
Four mice were tested in parallel in an Actimetrics FreezeFrame video-based
Conditioned Fear System (www.actimetrics.com). The conditioning chambers
(175mm deep x 180mm wide x 280mm high) were enclosed in ventilated and sound-
attenuated cabinets and had a floor consisting of stainless steel rods permitting the
application of current. The training session consisted of a 60s pre-exposure to the
training context immediately followed by 3 parings of a 2500Hz 85dB tone (CS)
lasting 30s and co-terminating with a 2s 0.25A foot shock (US). CS/US presentations
were separated by 30s intervals. 24h after training, the mice were re-exposed to the
training chamber for 120s without activation of the CS or US (context test).
Thereafter the floor of the conditioning chamber was covered with plastic and some
bedding material and a pebble were added. The mice were pre-exposed to this
modified context for 60s which was immediately followed by a 60s CS presentation
(tone test). Freezing (absence of movement aside from respiration) was quantified
automatically by the FreezeFrame software subtracting subsequent images recorded
by the IR video cameras that were attached to the top of the conditioning chambers.
Bouts of 1.0 s were used to define % freezing and movement thresholds were set at 20
(training and context test) or 8 units (tone test). The US-context association was
assessed by comparing % freezing during pre-exposure with % freezing during the
context test. The US-CS association was evaluated by comparing % freezing during
the pre-CS and CS phases of the tone test. Additional measures were: % freezing
during context pre-exposure (unconditioned freezing to the training context), %
freezing during the first tone presentation (unconditioned freezing to the tone), %
freezing during the pre-CS phase of the tone test (generalized freezing to the new
context). Statistics. Data were analyzed using a 2-way factorial ANOVA design with
genotype and sex as between subject factors using Statview 5.0 for Windows
Software (www.statview.com, no longer sold). Where appropriate, the model was

15
complemented by within subject factors to explore the dependence of genotype
effects on place or time. The sex factor was only introduced in order to reduce
unexplained variance and to check genotype effects for sex-dependence. Main effects
of sex are not reported in the results, sex x genotype interactions were not observed.
The sex factor could not be introduced for the analysis of water-maze data because the
final Wt group contained only one female mouse. Variables known to produce
strongly skewed distributions and/or frequent outliers were subjected to a log
transformation before ANOVA analysis (floating time in the water-maze). The
significance threshold was set at 0.05. The false discovery rate (FDR) control
procedure of Benjamini and Hochberg (Benjamini, 1995) was applied to groups of
conceptually related variables within single tests to correct significance thresholds for
multiple comparisons. Potential false discoveries are marked in the table.
Supplementary References
Benjamini Y, Hochberg, Y. (1995) Controlling the false discovery rate: a practical
and powerful approach to multiple testing. J Royal Stat Soc Ser B, 57, 289-300 Brami-Cherrier K, Valjent E, Garcia M, Pages C, Hipskind RA and Caboche J (2002)
Dopamine induces a PI3-kinase-independent activation of Akt in striatal neurons: a new route to cAMP response element-binding protein phosphorylation. J Neurosci, 22, 8911-8921
Carlin RK, Grab DJ, Cohen RS and Siekevitz P (1980) Isolation and characterization of postsynaptic densities from various brain regions: enrichment of different types of postsynaptic densities. J Cell Biol, 86, 831-845
Chen B, Borinstein SC, Gillis J, Sykes VW and Bogler O (2000) The glioma-associated protein SETA interacts with AIP1/Alix and ALG-2 and modulates apoptosis in astrocytes. J Biol Chem, 275, 19275-19281.
Cho KO, Hunt CA and Kennedy MB (1992) The rat brain postsynaptic density fraction contains a homolog of the Drosophila discs-large tumor suppressor protein. Neuron, 9, 929-942
Culver KE and Szechtman H (2003) Clorgyline-induced switch from locomotion to mouthing in sensitization to the dopamine D2/D3 agonist quinpirole in rats: role of sigma and imidazoline I2 receptors. Psychopharmacology (Berl), 167, 211-218
Culver KE, Szechtman H and Levant B (2008) Altered dopamine D2-like receptor binding in rats with behavioral sensitization to quinpirole: effects of pre-treatment with Ro 41-1049. Eur J Pharmacol, 592, 67-72
Drozdz (1975) Food habits and good assimilation in mammals. Methods for Ecological Bioenergetics, 23-47
Freudenthal R, Romano A and Routtenberg A (2004) Transcription factor NF-kappaB activation after in vivo perforant path LTP in mouse hippocampus. Hippocampus, 14, 677-683
16
Gallagher M, Burwell R and Burchinal M (1993) Severity of spatial learning impairment in aging: development of a learning index for performance in the Morris water maze. Behav Neurosci, 107, 618-626
Haglund K, Ivankovic-Dikic I, Shimokawa N, Kruh GD and Dikic I (2004) Recruitment of Pyk2 and Cbl to lipid rafts mediates signals important for actin reorganization in growing neurites. J Cell Sci, 117, 2557-2568
Heinrich JN, Brennan J, Lai MH, Sullivan K, Hornby G, Popiolek M, Jiang LX, Pausch MH, Stack G, Marquis KL and Andree TH (2006) Aplindore (DAB-452), a high affinity selective dopamine D2 receptor partial agonist. Eur J Pharmacol, 552, 36-45
Huang YS, Jung MY, Sarkissian M and Richter JD (2002) N-methyl-D-aspartate receptor signaling results in Aurora kinase-catalyzed CPEB phosphorylation and alpha CaMKII mRNA polyadenylation at synapses. Embo J, 21, 2139-2148
Kienzler F, Jedlicka P, Vuksic M, Deller T and Schwarzacher SW (2006) Excitotoxic hippocampal neuron loss following sustained electrical stimulation of the perforant pathway in the mouse. Brain Res, 1085, 195-198
Kim C, Speisky MB and Kharouba SN (1987) Rapid and sensitive method for measuring norepinephrine, dopamine, 5-hydroxytryptamine and their major metabolites in rat brain by high-performance liquid chromatography. Differential effect of probenecid, haloperidol and yohimbine on the concentrations of biogenic amines and metabolites in various regions of rat brain. J Chromatogr, 386, 25-35
Kowanetz K, Szymkiewicz I, Haglund K, Kowanetz M, Husnjak K, Taylor JD, Soubeyran P, Engstrom U, Ladbury JE and Dikic I (2003) Identification of a novel proline-arginine motif involved in CIN85-dependent clustering of Cbl and down-regulation of epidermal growth factor receptors. J Biol Chem, 278, 39735-39746
Levant B, Grigoriadis DE and DeSouza EB (1992) Characterization of [3H]quinpirole binding to D2-like dopamine receptors in rat brain. J Pharmacol Exp Ther, 262, 929-935
Mohajeri MH, Madani R, Saini K, Lipp HP, Nitsch RM and Wolfer DP (2004) The impact of genetic background on neurodegeneration and behavior in seizured mice. Genes Brain Behav, 3, 228-239
Ohl F, Holsboer F and Landgraf R (2001) The modified hole board as a differential screen for behavior in rodents. Behav Res Methods Instrum Comput, 33, 392-397
Schultz C, Konig HG, Del Turco D, Politi C, Eckert GP, Ghebremedhin E, Prehn JH, Kogel D and Deller T (2006) Coincident enrichment of phosphorylated IkappaBalpha, activated IKK, and phosphorylated p65 in the axon initial segment of neurons. Mol Cell Neurosci, 33, 68-80
Trounce I, Schmiedel J, Yen HC, Hosseini S, Brown MD, Olson JJ and Wallace DC (2000) Cloning of neuronal mtDNA variants in cultured cells by synaptosome fusion with mtDNA-less cells. Nucleic Acids Res, 28, 2164-2170
Vauti F, Goller T, Beine R, Becker L, Klopstock T, Holter SM, Wurst W, Fuchs H, Gailus-Durner V, de Angelis MH and Arnold HH (2007) The mouse Trm1-like gene is expressed in neural tissues and plays a role in motor coordination and exploratory behaviour. Gene, 389, 174-185

17
Whishaw IQ (1985) Cholinergic receptor blockade in the rat impairs locale but not taxon strategies for place navigation in a swimming pool. Behav Neurosci, 99, 979-1005
Wolfer DP, Madani R, Valenti P and Lipp HP (2001) Extended analysis of path data from mutant mice using the public domain software Wintrack. Physiol Behav, 73, 745-753

Figure S1
Figure S1. CIN85 isoforms in mouse.
The mouse CIN85 gene locus is located on the X chromosome and contains 24 exons.
Together these encode multiple isoforms, which are expressed under control of a
number of distinct promoters, as indicated by arrowheads in the figure. Isoforms
regulated by the same promoter are generated through alternative splicing. The
targeting event in the CIN85Δ ex2 knockout affects the first promoter (promoter 1) and
thereby cause a specific ablation of isoforms CIN85-xl, CIN85-l and CIN85-ΔCP,
leaving the isoforms which are under control of other, downstream, promoters
unaffected. CIN85-xl and CIN85-l, the major isoforms expressed in the CNS, are
absent in brains of CIN85Δex2 knockouts. CIN85-ΔA (promoter 2) is expressed in
thymus and spleen in CIN85Δex2 mice, but is absent from brain. CIN85-m and
CIN85-s (promoter 3) are expressed in skin, CIN85-t (promoter 4) and CIN85-h
(promoter 5) in testis and heart, respectively, but neither of these isoforms are
affected in the CIN85Δex2 mice. Abbreviations; xl, extra long; l, long; ΔA, deletion of
first SH3 domain; ΔCP, deletion of central part; t, testis; h, heart; s, skin; SH3, Src
homology 3 domain; PRO, proline-rich region; CC, coiled-coil.

α-ß-actin
α-CIN85kDa
Rat, C
erebra
l Cort
ex
Mouse
, +/+,
Who
le bra
in
Mouse
, -/-, W
hole
brain
Rat, W
hole
brain
Rat, C
erebe
llum
Rat, H
ippoc
ampu
s
Rat, S
triatum
Rat, M
idbrai
n
75
50
37
Rat, B
rains
tem
Figure S2
Figure S2. CIN85 expression in rat brain.
CIN85 is expressed in all the major regions of the rat brain, including the cerebral
cortex, cerebellum, hippocampus, striatum, midbrain and brain stem. The highest
expression levels are found in the striatum, hippocampus and cerebral cortex. Whole
brain lysates from wild-type and CIN85Δex2 knockout mice were used as positive and
negative control, respectively. 15 µg of total tissue lysates were subjected to 7 %
SDS-PAGE followed by Western blot analysis with anti-CIN85 (CT) antibodies.
Equal protein loading was confirmed by immunoblotting against β-actin.
Genotyping primers Size of PCR product (kb)
WT
KO
1. AAGGAGGATGGAGGCTGGTG
3. GATGAAGGCAAGTCTATGAGGA
2. GCTGCTATTGGGCGAAGTG
3. GATGAAGGCAAGTCTATGAGGA
0.5
1.5
A
PC NC C10 D3 D4 D8 D9
4 kb3 kb
B Genotyping primers Size of PCR product (kb)
WT
KO
1. AAGGAGGATGGAGGCTGGTG
4. GGAAGACAGGGCAGAAAAACTA
2. GCTGCTATTGGGCGAAGTG
4. GGAAGACAGGGCAGAAAAACTA
3.0
4.0
P1 & P4
P2 & P4
P1 & P4
P2 & P4
P1 & P4
P2 & P4
P1 & P4
P2 & P4
P1 & P4
P2 & P4
P1 & P4
P2 & P4
P1 & P4
P2 & P4
C
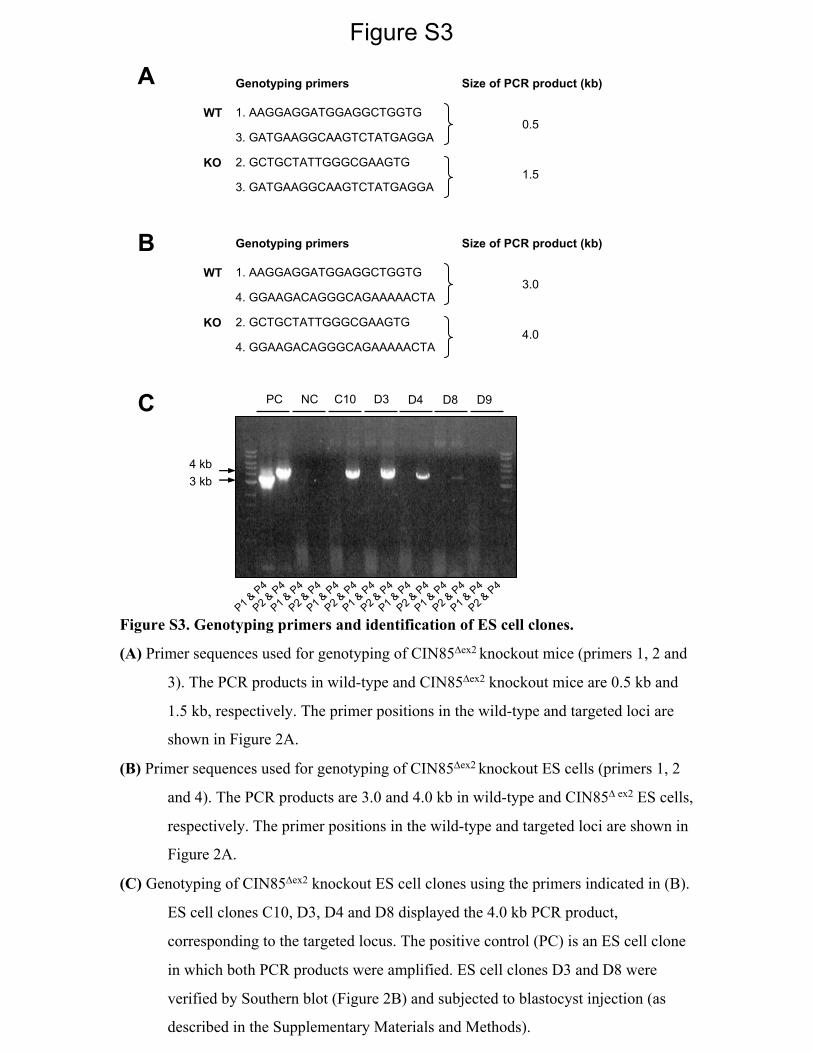
Figure S3
Figure S3. Genotyping primers and identification of ES cell clones.
(A) Primer sequences used for genotyping of CIN85Δex2 knockout mice (primers 1, 2 and
3). The PCR products in wild-type and CIN85Δex2 knockout mice are 0.5 kb and
1.5 kb, respectively. The primer positions in the wild-type and targeted loci are
shown in Figure 2A.
(B) Primer sequences used for genotyping of CIN85Δex2 knockout ES cells (primers 1, 2
and 4). The PCR products are 3.0 and 4.0 kb in wild-type and CIN85Δ ex2 ES cells,
respectively. The primer positions in the wild-type and targeted loci are shown in
Figure 2A.
(C) Genotyping of CIN85Δex2 knockout ES cell clones using the primers indicated in (B).
ES cell clones C10, D3, D4 and D8 displayed the 4.0 kb PCR product,
corresponding to the targeted locus. The positive control (PC) is an ES cell clone
in which both PCR products were amplified. ES cell clones D3 and D8 were
verified by Southern blot (Figure 2B) and subjected to blastocyst injection (as
described in the Supplementary Materials and Methods).

A
C
B
Figure S4

Figure S4. Phenotypic analysis of the CIN85Δex2 knockout mice.
(A) Overview of the screens performed by the German Mouse Clinic consortium in
order to characterise the CIN85Δex2 knockout mice. Details are described in the
Supplemental Experimental Procedures.
(B) Metabolic analysis of male and female CIN85Δex2 knockout mice (Mutants) and
wild type littermate control mice (Control). The results of the tested
parameters, including body weight, food consumption (Fcon), rectal
temperature (Tre), daily feces production (Fec), energy uptake (Eup), energy
content of the feces (Efec), metabolizable energy (Emet) and the food
assimilation coefficient (Fass), as well as analysis of statistical significance,
are shown. All values are presented as mean ± SEM. Experimental details are
described in the Supplementary Materials and Methods.
(C) A list describing the different behaviors and parameters that were tested in the
behavioral screen, e.g. the Modified Hole Board test. Parameters that were
significantly altered in the CIN85Δex2 knockout mice are indicated in red.

A
B
C
Figure S5

Figure S5. No obvious alterations in LTP and short-term synaptic plasticity in CIN85Δex2
knockout mice.
(A) In vivo electrophysiological measurements. Long-term potentiation (LTP) in the dentate
gyrus of anesthetized CIN85∆ex2 knockout mice is comparable to wild-type littermates. Shown
here is the LTP of the field excitatory postsynaptic potential (fEPSP) slope (left) and the
population spike (right), averaged for a group of mutant mice (n = 9, open circles) and wild-
type littermate controls (n = 6, filled circles). The arrow indicates the tetanic stimulation (4
trains of 15 pulses at 200 Hz, 0.1 Hz train rate). Similar potentials were recorded from a
single wild type and a single CIN85∆ex2 mouse, recorded just before (1, grey) and one hour
after (2, black) the tetanic stimulation, as shown in the insets. Calibration, 2 mV, 5 ms.
(B) Stimulus-response curves of fEPSP slopes and population spikes of wild type (+/+) and
CIN85Δex2 knockout (-/-) mice.
(C) Presynaptic short-term plasticity and GABAergic network inhibition tested by sub-
threshold (ratio of the second fEPSP amplitude to the first fEPSP amplitude) and
supramaximal (ratio of the second population spike amplitude to the first population spike
amplitude) paired-pulse stimulation of wild type (+/+) and CIN85Δex2 knockout (-/-) mice. No
significant differences were detected when comparing wild type and mutant mice in (B) and
(C). Error bars, SEM. Experimental details are described in the Supplementary Materials and
Methods.

genotype
Place navigation, training
escape latency / swim time (s) F(1,27)=0.6 ↓ nscumulative search error (m*s) F(1,27)=0.4 nsdistance to current goal (m) F(1,27)=0.5 ↓ nsWishaw's error (%) F(1,27)=0.1 nstime near wall (%) F(1,27)=0.8 ↓ nswall approaches (x) F(1,27)=0.8 ↓ ns
swim speed (m/s) F(1,27)=0.4 nstime floating (log s) F(1,27)=5.2 ↓ p<.0302 .11 !
Place navigation, probe 1
time in trained zone (% of 1st 60s) F(1,27)=2.2 ↑ nsannulus crossing index (x/m in 1st 60s) F(1,27)=0.6 ↑ nsaverage distance to target (m in 1st 60s) F(1,27)=4.6 ↓ p<.0410 .11 !
Place navigation, probe 2
time in trained zone (% of 1st 60s) F(1,27)=1.7 ↑ nsannulus crossing index (x/m in 1st 60s) F(1,27)=0.1 nsaverage distance to target (m in 1st 60s) F(1,27)=1.0 ↓ ns
Fear conditioning
freezing (%) during pre-exposure F(1,27)=0.1 nsfreezing (%) response to first CS presentation F(1,27)=0.1 nsfreezing (%) response to new context after 24h F(1,27)=0.6 ↑ ns
KO Wt
Place navigationtraining swim path (m)B
acquisition reversal
genotypens
2468
1012141618
trained
Place navigation, T1F60probe 1, quadrant time (%)C
geno x place ns
05
10152025303540
adjacent
chan
ce
Fear conditioning, 24 hfreezing to context (%)D
pre training
geno x timens
0
45
510152025303540
post training
Fear conditioning, 24hfreezing to tone (%)E
CS
geno x timens
pre CS05
1015202530354045
A
Figure S6

Figure S6. Learning and memory appear normal in CIN85Δex2 knockout mice.
(A) Summary of the parameters used to test the learning and memory abilities of
CIN85Δex2 knockout mice. Water-maze training variables were averaged across
all trials. Type I error p-values are shown for all effects and trends if <0.1,
followed by estimated effect sizes shown as partial omega squared, the
proportion of variance accounted for by genotype if only this factor were in the
design (range 0 to 1.0). Arrows pointing up and down indicate the direction of
mean differences between CIN85Δex2 knockout (KO) and wild type (Wt) if type I
error p<0.25. ! = potential false discovery according to the FDR procedure of
Benjamini and Hochberg.
(B) Swim path length during acquisition and reversal training in the water-maze place
navigation task. CIN85Δex2 knockout mice (KO) and wild-type (Wt) mice were
indistinguishable with respect to performance level as well as learning rates. In
both groups relocation of the platform caused a transient drop of performance
indicating that they had oriented their swimming strategy towards a specific
platform position (genotype F(1,27)=0.892 ns, time F(14,378)=11.822 p<.0001,
genotype x time F(14,378)=1.458 ns).
(C) Time spent in the target versus average of adjacent quadrants during the 60s probe
trial after the acquisition of the place navigation task. Independently of genotype
the mice showed a modest but significant preference for the trained quadrant
(place F(1,27)=10.859 p<.0028, genotype x place F(1,27)=0.356 ns).
(D) Contextual fear conditioning. Freezing in the conditioning chamber prior to and 24h
after training. Irrespective of genotype the mice showed a robust freezing
response to the training context (genotype F(1,27)=0.481 ns, time F(1,27)=48.760
p<.0001, genotype x time F(1,17)=0.429 ns).
(E) Cued fear conditioning. Freezing before and after CS (tone) presentation in a new
context 24h after training. Irrespective of genotype the mice showed a robust
freezing response to the CS (genotype F(1,27)=0.069 ns, time F(1,27)=71.855
p<.0001, genotype x time F(1,17)=0.010 ns).

Figure S7
Figure S7. Impaired D2 dopamine receptor (D2DR) endocytosis in CIN85Δex2 neurons.
The amount of D2DR remaining at the cell surface following 1 h of dopamine
stimulation was measured in wild-type and CIN85Δex2 knockout striatal neurons by a
radioligand-binding assay, using the tritium-labeled D2DR antagonist 3H-Spiperone.
The amount of 3H-Spiperone remaining in the membrane fraction indicates that
roughly 50% of the D2DRs remain on the cell surface after dopamine stimulation in
wild-type striatal neurons (+/+), in comparison to 80% in the CIN85Δex2 knockout mice
(-/-).
DA (min) – 60 – 60
50
20
10
25
15
30
[3 H]S
pipe
rone
-D2D
Rbi
ndin
g co
unts
(x10
2dp
m)
+/+ -/-

Figure S8
Figure S8. CIN85 interacts with p62.
Upper panel: Schematic organisation of p62, depicting the conserved PB1, ZnF and
UBA domains. In close proximity to the UBA domain, p62 contains a consensus
CIN85 binding sequence; PxxxPR. Left lower panel: Flag-tagged p62 interacts with
all the SH3 domains of CIN85 (SH3A, SH3B, SH3C and SH3 (A+B+C) domains).
Right lower panel: Flag-tagged CIN85 co-immunoprecipitates with GFP-tagged p62
protein in HEK293T cells. In this experiment a truncated version of p62, lacking the
PB1 domain, was used in order to avoid oligomerisation. Experimental details are
found in the Supplementary Materials and Methods.