t airbag material is polyester (100 g/km) ... low cg in aircraft - airbags are folded (g) unaffected...
TRANSCRIPT

::, ,. ·~ :._,;;' -~ t
'··~··--·

;r-- -.
. ... _·,:--
..
Approved for public release; distribution tmlimited.
Citation of trade n~a in this report does not constitute an official indorsement or approval of the uee of such items.
Destroy this report when no longer needed. Do not return it to the originator •
• •
' .
'
_.,

UNCLASSIFIEDSECURITY CLASSIFICATION OF THIS PAGE (WMn Dae EnitteR
REPORT DOCUMENTATION PAGE BEFRED MCUP TUGNBEFORE COMIPLE71NO FR
I. REPORT NUMBER J 2. GOVT ACCESSION NO 3. RECIPIENT'S CATALOG NUMBER
NATICK/TR--82/026 Ad A I 2 4. TITLE (and Subtitle) S. TYPE OF REPORT & PERIOD COVERED
BALLOON-SKIRT AIRBAGS AS AIRDROP SHOCKABSORBERS: PERFORMANCE IN VERTICAL DROPS June 1980 -July 1981
6. PERFORMING ORG. REPORT NUMBER
7. AUTHOR(e) S. CONTRACT OR GRANT NUMBER(o)
William NykvistN/A
9. PERFORMING ORGANIZATION NAME AND ADDRESS 10. PROGRAM ELEMENT. PROJECT, TASKAREA & WORK UNIT NUMBErRS
US Army Natick Research & Development Laboratories
Aero-Mechanical Engineering LaboratoryNatick, MA 01760 6.2, 1 L162210D2830M1
It. CONTROLLING OFFICE NAME AND ADDRESS 12. REPORT DATEUS Army Natick Research & Development Laboratories December 1981Aero-Mechanical Engineering Laboratory 13. NUMBER OF PAGES
Natick, MA 01760 4614. MONITORING AGENCY NAME & ADDRESS(U diflrent fram Controllind Office) 15. SECURITY CLASS. (of this repoct)
UNCLASSIFIED15m. DECL ASSIFI CATION/DOWNGRADING
SCHEDULE
IS. DISTRIBUTION STATEMENT (of this Report)
Approved for public release, distribution unlimited.
17. DISTRIBUTION STATEMENT (of the abstract entered in Block 20, It dIffermit from Report) 0#
19. KEY WORDS (Continue on reverse side if neceary and Identify by block number)
AIR BAGS LANDING IMPACTAERIAL DELIVERY IMPACTAIRDROP OPERATIONS SHOCK ABSORBERS
!= AserACT sev eyv s, N aseeem, d Iderlly block rmatbe)
A set of 8 balloon-skirt airbags was obtained from Bertin & Cie, France. These airbags weredesigned to dissipate impact energy of the 8 m/s vertical impact due to parachute airdrop,and provide a ground slide feature to dissipate horizontal velocity. A test platform was designedand fabricated. Forty-three vertical drops were carried out, with mass ranging from 970 to2390 kg and impact velocity from 5.5 to 8 m/s. Platform position and acceleration, and
selected airbag pressures were recorded vs time for each drop; high speed motion picture coverage\
t : 1473 EDlOWo.FNovss IS OamLET , UNCLASSIFIEDSECURITY CLASSIFICATION OF THIS PAGE ( IRt Date Eantew

UNCLASSIFIEDSCCURtTY CLASSFICATION OF THIS PA g abin DOM im4
20. ABSTRACT (cont'd):
provided for many drops. Variation of platform acceleration with load mass and Impactvelocity was determined for two choke sizes. The airbags exhibited premature skirt crushwhich would adversely affect ground slide. Average platform acceleration levls ranged from3.6 to 8.7 G, but peek accelerations were generally twice as high, ranging from 6.8 to 17.7
'
SE UNCLA IFIED89CURITY CLASSIFICAION OF THIS PA8E(Wmas Date Eaten.Q

PREFACE
The present system of airdropping military vehicles and equipment incorporates paperhoneycomb to mitigate impact shock. Paper honeycomb is an effective energy absorber buthas several drawbacks which make it difficult to use. The balloon-skirt airbag, or atterroglineur,developed in France, has the potential to replace paper honeycomb. In the 1970's our attmnptsto obtain detailed airbag engineering and test data met with little success. In order to determinethe performance and limitations of the balloon-skirt airbag, a set of eight were procured fromthe developer, Bertin & Cie, France, for in-house evaluation.
The author wishes to acknowledge the test work done by the Experimental Analysis andDesign Division of AMEL. The skilled efforts of John Buckley, Mike Hope, John Lanza, andJohn Lupien, in providing the test data that is the foundation of this report, are appreciated.
Accssiton For_
U.,anvGuflc ed 0
--- Dl'trbton---UU 0 , DI t i ''p;ct,
aV
1-,,r ....

TABLE OF CONTENTS
Pop
Preface 1
List of Figures 2
List of Tables 6
Introduction 7
Literature 8
Platform Design and Instrumentation 13
Test Plan and Procedure 19
Test Results and Discussion 21
Test Chronology and Data Summary 21
Detailed Drop Analysis 27
Airbag Crush Behavior 30
Airbag Pressure Variations 31
Platform Acceleration 31
Conclusions 36
References 38
Appendix - Test Data 39
f
3
PA ii nn4@ n . ....
LIST OF FIGURES
pops
Figure 1. Cross-Sectional View of Balloon-Skirt Airbag 7
Figure 2. Typical Data for Three Airbags (from Reference 1) g
Figure 3. Pressure and Force vs. Displacement, Goodyear Airbag 10(from Reference 2)
Figure 4. Four Bag Test Data for Cylindrical Airbag (from Reference 3) 11
Figure 5. Anchoring of Steel Weights 13
Figure 6. Platform Design 14
Figure 7. Platform Instrumentation 16
Figure 8. Airbag Platform: Two Overall Views 17
Figure 9. Airbag Platform: Mid-Drop and Camera View 18
Figure 10. Range of Platform Acceleration for Various Impact 20Velocities (from Reference 6)
Figure 11. Mass Range for Two Choke Diameters, for Acceleration 7 G, 20Impact Velocity 5 to 8 m/s (from Reference 6)
Figure 12. Airbag Mounting Hardware 25
Figure 13. Abrasions on Skirt 1 25
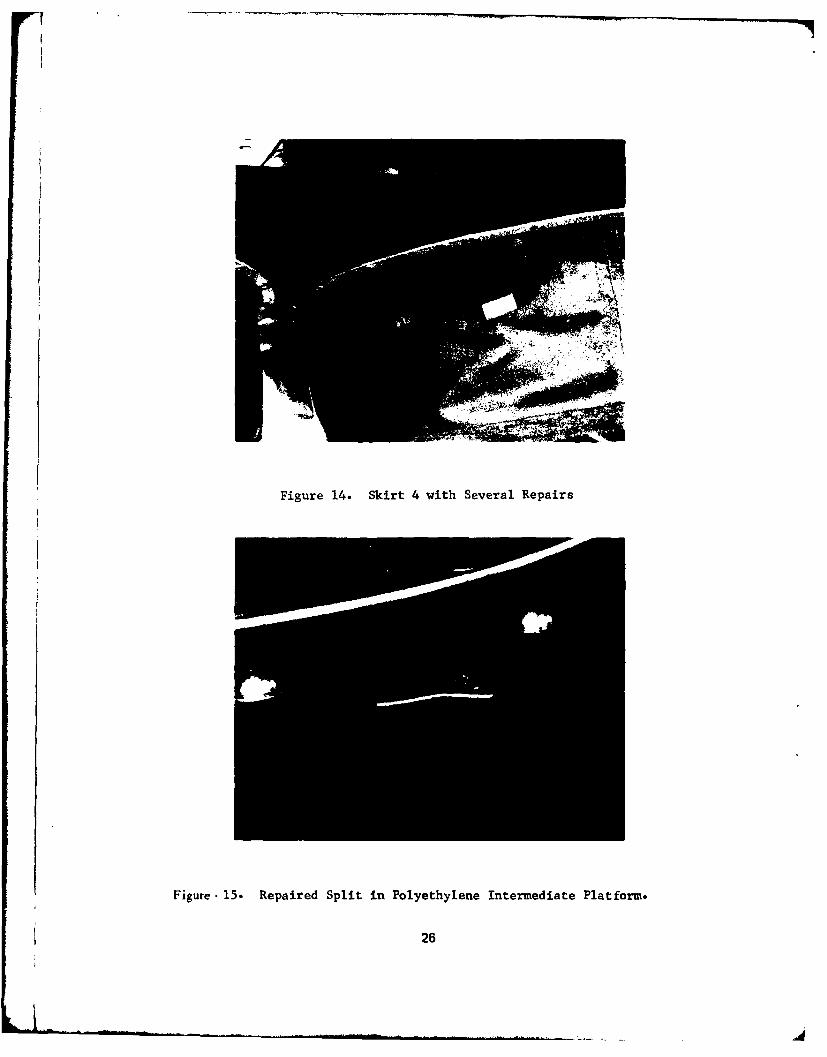
Figure 14. Skirt 4 with Several Repairs 26
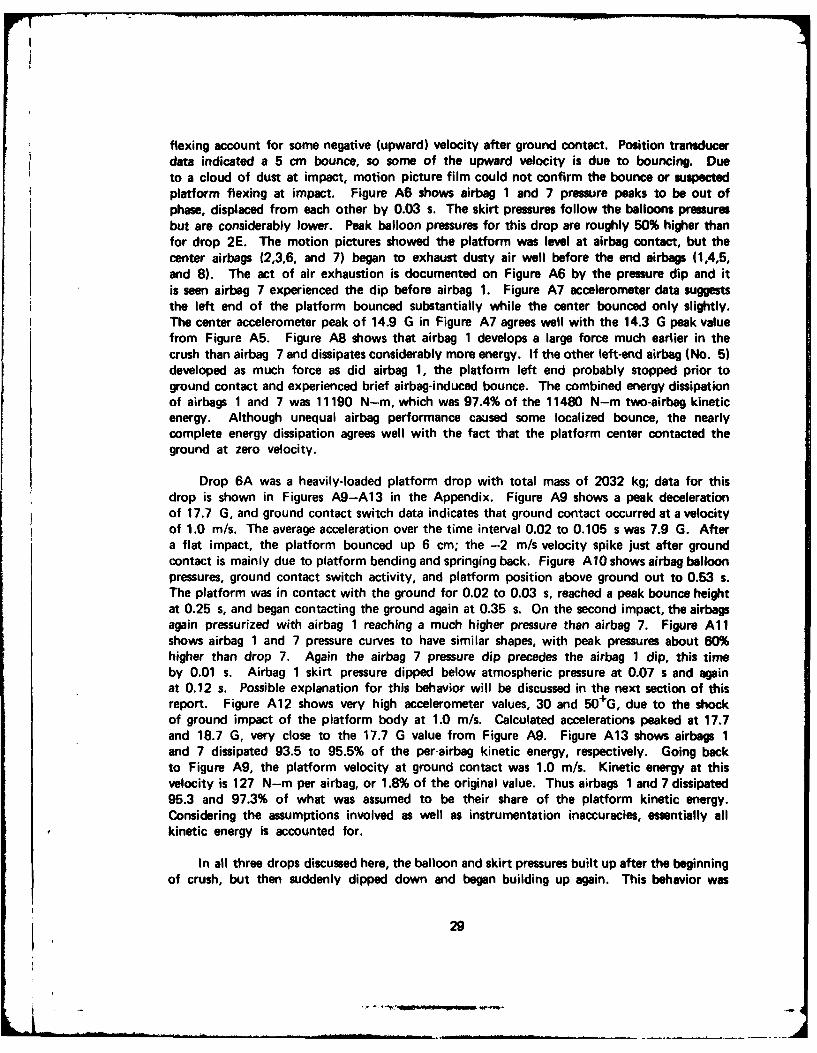
Figure 15. Repaired Split in Polyethylene Intermediate Platform 26
Figure 16. Successive Stages of Airbag Crush, End View 30
Figure 17. Airbag Balloon Pressure Comparison: Drops 2B, 20, 4C 32
Figure 18. Platform Peak and Average Accelerations at Impact Velocity of 347.4 m/s, Variation with Total Mass
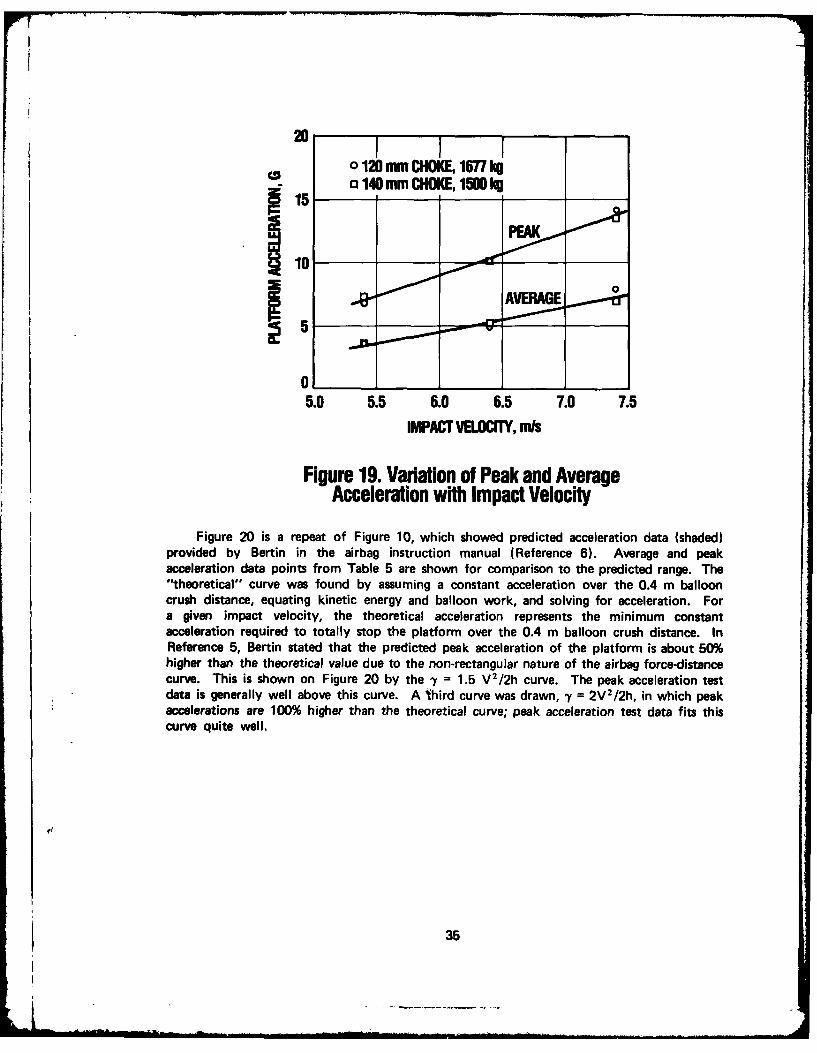
Figure 19. Variation of Peak and Average Acceleration with Impact 35Velocity
4
LIST OF FIGURES (cont'd)Pag,
Figure 20. Platform Acceleration vs. Impact Velocity; Comparison of 36Test Data, Reference 5 Theoretical and Practical Curves,and Reference 6 Predicted Range
Figure Al. Velocity vs. Time, Drop 2E 40
Figure A2. Airbag Pressure vs. Time, Drop 2E 40
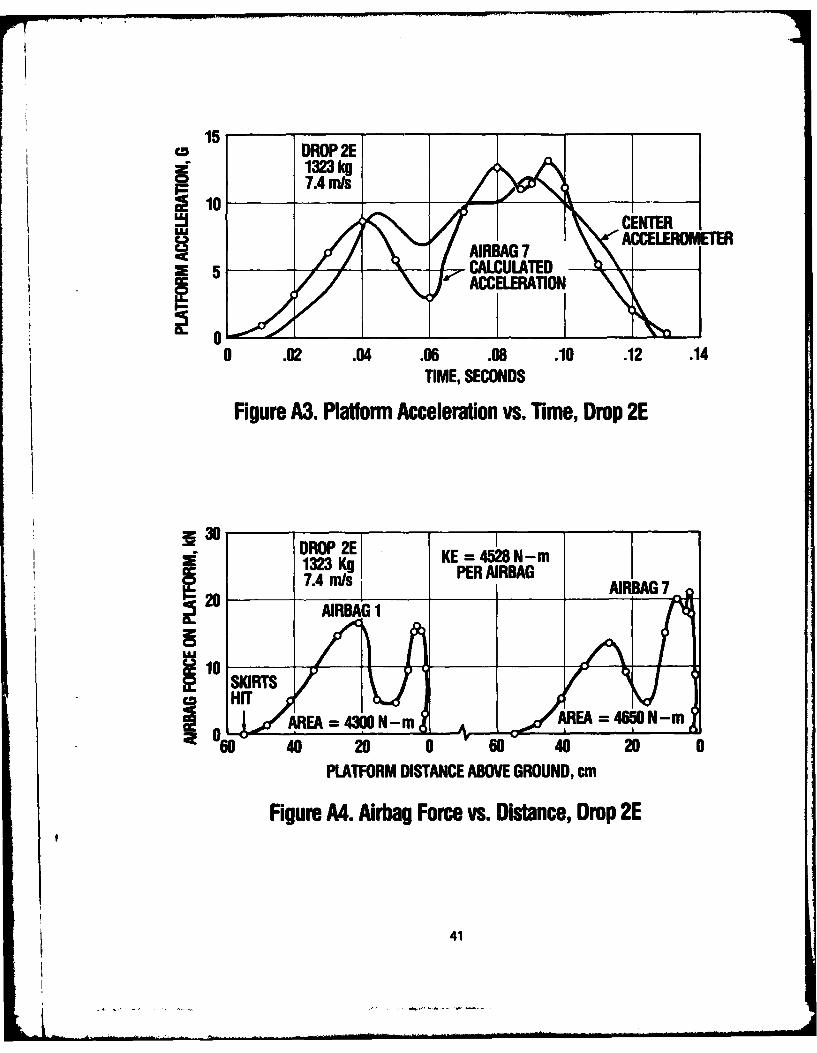
Figure A3. Platform Acceleration vs. Time, Drop 2E 41
Figure A4. Airbag Force vs. Distance, Drop 2E 41
Figure A5. Velocity vs. Time, Drop 7 42
Figure A6. Airbag Pressure vs. Time, Drop 7 42
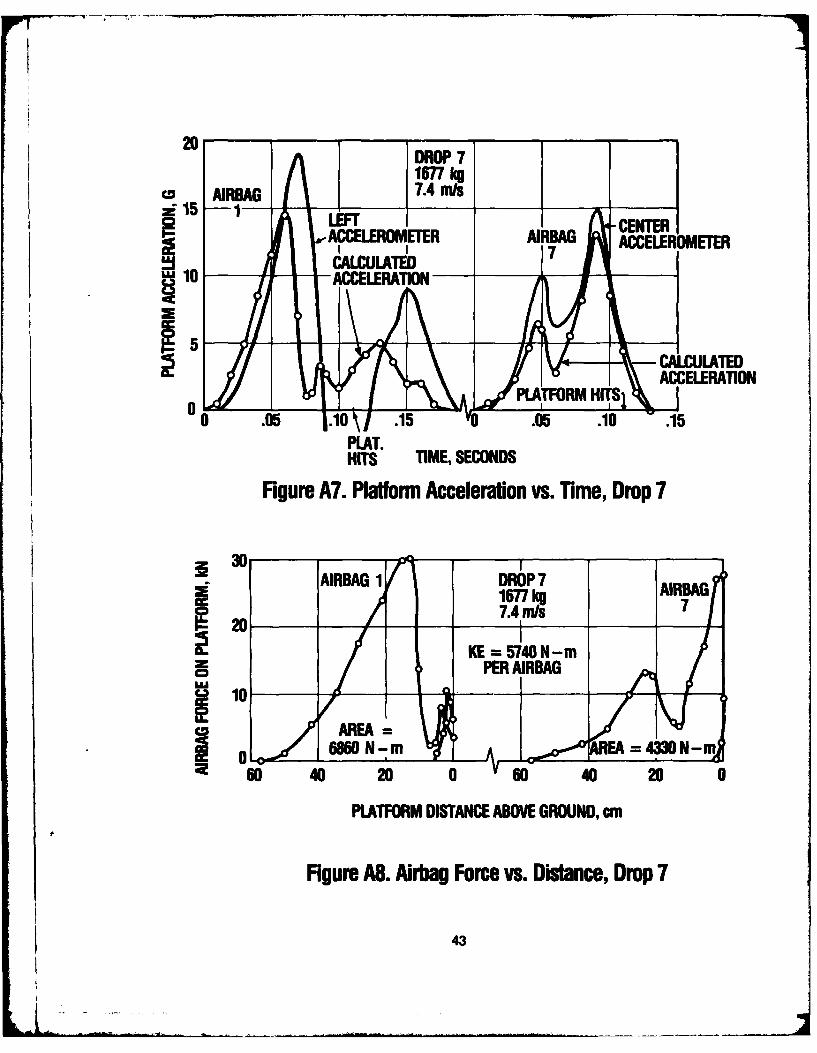
Figure A7. Platform Acceleration vs. Time, Drop 7 43
Figure A8. Airbag Force vs. Distance, Drop 7 43
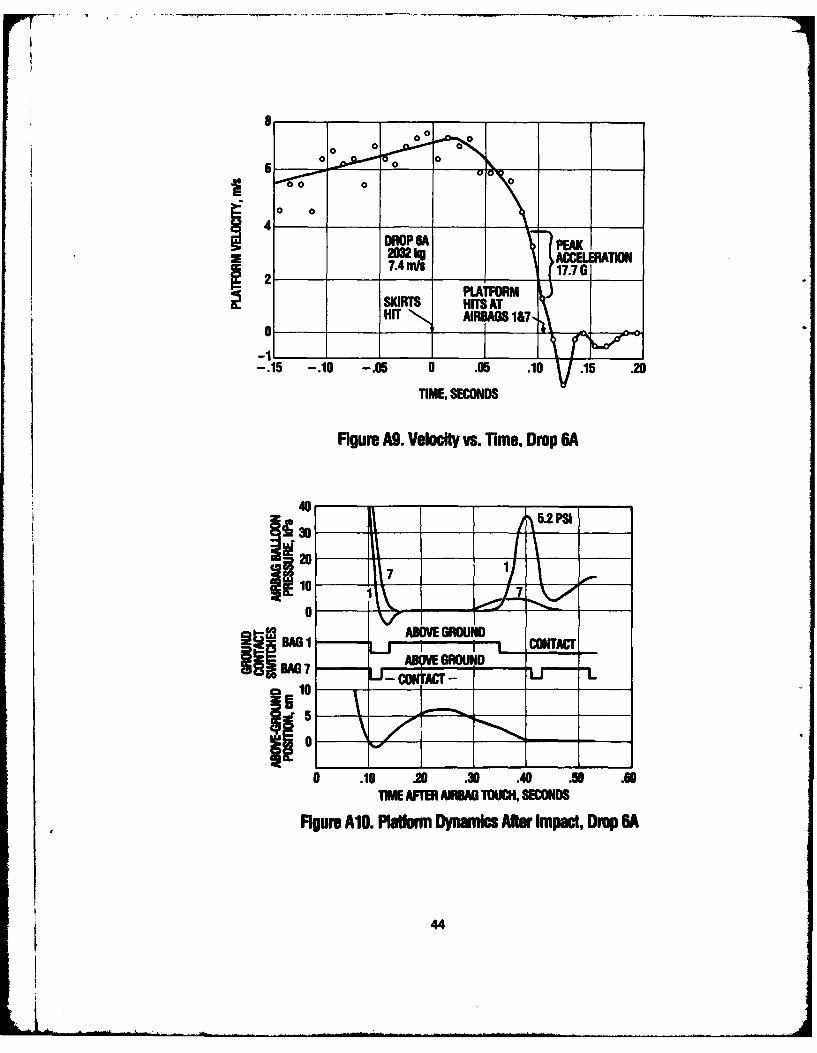
Figure A9. Velocity vs. Time, Drop 6A 44
Figure A10. Platform Dynamics After Impact, Drop 6A 44
Figure All. Airbag Pressure vs. Time, Drop 6A 45
Figure Al 2. Platform Acceleration vs. Time, Drop 6A 45
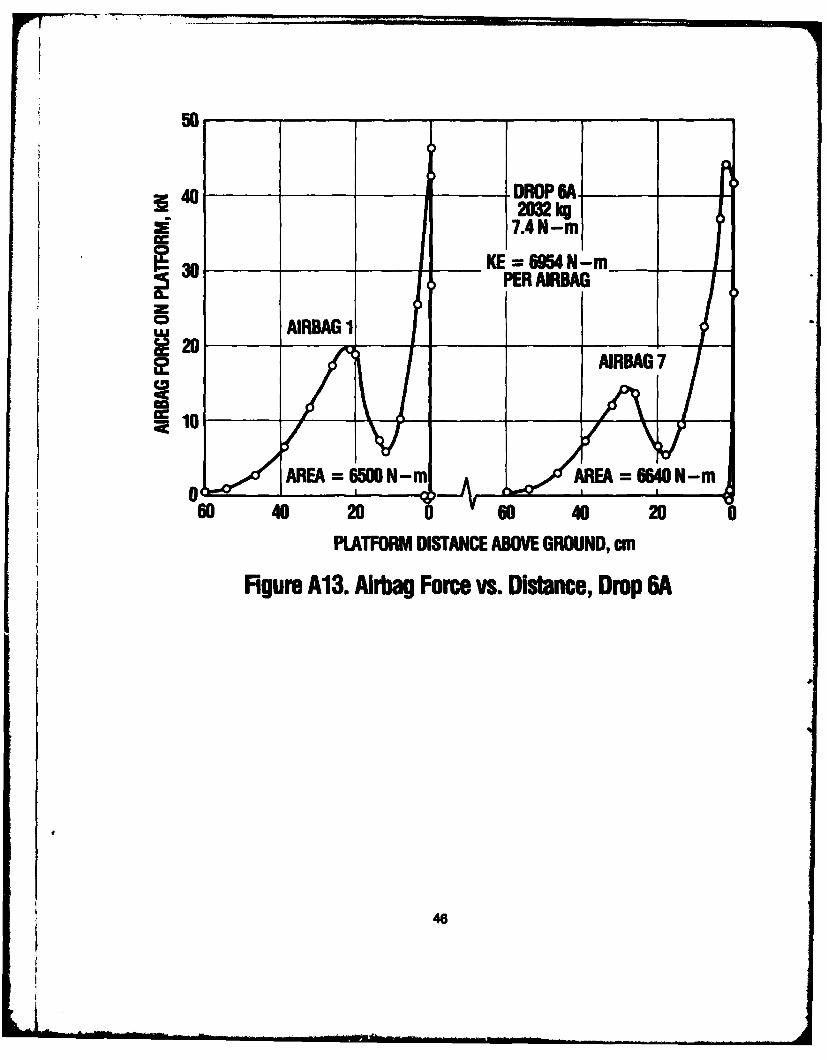
Figure A13. Airbag Force vs. Distance, Drop 6A 46
5

LIST OF TABLES
Pap
Table 1. Total Platform Mass 15
Table 2. Test Plan for Balloon-Skirt Airbag Platform 19
Table 3. Data Summary 22
Table 4. Revised Test Plan 24
Table 5. Acceleration Data, Selected Drops 33
6

BALLOON-SKIRT AIRBAGSAS AIRDROP SHOCK ABSORBERS:
PERFORMANCE IN VERTICAL DROPS
INTRODUCTION
In July 1979, US Army Natick R&D Laboratories awarded Contract DAAK60-79-C--0064 to Soci6ti Bertin & Cie, Plaisir, France, to supply an eight-airbag balloon-skirtimpact shock attenuation system. Used with platform-mounted vehicles and equipmentparachuted from aircraft, these airbags are designed to dissipate the impact energy of theapproximate 8 m/s vertical impact velocity. The Bertin system was designed to limit verticalaccelerations to approximately 7 G and eliminate platform overturn under the following airdropconditions:
- maximum airdropped mass of 2000 kg
- vertical velocity up to 8 m/s
- horizontal velocity up to 15 m/s
Throughout this report the notation G will stand for "times the acceleration of gravity atsea level" or times 9.8 m/s2 . The airbag features a balloon and skirt separated by a polyethyleneintermediate platform w shown in Figure 1. A removable choke is attached over a hole inthe intermediate platform; the choke restricts airflow out of the balloon. The airbag materialis polyester (100 g/km) coated with neoprene on the outside and hypalon on the inside, witha mass of 1000 g/m2 and thickness of 0.84 mm.
40 cm 5 mm POLYETHYLENE
]BLONINTERMEDIATE
PLATFOR
ca SCREEN
25 ernSKIRT(BOTTOMOPEN)
Figum 1. Cross-Seional Viewof Balloon-Skirt Airbag
The theory of operation involves a two stage crush, with the balloon crushing first (dueto the smaller diameter) in rpproximately 0.1 s, followed by the skirts crushing overapproximately a 1 s interval. Proper sizing of the choke orifice maintains optimum balloon
7
pressure during crush and results in reducing the load velocity to near zero at the end ofballoon crush. The skirts are fed with balloon air faster than air leaks out between the skirtand the ground, so that during balloon crush the skirts remain full of air and act as air cushions.The friction with the ground slowly increases as the air is exhausted from the skirts, and ifthere is a horizontal velocity present, a gradual sliding stop is achieved.
Several features and capabilities, nonexistent with the present airdrop system, would be
present in a balloon-skirt airbag system:
(a) vehicle roll-on/roll-off capability
(b) simplified rigging and derigging
(c) overturns are eliminated
(d) capability of high wind airdrops
(e) reusable
(f) low CG in aircraft - airbags are folded
(g) unaffected by moisture or rain (unless it freezes)
These features and capabilities, if incorporated into a practical platform, would vastly improveand simplify the airdrop of equipment, vehicles and cargo. Therefore, a set of eight airbagswas ordered for evaluation and test at NLABS. Test work concentrated on determining theeffect of variations in loae mass, impact velocity, and choke diameter on the platformacceleration. To do this, two of these three variables were held constant while the third wasvaried, and platform position and acceleration was recorded.
LITERATURE
Airbags have been around for many years and have been considered for use as airdropplatform cushioning devices for about 30 years.
In December 1953, three types of barrel-shaped airbags were tested by Wright PattersonAFB . ' All three airbags had approximate dimensions: 100 cm high, center diameter 90 cm,and top and bottom diameter 60 cm. These airbags all featured a check valve on the bottom,allowing inflation, and a top or side mounted diaphragm designed to burst at a predeterminedpressure.
'Madaffer, M.C. Evaluation of Three Types of Airbag Decelerators by Drop Tests, WrightPatterson AFB, Ohio, Technical Note WCLE-54-11, December 1953 (AD 857025).
8
The Brooks and Perkins airbag was made of vulcanized, rubberized nylon and used steelspring hoops to maintain its barrel-shaped form. It featured a top-mounted, 15 cm diameterorifice which could be covered with diaphragms designed to burst at 2, 4 and 5.7 psi (14,28 and 39 kPa). The Stanley airbag was made of cold cemented rubberized nylon and usedcable hoops to maintain its shape. It featured five 7.6 cm orifices spaced around the centercircumference, with diaphragms designed to burst z;t 5 psi (34 kPa). The British airbag wasmade of rubberized cotton and used cable hoops to maintain its shape. It featured a top15 cm diameter orifice with a diaphragm designed to burst at 1.5 psi (10 kPa).
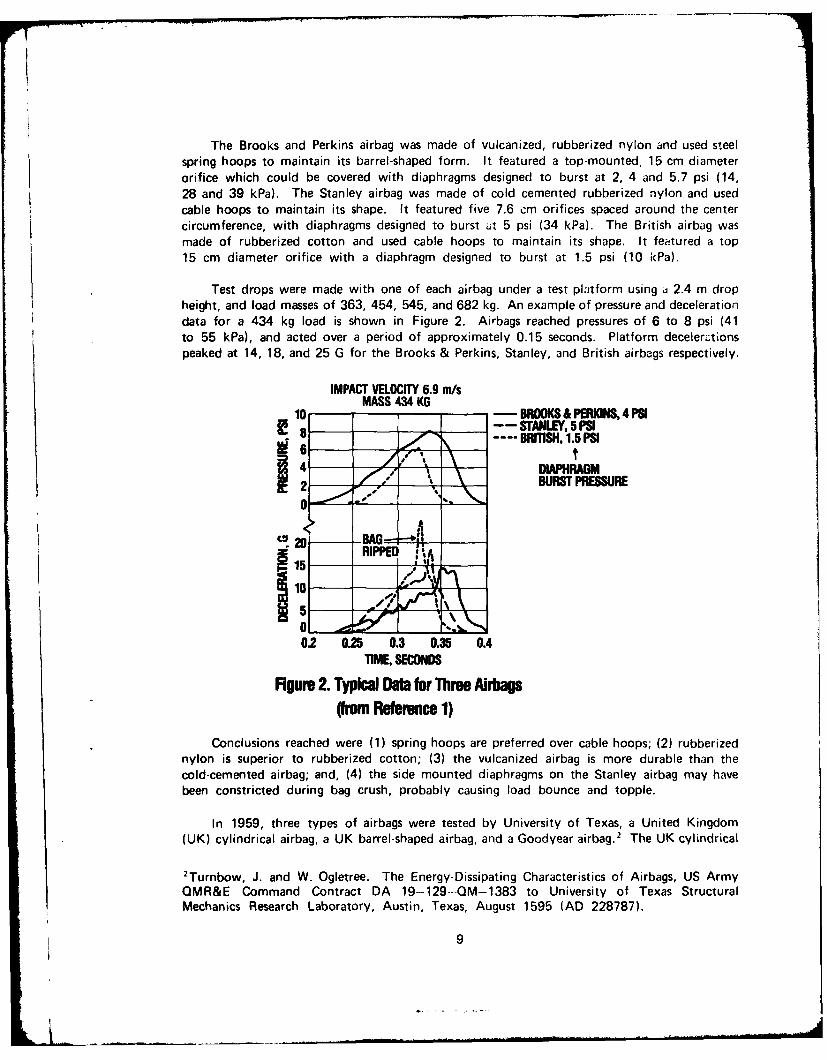
Test drops were made with one of each airbag under a test platform using a 2.4 m dropheight, and load masses of 363, 454, 545, and 682 kg. An example of pressure and decelerationdata for a 434 kg load is shown in Figure 2. Airbags reached pressures of 6 to 8 psi (41to 55 kPa), and acted over a period of approximately 0.15 seconds. Platform deceler;-tionspeaked at 14, 18, and 25 G for the Brooks & Perkins, Stanley, and British airbags respectively.
IMPACT VELOCITY 6.9 m/sMASS 434 KG
10 MS - - BROOKS & PERWS, 4 PSI8__ _--STANLEY, 5PSI8 BR.S.,.1.5 PSI
4- l - t
DIAPHRAGM2- BURST PRESSURE
0 2C20-J ,- ,.
15 RIPPEDI1i ' ,!i
0..0.2 0.25 0.3 0.35 0.4
TIME, SECONDS
Figure 2. Typical Data for Three Aidap(from Reference 1)
Conclusions reached were (1) spring hoops are preferred over cable hoops; (2) rubberizednylon is superior to rubberized cotton; (3) the vulcanized airbag is more durable than thecold-cemented airbag; and, (4) the side mounted diaphragms on the Stanley airbag may havebeen constricted during bag crush, probably causing load bounce and topple.
In 1959, three types of airbags were tested by University of Texas, a United Kingdom(UK) cylindrical airbag, a UK barrel-shaped airbag, and a Goodyear airbag.2 The UK cylindrical
2Turnbow, J. and W. Ogletree. The Energy-Dissipating Characteristics of Airbags, US ArmyQMR&E Command Contract DA 19-129---QM-1383 to University of Texas StructuralMechanics Research Laboratory, Austin, Texas, August 1595 (AD 228787).
9

bag was 94 cm in diameter and 137 cm long. The bottom of the bag had a 30 cm diameterfilling sleeve which closed on ground impact, while at the top were four 8 cm diameter orificescovered with rupture diaphragms. The UK barrel-shaped bag, also made of rubberized fabric,was 111 cm long; no diameter data was given. These bags had a 14 cm top orifice withrupture diaphragm, and a 29 cm filling orifice in the base. The Goodyear airbags werecylindrical, of heavier rubberized fabric, 90 cm diameter and 130 cm long. The filling portsconsisted of five 6 cm diameter orifices covered by a one-way flap valve. The 11 cm topoutlet orifice included 4 gum rubber gussets, permitting expansion of the orifice with increasingpressure.
A test program concentrated on single airbag test drops, with a range of loads from 300to 820 kg, and with impact velocities from 5.5 to 10.7 m/s. Typical data for the Goodyearairbag is included in Figure 3. Conclusions reached were (1) all three airbags are capableof dissipating up to 18,000 ft-lb (24,400 J) of energy; and (2) all airbags experienced a slowpressure rise causing the initial part of the stroke to be ineffective; (3) a single airbag is extremelyunstable; and (4) horizontal wind gusts deflect the bag and would present a platform overturnproblem.
28
24
GOODYEAR AIRBAG2c- 9ocm DIA, 130 cm HIGH
IMPACT VELOCITY 7.3 m~s
16
)/F1kgLa12 PR / A
4
0 1
DISPLACEMENT, FT
Figure 3. Pressure and Force vs. Displacement,Goodyear Airbag (from Reference 2)
10
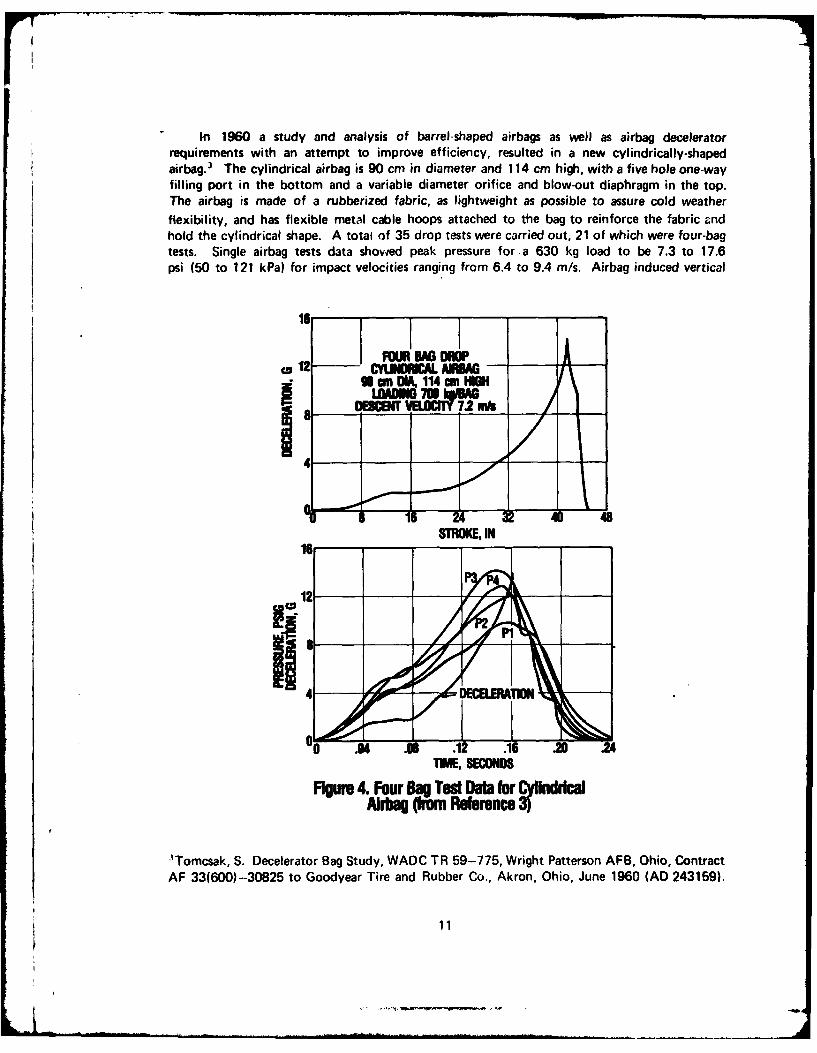
In 1960 a study and analysis of barrel-shaped airbags as well as airbag decelerator
requirements with an attempt to improve efficiency, resulted in a new cylindrically-shapedairbag.3 The cylindrical airbag is 90 cm in diameter and 114 cm high, with a five hole one-wayfilling port in the bottom and a variable diameter orifice and blow-out diaphragm in the top.The airbag is made of a rubberized fabric, as lightweight as possible to assure cold weather
flexibility, and has flexible metal cable hoops attached to the bag to reinforce the fabric andhold the cylindrical shape. A total of 35 drop tests were carried out, 21 of which were four-bagtests. Single airbag tests data showed peak pressure for .a 630 kg load to be 7.3 to 17.6psi (50 to 121 kPa) for impact velocities ranging from 6.4 to 9.4 m/s. Airbag induced vertical
CZ -OU BAG DRO
~ 12 CYuJICAL A~fhAM0 UimfLA, 114emHGH
44
STMOEIN
12
0O .04 .08 .12 .16 20 2
TIME, SECONDS
Figure 4. Four Ba Test Data for YilnddcalAiding (Wmm Refrencea)
'Tomcsak, S. Decelerator Bag Study, WADC TR 59-775, Wright Patterson AFB, Ohio, ContractAF 33(600)-30825 to Goodyear Tire and Rubber Co., Akron, Ohio, June 1960 (AD 243159).
11

deceleration was 4.1 to 12.8 G, while platform impact deceleration was 7.5 to 25.6 G verticaland up to 13 G horizontal. Although drops were vertical, the airbags would often slant underthe platform, causing the airbags to buckle and the platform to hit obliquely, resulting inhigher decleration values due to platform impact. Four-airbag data was similar, except horizontalimpact velocities due to uneven platform impact were lower, on the order of 1 to 5 G. Datafor a typical four-bag test is shown in Figure 4. A parachute drop test was conducted witha 7.3 m platform housing 12 airbags. For this drop, impact ve!ocity was 8.4 m/s while horizontalvelocity due to winds was 2.5 to 5 m/s. For this 12 airbag drop airbag pressures were lowerthan expected (8 psi), as was theplatform acceleration; validity of data was doubted. It wasconcluded that the cylindrical airbag with the variable diameter orifice was more efficient thanprevious airbags.
In an English study in 1963, a theory of compression of a cylindrical airbag was developedand equations were solved by numerical integration.4 Dimensionless parameters were developedfor bag height, bag loading, and orifice size, and a series of charts were drawn up so theperformance of a given airbag could be determined. It was found that airbags were mostsuitable at a loading of 150-200 lb/ft2 (7.2 to 9.6 kPa), and very high or low loadings wereinefficient. It was stated that it is unreasonable to expect an airbag to reduce impact velocityby more than 70%, so a descent velocity of 7.6 m/s should be reduced to about 2.3 m/sby the airbags. In this case, however, kinetic energy is reduced by 90%. Using an impactvelocity of 7.6 m/s, the charts indicate a good airbag would be 80 cm high, 60 cm in diameter,and given the proper orifice, could retard any load mass between 110 and 410 kg from 7.6to 2.4 m/s with a peak acceleration of about 8 G. The ground impact velocity of 2.4 m/s(equivalent to a 29 cm free-fall) would impart a substantial shock to the platform on hardterrain, greater than the 8 G airbag deceleration, and it was indicated the platform must berobust to withstand this. The charts indicate that ± 20% variation of the load on a givenairbag change the peak acceleration by less than ± 5%, while changes in impact velocity of± 20% change the peak acceleration by +57% and -40%. Although no drop tests were made,the theory was found to be in reasonably good agreement with some earlier test data. Itwas noted that for the theory to be valid in wind drift conditions, wind velocity must beno more than 1.8 m/s.
A final report of Bertin's work on airbag damping devices covered research and tests overthe time period 1963-1968.' The work was done under contract to the French Army(Direction Technique Des Armements Terrestres, Toulouse) to develop a device to permitairdrops in strong winds with no platform overturn and to dampen the impact so that equipmentwould be subjected to decelerations no more than those of their standard airdrop system.The report made reference to experiments conducted by Bertin in 1961 in which only flexibleskirts were used to attenuate a platform's vertical descent. The poor performance and platform
4 Browning, A.C. A Theoretical Approach to Airbag Shock Absorber Design. Technical NoteME369, Royal Aircraft Establishment, Farnborough, England, February 1963 (AD 421946).
5 Lebargy, P. Damping of Parachute Loads, Final Report, Technical Memorandum 681f29, Bertin& Co., Plaisir, France, November 1968.
12
overturn tendency of the skirts - only approach gave rise to a balloon-skirt airbag, whichgreatly reduced the gvound friction and rebound. Upon contract to the French Army, Bertinthen investigated various sizes and shapes of balloon-skirt airbags. A theoretical study ofballoon-skirt airbag operation was first carried out and a computer program was written. Theprogram calculated the choke diameter which, for a given airbag size and loading, resultedin zero platform velocity at the end of balioon crush. Early tests used compressed air topressurize the airbags just prior to impact; attempts to simplify the system, however, resultedin satisfactory operation without compressed air. Drop tests were first made in the laboratory(292 drops), then from a mobile crane (238) then a helicopter (6), and finally from a fixed-wingaircreft, the Transall C-160 (22). During the research program, it was found that to avoidskir buckling the skirt diameter-height ratio must be approximately 4. Also, to keep groundshear action from being excessive, the balloon height must be shorter than the average balloondiameter. The conclusions reached were (a) tests in wind velocities up to 15 m/s confirmedthe elimination of platform overturn, (b) the balloon-skirt assembly operated within standardsfor vertical velocities between 6 and 10 m/s and (c) platform accelerations were less than 10G in normal conditions of use, and did not exceed 18 G at an impact velocity of 12 m/s.
PLATFORM DESIGN AND INSTRUMENTATION
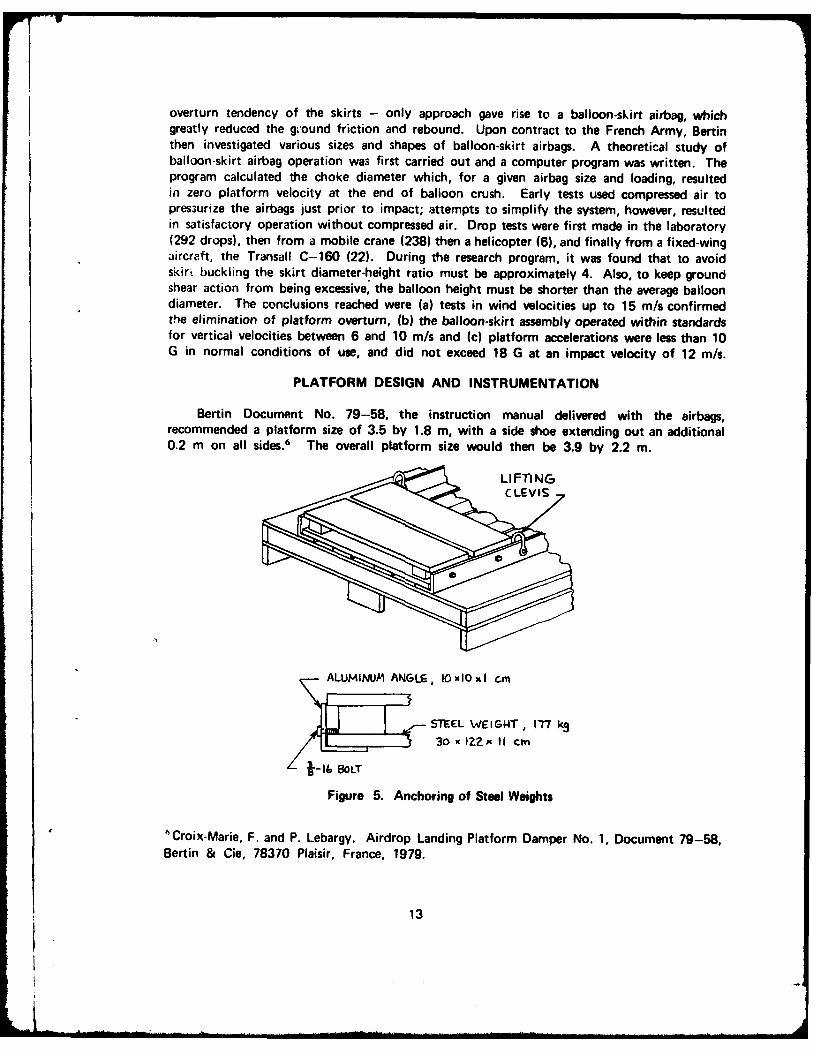
Bertin Document No. 79-58, the instruction manual delivered with the airbags,recommended a platform size of 3.5 by 1.8 m, with a side shoe extending out an additional0.2 m on all sides." The overall platform size would then be 3.9 by 2.2 m.
LI FTINGC LE VI/
ALUMINUM ANGLE, 0xIxlI C-m
STEEL WE I GHT, M k330 x 12x I CM
)3* -lit, SOLT
Figure 5. Anchoring of Steel Weights
'Croix-Marie, F. and P. Lebargy. Airdrop Landing Platform Damper No. 1, Document 79-58,Bertin & Cie, 78370 Plaisir, France, 1979.
13

" 7- I
/ET ETEI IRS\ \/ [I
-- ,-- .. ..
t - - D SI / ' I '
iTI EN I 4. A,
I-- 7 ANL IIll
lL S KI I
-1
I - -"<
-- _,_.. .. ..K- / - n II~ -
--. , I,0"
I - -" , I i
,I " Ii
ZII
SHO 8ALOODLMNINM I
! CNT MTES
Figure 2 6. _ P 4tor sgI " l 4

For this test program, a wood test platform designed to holdup to 11 steel weights wasfabricated. This platform was built solely as a test device to obtain data on the airbagperformance in vertical drops. Figure 6 shows the platform design. The two 10 x 10 x 1cm aluminum angles running the length of the platform provided a mounting and anchoringsurface for the steel weights. The method of anchoring the weights is shown in Figure 5.
The platform mass was 436 kg, and each steel weight had a mass of 177 kg. Table1 lists the total mass for the nine test configurations.
Table 1
Total Platform Mass
Number of Total MassWeights (kg) (lb weight)
3 968 21304 1145 25205 1323 2910
6 1500 33007 1677 3690
8 1855 40809 2032 4470
10 2209 486011 2386 5250
Figure 7 shows the platform set up with 7 weights and indicates locations of all transducers.Three accelerometers were cemented to the top of the steel weights, a location where platformvibration least affected acceleration values. Bell & Howell accelerometers were used, with ranges± 15 G, ± 25 G and ± 100 G. Pressure transducers used were Data Instrument Model AB-25,strain gage type, with range 0 to 25 psi (0 to 172 kPa) gage; these were mounted with steelguard members to protect the pressure-sensing face from impact. The position transducer,Celesco model PT-101-100A, had a 2.5 m active length. Since many of the drops werefrom 3.5 m height, the position transducer had to be used with some slack, resulting in positiondata on only the last half of the platform descent. This was no problem. Ground contactswitches were Microswitch model BZ-2RW-Z2. All of the above transducer outputs wererecorded on a Honeywell model 1858 17-channel Visicorder. The Visicorder features a multi-gridcathode ray tube with fiber optics to achieve a very high frequency response; a chart speedof 2.5 m/s gave a clear indication of all pressure and acceleration variations. A WollensakFastax high speed 16 mm motion picture camera was used at various speeds, ranging from450 to 1800 frames per second, to record the impact.
Figure 8 shows two views of the airbag platform suspended above the ground. The layerof paper honeycomb on top protects the center accelerometer from impact from the releasemechanism. Figure 9 shows a view of the platform in mid-drop and a view showing the highspeed camera. These photographs show the quick release attached to the crane hook, andthe forklift used to mount the position transducer.
15

R 16 11 4 1 c . -,
! 0
I I 47m
N '\
N,
I -
3SI 3IS! I I
,, ,.nO
TRANSDUCER• " Cea" I - AlTrACAW T
I I
/ \ / "
' 1 - LI \
S# (SWITCH
S5 I I
/ \ /
", * /
AccELERoMEES (3)
I WIRE TO
TRANSDOCER
GROUNDCOW-JTACT
-SWOITCH (z)
/ _PESSURE
TRANSDUCERS (4)A ., 1 *7)
Figure 7. Platform Instrumentation
16

Figure 8. Airbag Platform: Two Ovrall Views
17

Figure 9. Airbag Platform: Mid-Drop and Camwe View
18

TEST PLAN AND PROCEDURE
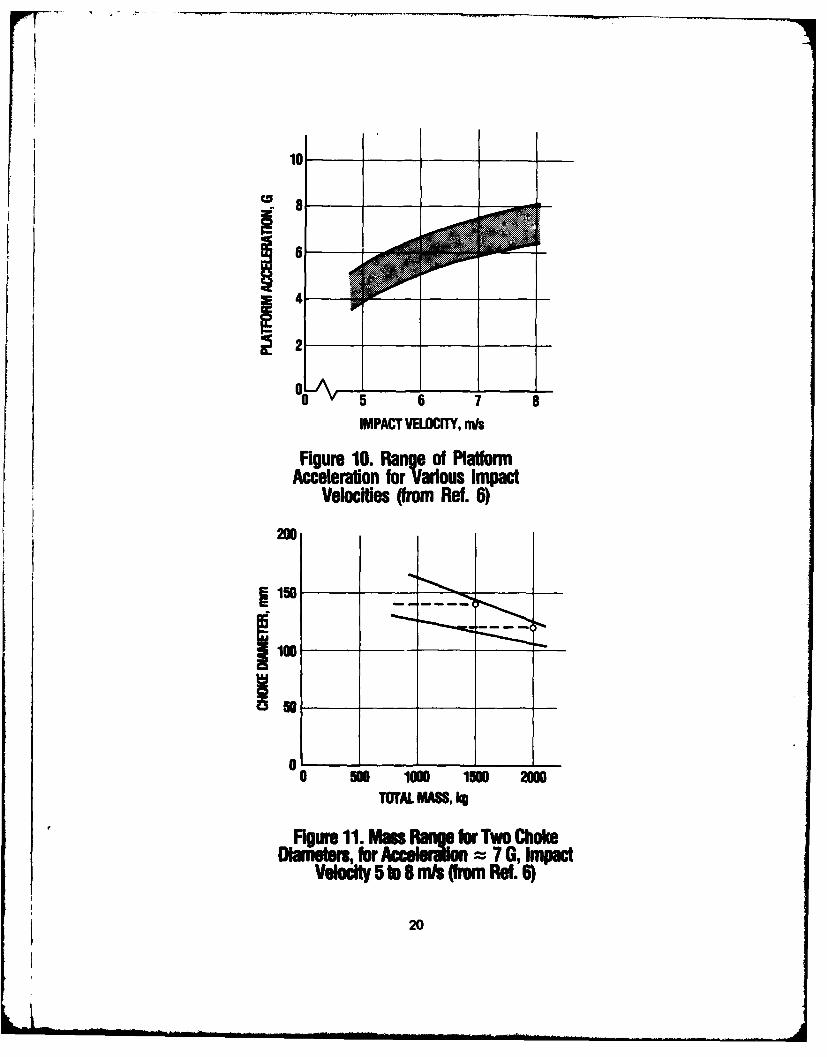
Data supplied with the shipment of the airbags (Ref 6) included two graphs, redrawnhere as Figures 10 and 11. In Figure 10, the effect of impact velocity on platform accelerationis shown; an increase of impact velocity of 5 to 8 m/s is accompanied with an increase inplatform acceleration of 50 to 60 percent. Accelerations given in these graphs are referredto in reference 6 as "calculated acceleration of the center of gravity of the load," which weinterpreted to mean average acceleration. Figure 11 indicates over what mass ranges the chokesshould be used to achieve approximately a 7 G acceleration over a velocity range of 5 to8 m/s.
The purpose of this test was to evaluate the performance of the airbag and to verifyits effectiveness of maintaining approximately a 7 G impact acceleration over both a rangeof load mass and a range of impact velocity.
The original test plan is included as Table 2. A moderate weight (1323 kg) was plannedto debug the data recording system, followed by a systematic investigation of load and velocityeffects on platform deceleration, with 120 and 140 mm chokes.
Table 2
Test Plan for Balloon-Skirt Airbag Platform
No. of Platform Impact ChokeDrop Steel Mass Velocity DiaNo. Weights (kg) (m/s) (mm) Comments
1 5 1323 8 1202 5 1323 8 120 Variations of Accel. with3 6 1500 8 120 Load Mass4 7 1677 8 1205 8 1855 8 120
6 9 2032 6 1207 9 2032 7 120 Variations of Accel. with8 9 2032 8 120 Velocity
9 9 2032 9 12010 9 2032 10 120
11 10 2209 8 120 Overload12 11 2386 8 120
13 7 1677 8 140 Low-Range Variation of14 5 1323 8 140 Accel. with Load Mass15 3 968 8 140
16 6 1500 6 140 Low-Range Variation of17 6 1500 8 140 Accel. with Velocity18 6 1500 10 140
19
10
"0 5 6 7 8
IMPACT VELOCITY, ms
Figure 10. Range of PlatformAcceleration for Varnous Impact
Velocities (from Ref. 6)200
3150
11.
010 500 100D 1500 2000
TOTAL MASS, Iq
Figure 11. Mass Range for Two ChokeDialm , for AcceleriUlot = 7 G, Impact
Velciy 5 to 8 nis (frm Ref. 6)
20

Test drops were conducted outdoors, adjacent to the Roller Test Facility, at NLABS.
The impact surface was asphalt.
The procedure followed in a typical drop was as follows:
a. Clear impact area of dirt, sand, or standing water.
b. Mount and secure the proper number of weights in a symmetrical manner on theplatform.
c. Check for proper operation of all transducers.
d. Cement the accelerometers to the appropriate weights.
e. Attach suspension sling clevis to crane hook, without using release mechanism. Raiseplatform approximately 0.5 m above the ground, check to see if each corner is approximatelythe same distance (within an inch) above the ground. If not, lower platform, adjust slings,and repeat procedure.
f. Attach release mechanism between suspension clevis and crane hook.
g. With platform on ground, electrically zero position transducer, align camera, writedrop number and date on platform.
h. Raise platform about 2 m off ground, attach height determining cable to intermediateplatform, make sure all airbags are fully extended, and raise platform to full height.
i. Remove height cable, align platform directly above impact point, and steady platform.
j. Release platform and immediately start data recorder and motion picture camera asplatform begins to fall.
k. After the drop, remove release mechanism, raise platform approximately 2 m, inspect
airbags and platform for damage.
TEST RESULTS AND DISCUSSION
Test Chronology and Data Summary
A total of 43 platform drops were conducted over the period 26 Jun 80 to 17 Jul 81.Table 3 summarizes the data recorded for each drop. The drop numbering system was basedon the test plan (see Table 2), with repeat drops denoted by adding letters, increasingalphabetically, after the drop number.
The first five drops were run to gain experience in the range of data variation, and toproperly space data on the somewhat narrow (200 mm) Visicorder chart paper. Accelerometers
21

Table 3
Date Sueary
Calc. Peak Airbag Acceleroeter ma.
NO. Load Imp Choke Pressures (pot) Peak Values Film Imp, PeakDrop Seq. Steel Has, Ve1 Di.. esg I Bag 7 (G) Speed Vl Accel.No. Date No. Wte (ka) (,/a) (ue) Ba. Skt _1l Ski L C R (f/a) (r/e) (G) o-nta
I b/2t/so 1 5 1304 120 6:7 5:9 2:7 2:2 DA
IA 6126/80 2 5 1304 8 120 2.8 1.3 5.7 3.5 TA
18 6/26/80 3 5 1304 B 120 4.9 3.0 4.0 2.21C /26/ 0 4 5 1304 8 120 3.8 3.3 2 5 2.0 '
T O 6 /26/80 5 5 1304 8 120 - NO DATA - B E A10 0 0 0 5IE /27/0 b 5 1304 8 120 4.2 3.0 2.8 1.2 A 00 80 1
IF t,127180 7 5 1304 8 120 - NO DATA - L
G 7/01/80 8 5 1304 8 120 4.0 3.2 3.2 1.8 E 800 8.0 17.8
IH 7/01/80 9 5 1304 8 120 6.0 4.0 2.5 1.2 400 9.2 19.711 8/2b/80 10 5 1304 8 120 4.2 Fail 6.5 4.5 Date filters added
S8/29/0 11 5 1304 8 120 4.0 4.0 2.0 [Po-
Undl
IK 8/29/80 12 5 1304 8 120 5.0 - 5.0 3.0 Weights 32 9/02/80 13 5 1304 7.7 120 3-7 - 5.5 4.0 27
3 9/03/80 14 6 1482 8 120 4.0 - 6.2 - IS 22 26 1800 8.2 15.0 Accel on top ef
4 9/D4/80 15 7 1659 8 120 6.9 - 8.5 3.2 32 25 23 1800 9.1 20.4 L, C and R Weights
5 9/04/8016 8 1836 8 120 9.0 - 9.7 Fail 32 25 28 1800 8.7 23.8 r 19/04/80 17 9 2014 8 120 9.0 - 11.0 - 30 26 32 1800 8.8 20.4 I
12 9/04/80 18 11 2368 8 120 12.5 - 11.8 - 28 30 33 1800 9.4 22.0 IityJ11 9/22/80 19 10 2190 8 120 13.5 - 10.5 - ail 35 O.C. 400 - - Rip-Skirt 4
IIA 9/22/80 20 10 2190 8 120 18.0 - 11.0 37 O.C. 690 8.5 20.4 Rip-SkS, Be14
- PLATFORM MODIFIED -
2A 12/22/80 21 5 1323 7.7 120 8.6 4.5 9.0 6-3 13 19 20 1000 'ii. 2501'
28 12/22/80 22 5 1323 7.7 120 12.8 8.3 10.0 7.3 12 14 20 1000 L Erk Rip-Skirt 1
2C 1/21181 23 5 1323 7.7 120 11.2 7.1 7.8 5.3 14 14 17 1050 7.0 11.0 34°F
3A 2/09/81 24 6 1500 7.7 120 13.4 8.5 8.7 6.0 16 13 14 1060 7.0 11.6 32°F
38 2/10/81 25 6 1500 7.7 120 12.2 7.5 8.7 5.3 18 - 16 1050 7.1 11.0 370F
4A 2/10/81 26 7 1677 7.7 120 12.0 7.0 8.5 5.5 15 19 22 1090 7.4 13.4 37OF
4B 4/09/81 27 7 1677 7.7 120 19.0 12.5 11.5 9.0 29 26 - 700 7.4 13.9 70OF Ground switch added
4C 4/09/81 28 7 1677 7.7 120 17.5 11.2 10.7 9.0 25 23 - 700 7.4 14.7 . C irts 1 & 2 Exch
7 4/30/81 29 7 1677 7.7 120 13.2 9.7 11.8 8.0 19 15 - 500 7.4 14.3 Skirt 5 Rips
8 5/20/81 30 7 1677 6.7 120 14.0 11.0 6.7 4.5 10 10 - 900 6.4 10.2 (.Poe. 12CR Added
9 (,/02/81 31 7 1677 5.5 120 6.5 4.5 6.7 4.0 8 9 - 450 5.4 6.8 Skirt@ 5 & 6 Exch
- 140 MM CHOKES INSTALLED -13 6/11/81 32 6 1500 5.5 140 7.2 4.2 4.8 3.6 20 10 - 450 5.4 7.3 75OF14 b/11/81 33 6 1500 6.7 140 7.4 5.4 Failt 5-6 19 13 - 450 6.4 ao0.215 /11/81 34 6 1500 7.7 140 13.0 9.4 6.8 22 17 - 450 7.4 13.6
14 6/11/81 35 5 1323 7.7 140 13.5 11.5 5.0 26 24 - 450 7.4 11.2
17 6/11/81 36 4 1145 7.7 140 9.0 7.0 6.2 19 13 - 450 7.4 9.0
18 6/11/81 37 3 968 7.7 140 6.8 4.8 - 5.5 13 14 - 450 7.4 8.8
- 120 MN CHOKES INSTALLED -
20 6/30/81 38 5 1323 7.7 120, 8.5 6.0 7.2 - - 12 - - - 800
F; Poe XDCR Broke
Ut 6/30/81 39 5 1323 7.7 120 7.3 5.0 9.2 - - 13 - 7.4 1T.7
3C 6/30/81 40 6 1500 7.7 120 10.4 6.5 7.4 - - 16 - 7.4 12.5 Rip- Skirt 8
5A 7/17/81 41 8 1855 7.7 120 15.8 9.8 9.4 - 32 19 20 7.4 15.8 Skirt 3 8 Ech
6A 7/17/81 42 9 2032 7.7 120 20.5 12.0 19.3 - 47 30 O.C. 7.4 17.7
118 7/17/81 43 T0 2209 7.7 120 29.0 19.3 19.7 - O.C. 32 O.C. 7.4 18.4
O.C. * Off Chart
22
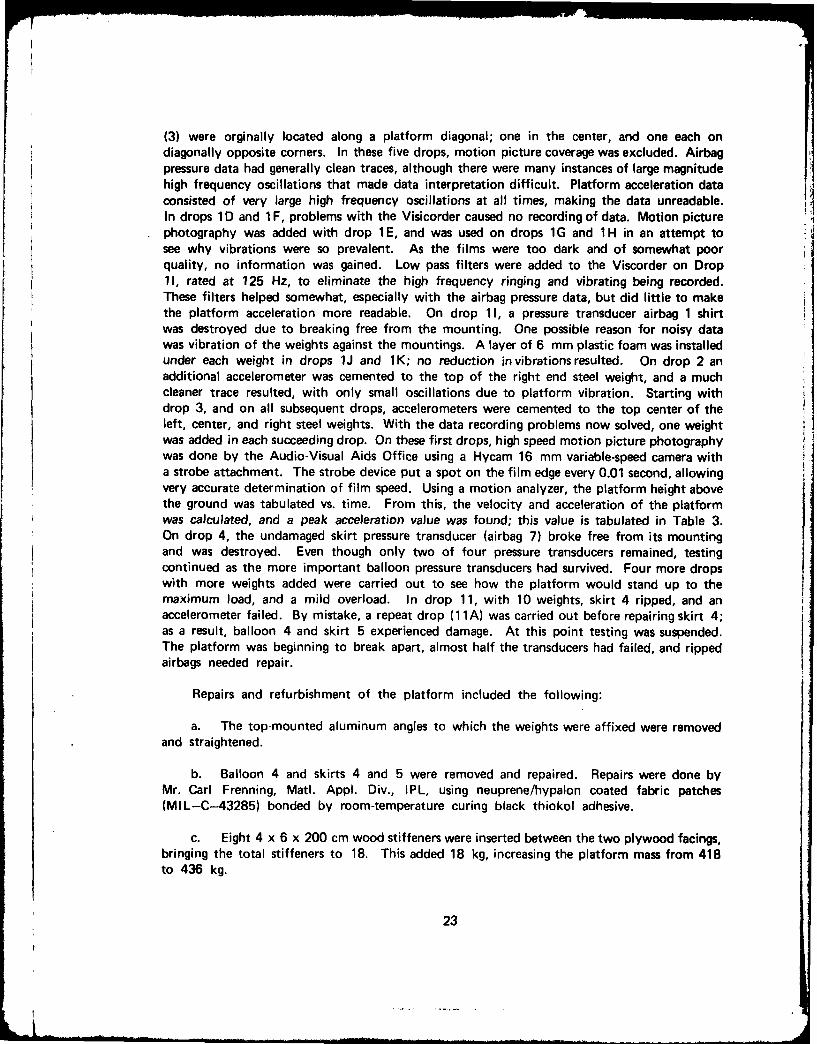
(3) were orginally located along a platform diagonal; one in the center, and one each ondiagonally opposite corners. In these five drops, motion picture coverage was excluded. Airbagpressure data had generally clean traces, although there were many instances of large magnitudehigh frequency oscillations that made data interpretation difficult. Platform acceleration dataconsisted of very large high frequency oscillations at all times, making the data unreadable.In drops 1D and 1 F, problems with the Visicorder caused no recording of data. Motion picturephotography was added with drop 1 E, and was used on drops 1G and 1 H in an attempt tosee why vibrations were so prevalent. As the films were too dark and of somewhat poorquality, no information was gained. Low pass filters were added to the Viscorder on Drop11, rated at 125 Hz, to eliminate the high frequency ringing and vibrating being recorded.These filters helped somewhat, especially with the airbag pressure data, but did little to makethe platform acceleration more readable. On drop 11, a pressure transducer airbag 1 shirtwas destroyed due to breaking free from the mounting. One possible reason for noisy datawas vibration of the weights against the mountings. A layer of 6 mm plastic foam was installedunder each weight in drops 1J and 1K; no reduction in vibrations resulted. On drop 2 anadditional accelerometer was cemented to the top of the right end steel weight, and a muchcleaner trace resulted, with only small oscillations due to platform vibration. Starting withdrop 3, and on all subsequent drops, accelerometers were cemented to the top center of theleft, center, and right steel weights. With the data recording problems now solved, one weightwas added in each succeeding drop. On these first drops, high speed motion picture photographywas done by the Audio-Visual Aids Office using a Hycam 16 mm variable-speed camera witha strobe attachment. The strobe device put a spot on the film edge every 0.01 second, allowingvery accurate determination of film speed. Using a motion analyzer, the platform height abovethe ground was tabulated vs. time. From this, the velocity and acceleration of the platformwas calculated, and a peak acceleration value was found; this value is tabulated in Table 3.On drop 4, the undamaged skirt pressure transducer (airbag 7) broke free from its mountingand was destroyed. Even though only two of four pressure transducers remained, testingcontinued as the more important balloon pressure transducers had survived. Four more dropswith more weights added were carried out to see how the platform would stand up to themaximum load, and a mild overload. In drop 11, with 10 weights, skirt 4 ripped, and anaccelerometer failed. By mistake, a repeat drop (11 A) was carried out before repairing skirt 4;as a result, balloon 4 and skirt 5 experienced damage. At this point testing was suspended.The platform was beginning to break apart, almost half the transducers had failed, and rippedairbags needed repair.
Repairs and refurbishment of the platform included the following:
a. The top-mounted aluminum angles to which the weights were affixed were removedand straightened.
b. Balloon 4 and skirts 4 and 5 were removed and repaired. Repairs were done byMr. Carl Frenning, Matl. Appl. Div., IPL, using neuprene/hypalon coated fabric patches(MIL-C-43285) bonded by room-temperature curing black thiokol adhesive.
c. Eight 4 x 6 x 200 cm wood stiffeners were inserted between the two plywood facings,bringing the total stiffeners to 18. This added 18 kg, increasing the platform mass from 418to 436 kg.
23

d. Side shoes were reinforced with three exterior aluminum channel stiffeners and several
interior 900 aluminum angle brackets.
e. Two end shoes were aLLwched.
f. Balloon pressure transducers were relocated, mounted on the underside of the platformrather than on the polyethylene intermediate platform. Skirt pressure transducer mountingswere redesigned to hold the transducers positively in place.
g. Splits in the polyethylene intermediate platform were repaired with steel tabssandwiching the polyethylene, attached with machine screws, and spaced approximately every15 cm along the split. Three splits were repaired. The polyethylene intermediate platformwas fabricated of several sheets butt-welded together; splits occurred on the welds.
The Bertin-supplied threaded fasteners used to mount the airbags consisted of round headmachine screws and round slotted nuts. Figure 12 shows both the machine screw head andnut. Both the nut and machine screw head had sharp rough areas; the skirts and sometimesthe balloons were abraded and cut by these sharp surfaces. Figure 13 shows typical abrasionson skirt 1. It was at these cuts and abrasions that full scale airbag rips occurred. As thenumber of test drops increased, cuts and rips were discovered and repaired; Figure 14 showsskirt 4 with several repairs. The aforementioned splits in the polyethylene intermediate platformwere repaired as shown in Figure 15. A steel tab is also on the underside of the polyethylene.The nuts were covered with heavy tape to protect the airbag material.
The original test plan was revised in view of the performance over the first 20 test drops.Accelerations were high and the platform seemed overloaded at the design load mass of 2000 kg(9 weights). Rather than risk airbag and platform damage, the mass loading was reduced.Table 4 shows the revised test plan.
Table 4
Revised Test Plan
No. of Platform Impact ChokeDrop Steel Mass Velocity DiaNo. Weights (kg) (m/s) (mm)
2A 5 1322 8 1203A 6 1500 8 1204A 7 1677 8 1205A 8 1854 8 1207 7 1677 8 1208 7 1677 7 1209 7 1677 6 120
13 6 1500 6 14014 6 1500 7 14015 6 1500 8 14016 5 1322 8 14017 4 1145 8 14018 3 968 8 140
24

Figure 12. Airbag Mounting Hardware
Figure 13. Abrasions on Skirt 1
25
WAC : "lowI
Figure 14. Skirt 4 with Several Repairs
Figure. 15. Repaired Split in Polyethylene Intermediate Platform.
26

-- ' "-.-. . . . .- ---. . .
When tests were resumed, the drop height was effectively lowered by 25 cm by attachingthe calibrated height cable to the intermediate platform rather than the bottom of the skirt.The theoretical platform velocity at impact was reduced to 7.7 m/s.
Drops 2A through 4A, a total of six drops, were made in ambient temperatures between-4 and 3°C; all other drops were at temperatures above 16*C. Compared to earlier drops,these six drops exhibited higher airbag pressures and lower acceleration readings. The reducedairbag fabric extensibility and flexibility was a probable cause for this behavior.
In drop 2B, skirt 1 was ripped. As the repair patch does make the skirt locally stiffer,and airbag 1 is instrumented for pressure, the skirt was exchanged with undamaged skirt 2prior to test 7.
Up to drop 7, motion picture films were analyzed on a motion analyzer (Vanguard modelM16C) to get position, velocity, and acceleration data. This was time-consuming and resultswere subject to error due to poor picture quality. On drop 7 and all succeeding drops, aposition transducer was used to record position vs. time data. The transducer output wasrecorded on the visicorder along with pressure and accelerometer data.
On drop 4B a pressure transducer failed. Delivery of additional transducers, previouslyordered, was delayed, so a replacement transducer could not be installed.
For drops 13 to 18 the 140 mm chokes were installed. The motion picture camera wasmoved to get an end view and slowed to the minimum 450 frames/second to make the picturesas bright as possible. The camera was positioned to observe only the airbags during crush.On drop 15 a balloon pressure transducer (7) failed; it was not replaced since no extras wereon hand. It was replaced with the skirt pressure transducer prior to drop 2D as the balloonpressure is more useful data than the skirt pressure.
After the series of drops (13 to 18) with the 140 mm chokes installed, the data wasreviewed. It was decided to repeat several drops with the 120 mm chokes to get more reliableposition data and to confirm previous results. Unfortunately another accelerometer failed,so the sole remaining one was positioned on the center weight. The long-standing order foraccelerometers was finally filled prior to test 5A, so the last three tests had 3 accelerometers.Motion picture coverage was not requested on these last 6 repeat drops.
Detailed Drop Analysis
Each platform drop generated a substantial amount of data so it is unreasonable to examineeach drop in detail in this report. Three drops were chosen for a detailed analysis: drops2E, 7, and 6A, representing light, medium, and heavy platform loading, respectively. All threedrops had an impact velocity of 7.4 m/s, slightly less than the standard airdrop velocity inthe present system. These drops all used a 120 mm choke; the drops made with the 140 mmchoke showed essentially the same characteristics but had generally lower peak values of pressureand acceleration. Data charts for these three drops appear in the Appendix as Figures Alto A13.
27

Drop 2E, with a total mass of 1323 kg, represents a light load for the 120 mm choke(range 1350-2100 kg). Figure Al shows the velocity-time data, which was calculated fromthe position transducer data, and indicates that the platform deceleration took place over abouta 0.10 s time interval. The cyclic appearance of the pre-impact data points is due to theposition transducer response to a step input when the initial slack in the connecting wire wasused up. Slack was necessary since the drop height was 3.25 m and the working length ofthe position transducer wire was only 2.5 m. The maximum slope of the velocity-time curveis the peak acceleration, 11.7 G. Deceleration from 7.4 to 0 m/s took place over a 0.01to 0.115 s time interval, giving an average acceleration value of 7.2 G. For all data presentedhere, time zero was assumed to be the instant the airbag skirts touched the ground.
The ground contact switch near airbag I indicated platform contact at 0.177 s; fromFigure Al the platform velocity at this time had just reached zero. This is an indicationof complete impact energy absorption; according to the theory of airbag operation, however,zero velocity should occur with the skirts uncrushed. The negative velocity at 0.13 s is dueto platform bending at the attachment point of the position transducer, and springing back.The ground contact switch near airbag 7 did rot indicate ground contact until 0.28 s, so whilethe left end of the platform was on the ground, the right end was not; it settled down 0.16 slater. Flexing of the platform during airbag crush was easily seen in high speed motion picturefilms. Films showed no two-stage crush; the skirts did not gently lower the platform to theground over a 1 s interval as was expected. Figure A2 shows airbag pressure vs. time forairbags 1 and 7; a damaged pressure transducer is the reason airbag 7 skirt data is missing.The pressure dip at 0.06 s is quite large, in fact airbag 1 skirt completely depressurized foralmost 0.2 s. Possible reasons for this behavior will be discussed in the next section of thisreport. Figure A3 compares the calculated acceleration for airbag 7 with the centeraccelerometer output. The calculated acceleration is found by using a 0.65 m diameter circulararea over which the airbag pressure is exerting an upward force on the platform. The airbagballoon pressure is assumed to be acting against one-eighth and platform mass, so an accelerationvalue can be calculated. The balloon is tapered, with a top diameter of 0.5 m and a bottomdiameter of 0.7 m; the assumed 0.65 m value is the average diameter during the last halfof crush when pressure is highest. Quite good agreement is seen between the value of calculatedacceleration and the nearby center accelerometer. Good agreement is also seen between peakaccelerations in Figure A3 and the 11.7 G value from Figure Al. Figure A4 shows a plotof the individual airbag force vs. the platform distance above the ground for airbags 1 and 7.The pressure dip observed in Figure A2 is also seen very clearly here. The dip occurs withthe platform 16 cm off the ground. The area under the curve is the work done by the airbegduring crush. The work done can be compared with the kinetic energy of the platform basedon one-eighth of the platform mass. It is seen that airbags 1 and 7 together dissipated8950 N-m, which is 98.8% of the 9056 N-m two-airbag kinetic energy. This data indicatesessentially complete impact energy dissipation which agrees well with the zero platform contactvelocity shown in Figure Al.
Drop 7 had 354 kg more load mass than drop 2E, giving a moderate total mass of 1677 kg.Figures A5-A8 in the Appendix are drop 7 data. In Figure A5 a peak acceleration of 14.3 Gappears, and platform contact takes place at zero velocity. The proper airbag crush sequence,with the skirt slowly crushing only after balloon crush, again did not occur. Average.9cceleration, over 0.01 to 0.105 s time interval, was 8.0 G. Again, platform bending and
28
flexing account for some negative (upward) velocity after ground contact. Position transducerdata indicated a 5 cm bounce, so some of the upward velocity is due to bouncing. Dueto a cloud of dust at impact, motion picture film could not confirm the bounce or suspectedplatform flexing at impact. Figure A6 shows airbag 1 and 7 pressure peaks to be out ofphase, displaced from each other by 0.03 s. The skirt pressures follow the balloons pressuresbut are considerably lower. Peak balloon pressures for this drop are roughly 50% higher thanfor drop 2E. The motion pictures showed the platform was level at airbag contact, but thecenter airbags (2,3,6, and 7) began to exhaust dusty air well before the end airbags (1,4,5,and 8). The act of air exhaustion is documented on Figure A6 by the pressure dip and itis seen airbag 7 experienced the dip before airbag 1. Figure A7 accelerometer data suggeststhe left end of the platform bounced substantially while the center bounced only slightly.The center accelerometer peak of 14.9 G in Figure A7 agrees well with the 14.3 G peak valuefrom Figure A5. Figure A8 shows that airbag 1 develops a large force much earlier in thecrush than airbag 7 and dissipates considerably more energy. If the other left-end airbeg (No. 5)developed as much force as did airbag 1, the platform left end probably stopped prior toground contact and experienced brief airbag-induced bounce. The combined energy dissipationof airbags 1 and 7 was 11190 N-m, which was 97.4% of the 11480 N-m two-airbag kineticenergy. Although unequal airbag performance caused some localized bounce, the nearlycomplete energy dissipation agrees well with the fact that the platform center contacted theground at zero velocity.
Drop 6A was a heavily-loaded platform drop with total mass of 2032 kg; data for thisdrop is shown in Figures A9-A13 in the Appendix. Figure A9 shows a peak decelerationof 17.7 G, and ground contact switch data indicates that ground contact occurred at a velocityof 1.0 m/s. The average acceleration over the time interval 0.02 to 0.105 s was 7.9 G. Aftera flat impact, the platform bounced up 6 cm; the -2 m/s velocity spike just after groundcontact is mainly due to platform bending and springing back. Figure A10 shows airbag balloonpressures, ground contact switch activity, and platform position above ground out to 0.53 s.The platform was in contact with the ground for 0.02 to 0.03 s, reached a peak bounce heightat 0.25 s, and began contacting the ground again at 0.35 s. On the second impact, the airbagsagain pressurized with airbag 1 reaching a much higher pressure than airbag 7. Figure Al 1shows airbag 1 and 7 pressure curves to have similar shapes, with peak pressures about 60%higher than drop 7. Again the airbag 7 pressure dip precedes the airbag 1 dip, this timeby 0.01 s. Airbag 1 skirt pressure dipped below atmospheric pressure at 0.07 s and againat 0.12 s. Possible explanation for this behavior will be discussed in the next section of thisreport. Figure A12 shows very high accelerometer values, 30 and 50+G, due to the shockof ground impact of the platform body at 1.0 m/s. Calculated accelerations peaked at 17.7and 18.7 G, very close to the 17.7 G value from Figure A9. Figure A13 shows airbags 1and 7 dissipated 93.5 to 95.5% of the per-airbag kinetic energy, respectively. Going backto Figure Ag, the platform velocity at ground contact was 1.0 m/s. Kinetic energy at thisvelocity is 127 N-m per airbag, or 1.8% of the original value. Thus airbags 1 and 7 dissipated95.3 and 97.3% of what was assumed to be their share of the platform kinetic energy.Considering the assumptions involved as well as instrumentation inaccuracies, essentially allkinetic energy is accounted for.
In all three drops discussed here, the balloon and skirt pressures built up after the beginningof crush, but then suddenly dipped down and began building up again. This behavior was
29

unexpected. All three drops also did not exhibit proper crush characteristics; the skirts didnot gently lower the platform to the ground after balloon crush. These two events are related,as will be seen in the next section.
Airbag Crush Behavior
In most drops, the pressure dip occurred with the platform 10 to 15 cm above the ground;this can be seen in Figures A4, A8, and A13 for the three drops analyzed in detail. Side-viewhigh speed motion picture films showed only a rush of dusty air (toward the camera) whenthe platform was about 10 to 15 cm above the ground. End-view film coverage, however(drops 13--18), was much more informative. Figure 16 shows a typical airbag crush sequencebased on end-view films.
I RI~TEDO LTI I
igure 16. Successive Stagesof Airbag Crush, End View
The inward-facing part of the skirts crush while the outer edges tip upward. This tippingprogresses, bending the intermediate platform until it contacts the ground. The outer edgeof the skirts then lifts up, exhausting a large amount of air, reducing the skirt pressure to(or below) zero, and greatly lowering balloon pressure. The skirt then flattens and airbagpressure increases again. The pressure-time data shows this behavior as a large pressure dip.The negative skirt pressure occurring just after air exhaustion is probably due to the violentflipping-up action of the skirt causing a mild vacuum.
30

The flattening of the skirt before the balloon does not follow the theory of operation,as described in the introduction of this report. Reference 5 shows a photographic sequenceof an airbag crushing; the balloon crushes completely while the skirt stays uncrushed. Alsoin a film by Bertin "Utilization of Air Cushioning to Lessen Impact of Parachute DroppedLoads," slow motion footage clearly shows the two-stage crush, with the balloons first crushingover approximately 0.1 s and the skirts crushing for approximately 0.8 s, beginning after ballooncrush. The platform velocity is reduced to near zero by the balloon crush.
A letter was sent to Bertin & Cie, France, with a description of the airbeg platform,some test results, and a copy of Figure 16. An explanation of the suspected abnormal crushbehavior was requested. In reply, Bertin was surprised and puzzled that our results did notagree with theirs. They concluded that the choke area was too small, causing the skirts tobe insufficiently fed with air, and to collapse. They suggested the chokes be progressivelyenlarged until the optimum deceleration is achieved.
Airbeg Pressure Variations
All airbag pressure-time data showed the existence of at least two distinct peaks. Thesepeaks varied greatly in size and shape between airbags 1 and 7 on a given drop, and betweendrops from identical conditions. Figure 17 compares airbag balloon pressure data for drops2B, 2D, and 4C. These drops were chosen for this figure since they have characteristic shapes:one large peak followed by a much smaller second peak (2B), two approximately equal sizedpeaks (2D), and a small first peak followed by a much larger second peak (4C). Patternsevident in the data are: (a) most lightly-loaded platforms had a pressure curve similar to thatof drop 2B, but a few appeared similar to drop 2D, (b) moderately loaded platforms showedno consistent pattern, having pressure curves with all three shapes, and (c) heavily loadedplatforms always had pressure curves similar to the shape of drop 4C. These trends are validfor both 120 mm and 140 mm choke sizes. Lightly loaded drops included light load massesimpacting at 7.4 m/s, and heavier load masses impacting at lower velocities. Two more trendsevident in the data and observable in Figure 17 are that airbag 7 pressures were almost alwayslower than those of airbag 1, and in the majority of cases the airbag 1 and 7 pressure curveswere of similar shapes for a given drop. A notable exception to the latter is drop 7, seenin Figure A6. It should also be noted that drops 28 and 2D did differ in the ambienttemperature, 25°F for 2B but 80OF for 2D. The stiffer airbag coated fabric at the lowertemperatures may have contributed to the differently-shaped pressure curves.
Platform Acceleration
One of the major goals of this test program was to determine the sensitivity of the platformimpact acceleration to variations in load mass, impact velocity, and choke size. Average andpeak platform accelerations for the final fourteen drops are tabulated in Table 5.
31

100 DROPMAS[InAIRBAG7 I Of) MS
I 11PS 203 1323 7.475- 20 112 I 7.4
23 C41 167717.4
~25-
LF
O0 0.04 0.08 0.12 0.16
TIME, S!AIRBAG 1 17.5 PSI
100
Q 75 2B3P
_ n 4
50
25 / ,A
0 0.04 0.08 0.12 0.16
TIME, S
Figure 17. Airbag Balloon PressureComparison: Drops 2B, 2D, 4C
32
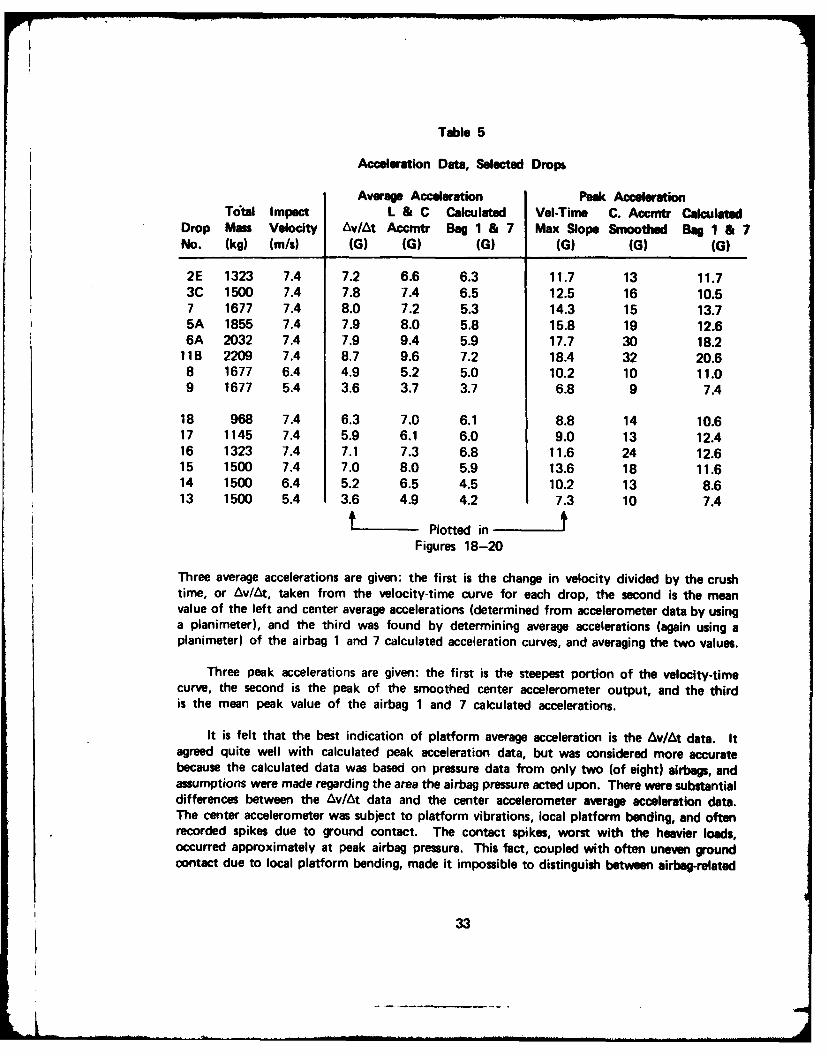
Table 5
Acceleration Data, Selected Dropb
Average Acceleration Peak AccelerationTotal Impact L & C Calculated Vol-Time C. Accmtr Calculated
Drop Mass Velocity Av/t Accmtr Bag I & 7 Max Slope Smoothed Bag I & 7No. (kg) (m/s) (G) (G) (G) (G) (G) (G)
2E 1323 7.4 7.2 6.6 6.3 11.7 13 11.73C 1500 7.4 7.8 7.4 6.5 12.5 16 10.57 1677 7.4 8.0 7.2 5.3 14.3 15 13.75A 1855 7.4 7.9 8.0 5.8 15.8 19 12.66A 2032 7.4 7.9 9.4 5.9 17.7 30 18.211B 2209 7.4 8.7 9.6 7.2 18.4 32 20.68 1677 6.4 4.9 5.2 5.0 10.2 10 11.09 1677 5.4 3.6 3.7 3.7 6.8 9 7.4
18 968 7.4 6.3 7.0 6.1 8.8 14 10.617 1145 7.4 5.9 6.1 6.0 9.0 13 12.416 1323 7.4 7.1 7.3 6.8 11.6 24 12.615 1500 7.4 7.0 8.0 5.9 13.6 18 11.614 1500 6.4 5.2 6.5 4.5 10.2 13 8.613 1500 5.4 3.6 4.9 4.2 7.3 10 7.4
Plotted inFigures 18-20
Three average accelerations are given: the first is the change in velocity divided by the crushtime, or Av/At, taken from the velocity-time curve for each drop, the second is the meanvalue of the left and center average accelerations (determined from accelerometer data by usinga planimeter), and the third was found by determining average accelerations (again using aplanimeter) of the airbag 1 and 7 calculated acceleration curves, and averaging the two values.
Three peak accelerations are given: the first is the steepest portion of the velocity-timecurve, the second is the peak of the smoothed center accelerometer output, and the thirdis the mean peak value of the airbag 1 and 7 calculated accelerations.
It is felt that the best indication of platform average acceleration is the Av/At data. Itagreed quite well with calculated peak acceleration data, but was considered more accuratebecause the calculated data was based on pressure data from only two (of eight) airbags, andassumptions were made regarding the area the airbag pressure acted upon. There were substantialdifferences between the Av/At data and the center accelerometer average acceleration data.The center accelerometer was subject to platform vibrations, local platform bending, and oftenrecorded spikes due to ground contact. The contact spikes, worst with the heavier loads,occurred approximately at peak airbag pressure. This fact, coupled with often uneven groundcontact due to local platform bending, made it impossible to distinguish between airbag-related
33
L __
and contact-related center accelerometer output. Also, ground contact shocks were more severewith the asphalt surface used in these tests than they would be with typical grass or earthdrop zones. To study airbag performance up to the point of ground contact as we are doing,the Av/At data, free of extraneous accelerations due to vibration and ground contact, providesthe best evaluation.
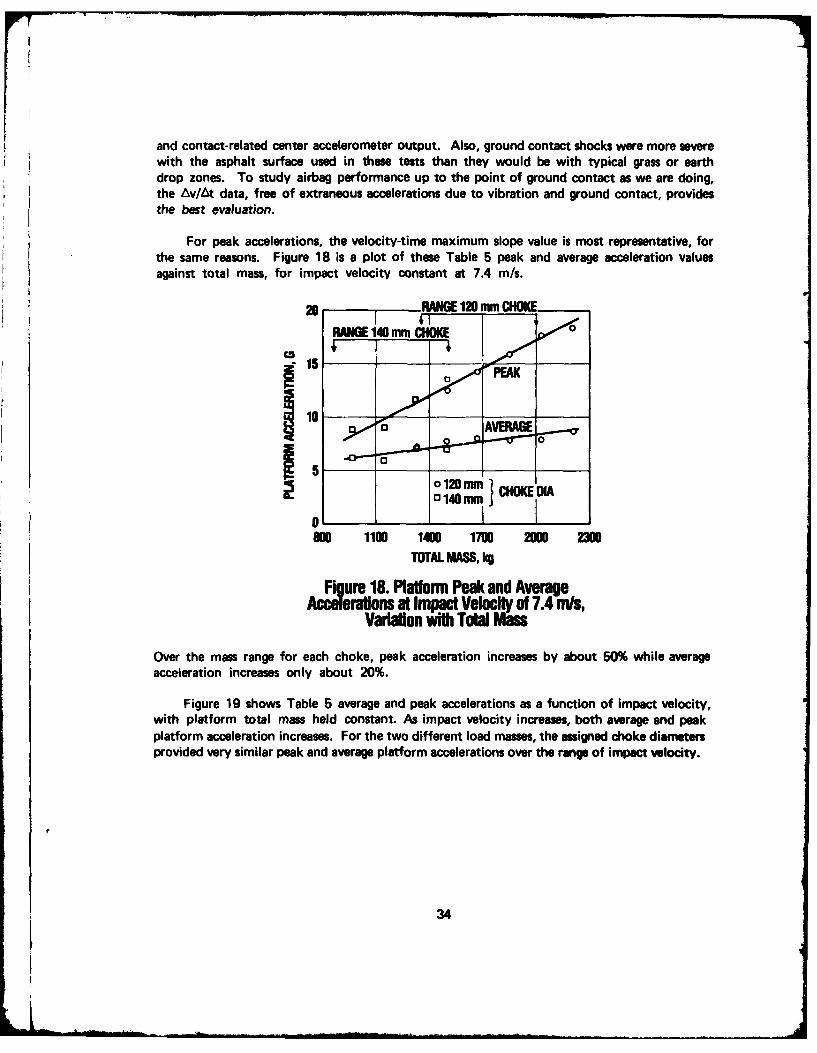
For peak accelerations, the velocity-time maximum slope value is most representative, forthe same reasons. Figure 18 is a plot of these Table 5 peak and average acceleration valuesagainst total mass, for impact velocity constant at 7.4 m/s.
20 ] 1I i EI 120 mm CHOKE
RAW 10 mm CHOK
10
800 110 1400 10 20M 2=0
TOTAL MASS, kg
Figure 18. Platform Peak and AverageAcceleirations at Impact Velocity of 7.4 mins,
Variation Wit Total Mas
Over the mass range for each choke, peak acceleration increases by about 50% while averageacceleration increases only about 20%.
Figure 19 shows Table 5 average and peak accelerations as a function of impact velocity,with platform total mass held constant. As impact velocity increases, both average and peakplatform acceleration increases. For the two different load masses, the assigned choke diametersprovided very similar peak and average platform accelerations over the range of impact velocity.
34
20
o 120 mm CHOKE, 1677 kg- n1140 mm HOKE, 1500 kg
15
110
5.0 5.5 6.0 6.5 7.0 7.5IMPACT VELOCITY, M
Figure 19. Variation of Peak and AverageAcceleration with Impact Velocity
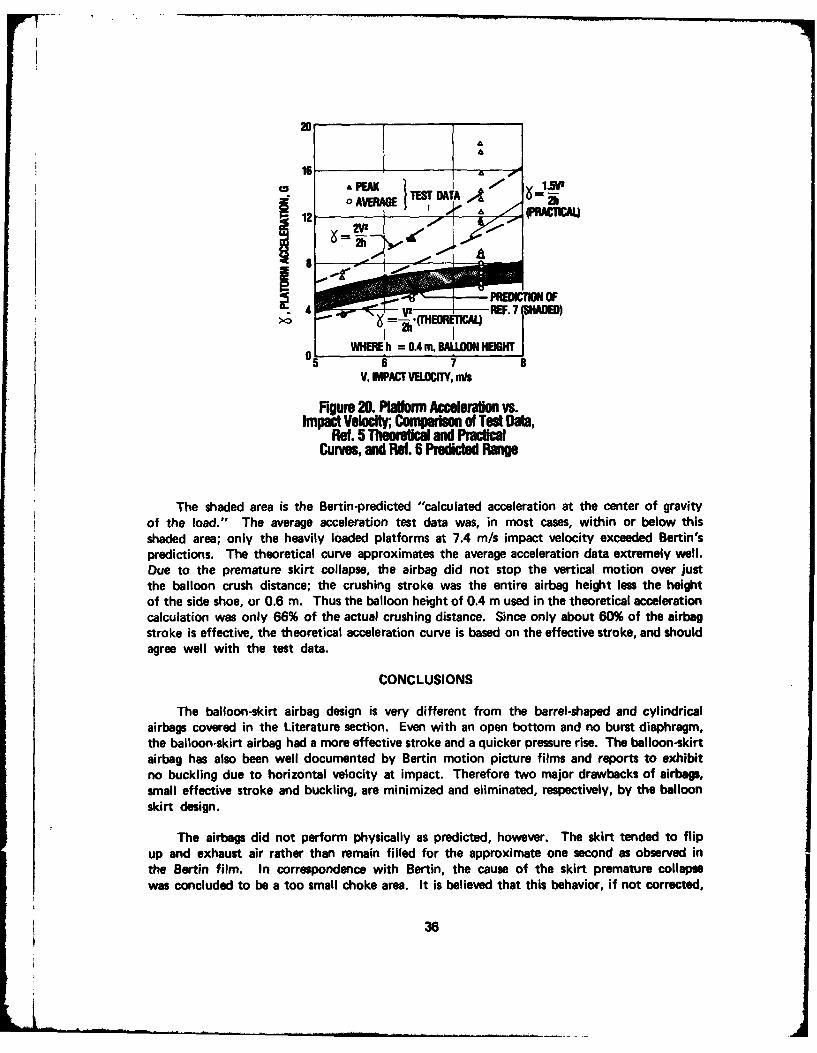
Figure 20 is a repeat of Figure 10, which showed predicted acceleration data (shaded)provided by Bertin in the airbag instruction manual (Reference 6). Average and peakacceleration data points from Table 5 are shown for comparison to the predicted range. The"theoretical" curve was found by assuming a constant acceleration over the 0.4 m ballooncrush distance, equating kinetic energy and balloon work, and solving for acceleration. Fora given impact velocity, the theoretical acceleration represents the minimum constantacceleration required to totally stop the platform over the 0.4 m balloon crush distance. InReference 5, Bertin stated that the predicted peak acceleration of the platform is about 50%higher than the theoretical value due to the non-rectangular nature of the airbag force-distancecurve. This is shown on Figure 20 by the -f = 1.5 V 2 /2h curve. The peak acceleration testdata is generally well above this curve. A third curve was drawn, - = 2VI/2h, in which peakaccelerations are 100% higher than the theoretical curve; peak acceleration test data fits thiscurve quite well.
35
A
16 A ;0
A PEA 100,
12 oAVERM~ (T DATA A. A Pru(BA ---1CAL
05 WHERE h 04mBAL00NHEIGKJT
V, IMPACT VELOCITY, m/s
Figure 20. Platform Acceleration vs.
Curve, and Ref. 6 Predicted Range
The shaded area is the Bertin-predicted "calculated acceleration at the center of gravityof the load." The average acceleration test data was, in most cases, within or below thisshaded area; only the heavily loaded platforms at 7.4 m/s impact velocity exceeded Bertin'spredictions. The theoretical curve approximates the average acceleration data extremely well.Due to the premature skirt collapse, the airbag did not stop the vertical motion over justthe balloon crush distance; the crushing stroke was the entire airbag height less the heightof the side shoe, or 0.6 m. Thus the balloon height of 0.4 m used in the theoretical accelerationcalculation was only 66% of the actual crushing distance. Since only about 60% of the airbagstroke is effective, the theoretical acceleration curve is based on the effective stroke, and shouldagree well with the test data.
CONCLUSIONS
The balloon-skirt airbag design is very different from the barrel-shaped and cylindricalairbags covered in the Literature section. Even with an open bottom and no burst diaphragm,the balloon-skirt airbag had a more effective stroke and a quicker pressure rise. The balloon-skirtairbg has also been well documented by Bertin motion picture films and reports to exhibitno buckling due to horizontal velocity at impact. Therefore two major drawvbacks of airbags,small effective stroke and buckling, are minimized and eliminated, respectively, by the balloonskirt design.
The airbags did not perform physically as predicted, however. The skirt tended to flipup and exhaust air rather than remain filled for the approximate one second as observed inthe Bertin film. In correspondence with Bertin, the cause of the skirt premature collapsewas concluded to be a too small choke area. It is believed that this behavior, if not corrected,
36
VNATVEOY i
would adversely effect the platform ground slide feature. This behavior did not seem to increasethe average acceleration of the platform, but probably caused higher than predicted peakaccelerations.
Average accelerations of the platform were close to the predicted values by Bertin, buteven closer to the theoretical average based on 0.4 m balloon crush.
In the present airdrop system, descent velocity is intentionally kept as constant as possibleat about 8 m/s. Variations around this value will generally be small, probably less than ±1m/s. The variation of platform acceleration with total mass rather than impact velocity istherefore more important. It was found that average accelerations were quite insensitive tovariations in total mass. From the low to the high end of the mass range for each choke,with impact velocity held constant, average accelerations increased only about 12%. Peakaccelerations increased approximately 50%.
With total mass held constant, variation of platform acceleration with impact velocitywas more pronounced. As impact velocity increased from 5.4 to 7.4 m/s for both chokes,the peak and average accelerations increased by about 100%.
The peak acceleration value, over the range of total mass and impact velocity test data,was approximately 100% greater than the average acceleration value. Bertin predicted the excessof peak over average acceleration to be only 50%.
There are some possible problems in practical use of these airbags. The skirts at timesacquired a fold that had to be pulled out before a drop. Cold weather stiffness of the airbagcoated fabric could affect deployment. Also, if the bags were wet and froze in the foldedposition, deployment could be affected. The airbag fabric did occasionally rip, but only whereweakened by abrasion with sharp-edged metal fasteners. Improved fastener design couldeliminate this problem.
The 2000 kg total mass limitation of these airbags would permit use with only the lightestof airdropped equipment. Bertin has also designed a scaled-up version of this airbag that hasa capacity four times as great. Eight of these larger airbags would handle an 8000 kg mass(17,600 lb weight).
The balloon-skirt airbags, although exhibiting premature skirt crush, did prove to bedurable, reusable and basically effective over an adequate range of total mass and impact velocity.If the abnormal skirt crush can be corrected, the balloon-skirt airbags have great potentialfor use as airdrop impact shock absorbers.
37

REFERENCES
1. Madaffer, M.C. Evaluation of Three Types of Airbag Decelerators by Drop Tests, TechnicalNote WCLE-54-11, Wright-Patterson AFB, Ohio, December 1953 (AD 857025).
2 Turnbow, J. and W. Ogletree. The Energy Dissipating Characteristics of Airbags, US ArmyQMR&E Command Contract DA 19-129-QM-1383 to University of Texas StructuralMechanics Research Laboratory, Austin, Texas, August 1959 (AD 228 787).
3. Tomcsak, S. Decelerator Bag Study, Technical Report WADC-TR-59-775,Wright-Patterson AFB Contract AF 33(600)-30825 to Goodyear Tire and Rubber Co.,Akron, Ohio, June 1960 (AD 243 159).
4. Browning, A.C. A Theoretical Approach to Airbag Shock Absorber Design, TechnicalNote ME369, Royal Aircraft Establishment, Farnborough, England, February 1963 (AD421 946).
5. Lebargy, P. Damping of Parachute Loads, Final Report, Technical Memorandum 681F29,Bertin & Co., Plaisir, France, November 1968.
6. Croix-Marie, F. and P. Lebargy. Airdrop Landing Platform Damper No. 1, Document79-58, Bertin & Co., Plaisir, France, November 1979.
38

APPENDIX
TEST DATA
39

8
4 DROP2E PA1323 k9CEERTO7.4nils1.G
-.20 -.15 -.10 -. 05 0 .05 .10 .15TIME, SECONDS
Figure . Velocity vs. ime, Drop 2E
IE 40
~20
0 .02 .04 .0 11.0 .10 .12 -.14TIME, SECONDS
Figure A2. Airbag Pressure vs. Time, Drop 2E
40
150a DROP2EZF 1323 kg
10 ~ 7.4nils
10
0 .02 .04 .06 .08 .10 .12 .14TIME, SECONDS
Figure A3. Platform Acceleration vs. lime, Drop 2E
30 DROP 2E132 Kg KE = 4=2N-m74 mi PER AIRBAG
AIG1ARA~20
10
:V ~~~ ~ AREA 430N=ARJ 4650 N -rn
PLATFORM DISTANCE ABOVE GROUND, cm
Figure A4. Airbag Force vs. Distance, Drop 2E
41

100
AIRWAI 13.3 PSI
80BALLOON4 11.2 PSI
-AIRIA 7AIRBAG iBALL.OON
13 ~SIRT__ _
DROP 7 SIRTA
7.4 MIS~40 -=_
0 .02 .04 .06 .08 .10 .12 .14 .16
Figure A6. Airbag Pressure vs. lime, Drop 7
PIA
-.15 -.10 -. 05 0 1 .05 .10 15 .20IME, SECONDS
Figure A5. Velocity vs. lime, Drop 7
42
20 DROP 7
C5 AIRBAG 7Trn/szi - LEFT CNE
F.ACCELEROMNETER AIRBAG ACELTEROERI 1I 7ACEEOlRCALCULATED A ____L' 10 ACC~ELERATION
CALCULATED
PLATFORM HITSIX ACLRTO0 .05 .10 .15 005 .10 .15
PUAT.HITS TIME, SECONDS
Figure A7. Platform Acceleration vs. Time, Drop 7
AIRBAG 1 DROP 7 AIRBAG
20 -- 4Is
KE =5740 N-mC3 PER AIRBAG
=000
Figure A Airbag Force vs. Distance, Drop 7
43
8
S0 0
00
-. 15 -. 10 -. 05 0 .05 .10 .15 20
TIME, SECONDS
Figure AD. Velocity vs. ime. Domp 6A
0 0
HIT_ 7 1,0 7
0 -.05 0 .05 .0 .15 .0
TIME , SE CONDS
Iigu AIO. nao v Ast. r Impact, Dm:
44
A5PS

16oI
19.3 PSI 20.5 PSI
120 n R AG IBALLOONBALLOON
0 .02 .04 .06 .06 .10 .12 .14 .16
TIME, SECONDS
Figure All. Airbag Pressure vs. ime, Dop 6A
t 25
10 AIR BAG 1AIRBAG 7
C.0O . 0 6 .0 ,10 .12
TIME, SECONDS
Figure A12. Platfol Acceleration vs. Time, Drop 6A
45
K
50
40 DROP 6A2032 k9
E 7.4N-m
__30 KE =6954N-mPER AIRBAG
z)
Lu AIRBAG 1h!20 AIRAG.12
0C10 LARAQ v
AREA = 6500N-m AREA N - m
60 40 20 60 40 20 0
PLATFORM DISTANCE ABOVE GROUND, cm
Figure A13. Airbag Force vs. Distance, Drop 6A
46