systems mapping for international benchmarking of uk
TRANSCRIPT

Systems mapping for
international benchmarking of
UK science and innovation .
Ian M Mitchell FORS
March 2015

Agenda
• Systems thinking in BIS
– Catalyst for policy
• Science and Innovation
Question
• Systems approach
• What we did
• Outputs
• Discussion
2

Outline
• O.R. structures problems
• Systems Thinking catalyses policy definition
• Systems Thinking with Causal Loop Diagrams
builds frameworks for complicated areas by
creating maps from stakeholder views.
• Maps summarise areas in terms acceptable to
policy leads and stakeholders.
• Success depends on a Socio-technical process
rather than an analytical exercise.
• Early is better: in the ROAMEF cycle, but also to
structure studies
3
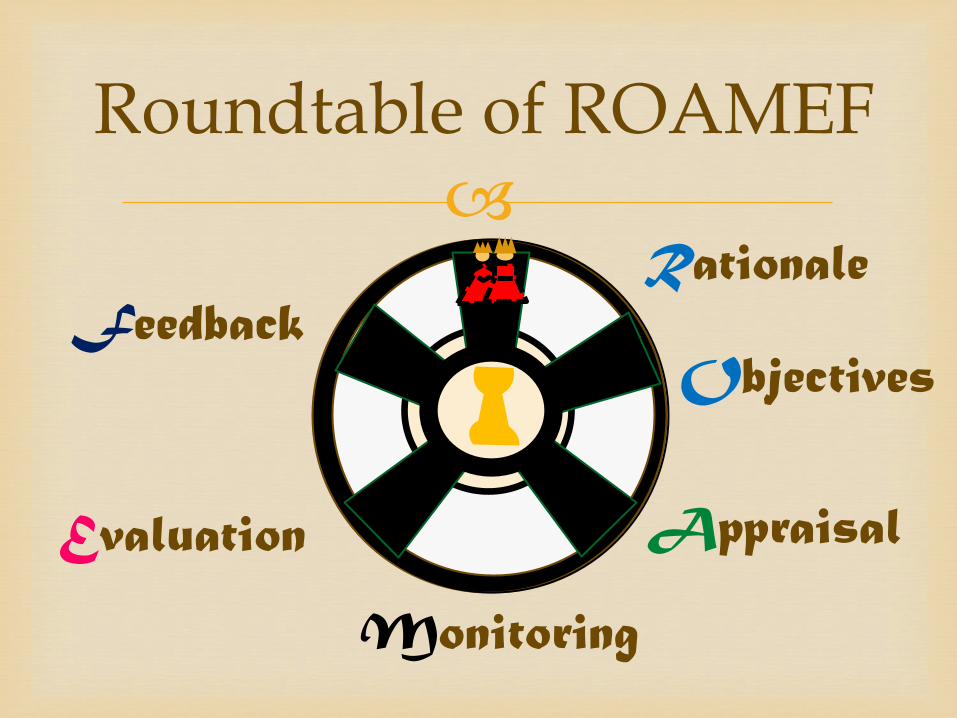
Roundtable of ROAMEF
Z
Rationale
Objectives
Appraisal
Monitoring
Evaluation
Feedback
5
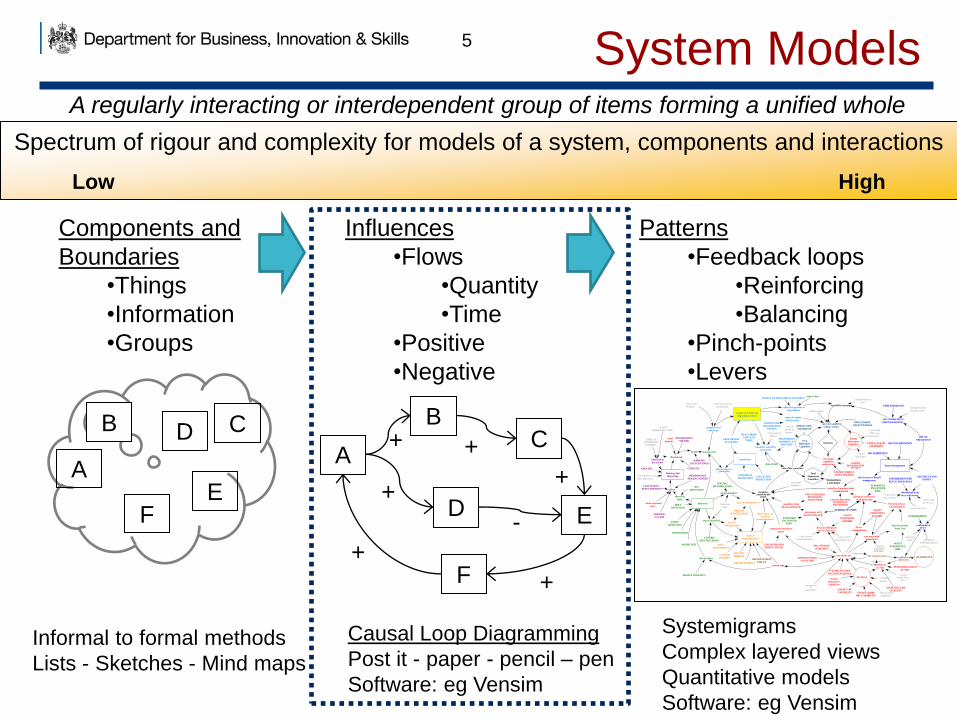
Spectrum of rigour and complexity for models of a system, components and interactions
Low High
Components and
Boundaries
•Things
•Information
•Groups
Influences
•Flows
•Quantity
•Time
•Positive
•Negative
Patterns
•Feedback loops
•Reinforcing
•Balancing
•Pinch-points
•Levers
Systemigrams
Complex layered views
Quantitative models
Software: eg Vensim
Informal to formal methods
Lists - Sketches - Mind maps
Causal Loop Diagramming
Post it - paper - pencil – pen
Software: eg Vensim
A
B
E
C
D
F
-
+
+
+
+ +
+ A
B
E
C
F
D hazard management
detection
Warning And
Reporting
protection
medical
countermeasures
PRETREATMENTS
POST
TREATMENTS
casualtiescaused by nbc
attack
COLLECTIVE
PROTECTION
INDIVIDUAL
PROTECTION
DECONTAMINATION
NBC HARDENING
in protection
effectiveness ofprotection
reduced tempo due to
degradation
casualties caused by
protection
rate of nbc casualties
loss of tempo due to
hazard management
total effect on tempo
reduced combat
effectiveness
attack type
effectiveness ofmedical
countermeasures
able to detect
casualties from direct
attack
Persistent Area
Contamination
casualties from persistent
contamination
nbc threat
rate of nbc useDETERRENCE
Outcome
POINT
DETECTION
MONITORING
proportion suffering
degradation effects
<time of day>
Enemy
Manoeuvre
Capabil ity
MEDICAL
SURVEILLANCE
NBC RECCE AND
SURVEY
Own
Manoeuvre
Capabil ity
GENERIC
THERAPY
WATER TEST
effectiveness of hazard
management
confirmationof use
attack identified
PROCESS
disseminate
ENEMYDEGRADATION
EFFECT
<Enemy
Manoeuvre
Capabil ity>
OPPORTUNITIES
TO USE NBC
ENEMY NBC
CAPABILITY
HEAT STRAIN
CASUALTY
TABLE
credibi li ty ofdeterrent
AGENT
PERSISTENT
HAZARD
AGENT
PERSISTENCE
TIME
ABILITY TO DETECT
PROPORTION
IN COLPRO
TIME FOR DECON
rate own capabil i ty
reduces enemy
rate enemycapabil ity
reduces own
INITIAL ENEMY
CAPABILITY
ENEMY COMBAT
EFFECTIVENESS
OWN COMBAT
EFFECTIVENESSINITIAL OWN
CAPABILITY
CASUALTIES PER
DIRECT ATTACK
AGENT
DOWNWIND
HAZARD
MANOEUVRE
DEGRADATION
EFFECT
EFFECT OF HEAT STRESS ON TEMPO
CAPABILITY USED
TO LAUNCH ATTACK
Nbc Attacks Used
Total
Manoeuvre
Casualties
<rate of
arrival in
theatre>
<conflict begins>
information
decay time
Decision To
Use Nbc PERCEIVED UTILITY
OF NBC
<currentenemy force
ratio>
NBC ATTACKS
AVAILABLE
CASUALTIES PERPERSISTENTENCOUNTER
PERSISTENTENCOUNTER
RATE
casualties from
downwind hazards
CASUALTIES PERDOWNWINDENCOUNTER
FORWARDENCOUNTER
RATE
potential encounters
with persistent
NUMBER OF UNITSencounters with
downwind hazards
action
collect
C3IDELAY
INFORMATION
PER ENCOUNTER
detection
made
ANY
DETECTION
INFORMATION
NEEDED
GENERIC
IDENTIFICATION
agent identi fied
SPECIFIC
IDENTIFICATION
specific therapy given
<mean persistent
encounter rate>
<MEDICAL
SURVEILLANCE>
ENEMY RELEASE
OF AGENT
generic
therapy given
AREA
DETECTION
DECON
FREQUENCY
direct
contamination
WARNING
EFFECTIVENESS
ENEMY STRIKE
NBC CAPABILITY<Enemy Strike
Capability>
<own strike
effects on
manoeuvre>
<time of day>
<time in ipe
vs agent>
proportion of
time in ipe
<time in ipe due to
conventional>
Rate Persistent
Areas Lost
<personnel
multiplier>
CONFIRMATION
SPECIFIC
THERAPY
<detection
made>
<detection
made>
<AGENT
PERSISTENCE TIME>
<TIME OFDOWNWIND
HAZARD>
COLLECTION
EFFECTIVENESS
<proportionvs
manoeuvre>
PRETREATMENT
TAKE UP
PERSONNEL
LOSS RATE
<Personnel In
Theatre>
PROPORTION
WORKING AT
MAX RATE
<enemy
surrender>
<effectiveness of
locs>
<conflict
begins>
Downwind Hazards
In Forward Area
<rate forward
hazards disperse><rate forward
hazards move on>
<total
hazards>
information from
recce and survey
INFORMATION PER
RECCE AND SURVEY
<rate of nbc
use vs locs>
<rate of nbc
use vs strike>
<rate of nbc use>
<information from
recce and survey>
<total encounter
rate>
rate persistent
hazard laid
<AGENTFALLOUTHAZARD>
WARNING
FACTOR
<rate of nbc
use vs locs>
System Models A regularly interacting or interdependent group of items forming a unified whole

Workshop Brief
Activity 1 Introduction Background and Brief overview of the method
Activity 2 Agree broad areas Consider and agree broad areas of influence that should be covered by the map,
Activity 3 Generate Variables Generate key variables that reflect the interest of the client
Activity 4
Identify Causes, Effects, Feedbacks and Data Map how each variable affects the variable of interest and other variables in the diagram. Identify additional variables and how they impact on the system Consider the data available on these
Activity 5 Wash Up Review workshop output
SAI Question
• What does international comparative evidence tell
us about the priority actions for the UK’s Science
and Innovation System and its contribution to the
economy, if we are to maintain a global leadership
position in this domain?

Components 8
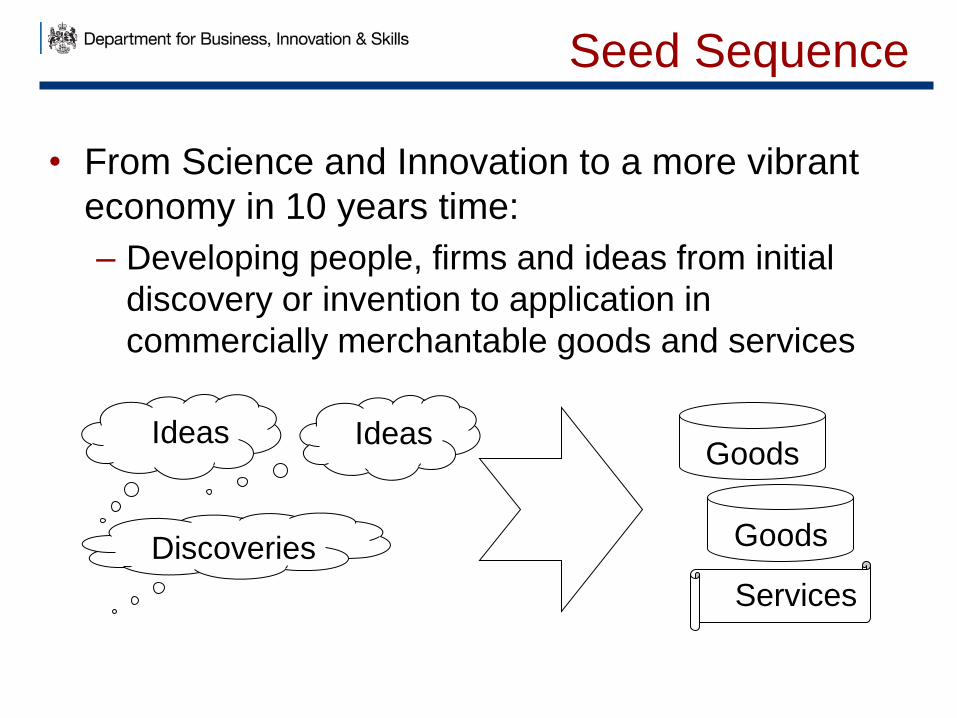
Seed Sequence
• From Science and Innovation to a more vibrant
economy in 10 years time:
– Developing people, firms and ideas from initial
discovery or invention to application in
commercially merchantable goods and services
Ideas
Discoveries
Ideas Goods
Goods
Services
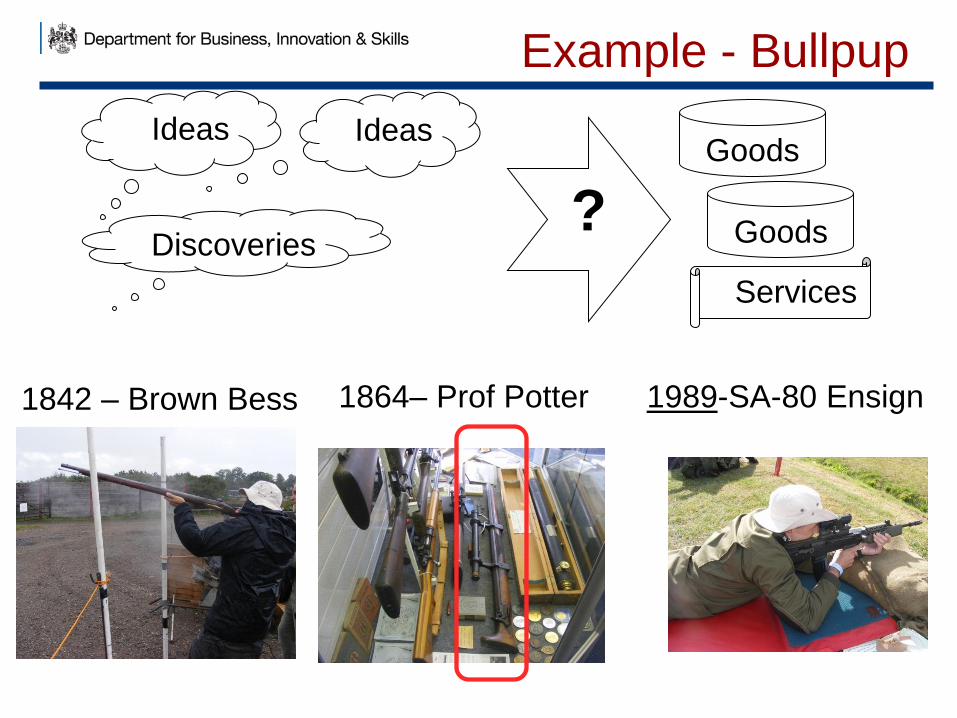
Example - Bullpup
Ideas
Discoveries
Ideas
?
Goods
Goods
Services
1842 – Brown Bess 1864– Prof Potter 1989-SA-80 Ensign
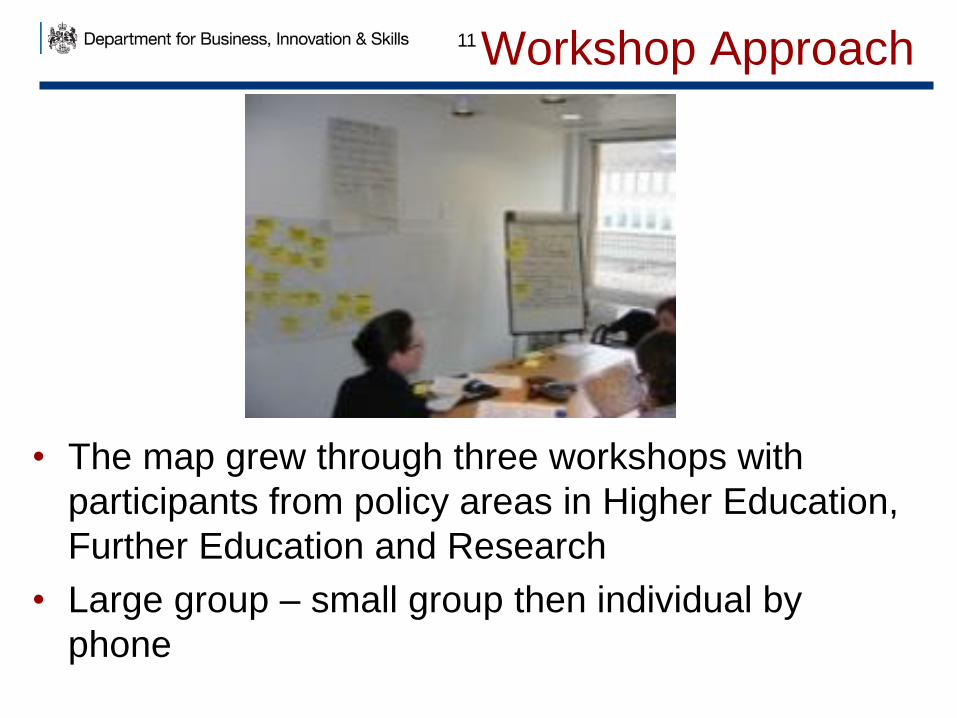
Workshop Approach
• The map grew through three workshops with
participants from policy areas in Higher Education,
Further Education and Research
• Large group – small group then individual by
phone
11
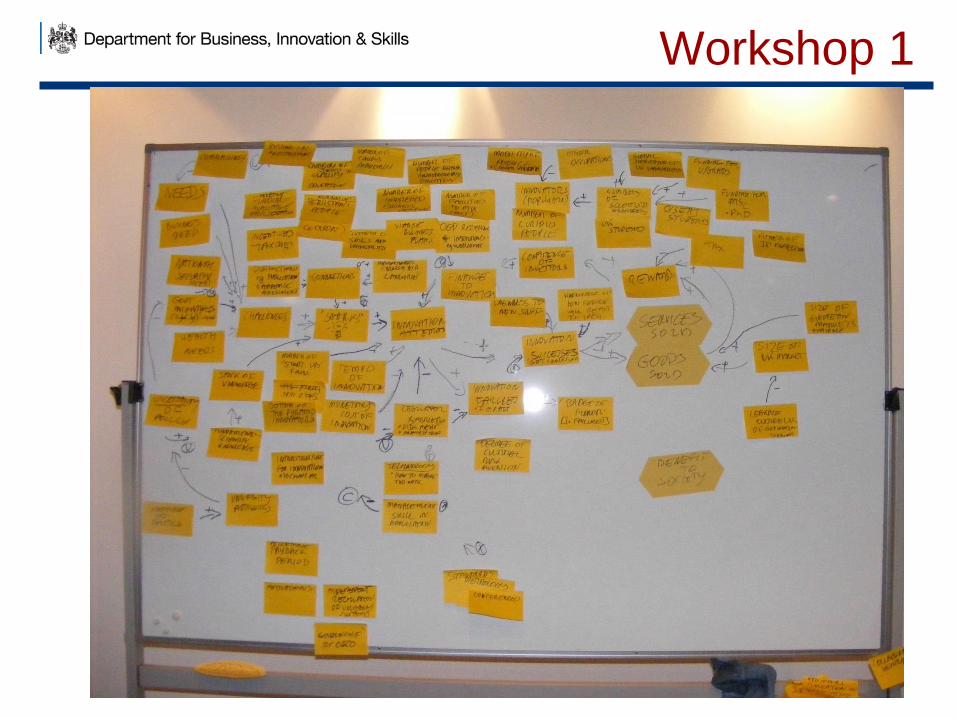
Workshop 1

Workshop 2
• Research area
• Two variables from Workshop 1 as seeds and
connectors
13

Single view
Needs
Business
Needs
National
Security Needs Health
NeedsGovernmentIncentives egCyber Sy,Longitude
Challenges
"Sparks" -
Innovation
ideas
Innovation
Attempts
Connections
Complacency
-
Buying In
"Upstream"
Number ofStudents in
qualityeducation
++
+
+
+ +
+
+InnovationSuccesses
Innovation
failures
Severity ofImpact of
failure
Regulatory
Barriers -Risk
averse prohibition
Tempo of
Innovation
Monetarycost of
Innovation
Numbers ofBottom ofPyramid
Innovators
Uncertainty
of Policy
Independence
from Politics
Number ofSpin Offs
(academicsresearch)
Number of
Start Ups
Infrastructure for
Innovation -
Technical
University
Autonomy
Stock of
knowledge
+
AcceptablePaybackPeriod
Motivation
Regulation ofUniversitysystems
"Governance"
per OECD
Standards
Metrology
Conferences
+
-
Number ofcurious
academics
Number ofpersistantpeople
Relativeavailabilty of
researchfunding
Incentives:
Tax credits
Distractions eg
Publications for
academic
assessments
Numbers of
Inspirational
Innovators
(Edisons)
Clusters ofSMEs andUniversities
Anglophones: number of
English speakers
Finance for
innovation
Numbers ofinterestedbusinesspeople
Technology:How to make
this work
+
-
Managementskills in
application
Degree ofCultural risk
aversion
-
-
+
+
Acceptance offailure as a
Badge of Honor
Number of
Curious
People
Mobility of
People - eg
career
structures
Knowledgeof how
people willreact to idea
Openness to
New ideas
Confidence
of Investors
Viable
Business
Plans
Number of moves to
Other OccupationsOGDResearch
Funds
ResearchCouncil
InstitutionResearch
funds
+
Population of
Innovators
+
-
Services
sold
Goods
sold
Benefits to Society
++
+
+
-
-
+
+
Rewards
++
+
Fitness ofIntellectual
Proprty rightprotection
Funding for
Undergraduates
Funding for
MSc
Funding for
PhD
Numbers of
UK students
Number ofOverseasStudents
Number ofScientists
andEngineers
Size of UK
Market
Size ofEuropeanMarketsavailable
Leakage
outside UK of
exploitation
(eg Skylon)
Number offacilities to
"mix" eg MIT
+
+
+
+
+
+
+
-
+
++
-
+
++
++
+
-
+
-
-
+
Government
Revenue
+++
+
+
++
+
+
Prestige of
area +
++
-
+
ExcellentResearch
conducted
+
+
+
Partnerships
International
Investment
Access to
Researchers of
choice
Business - UserUniversity
interactions
Extent ofdiffusion ofknowledge
Publications
of Research
Intellectual
Property
Solutions to
National
challenges
+
New
Technologies
designed
Quality andquantity ofResesearchtechnology
facilities
Discoveries
made
+
+
+
+ +
+
+
+ +
+
Degree of
excellence of
research
+
+
TrainedSkilled
Individuals
AbsorbativeCapacity for
Researchelsewhere
Quality ofresearch
environment
+
+
+
+
+
+
+
+
++
+
+
+
+
+
+
+
+
+
+
-
+
+
-
Valley of death
+
HE Establis
hments
FE Establish
ments
Size of local
economies
Apprentices
hips
ERDFClean money
Hubs eg
Shoreditch
Techniums
Science
Cities
Licences
software
licences -
otherIP based
companies
Graduate
firms
Industrial
investment CPD
participants
Innovative
Companies
Overseas
alumni
UK Trade
Trade
network
+
+
Funds for
HE
+
+
+
+
+
+
IDEAS
MONEY
PEOPLE
FIRMS
COMMERCE
+
CULTURE
Profile of
Area
+
Coverage of
Area
+
+

Mk 6A Summary
Needs
Sparks
Innovation
ideas
Innovation
Outputs
Innovation
Successes
Goods and
Services Sold
Rewards
Confidence
of Investors
Innovation
Resources
+
+
+
++
+
+
Connections
+
<Caution>
-"Valley of
Death"
Commerce
InnovationPipeline
Knowledge assets
Talent
Feedback
<Friction>
-
Structures andIncentives
++
+
+
+
+
Money
+
+

Mk 6A – Cycles
Needs
Challenges
Sparks
Innovation
ideas
Innovation
Outputs
Innovation
Successes
Goods Sold
Services
Sold
Rewards
Coverage
Profile
Confidence
of Investors
Innovation
Resources
+
+
++
+
+
+
+
+
+
+
+
Connections
+
<Number of Inspirational
innovators (Edisons)>
+<Population of
innovators> +
<P7 : Absorptive
Capacity>
+<Viable Business
Plans>
+<Extent of diffusion of
Knowledge>
+
<Demand>
+ +
<Caution>
- <Leakage outside UK of
exploitation (eg Skylon)>
-
<Knowledge of how
technology works>
+"Valley of
Death"
Commerce
InnovationPipeline
KnowledgeAssets
Talent
Feedback
<National Security
Needs>+
<Health Needs>
+
<Friction>
-
Structures andIncentives
<Finance for
innovation>
+
O2: Sales of
new to market
and new to firm
innovations
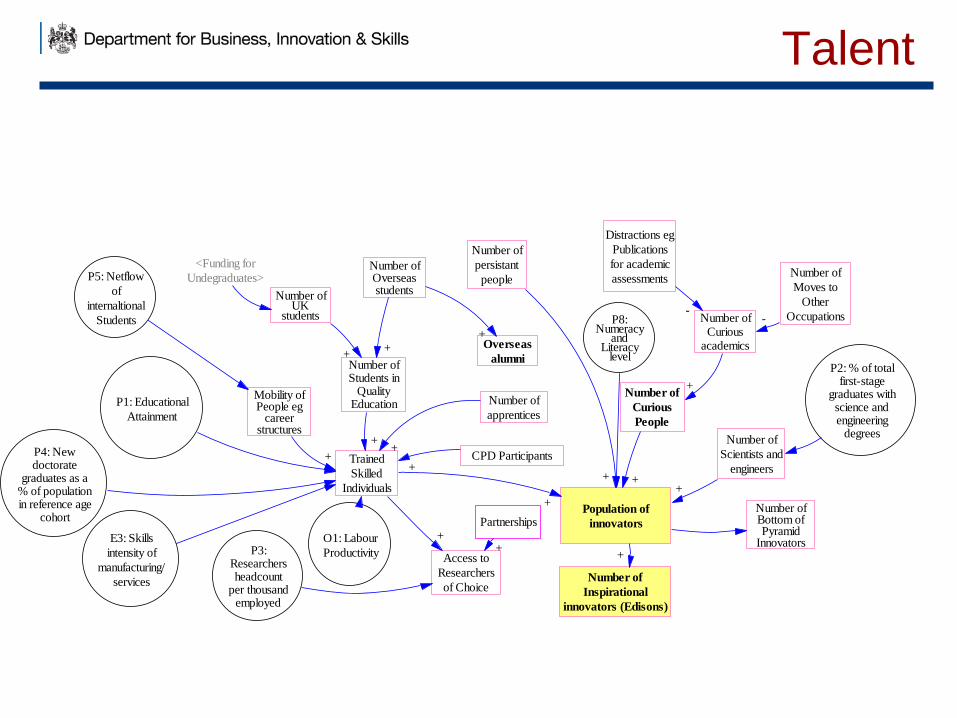
Talent
Number of
Moves to
Other
Occupations
Distractions eg
Publications
for academic
assessments
CPD ParticipantsTrained
Skilled
Individuals
Population of
innovators
Mobility ofPeople eg
careerstructures
Number of
Curious
People
Number of
Scientists and
engineers
Number ofCurious
academics
Number ofUK
students
Number ofOverseasstudents
Number of
apprentices
Number of
Inspirational
innovators (Edisons)
Number of
persistant
people
++
+
++
+
--
Number ofStudents in
QualityEducation
+
+ Number ofBottom ofPyramid
Innovators
++
+
+
Access to
Researchers
of Choice
+Partnerships
+
Overseas
alumni
+
<Funding for
Undegraduates>
P1: Educational
Attainment
P2: % of totalfirst-stage
graduates withscience andengineering
degrees
P3:Researchersheadcount
per thousandemployed
P4: Newdoctorate
graduates as a% of populationin reference age
cohort
P5: Netflow
of
internaltional
Students P8:Numeracy
andLiteracy
level
E3: Skills
intensity of
manufacturing/
services
O1: Labour
Productivity

Structures & Incentives
S3: State of
Clusters of
SMEs and
Universities
Number of
facilities to
"mix" eg MIT
Standards
Metrology
Anglophones-
numbers of
english
speakers
IP Based
companies
ViableBusiness
Plans
P7 :
Absorptive
Capacity
+
+
+
+
+
Innovative
Companies
AcademicSpin offs(academicresearch)
Hubs eg
Shoreditch
+
E5: Start uprates per
100kpopulation=Number ofStart Ups
+
+
+
Technicums
+
Graduate
Firms+
+
Conferences+
<New Technologies
designed>
+HE
EstablishmentsFE
Establishments
Science
Cities
S2: FirmsCollaboratingon innovation= Business
UserUniversity
Interactions
+
+
Infrastructure
for Innovation
- Technology
+ +
Numbers of
Interested
Business People
+ Management
Skills in
Application
+
+
P6:management
andleadership
skills
O6: SMESintroducingproduct orprocess
innovations
O7: SMEsintroducing
marketing ororganisation
alinnovations
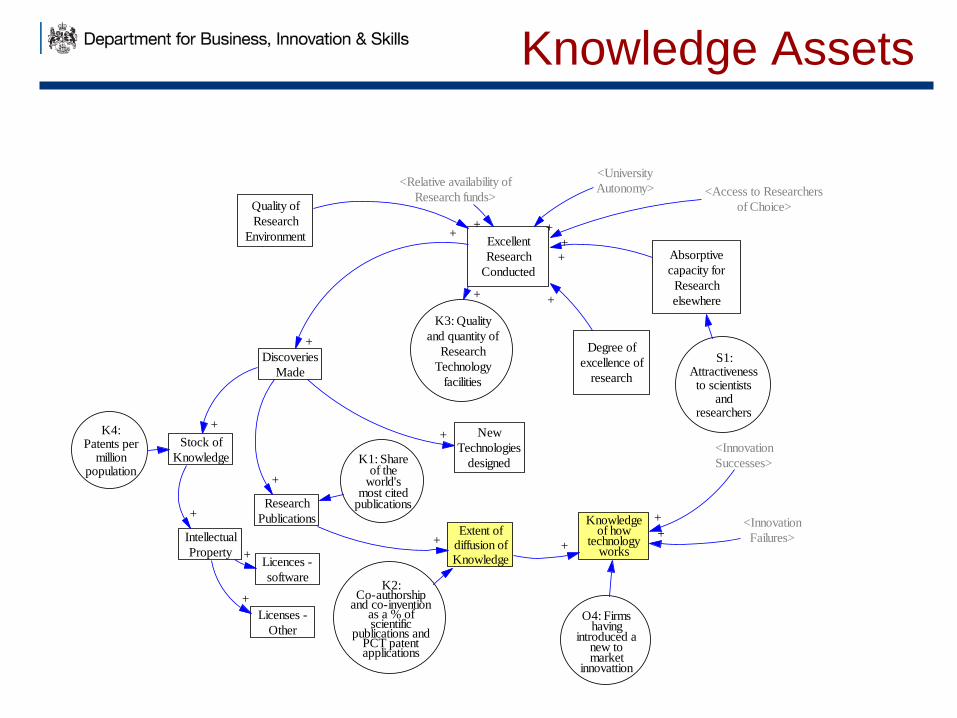
Knowledge Assets
Excellent
Research
Conducted
Degree of
excellence of
research
K3: Quality
and quantity of
Research
Technology
facilities
Discoveries
Made
Stock of
Knowledge
Intellectual
Property
Licenses -
Other
Licences -
software
+
+
Extent ofdiffusion ofKnowledge
Research
Publications
+
+
+
+
New
Technologies
designed
+
+ +
Absorptive
capacity for
Research
elsewhere
+
Quality of
Research
Environment +
+
<Access to Researchers
of Choice>
+
<University
Autonomy>
+
Knowledgeof how
technologyworks+
<Innovation
Successes>
+ <Innovation
Failures>+
<Relative availability of
Research funds>
+
K1: Shareof the
world'smost cited
publications
K2:Co-authorship
and co-inventionas a % ofscientific
publications andPCT patentapplications
K4:Patents per
millionpopulation
S1:Attractiveness
to scientistsand
researchers
O4: Firmshaving
introduced anew tomarket
innovattion

Money
Finance for
innovation
Clean
Money
AcceptablePaybackperiod
+ +
Investor
Confidence
+
Funding for
PhD
Funding for
MSc
Funding for
Undegraduates
Government
Revenues +
+
+
Research council
Institution
Research Funds
+
OGD
Research
Funds
Relative
availability of
Research funds
Incentives
Tax Credits
-
+
Industrial
Investment
+
ERDF
International
investment+
+
+
Size of UK
Market
Size of
European
Market
UK trade
Trade
network
+
+
Demand
++
<Overseas
alumni>
+
Local
economies
+
<Science Cities>
+
State of
economy+ +
+
M1: R&Dfundingfrom
abroad as% of GERD
M2: Extentto which FDIbrings newtechnology
into thecountry
M3:
BERD
intensity
M4:Percentage
of GERD
financed by
Goverrnment
M5: Venture
Capital as %
of GDP
M6: Abilityto finance
through localequity
markets
M8: NonR& D
innovationexpenditureas % of totalexpenditure
E2: Intensity
of
Competition
E4:Quality ofdemand
conditionsO3:
Knowledgeintensiveservicesexports
O5:
Technology
balance of
payments
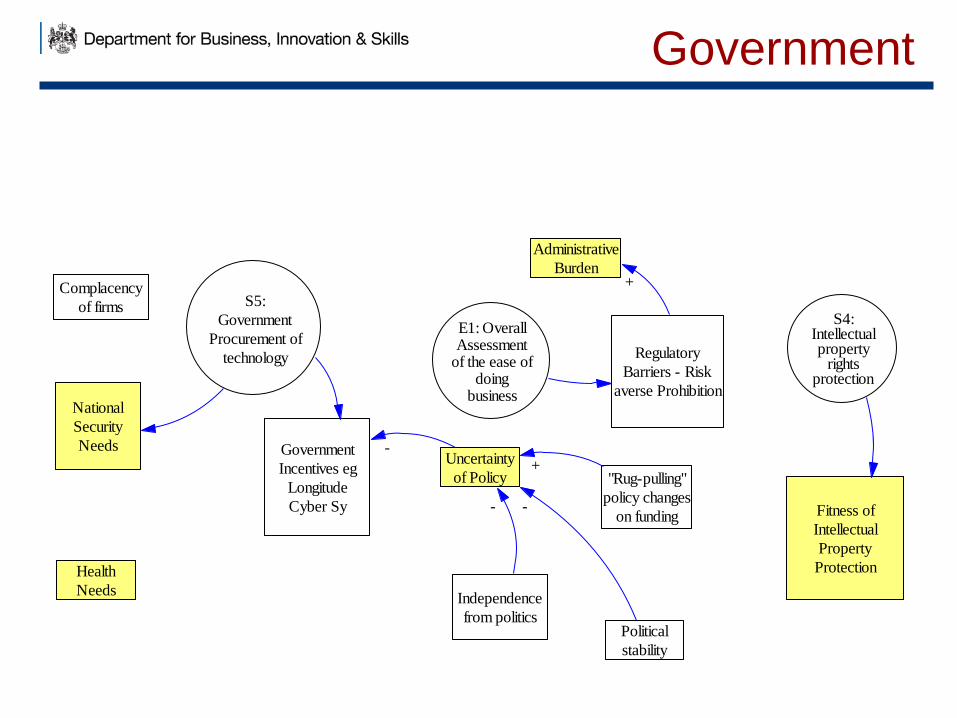
Government
Government
Incentives eg
Longitude
Cyber Sy
Uncertainty
of Policy
-
Regulatory
Barriers - Risk
averse ProhibitionNational
Security
Needs
Fitness of
Intellectual
Property
ProtectionHealth
Needs
Complacency
of firms
Independence
from politics
-
"Rug-pulling"
policy changes
on funding
+
Administrative
Burden+
Political
stability
-
S5:
Government
Procurement of
technology
S4:Intellectualproperty
rightsprotection
E1: OverallAssessment
of the ease ofdoing
business
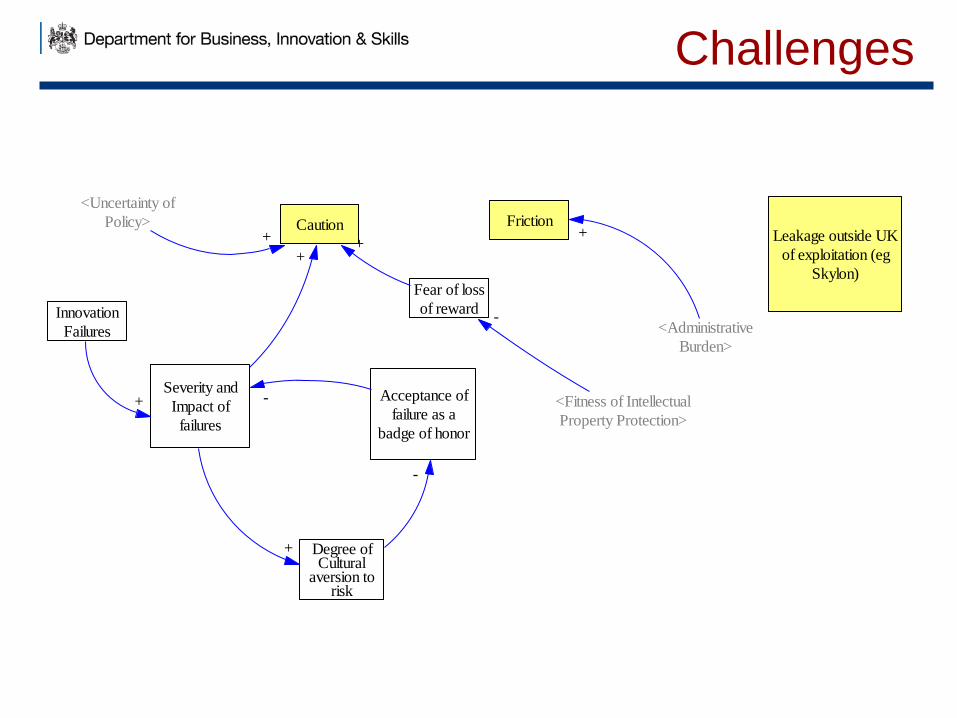
Challenges
Leakage outside UK
of exploitation (eg
Skylon)
Degree ofCultural
aversion torisk
Innovation
Failures
Severity and
Impact of
failures
Acceptance of
failure as a
badge of honor
-
-
+
+
Caution
+
<Uncertainty of
Policy>+
Fear of loss
of reward
+
<Fitness of Intellectual
Property Protection>
-
Friction
<Administrative
Burden>
+

Needs
Business
Needs
National
Security Needs Health
NeedsGovernmentIncentives eg
Cyber Sy,Longitude
Challenges
"Sparks" -
Innovation
ideas
Innovation
Attempts
Connections
Complacency
-
Buying In
"Upstream"
Number ofStudents in
qualityeducation
++
+
+
+ +
+
+InnovationSuccesses
Innovation
failures
Severity ofImpact of
failureRegulatory
Barriers -Risk
averse prohibition
Tempo of
Innovation
Monetarycost of
Innovation
Numbers ofBottom ofPyramid
Innovators
Uncertainty
of Policy
Independence
from Politics
Number ofSpin Offs
(academicsresearch)
Number of
Start Ups
Infrastructure for
Innovation -
Technical
University
Autonomy
Stock of
knowledge
+
AcceptablePaybackPeriod
Motivation
Regulation ofUniversitysystems
"Governance"
per OECD
Standards
Metrology
Conferences
+
-
Number ofcurious
academics
Number ofpersistant
people
Relativeavailabilty of
researchfunding
Incentives:
Tax credits
Distractions eg
Publications for
academic
assessments
Numbers of
Inspirational
Innovators
(Edisons)
Clusters ofSMEs andUniversities
Anglophones: number of
English speakers
Finance for
innovation
Numbers ofinterestedbusinesspeople
Technology:How to make
this work
+
-
Managementskills in
application
Degree ofCultural risk
aversion
-
-
+
+
Acceptance offailure as a
Badge of Honor
Number of
Curious
People
Mobility of
People - eg
career
structures
Knowledgeof how
people willreact to idea
Openness to
New ideas
Confidence
of Investors
Viable
Business
Plans
Number of moves to
Other Occupations
OGDResearch
Funds
ResearchCouncil
InstitutionResearch
funds
+
Population of
Innovators
+
-
Services
sold
Goods
sold
++
+
+
-
-
+
+
Rewards
++
+
Fitness ofIntellectual
Proprty rightprotection
Funding for
Undergraduates
Funding for
MSc
Funding for
PhD
Numbers of
UK students
Number ofOverseasStudents
Number ofScientists
andEngineers
Size of UK
Market
Size ofEuropeanMarketsavailable
Leakage
outside UK of
exploitation
(eg Skylon)
Number offacilities to
"mix" eg MIT
+
+
+
+
+
+
+
-
+
++
-
+
++
++
+
-
+
-
-
+
Government
Revenue
++
+
+
+
++
+
+
Prestige of
area+
++
-
+
ExcellentResearch
conducted
+
+
+
Partnerships
International
Investment
Access to
Researchers of
choice
Business - UserUniversity
interactions
Extent ofdiffusion ofknowledge
Publications
of Research
Intellectual
Property
Solutions to
National
challenges
+
New
Technologies
designed
Quality andquantity ofResesearchtechnology
facilities
Discoveries
made
+
+
+
+ +
+
++
+
+
Degree of
excellence of
research
+
+
TrainedSkilled
Individuals
AbsorbativeCapacity for
Researchelsewhere
Quality ofresearch
environment
+
+
+
+
+
+
+
+
++
+
+
+
+
+
+
+
+
+
+
-
+
+
-
Valley of death
+
HE Establis
hments
FE Establish
ments
Size of local
economies
Apprentices
hips
ERDFClean money
Hubs eg
Shoreditch
Techniums
Science
Cities
Licences
software
licences -
otherIP based
companies
Graduate
firms
Industrial
investmentCPD
participants
Innovative
Companies
Overseas
alumni
UK Trade
Trade
network
+
+
Funds for
HE
+
+
+
+
+
+
KNOWLEDGE
ASSETS
MONEY
TALENT
STRUCTURES &
INCENTIVES
INNOVATION
OUTPUTS
+
BROADER
ENVIRONMENT
Profile of
Area
+
Coverage of
Area
+
+
STRUCTURES
& INCENTIVES
KEY
MONEY
KNOWLEDGE
ASSETS
TALENT
INNOVATION
OUTPUTS
BROADER
ENVIRONMENT
STRUCTURES
& INCENTIVES
KEY
MONEY
KNOWLEDGE
ASSETS
TALENT
INNOVATION
OUTPUTS
BROADER
ENVIRONMENT
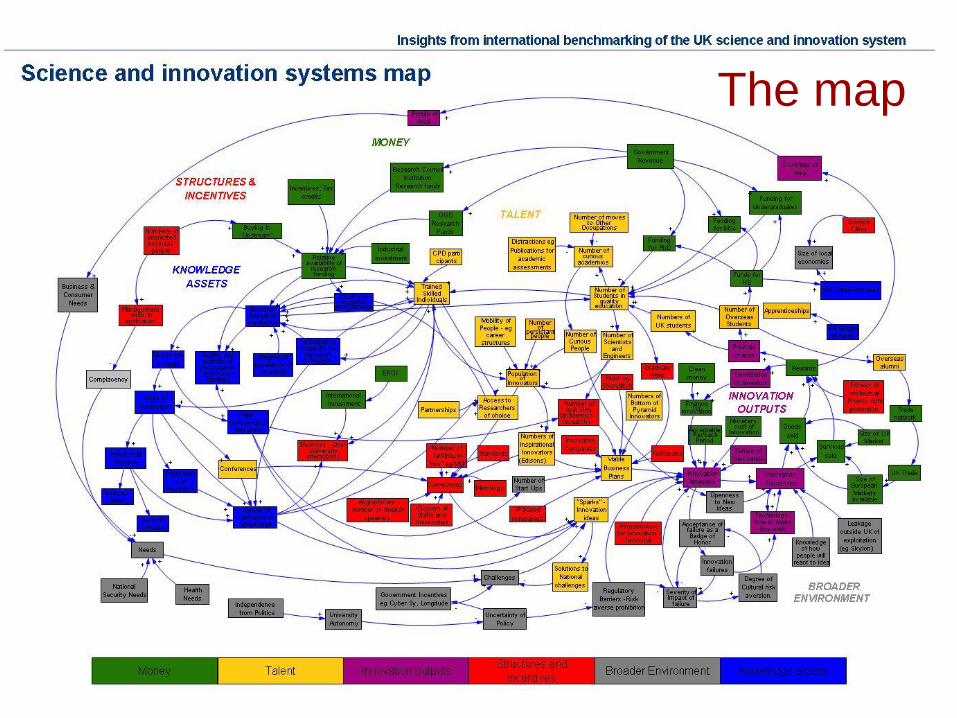
The map
Outputs

System mapping offers a useful
technique to represent the views of a
large number of people, to determine
boundaries, components and relative
dependencies within a system. The OR
Unit in BIS used Causal Loop
Diagramming as described by Peter
Senge in the Fifth Discipline.
The Facilitators built influence diagrams
representing the views of the
participants, creating the components
and relationships with Post-its and
points arising from discussion on
whiteboards. The Systems map that
resulted, drawn in Vensim, illustrates
the complexity of the science and
innovation system and many feedback
loops within it.
The map grew through three
workshops with participants from
policy areas in Higher Education,
Further Education and Research, and
was further informed by discussion with
members of the Intellectual Property
Office and the National Measurement
Office. The map informed discussions
between analytical communities of OR
and the Economists compiling data.
Actors within the system include the
government, public services, higher
and further education, business and
industry, financial markets, customers
and citizens, learned societies and
charities.
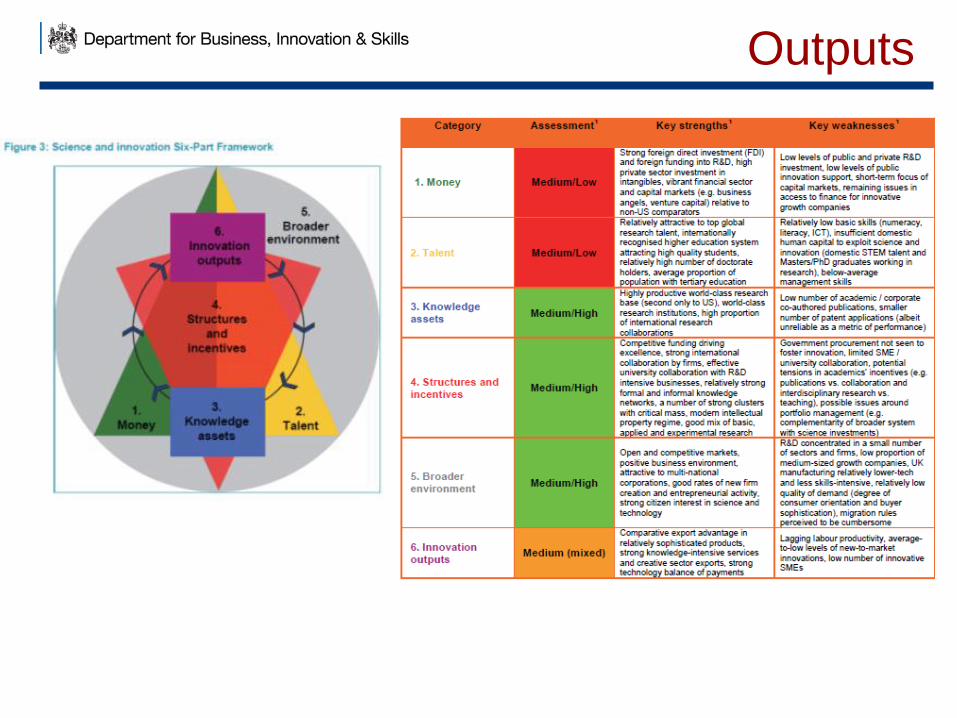
A Six-Part Framework
reflecting key elements of
the system allowed
benchmarking of the UK
against key comparator
countries.
This work found broad
consensus and empirical
evidence about the key
features of effective science
and innovation systems.
Foreword from
BIS Permanent Secretary Martin
Donnelly and
Director General, Knowledge
and Innovation Sir John O’Reilly
Britain’s prosperity in a rapidly
changing global economy
depends critically on the quality
and quantity of our science,
innovation and skills.
To achieve sustainable growth
we need to examine carefully the
evidence of how others are
approaching these challenges, to
see what we can learn.
This report takes a longer-term,
strategic view and provides a
valuable contribution to our
evidence base. As such it will
help us to build on the UK’s
world class science base and
innovation infrastructure to
secure our future prosperity.
https://www.gov.uk/government/publications/science-and-innovation-system-international-
benchmarking

Social - Advantages
• Buy in
– The process aggregates participants’ views
• Common understanding
– Context and connections for the participants
become visible
• Immediate Engagement
– Speed in use
– Essential to obtain engagement