systems engineering analysis for optimum selection
TRANSCRIPT

LMU/LLS Theses and Dissertations
Summer July 2018
Systems Engineering Analysis for Optimum Selection Protocol for Systems Engineering Analysis for Optimum Selection Protocol for
Thermal Expansion Measurement of a Carbon Fiber Reinforced Thermal Expansion Measurement of a Carbon Fiber Reinforced
Composite Tube Composite Tube
Ronald Uchimiya Loyola Marymount University, [email protected]
Follow this and additional works at: https://digitalcommons.lmu.edu/etd
Part of the Systems Engineering Commons
Recommended Citation Recommended Citation Uchimiya, Ronald, "Systems Engineering Analysis for Optimum Selection Protocol for Thermal Expansion Measurement of a Carbon Fiber Reinforced Composite Tube" (2018). LMU/LLS Theses and Dissertations. 322. https://digitalcommons.lmu.edu/etd/322
This Research Projects is brought to you for free and open access by Digital Commons @ Loyola Marymount University and Loyola Law School. It has been accepted for inclusion in LMU/LLS Theses and Dissertations by an authorized administrator of Digital Commons@Loyola Marymount University and Loyola Law School. For more information, please contact [email protected].

SYSTEMS ENGINEERING ANALYSIS FOR OPTIMUM SELECTION PROTOCOL FOR THERMAL EXPANSION MEASUREMENT OF A CARBON
FIBER REINFORCED COMPOSITE TUBE
By
Ronald Uchimiya
A research paper presented to the
Faculty of the Department of
Systems Engineering
Loyola Marymount University
In partial fulfillment of the Requirements for the Degree
Master of Science in Systems Engineering
January 18, 2018

CTE Measurement Using Strain Gage Methodology
Page 1
SYSTEMS ENGINEERING ANALYSIS FOR OPTIMUM SELECTION PROTOCOL FOR THERMAL
EXPANSION MEASUREMENT OF A CARBON FIBER REINFORCED
COMPOSITE TUBE Loyola Marymount University, Systems Engineering Leadership Program
Ron Uchimiya
Abstract A material’s Coefficient of Thermal Expansion (CTE) is a valuable physical property, particularly for structural fiber reinforced composites that are routinely used in satellite/aerospace applications. Satellite space structures are routinely designed with a high degree of dimensional and thermal stability. Designing and verifying for near zero CTE performance is a common design requirement. The CTE is routinely a physical property with known values for common materials. However, the strength, stiffness and CTE properties on a multi-ply graphite fiber reinforced laminate composite can be tailored to specific engineering requirements. Because of this, a method of verification (testing) is routinely performed to ensure these requirements are met.
CTE Measurement Using Strain Gage Methodology
Page 2
Contents Executive Summary ....................................................................................................................................... 4
Introduction .................................................................................................................................................. 5
Figure 1: Example of Thermal Strain Measurement ............................................................................ 5
Overview of Systems for Thermal Strain Measurement ............................................................................... 6
Figure 2: Thermal Strain Measurement Methods ............................................................................... 6
Applying System Engineering Approach ................................................................................................... 6
Figure 3: Ranking of Methods .............................................................................................................. 7
Figure 4: Venn diagram of Methods & Capabilities ............................................................................. 8
Interferometry Systems ............................................................................................................................ 8
Figure 5: Michelson Laser Interferometer ........................................................................................... 9
Figure 6: Wavelengths of Light ............................................................................................................ 9
Dilatometer Systems ............................................................................................................................... 10
Figure 7: Basic Quartz Rod Dilatometer ............................................................................................. 10
Figure 8: Quartz Rod Dilatometer ...................................................................................................... 11
Digital Image Correlation ........................................................................................................................ 11
Figure 9: Digital Image Correlation Setup .......................................................................................... 12
Resistive Strain Gage Methodology ............................................................................................................ 12
Figure 10: Resistive Strain Gage Thermal Strain Measurement System ............................................ 12
Test Article Definition ............................................................................................................................. 13
Figure 11: Excel Laminate Calculations .............................................................................................. 14
Figure 12: Carbon Fiber Reinforced Composite Tube Sample ........................................................... 14
Reference Standard Definition and Selection Criteria ............................................................................ 15
Figure 13: Corning ULE 7972 “Zero-CTE” Reference Standard .......................................................... 15
Other Test Samples ................................................................................................................................. 15
Strain Gage Selection .............................................................................................................................. 16
Strain Gage Bonding................................................................................................................................ 16
Figure 14: Test Samples prepared for Strain Gage bonding .............................................................. 16
Strain Gage Leadwire Selection .............................................................................................................. 17
Figure 15: Completed Strain Gage Installation on Corning ULE 7972 Glass Standard ....................... 17
Figure 16: Completed Strain Gage Installations ................................................................................. 18
Thermocouple Installation ...................................................................................................................... 18
Figure 17: Completed Installation on Carbon Fiber Reinforced Composite Tube ............................. 19

CTE Measurement Using Strain Gage Methodology
Page 3
Sensor Calibration ................................................................................................................................... 19
Vishay System 5000 Data Acquisition System ........................................................................................ 20
Figure 18: Completed Strain Gage & Thermocouple Installations ..................................................... 20
Thermal Chamber Definition .................................................................................................................. 21
Figure 19: Test Samples in Thermal Chamber ................................................................................... 21
System Measurement Checkouts ........................................................................................................... 22
Data Review ............................................................................................................................................ 23
Figure 20: Thermal Strain vs Temperature Graph: All Samples ........................................................ 23
Figure 21: Thermal Strain vs Temperature Graph: ULE Reference Standard ................................... 24
Figure 22: CTE Calculations from 4th Order Polynomial Trendline Equation ..................................... 25
Figure 23: CTE Comparison at 24⁰C ................................................................................................... 25
Risk Management ................................................................................................................................... 26
Figure 24: Risk Chart .......................................................................................................................... 26
Product & Test Article Safety .............................................................................................................. 27
Requirements Verification ...................................................................................................................... 28
Figure 25: Requirements Verification Matrix ..................................................................................... 28
Cost Summary & Estimates ..................................................................................................................... 28
Figure 26: Cost Estimate .................................................................................................................... 28
Project Schedule ..................................................................................................................................... 29
Figure 27: Project Schedule ............................................................................................................... 29
Quality Principles .................................................................................................................................... 29
Lean Strategies ........................................................................................................................................ 29
Lessons Learned ...................................................................................................................................... 30
Project Assessment ................................................................................................................................. 30
Recommendations .................................................................................................................................. 30
Acknowledgements ................................................................................................................................. 31
Endnotes ................................................................................................................................................. 31

CTE Measurement Using Strain Gage Methodology
Page 4
Executive Summary The primary goal of this project was to apply a Systems Engineering approach in examining thermal strain measurement methods that would optimize the selection protocol for CTE measurement of a carbon fiber reinforced composite tube.
While the CTE for metallic or standard plastic materials is often a well-known physical property such is not the case with structural fiber reinforced composites. Space structures are routinely designed with a high degree of dimensional and thermal stability. Designing and verifying for near-zero CTE performance is a common design requirement for structural fiber reinforced composites used for satellite/aerospace applications. A composites’ CTE is dependent on its laminate properties; number of plies, fiber orientation and resin system. Measuring a composites’ CTE, in this application, becomes necessary for design or manufacturing process verification.
Laser interferometry, with its use of a coherent light wavelength as a measurement standard, provides the highest accuracy and precision amongst all methods. Modern digital image correlation methods offers ease of use, as well as a highly descriptive full-strain field assessment of a test specimen. The quartz rod dilatometer method is a proven, reliable method accepted by the ASTM D696 standard.
For this project, the resistive strain gage thermal measurements were limited to -40⁰C to 24⁰C, primarily for safety and cost limitations - not for technical reasons. A Corning ULE 7972 glass reference standard was used as a “zero-CTE” reference and all CTE calculations made from the thermal strain measurements were relative to this standard. Vishay Micro-measurements Technical Note TN-513 contains a thorough description of the basic strain gage theory and application of the approach used in this project.
While the resistive strain gage thermal strain measurements were not intended to rigorously correlate thermal strain data against other methods or known standards, it served an important role in the effective application of the systems engineering process, particularly throughout the verification and validation stages.
A significant outcome of this project was the strain gage thermal strain data that characterized the Corning ULE 7972 glass reference standard – when “best fitted” as a 4th order polynomial trendline, matched the Vishay engineering calibration data within less than +/- 10 micro-strain. This provided positive verification that the Corning ULE 7972 glass reference standard could be used as a “zero-CTE” reference standard – a necessary attribute for making accurate relative CTE measurements of other materials.
Perhaps the most compelling attribute of the resistive strain gage method, when applied with the use of strain rosettes, is its capability to simultaneously measure the longitudinal, hoop and “twist” CTE. This method has the capability to provide affordable, timely and decisive results if needed to affirmatively verify a CTE critical requirement with a carbon-fiber reinforced composite tube layup.

CTE Measurement Using Strain Gage Methodology
Page 5
Introduction A materials’ CTE plays an important role in many engineering applications. The photo below depicts the effect of temperature on railroad tracks without accommodations for linear expansion.
The applications that are dependent of a solid understanding of a materials’ Coefficient of Thermal Expansion span many industries - from expansion joints used in bridge and construction design, basic design of automotive engines, dimensionally stable satellite structures and now more recently, micro and nano-technology.
In order to quantify a material’s basic Coefficient of Thermal Expansion (CTE), it is necessary to measure the materials’ change in length over a range of temperatures – as depicted in the graph below.
Figure 1: Example of Thermal Strain Measurement The coefficient of linear thermal expansion, α, between temperatures T1 and T2 for a specimen whose length is L0 at the reference temperature, is given by the following equation:i
α = (L2 - L 1)/[L0(T2 - T1)] = ΔL/L 0ΔT
where L1 and L2 are the specimen lengths at temperatures T1 and T2, respectively. α is, therefore, obtained by dividing the linear expansion per unit length by the change in temperature.

CTE Measurement Using Strain Gage Methodology
Page 6
Common units of inch/inch-⁰F, m/m-⁰C or m/m-K are used.
There is no assurance a material’s CTE will be linear or constant. In fact, for many materials, an nth order polynomial relationship is routinely necessary to describe a materials’ expansion versus temperature, particularly if the temperature range encompasses phase changes.
In principle, any method that can measure strain can measure thermal expansion. There are, of course, pros and cons with the various methods and each method can offer advantages and limitations, as well. This project will examine 4 measurement systems and more specifically, offer a more detailed examination of the strain gage method applied to the CTE measurement of a carbon-fiber reinforced composite tube.
Overview of Systems for Thermal Strain Measurement Several measurement methods exist for quantifying a material’s coefficient of thermal expansion. The following methods were examined for this project:
1. Interferometer Systems 2. Dilatometer Systems 3. Digital Image Correlation 4. Resistive Strain Gage
There are tailored variations of these basic measurement systems, particularly with the Dilatometer systems but their examination is beyond the scope of this project.
Figure 2: Thermal Strain Measurement Methods
Applying System Engineering Approach A Systems Engineering approach was applied to evaluating these methods of measuring thermal expansion of materials. Some basic questions and factors were considered in selection of an appropriate measurement method.
CTE Measurement Using Strain Gage Methodology
Page 7
QUESTIONS/FACTORS TO CONSIDER FOR THERMAL EXPANSION MEASUREMENT
• What level of accuracy & precision is required? • What temperature ranges are required? • Are other environmental factors or conditions, such as vacuum or humidity, required or need to
be controlled? • Can sensing elements (both strain and temperature) be applied to the test article/specimen? • What is the size of the material/part? • If the part is very large, can a portion or smaller sample be used? • Is an overall, end-to-end measurement required? Or can a localized region be measured that
represents the overall response of the entire article? • Is the material rigid, soft, porous or of a condition that would inhibit attachment of sensing
elements or apparatus? • Are ASTM specifications or requirements applicable?
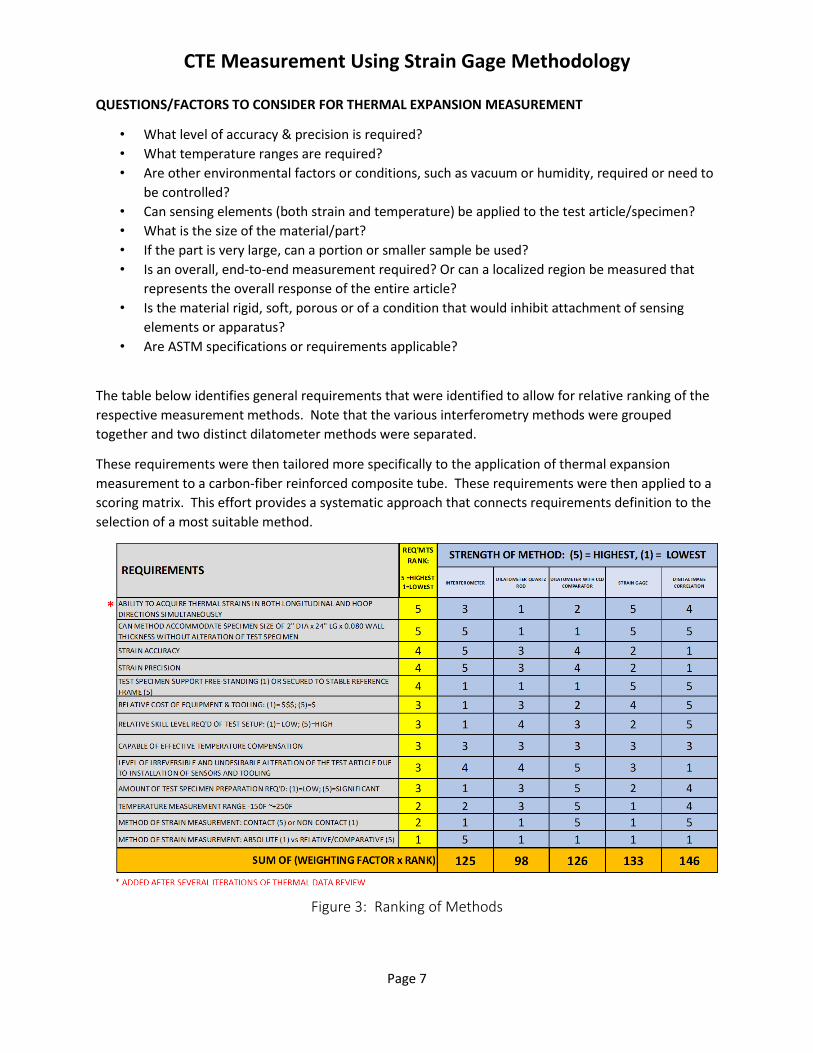
The table below identifies general requirements that were identified to allow for relative ranking of the respective measurement methods. Note that the various interferometry methods were grouped together and two distinct dilatometer methods were separated.
These requirements were then tailored more specifically to the application of thermal expansion measurement to a carbon-fiber reinforced composite tube. These requirements were then applied to a scoring matrix. This effort provides a systematic approach that connects requirements definition to the selection of a most suitable method.
Figure 3: Ranking of Methods
CTE Measurement Using Strain Gage Methodology
Page 8
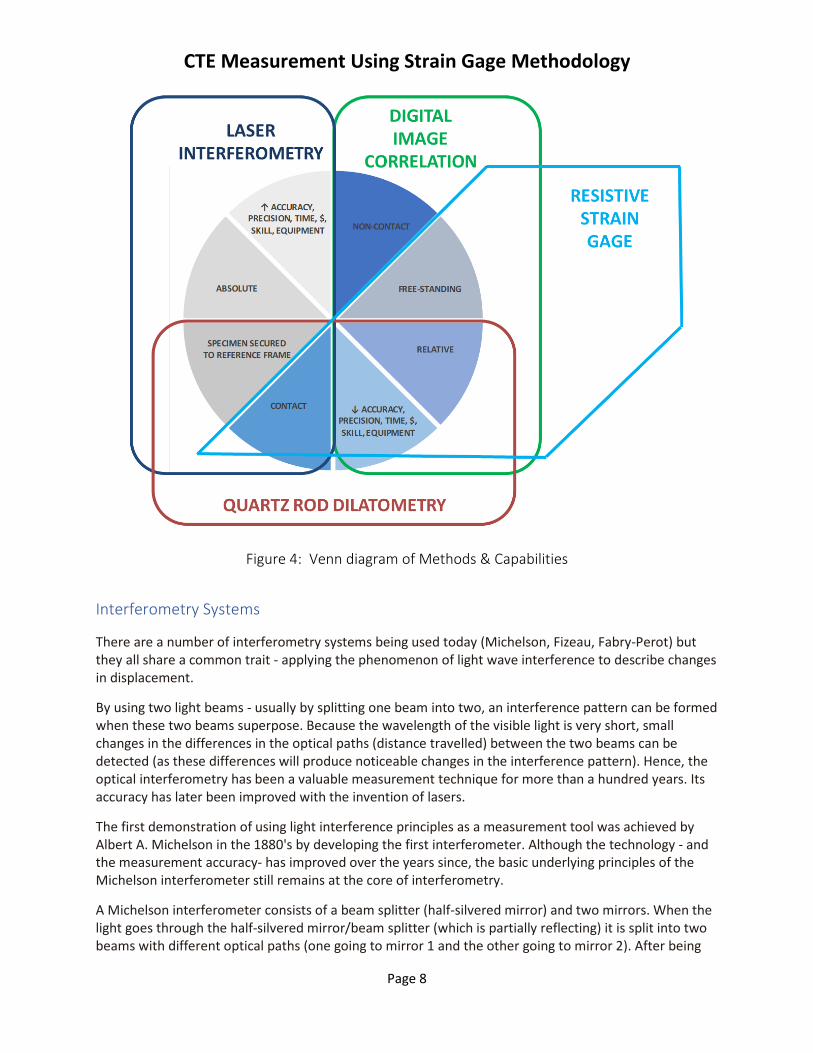
Figure 4: Venn diagram of Methods & Capabilities
Interferometry Systems
There are a number of interferometry systems being used today (Michelson, Fizeau, Fabry-Perot) but they all share a common trait - applying the phenomenon of light wave interference to describe changes in displacement.
By using two light beams - usually by splitting one beam into two, an interference pattern can be formed when these two beams superpose. Because the wavelength of the visible light is very short, small changes in the differences in the optical paths (distance travelled) between the two beams can be detected (as these differences will produce noticeable changes in the interference pattern). Hence, the optical interferometry has been a valuable measurement technique for more than a hundred years. Its accuracy has later been improved with the invention of lasers.
The first demonstration of using light interference principles as a measurement tool was achieved by Albert A. Michelson in the 1880's by developing the first interferometer. Although the technology - and the measurement accuracy- has improved over the years since, the basic underlying principles of the Michelson interferometer still remains at the core of interferometry.
A Michelson interferometer consists of a beam splitter (half-silvered mirror) and two mirrors. When the light goes through the half-silvered mirror/beam splitter (which is partially reflecting) it is split into two beams with different optical paths (one going to mirror 1 and the other going to mirror 2). After being

CTE Measurement Using Strain Gage Methodology
Page 9
reflected back at the mirrors these beams recombine again at the beam splitter before arriving at the detector (sensor). The path difference of these two beams causes a phase difference which creates an interference fringe pattern. This pattern is then analyzed by the detector to evaluate the wave characteristics, material properties or the displacement of one of the mirrors, depending what measurement the interferometer was being used for.ii
The Figure & photo below describes the basic Michelson Interferometeriii
Figure 5: Michelson Laser Interferometer The difference in the fringe count provides a measure of the net absolute expansion. These light rays have undulations or waves – as depicted in the figure below - each fringe measuring ½ the length of the light wave.
Figure 6: Wavelengths of Light
Today’s laser interferometry systems, along with continual development of solid state electronics, high speed photodetectors, CCD cameras and computerized data acquisition systems have considerably improved the versatility, range and resolution of interferometers, allowing a wide variety of applications.

CTE Measurement Using Strain Gage Methodology
Page 10
Laser interferometer systems provide accuracy and precision not achievable by any other current methods. These Interferometry systems now enable CTE measurements in the 1-50 ppb/K.iv This accuracy and precision is currently being sought out by micro and nano-technology, as well as ultra- precision space telescopes that are mapping our universe.
Dilatometer Systems The Quartz Rod Dilatometer measurement systems is recognized as perhaps the most traditional method used for thermo-mechanical measurement of materials. ASTM D696 defines the requirements and use of quartz rod dilatometers.
The basic quartz rod dilatometer system utilizes a low expansion quartz rod and tube to minimize systematic errors that would result from expansion of the reference frame itself. This type of measurement system makes comparative type measurements, as opposed to absolute in the case of a single beam Michelson interferometer.
This system is suitable for materials that can fit within the quartz tube and can sustain the contact pressure of the quartz rod itself without detrimentally influencing the measurements taken over temperature. The contact force of the quartz rod can be utilized for characterizing the temperature at which a material may soften or undergo a phase change. Modern quartz rod dilatometers are highly suited for displacement measurements up to temperatures exceeding 1000 °C.
Figure 7: Basic Quartz Rod Dilatometer

CTE Measurement Using Strain Gage Methodology
Page 11
A more modern Quartz Rod Dilatometer measurement system is depicted in the following figurev:
Figure 8: Quartz Rod Dilatometer
Dilatometers have undergone continual improvements and some have incorporated non-contact CCD optical sensors to replace the dial gage or LVDT.
Digital Image Correlation Digital image correlation (DIC) is an optical technique that uses digital images that contain fiduciary markers to extract full-field 2 or 3 dimensional displacement and strains. It is a non-contact measurement method that offers distinct advantages over strain gage, extensometer or conventional contact-type dilatometer systems.

CTE Measurement Using Strain Gage Methodology
Page 12
Figure 9: Digital Image Correlation Setup
Resistive Strain Gage Methodology The basic concept of using resistive strain gages for thermal expansion measurement uses two well-matched strain gages, one bonded to a reference material, and the second to the test material of interest. Like the Digital Image Correlation method, the specimens can be free-standing, lacking any precise attachment to a reference frame. The specimens may be of any size or shape compatible with the available equipment for heating and refrigeration - however specimens of uniform cross section will minimize potential problems with temperature gradients. Under stress-free conditions, the differential output between the gages on the two specimens, at any common temperature, is equal to the differential unit expansion (in/in, or m/m).vi The resistive strain gage thermal strain measurement system is represented in the following figure:
Figure 10: Resistive Strain Gage Thermal Strain Measurement System

CTE Measurement Using Strain Gage Methodology
Page 13
When a resistance strain gage is installed on a stress-free specimen of any test material, and the temperature of the material is changed, the output of the gage changes correspondingly. This effect, present in all resistance strain gages, was formerly referred to as “temperature-induced apparent strain”, but is currently defined as thermal output. It is caused by a combination of two factors. To begin with, in common with the behavior of most conductors, the resistivity of the grid alloy changes with temperature. An additional resistance change occurs because the thermal expansion coefficient of the grid alloy is usually different from that of the test material to which it is bonded. Thus, with temperature change, the grid is mechanically strained by an amount equal to the difference in expansion coefficients. Since the gage grid is made from a strain-sensitive alloy, it produces a resistance change proportional to the thermally induced strain. The thermal output of the gage is due to the combined resistance changes from both sources. The net resistance change can be expressed as the sum of resistivity and differential expansion effects as follows:vii
An algebraic demonstration of the principle can be obtained by rewriting Equation (4) twice; once for the gage installed on a specimen of the test material of unknown expansion coefficient αS, and again for the same type of gage installed on a standard reference material with a known expansion coefficient αR:
Thus, the difference in expansion coefficients, referred to a particular temperature range, is equal to the unit difference in thermal output for the same change in temperature.
Test Article Definition The test article is a 16 ply carbon-fiber reinforced composite tube, approximately 1.75” diameter, 16” length and 0.080 inch wall thickness. Each ply is composed of 0.005 inch thick M55J carbon fiber unidirectional prepreg. The “unitape” is pre-impregnated with a 977-6 modified resin system. This fiber

CTE Measurement Using Strain Gage Methodology
Page 14
and resin system is used routinely in structural composites applied in the spacecraft industry. The composite tube is cured at 325 °F under 90 psi autoclave pressure. An excel laminate calculator was used to calculate the nominal mechanical properties based on the specific unitape and resin system material, ply count, ply angles as shown in the figure below:
Figure 11: Excel Laminate Calculations
The mechanical properties for this carbon fiber composite tube are highly orthotropic, as summarized below:
E1 = 42.35 Msi Elastic Modulus, longitudinal
E2 = 0.92 Msi Elastic Modulus, transverse (hoop)
α1 = -0.63E-6/°F Linear Coefficient of thermal expansion, longitudinal
α2 = 14.6763E-6/°F Linear Coefficient of thermal expansion, transverse (hoop)
ν12 = 1.08 Poisson’s ratio
The negative longitudinal CTE is a common design feature with composite tubes used in spacecraft design. When combined with a slightly positive CTE of metallic end fittings that are structurally bonded to the tube ends, the end result is a near-zero CTE structural tube – providing a thermally stable structure.
The carbon fiber composite tube is shown in the following digital photo:
Figure 12: Carbon Fiber Reinforced Composite Tube Sample

CTE Measurement Using Strain Gage Methodology
Page 15
Reference Standard Definition and Selection Criteria The reference standard was made of Corning ULE 7972 standard grade glass, approximately 2” x 2” x 0.4” thick. This material, graciously donated by Advanced Glass Industries, Rochester, New York, is a titanium silicate glass, chosen primarily for its extremely low CTE of 15 ppb/⁰C. Additionally, it exhibits no measurable delayed elastic effect or measurable hysteresis from thermal cycling.viii The reference standard is shown in the following digital photo:
Figure 13: Corning ULE 7972 “Zero-CTE” Reference Standard
Other Test Samples The thermal chamber and data acquisition system had sufficient capacity to accommodate additional articles so the following materials were also prepared for thermal strain measurement:
A. Copper, approx. 2” diameter x 1” thick B. Borosilicate Glass, approx. 2” x 2” x ½” thick C. Invar 36, 1” x 4” long x 1/8” thick
CTE Measurement Using Strain Gage Methodology
Page 16
Strain Gage Selection The resistive strain gages used were purchased from the Vishay Micromeasurements. The gage type was a WK-00-250PD-10C. It features a fully encapsulated ¼” gage length, 1000 ohm resistance, K-alloy dual grid type construction with a S-T-C value of “00”. The 1000 ohm gage resistance lessens the effects of “self-gage heating” and unsymmetric leadwire resistance changes over the 120 or 350 ohm gage resistance strain gages. The S-T-C of “00” was chosen to match the nominal CTE of the Corning ULE 7972 reference standard sample.
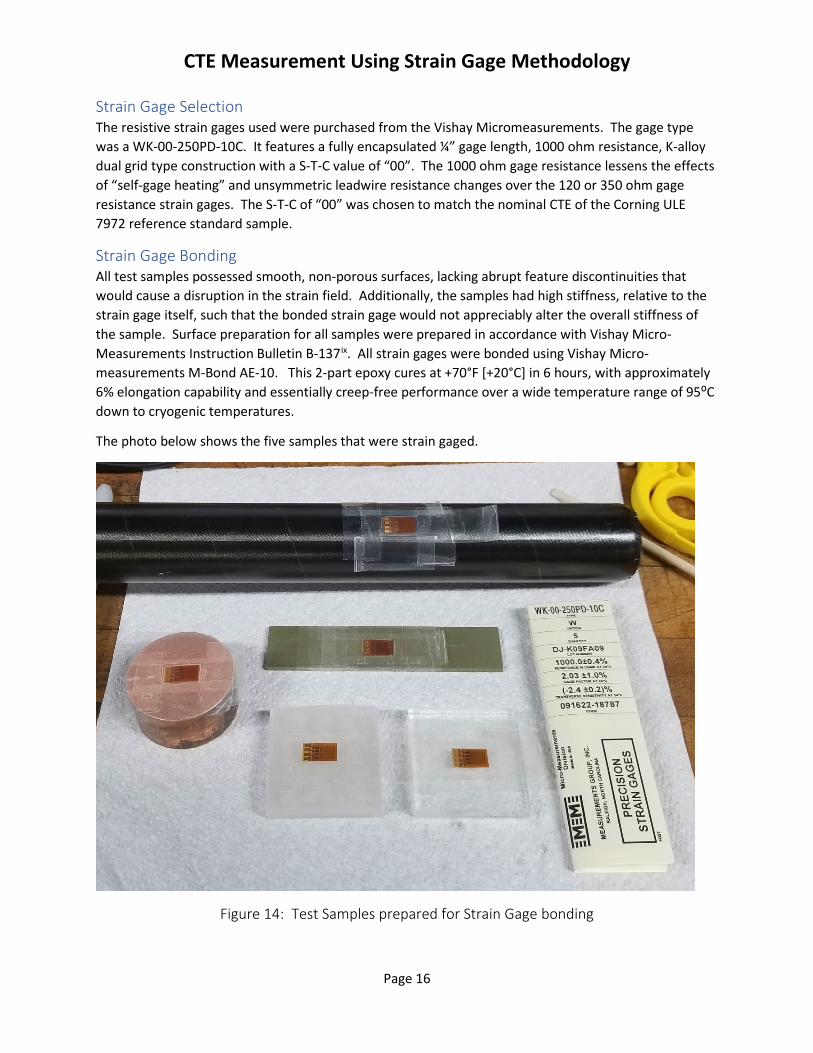
Strain Gage Bonding All test samples possessed smooth, non-porous surfaces, lacking abrupt feature discontinuities that would cause a disruption in the strain field. Additionally, the samples had high stiffness, relative to the strain gage itself, such that the bonded strain gage would not appreciably alter the overall stiffness of the sample. Surface preparation for all samples were prepared in accordance with Vishay Micro-Measurements Instruction Bulletin B-137ix. All strain gages were bonded using Vishay Micro-measurements M-Bond AE-10. This 2-part epoxy cures at +70°F [+20°C] in 6 hours, with approximately 6% elongation capability and essentially creep-free performance over a wide temperature range of 95⁰C down to cryogenic temperatures.
The photo below shows the five samples that were strain gaged.
Figure 14: Test Samples prepared for Strain Gage bonding

CTE Measurement Using Strain Gage Methodology
Page 17
Strain Gage Leadwire Selection 3-conductor flat vinyl 26 gage wire was used to connect all strain gages to the data acquisition system. Solder joints attaching the leadwires to the gage solder tabs were smooth and bright, lacking any visual indication of a “cold solder joint”. Soldering flux was removed using isopropyl alcohol. The following photo shows the Corning ULE 7972 reference standard after leadwire attachment.
Figure 15: Completed Strain Gage Installation on Corning ULE 7972 Glass Standard
Thermally produced resistance changes in the leadwires will generate circuit outputs which are indistinguishable from the thermal outputs being measured. If these differ in any way between the reference and test specimens, the indicated differential expansion data will be in error accordingly. Because of this, all wire lead lengths were maintained within +/- 2 inches over their nominal 144 inch lengths and bundled into a common loom in order to obtain the most accurate results. The following photo shows the completed strain gaged samples.

CTE Measurement Using Strain Gage Methodology
Page 18
Figure 16: Completed Strain Gage Installations
Thermocouple Installation K-type thermocouple wire was used for all samples. The thermocouple joints were adhesively attached to each of the samples using a Loctite 2-part epoxy and overcoated to mitigate erroneous sensing of ambient air. For each sample, 2 thermocouple sensors were located on each side of the strain gage sensor, within approximately 1”. The thermocouple leadwire was coiled to act as a strain relief to reduce any effects of leadwire mechanical strain. The attached photo of the carbon fiber reinforced composite tube is representative of the thermocouple installation common to all samples.

CTE Measurement Using Strain Gage Methodology
Page 19
Figure 17: Completed Installation on Carbon Fiber Reinforced Composite Tube
Sensor Calibration A limited single point, end-to-end strain gage calibration was performed on each strain gage channel using a precision shunt resistor to validate strain gage sensor scaling. Thermocouple sensors were not calibrated due to cost and availability of calibration equipment. This shortfall was identified early in the project and a risk mitigation plan is further detailed later in this report.

CTE Measurement Using Strain Gage Methodology
Page 20
Vishay System 5000 Data Acquisition System A Vishay System 5000 Data Acquisition System was used to monitor and record the strain gage and thermocouple sensors. A total of 10 strain channels and 10 thermocouple channels were utilized for this project. The complete system is shown in the photo below.
Figure 18: Completed Strain Gage & Thermocouple Installations

CTE Measurement Using Strain Gage Methodology
Page 21
Thermal Chamber Definition Access to a thermal chamber, with closed-loop temperature programming was unavailable during the course of this project. A simple Styrofoam enclosure of approximately 16 inch x 16 inch x 16 inch was used. For safety reasons, it was decided to forego high temperature exposure. “Dry ice” or C02 was used as a cooling medium however no closed loop method of thermal control was implemented for the cooling medium. Dry ice sublimates to a gas at standard atmospheric pressure at −78.5 °C (−109.3 °F).
Procedurally, all strain channels were zeroed nominally at 24°C, the C02 dry ice block was positioned in front of the fan and the thermal chamber was sealed shut. The fan was then activated and circulated air as the dry ice was allowed to sublimate to completion as data was monitored continuously and recorded at 1 minute intervals. This resulted in large thermal gradients as the C02 dry ice sublimed to completion.
The completed setup is shown in the photo below.
Figure 19: Test Samples in Thermal Chamber

CTE Measurement Using Strain Gage Methodology
Page 22
System Measurement Checkouts With the Test article sub-system, Data acquisition sub-system and Thermal chamber sub-systems in place, preliminary system measurement checkouts were necessary to baseline thermal strain measurements, requirements verification, risk identification and reduction.
The following checkouts were performed:
1. Baseline strain channels monitored with zero excitation to verify for stray signal noise and stability at ambient temperature
2. Baseline strain channels monitored with 1 VDC excitation to verify for stable signal and stability (check for possible “strain gage self-heating” at ambient temperature
3. Baseline strain channels monitored with 5 VDC excitation to verify for stable signal and stability (check for possible “strain gage self-heating” at ambient temperature
4. Baseline thermocouple channels monitored at ambient with all 10 junctions secured to a common aluminum sheet – check for uniformity and stability of thermocouple signals
5. 1st Cold Run: Zero out all strain channels at 24⁰C, close up thermal chamber with 7 lb. of dry ice and determine maximum cold temperature is achievable. Also check for stable return to zero of all strain channels
6. 2nd Cold Run: Repeat previous Cold run except with approx. 10 lb. of dry ice and determine maximum cold temperature is achievable. Also check for stable return to zero of all strain channels.
It was determined and demonstrated in these preliminary checkouts that the ½ cycle from ambient to cold would result in unacceptable thermal gradients – yielding unacceptable thermal strain data. Several cold thermal cycles would demonstrate that the best results were achieved by utilizing approximately 14 lb. of dry ice, allowing it to sublimate fully, then allow the test samples to “normalize” at the maximum cold temperature of approx. -40⁰C while continuously monitoring data and recording at 1 minute intervals, as the specimens slowly warmed back up to ambient over approx. 12 hour period. The Vishay System 5000 data acquisition system acquired thermal strain and thermocouple data throughout this period. All test runs were concluded with data auto-save enabled to the PC’s hard drive. The data was secondarily exported to Excel to allow for data review and analysis.

CTE Measurement Using Strain Gage Methodology
Page 23
Data Review The following chart represents thermal strain data from the final thermal run from cold back up to ambient. Each sample was instrumented with 2 strain channels and 2 thermocouple channels so the average strain and average temperature was plotted. 4th order trendline equations are shown for each sample.
Figure 20: Thermal Strain vs Temperature Graph: All Samples

CTE Measurement Using Strain Gage Methodology
Page 24
The following graph represents the average thermal strain measured on the Corning ULE 7972 glass sample and the 4th order polynomial equation from the Vishay Engineering datasheet provided with the furnished strain gages. The “as-measured” thermal strain compared very favorably to the nominal “calibration” equation furnished by Vishay. This result was the necessary validation of the “as-measured” thermal strain data of the ULE glass sample. From this, the thermal strain data, and the resulting CTE calculations that would be derived from it, could be confidently determined.
Figure 21: Thermal Strain vs Temperature Graph: ULE Reference Standard
From these trendline equations, the derivative or slope, dy/dx; where y = strain , x = Temperature was calculated. From this, the CTE can be quantified over any selected range of temperatures from the following:
CTE sample = (Slope sample - Slope ref standard ) / ⁰C

CTE Measurement Using Strain Gage Methodology
Page 25
The table below tabulates the “as-measured” data as follows:
Figure 22: CTE Calculations from 4th Order Polynomial Trendline Equation
Figure 23: CTE Comparison at 24⁰C
deg C -30 -25 -20 -15 -10 -5 0 5 10 15 20 24 30SLOPE = dy/dx = dε/dT
y = 4 x -5E-7 x3 + 3 x 0.0001 x2 + 2 x -0.0211 x + 3.4344 5.024 4.708 4.414 4.142 3.888 3.653 3.434 3.231 3.040 2.862 2.694 2.567 2.384y = 4 x -3E-6 x3 + 3 x 4E-5 x2 + 2 x -0.0178 x + 3.1508 4.651 4.303 4.007 3.752 3.531 3.333 3.151 2.974 2.795 2.603 2.391 2.200 1.867y = 4 x 3E-7 x3 + 3 x 0.0002 x2 + 2 x -0.0234 x + 4.681 6.171 5.907 5.651 5.401 5.156 4.917 4.681 4.448 4.218 3.988 3.759 3.576 3.299y = 4 x 9E-7 x3 + 3 x 0.0001 x2 + 2 x -0.0207 x + 6.5144 7.881 7.624 7.383 7.154 6.935 6.723 6.514 6.308 6.100 5.888 5.670 5.488 5.202y = 4 x -5E-6 x3 + 3 x 0.0001 x2 + 2 x -0.0079 x + 19.918 20.959 20.644 20.406 20.229 20.099 20.000 19.918 19.837 19.743 19.620 19.454 19.280 18.931
CORNING 7972 ULE GLASS 0.000 0.000 0.000 0.000 0.000 0.000 0.000 0.000 0.000 0.000 0.000 0.000 0.000GRAPHITE TUBE -0.374 -0.405 -0.408 -0.389 -0.358 -0.320 -0.284 -0.256 -0.246 -0.259 -0.304 -0.367 -0.518INVAR 36 1.147 1.199 1.236 1.259 1.268 1.264 1.247 1.218 1.177 1.126 1.065 1.009 0.914BOROSILICATE GLASS 2.856 2.916 2.969 3.013 3.047 3.069 3.080 3.077 3.059 3.026 2.975 2.922 2.818COPPER 15.935 15.936 15.992 16.088 16.211 16.347 16.484 16.607 16.703 16.758 16.760 16.713 16.547
DEGREES CELSIUS
dy/dx = dε/dT = derivative of trendline equation; evaluated at specific temperatures; x = deg C
differential CTE; using Corning 7972 ULE Glass as "zero-CTE" standard

CTE Measurement Using Strain Gage Methodology
Page 26
Risk Management Risks were identified throughout the requirements definition phase of the project. The following technical risks were identified.
1. Thermal gradients of unknown magnitude and consequence could cause difficulty to achieve thermal equilibrium between ULE Glass reference standard and test sample
2. Poor thermal conductivity of ULE Glass can pose risk with strain gage “self-heating”, causing strain gage signal drift
3. Strain gage calibration limited to single point rather than multi-point
4. No thermocouple calibration
5. Test data validity; “how valid is the data?”
Figure 24: Risk Chart
Risk #1 was considered to be a 5E (High-Very Likely) given the limitations of performing the thermal cycling with the basic thermal chamber and lack of a closed loop thermal control system. The mitigation plan was to limit the data extraction to the ½ cycle from maximum cold to ambient. This was determined after performing several preliminary thermal cycles and monitoring the temperature gradients. These preliminary thermal cycles identified excessive thermal gradients that could not be mitigated with the available thermal capacity of the CO2 dry ice to practically extract meaningful data on the ½ cycle from ambient down to maximum cold. The penalty for this limitation was not being able to generate a full thermal hysteresis loop and the thermal strain measurements. The mitigation plan that was implemented moved this risk to the 2D (Minor, Likely)

CTE Measurement Using Strain Gage Methodology
Page 27
Risk #2 was considered to be a 3D (Moderate-Likely) prior to performing the preliminary checkout of the System 5000 data acquisition system revealed a steady and stable strain gage response at 1 volt DC excitation. As a further check, the excitation level was raised to 5 volt DC momentarily to deliberately trigger an unstable response without causing permanent damage to the gage installation. After this checkout, Risk #2 was moved down to 1B (Low-Unlikely).
Risk #3 was considered to be a 2E (Minor-Very Likely) and was mitigated by performing a single point calibration using a precision resistor. ASTM E251 7.2.2.3 recommends a multi-point calibration method to verify strain gage output. The results of the single point precision resistor calibration checkout moved the Risk #3 down to 1B (Low-Unlikely).
Risk #4 was considered to be a 2E (Minor-Very Likely). A preliminary checkout of the System 5000 data acquisition system monitored all 10 thermocouple channels with all junctions adhered to a common aluminum plate for a duration lasting several hours. This revealed a tight temperature grouping of +/- 1 ⁰C for all 10 thermocouples. The results of this checkout moved the Risk #4 down to 1B (Low-Unlikely).
Risk #5 was considered to be a 4C (Significant-Possible). The author had not concluded – a priori – that the “as-measured” thermal strain of the Corning ULE 7972 glass sample should match that of the 4th Order polynomial equation provided on the Vishay Engineering datasheet. This observation became evident after plotting several sets of data from preliminary test runs. The results of this observation and recognition moved the Risk #5 down to 1B (Low-Unlikely).
Product & Test Article Safety Considerations for Product, Test Article, Operator and Test Site Safety were implemented to ensure execution of project requirements would not cause adverse liabilities or risks for safety. The following safety considerations were identified and implemented:
Hot thermal cycling was not performed due to potential fire risk and the extended thermal cycle durations necessary for mitigating thermal gradients. It was reasoned that the potential risks outweighed the benefits to the overall goal of the project
Similarly, cold thermal cycling was accomplished using CO2 dry ice rather than LN2. While both are considered asphyxiants that displace oxygen, LN2 poses a greater threat. Commercial O2 sensors are available but it was reasoned that the potential risks outweighed the benefits to the overall goals of the project.

CTE Measurement Using Strain Gage Methodology
Page 28
Requirements Verification A verification matrix was prepared to demonstrate compliance to requirements. Any requirements that could not be met were appropriately identified and remarked for disposition, if warranted.
Figure 25: Requirements Verification Matrix
Cost Summary & Estimates Cost Estimates for Strain Gage Thermal Measurement are summarized in the table below:
Figure 26: Cost Estimate
REQUIREMENTS FOR STRAIN GAGE SENSOR: VISHAY WK-00-250PD-10C REQ'MT MET? YES/NO
DESCRIBE VERIFICATION
GAGE WITH KNOWN GAGE FACTOR ASTM E251_1.3.3 YES REFER TO VISHAY DATASHEET
SELECT GAGE WITH S-T-C PROPERTIES THAT MATCH REF STD MAT'L VISHAY TN-513 YES REFER TO VISHAY DATASHEET
CAPABLE TEMPERATURE RANGE VISHAY TN-513 YES VISHAY DATASHEET: -269C ~ 290C
HIGH GAGE RESISTANCE VISHAY TN-513 YES 1000 OHM
AVOID GRID LESS THAN 1/8" VISHAY TN-513 YES 1/4" GRID
REQUIREMENTS FOR TEST ARTICLE: CARBON FIBER COMPOSITE TUBE REQ'MT MET? YES/NO
DESCRIBE VERIFICATION
SURFACE IS COMPATIBLE FOR EPOXY STRAIN GAGE BONDING VISHAY TN-513 YES PREVIOUS KNOWLEDGE/EXPERIENCE
BONDED GAGE PRODUCES NEGLIGIBLE INFLUENCE DUE TO MECHANICAL REINFORCEMENT VISHAY TN-513 YES PREVIOUS KNOWLEDGE/EXPERIENCE
REQUIREMENTS FOR REFERENCE STANDARD: CORNING ULE 7972 GLASS REFERENCE REQ'MT MET? YES/NO
DESCRIBE VERIFICATION
KNOWN CTE PROPERTIES VISHAY TN-513 YES NO CERTIFICATION w SAMPLE
SURFACE IS COMPATIBLE FOR EPOXY STRAIN GAGE BONDING VISHAY TN-513 YES RECOMM VISHAY TECH BULLETIN TN-513
BONDED GAGE PRODUCES NEGLIGIBLE INFLUENCE DUE TO MECHANICAL REINFORCEMENT VISHAY TN-513 YES ELASTIC MODULUS: 9.8E6 PSI
CAPABLE TEMPERATURE RANGE VISHAY TN-513 YES VISHAY DATASHEET: -150C ~ 250C
REQUIREMENTS FOR GAGE INSTALLATION REQ'MT MET? YES/NO
DESCRIBE VERIFICATION
STRAIN GAGE BONDLINE UNIFORM ASTM E251_5.1 SEE COMMENT
FULLY CURED STRAIN GAGE EPOXY ASTM E251_5.1 SEE COMMENT
GAGE IS ALIGNED TO LONGITUDINAL AXIS VISHAY TN-513 YES VISUAL INSPECTION
SOLDER JOINTS; UNIFORM, SMOOTH, BRIGHT VISHAY TN-513 YES VISUAL INSPECTION
UNIFORM WIRE LENGTHS VISHAY TN-513 YES 120 INCH LENGTHS +/- 2 INCHES
UNIFORM WIRE GAGE VISHAY TN-513 YES SAME WIRE TYPE/GAGE USED FOR ALL CHANNELS
UNIFORM WIRE ROUTING VISHAY TN-513 YES BUNDLED AND ROUTED AS COMMON, UNITIZED LOOM
REQUIREMENTS FOR TEMPERATURE SENSOR REQ'MT MET? YES/NO
DESCRIBE VERIFICATION
ABLE TO SENSE TEMPERATURE OF PARENT MAT'L IMMEDIATELY ADJACENT TO STRAIN GAGE VISHAY TN-513 YES
1" OF STRAIN GAGES
REQUIREMENTS FOR DATA ACQUISITION SYSTEM REQ'MT MET? YES/NO
DESCRIBE VERIFICATION
NEGLIGIBLE STRAIN GAGE OUTPUT DRIFT OR INSTABILITY DUE TO EXCITATION VOLTAGE ASTM E251_5.1 YES RAN BASELINE STRAIN STRIPCHART @ VARIOUS EXCITATION OVER
ACCURATE STRAIN OUTPUT ASTM E251_4.3 SEE COMMENT STRAIN GAGE OUTPUT CHECKED VIA SHUNT CAL; W/IN XX%
PRECISE STRAIN OUTPUT ASTM E251_4.3 YES
REPEATABLE STRAIN OUTPUT ASTM E251_5.1 YES
NEGLIGIBLE STRAIN GAGE OUTPUT NOISE DUE TO RF OR EMI SOURCES ASTM E251_5.1 YES
ACCURATE TEMPERATURE OUTPUT VISHAY TN-513 SEE COMMENT TC CALIBRATION UNAVAILABLE; COST CONSTRAINTS
PRECISE TEMPERATURE OUTPUT VISHAY TN-513 YES RECORDED TEMP STRIPCHART TO BASELINE TC's OVER 8 HR DWELL
REPEATABLE TEMPERATURE OUTPUT VISHAY TN-513 YES ALL 10 TC's AGREED WITHIN +/- 1.5 DEG C @ ROOM TEMP
OVERALL STRAIN GAGE SYSTEM PERFORMANCEVISHAY TN-513 &
ENGINEERING DATASHEET
YESPLOT AND COMPARE MEASURED THERMAL STRAIN vs TEMP AGAINST 4TH ORDER EQUATION ON VISHAY ENGINEERING DATASHEET
2 HOUR DWELL TO CHECK FOR DRIFT AND STABILITY; ALL GAGES STABLE @ 1 VDC +/- 10 μstrain
NEGLIGIBLE ZERO SHIFT AFTER 3X THERMAL CYCLES FROM RT~ -40⁰C
COST ESTIMATES ESTIMATETHERMAL CHAMBER $15,000STRAIN GAGE DATA ACQUISITION SYSTEM $7,500PC & PERIPHERALS $3,000SAFETY AND PERIPHERAL TEST EQUIPMENT $1,000CONSUMABLES (FOR STRAIN GAGING, THERMOCOUPLES, BONDING, WIRING AND INSTRUMENTATION)
$1,000
CALIBRATION EQUIPMENT & SERVICING (ANNUAL) $2,000CORNING ULE 7972 GLASS STANDARD (CERTIFICATION GRADE) $500
LABOR AND OPERATING COSTS /PER TEST ARTICLE $2,000
TOTAL $32,000

CTE Measurement Using Strain Gage Methodology
Page 29
Project Schedule
Figure 27: Project Schedule
Quality Principles The strain gage method outlined in this report is well suited for identifying potential workmanship liabilities in carbon fiber reinforced composite tubes that require verification of rigorous CTE requirements. The risk of an improperly aligned ply or a “flipped” ply (a +15⁰ ply laid down vs a -15⁰ ply) is ever-present, especially with hand-layup composite tubes. This anomaly could be identified with this test method, particularly with use of strain rosettes instead of a uniaxial strain gage.
Lean Strategies Despite the lack of Lean Strategies implemented as part of this project, several Lean Strategies were identified with a recurring test program that makes use of this thermal strain measurement method tailored for carbon fiber reinforced composite tubes.
With a recurring test program, several tasks and operations would be suited for standardization. Data reduction spreadsheets that were part of the development effort would be standardized. The Vishay StrainSmart™ data acquisition software allows the user to conveniently create specific user-defined channels from measured data channels – allowing for more immediate translation and interpretation of measured data. While this project dealt with thermal chamber limitations, an opportunity exists for potentially optimizing the temperature range that would yield sufficient and robust data recovery yet minimize the thermal exposure risks to the test sample and equipment.
But most importantly, this method can be particularly useful when implemented for carbon fiber reinforced composite tubes that have critical CTE requirements, especially for those with CTE requirements in all 3 axis (longitudinal, hoop and “twist”). With the use of strain rosettes, instead of

CTE Measurement Using Strain Gage Methodology
Page 30
uniaxial strain gages, the complete strain field can be quantified. This method would yield positive, economic, rapid test results that would provide robust verification of these requirements.
Lessons Learned Incorporating and capturing lessons learned is ingrained in the Systems Engineering discipline. This project, with the inclusion of examination of a measurement method that the author had not had exhaustive previous experience provided a thorough opportunity to incorporate lessons learned, as applied to the Systems Engineering discipline. The following lessons were considered noteworthy:
Several iterations were needed to develop and refine thorough requirements definition.
The “Vee” method, as described in the INCOSE Systems Engineering Handbook, was applied in this project, to enable continuous validation and requirements development throughout development and continuous risk and opportunity assessment.
Iteration and recursion, as described in the INCOSE Systems Engineering Handbook, was applied, particularly during the thermal checkouts phase where several risks were identified and mitigated
Be prepared to incorporate follow-on requirements based on lessons learned from previous projects
Project Assessment The primary goal of this project – to apply a Systems Engineering approach in examining thermal strain measurement methods that would optimize the selection protocol for CTE measurement of a carbon fiber reinforced composite tube – was fulfilled.
This project provided an in-depth, hands-on learning experience that enriched a greater understanding of Systems Engineering principles. It took the author several iterations, however with continual dialogue with Dr. Brown, through weekly progress reports led to a more thorough understanding and application of the Systems Engineering discipline. This project reinforced the importance of requirements definition and often challenged the author to re-examine, re-write and tailor requirements as needed to fulfill the intended purpose. The various methods of thermal strain measurement challenged the author to look critically at the relative merits of each method, assess for commonality and differences. Finally, the actual hands-on testing and data analysis led the author to “circle back”, examine and update requirements fulfillment. It also fulfilled a secondary goal of Lean Implementation with the recommended use of strain gage rosettes for examination of carbon fiber reinforced composite tube with critical CTE requirements.
Recommendations For further study and followup, this method could be further refined and improved with the use of strain gage rosettes that would replace the uniaxial strain gages. The same installation methods, wiring and data acquisition system could be used. The use of strain rosette(s) would provide a complete assessment of the strain field to allow for determination of CTE in all 3 axis’ – longitudinal, hoop and “twist”. This would be applied specifically to carbon fiber reinforced composite tubes with “critical” CTE requirements – most often those used for pointing critical satellite antenna applications.

CTE Measurement Using Strain Gage Methodology
Page 31
Acknowledgements The author is very grateful to Dr. Frederick Brown, Program Director of the Systems Engineering Masters Program at Loyola Marymount University for his salient critique in this report. Additionally, I would like to thank the Vishay Precision Group and their technical representatives, Mr. Jim Johnson and Mr. Darryl Peterson who provided detailed technical advice on strain gaging. Mr. Matt Tuchscherer, a fellow work colleague with 20+ years of experience from JPL, helped me attain the soldering skills necessary for this project. The Corning ULE 7972 Glass reference standard was graciously supplied by Advanced Glass Industries, Rochester, New York. And finally, a deserved thank you to my wife, Karen, for her continual support of my graduate studies that I’ve undertaken to complete so late in my professional career.
Endnotes
i ASTM D696-16, Section 5.1, Standard Test Method for Coefficient of Linear Thermal Expansion of Plastics Between –30°C and 30°C with a Vitreous Silica Dilatometer ii http://www.renishaw.com/en/interferometry-explained--7854
http://www.3ders.org/articles/20130328-michigan-tech-releases-open-source-3d-printable-optics-designs.html iii ASTM E289-17, Fig 2, Standard Test Method for Linear Thermal Expansion of Rigid Solids with Interferometry iv SPIE, 2002 Conference, Corning Ultra-High Accuracy Measurement of the Coefficient of Thermal Expansion for Ultra-Low Expansion Materials, Dr. Vivek G. Badami, Dr. Michael Linder v http://www.perkinelmer.com/product/tma-4000-lab-system-100-230v-l8040000 vi ibid vii ibid viiihttps://www.corning.com/media/worldwide/csm/documents/7972%20ULE%20Product%20Information%20Jan%202016.pdf ix http://www.vishaypg.com/docs/11137/B137-4-.pdf