systems approach to epc material procurement …
TRANSCRIPT

SYSTEMS APPROACH TO EPC MATERIAL PROCUREMENT STRATEGY
A Thesis Submitted to College of Graduate and Postdoctoral Studies
In Partial Fulfillment of the Requirements
For the Degree of Master of Science
In the Department of Mechanical Engineering
University of Saskatchewan
Saskatoon
By
Mary Taiwo Bajomo
© Copyright Mary Taiwo Bajomo, December 2019. All rights reserve

i
PERMISSION TO USE
In presenting this thesis in partial fulfilment of the requirements for the Postgraduate degree from
the University of Saskatchewan, I agree that the Libraries of this University may make it freely
available for inspection. I further agree that permission for copying of this thesis in any manner,
in whole or in part, for scholarly purposes may be granted by the Prof. Chris W.J. Zhang, the
professor who supervised my thesis work or, in their absence, by the Head of the Department or
the Dean of the College in which my thesis work was done. It is understood that any copying or
publication or use of this thesis or parts thereof for financial gain shall not be allowed without my
written permission. It is also understood that due recognition shall not be allowed without my
written permission. It is also understood that due recognition shall be given to me and the
University of Saskatchewan in any scholarly use which may be made of any material in my thesis.
Requests for permission to copy or to make other use of material in this thesis in whole or part
should be addressed to:
Head of the Department of Mechanical Engineering
University of Saskatchewan
57 Campus Drive
Saskatoon, Saskatchewan S7N549
Canada
OR
Dean
College of Graduate and Postdoctoral Studies
University of Saskatchewan
116 Thorvaldson Building, 110 Science Place
Saskatoon, Saskatchewan S7N 5C9
Canada

ii
ABSTRACT
The criticality of procurement and logistics to the success of Engineering Procurement
Construction (EPC) projects cannot be over emphasized, as it has been a large area of opportunities
that should be adequately exploited to enhance the overall performance of construction projects.
EPC firms, which act as a catalyst for a nation’s economy growth, still suffer from work backlog,
and this further hinders them from functioning at their optimum level. The work backlog often
arises from delay caused by the stakeholders of the complex EPC system. Furthermore, the delay
may arise from design or management decisions.
Therefore, there is a need to study the effect of decisions taken by stakeholders to know the
behaviour of the material procurement system with a focus on the timely delivery of construction
materials to construction sites to ensure a smooth running of the construction process and prevent
the work backlog due to shortage of materials on sites, which eventually leads to schedule and cost
overrun.
The purpose of this study is to develop a novel Systems Dynamics (SD) decision support model
to improve the construction material supply chain performance. The model emphasizes the essence
of information sharing, collaboration, and trust among stakeholders; as such, the model may help
EPC managers take effective decisions in an EPC material procurement system. The context of
EPC, which this study is focused is to bulk construction materials.
This model will be a particularly useful tool to assist decision makers in evaluating the impact of
material shortage and time delay by observing the simulated scenarios accordingly and in
developing various effective policies.

iii
ACKNOWLEDGEMENT
I will like to express my sincere appreciation to my supervisor, Professor Chris W.J. Zhang for his
great support, effective advice, and for believing in my capabilities during my thesis work.
My gratitude also goes to professors in my advisory committee: Prof. Duncan Cree and Prof. David
Torvi for their insightful contributions which helped a great deal.
My family’s unquantifiable support is overwhelming. I could not have done this without them. I
really appreciate my mother, Patience Bajomo for her great support.
Special appreciation goes to my wonderful husband, Adedayo Oladeji. You were significantly
instrumental to the great success of this work. Thanks for your patience, understanding and always
being there.
During my program, I had friends who were of help and I will like to thank them for their support.
Among them are McDonalds Wade, Ogbeyemi Akinola, Ejalonibu Adewale, Stephen
Onwuamanam, Jude Okolie, Ibraheem Abdulganiyu, and a good number of other friends. Thank
you all.

iv
DEDICATED
TO
MY FATHER, ADUROTINILOJOISORO

v
TABLE OF CONTENTS
PERMISSION TO USE..................................................................................................................i
ABSTRACT ...................................................................................................................................ii
ACKNOWLEDGEMENT ...........................................................................................................iii
DEDICATION ..............................................................................................................................iv
TABLE OF CONTENTS ..............................................................................................................v
LIST OF FIGURES ...................................................................................................................viii
LIST OF TABLES .........................................................................................................................x
LIST OF ABBREVIATIONS AND SYMBOLS........................................................................ xi
CHAPTER 1: INTRODUCTION .....................................................................................1
1.1 Background and Motivation ................................................................................................1
1.2 Research Objectives and scope of thesis ..............................................................................4
1.3 Thesis Organization .............................................................................................................5
CHAPTER 2: BACKGROUND AND LITERATURE REVIEW................................. 6
2.1 Introduction to Supply Chain Network (SCN).................................................................... 6
2.1.1 Construction Supply Chain Management ............................................................... 7
2.1.2 EPC: How procurement serve as a strategic link from project recovery deviation…7
2.2 Factors affecting construction project performance........................................................... 10
2.2.1 Material delay on construction projects................................................................. 11
2.2.2 Impact of material delay on construction performance.......................................... 11
2.3 Stakeholders of a construction industry and their impact................................................... 12
2.3.1 Contractor-Supplier Relationship.......................................................................... 13
2.4 Supply Chain Procurement Strategies............................................................................... 14
2.4.1 Supply Chain Collaboration.................................................................................. 17
2.4.2 Material Management Policies.............................................................................. 18
2.5 Conclusion……………………………………………………………………………….19
CHAPTER 3: METHODOLOGY AND MODEL DESCRIPTION……………….... 21
3.1 System dynamic approach in supply chain ........................................................................ 21

vi
3.2 Problem description of the construction material supply ……………….……………. …22
3.3 FCBPSS Framework…………………………..................................................................23
3.3.1 FCBPSS framework of Construction Material Supply Chain (CMSC) model ….24
3.4 SD model development and formulation…………………………………...………….…29
3.4.1 Causal Loop Diagram (CLD) for CMSC .............................................................. 33
3.4.2 SD model development structure and parameters ................................................. 34
CHAPTER 4: MODEL TESTING, RESULTS AND ANALYSIS............................... 41
4.1 Model Validation .............................................................................................................. 41
4.2 Test input built-ins ............................................................................................................ 42
4.2.1 Introduction……………....................................................................................... 43
4.2.2 Step Response Simulation..................................................................................... 43
4.3 Model Analysis of Construction Material Supply Chain (CMSC) Model......................... 45
4.3.1 Behavior of the supplier processing and shipment model ......................................45
4.3.2 Behavior of the EPC contractor material management model ................................48
4.4 CMSC Model sensitivity (what-if) analysis...................................................................... 49
4.4.1 Single variable sensitivity analysis........................................................................ 50
4.4.1.1 Behavior of the CMSC model to EPC contractor order change……...…...50
4.4.2 Multi variable sensitivity analysis: Time response simulation under with EPC order
change……………………………………………………………………………57
4.4.2.1 Shipping Time Analysis…………………………………………….……57
4.4.2.2 Supplier’s Processing Time Analysis…………………………………….59
4.5 Intervention using safety stock (SS)……………………………………………………...61
4.5.1 Introduction………………………………………………………………………61
4.5.2 Behavior of the inventories to supplier’s safety stock inventory coverage .............62
4.5.3 Response of the CMSC model to sudden EPC order change with different safety
stock level ..............................................................................................................62
4.6 Discussion of results …………......................................................................................... 75
4.6.1 Supplier’s safety stock planning…………………………………………….……76
4.6.2 EPC’s material management planning...................................................................77

vii
CHAPTER 5: RECOMMENDATION AND CONCLUSION.................................... 78
5.1 Suggested policies ............................................................................................................ 78
5.2 Concluding Remarks......................................................................................................... 79
5.3 Limitations and Future work ............................................................................................. 80
REFERENCES ........................................................................................................................... 82
APPENDIX A: SYSTEMS DYNAMICS MODEL EQUATIONS................................. 96
APPENDIX B: COPYRIGHT PERMISSION ………………….…………………... 102

viii
LIST OF FIGURES
Fig. 1.1 EPC process model. ................................................................................................ 2
Fig. 1.2 Break-up time of a typical construction. ................................................................. 3
Fig. 2.1 Material Management Flow. ................................................................................... 8
Fig. 2.2 Phase Overlaps in EPC process ………………….………….……………………10
Fig. 3.1 The Simulation Method. ....................................................................................... 22
Fig. 3.2 Typical forms of behavior in a dynamic system .................................................... 26
Fig. 3.3 Stock and Flow Diagram. ...................................................................................... 28
Fig. 3.4 Construction Material Coordination System Unit ...……………………….......... 33
Fig. 3.5 Supplier Processing Model. .................................................................................. 36
Fig. 3.6 Supplier Shipment and Order Fulfillment Model .................................................. 38
Fig. 3.7 Order Fulfillment as function of supplier’s inventory. .......................................... 38
Fig. 3.8 EPC Material Management Model. ....................................................................... 40
Fig. 3.9 Material Usage as function of EPC contractor’s inventory.................................... 40
Fig. 4.1 EPC contractor's Inventory behavior to 10% EPC order increase……………...... 44
Fig. 4.2 Supplier's Inventory behavior to 10% EPC order increase..................................... 44
Fig. 4.3 Supplier's shipment behavior to 10% increase in EPC order ............................... 46
Fig. 4.4 Supplier's Processing response to 10% increase in EPC order. ............................. 46
Fig. 4.5 Graph showing when the supplier's inventory start falling. ………………..….... 47
Fig. 4.6 Supplier's service level to 10% increase in EPC order. ……………………........ 47
Fig. 4.7 EPC contractor’s usage rate response to 10% increase in their order change........ 48
Fig. 4.8 Effect of 10% increase in EPC order on supplier's service level: (a) material
delivery rate (b) inventory coverage...................................................................... 51
Fig. 4.9 Effect of EPC order change on (a) Order backlogs (b) Material Delivery Delay…52
Fig. 4.10 EPC change order on supplier's service level......................................................... 53
Fig. 4.11 Effect of various EPC order change on construction rate (a) 20% increase, (b) 40%
increase, (c) 60% increase, (d) 80% increase, (e) 100% increase, (f) graph showing
all the constriction rate behavior………………………………………………….54
Fig. 4.12 Effect of shipment delay time on (a) supplier's inventory coverage, (b) construction
rate…………………………………………………………………………….….58

ix
Fig. 4.13 Effect of process time delay on (a) supplier's service level response, (b)
construction rate response, (c) closer view of construction rate response………...59
Fig. 4.14 Order backlog response to different safety stock level under various order change
(a) 20% order increase, (b) 40% order increase, (c) 60% order increase, (d) 80%
order increase, (e) 100% order increase…………………………………..………63
Fig. 4.15 Order delivery response to different safety stock level under various EPC order
increase (a) 20% order increase, (b) 40% order increase, (c) 60% order increase, (d)
80% order increase, (e) 100% order increase……………………..………………66
Fig. 4.16 Construction rate response to different safety stock level under various EPC order
increase (a) 20% order increase, (b) 40% order increase, (c) 60% order increase, (d)
80% order increase, (e) 100% order increase………………………………..……69
Fig. 4.17 Supplier service level to different safety stock level under various EPC order
increase (a) 20% order increase, (b) 40% order increase, (c) 60% order increase, (d)
80% order increase, (e) 100% order increase……………………………..………72

x
LIST OF TABLES
Table 3.1 Notation for Construction Material Supply Chain (CMSC) model…………........ 29
Table 3.2 Illustrative Parameter for SD model...................................................................... 35
Table 3.3 Order Fulfillment Ratio Table…........................................................................... 37
Table 3.4 Material Usage Ratio Table .................................................................................. 39

xi
LIST OF ABBREVIATIONS AND SYMBOLS
ACRONYMS
CLD Causal Loop Diagram
CMSC Construction Material Supply Chain
CSCM Construction Supply Chain Management
EPC Engineering Procurement and Construction
ERP Enterprise Resource Planning
JIT Just In Time
SCN Supply Chain Network
SD Systems Dynamics
SS Safety Stock
SYMBOLS
AD Time to Average Delivery Rate, Weeks
ADD Actual Delivery Delay, Week
AT Time to Average Order Rate, Weeks
CEO Change In Expected Order, Materials/Week
CMD Change in Material Delivery Rate, Materials/Week
DDR EPC Desired Material Delivery Rate, Materials/Week
DEI Desired EPC Inventory, Material
DP Desired WIP, Materials/Week
DSI Desired Supplier Inventory, Material
DSR Desired Shipment Rate, Materials/Week
DUR EPC Desired Material Usage Rate, Materials/Week
DW Desired WIP, Material
EDT EPC Inventory Adjustment Time, Weeks
EI EPC Inventory, Materials
EIC EPC Inventory Coverage, Week
EID EPC Inventory Discrepancy, Material
EMD Expected Material Delivery, Materials
EO EPC initial Order, Weeks

xii
EOR Expected EPC Order Rate, Materials
ESS EPC Safety Stock, Weeks
FR Order Fulfilment Rate Ratio
MDR Material Delivery Rate, Materials/Week
MIC EPC Minimum Material Inventory Coverage, Weeks
MSR Supplier Maximum Shipment Rate, Materials/Week
MU EPC Maximum Usage Rate, Materials/Week
MUR EPC Material Usage Rate, Materials/Week
OB EPC Order Backlog, Materials
OFR Order Fulfilment Rate Materials/Week
OR EPC Order Rate, Materials/Week
PR Processing Rate, Materials/Week
PS Processing Start Rate, Materials/Week
PT Processing Time, Weeks
SDT Supplier Inventory Adjustment Time, Weeks
SIC Supplier Inventory Coverage, Week
SI Supplier Inventory, Materials
SID Supplier Inventory Discrepancy, Material
SR Supplier Shipment Rate, Materials/Week
SS Supplier Safety Stock, Weeks
ST Minimum Shipping Time, Weeks
UR EPC Usage Rate Ratio
WD WIP Discrepancy, Material
WDT WIP Adjustment Time, Weeks
WIP Supplier’s Work in Process Inventory, Materials
ᵟ₃ Third order delay

CHAPTER 1
INTRODUCTION
1.1 Background and Motivation
In the Engineering, Procurement, and Construction (EPC) industry, procurement is a functional
link between Engineering and Construction and is highly dependent on external companies. A
strong unity among the project functions will improve the coordination and communication within
the system (Yeo and Ning, 2002). Delivery of many large construction projects has encountered
cost overrun, delay, and loss of productivity. It is interesting to explore the underlying causes.
Many practitioners and researchers found that the poor management practice can lead to poor
outcomes such as the lack of proper planning and scheduling, scope changes, design errors and
omissions, and inappropriate management of material, equipment, and labour among many other
factors.
Over the decades, procurement strategies have been implemented in various organisations such as
manufacturing and construction to promote optimum performance in terms of cost, quality, and
time. In the presence of these strategies, EPC contractors still suffer from work backlog which
hinders them from functioning at a satisfactory level by embracing cost and schedule overrun. This
has been traced to lack of collaboration among supply chain entities and visibility in the supply
network. As depicted in Figure 1.1, the presence of feedforward and feedback flow of information
and materials in construction supply chain calls for collaboration for an efficient supply chain
system. An efficient supply chain management will require focus, not just on internal resources
such as management, engineering, procurement, and construction teams but on external resources
like suppliers and sub contractors. Furthermore, a large percentage of value adding occurs outside
the boundaries of a single firm (Bruce, Daly, and Towers, 2004; Gomez-Mejia and Wiseman,
2007).
A number of comprehensive analyses have shown the necessity of collaboration as a way to
mitigate delay which is costly (Iyer and Jha, 2005; Assaf, Al-Khalil, and Al-Hazmi, 1995;
Enshassi, Mohamed, and Abushaban, 2009). Studies have shown that delay in construction is a

2
major cause of negativity on construction projects which must be critically studied to improve
project performance. From study on time waste, labor force on site use about 40% of the project
time (from start time to finish time) on non-value added activities like waiting for permission or
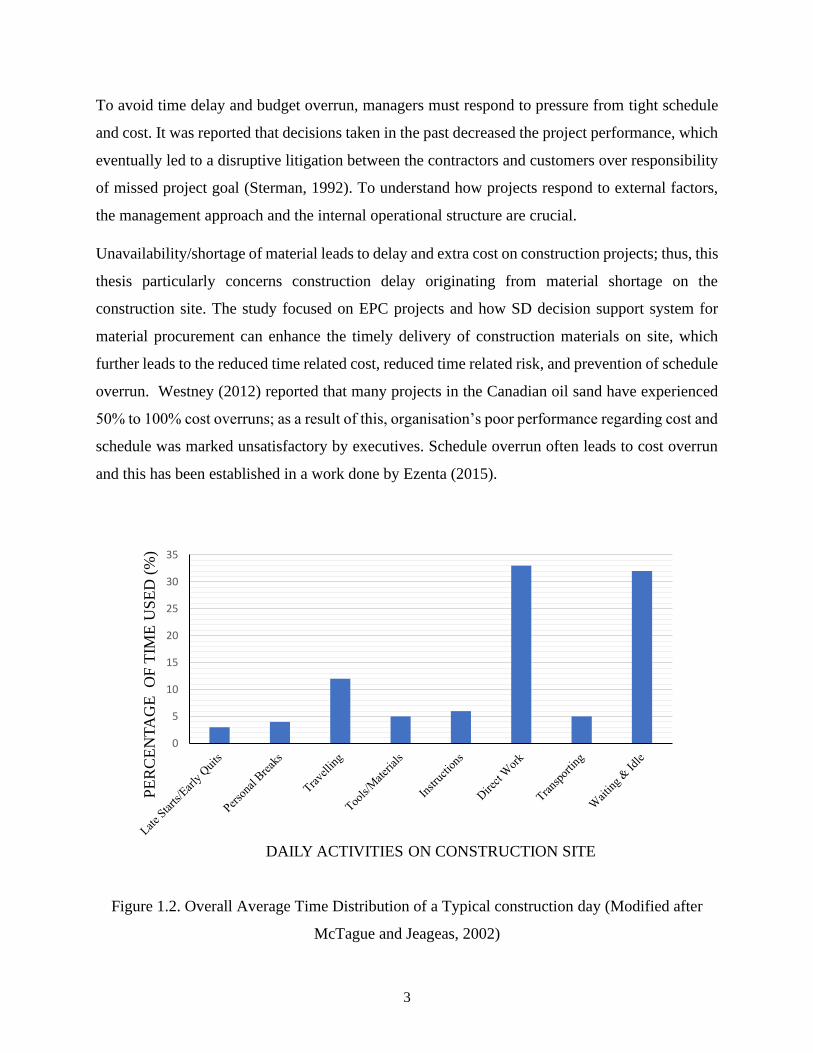
supply on site (Mohamed and Tucker, 1996). Figure 1.2 shows non value adding activities like
waiting for material supply have been reported as a major cause of poor performance in
construction projects (Jergeas, 2009; McTague and Jergeas 2002). Changing the external factors
such as procurement delay, availability of resources, and customer changes alter the original
schedule and cost. Schedule overrun occurs due to unpredictable duration for activities such as
negotiation, material procurement, and supply, and unnecessarily long approval process with the
authorities. Studies have shown that procurement takes about 50 to 70% of the total worth of
construction projects (Langston, 2016; Cagno, Giulio, and Trucco, 2004; Murphree, Cate, and
Vosburg, 2002; Kaming, Olomolaiye, Holt, and Harris, 1997), therefore, proper management of
the procurement function in EPC will significantly and effectively minimize project deviation and
save cost.
Figure 1.1. EPC Process Model (Yeo, K.T., and Ning, 2002)
3
To avoid time delay and budget overrun, managers must respond to pressure from tight schedule
and cost. It was reported that decisions taken in the past decreased the project performance, which
eventually led to a disruptive litigation between the contractors and customers over responsibility
of missed project goal (Sterman, 1992). To understand how projects respond to external factors,
the management approach and the internal operational structure are crucial.
Unavailability/shortage of material leads to delay and extra cost on construction projects; thus, this
thesis particularly concerns construction delay originating from material shortage on the
construction site. The study focused on EPC projects and how SD decision support system for
material procurement can enhance the timely delivery of construction materials on site, which
further leads to the reduced time related cost, reduced time related risk, and prevention of schedule
overrun. Westney (2012) reported that many projects in the Canadian oil sand have experienced
50% to 100% cost overruns; as a result of this, organisation’s poor performance regarding cost and
schedule was marked unsatisfactory by executives. Schedule overrun often leads to cost overrun
and this has been established in a work done by Ezenta (2015).
Figure 1.2. Overall Average Time Distribution of a Typical construction day (Modified after
McTague and Jeageas, 2002)
0
5
10
15
20
25
30
35
PE
RC
EN
TA
GE
O
F T
IME
US
ED
(%
)
DAILY ACTIVITIES ON CONSTRUCTION SITE

4
With regards to project deviation, the procurement process and strategies can be used as
realignment responses. Micheli and Cagno, (2016) used a case study approach with three
companies to know the cause of deviation in time and cost performance of projects, they found
procurement management to be one of the major causes (Micheli and Cagno, 2016). Several works
have been done to quantify the impact of material delay, and how it can be mitigated to improve
material supply chain, but few of them have focused on how to improve the gap between material
supply operational visibility and management. This shows the need for collaboration and most
importantly, helps managers make good decisions to prevent material shortage on the construction
site by understanding the dynamics of the material supply system. The intention of material
management is to ensure material availability at the right quantity and quality on the construction
site and having it in mind that reduction of procurement time and cost boost opportunity of overall
project time and cost reduction respectively. Other objectives of material management are
procurement and receiving, productive material planning, good contractor-supplier relationship,
storing and inventory control, quality control and assurance, and supply and delivery of material.
Adequate collaboration is required to achieve these goals.
This study focuses on how EPC contractor can relate with supplier by correctly aligning their
business goals. This study will also emphasize the need for information sharing by all participants,
which aims at helping EPC contractor in continually strengthening its capability. This study also
helps to facilitate optimal decision making during the material supply coordination. To improve
material supply performance, bottle necks must be removed by minimizing demand and supply
uncertainties, thus, embracing continual improvement. This study will be achieved by using
Systems Dynamics (SD), an integrative and holistic approach, which has a fundamental view of
studying the dynamic behaviour of a system structure which is caused by delay and feedback.
1.2 Research Objectives and Scope of Thesis
This study attempts to give probable decision support system by using the systems dynamic model.
The overall objective to develop a decision support model for material procurement to enhance
timely delivery of construction materials. To achieve the overall objective, the following specific
objectives were proposed.

5
Objective 1: To investigate and implement the existing procurement strategies in EPC system,
which mitigate material shortage on construction site.
Objective 2: Investigate the impact of time delay and information sharing, demand forecast on
material supply system using SD decision support model.
Objective 3: Demonstrate the capacity of the model to suggest policy that will enhance timely
delivery of construction materials on site.
This thesis focused on construction material, largely consumed during construction, and are off-
the-shelf. This model can be used as a decision-information tool to enhance the understanding of
the basic factors that affect the shortage of material on site with a focus on the interaction of the
Construction Material Supply Chain (CMSC) entities to improve the project performance.
1.3 Thesis Organization
The remaining part of the thesis is arranged as follows. Chapter 2 gives a background information
and literature on work related to the proposed research objectives. Chapter 3 describes the problem
and the design of the model using the FCBPSS structure, SD model formulation, parameterization,
and construction which aligns with the supply of construction material, using stock and flow
diagram structure proposed by Sternman. Chapter 4 presents the model validation, results, analysis
and its intervention. Lastly, Chapter 5 discusses the suggested policy, conclusion, and future
research.

6
CHAPTER 2
BACKGROUND AND LITERATURE REVIEW
2.1 Introduction to Supply Chain Network (SCN)
Supply chain network (SCN) is an inevitable part of engineering management in EPC industry,
thus, any form of disruption in the SCN of an organization will expose it to risk. Adequate attention
must be given to the SCN of a company as supply, demand, availability, and capability of internal
resources are greatly connected to profit gained, and disruption of any of these three will bring
failure to the firms in supply network. SCN is a complex network of entities that experiences
frequent turbulence which generates potential for unpredictable disruption. Its vulnerability,
caused by lots of uncertainties, has gotten the attention of industry and academics, therefore for
companies to survive, there is need for management strategists to take proactive steps towards
supply chain efficiency and resiliency (Wang, Dou, Muddada, and Zhang, 2017;Wang, Ip,
Muddada, Huang, and Zhang, 2013). Although uncertainty in market is on the rise and often
unpredictable, business can go a long way towards mitigating damage or the impact of disruption
with proactive measures at different phases of disruption. Most times, decision makers use warning
means such as sharing inventory, forecast, and logistic data to identify supply chain irregularities
and in turn, the possible chain reactions are communicated to the concerned firms. Siau and Tian
(2004) made us understand that the road to a firm’s continual survival is through a competent
supply chain.
Collaboration has been identified as one of the ways to reduce uncertainties in supply chain
(Christopher and Peck, 2004). The health status of a supply chain network depends on how well
the interdependent firms collaborate to be able to quickly recover from disruption. Firms need to
engage in collaboration to lessen vulnerability, increase sustainability, and enable healthy financial
status by taking proactive measures towards a resilient inter firm supply network. Currently, the
business world is in a challenging time and there is need for partner firms to cooperate more and
leverage on both external and internal resources across the various supply chain. It is seen that
partnership reduces procurement chain and deviation causes, which is needed in EPC projects as
procurement can minimize deviations in the project performance (Micheli and Cagno, 2016). This
7
systems approach (use of systems dynamics modelling, collaboration, use of integrated
procurement strategies) will help in decision making by giving insight into the complex dynamic
nature of the project procurement system.
Firms are learning to live with uncertainty and the ever-changing market has called for firms to
take adequate measures in managing disruptions. This has made researchers explore supply chain
dynamics continuously to have a better and solid understanding to aid takes proactive strategies in
mitigating risks in firms.
2.1.1 Construction Supply Chain Management (CSCM)
Construction Supply Chain Management can be a complex system which consists of large number
of partners (owner, contractor, consultant, regulator, supplier) having different goals and at the
same time participating in another supply network. Therefore, it is clear that high level of
cooperation and coordination of activities is needed within and among the firms, which will help
reduce uncertainties and increase customer satisfaction. Uncertainties in CSCM can emanate from
time delay in projects, market fluctuation, changing customers’ requirement, project and material
cost, government policies, etc.
2.1.2 EPC: How procurement serve as a strategic link from project recovery deviation
EPC is a prominent form of contracting in the construction industry with pre-specified and agreed
timeline and cost, one company is responsible for all phases of project which includes engineering
design of project, procurement of required equipment and materials, and construction of
functioning facility to meet the customer’s expectation. The importance of EPC contracting
method is largely recognised in the engineering field because of its associated benefits like reduced
project cost, tighter project schedule, and risk-bearing attribute, thus, this approach aims at
seamless delivery of project. EPC has gained the attention of researchers because of its increased
economic relevance, so there is need to address sources of disruption and how the effects can be
mitigated on project performance. Construction sectors contributes about 10% to the Gross
Domestic Product (GDP) of an industrialized nation (Navon, 2005; Allmon et al., 2000). EPC

8
industry faces challenges like work fragmentation, sophisticated organizational structure,
interconnected processes, phase overrun, and vagueness in the correct forecasting of the desired
result (Breuer, Fischer, and Member, 1994). Some EPC contractors have suffered huge losses due
to inadequate knowledge of supply chain management, which has a strong bond to delivery time
and cost incurred on the project, and eventually affects the overall performance of the firm.
Therefore, there is a need for EPC firms to engage more in collaborative practices to build a
resilient and healthy supply network. This work focuses on the material management process
which is usually done at the planning and execution phase of construction projects, where each
activity is time-phased according to earlier activities, resources needed, and constraints. Material
management has become critical to the success of a construction project. The material management
functions can be seen in Figure 2.1 below.
Figure 2.1. Material Management Flow
Material procurement is large percent of the total worth of project, so minimizing its cost will
greatly enhance the project performance and lead to opportunities that will reduce the project time
and cost. Procurement processes are associated with all phases of the project life cycle, which
starts with what is to be purchased and close with confirmation of the conformity of the final

9
product with the required standard (International Standards Organisation, 2010). A procurement
process includes: material take-off, supplier research, market price prediction, supplier
qualification, purchase requisition, supplier selection and final choice, development of the system
supporting relation, order management and inspection, shipping, and knowledge management.
Mubin and Mannan (2013) proposed a risk identification model, which showed that the
procurement process has the topmost risk. Some challenges faced by the procurement and material
management team are the selection of unqualified suppliers and subcontractors, late involvement
of the procurement team, material supply and flow to meet construction timeline, lack of experts,
poor communication, late delivery of material, availability of material, etc. (Thomas et al., 2005;
Drew, Tang, and Lui, 2004; Murphree, Cate, and Vosburg, 2002).
Procurement is essential and relevant in the construction project, as it serves as a strategic link to
recovery from project deviation. Using a different mix of strategy and process modification,
Micheli and Cagno (2016) demonstrated this by using case studies of top-rated EPC companies
(Micheli and Cagno, 2016). Ruparathna and Hewage, (2015) reviewed the definitions of
construction procurement in previous literature and classified them into two, based on what they
focus on: (1) purchasing contracts only and (2) all activities associated with purchasing
activities/services necessary to achieve the project objective. According to Miller et al. (2009), a
procurement method practiced is often selected by the project owner or construction manager,
which usually tends towards the route that has worked for them in the past, which should also
depend on the price/compensation formation method, project delivery method and conditions for
contracts (Eriksson and Westerberg, 2011). Laedre et al., (2006) made it clear that the using an
unsuitable procurement method can lead to schedule overrun and money wastage (Laedre,
Austeng, Haugen, and Klakegg, 2006). Thomas et al., (2005) showed how Out of Sequence (OOS)
material delivery promote delay on construction site while Mawdesley and Al-Jibouri (2010)
emphasized the criticality of material management to construction productivity. Therefore,
adequate and proper management of the material procurement is needed to prevent shortage and
excess material inventory on project site so as minimize the project deviation.
In Figure 2.2, the great influence of procurement is just as conspicuous with regards to time and
cost, such as studying the time for construction material supply by selected suppliers, procurement

10
process, which takes place before and during construction, and the final quality of product being
purchased and delivered.
Figure 2.2. Phase Overlaps in EPC process (Yeo, K.T., and Ning, 2002)
2.2 Factors affecting construction project performance
Many studies have focused on factors impacting project performance. Performance is assessed by
using various performance indicators which can be grouped in two classes depending on the aspect
being considered. Class 1 are those related to dimensions like time, cost, quality (Micheli and
Cagno, 2016; Ling, Ong, Ke, Wang, and Zou, 2014; Chan and Chan, 2004) and Class 2 are those
related to entities in the CSCM – owner, contractor, subcontractor, consultant (Pheng and Chuan,
2006). Performance indicators predominantly used by most stakeholders to evaluate construction
project outcomes are time, cost, quality, health, and safety. It has been observed by Dissanayaka
and Kumaraswamy (1998) that time and cost performance is controlled by procurement system,
project nature, collaboration, and stakeholder’s performance. Some of the factors that affect project
performance are discussed below.

11
2.2.1 Material delay on construction projects
Construction delay has been a reoccurring issue that hinders project success. Researchers have
identified causes of project delay to reduce or prevent delay and their associated cost. Using semi
structured interviews, Assaf et al. (1995) highlighted many causes of construction delay and
organised the construction delay into 9 major groups: financing, materials, contractual
relationship, changes, long permit approval process, man power, scheduling and control,
equipment, and environment (Abd El-Razek, et al 2008; Assaf, Al-Khalil, and Al-Hizami, 1995).
Material delay ranked high. This was seen in other works by Murphree et al., (2002) and Thomas
et al., (2005), who also highlighted inefficient material management as a major cause of project
delay and financial loss. Wang et al. (2016) carried out a survey which identified the five major
important risks to EPC namely, inflation, government inefficiency, shortage of material in the
locality, fluctuating financial market, and unstable political situation (Wang, Tang, Du, Duffield,
and Wei, 2016). From the study by Enshassi et al., (2009), the top most factors affecting
construction project performance emanated from the material management with the stakeholders
giving the highest rank to shortage/unavailability of materials and resources (Enshassi, Mohamed,
and Abushaban, 2009). Horman and Thomas, (2005) reported that the delay that evolved from
material management was the most documented probable after study of about 125 projects.
Literature shows that shortage of materials has been a reoccurring source of project deviation for
EPC contractors. Material-related causes that affect project performance include: slow delivery of
material, shortage of construction materials onsite, damage of materials in storage, change of
material specification and type during construction, and imported material items (Abd El-Razek
et al., 2008). Transportation can be integrated into the cause of material shortage. There is usually
an exchange of information and drawing between supplier and contractor, which often brings time
delay into the procurement.
2.2.2. Impact of material supply delay on construction performance
Project construction usually depends on material supply needed, and the delivery of these materials
affects the project schedule. Delay in supply of material has been found to be a major cause of
time overrun (Dey, 1996). Proper material planning would help give direction to all the successive

12
activities which will have a huge impact on project success. The planning process includes record
upkeep, target inventory level determination, and material delivery frequency (Payne et al. 1996).
Construction materials like pipeline, rebar, tiles, glass, rubber, cement, bulk filling materials (soil,
rocks etc.), ceramics, gravel, lead, paints, plastics, plywood etc. which are consumed in large
quantity can hinder construction progress. Some materials are required earlier (i.e. long-lead
items), thus, the project schedule is included in the contracting plan. Beyond identification of risk
factor in construction, there is need to assess the impact of the risk and how it can be mitigated to
prevent or reduce poor project performance. (Enshassi et al., 2009). Said and El-Rayes, (2011)
proposed an optimisation model-Construction Logistics Planning model to show the impact of
material shortage on site. Various studies on impact of material delay/management on project
performance have been carried out, these includes Horman and Thomas, 2005; Thomas, Riley,
Member, Sanvido, and Member, 1999; Thomas, Sanvido, Member, and Sanders, 1990.
2.3 Stakeholders of a construction industry and their impact
The poor performance of projects can also be attributed to the participating parties like owner,
consultant, contractor, supplier. The owner and contractor, who look at performance from both
macro and micro viewpoint respectively, have the largest impact on the construction performance.
Material supply delay, a contractor-related risk is seen to be common in most construction projects
and the timely completion of projects is profitable to all parties concerned. Various studies have
shown how supply chain relationship can affect project performance (Meng, 2012; Chen and Chen,
2007; Beach, Webster, and Campbell, 2005; Paul Humphreys, Jason Matthews, and Monan
Kumaraswamy, 2003; Black, Akintoye, and Fitzgerald, 2000). To deal with risks, EPC contractors
must have a good relationship with all stakeholders (Yang, Shen, Drew, and Ho, 2010;
Newcombe, 2003), who are regular sources of risks and find way out to prevent or lessen the risks
(Tang, Li, Qiang, Wang, and Lu, 2013). Risks that can be avoided or minimised include: conflicts,
design deviation, uneconomical material, and equipment procurement.(Grau, Back, and Prince,
2011; Pulaski and Horman, 2005)

13
2.3.1 Contractor-Supplier Relationship
Each entity in a supply network has its role to play to make the network a resilient one (Wang,
Dou, Muddada, and Zhang, 2017). Therefore, there is need for supplier relationship agreement,
which helps in early selection of supplier (Slootman, 2007; Chu, Tso, Zhang, and Li, 2002) and
joint model development which helps mitigate time delay. Customer satisfaction, reduced cost,
and improved performance can be accomplished through contractor-supplier relationship
improvement (Beach et al., 2005; Larson and Larson, 1995). According to Yeo and Ning, (2002),
to improve supply chain relationship, good and reliable partners must be selected and these
partners must protect each other’s interest (Yeo and Ning, 2002). Past studies have shown how
factors of the supply chain relationship can affect the project performance (Meng, 2012; Chen and
Chen, 2007). Factors such as supplier’s service level, supplier’s delivery reliability, joint
continuous improvement, and efficient problem solving have tremendous impact on the project
success (Pal, Wang, and Liang, 2017). A good supplier–contractor relationship will help to avoid
and resolve conflict early, increase serviceability ability which will in turn contribute positively to
the project performance. In opposition to the traditional SC relationship relation which is cost
based, Greasley (2000) reported that supply chain relationship is dependent more on factors such
delivery capability, quality, flexibility, and commitment of partners. (Greasley, 2000). It has been
observed that having a long-term contract with suppliers can minimize or prevent price increase.
Factors of a successful supply network relationship are commitment and collaboration among
partner headed for improved supply chain performance (Cao, Vonderembse, Zhang, and Ragu-
Nathan, 2010; Griffith, Harvey, and Lusch, 2006; Cao and Zhang, 2011). In the construction
industry, lack of trust makes the main contractors give favourable surplus quote, while supplier or
subcontractor hide their cost information to prevent the main contractor from reducing its profit
(Du et al., 2016; Manu, Ankrah, Chinyio, and Proverbs, 2015; Beach et al., 2005). The EPC
contractor needs the supplier to deliver quality material and support the project schedule.
Suppliers, who usually supply to more than one contractor usually organise their supply plan based
on their customer’s demand, contract’s terms and condition.

14
2.4 Supply Chain Procurement Strategies
Firms need to come up with designs to make their logistic and procurement efficient and effective
in project performance (Dainty, Briscoe, and Millett, 2001 ; Vrijhoef and Koskela, 2000).
Disruption has an adverse effect on the performance of a firm, therefore for firms to survive, there
must be strategic thinking towards proactive strategies to mitigate uncertainties and vulnerability.
Suitable and efficient procurement route will be based on each project’s characteristics or specific
situation, objectives and project performance expectations, as no two projects are the same, so also
no approach is suitable for all types of projects. According to Laedre et al., (2006), rigidity of an
organisation to a new procurement strategy is common, as often times the usual procurement route
is followed even when the route in not appropriate for a specific project type which is against the
recommended practice (Laedre et al., 2006). Existing procurement studies will be discussed below.
Inventory / Buffer Management: Buffers are used to reduce uncertainties in projects.
Procurement chain can be improved by coupling supply chain management and critical chain
project management. They used the buffer management approach to reduce the uncertainties in
procurement (Yeo and Ning, 2002). Time buffer helps to safely reduce time waste on construction
by incorporating a float on the project schedule which includes all the planned dates from starting
and completing project activities and milestones. In material management, a float is inserted
between the promised delivery date and the required on site date (Yeo and Ning, 2006). Inventory
buffer for construction material is needed to enhance construction performance (Horman and
Thomas, 2005). Good inventory management by entities in the supply network can help mitigate
supply delay (Huang, Yang, Zhang, and Liu, 2012).
Early Sourcing and Purchase Order: Early sourcing strategy was used for solving procurement
problems in EPC firm (Azambuja, Ponticelli, and O’Brien, 2014), while, Jergeas (2009) proposed
early purchase order of material as a way to minimize material delay in construction project.
Seshadri, Chatterjee, and Lilien, (2008) developed a model to show the relation between multi
sourcing and its effects which includes seller’s profit, buyer’s profit, and numbers of bids. To
increase reliability of supply, multiple sourcing has been embraced as a way out. Back up strategy

15
is not a common practice in construction because of the cost and time associated in the selection
of suppliers.
Expedite: Procurement team should brainstorm with the suppliers on how to expedite the
manufacturing and transportation of the material and equipment to enhance timely delivery. This
is regarding purchase order, the project’s requirements, and schedule. This process must be well
planned because information sharing is practiced regularly between the contractor and the supplier.
In the service supply chain, we have backlogs which is managed by capacity adjustment
(Akkermans and Dellaert, 2005).Through exchange of expediting report between the project
control and procurement team, delay can be minimized. Lead time reduction and information
sharing on demand enhance SC performance. Anderson, Morrice, and Lundeen, (2005) showed
this in their work and proposed some policies to minimize backlogs, which usually indicate the
level of responsiveness of a system.
Lean Concept: An aspect of lean concept is just-in-time (JIT) strategy, a process improvement
approach, which is often practised in the delivery of construction material to minimize material
inventory, double handling, and material waste, and enhance quality and maintenance. This
approach aims at reducing response time from suppliers. Close relationship with the suppliers is
vital for successful implementation of JIT strategy (Akintoye, 1995; Pheng and Hui, 1999;
Shmanske, 2003; Polat and Arditi, 2005a). The random flow of material and inadequate
information sharing cripple the extensive use of lean principles to construction supply chain
(Fearne and Fowler, 2006; Forsman et al., 2012; Eriksson, 2010)
Material Decision Support Models: Researchers have proposed decision support systems to help
managers and decision-makers make good decisions to enhance timely delivery of material on
construction site by considering the material inventory level and storage need. The model will give
insight to the behaviour of the procurement system over time and help in developing effective
principles and policies for material management. Past studies looked into the development of
policies and their impact on various aspect of construction projects such as: material supply

16
decision on construction labour productivity (Thomas, Riley and Sanvido, 1999; Thomas, Sanvido
and Sanders, 1990), development of principles for site material management ( Thomas, Riley, and
Messner, 2005), and decision support system for material supply ( Tserng, Yin, and Li, 2006;
Polat, Arditi, and Mungen, 2007). Jaśkowski, Sobotka, and Czarnigowska, (2018) proposed a
decision model by solving a fuzzy model with the aim to reduce the inventory cost for large
construction material. Other existing decision models focused of selection of suppliers. (Cengiz et
al., 2017; Patil and Adavi, 2012; Lam, Tao, and Lam, 2010; Ho, Nguyen, and Shu, 2007).
Material - logistics Models: Said and El-Rayes (2011) proposed an optimization model -
Construction Logistic Planning model to help contractors reduce material logistics cost. This
model also enhanced the material procurement decisions and site layout policies which considered
material storage space and temporal facilities for the project duration. Existing studies considered
material storage capacity alongside with construction site layout (Elbeltagi, Hegazy, and
Eldosouky, 2004 ; El-Rayes and Said, 2009). Ghodsypour and O’Brien (2001) developed a mixed
inter nonlinear programming model to find the least cost cyclic ordering for the customer by
examining multi sourcing problem with multiple criteria and capacitated suppliers.
Simulation- based Approaches: Modelling and simulation are an efficient means to solve
complex systems. Systems Dynamics (SD) re-emerged about two decades ago with research focus
on supply chain design and integration, demand amplification, inventory decision and policy
development, time compression, and international supply chain management. SD model can be
used to carry out what-if-analysis to study the impact of policy developed, giving project managers
foresight of the behaviour of the system under various desired scenarios (Boateng, Chen,
Ogunlana, and Ikediashi, 2012)
Researchers have supported the use of simulation-based approach for a strategic design and
quantitative analysis for the impact of disruption on supply chain (Vanany, Zailani, and Pujawan,
2009), as supply disruption can hinder cash and operation flow and may eventually stop it. In a
whole supply chain, all nodes must make appropriate purchasing and inventory strategies to lessen
the impact of supply disruption in both upstream and downstream (Ellis, Henry, and Shockley,

17
2010). Sterman, (2000) proposed that the multi-limitation to flow in a firm makes it necessary for
most activities to be captured by the SD model. Various works have used SD to show the impact
of delay and information sharing which limits the flow in a supply chain (Ge, Yang, Proudlove,
and Spring, 2004; Feng, 2012). Using the SD approach, Tang and Ogunlana, (2003) modelled the
factors affecting construction performance, and Love, Mandal, Smith, and Heng, (2000) identified
the factors causing schedule overrun. Several software tools such us Enterprise Resource Planning
(ERP), Advance Planning and Scheduling (APS) and Material Requirement Planning (MRP) can
be used to manage supply chain but their incapability to handle the feedback, delay, and dynamic
nature of the supply chain limit their application (Akkermans and Dellaert, 2005).
Systems dynamic works by modelling the internal structure of the complex system, analysing the
causal relation feedback and developing a policy and strategy from the verification and validation
done during simulation. Systems dynamics is a continual improvement process that takes into
consideration the (information) feedback causal relation and policy structure. This understanding
gives insight to the managers when taking decisions which affect the project performance
2.4.1 Supply Chain Collaboration: Abd El-Razek et al. (2008) concluded after comprehensive
analysis that, to decrease delay in construction projects, collaboration is needed. Wang et al.,
(2016) reported that a good knowledge of cause and effect relationship between firms will help
EPC contractors manage project risk very well by blending both inter and intra organisation
resources to achieve the goal which is project success. One of the major characteristics of
collaboration is sharing of information (risk, objectives, problems, resources etc.) accurately and
with velocity. The procurement department engages more in communication and negotiation with
the external parties of the construction, therefore, there is need for the function to bond well with
the suppliers. Collaboration, which helps prevent opportunistic behaviour among supply chain
partners, is defined as a “glue that holds supply chain firms in crisis together” (Richey, 2009).
Simatupang and Sridharan, (2008) identified decision synchronisation and incentive alignment are
two essential element of supply chain collaboration useful for disruption response. Firms that will
survive in this competing business world must embrace collaboration. Several studies showed how
supply chain improvement can be attributed to collaboration among partners in the network. (Cao,
Vonderembse, Zhang, and Ragu-Nathan, 2010; Griffith, Harvey, and Lusch, 2006).

18
In this inter-firm SCN, the resiliency of a firm does not guarantee the resiliency of the entire
network of firms, therefore, there is need for each firm to play its role for its survival and in the
best interest of the whole supply chain (Wang, Dou, Muddada, and Zhang, 2017), thus, to drive
this in EPC projects, collaborative attitude among all chain members, timely information sharing,
and organized procurement procedures should be practiced. According to Cao et al. (2010), SC
collaboration has been studied from four viewpoints, namely: transaction cost economics, resource
based view, uncertainty reduction, and transfer of knowledge (Cao et al., 2010). Risk-related
problems can be solved when partners exercise trust, joint analysis, and resource sharing (Cho,
Hyun, Koo, and Hong, 2010;Yeung, Chan, and Chan, 2009; Bower, Ashby, Gerald, and Smyk,
2002). Network of firms needs adequate knowledge of supply chains for the smooth running which
involves flow of material, cash, information from suppliers to end-users (Crum, 1999; Mentzer et
al., 2001). In the network of inter-firm, coordination is not enough, as collaboration must go along
for the efficient performance (Malindretos and Binioris, 2012). Past studies have shown the power
and the importance of partnership collaboration (Singh, Gu, and Wang, 2011; Yeung, Chan, and
Chan, 2009; Cho, Hyun, Koo, and Hong, 2010; Brahm and Tarzijan, 2016 ; Broft, Badi, and Pryke,
2016; Babaeian Jelodar, Yiu, and Wilkinson, 2017). The struggle of control and visibility of supply
chain is rampant with companies, there is need to leverage on technology to have a platform, where
supply partners can collaboratively share information and coordinate operations. Eldabi and
Keramati, (2011) also reported inter-firm supply chain give better visibility and helps organisations
compete greatly in the world of business and sustain their financial health. Researchers
recommended quick response, collaborative planning, and efficient customer response as way out
of bullwhip, amplification, and distortion effect in supply chain.
2.4.2 Material Management Policies
Dealing with collaboration challenges among entities in a supply network involves balancing
profits on each sides of the supply network members, concerns with resource and information
sharing, lack of trust, commitment, investment preference, risk management, and intellectual
property security. Thus, this introduces complexity and diversity into the decision making process
of the managers, hence, improving SC operation visibility has been established as one of the ways
of improving decision and policy making, which has positive effect on profit and customer

19
satisfaction (Natour, Gibson, and Gibson, 2011). In addition, improving the SC operation visibility
can also reduce uncertainty in SC (Sarimveis, Patrinos, Tarantilis, and Kiranoudis, 2008; Sterman,
1989; Sterman, 1992). One of the demanding responsibilities of policy makers is to generate value
by building integrated supply chain (Wadhwa and Saxena, 2007). Although supply chain
collaboration has good impact on the supply chain performance, according to past works, its
implementation still remain a complex one (Chen, Daugherty, and Landry, 2009).
To minimize uncertainties, decision makers must investigate the observable attributes of the
material supply system, which is controlled by some dependent factors such as dissimilar
objectives, uncertainties, and mutual distrust. Transparency and openness in decision making
process will enhance information and resource sharing (Denize and Young, 2007). Managers/
policy makers should investigate how information can be distributed in the network to enhance
collaboration. The higher the uncertainties awareness by partners, the lesser their flexibility to
collaborate (Riddalls, Bennett, and Tipi, 2000); the better the information sharing culture (capacity
utilisation, production plan, customers demand/order rate), the lesser the risk attached to material
stock out or excess inventory. Christopher and Lee (2004) reported that partners’ confidence can
be created by allowing all entities have control over the SC activities. (Christopher and Lee, 2004),
but control-oriented management hinders expected benefits such as cooperation in the supply
network (Ramon Gil-Garcia, Chengalur-Smith, and Duchessi, 2007; Griffith et al., 2006; Jensen
and Meckling, 1976; Eugene and Jensen, 1983).
Some suggestions given on construction material management include IT integration during
project planning, continuous material management training, selection of qualified suppliers,
consideration of material cost and logistics during the early project planning, development of
strategic plan as a proactive measure (Caldas et al., 2015). SD approach helps to determine
decision – making policies that are not beneficial and the policies that can be used to enhance
project performance.
2.5. Conclusion
Researchers have investigated several procurement strategies that can mitigate material shortage
in construction, but lack of collaboration still makes the problem to be persistent in the construction

20
industry. The knowledge of the how the construction industry contributes to the GDP of a nation’s
economy calls for a need for immediate solution to further mitigate risks like material shortage,
thus, improving the performance of the construction industry. Researchers have also developed
decision support tools to help decision makers or managers make effective policy to enhance
project performance but none of it has studied how the relationship between the EPC contractor
and its supplier can enhance the construction performance through the decisions made. The
expected contribution of this work is to develop a decision support SD model which will help
understand the material supply chain dynamics between the EPC firm and its supplier, which often
emanates into material shortage on site and how this risk can be mitigated to enhance project
performance. In conclusion, the proposed research in terms of the research objectives may make
some meaningful contribution to the construction management in general and EPC management
specifically.

21
CHAPTER 3
METHODOLOGY AND MODEL DESCRIPTION
3.1 System Dynamic (SD) Approach in Supply Chain
The System dynamics approach was formulated by Jay W. Forrester in the 1960s. SD is a powerful
management tool for modeling and simulating complex real-life systems to understand the
complex nature of the system and strategic decisions/policy execution. The model is based on
causal feedback that balances or reinforces complex relationship between system variables
(Richardson, 2011). The concept of feedback permits the past behaviour to control the prospective
action. In this computer-based simulation environment, the differential equation is graphically
represented and the discrete step is computed by the computer over a predetermined time frame
(Sterman, 2000). According to Van Ackere et al. (1997), SD approach is suitable for systems
which contain and are hugely affected by core variables that adjust over time and when it is well
known that dynamic feedback occurs. A SD model gives a holistic view of a system, how it
changes over time, and interactions within the system and outside with exogenous factors. For the
smooth running of operations, organisations should be able to determine delay and disruption in
activities affecting the incoming customer order, processing operations, and long-term revenue.
The SD approach gives insight into the factors affecting the nonlinear dynamic behaviour of a
system under certain conditions or assumptions or contexts. The concept of context is gotten from
Zhang and Wang (2016) and Zhang (1994). This approach provides analysis to ‘what-if” question
by decision makers. Systems dynamics, a continuous time approach, enhances supply chain
visibility and this visibility ensures confidence into supply chain and help prevent ineffective
decisions in a risk event situation (Christopher and Lee, 2004). Supply chain visibility looks into
information about the entities and activities regarding end to end orders, inventory, shipment and
distributions in a systems (Wei and Wang, 2010). Also, SD suggests ways the current process can
be improved.
SC performance has great influence on a firm’s success, moreover, an efficient SC should enhance
control and better understanding of a system, to help firms obtain reduced cost, improved response
time, lowered inventory, and minimised demand uncertainty which often spring from unstable
22
delivery services, demand projections, lead time delay, and altered information. The literature has
established that collaboration by sharing needed information within firm and among SC partner
will greatly improve construction firm’s performance, as they are able to make adequate plans for
the availability of construction materials.
From the perspective of SD, supply chain (SC) can be described as a structure of chain of stock
and flow which controls stock of inventory, rate of shipping, processing and capacity. This
structure harbors delay from decisions regulating the flow. Systems dynamics methodology
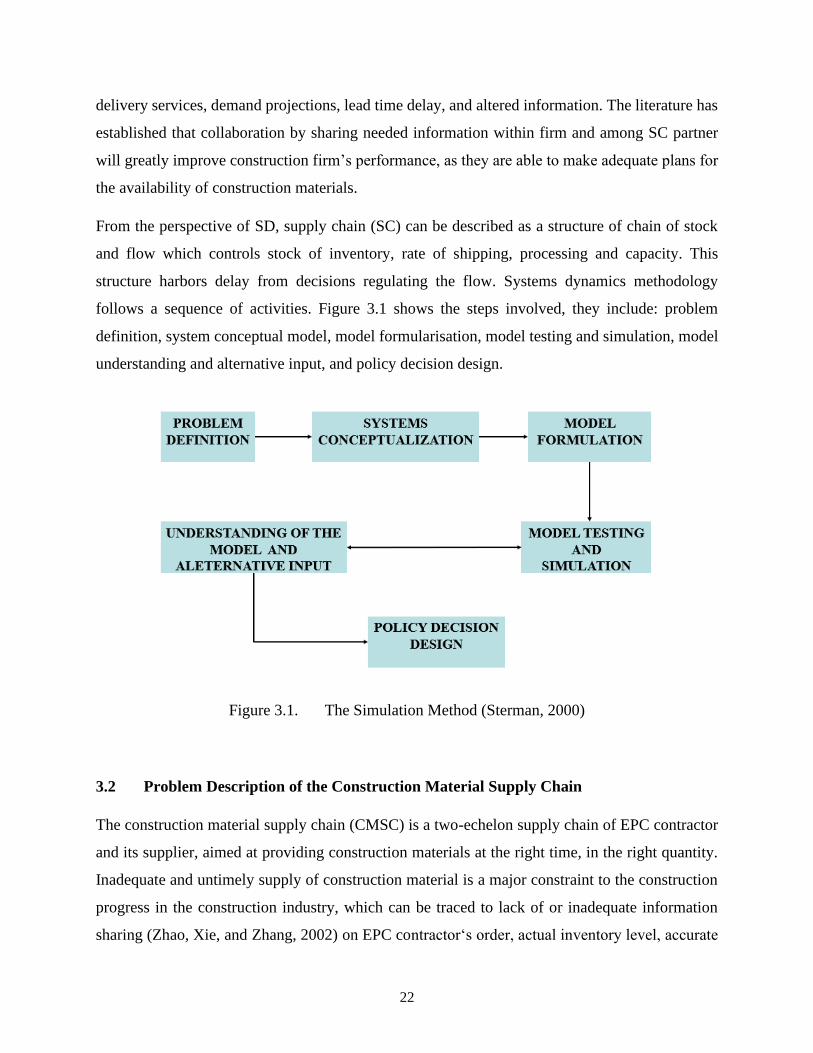
follows a sequence of activities. Figure 3.1 shows the steps involved, they include: problem
definition, system conceptual model, model formularisation, model testing and simulation, model
understanding and alternative input, and policy decision design.
Figure 3.1. The Simulation Method (Sterman, 2000)
3.2 Problem Description of the Construction Material Supply Chain
The construction material supply chain (CMSC) is a two-echelon supply chain of EPC contractor
and its supplier, aimed at providing construction materials at the right time, in the right quantity.
Inadequate and untimely supply of construction material is a major constraint to the construction
progress in the construction industry, which can be traced to lack of or inadequate information
sharing (Zhao, Xie, and Zhang, 2002) on EPC contractor‘s order, actual inventory level, accurate

23
processing time, and delay encountered. However, EPC supply chain managers desire to know all
information related to the management of materials from the beginning, when the contractor makes
order to the end, when the materials are delivered by the supplier, but lack of access to information
can cripple the decisions or plans on being proactive to minimize or avoid material shortage on a
construction site. Therefore, for the supplier to satisfy the EPC contractor, the contractor must be
willing to give timely and accurate information and vice versa. The supplier seeks to know the
order backlog to effectively strategize how the order will be fulfilled without delay or with a
minimal delay by considering the inventory and processing schedule.
Supply chain performance is not a function of one entity in the system, therefore, adequate
information sharing, and collaboration is essential. Else, the aftermath of the material supply
coordination will be experienced by all SC members in a different proportion, depending on the
type and condition of contract made. For collective interest, a collaborative culture will promote
achievement of common and unobjectionable goals by sharing adequate information, namely
preventing time delay, cost overrun, surplus stock, and slow feedback in material acquisition.
In this study, a holistic view of material management with focus on material supply and usage with
its relation to procurement strategies was taken. This SD model considers key variables and
management efficient viewpoint, thus, enhancing effective decision making. Furthermore,
observing the behaviour over time will give a better understanding of the significant relationships,
evolved pattern, and determinants of the desired state and impact of prospective decisions or
policies. Performance metrics used are material usage rate, supplier’s inventory coverage,
unfulfilled order (order backlog), and order delivery delay.
As seen in Figure 3.1, after the problem description, the system conceptualisation was done by
using the FCBPSS framework and the Causal Loop Diagram (CLD), which are discussed in the
subsequent section.
3.3 FCBPSS Framework
The FCBPSS was proposed by Lin and Zhang (2004), which was adapted in this work as a tool to
design the model. This modelling methodology has been applied in various domains of systems
such as telecommunication system, electric power generation, transportation systems, water

24
supply system, robotic system, educational system, and biological system. Zhang and Van
Luttervelt, (2011) applied FBS model in a manufacturing system. According to Zhang (ME 886
class note), the FCBPSS is a modelling tool that helps gives a framework, a set of concepts upon
which a system can be built and information architecture, a system where its functions and concept
is expected to realize the expected function. The FCBPSS has six canonical concepts, which are
Function (F), Context (C), Behaviour (B), Principle (P), Structure (S), and State (S). A system has
a boundary which interacts with other systems through the structure that contains input and output
variables that cause change in the state of the system. In system analysis, along the path of the
structure to function, one can evaluate whether a given structure can achieve a required function.
In system design, the required function and context are given, and one needs to determine the
required state and behaviour and eventually the structure (Zhang, ME 886 class note).
3.3.1 The FCBPSS framework of the Construction Material Supply Chain (CMSC) model.
This modelling tool gives the framework and concepts upon which the CMSC system is developed.
FUNCTION: This answers the question “what is the purpose of the system”, which can be
achieved by the structure and state variables of the CMSC. The usefulness of the model is to
support decision makers to gain insights on CMSC and take effective decisions towards mitigation
of construction material shortage on construction site, thereby minimizing project deviation in
construction project.
CONTEXT: This considers the pre-condition, post-condition, and environment where a structure
say A is operated. The environment indicates where A is operated, pre-condition describes the
condition that needs to be satisfied such that A can be operated, and the post condition refers to
the condition, as a result of the operation of A, which may affect other systems that succeed the
operation of A.
This model is applicable to the construction industry, specifically the EPC contractors and
construction material suppliers. This CMSC model was studied under step input signal, varied
parameters and variation on contractor’s orders.

25
Precondition as a form of design setting: Assumptions made affect the behaviour and function
of the structure of the design (structure). Assumptions used in the setting of the model design are
listed below:
• Assumed contractor has available storage space for quantity of material ordered.
• Assumed the supplier has capacity for the specified contractor’s demand at the beginning
of the contract, however, the capacity is subject to time.
• Assumed material, labour and capital are always available for the supplier, processing start
rate will always be equal to the desired processing start rate.
• Assumed material delivered is immediately available for construction.
• Assumed all orders are shipped immediately if the material is available in the supplier’s
inventory.
In the development of the model, it was assumed that all information shared are accurate and
timely, however, in the presence of faulty information, the model will not give result that can help
make accurate informed decisions. Unavailability of storage space with the EPC contractor will
lead to site congestion and increased inventory level, while insufficient supplier’s capacity will
lead to unavailable material for shipment. Also, if material, labour and capital are not always
available as assumed, then time delay will be encountered. When material delivered is not available
for construction immediately, then the EPC contractor’s inventory level will increase which might
lead to site congestion or increased holding cost or reduced material usage. In addition, when the
supplier does not ship out material immediately, it will lead to reduced shipment and material
delivery rate, increased inventory level, higher holding cost.
Precondition as a form of reference frame: Most time in construction industry, there is no
conspicuous external reference point to determine goals. Every project is unique, and no two
projects are the same. In this model, the desired state of the system is influenced by the real states
of the system itself and principle of the system which can then be adjusted based on experience
and external pressure (e.g. contractor’s order). The formulation responds to part of the gap between
the desired and the current state of the system. The desired inventory is based on the contractor’s
order and inventory coverage. Decision made on a corrective action is based on the gap between
the desired and real state of the system.

26
BEHAVIOUR: The behaviour is the response of the system to factors (like change in contractor’s
order, time delay) which can be observed by the interaction among the input variables and the
output variables. This interaction regularly leads to feedback which determines the complex
behaviour in the system. Stock management is often used to describe the source of behaviour.
These behaviours include but are not limited to oscillation, system stability, rapid changes, and
instability. There are two types of feedback loops and each loop’s behaviour is characterised by
the systems’ structure, and the polarity of the variables in the loop. The positive loop (reinforcing
loop) represented as “+”or “s” produces different types of behaviour such as: growth, destabilising,
accelerating while the negative loop (balancing loop) represented as “-” or “o” produces various
forms of behaviour such as counteracting, goal seeking, and stabilizing. Figure 3.2 shows typical
forms of dynamic system behavior
a. Exponential growth b. Goal-seeking
c. S-shaped d. Oscillation
Figure 3.2: Typical forms of behaviour in a dynamic system (Kirkwood, 2013)

27
From the base model (an hypothetical representation of the system’s properties and its behaviour,
which is valid across the model), the behaviour of the whole system is performing as desired i.e.
the contractor’s order rate correlated with the rate at which order are fulfilled and materials
delivered.
PRINCIPLE: It is a set of mathematical equations that explain why a system changes in relation
to the process. It is the basic law that governs the behaviour of the system and describes the relation
between the state variables and the constraints among the variables. To simulate the behaviour, the
SD uses mathematics to describe and relate model variables, that is, the stock and flow construct.
In the stock and flow construct, stock provides a form of memory which is mathematically
represented by integral while flow is the rate of change, mathematically represented by first order
differential equations which describe the function (Little’s law) and its derivative. Littles law
explains the relationship between the throughput (R, rate of flow), the capacity (I,
Inventory/WIP/Backlog) and the lead time (T, processing or waiting time). Mathematically, the
above principle is written as I=R×T.
For example, using Little’s law, the Deliver Delay at any point is the ratio of the Backlog to Order
Fulfilment Rate, i.e., Delivery Delay= Backlog/Order Fulfillment Rate.
STRUCTURE: The polarities of the link depict the structure of the system. The structure of a
CMSC refers to the sets of elements which may be at the physical level and must be related in a
meaningful and purposeful way. The structure is represented as a stock and flow diagram with
basic elements such as EPC contractor, its suppliers and their relationship on how to achieve timely
supply of construction material. This stock and flow diagram consist of stock (accumulation of
system entities), flow (rate of change), time delay and feedback. Stock is the source of dynamic
behaviour in the system, as it creates gaps and delay. To initiate correction to get rid of any
discrepancy/gap, a comparison is done between the desired and actual state of the system of the
negative feedback. The stock is reduced by outflow and increased by inflow. An example of stock
and flow diagram is seen in Figure 3.3

28
Figure 3.3 Stock and Flow Diagram
The relationship between stock and flow can be mathematically represented by
𝑑𝑠𝑡𝑜𝑐𝑘
𝑑𝑡= 𝐼𝑛𝑓𝑙𝑜𝑤𝑠(𝑡) − 𝑂𝑢𝑡𝑓𝑙𝑜𝑤𝑠(𝑡)…………………………………………………………(3.1)
Systems structure can be visualized mentally by means of causal loop diagram, with the arrows
indicating systems elements. The major concept behind this type of modelling is defining the
aspects of the system. Assigning polarity shows the characteristics of the relationship between
variable based on the directions of the change. Structures considered in this work are order
fulfilment structure, processing structure and material management structure which are discussed
in detail in section 3.4
STATE: The stock, also known as the memory of the system, collectively describes the state of
the system, and passes messages which are considered in decision making. The state depends on
the function or interested area of the system. These states are expressed as variables which change
over time. A variable can be endogenous and exogenous variable. The future state of the system
is determined by the current state and the current state is determined by the preceding state. The
states include:
Stock Variables: Order backlog, Expected Order, Work-In-Process, Supplier Inventory,
Contractor Inventory, and Expected Material Delivery.
Auxiliary Variable: Desired Order, Contractor’s Order rate, Actual delivery delay, Desired
shipment rate, Order fulfilment rate ratio, Maximum shipment rate, Desired Supplier inventory,
Supplier Inventory Discrepancy, Desired Work-In-Process, WIP discrepancy, Desired processing
Rate, Desired Processing Start Rate, Desired Material delivery rate, Contractor Inventory
Discrepancy, Maximum Material Usage Rate, Material Usage Ratio, Desired Contractor
Inventory, and Desired material usage rate.

29
Flow Variables: Processing Rate, Shipment Rate, Change in Expected Demand, Order fulfilment
Rate, Material delivery rate, Material Usage Rate, and Change in Material Delivery Rate
3.4 SD Model Development and Formulation
This work uses two-step SD method – conceptual and experimentation used in a work done by
Größler, Thun, and Milling, (2008). The FCBPSS and the Causal Loop Diagram (CLD) were used
for the conceptual modelling and to illustrate the conceptual feedback structures which provides
good understanding of the construction material supply chain (CMSC) behaviour. The Sterman
(2000) stock management structure was adopted to develop the CLD. The generalised structure of
the 2-echelon Construction Material Supply Chain (CMSC) is basically EPC contractor and their
supplier.
Table 3.1: Notation for Construction Material Supply Chain (CMSC) model
Units
Parameters
DD Target Delivery Delay Weeks
EO EPC initial Order Materials
ST Minimum Shipping Time Weeks
AT Time to Average Order Rate Weeks
AD Time to Average Delivery Rate Weeks
SS Supplier Safety Stock Inventory Coverage Weeks
ESS EPC Safety Stock Inventory Coverage Weeks
PT Processing Time Weeks
SDT Supplier Inventory Adjustment Time Weeks
EDT EPC Inventory Adjustment Time Weeks
WDT WIP Adjustment Time Weeks
MIC EPC Minimum Material Inventory
Coverage
Week

30
Stock Variables
SI Supplier Inventory Materials
EI EPC Inventory Materials
OB EPC Order Backlog Materials
EOR Expected EPC Order Rate Materials
EMD Expected Material Delivery Materials
WIP Supplier’s Work in Process Inventory Materials
Flow Variables
OR EPC Order Rate Materials/Week
PS Processing Start Rate Materials/Week
SR Supplier Shipment Rate Materials/Week
PR Processing Rate Materials/Week
CEO Change In Expected Order Materials/Week
CMD Change in Material Delivery Rate Materials/Week
MDR Material Delivery Rate Materials/Week
MUR EPC Material Usage Rate Materials/Week
OFR Order Fulfilment Rate Materials/Week
Auxiliary Variables
DSR Desired Shipment Rate Materials/Week
ADD Actual Delivery Delay Week
FR Order Fulfilment Rate Ratio
UR EPC Usage Rate Ratio
EIC EPC Inventory Coverage Week
SIC Supplier Inventory Coverage Week
MSR Supplier Maximum Shipment Rate Materials/Week
MU EPC Maximum Usage Rate Materials/Week
DSI Desired Supplier Inventory Material
DEI Desired EPC Inventory Material
SID Supplier Inventory Discrepancy Material

31
EID EPC Inventory Discrepancy Material
WD WIP Discrepancy Material
DW Desired WIP Material
DP Supplier Desired Processing Materials/Week
DUR EPC Desired Material Usage Rate Materials/Week
DDR EPC Desired Material Delivery Rate Materials/Week
3.4.1 Causal Loop Diagram (CLD) for CMSC model
Systems structure can be visualized mentally by means of Causal Loop Diagram (CLD), with the
arrow indicating systems elements. This is built on the positive and negative causal relationship
between the variables, feedback and delay. Assigning polarity shows the characteristics of the
relationship between variable based on the directions of the change. The behaviour a loop is
characterised by the systems structure the polarity of the variables in a loop. Negative feedback is
goal seeking or stabilising while the positive feedback is diverging from the equilibrium or
destabilising. The CLD serves as draft for the stock and flow diagram. Figure 3.4 shows the
construction material coordination system unit. The causal loop diagram contains positive and
negative polarities. The positive polarity (+) means variables change in the same direction while
the negative polarity (-) means that change of a variable in one direction causes the second variable
to change in the opposite direction.
The construction material supply chain has various processes in each echelon such as the order
placement, order fulfillment, inventory control, and order processing and material management.
The behaviour of these processes is discussed below:
i. Order fulfilment: The EPC contractor starts with placing an initial EPC Order (EO),
EO leads to an increase in EPC Order Rate (OR). In the absence of adequate inventory
in stock for construction, OR leads to an increase in EPC Order Backlog (OB)
(Sterman, 2000) which indicates the unfulfilled/unsatisfied orders (Venkateswaran and
Son, 2007; Wilson, 2007). An increase in OB provokes Supplier Desired Shipment Rate

32
(DSR) which refers to the supplier target delivery rate. DSR verifies that the
construction material is supplied within a specified time termed Supplier Target
Delivery Delay (DD). DD is calculated to satisfy the EPC order on time. If the Supplier
Inventory (SI) in stock is enough, the DSR leads to an increase in Supplier Shipment
Rate (SR). Therefore, SR leads to an increase in the Supplier Order Fulfilment Rate
Ratio (FR) (Kamath and Roy, 2007; Venkateswaran and Son, 2007). The moment
orders are fulfilled within FR, OB and Order Delivery Delay (ADD), the actual average
delay between the placement and the receiving of the construction material reduces
respectively. Else, OB will increase ADD. The SD equations for the order fulfilment
process are in Appendix A.
ii. Inventory control: Adequate SI in stock increases the Supplier Maximum Shipment Rate
(MSR). MSR indicated the maximum rate of shipment given the SI and the Minimum
Shipping Time (ST). ST refers to the time taken to ship construction material to the
EPC contractor. Thus, an increase in ST leads to decrease in MSR. MSR decreases SR,
since supplier cannot ship out more than MSR. In contrast, an increase in SR leads to a
decrease in SI. To avoid material shortage, it is needful to know whether the supplier
SR has enough inventory to meet EO. Supplier Inventory Coverage (SIC) refers to the
number of weeks the supplier can ship out at the current SR, given their SI level which
shows the service level of the supplier. The lesser the SIC, the higher the desired SI to
match the EO. The inventory level required to keep the desired service level of supplier
to offer high delivery performance is called Desired Supplier Inventory (DSI). EO is
estimated by the Expected EPC Order Rate (EOR) which depends on ST and the
Supplier Safety Stock (SS). An increase in EO over time leads to increase in EOR and
DSI respectively (Georgiadis, Vlachos, and Tagaras, 2006). The supplier considers
EPC Order Change In Expected Order (CEO), when adjusting the DSI. CEO refers to
the discrepancy between EOR and the OR over a time frame determined by the Time to
Average Order Rate (AT). The EO information is used to generate EOR by smoothing
the order quantity with the past duration’s anticipated order. The supplier aims to
maintain the DSI set equal to EOR (Venkateswaran and Son, 2007). DSI leads to an
increase in the Supplier Inventory Discrepancy (SID), the gap between DSI and SI.

33
Supplier Inventory Adjustment Time (SDT), the time needed to take the inventory to
the desired level, regulate SID, over a definite period. The SD equation for the
inventory control process are in Appendix A.
iii. Material management process: This begins with EO, which is to be satisfied by the
Material Delivery Rate (MDR) of the supplier. The MDR and SR are analogous. An
increase in MDR increases the EPC Inventory (EI) in stock. EPC Desired Material
Usage Rate (DUR) leads to an increase in the EPC Material Usage Rate (MUR). DMU
refers to target usage rate EPC. Therefore, MUR leads to an increase in the EPC Usage
Rate Ratio (UR). Adequate EI in stock increase the EPC Maximum Usage Rate (MU)
by increasing the usage ratio. MU refers to the maximum rate of usage given the EI and
EPC Minimum Material Inventory Coverage (MIC). MIC refers to the minimum time
required to inspect, arrange and use the material. Hence, an increase in MIC leads to a
decrease in MU. MU decreases the MUR, since EPC cannot construct more than MU.
On the other hand, an increase in MUR leads to a decrease in EI. To prevent material
shortage on construction site, it is essential to determine whether the EPC contractor
MUR has enough inventory to match with EO. EPC Material Inventory Coverage
(EIC) refers to the numbers of weeks the EPC can carry out construction at the current
MUR given EI. The lower the EIC, the more EPC contractor desires an increase in the
EI level in order to match with the EO. The inventory level needed to maintain the
desired material usage rate of the EPC to give good project performance is called
Desired EPC Inventory (DEI). MDR is estimated by the Expected Material Delivery
(EMD) and depends on the EPC Safety Stock (ESS) and ST. An increase in the EO
after a while leads to an increase in EMD and DEI respectively. The EPC considers
Change in Material Delivery Rate (CMD) when setting the DEI. CMD refers to the
discrepancy between EMD and OR over a period determined by the Time to Average
Delivery Rate (AD). The MDR information is used to generate EMD by smoothing the
construction material delivery quantity with past periods of perceived delivery. An EPC
seeks to maintain the DEI, set equal to the EMD. DEI leads to an increase in the EPC
Inventory Discrepancy (EID), the discrepancy between DEI and EI. EPC Inventory
Adjustment Time (EDT), the time required to take the inventory to the desired level,

Figure 3.4. Construction Material Coordination System Unit.

34
corrects EID, over a period. The SD equations for the material management are in
Appendix A.
iv. Order placement: As EPC Inventory Discrepancy (EID) increases, the EPC contractor
needs to place more order with the supplier which leads to order change. As Supplier
Inventory Discrepancy (SID) increases, the supplier needs to place more order with the
producer which is out of the scope this study.
v. Order processing: An increase in EOR increases the Supplier’s Desired Processing (DP).
DP leads to an increase in Processing Start Rate (PS) (Venkateswaran and Son, 2007) and
increase in PS leads to an increase in Supplier’s Work in Process Inventory (WIP)
(Georgiadis et al., 2006). WIP accumulates the difference between processing starts PS
and Processing Rate (PR). WIP Discrepancy (WD), the awaiting processing line refers to
the gap between the Desired WIP (DW) and WIP, which is adjusted by the WIP Adjustment
Time (WDT) (Sterman, 2000). WD adjust PS to keep up with WIP and SI in line with the
DW level. Processing Time (PT) reduces the DW while leading to a decrease in PR as
result of third order delay (ᵟ). The PR increases the SI level. A sufficient level of SI
decreases WD (Wilson, 2007). The lesser the WD, the lesser the DP or vice versa.
Increased SI level also leads to an increase in MSR and SR respectively. The SD equations
for the order processing are in Appendix A.
3.4.2 SD Model Development Structure and Parameters.
List of constant parameters used in this model include: Target delivery delay, Initial EPC
contractor order, Minimum shipment time, Supplier safety stock coverage, Supplier inventory
adjustment time, Time to average order rate, Time to average material delivery rate, Processing time,
WIP adjustment time, EPC contractor inventory adjustment time, EPC contractor safety stock
coverage. Table 3.2 shows the values the parameters are set to when the time is equal to zero.
Development of the SD model comes after defining the problem. This SD model consists of stock
(accumulation), flow (rate of change), time delay and feedback. To simulate the behaviour, the SD
uses mathematics to describe and relate model variables. Stock provides a form of memory which is

35
mathematically represented by integral while Flow is the rate of change, mathematically represented
by first order differential equation.
Table 3.2. Illustrative Parameter for SD model
Parameters Parameter values in CMSC model
DD (Target Delivery Delay) 1 week
EO (EPC initial Order) 5000 material
ST (Minimum Shipping Time) 1 week
AT (Time to Average Order Rate) 8 weeks
SS (Supplier Safety Stock) 2 weeks
ESS (EPC Safety Stock) 1 week
PT (Processing Time) 8 weeks
SDT (Supplier Inventory Adjustment Time) 1 week
WDT (WIP Adjustment Time) 1 week
The Vensim and AnyLogic software were used to develop and simulate the material supply model in
this work. Systems dynamics professionals attempt to step up the process by developing collections
of templates or libraries of commonly used component from Sterman’s Business Dynamics (Sterman,
2000) and Hines’ Molecules (Hines, 1997). The model in this thesis is built upon components from
Sterman’s Business Dynamics (Sterman, 2000), however, these components are generic. Therefore,
some of these components were modified into construction material supply chain (CMSC) model.
The structure of a model consists of two main components namely: the physical environment and the
decisions policy made by managers in relation to the physical environment. The CMSC model
includes supplier’s processing capacity, inventory management, order fulfillment, order placement
which contributes the fluctuation in the processing capacity, material management, and shipment and
order fulfilment. The SD equations are developed and discussed in Appendix A. In this study, we
assumed EPC contractor demand 5000 materials per week and the SD model is simulated for 52 weeks
(1 year). The SD model is simulated using AnyLogic software.

36
The CMSC model consist of three sub model which are 1) Supplier Processing, 2) Shipment and
Order Fulfilment and 3) EPC contractor Material Management. Chapter four gives the simulation
result and analyses that enhanced better understanding of the behaviour of the of the CMSC model.
1. Supplier’s Processing Model: The processing capacity is driven by the EPC contractor’s
order which eventually builds up inventory for shipment. The processing model in Figure 3.5
captures the causal relationship. It illustrates the supplier’s processing and shipping mode for
the construction material. The supplier operated under the make-to-order inventory policy and
the supplier’s processing model was built based on the generic Production Starts model from
Sterman’s Business Dynamics (2000). This model was tailored to fit the Construction Material
Supply Chain (CMSC). Firstly, the Production Start Model’s variable names were modified
to match the CMSC nomenclature, variables, constants and unit conversion were added to the
model. Secondly, the material producers (exogenous factors) were captured in processing
model as supplier Work in Process Inventory (WIP) stock. The CMSC model operates as a
pull process i.e. the EPC contractor must “pull” the material off -the-shelve after the
contractors ordered for it.
Figure 3.5. Supplier Processing Model

37
2. Supplier’s Shipment and Order Fulfilment Model: This sub model consists of supplier
inventory, order backlog and shipment, and the expected order which is a smooth function of
EPC contractor order for construction material as shown in Figure 3.6. It was developed based
on Order fulfilment model from Sterman’s Business Dynamics (2000). From the supplier’s
inventory, construction material is shipped to EPC contractor; however, in practice, this
material cannot be delivered instantly, which calls for the use of order backlogs that aggregate
the discrepancy between EPC fulfilled orders (SR) and EPC Order (EO). First order material
delay is used here because there are no capacity constraints on the normal Delivery Delay
(DD). The average delay to deliver EPC order is given by the ratio of order backlog to current
shipment rate. In the numerical study, Order Fulfilment Ratio (FR) regulates the shipment rate
(SR) from the supplier to the EPC contractor. Sterman, (2000) study was used, relating Order
Fulfilment (FR) to Maximum Shipment Rate (MSR) and Desired Shipment Rate (DSR) as
shown in the Table 3.3. The Order Fulfilment (FR) of the all the trial runs of the simulation
model were obtained through the Table 3.3.
Table 3.3. Order Fulfillment Ratio Table
MS/DSR 0.0 0.2 0.4 0.6 0.8 1.0 1.2 1.4 1.6 1.8 2.0
FR 0.0 0.2 0.4 0.58 0.73 0.85 0.93 0.97 0.99 1.0 1.0
Figure 3.7 shows the Order Fulfilment ratio as a function of MSR/DSR. For example, when
the obtained ratio is 0.8, the look up value from Table 3.3 for FR is 0.73. When shipment is
equal to desired shipment i.e. (SR=DSR), the order fulfilment ratio is equal to 1 (FR=1). The
derivation of SR is shown in Appendix A. Thus, we assume that the supplier will ship the
order if material is available and adequate in their store. They will not hold back material or
keep for forthcoming order.

38
Figure 3.6 Supplier Shipment and Order Fulfillment Model
Figure 3.7 Order Fulfillment as function of supplier’s inventory
0
0.2
0.4
0.6
0.8
1
1.2
0 0.5 1 1.5 2
Ord
er F
ulf
ilm
ent
Rat
io (
FR
)
(Dim
ensi
on
less
)
Maximum Shipment Rate/ Desired Shipment Rate
(MSR/DSR)
(Dimensionless)

39
3. EPC Contractor’s Material Management Model: This structure is like the supplier’s
inventory of processed goods. Unless there are construction materials, construction will not
start or progress, therefore, EPC contractor must have ordered enough materials to absorb any
disruption and keep the construction work going. The material delivery rate is analogous to
the shipment rate. Figure 3.8 shows the stock management structure of the material inventory.
The Material Usage Rate (MUR) is related to the Material Delivery Rate (MDR), but the real
material usage rate is the desired material usage rate when the material is adequate for
construction, else, material usage rate (construction progress) reduces as a result of material
shortage on site which in turn gradually decreases the material usage ratio. The EPC contractor
must have enough material to keep the construction going. The coverage depends on
proportion of actual rate to the desired rate which is based on the availability and sufficiency
of EPC contractor’s material inventory. Just like the Order Fulfillment Ratio, the function that
regulates it is the same for the Material Usage Ratio. Table 3.4 shows the material usage ratio
and the Figure 3.9 shows the Material Usage Ratio as a function of MUR/DMU. The desired
material usage rate is familiar to the EPC contractor’s order while the maximum usage rate is
determined on the actual contractor’s material inventory. The desired material inventory is
determined by the desired usage rate of material and the desired material inventory coverage
i.e. minimum material inventory coverage which is based on the quantity of material needed
per time. This is the period between when the material gets inspected, stocked and the time it
is required for construction.
All the production stages are shown as WIP in this work. Processing time is the average transit
time for all the materials amassed in the model. The lesser materials accumulate, the lesser the
deviation in the material cycle time and the higher the order of the delay that best describes
production.
Table 3.4. Material Usage Ratio Table
MUR/DMU 0.0 0.2 0.4 0.6 0.8 1.0 1.2 1.4 1.6 1.8 2.0
UR 0.0 0.2 0.4 0.58 0.73 0.85 0.93 0.97 0.99 1.0 1.0

40
Figure 3.8. EPC Material Management Model
Figure 3.9. Material Usage as function of EPC contractor’s inventory
0
0.2
0.4
0.6
0.8
1
1.2
0 0.5 1 1.5 2
Usa
ge
Rat
io (
UR
)
(Dim
ensi
on
less
)
Maximum Usage Rate/ Desired Usage Rate (MUR/DUR)
(Dimensionless)

41
CHAPTER 4
MODEL TESTING, RESULTS AND ANALYSIS
4.1 Model Validation
The main aim of a SD study is to explain the behaviour of the system and give alternatives to help
obtain the desired system behaviour (Saysel and Barlas, 2001). After the development of the CMSC
model, using the stock and flow diagram, model equations (nonlinear differential equations), initial
values and constants were applied to the model. Simulating a real-world problem helps provide better
insight on how to solve the problem. Systems Dynamics (SD) model requires validation of
practicability and confidence transmission for the users (decision makers, managers), even after
conformance of the model to physical laws of the system. Confidence has its root in the ability of the
model to realize results which are the same as the decision maker’s mental model while practicability
is a function of whether the model addresses the research problem, where decision makers need
support. Various tests were conducted to build confidence in the CMSC model. These included the
consistency of variable dimensions, which was tested through the AnyLogic software which reported
no dimensional consistency or error found. Then, various scenario tests were taken up to test
consistency of the CMSC model behavior and the realistic operation. One of the tests which had a
scenario of no EPC order, showed that there were no working activities i.e. processing=0, shipping
=0, material delivery=0 and material usage =0. The behaviour of the model aligns with what is
obtainable in the industry and past works on how demand variability affects performance and how
safety stock can be used to improve the performance. Instead of validating model, the model can be
run through several tests to gain confidence in it (Barlas, 1996).
Base Model: In the delay-free base model, there was no form of discrepancy between the desired
state and the actual state. This ideal state also describes the situation where there is timely and accurate
information between the supplier and the EPC contractor. This information includes inventory data,
order status tracking report, supply chain operating parameters like material lead time and time delay.

42
In this section, numerical example was considered which assumed EPC order of 5000 material per
week for a period of 52 weeks (1 year). Table 3.2 shows the parameters and the values used in the
numerical study. Accordingly, when the EPC contractor makes the material order continually from
its supplier, who then makes decisions on the safety stock level required to maintain adequate service
level. Finally, the construction material was shipped to the EPC contractor. The outcome of the delay
free scenario shows that construction material was always available in the store for shipment and
usage. The formulation of EPC order rate is robust, orders remained nonnegative no matter how large
the demand shock may be, the supply line and stock never fell below zero. The order fulfilment sector
was also tested with its response which had increased backlog. The shipment formulation allows
supplier to meet their delivery goal without capacity constraints.
4.2 Test Input Built-in
4.2.1 Introduction
Testing the CMSC model’s components i.e. the supplier’s shipment and order fulfillment sub model,
processing sub model and EPC contractor’s material management sub model, CMSC model should
give steady behavior when assessed for simple ideal scenarios with progress evolving towards the
planned goal.
To analyse the CMSC model and study its dynamic behaviour, the model was simulated under
equilibrium condition by varying the input signal level and parameters of the model. Dynamic
behaviour was generated when the system was disrupted at equilibrium. The focus of this CMSC
model is the EPC contractor’s and its suppliers’ inventories, which are major constraints to the
availability of construction material on site. Inventory level affects the supplier’s ability to ship
material to EPC contractor, thereby affecting the contractor’s desired inventory level which eventually
affects the construction rate. The model was disrupted by various levels of input signal (step function).
This facilitated the conduction of controlled experiment on the CMSC model, by observing how the
model responded to the input signal when the system was in equilibrium state. This is a state where
the discrepancy between the desired and actual state is 0 i.e. all stocks in the system, were unchanging
and the inflows and outflows were the same. This study used inventory coverage, order backlogs,
delivery delay, and material usage rate as performance metrics, which have been studied in other

43
sectors of life such as health. (Gonul Kochan et al., 2018; Bijulal et al., 2011; Bijulal and
Venkateswaran, 2008; Ovalle and Marquez, 2003).
4.2.2 Step Response Simulation
The step input is a simple test that checks the response of the system to an unpredicted permanent
change in the EPC contractor’s demand. The input test signal was also considered because it is supply
chain variability effect. The CMSC model was disturbed from equilibrium on the 6th week by EPC
contractor’s demand shock of a 10% step increase (0.1) of 5000 materials per week, which relays the
signal to the supplier who responded by increasing its ordered materials from the producer. Supplier
tries to balance order processing and production (which is out of their reach) with the EPC contractor’s
demand which results in a negative feedback. Several delays often occur while the EPC contractor
and supplier try to update orders and the producer try to update production (such as time to adjust
inventory in the production). The delayed encountered by producers is not considered in this work.
Figure 4.1 shows the response behaviour of EPC contractor’s material inventory. The expanding gap
between the desired contractor inventory and the actual inventory pushes the EPC contractor to
increase its subsequent order. Figure 4.2 shows the response behaviour of supplier’s inventory which
is a major criterion for the timely delivery of construction material to EPC contractor. Due to lack of
space, supplier plan with the EPC contractor’s demand to know which material to store or put on the
shelf. Supplier must increase its processing speed or expand its capacity, if need be, to ensure the EPC
contractor are satisfied. The expanding gap between the desired supplier inventory and the actual
inventory push the desired processing rate to accelerate above the expected EPC order rate, thereby
causing a growth in the work in process (WIP) inventory to satisfy its processing target, so the desired
processing start rate accelerates higher than the desired processing rate. At the time the EPC
contractor’s order increased, its inventory level has not yet changed and gradually fell over time unlike
the supplier’s inventory level which dropped immediately. Furthermore, these inventories’ behaviour
had effect on the EPC contractor’s material usage rate and supplier’s reliability overtime.

44
Figure 4.1. EPC contractor's Inventory behaviour to 10% EPC order increase
Figure 4.2. Supplier's Inventory behavior to 10% EPC order increase
8000
8500
9000
9500
10000
10500
11000
11500
1 3 5 7 9 11 13 15 17 19 21 23 25 27 29 31 33 35 37 39 41 43 45 47 49 51 53
Mat
eria
ls
Weeks
MaterialInventory DesiredMaterialInventory
7000
7500
8000
8500
9000
9500
10000
10500
11000
1 3 5 7 9 11 13 15 17 19 21 23 25 27 29 31 33 35 37 39 41 43 45 47 49 51 53
Mat
eria
ls
Weeks
SupplierInventory DesiredSupplierInventory

45
4.3 Model Analysis of the CMSC Model
4.3.1 Behaviour of the Supplier’s processing and shipment model
After the 0.1 step increase in EPC contractor’s demand on the 6th week, shipment rate became steady
after 25 weeks of the demand shock and the accumulated order backlog led to an increased desired
shipment rate as shown in Figure 4.3. Order backlog implies there is a delay between the EPC
contractor order release and material delivery. Such a delay may include processing time, shipment
time to construction site, decision making time and other organisational activities. When the shipment
rate falls, the delivery delay increases, and this is due to the low level of supplier’s inventory. The
simulation in Figure 4.3 tests the shipment formulation with a step increase in EPC contractor’s orders
from 5000 materials/week to 5500 materials/week, taking capacity as constant. The initial order
backlog is 5000 materials because there is normal delivery delay of 1 week. The shipment smoothly
approaches the new equilibrium of 5500 materials/week. This test showed the expected inference of
the formulation for order fulfilment.
The supplier often does not have timely information on EPC contractor’s order change. This reflects
on the supplier’s inventory: it is forced to increase the expected order rate from the EPC contractor
and work in process (WIP) when the gap between the desired and actual inventory increases. It took
the supplier 15 weeks longer than the specified 8 weeks (normal processing time) to recover from the
10% increase in change order. This is seen in Figure 4.4, where the processing start rate is higher than
the desired processing rate. The processing start gets to a peak of about 19% higher than its original
level about 4 weeks after the demand shock to quickly fill the supply line of WIP, this happened with
an amplification of 1.4. Processing rate did not exceed shipment until more than 8 weeks passed,
when the supplier’s inventory was at its lowest level as seen in Figure 4.2 and 4.5, while the processing
rate which lags the EPC contractor’s order by 8 weeks had to rise above the shipment in the 15th week
so as to consistently satisfy the EPC contractor.
As shown in Figure 4.6, the 10% step increase causes a drop in the supplier’s inventory coverage from
initial of 2 to 1.4 weeks, 10 weeks after the change in EPC contractor’s order. If the processing rate
continues at 5000 materials/week, it will affect the supplier’s timely delivery ability.

46
Figure 4.3. Supplier's shipment behaviour to 10% increase in EPC order
Figure 4.4. Supplier's Processing response to 10% increase in EPC order
5000
5100
5200
5300
5400
5500
5600
5700
5800
0 2 4 6 8 10 12 14 16 18 20 22 24 26 28 30 32 34 36 38 40 42 44 46 48 50 52
Mat
eria
l/W
eek
Weeks
EPCOrderRate DesiredShipmentRate ShipmentRate
5000
5100
5200
5300
5400
5500
5600
5700
5800
5900
6000
1 3 5 7 9 11 13 15 17 19 21 23 25 27 29 31 33 35 37 39 41 43 45 47 49 51 53
Mat
eria
l/W
eek
Weeks
EPCOrderRate ProcessingRateDesiredProcessing ExpectedOrderRateProcessingStartRate

47
Figure 4.5. Graph showing when the supplier's inventory falls
Figure 4.6. Supplier's service level to 10% increase in EPC order
5000
5100
5200
5300
5400
5500
5600
5700
5800
1 3 5 7 9 11 13 15 17 19 21 23 25 27 29 31 33 35 37 39 41 43 45 47 49 51 53
Mat
eria
ls/w
eek
Weeks
ShipmentRate ProcessingRate
1
1.1
1.2
1.3
1.4
1.5
1.6
1.7
1.8
1.9
2
1 3 5 7 9 11 13 15 17 19 21 23 25 27 29 31 33 35 37 39 41 43 45 47 49 51 53
Wee
ks
Weeks
OrderDeliveyDelay SupplierInventoryCoverage

48
4.3.2 Behaviour of the EPC contractor material management model
The SC manager keeps an eye on the supply line of materials ordered and makes orders based on the
desired delivery rate which is adjusted to keep inventory at the desired level. The desired material
inventory is determined by the desired material usage rate and the contractor’s belief about the
delivery delay for the receipt of materials i.e. expected delivery delay. A huge fall in the EPC
contractor’s inventory forces it to consequently increase its order so that the material delivery rate can
exceeds the material usage rate to keep the construction going at the desired rate. The material delivery
rate did not exceed the material usage rate until more than 9 weeks passed (16th week). Figure 4.7
shows the EPC contractor’s order rate, the material delivery rate and the material usage rate depicting
the construction rate. The construction rate stabilised 15 weeks (21st week) after the order change.
The analysis of construction materials delay during construction was proposed to focus on the risk
related to EPC contractor which is untimely delivery of material need for construction. This was done
by comparing the EPC ordering rate with the material usage rate which depends on the availability of
the material for construction. Lack of information sharing among the supply chain entities causes
bullwhip effect, distortion and amplification of customer demand which is due to the inability to
forecast correctly ( Sterman, 1989; Lee et al., 1997).
Figure 4.7. EPC contractor’s usage rate response to 10% increase in their order change
5000
5100
5200
5300
5400
5500
5600
1 3 5 7 9 11 13 15 17 19 21 23 25 27 29 31 33 35 37 39 41 43 45 47 49 51 53
Mat
eria
ls/W
eek
Weeks
EPCOrderRate MaterialDeliveryRate MaterialUsageRate

49
This simulation explains some basic supply chain behaviour such as amplification, phase lag, and fall
in inventory level in response to unpredicted increase in EPC contractor’s order. The presence of
processing and shipment delays generated amplification and phase lag. Due to fluctuation in material
demand of the EPC contractor, supplier may have surplus or too little inventory depending on the
management policies which affects its delivery reliability.
The model testing is carried out by using the sensitivity analysis (single variable and multi variable)
as discussed in section 4.4 below and intervention analysis which is discussed in section 4.5.
4.4 CMSC Model Sensitivity (What-If) Analysis
Sensitivity analysis is a “what-if” analysis that gives insight into outcomes of decisions given a certain
range of variables. This will help us know how changes in one variable influence the chain reaction
and the understanding the chain reaction will help decision makers make effective policy or decision.
The what-if analysis helps us understand the impact a range of variable has on the system.
In this section, I investigated selected parameters and examined their impact level on the model results
through sensitivity analysis. The sensitivity analysis of the model parameters will reveal the influence
of the parameters in the CMSC model. Parameters such as processing time, shipping time, safety
stock coverage are studied in this work. These test variables were selected because of the influence
of flow rate and material availability in the store. The simulation timeframe is 52 weeks (one year).
By varying the values of the chosen parameters, the changes on the model outputs was examined and
the impact levels was determined from the changed parameters. These results variables are plotted
into graphs to explain the changes.
Several simulations were carried out and studied by varying one parameter at a time or two at the
same time. Varying the EPC contractor’s order with increment of 20%, 40%, 60%, 80%, 100% of the
initial order, this section explains the behaviour of the CMSC model entities in terms of order backlog,
delivery delay, inventory coverage and material usage rate.
After the sensitivity analysis, several interventions were carried out based on the observed results.
Comparing the results from the interventions can be tailored into likely intervention policy for
construction industry and its suppliers.

50
4.4.1 Single Variable Sensitivity Analysis
The section below studied the effects of different step input heights on the CMSC model, illustrating
the unpredicted change order that happens in the construction industry. By varying the EPC
contractor’s order with increment of 20%, 40%, 60%, 80%, and 100% of the initial order. This
analysis studied the effects of one test variable at a time on the system performance, which is also
used as basis for the multi variable sensitivity analysis. The EPC contractor’s order change has
different impacts on order backlog, delivery delay, inventory coverage, and material usage
(construction progress)
4.4.1.1. Behaviour of the CMSC model to EPC contractor order change
As the EPC contractor’s order varies, the supplier experiences fall in its inventory level with reduction
in supplier’s inventory coverage while EPC contractor encounters instability in the construction
progress. The supplier will eventually get a point where it will not be able to deliver material due to
inventory level drop, which translate to unavailability of materials for the EPC contractor to use. So,
there is need for collaboration to be emphasized to enable healthy supply chain network. Figures 4.8-
4.17 show the response of the CMSC model to different step increase in EPC contractor’s order.
Figures 4.8 a and 4.8b show the response of material delivery and supplier’s service level to 10%
increase in EPC order. The effects of the change order on order backlog, delivery delay, inventory
coverage, and material usage (construction progress) were also studied.

51
Figure 4.8a. Effect of 10% increase in EPC order on supplier's service level: material delivery rate
Figure 4.8b. Effect of 10% increase in EPC order on EPC and supplier's inventory coverage.
5000
5100
5200
5300
5400
5500
5600
1 3 5 7 9 11 13 15 17 19 21 23 25 27 29 31 33 35 37 39 41 43 45 47 49 51 53
Mat
eria
ls/W
eek
Weeks
EPCOrderRate MaterialDeliveryRate
1
1.1
1.2
1.3
1.4
1.5
1.6
1.7
1.8
1.9
2
1 3 5 7 9 11 13 15 17 19 21 23 25 27 29 31 33 35 37 39 41 43 45 47 49 51 53
Inven
tory
Cover
age
(Wee
ks)
Weeks
EPCInventoryCoverage SupplierInventoryCoverage

52
The effects of the change order on order backlog, delivery delay, inventory coverage and material
usage (construction progress) were studied by varying the EPC contractor’s order with increment of
20%, 40%, 60%, 80%, and 100% of initial order.
(1) Order backlog effect and delivery delay: Order backlog accumulated, and delivery delay
rose with increase in EPC order change as seen in Figure 4.9a and Figure 4.9b respectively.
Figure 4.9a. Resultants Order backlogs to sudden material order increment
Figure 4.9b. Material Delivery Delay as a result of sudden material order increment
5000
10000
15000
20000
25000
30000
35000
40000
45000
0 2 4 6 8 10 12 14 16 18 20 22 24 26 28 30 32 34 36 38 40 42 44 46 48 50 52
Ord
er B
acklo
gs
(Mat
eria
ls)
Weeks
OrderBacklog0.2 OrderBacklog 0.4 OrderBacklog 0.6
OrderBacklog 0.8 OrderBacklog 1.0
1
1.5
2
2.5
3
3.5
4
4.5
5
0 2 4 6 8 10 12 14 16 18 20 22 24 26 28 30 32 34 36 38 40 42 44 46 48 50 52
Del
iver
y D
elay
(W
eeks)
Weeks
OrderDeliveyDelay0.2 OrderDeliveyDelay 0.4 OrderDeliveyDelay 0.6
OrderDeliveyDelay 0.8 OrderDeliveyDelay 1.0

53
(2) Supplier’s Inventory Coverage: The inventory coverage expressed in weeks shows the
service level of the supplier. As the inventory level of the supplier fall, it reduces its ability to ship
materials to the EPC contractor thereby leading to reduced reliability level as revealed in the Figure
4.10. Availability of material in the inventory will help the supplier maintain and increase its delivery
reliability.
Figure 4.10. EPC change order on supplier's service level
(3) Material Usage rate (construction progress): The EPC firm can not maintain or increase its
construction rate unless material is available in its store i.e. the material must have been delivered by
the supplier on the construction site. Figures 4.11 a – e show the construction progress of the EPC
contractor by comparing the actual material usage rate (dependent on material availability) to the its
order rate which is needed to accomplish its target construction progress. It is observed that the
construction progress experiences more instability as the order change increase. With a 10% increase
in the EPC order, the construction rate stabilized 15 weeks after the order change i.e. the EPC firm
experiences instability in the construction progress as the order change increases. Figure 11f shows
the disruption the EPC firm encountered in respect to the construction rate which was caused by order
changes in the absence of materials for construction.
1
1.1
1.2
1.3
1.4
1.5
1.6
1.7
1.8
1.9
2
0 2 4 6 8 10 12 14 16 18 20 22 24 26 28 30 32 34 36 38 40 42 44 46 48 50 52
Wee
ks
Weeks
SupplierInventoryCoverage 0.2 SupplierInventoryCoverage 0.4SupplierInventoryCoverage 0.6 SupplierInventoryCoverage 0.8SupplierInventoryCoverage 1.0

54
Figure 4.11a. Construction rate in response to 20% increase in material order
Figure 4.11b. Construction rate in response to 40% increase in material order
5000
5100
5200
5300
5400
5500
5600
5700
5800
5900
6000
1 3 5 7 9 11 13 15 17 19 21 23 25 27 29 31 33 35 37 39 41 43 45 47 49 51 53
Mat
eria
ls/W
eek
Weeks
EPCOrderRate MaterialUsageRate 0.2
5000
5200
5400
5600
5800
6000
6200
6400
6600
6800
7000
1 3 5 7 9 11 13 15 17 19 21 23 25 27 29 31 33 35 37 39 41 43 45 47 49 51 53
Mat
eria
ls/W
eek
Weeks
EPCOrderRate MaterialUsageRate 0.4

55
Figure 4.11c. Construction rate in response to 60% increase in material order
Figure 4.11d. Construction rate in response to 80% increase in material order
5000
5500
6000
6500
7000
7500
8000
1 3 5 7 9 11 13 15 17 19 21 23 25 27 29 31 33 35 37 39 41 43 45 47 49 51 53
Mat
eria
ls/w
eek
Weeks
EPCOrderRate MaterialUsageRate 0.6
5000
5500
6000
6500
7000
7500
8000
8500
9000
1 3 5 7 9 11 13 15 17 19 21 23 25 27 29 31 33 35 37 39 41 43 45 47 49 51 53
Mat
eria
ls/W
eek
Weeks
EPCOrderRate MaterialUsageRate 0.8

56
Figure 4.11e. Construction rate in response to 100% increase in material order
Figure 4.11f. Construction rate behaviour to different material order increment
5000
5500
6000
6500
7000
7500
8000
8500
9000
9500
10000
1 3 5 7 9 11 13 15 17 19 21 23 25 27 29 31 33 35 37 39 41 43 45 47 49 51 53
Mat
eria
ls/W
eek
Weeks
EPCOrderRate MaterialUsageRate 1.0
5000
6000
7000
8000
9000
10000
0 2 4 6 8 10 12 14 16 18 20 22 24 26 28 30 32 34 36 38 40 42 44 46 48 50 52
Mat
eria
ls/W
eek
Weeks
MaterialUsageRate 0.2 MaterialUsageRate 0.4 MaterialUsageRate 0.6
MaterialUsageRate 0.8 MaterialUsageRate 1.0

57
4.4.2 Multi Variable Sensitivity Analysis: Time Response Simulation with EPC Order Change
Exploring the responses of different delays to step input and fluctuations helped developed another
insight for the model’s behaviour. Delay input are endogenous part of the feedback structure.
Feedback occurs when there is change in decisions on the state of the system, which in turn changes
the information and condition that control the prospective decision.
Time delay usually occurs between the times when an order is placed to when the materials are
delivered to the construction site. The delivery inefficiency of the supplier can sometimes be traced
to the EPC contractor’s demand fluctuation and the supplier, being unaware of the unpredicted EPC
contractor’s change make its decision on only the number of units ordered per period (Ovalle and
Marquez, 2003; Bhakoo, Singh, and Sohal, 2012; Kelle, Woosley, and Schneider, 2012). This lack of
communication on order change and time delays show the non-collaborative attitude of the entities in
the CMSC. This analysis helped in understanding how different delays respond to variation in the
delay time. The CMSC model cycle time consists of processing time and shipping time.
4.4.2.1 Shipping Time Analysis
This analysis studied the effect of delayed shipping time on the supplier’s service level and
construction progress in the presence of 10% increase in EPC order. It was observed that when there
is shipping time delay, the supplier’s inventory level increases as shown in Figure 4.12a and the
construction progress is hindered due to unavailability of materials on the site which leads to reduction
in the rate of construction as shown in Figure 4.12b. The construction rate experience instability in
the presence of material usage reduction and time lag. There might be a need to use premium freight
to expedite the delivery of material to the construction site for the EPC firm to meet its target
construction progress. This is a decision that needs to be taken by the EPC contractor and the cost
allocation depends on the contract among the entities in the supply chain and the party responsible for
the shipping time delay. It is recommended that the firms calculate the delivery time from when the
material leave the supplier not when the order was placed.

58
Figure 4.12a. Response of supplier's inventory coverage to shipment time delay
Figure 4.12b. Construction rate due to shipment time delay
1
2
3
4
5
6
7
0 2 4 6 8 10 12 14 16 18 20 22 24 26 28 30 32 34 36 38 40 42 44 46 48 50 52
Suppli
er I
nven
tory
Cover
age
(Wee
ks)
Weeks
SupplierInventoryCoverage with 1 week shipment time delay SupplierInventoryCoverage with 2 weeks shipment time delay
SupplierInventoryCoverage with 3 weeks shipment time delay SupplierInventoryCoverage with 4 weeks shipment time delay
SupplierInventoryCoverage with 5 weeks shipment time delay SupplierInventoryCoverage with no delay
3000
3500
4000
4500
5000
5500
6000
0 2 4 6 8 10 12 14 16 18 20 22 24 26 28 30 32 34 36 38 40 42 44 46 48 50 52
Mat
eria
l U
sage
Rat
e (M
ater
ials
/Wee
k)
Weeks
MaterialUsageRate with 1 week shipment time delay MaterialUsageRate with 2 weeks shipment time delayMaterialUsageRate with 3 weeks shipment time delay MaterialUsageRate with 4 weeks shipment time delayMaterialUsageRate with 5 weeks shipment time delay MaterialUsageRate with no delay

59
4.4.2.2 Supplier’s Processing Time Analysis
The order processing time is the time taken by the supplier to get the material from the producer and
make them available for shipping out to the EPC contractor. Long order delay contributes to shortage
of materials in the supplier’s store (reduced inventory coverage) and in turn make construction
materials unavailable to the EPC firm leading to lag in construction progress as shown in Figure 4.13a
and Figure 4.13b respectively. Figure 4.13c is a close view of the construction progress response.
Figure 4.13a shows a continuous one-week delay in the processing time which causes drop in the
supplier’s inventory coverage overtime, reducing the supplier’s reliability level with every one-week
delay. The supplier’s processing model incorporates a base inventory coverage to help protect the
supplier’s reputation. Figure 4.13c shows the impact of a continuous one-week processing delay on
the construction progress. The construction rate experiences instability in the presence of material
usage reduction and time lag. With one-week delay in processing time, it took the EPC firms 10 weeks
after the order change to stabilise back to the desired construction rate. It has been studied that late
delivery of materials affect supply chain performance which can be improved by effective inventory
management practice (Yu, 2011; Fullerton, McWatters, and Fawson, 2003) and safety stock keeping
(Buzacott and Shanthikumar, 2008).
Figure 4.13a. Supplier's service level response to process time delay
1
1.2
1.4
1.6
1.8
2
0 2 4 6 8 10 12 14 16 18 20 22 24 26 28 30 32 34 36 38 40 42 44 46 48 50 52
Suppli
er I
nven
tory
Cover
age
(Wee
ks)
Weeks
SupplierInventoryCoverage with 1 week process time delay SupplierInventoryCoverage with 2 weeks process time delay
SupplierInventoryCoverage with 3 weeks process time delay SupplierInventoryCoverage with 4 weeks process time delay
SupplierInventoryCoverage with 5 weeks process time delay SupplierInventoryCoverage with no delay

60
Figure 4.13b. Construction rate response to process time delay
Figure 4.13c. Closer view of construction rate response to process time delay
5000
5050
5100
5150
5200
5250
5300
5350
5400
5450
5500
1 3 5 7 9 11 13 15 17 19 21 23 25 27 29 31 33 35 37 39 41 43 45 47 49 51 53
Mat
eria
l U
sage
Rat
e (M
ater
ial/
Wee
k)
Weeks
MaterialUsageRate with 1 week process time delay MaterialUsageRate with 2 weeks process time delay
MaterialUsageRate with 3 weeks process time delay MaterialUsageRate with 4 weeks process time delay
MaterialUsageRate with 5 weeks process time delay MaterialUsageRate with no delay
5475
5480
5485
5490
5495
5500
1 3 5 7 9 11 13 15 17 19 21 23 25 27 29 31 33 35 37 39 41 43 45 47 49 51 53
Mat
eria
l U
sage
Rat
e (M
ater
ial/
Wee
k)
WeeksMaterialUsageRate with 1 week process time delay MaterialUsageRate with 2 weeks process time delay
MaterialUsageRate with 3 weeks process time delay MaterialUsageRate with 4 weeks process time delay
MaterialUsageRate with 5 weeks process time delay Material usage rate with no delay

61
In conclusion, the shipping time delay has more effect on the construction progress than the processing
time delay, whereas, the processing time has more impact on the inventory coverage of the supplier.
This is because the supplier can always get materials from another producer, as these off-the-shelf
materials are easily obtained from the market compared to equipment with high lead time. When the
materials are being shipped to the EPC contractor, the EPC contractor will have to wait until the
materials are delivered. Supplier will be ready to go out of its way to ensure customer satisfaction and
maintain its reputation.
4.5 Intervention Using Safety Stock
4.5.1 Introduction
After the sensitivity analysis, the effect of safety stock intervention was examined based on the
observed results in section 4.4. This intervention analysis agrees with previous studies done on the
effect of safety stock on demand variation. Comparing the results from the interventions can be
tailored into likely intervention policy for construction industry. This section gives the relation
between safety stock and material shortage by studying the output of safety stock intervention on the
service level of the EPC firm and its supplier. Supplier is often under pressure to provide high service
level to EPC contractor while operating productively with low inventory level. Supply chains are
exposed to so many risk such as demand uncertainty, supply uncertainty, lead time uncertainty, supply
cost uncertainty, supply capacity uncertainty, and natural and man made disaster (Tang, 2006), and
various strategies were used to mitigate them. Such strategies include but are not limited to
incorporation of safety stock and safety time (Buzacott and Shanthikumar, 2008).
A safety stock should not be set to zero as it will not only reduce the inventory level but the service
level which will cost much more than the cost of the extra inventory. Putting a safety stock is the
decision of the supplier to satisfy the EPC contractor in the presence of unpredicted changes. For
firms to have adequate inventory as buffer against sudden variation in demand or production, they
keep a certain coverage of expected demand. Therefore, for high level of supplier’s service, their
desired inventory coverage will include firstly, adequate inventory coverage to ship at the supposed
rate which needs a base coverage level equal to the minimum shipment time. Secondly, it must keep

62
supplementary safety stocks. Thus, their desired inventory includes base coverage level i.e. minimum
material coverage and the additional safety stock.
4.5.2 Behaviour of the inventories to supplier’s safety stock inventory coverage
Inventory coverage is the number of weeks the firms keep inventory to enable delivery reliability or
performance reliability (regarding material availability). These are inventory policies/ decisions taken
by the management of firm which depends on the holding cost of the construction materials, but then
who takes up the holding cost? The factors which affect the inventory coverage includes finances,
lead time, management and external factor (e.g. economic downturn). Supplier often increases its
inventory coverage to buffer against fluctuations in EPC contractor’s demand, in addition, safety stock
reduces logistic cost. In determining inventory coverage, the processing and shipping time are
essential to sustain reputation, but the safety stock is optional because of the additional cost attached
to it. On the other hand, EPC contractor considers the periodic use of the construction materials. The
supplier’s processing depends on the location of the producer, the farther the location, the longer the
waiting time (processing time), and the stock level adjustment will be done accordingly. The success
of the EPC contractor depends on reliable suppliers. The question to be answered in this section is,
does the intervention enhance the stability and help meet the target goal of the CMSC system, in the
face of sudden order change?
4.5.3 Response of the CMSC model to sudden EPC order change with different safety stock
(SS) level.
The effects of the various safety stock level (i.e. SS2, SS3, SS4, SS5) on order backlog, delivery
delay, inventory coverage and material usage (construction progress) were also studied in the presence
of the EPC order change (increment of 20%, 40%, 60%, 80%, 100% of initial order).
(1) Order backlog and delivery delay response to sudden EPC order change with different
safety stock level: Figures 4.14a to Figure 4.14e show the how the order accumulated as a result of
order increase and the effect of safety stock (SS) on the accumulation. To reduce the order backlog,

63
it is recommended that the supplier increases its safety stock level with increase in order change.
Figures 4.15a to Figure 4.15e show the effects of safety stock on the material delivery delay which is
the same with the order backlog described above. Order backlog will not reduce if the materials
ordered are not delivered to the EPC contractor, thus, the material delivery delay causes order backlog.
Therefore, the supplier needs to keep different level of safety stock to absorb the different
unanticipated increase in the EPC order, to reduce the backlog of order and material delivery.
Figure 4.14a. Order backlog response to different safety stock level under 20% EPC order increase
5000
5500
6000
6500
7000
7500
0 2 4 6 8 10 12 14 16 18 20 22 24 26 28 30 32 34 36 38 40 42 44 46 48 50 52
Ord
er B
acklo
g (
Mat
eria
l)
Weeks
OrderBacklog0.2 without SS OrderBacklog with SS2OrderBacklog with SS3 OrderBacklog with SS4OrderBacklog with SS5

64
Figure 4.14b. Order backlog response to different safety stock level under 40% EPC order increase
Figure 4.14c. Order backlog response to different safety stock level under 60% EPC order increase
5000
6000
7000
8000
9000
10000
11000
12000
13000
14000
15000
0 2 4 6 8 10 12 14 16 18 20 22 24 26 28 30 32 34 36 38 40 42 44 46 48 50 52
Ord
er B
acklo
gs
(Mat
eria
ls)
Weeks
OrderBacklog 0.4 without SS OrderBacklog with SS2 OrderBacklog with SS3
OrderBacklog with SS4 OrderBacklog with SS5
5000
7000
9000
11000
13000
15000
17000
19000
21000
23000
25000
0 2 4 6 8 10 12 14 16 18 20 22 24 26 28 30 32 34 36 38 40 42 44 46 48 50 52
Ord
e B
acklo
gs
(Mat
eria
ls)
Weeks
OrderBacklog 0.6 without SS OrderBacklog with SS2 OrderBacklog with SS3
OrderBacklog with SS4 OrderBacklog with SS5

65
Figure 4.14d. Order backlog response to different safety stock level under 80% EPC order increase
Figure 4.14e. Order backlog response to different safety stock level under 100% EPC order increase
5000
10000
15000
20000
25000
30000
35000
0 2 4 6 8 10 12 14 16 18 20 22 24 26 28 30 32 34 36 38 40 42 44 46 48 50 52
Ord
er B
acklo
gs
(Mat
eria
ls)
Weeks
OrderBacklog 0.8 without SS OrderBacklog with SS2 OrderBacklog with SS3OrderBacklog with SS4 OrderBacklog with SS5
5000
10000
15000
20000
25000
30000
35000
40000
45000
0 2 4 6 8 10 12 14 16 18 20 22 24 26 28 30 32 34 36 38 40 42 44 46 48 50 52
Ord
er B
acklo
g (
Mat
eria
ls)
Weeks
OrderBacklog 1.0 without SS OrderBacklog with SS2 OrderBacklog with SS3
OrderBacklog with SS4 OrderBacklog with SS5

66
Figure 4.15a. Order delivery response to different safety stock level under 20% EPC order increase
Figure 4.15b. Order delivery response to different safety stock level under 40% EPC order increase
1
1.05
1.1
1.15
1.2
1.25
1.3
0 2 4 6 8 10 12 14 16 18 20 22 24 26 28 30 32 34 36 38 40 42 44 46 48 50 52
Del
iver
y D
elay
(W
eeks)
Weeks
OrderDeliveyDelay 0.2 without SS OrderDeliveyDelay with SS2OrderDeliveyDelay with SS3 OrderDeliveyDelay with SS4OrderDeliveyDelay with SS5
1
1.2
1.4
1.6
1.8
2
2.2
0 2 4 6 8 10 12 14 16 18 20 22 24 26 28 30 32 34 36 38 40 42 44 46 48 50 52
Del
iver
y D
elay
(W
eeks)
Weeks
OrderDeliveyDelay 0.4 without SS OrderDeliveyDelay with SS2OrderDeliveyDelay with SS3 OrderDeliveyDelay with SS4OrderDeliveyDelay with SS5

67
Figure 4.15c. Order delivery response to different safety stock level under 60% EPC order increase
Figure 4.15d. Order delivery response to different safety stock level under 80% EPC order increase
1
1.5
2
2.5
3
3.5
0 2 4 6 8 10 12 14 16 18 20 22 24 26 28 30 32 34 36 38 40 42 44 46 48 50 52
Del
iver
y D
elay
(W
eeks)
Weeks
OrderDeliveyDelay 0.6 without SS OrderDeliveyDelay with SS2OrderDeliveyDelay with SS3 OrderDeliveyDelay with SS4OrderDeliveyDelay with SS5
1
1.5
2
2.5
3
3.5
4
0 2 4 6 8 10 12 14 16 18 20 22 24 26 28 30 32 34 36 38 40 42 44 46 48 50 52
Mat
eria
l D
eliv
ery D
elay
( W
eeks)
Weeks
OrderDeliveyDelay 0.8 without SS OrderDeliveyDelay with SS2OrderDeliveyDelay with SS3 OrderDeliveyDelay with SS4OrderDeliveyDelay with SS5

68
Figure 4.15e. Order delivery response to different safety stock level under 100% EPC order increase
(2) Material usage rate response to sudden EPC order change with different safety stock
level: From Figures 4.16 a to 4.16e show that for the EPC contractor to keep construction rate going
at the desired rate in the absence of time delay, it is recommended that the supplier increases its safety
stock level with increase in order change. This shows that the supplier needs to keep high level of
safety stock to absorb the unanticipated increase in the EPC order, to keep its reputation and help its
contractor achieve their project goal.
1
1.5
2
2.5
3
3.5
4
4.5
5
0 2 4 6 8 10 12 14 16 18 20 22 24 26 28 30 32 34 36 38 40 42 44 46 48 50 52
Ord
er D
eliv
ery D
elay
(W
eeks)
Weeks
OrderDeliveyDelay 1.0 without SS OrderDeliveyDelay with SS2OrderDeliveyDelay with SS3 OrderDeliveyDelay with SS4OrderDeliveyDelay with SS5
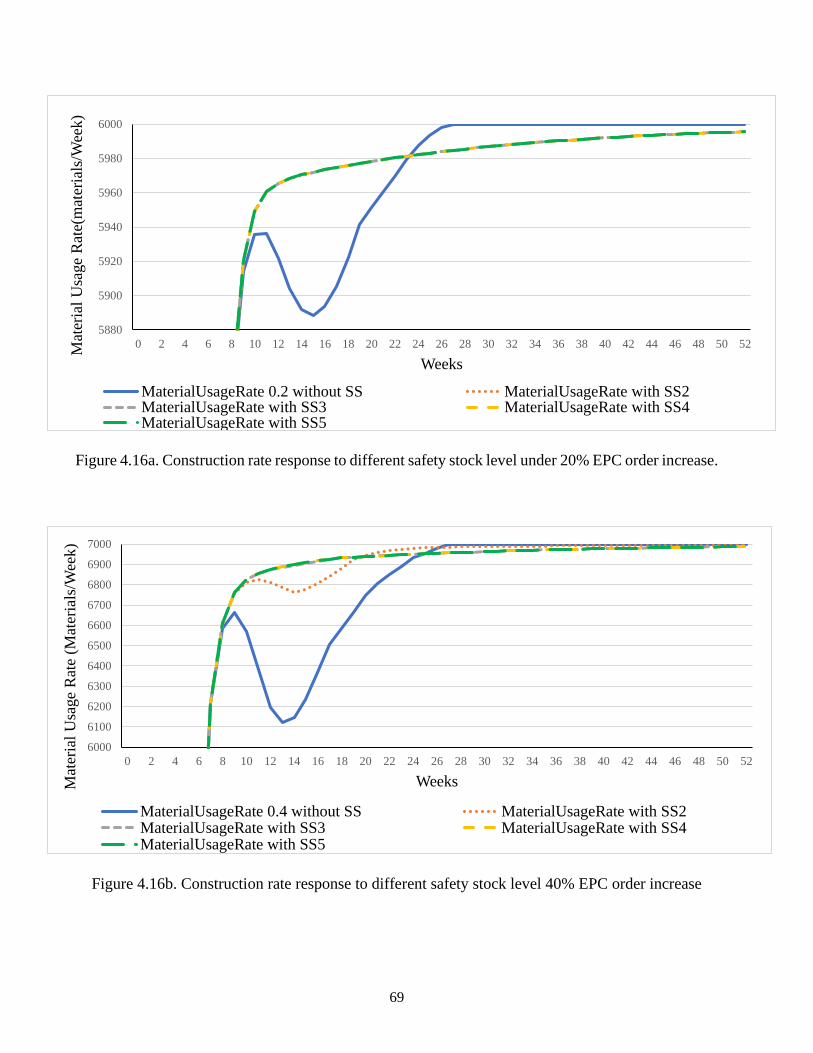
69
Figure 4.16a. Construction rate response to different safety stock level under 20% EPC order increase.
Figure 4.16b. Construction rate response to different safety stock level 40% EPC order increase
5880
5900
5920
5940
5960
5980
6000
0 2 4 6 8 10 12 14 16 18 20 22 24 26 28 30 32 34 36 38 40 42 44 46 48 50 52
Mat
eria
l U
sage
Rat
e(m
ater
ials
/Wee
k)
Weeks
MaterialUsageRate 0.2 without SS MaterialUsageRate with SS2MaterialUsageRate with SS3 MaterialUsageRate with SS4MaterialUsageRate with SS5
6000
6100
6200
6300
6400
6500
6600
6700
6800
6900
7000
0 2 4 6 8 10 12 14 16 18 20 22 24 26 28 30 32 34 36 38 40 42 44 46 48 50 52
Mat
eria
l U
sage
Rat
e (M
ater
ials
/Wee
k)
Weeks
MaterialUsageRate 0.4 without SS MaterialUsageRate with SS2MaterialUsageRate with SS3 MaterialUsageRate with SS4MaterialUsageRate with SS5

70
Figure 4.16c. Construction rate response to different safety stock level under 60% EPC order increase
Figure 4.16d. Construction rate response to different safety stock level under 80% EPC order increase
6000
6200
6400
6600
6800
7000
7200
7400
7600
7800
8000
0 2 4 6 8 10 12 14 16 18 20 22 24 26 28 30 32 34 36 38 40 42 44 46 48 50 52
Mat
eria
l U
sage
Rat
e(m
ater
ials
/Wee
k)
Weeks
MaterialUsageRate 0.6 without SS MaterialUsageRate with SS2MaterialUsageRate with SS3 MaterialUsageRate with SS4MaterialUsageRate with SS5
5000
5500
6000
6500
7000
7500
8000
8500
9000
0 2 4 6 8 10 12 14 16 18 20 22 24 26 28 30 32 34 36 38 40 42 44 46 48 50 52
Mat
eria
l U
sage
Rat
e (M
ater
ials
/Wee
ks)
Weeks
MaterialUsageRate 0.8 without SS MaterialUsageRate with SS2MaterialUsageRate with SS3 MaterialUsageRate with SS4MaterialUsageRate with SS5

71
Figure 4.16e. Construction rate response to different safety stock level under 100% EPC order
increase
(3) Supplier’s Service level: Supplier’s inventory coverage refers to the numbers of weeks a firm
can ship at the current rate considering its present invent. Figures 4.17a to 4.17e show that for supplier
to maintain satisfactory delivery reliability level, it is recommended that the supplier increases its
safety stock level with increase in order change. For the supplier to maintain a satisfactory service
level and keep its reputation, there is need to keep adequate safety stock to minimize the undesired
effect of the unanticipated increase in the EPC order.
5000
5500
6000
6500
7000
7500
8000
8500
9000
9500
10000
0 2 4 6 8 10 12 14 16 18 20 22 24 26 28 30 32 34 36 38 40 42 44 46 48 50 52Mat
eria
l U
sage
Rat
e (M
ater
ials
/Wee
k)
Weeks
MaterialUsageRate 1.0 without SS MaterialUsageRate with SS2MaterialUsageRate with SS3 MaterialUsageRate with SS4MaterialUsageRate with SS5

72
Figure 4.17a. Supplier’s service level response to different safety stock level 20% EPC order increase
Figure 4.17b. Supplier’s service level response to different safety stock level 40% EPC order increase
1
1.5
2
2.5
3
3.5
4
4.5
5
5.5
6
0 2 4 6 8 10 12 14 16 18 20 22 24 26 28 30 32 34 36 38 40 42 44 46 48 50 52
Suppli
er I
nven
tory
Cover
age
(Wee
ks)
Weeks
SupplierInventoryCoverage 0.2 without SS SupplierInventoryCoverage with SS 2SupplierInventoryCoverage with SS3 SupplierInventoryCoverage with SS4SupplierInventoryCoverage with SS5
1
1.5
2
2.5
3
3.5
4
4.5
5
5.5
6
0 1 2 3 4 5 6 7 8 9 10 11 12 13 14 15 16 17 18 19 20 21 22 23 24 25 26 27 28 29 30 31 32 33 34 35 36 37 38 39 40 41 42 43 44 45 46 47 48 49 50 51 52
Suppli
er I
nven
tory
Cover
age
(Wee
ks)
Weeks
SupplierInventoryCoverage 0.4 without SS SupplierInventoryCoverage with SS2SupplierInventoryCoverage with SS3 SupplierInventoryCoverage with SS4SupplierInventoryCoverage with SS4

73
Figure 4.17c. Supplier’s service level response to different safety stock level 60% EPC order increase
Figure 4.17d. Supplier’s service level response to different safety stock level 80% EPC order increase
1
1.5
2
2.5
3
3.5
4
4.5
5
5.5
6
0 2 4 6 8 10 12 14 16 18 20 22 24 26 28 30 32 34 36 38 40 42 44 46 48 50 52
Suppli
er I
nven
tory
Cover
age
(Wee
ks)
Weeks
SupplierInventoryCoverage 0.6 without SS SupplierInventoryCoverage with SS2
SupplierInventoryCoverage with SS3 SupplierInventoryCoverage with SS4
SupplierInventoryCoverage with SS5
1
1.5
2
2.5
3
3.5
4
4.5
5
5.5
6
0 2 4 6 8 10 12 14 16 18 20 22 24 26 28 30 32 34 36 38 40 42 44 46 48 50 52
Suppli
er I
nven
tory
Cover
age
(Wee
ks)
Weeks
SupplierInventoryCoverage 0.8 without SS SupplierInventoryCoverage with SS2SupplierInventoryCoverage with SS3 SupplierInventoryCoverage with SS4SupplierInventoryCoverage with SS5

74
Figure 4.17e. Supplier’s service level to different safety stock level under 100% EPC order increase
From the intervention analysis, it is observed that for adequate service level fulfilment, increase in
safety stock is needed to cover the order change increase, to mitigate material shortage. This aligns
with a work done on how buffer size depends on variability by Korponai, Tóth, and Illés, (2017).
This shows that the supplier needs to keep high level of safety stock to absorb the unanticipated
increase in the EPC order, so as keep its reputation and help its EPC contractor achieve its project
goal. Comparing the results from various levels of interventions, decision makers will be able to
understand better how safety stock can mitigate in the effect of order change and use them to make
necessary adjustments to policy in the construction industry.
Also, an understanding of the holding cost incurred by the supplier on large safety stock to satisfy its
customers, will make the EPC contractor see reasons why it needs to give timely and adequate
information to the supplier so that it can help meet EPC target construction rate to finish the project
on time and avoid cost overrun. Safety stock is to help improve performance but excess of it leads to
wastage and impedes performance. This conclusion agrees to how the keeping of safety stock can
improve performance by Horman and Thomas (2005).
1
1.5
2
2.5
3
3.5
4
4.5
5
5.5
6
0 2 4 6 8 10 12 14 16 18 20 22 24 26 28 30 32 34 36 38 40 42 44 46 48 50 52
Suppli
er I
nven
tory
Cover
age
(Wee
ks)
Weeks
SupplierInventoryCoverage 1.0 without SS SupplierInventoryCoverage with SS2
SupplierInventoryCoverage with SS3 SupplierInventoryCoverage with SS4
SupplierInventoryCoverage with SS5

75
4.6 Discussion
It has been established that the project success of the EPC firm is dependent on the supplier’s delivery
performance. In addition, the decision taken by the EPC firm on material quantity ordered per period
has effect on the supplier and the EPC firm itself. Complex supply system cannot be managed by just
one member of the supply network (Choi, Dooley, and Rungtusanatham, 2001).Previous work has
shown that order change is inevitable in construction industry and therefore there is need for members
of construction material supply chain to have insight into the behaviour of the system, how the order
change affects the performance of the system and how performance can be enhanced. Studies have
shown that supply chain can be improved by promoting collaboration and communication among
entities in a supply network. Long term relationship and commitment between supply chains entities
will help improve the service level of supplier and EPC contractor. It is easier for supplier to deliver
on time and in right quantity when order is certain and steady. Timely material demand information
from the EPC firm will help the supplier plan its material processing schedule to ensure it is able to
fulfil order when it comes. With effective information sharing, EPC firm can mitigate project
disruption. The information that must be shared in the material supply system are inventory
management decisions, delivery delay, lead time, shipment, and contractor’s orders. Factors to be
considered for optimum performance include timely and accurate information sharing, working
closely with supplier to overcome challenges, arranging preference based on effect of material
shortage on performance, and backup plan to accommodate contingencies. EPC firm should avoid
order change in short notice, being uninformed on the impact of its decisions on itself and other
entities in the network, not paying suppliers on time, to enhance supplier relationship and improve
performance.
The results shown in chapter four are useful for EPC firm and its supplier. The EPC firms, whose
performance is tied to delivery performance of the supplier to make the construction materials
available, can use safety lead time or premium freight to expedite instead of safety stock because the
construction site is a temporary storage room and there is not so much space often times on the
construction site and that is the reason JIT delivery method is embraced in the construction industry
for off-the-shelf materials. On the other hand, for the supplier, it is recommended they keep safety
stock to maintain high delivery performance for an off-the-shelve construction material which is
constantly used for a period.

76
Modelling aims at understanding the behavioural pattern to design policies to improve the system.
Supply system enhancement tests if the modelling process helped improve the system. Analyses
shown in chapter four have shown that the higher the EPC order increases, the more the order backlog
and material delivery delay, the lesser the material usage rate by the EPC contractor and supplier’s
delivery reliability level. To study the supplier’s intervention policy for the material supply
coordination, experimental scenarios were devised by varying the order change of EPC contractor,
and supplier’s safety stock level. The order change ranges from 10% increase to 100% increase while
the supplier’s inventory coverage ranges from 2 weeks to 5 weeks. An increase in the supplier’s
inventory coverage (safety stock level) to absorb the order changes from the EPC contractors implies
that the supplier invests more on guaranteeing construction materials for the EPC contractor. Model
suggests that when there was order change, the construction performance reduced in the absence of
the supplier’s safety stock but, the construction performance was enhanced in the presence of safety
stock. Therefore, parameters such as the safety stock, desired inventory and current inventory were
examined during the experiment implementing ordering policy. The decision support model
developed in this work is useful to the construction industry, specifically Engineering, Procurement
and Construction (EPC) firms, who tilt towards lean principles. It is a tool that can be used to enhance
the service level of the EPC firm and its supplier.
Decision support SD model developed in this work will help understand the material supply chain
dynamics between the EPC firm and its supplier, which often emanates into material shortage on site
and how this risk can be mitigated to enhance project performance. In conclusion, the proposed
research in terms of the research objectives may make some meaningful contribution to the
construction management in general and EPC management specifically.
4.6.1 Supplier’s safety stock planning
The safety stock policy was examined under the assumption that no information is between the EPC
contractor and its supplier. Therefore, the supplier must anticipate the material shortage based on
experience and judgement, thus, deal with the uncertainty of deciding what safety stock level should
be kept guaranteeing high service and at the same time not to have excess stock. When EPC order
increases slightly and the material shortage is not serious, incurring extra holding cost of high safety
stock level might not be needed and can be minimized. On the other hand, if the order change cause

77
great material shortage, both the EPC contract and the supplier will bear the consequences, i.e. the
supply chain risk which may cause more damage than spending extra holding cost on more safety
stock. The result presented in section 4.5 shows the EPC contractor’s construction performance
(material usage) and the supplier’s service level (supplier’s inventory coverage) under various order
change and safety stock level. The supply chain performance differs under different scenarios. When
the EPC contractor shares the information on material needed with the supplier on time, the supplier
will know what level of safety stock is needed to maintain high supply chain performance, as safety
stock level should increase with increase in EPC order. For a bulky, off the shelve construction
material, the supplier has developed a solid processing capacity and can accomplish the material
supply. Supplier often measures its performance by delivering in full and on time. When the supplier
has no information about the material needed on time, it is unable to plan very well and might keep
low or excess safety stock. Five scenarios were studied with safety stock level ranging from 2 to 5
weeks of demand. These results are required in decision making by the supplier to help give insight
to the safety stock level to be maintained in response to EPC order increase. Suppliers must also have
good relationship with the producer which is shown in section 4.4.2.1 where delayed processing
reduces the service level of both the supplier and the EPC contractor.
4.6.2 EPC material management planning
To study the role of the EPC contractor in the material coordination, experimental scenarios were
carried out by varying the order change of the EPC firm which from 20% increase to 100% increase
of its initial order. The order increase means that there is high material usage in the construction
process and the EPC contractor needs more materials. The order rate decision has impact on material
availability which eventually affects the project performance. Depending on the contract made with
the supplier and safety lead time kept by the EPC firm, the material delivery rate can be managed by
the decision makers by allowing premium freight i.e. to expedite the construction material to meet the
project goal and avoid schedule and cost overrun. When the EPC firm shares accurate and timely
information with the supplier, the supplier will not have to worry about material shortage and can
keep the safety stock level required for each order change by increasing its order with the producer.
EPC firm must also have good relationship with the supplier which is shown in section 4.4.1.1 where
construction rate reduced because of material shortage and section 4.4.2.2 where delayed shipping
time reduced the service level of the EPC contractor.

78
CHAPTER 5
RECOMMENDATION AND CONCLUSION
5.1 Suggested policies
Based on the results and analyses in chapter 4, this model shows the capability to generate policy,
therefore the following inventory management policies are suggested:
1. Effective information sharing should be foremost to support the EPC contractor and supplier
in developing inventory management policies. From section 4.4.1.1, the effect of sudden order
change was observed on the accumulated order backlog, increased delivery delay, fall in
inventory coverage, instability in material usage, which are all important factors to timely
delivery of material on site and project success.
2. For EPC contractors to make effective alternative plan (such as diverting to other project
aspect) to meet its project goal, there must be accurate and timely information on the shipping
and order processing status. From the analysis in 4.4.2.1 and 4.4.2.2, it was observed that
instability in construction project progress increased as time delay encountered increased.
3. Supplier should keep satisfactory safety stock level corresponding to the order change to
enhance its service level and project performance. From result obtained in section 5.4.3, a 5x%
increase in initial order can help maintain service level of supplier in the presence of x%
sudden increase in order change. The results also suggest that the safety stock as intervention
in the construction material supply chain improves demand and inventory variability, reduces
order backlog and delivery delay of construction materials, improves the project performance,
and the supplier’s service level. Therefore, inventory buffer beyond certain levels does not
enhance project performance or service level, which is the main purpose of its usage, instead
it impedes it.
4. Contingency plans, such us freight premium, must be made in the binding contract for
shipping time delay because of the adverse effect it has on the project performance.
Furthermore, it was observed that the sudden order change has more effect on the EPC contractor,
than on its supplier, in term of the recovery rate as seen in Figure 4.1 and 4.2. These propositions also
apply to each entity in the material supply chain, as the success of entire supply network depend on
the success of each entity (Wang, Dou, Muddada, and Zhang, 2017). With effective information

79
sharing, the supplier can use optimal safety stock level to enhance its service level and the project
performance, therefore excess holding cost can be avoided.
For this model to used by firms, there is need to be aware of the cost associated with it and what is
needed to utilize the model effectively. This model can be used as a stand-alone, which is run with
data obtained from the existing ERP software of a firm. There is need for the firm to buy AnyLogic
software, which is the environment where the model was simulated. In addition, the cost of obtaining
the model, training and hiring the staff that will be responsible for the software management should
also be considered.
5.2 Concluding Remarks
In today’s timeline performance environment, it is very important for decision makers to have access
to decision tools in order to make effective, correct and quick decision. For a successful supply chain,
each firm in an interconnected network should consider themselves as an integral member of the
network and not only focus on its own interest. Holistic supply network is a proactive measure towards
resilience which improves project performance for the sustainability of the EPC, in the face of supply
disruption that can arise in this ever-changing market. Supply chain collaboration gives platform for
organisation to have a better performance in terms of supplier’s service level and project performance.
Application of SD to this work make it an effective tool for decision makers by giving insights to
various possible outcome of a material supply chain reaction under different policies and parameters.
The developed decision systems dynamics simulation model in this work will provide potential
opportunity for firms that seek better project performance by understanding the dynamic behavior of
the complex material supply coordinating system. This model also enhances visibility in the material
supply chain, which positions the EPC contractor and its supplier to make informed-based decision
and policy. Therefore, the EPC firm sees the importance of timely and accurate information sharing
and how its supplier can make adequate plans to meet its demand, even in the face of order changes.
This effective process improvement method is suitable because of its capability to model and simulate
the time-variant behavior to get a decision support system on chain reactions when firms collaborates
and share information. Resilience is not a static goal; continual improvement is needed and crucial to
the success of any firm.

80
Insufficient and untimely delivery of construction materials would reduce the construction rate which
in turn lead to schedule and cost overrun. The optimal planning of the supplier will not only reduce
holding cost but improve the material delivery performance and the project performance. This work
also focuses of the synergy of the supplier’s inventory management and EPC order and material
coordination, which developed a SD model to generate optimal strategy for inventory management in
the CMSC. To improve the material supply chain performance, the material safety stock policy should
be made based of the EPC’s order. This study focuses on the bulk off the shelve construction material
supply coordination between EPC contractor’s and its supplier. As the thesis topic suggests, the goal
of the study is to design a decision simulation model for the construction material supply. The model
can be used to project the response of a policy or decision, but the results are based on assumptions.
It can be used to as a support tool to assist decision makers understand the basic causes of material
delay in the material supply dynamics and test potential intervention policies. This study introduced
some supply chain performance metrics such us supplier’s inventory coverage, material usage rate,
order backlog and order delay, among others. These metrics have been linked and the decision
simulation model had been developed based on them. This decision support simulation model backs
studies on how material shortage reduces construction progress and how safety stock can help achieve
higher service level in the presence of demand variation and inventory variability. This SD model
helped study the behaviour of construction materials supply chain and evaluate the impact of safety
stock intervention and sharing information. This study contributes to the literature by developing a
SD decision support system to help understand the material supply chain dynamics between the EPC
firm and its supplier, which often emanates into material shortage on site and how this risk can be
mitigated to enhance project performance. In conclusion, the proposed research in terms of the
research objectives made some meaningful contribution to the construction management in general
and EPC management specifically.
5.3 Limitation and Future Work
For future research, the result and suggested policies can be further validated using empirical data. In
addition, the findings are limited to construction industry supply chain setting. Further work can be
done on cost of material shortage on the EPC firm in the supply network and incorporation of capacity
expansion model for the construction material to have a better insight to the cost associated to

81
premium freight taking into consideration the time delay in the capacity expansion decision making.
More studies can also be conducted on the safety stock level required in the presence of shipping time
delay and processing time delay.

82
REFERENCES
Abd El-Razek M. E., Bassioni H. A., Mobarak A. M. (2008). Causes of Delay in Building
Construction Projects in Egypt. Journal of Construction Engineering and Management, 134(11),
831–841.
Akintoye A. (1995). Just-in-Time application and implementation for building material management.
Construction Management and Economics, 13(2), 105–113.
Akkermans H., Dellaert N. (2005). The rediscovery of industrial dynamics: The contribution of
system dynamics to supply chain management in a dynamic and fragmented world. System
Dynamics Review, 21(3), 173–186.
Allmon E., Haas C. T., Borcherding J. D., Goodrum P. M. (2000). U.S. Construction Labor
Productivity Trends, 1970–1998. Journal of Construction Engineering and Management, 126(2),
97–104.
Anderson E. G., Morrice D. J., Lundeen, G. (2005). The “physics” of capacity and backlog
management in service and custom manufacturing supply chains. System Dynamics Review,
21(3), 217–247.
Assaf S. A., Al-Khalil M., Al-Hizami M. (1995). Causes of Delay in Large Building. Journal of
Management Engineering, 11(April), 45–50.
Azambuja M. M., Ponticelli S., O’Brien W. J. (2014). Strategic Procurement Practices for the
Industrial Supply Chain. Journal of Construction Engineering and Management, 140(7).
Babaeian Jelodar, M. Yiu, T. W., Wilkinson, S. (2017). Assessing Contractual Relationship Quality:
Study of Judgment Trends among Construction Industry Participants. Journal of Management in
Engineering, 33(1), 1–13.
Barlas Y. (1996). Formal aspects of model validity and validation in system dynamics. System
Dynamics Review, 12(3), 183–210.
Beach R., Webster M., Campbell K. M. (2005). An evaluation of partnership development in the
construction industry. International Journal of Project Management, 23(8), 611–621.
Bhakoo V., Singh P., Sohal A. (2012). Collaborative management of inventory in Australian hospital

83
supply chains: Practices and issues. Supply Chain Management, 17(2), 217–230.
Bijulal D., Venkateswaran, J., Hemachandra N. (2011). Service levels, system cost and stability of
production-inventory control systems. International Journal of Production Research, 49(23),
7085–7105.
Black C., Akintoye A., Fitzgerald, E. (2000). Analysis of success factors and benefits of partnering
in construction. International Journal of Project Management, 18(6), 423–434.
Boateng P., Chen Z., Ogunlana S., Ikediashi, D. (2012). A system dynamics approach to risks
description in megaprojects development. Organization, Technology and Management in
Construction: An International Journal, 4(3), 593–603.
Bower D., Ashby G., Gerald K., Smyk W. (2002). Incentive Mechanisms for Project Success. Journal
of Management in Engineering, 18(1), 37–43.
Brahm F., Tarzijan J. (2016). Relational Contracts and Collaboration in the Supply Chain: Impact of
Expected Future Business Volume on the Make-or-Buy Decision. Journal of Supply Chain
Management, 52(3), 48–67.
Breuer B. J., Fischer M., Member A. (1994). Paper Managerial Aspects Of Information- Technology
Strategies For A / E / C Firms, 10(4), 52–59.
Broft R., Badi S. M., Pryke S. (2016). Towards supply chain maturity in construction. Built
Environment Project and Asset Management, 6(2), 187–204.
Bruce M., Daly L., Towers N. (2004). Lean or agile: A solution for supply chain management in the
textiles and clothing industry? International Journal of Operations and Production Management,
24(1–2), 151–170.
Buzacott J. A., Shanthikumar J. G. (2008). Safety Stock versus Safety Time in MRP Controlled
Production Systems. Management Science, 40(12), 1678–1689.
Cagno E., Giulio, A. Di, Trucco P. (2004). State-of-Art and Development Prospects of E-Procurement
in the Italian Engineering and Contracting Sector, (April).
Caldas C. H., Menches C. L., Reyes P. M., Navarro L., Vargas D. M. (2015). Materials Management
Practices in the Construction Industry. Practice Periodical on Structural Design and

84
Construction, 20(3), 1–8.
Cao M., Vonderembse M. A., Zhang Q., Ragu-Nathan T. S. (2010). Supply chain collaboration:
Conceptualisation and instrument development. International Journal of Production Research,
48(22), 6613–6635.
Cao M., Zhang Q. (2011). Supply chain collaboration: Impact on collaborative advantage and firm
performance. Journal of Operations Management, 29(3), 163–180.
Cengiz A. E., Aytekin O., Ozdemir I., Kusan H., Cabuk A. (2017). A Multi-criteria Decision Model
for Construction Material Supplier Selection. Procedia Engineering, 196(June), 294–301.
Chan A. P. C., Chan A. P. L. (2004). Key performance indicators for measuring construction success.
Benchmarking, 11(2), 203–221.
Chen H., Daugherty P. J., Landry, T. D. (2009). Supply Chain Process Integration: a Theoretical
Framework. Journal of Business Logistics, 30(2), 27–46.
Chen W. T., Chen, T. T. (2007). Critical success factors for construction partnering in Taiwan.
International Journal of Project Management, 25(5), 475–484.
Cho K., Hyun C., Koo, K., Hong T. (2010). Partnering Process Model for Public-Sector Fast-Track
Design-Build Projects in Korea. Journal of Management in Engineering, 26(1), 19–29.
Choi T. Y., Dooley K. J., Rungtusanatham M. (2001). Supply networks and complex adaptive
systems: Control versus emergence. Journal of Operations Management, 19(3), 351–366.
Christopher M., Lee H. (2004). Mitigating supply chain risk through improved confidence.
International Journal of Physical Distribution and Logistics Management, 34(5), 388–396.
Christopher M., Peck H. (2004). Building the Resilient Supply Chain. The International Journal of
Logistics Management, 15(2), 1–14.
Chu X. N., Tso S. K., Zhang W. J., Li, Q. (2002). Partnership synthesis for virtual enterprises.
International Journal of Advanced Manufacturing Technology, 19(5), 384–391.
Construction Work Packages. (2002), (February).
Lambert, Garcia-Dastugue, Croxton. (2005). An evaluation of process-oriented supply chain

85
management frameworks. Journal Of Business Logistics, Vol. 26, No. 1, 2005, 25–51.
Bijulal, Venkateswaran J. (2008). Closed-Loop Supply Chain Stability under Different Production-
Inventory Policies. Control. Retrieved from
http://www.systemdynamics.org/conferences/2008/proceed/papers/bijul325.pdf
Dainty A. R. J., Briscoe G. H., Millett S. J. (2001). New perspectives on construction supply chain
integration. Supply Chain Management, 6(4), 163–173.
Denize S., Young L. (2007). Concerning trust and information. Industrial Marketing Management,
36(7 SPEC. ISS.), 968–982.
Dey P. K. (1996). Managing projects in fast track – A case of public sector organization in India.
International Journal of Public Sector Management, 13(7), 588–609.
Dissanayaka S. M., Kumaraswamy M. M. (1998). Comparing contributors to time and cost
performance in building projects. Building and Environment, 34(1), 31–42.
Drew D. S., Tang S. L. Y., Lui, C. K. (2004). Balancing fee and quality in two envelope fee bidding.
Engineering, Construction and Architectural Management, 11(3), 159–175.
Du L., Tang W., Liu C., Wang S., Wang T., Shen W., Zhou Y. (2016). Enhancing engineer-procure-
construct project performance by partnering in international markets: Perspective from Chinese
construction companies. International Journal of Project Management, 34(1), 30–43.
El-Rayes K., Said, H. (2009). Dynamic Site Layout Planning Using Approximate Dynamic
Programming. Journal of Computing in Civil Engineering, 23(2), 119–127.
Elbeltagi E., Hegazy T., Eldosouky A. (2004). Dynamic Layout of Construction Temporary Facilities
Considering Safety. Journal of Construction Engineering and Management, 130(4), 534–541.
Eldabi T., Keramati A. A. (2011). System Dynamics in Integration of Supply Chain, 35–44.
Ellis S. C., Henry R. M., Shockley J. (2010). Buyer perceptions of supply distruption risk: A
behavrioural view and empirical assessment. Journal of Operations Management, 28(1), 34–46.
Enshassi A., Mohamed S., Abushaban S. (2009). Factors Affecting the Performance of Construction
Projects in the Gaza Strip. Journal of Civil Engineering and Management, 15(3), 269–280.

86
Eriksson P. E. (2010). Improving construction supply chain collaboration and performance: A lean
construction pilot project. Supply Chain Management, 15(5), 394–403.
Eriksson P. E., Westerberg M. (2011). Effects of cooperative procurement procedures on construction
project performance: A conceptual framework. International Journal of Project Management,
29(2), 197–208.
Eugene F. Fama, Jensen M. C. (1983). Análisis del problema de la vivienda en España. Journal Of
Law and Economics, 26(2), 301–325.
Ezenta B. (2015). Project change management for oil and gas projects in Alberta: Twards a predictive
approach. University of Calgary.
Fearne A., Fowler, N. (2006). Efficiency versus effectiveness in construction supply chains: The
dangers of “lean” thinking in isolation. Supply Chain Management: An International Journal,
11(4), 283–287.
Feng Y. (2012). System Dynamics Modeling for Supply Chain Information Sharing. Physics
Procedia, 25, 1463–1469.
Forsman S., Björngrim N., Bystedt A., Laitila L., Bomark P., Öhman, M. (2012). Need for innovation
in supplying engineer-to-order joinery products to construction: A case study in Sweden.
Construction Innovation, 12(4), 464–491.
Fullerton R. R., McWatters C. S., Fawson C. (2003). An examination of the relationships between
JIT and financial performance. Journal of Operations Management, 21(4), 383–404.
Ge Y., Yang J. B., Proudlove N., Spring M. (2004). System dynamics modelling for supply-chain
management: A case study on a supermarket chain in the UK. International Transactions in
Operational Research, 11(5), 495–509.
Georgiadis P., Vlachos D., Tagaras G. (2006). The Impact of Product Lifecycle on Capacity Planning
of Closed-Loop Supply Chains with Remanufacturing. Production and Operations Management,
15(4), 514–527.
Ghodsypour S. H., O’Brien C. (2001). The total cost of logistics in supplier selection, under conditions
of multiple sourcing, multiple criteria and capacity constraint. International Journal of

87
Production Economics, 73(1), 15–27.
Gomez-Mejia L. R., Wiseman R. M. (2007). Does agency theory have universal relevance? A reply
to Lubatkin, Lane, Collin, and Very. Journal of Organizational Behavior, 28(1), 81–88.
Gonul Kochan C., Nowicki D. R., Sauser B., Randall W. S. (2018). Impact of cloud-based information
sharing on hospital supply chain performance: A system dynamics framework. International
Journal of Production Economics, 195(October 2017), 168–185.
Grau D., Back W. E., Prince, J. R. (2011). Benefits of On-Site Design to Project Performance
Measures. Journal of Management in Engineering, 28(3), 232–242.
Greasley A. (2000). Proceedings of the 2000 Winter Simulation Conference . 2000 Winter Simulation
Conference Proceedings , 2(1), 2004–2009.
Griffith D. A., Harvey M. G., Lusch R. F. (2006). Social exchange in supply chain relationships: The
resulting benefits of procedural and distributive justice. Journal of Operations Management,
24(2), 85–98.
Größler A., Thun J. H., Milling P. M. (2008). System dynamics as a structural theory in operations
management. Production and Operations Management, 17(3), 373–384.
Hines J. (1996). Jim Hines Molecules of Structure Page 2 of 128, 1–128.
Ho Nguyen, Shu. (2007). Supplier evaluation and selection criteria in the construction industry of
Taiwan and Vietnam. International Journal of Information and Management Sciences, 18(4),
403–426.
Horman M. J., Thomas H. R. (2005). Role of Inventory Buffers in Construction Labor Performance.
Journal of Construction Engineering and Management, 131(7), 834–843.
Huang M., Yang M., Zhang Y., Liu B. (2012). System Dynamics Modeling-based Study of
Contingent Sourcing under Supply Disruptions. Systems Engineering Procedia, 4(2011), 290–
297.
International Standards Organisation. (2010). International Standard for Construction Procurement -
Part 1: Processes, Methods and Procedures.
Iyer K. C., Jha K. N. (2005). Factors affecting cost performance: Evidence from Indian construction

88
projects. International Journal of Project Management, 23(4), 283–295.
Jaśkowski P., Sobotka A., Czarnigowska A. (2018). Decision model for planning material supply
channels in construction. Automation in Construction, 90(March), 235–242.
Jensen M., Meckling W. (1976). Theory of the firm: Managerial behaviour, agency costs and
ownership. Strategic Management Journal, 21(4), 1215–1224. Retrieved from
http://search.ebscohost.com/login.aspx?direct=true&db=buh&AN=12243301&site=ehost-live
Jergeas G. (2009). Improving Construction Productivity on Alberta Oil and Gas Capital Projects A
report submitted to : Alberta Finance and Enterprise Prepared by : Professor of Project
Management Department of Civil Engineering Schulich School of Engineering University of C.
Management, (May).
Kamath N. B., Roy R. (2007). Capacity augmentation of a supply chain for a short lifecycle product:
A system dynamics framework. European Journal of Operational Research, 179(2), 334–351.
Kaming P. F., Olomolaiye P. O., Holt G. D., Harris F. C. (1997). Factors influencing construction
time and cost overruns on high-rise projects in Indonesia. Construction Management and
Economics, 15(1), 83–94.
Kelle P., Woosley J., Schneider H. (2012). Pharmaceutical supply chain specifics and inventory
solutions for a hospital case. Operations Research for Health Care, 1(2–3), 54–63.
Kirkwood C. C. (2013). System Behavior and Causal Loop Diagrams. System Dynamics Methods,
(Forrester 1961), 1–14.
Korponai J., Tóth Á. B., Illés, B. (2017). Effect of the Safety Stock on the Probability of Occurrence
of the Stock Shortage. Procedia Engineering, 182(1), 335–341.
Laedre O., Austeng K., Haugen T. I., Klakegg O. J. (2006). Procurement Routes in Public Building
and Construction Projects. Journal of Construction Engineering and Management, 132(July 1),
7.
Lam K. C., Tao R., Lam M. C. K. (2010). A material supplier selection model for property developers
using Fuzzy Principal Component Analysis. Automation in Construction, 19(5), 608–618.
Langston C. (2016). The reliability of currency and purchasing power parity conversion for

89
international project cost benchmarking. Benchmarking, 23(1), 61–77.
Larson B. E., Larson E. (1995). Project Partnering : Results of Study of 280 Construction Projects.
Journal of Management in Engineering, 11(2), 30–35.
Lee H. L., Padmanabhan V., Whang S. (1997). Information Distortion in a Supply Chain: The
Bullwhip Effect. Management Science, 43(4), 546–558. https://doi.org/10.1287/mnsc.43.4.546
Lin,Y., Zhang W.(2004). Towards a novel interface design framework: function–behavior–state
paradigm. International Journal of Human-Computer Studies, 61(3), 259–297.
Ling F. Y. Y., Ong S. Y., Ke Y., Wang S., Zou P. (2014). Drivers and barriers to adopting relational
contracting practices in public projects: Comparative study of Beijing and Sydney. International
Journal of Project Management, 32(2), 275–285.
Love P. E. D., Mandal P., Smith J., Heng L. I. (2000). Modelling the dynamics of design error induced
rework in construction. Construction Management and Economics, 18(5), 567–574.
Malindretos G., Binioris S. (2012). Supply Chain Resilience and Sustainability. Inv. Res. Anal. J\r,
2014(5), 1.
Manu E., Ankrah N., Chinyio E., Proverbs D. (2015). Trust influencing factors in main contractor and
subcontractor relationships during projects. International Journal of Project Management, 33(7),
1495–1508.
Mawdesley M. J., Al-Jibouri S. (2010). Modelling construction project productivity using systems
dynamics approach. International Journal of Productivity and Performance Management, 59(1),
18–36.
McTague and Jeageas. (2002). Planning of Mega-Projects: Influence of Execution Planning on
Project Performance, 119.
Meng X. (2012). The effect of relationship management on project performance in construction.
Mentzer J. J. T., Dewitt W., Keebler J. J. S., Min S., Nix, N. W., Smith, C. D., & Zacharia, Z. G.
(2001). Defining supply chain management. Journal of Business Logistics, 22(2), 1–25.
Micheli G. J. L., Cagno E. (2016). The role of procurement in performance deviation recovery in large
EPC projects. International Journal of Engineering Business Management, 8, 1–17.

90
Miller G., Furneaux C. W., Davi, Love P., O’Donnell, A. (2009). Built Environment Procurement
Practice: Impediments to Innovation and Opportunities for Changes, (May), 1–184.
Mohamed S., Tucker S. (1996). Options for applying BPR in the Australian construction industry.
International Journal of Project Management, 14(6 SPEC. ISS.), 379–385.
Mubin S., Mannan A. (2013). Innovative Approach to Risk Analysis and Management of Oil and Gas
Sector EPC Contracts from a Contractor’s Perspective. Journal of Business and Economics (Air
University), 5(2), 149–170. Retrieved from
http://www.au.edu.pk/jbe%5Cnhttp://ezproxy.lib.ucalgary.ca/login?url=http://search.ebscohost
.com/login.aspx?direct=true&db=ecn&AN=1547123&site=ehost-live
Murphree M., Cate R. P., Vosburg C. (2002). Construction Materials Management Guidelines. Waste
Management, 2002(713).
Natour A., Gibson P., Gibson P. (2011). Supply Chain Integration and Collaboration for Performance
Improvement: an Agency Theory Approach. 9th ANZAM Operations, Supply Chain and
Services Management Symposium, 503–519.
Navon R. (2005). Automated project performance control of construction projects. Automation in
Construction, 14(4), 467–476.
Newcombe R. (2003). From client to project stakeholders: A stakeholder mapping approach.
Construction Management and Economics, 21(8), 841–848.
Ovalle O. R., Marquez A. C. (2003). The effectiveness of using e-collaboration tools in the supply
chain: An assessment study with system dynamics. Journal of Purchasing and Supply
Management, 9(4), 151–163.
Pal R., Wang P., Liang X. (2017). The critical factors in managing relationships in international
engineering, procurement, and construction (IEPC) projects of Chinese organizations.
International Journal of Project Management, 35(7), 1225–1237.
Patil, S., & Adavi, P. . (2012). A Survey Study Of Supplier Selection Issues In Construction Supply
Chain. International Journal of Engieering Research Adn Applications, 2(5), 1806–1809.
Paul Humphreys, Jason Matthews, Monan Kumaraswamy. (2003). Pre-construction projection

91
partnering: From adversarial to collaborative relationships. Supply Chain Management, 8(2),
166.
Pheng L. S., Chuan Q. T. (2006). Environmental factors and work performance of project managers
in the construction industry. International Journal of Project Management, 24(1), 24–37.
Pheng L. S., Hui M. S. (1999). The application of JIT philosophy to construction: A case study in site
layout. Construction Management and Economics, 17(5), 657–668.
Polat G., Arditi D. (2005). The JIT materials management system in developing countries.
Construction Management and Economics, 23(7), 697–712.
Polat G., Arditi D., Mungen U. (2007). Simulation-Based Decision Support System for Economical
Supply Chain Management of Rebar. Journal of Construction Engineering and Management,
133(1), 29–39.
Pulaski M. H., Horman M. J. (2005). Organizing Constructability Knowledge for Design. Journal of
Construction Engineering and Management, 131(8), 911–919.
Ramon Gil-Garcia J., Chengalur-Smith I. S., Duchessi P. (2007). Collaborative e-Government:
Impediments and benefits of information-sharing projects in the public sector. European Journal
of Information Systems, 16(2), 121–133.
Richardson G. P. (2011). Reflections on the foundations of system dynamics. System Dynamics
Review, 27(3), 219–243.
Richey R. G. (2009). The supply chain crisis and disaster pyramid, A theoretical framework for
understanding preparedness and recovery. International Journal of Physical Distribution and
Logistics Management, 39(7), 619–628.
Riddalls C. E., Bennett S., Tipi N. S. (2000). Modelling the dynamics of supply chains. International
Journal of Systems Science, 31(8), 969–976.
Ruparathna R., Hewage K. (2015). Review of Contemporary Construction Procurement Practices.
Journal of Management in Engineering, 31(3), 04014038.
Said H., El-Rayes K. (2011). Optimizing Material Procurement and Storage on Construction Sites.
Journal of Construction Engineering and Management, 137(6), 421–431.

92
Sarimveis H., Patrinos P., Tarantilis C. D., Kiranoudis C. T. (2008). Dynamic modeling and control
of supply chain systems: A review. Computers and Operations Research, 35(11), 3530–3561.
Saysel A. K., Barlas Y. (2001). A dynamic model of salinization on irrigated lands. Ecological
Modelling, 139(2–3), 177–199.
Seshadri S., Chatterjee K., Lilien G. L. (2008). Multiple Source Procurement Competitions.
Marketing Science, 10(3), 246–263.
Shmanske S. (2003). JIT and the Complementarity of Buffers and Lot Size. American Business
Review, 21(1), 100.
Siau K., Tian Y. (2004). Supply Chains Integration: Architecture and Enabling Technologies. The
Journal of Computer Information Systems, 44(3), 67–72. Retrieved from
http://search.proquest.com/docview/232575855?accountid=27937%5Cnhttp://sfx.colman.ac.il:
3210/sfxlcl3/?url_ver=Z39.882004&rft_val_fmt=info:ofi/fmt:kev:mtx:journal&genre=article&
sid=ProQ:ProQ:computing&atitle=Supply+Chains+Integration:+Architecture+And+Ena
Simatupang T. M., Sridharan R. (2008). Design for supply chain collaboration. Business Process
Management Journal, 14(3), 401–418.
Singh V., Gu N.,Wang X. (2011). A theoretical framework of a BIM-based multi-disciplinary
collaboration platform. Automation in Construction, 20(2), 134–144.
Sterman J. D. (1989). Modeling Managerial Behavior: Misperceptions of Feedback in a Dynamic
Decision Making Experiment. Management Science, 35(3), 321–339.
Sterman J. D. (1992). System Dynamics Modeling for Project Management. Manuscripts MIT, 1, 1–
12.
Sterman J. D. (2000). System Dynamics: Systems Thinking and Modeling for a Complex World. In
Proceedings of the ESD Internal Symposium.
Tang C. S. (2006). Perspectives in supply chain risk management. International Journal of Production
Economics, 103(2), 451–488.
Tang W., Li Z., Qiang M., Wang S., Lu, Y. (2013). Risk management of hydropower development in
China. Energy, 60, 316–324.

93
Tang Y. H., Ogunlana S. O. (2003). Modelling the dynamic perfomance of a construction
organization. Construction Management and Economics, 21(2), 127–136.
Thomas B. H. R., Riley D. R., Sanvido V. E. (1999). L p d m w, 125(February), 39–46.
Thomas B. H. R., Sanvido V. E., Sanders, S. R. (1990). Impact Of Material Management On
Productivity—A Case StudY, 115(3), 370–384.
Thomas H. R., Riley D. R., Messner J. I. (2005). Fundamental Principles of Site Material
Management. Journal of Construction Engineering and Management, 131(7), 808–815.
Tserng H. P., Yin S. Y. L., Li S. (2006). Developing a Resource Supply Chain Planning System for
Construction Projects. Journal of Construction Engineering and Management, 132(4), 393–407.
Van Ackere A., Larsen E. R., Morecroft J. D. W. (1997). Maintaining Service Quality under Pressure
from Investors : a Systems Dynamics M o d e l as a H a n d s - o n Learning Tool, 73(2). Retrieved
from https://doi.org/10.1016/S0263-2373(96)00082-5
Vanany I., Zailani S., Pujawan N. (2009). Supply Chain Risk Management-Lit Review and Future
Research. Int’l Journal of Information Systems and Supply Chain Management, 2(1), 16–33.
Retrieved from
https://pdfs.semanticscholar.org/ef1a/3b551bc511f78bf6bfa479253ae2cc398be3.pdf
Venkateswaran J., Son Y. J. (2007). Effect of information update frequency on the stability of
production-inventory control systems. International Journal of Production Economics, 106(1),
171–190.
Vrijhoef R., Koskela L. (2000). The four roles of supply chain management in construction. European
Journal of Purchasing and Supply Management, 6(3–4), 169–178.
Wadhwa S., Saxena A. (2007). Decision knowledge sharing: Flexible supply chains in KM context.
Production Planning and Control, 18(5), 436–452.
Wang J., Dou R., Muddada R. R., Zhang W. (2017a). Management of a holistic supply chain network
for proactive resilience: Theory and case study. Computers and Industrial Engineering, (xxxx),
0–1.
Wang J., Dou R., Muddada R. R., Zhang W. (2017b). Management of a holistic supply chain network

94
for proactive resilience: Theory and case study. Computers & Industrial Engineering,
125(December 2017), 668–677.
Wang J. W., Ip W. H., Muddada R. R., Huang J. L., Zhang W. J. (2013). On Petri net implementation
of proactive resilient holistic supply chain networks. The International Journal of Advanced
Manufacturing Technology, 69(1–4), 427–437.
Wang T., Tang W., Du L., Duffield C. F., Wei Y. (2016). Relationships among Risk Management,
Partnering, and Contractor Capability in International EPC Project Delivery. Journal of
Management in Engineering, 32(6), 04016017.
Wei H. L., Wang E. T. G. (2010). The strategic value of supply chain visibility: Increasing the ability
to reconfigure. European Journal of Information Systems, 19(2), 238–249.
Westney R. E. (2012). Why Projects Overrun and What To Do About It. Westney Consulting Group,
Inc., (1). Retrieved from www.westney.com
Wilson M. C. (2007). The impact of transportation disruptions on supply chain performance.
Transportation Research Part E: Logistics and Transportation Review, 43(4), 295–320.
Yang J., Shen G. Q., Drew D. S., Ho M. (2010). Critical Success Factors for Stakeholder
Management: Construction Practitioners’ Perspectives. Journal of Construction Engineering and
Management, 136(7), 778–786.
Yeo K.T., Ning J. H. (2002). Integrating Supply Chain and Critical Chain Concepts in Engineer -
Procure - Construct (EPC) Projects. International Journal of Project Management, 20(4), 253–
262.
Yeo K. T., Ning J. H. (2006). Managing uncertainty in major equipment procurement in engineering
projects. European Journal of Operational Research, 171(1), 123–134.
Yeung J. F., Chan A. P., Chan D. W. (2009). Developing a Performance Index for Relationship-Based
Construction Projects in Australia: Delphi Study. Journal of Management in Engineering, 25(2),
59–68.
Yu M. C. (2011). Multi-criteria ABC analysis using artificial-intelligence-based classification
techniques. Expert Systems with Applications, 38(4), 3416–3421.

95
Zhang W. J. (1994). 3me_zhang_19941115.PDF. https://doi.org/ISBN 90-370-0113-0, pp. 1-263.
Zhang W. J., Van Luttervelt C. A. (2011). Toward a resilient manufacturing system. CIRP Annals -
Manufacturing Technology, 60(1), 469–472.
Zhang W. J., Wang, J. W. (2016). Design theory and methodology for enterprise systems. Enterprise
Information Systems, 10(3), 245–248.
Zhao X., Xie J., Zhang W. J. (2002). The impact of information sharing and ordering co‐ordination
on supply chain performance. Supply Chain Management: An International Journal

96
APPENDIX A
SYSTEMS DYNAMICS MODEL EQUATIONS
Order Fulfilment
The CMSC model starts with an incoming EPC Order rate (OR). OR provokes OB. OB increases the
unfulfilled orders by reason of the EPC order cannot be delivered immediately. To provide model’s
equilibrium
OB = OR × DD= 0 ………………………………………………………………………………(A.1)
where DD can be any value decided on by the EPC firm
OB= (OR × DD) + OR- OFR …………………………………….………………………….…...(A.2)
OB affects the behaviour of the desired shipment DSR. DRS is calculated as the ratio of OB and DD
DSR =OB/ TDD …………………………………………………………………….……………(A.3)
OB also affect the actual average delay, ADD. DD is obtained as the ratio OB and OFR
DD= OB/OFR ………………………………………………........…………………………..(A.4)
where OFR =SR ………………………………………………………….……………..……...(A.5)
Shipment Rate, is calculated as follows:
SR= DSR× [TF(MSR/DSR)] …………………………………………………….…..……….…(A.6)
Where TF indicate to the Table of Order Fulfilment. [TF (MSR/DSR)] shows a function of MSR to
DSR that indicates the fraction of the orders given DSR which is called FR

97
MSR is the supplier maximum rate of shipments that can occurs given the current SI level regulated
by ST
MSR = SI/ST ……………………………...………………………………………….…………..(A.7)
where minimum shipping time, ST is given
Inventory Control
SI, the level of ready supplier inventory in stock which is computed as
SI =DSI ……………………………………...…………………………………………………...(B.1)
SI accumulates the discrepancy between the processing rate PR ad the shipment rate SR
SI = (PR – SR) ×dt ……………………………………………………………………….……...(B.2)
Where, MDR = SR………………………………………………………………………..………(B.3)
SIC shows the numbers of weeks supplier could ship at the current SR given their SI level. Supplier
seeks to maintain adequate SIC to enhance adequate service level to the EPC. To maintain SIC, the
supplier tries to keep SI level adequate at the DSI by protecting the EOR.
SIC= SI / SR ………………………………………………………………………………….…(B.4)
Therefore, DSI is determined by:
DSI = (ST+SS) × E0R ………………………………………………….………………….……(B.5)
where ST and SS are given predetermined values.

98
EOR, initialized when the t = 0 as follows: EOR = EO, t = 0 …………………………...…….…(B.6)
EOR was determined by first order exponential smoothing technique as follow:
EOR = EO+ CEO …………………………………………….…………………………….….…(B.7)
where CEO, change in expected order, is determined between EO and EOR adjusted by the given AT,
time to average order rate:
CEO = (EO – EOR)/AT ……………………………………….…………………………………(B.8)
When there is not enough supplier inventory coverage, there is discrepancy between DSI and SI,
which is referred as SID, supplier inventory gap which is adjusted by SDT:
SID = (DSI-SI)/SDT ………………...………………………………………………………….(B.9)
To reduce SID, and take the SI level to desired level, supplier desired processing rate DP is determined
as follows:
DP = (EOR+SID) …………………………………….………………………...………….……(B.10)
SR = MDR …………………………….……………………………………...…………………(B.11)
Order Processing
DP alters PS, processing start rate, which is regulated by DP as:
PS =DP + WD ……………………...………………………………………………………….…(C.1)

99
WD work in process discrepancy, adjust PS, to reduce the difference between desired work in process,
DW, and supplier work in process inventory, WIP
WD = (DW – WIP)/WDT…………………….………………………………………..…………(C.2)
where WDT value is given.
WIP accumulates the difference between processing start rate PS and processing rate, P. WIP is
calculated as
WIP = DW, t = 0 ……………………………...………………………………..…………………(C.3)
WIP = DW+ PS – PR …………………………………...………………………...……………...(C.4)
DW enhances a level of WIP, adequate to provide the DP, given processing time PT:
DW = PT× DP ………………...…………………………………………………….……………(C.5)
Processing rate PR is calculated by the third order delay of the processing start rate (delay 3) ᵟ₃ with
the delay time determined by the PT:
PR = δ ₃ (PS, PT) ……………………………………………………………….…………………(C.6)
Material Management
Recall from equation 18, SR = MDR
EI, the level of ready EPC inventory in stock which is computed as
EI =DEI ……………………………………………………………………….…………………(D.1)
EI accumulates the discrepancy between the material delivery rate MDR and the material usage rate
MUR
EI = (MDR – MUR) * dt ……………...……………………………………………….…………(D.2)

100
EIC shows the numbers of weeks EPC contractors could construct (use) at the current MUR given
their EI level. MUR is the rate at which construction materials are consumed depending on its
availability in the store.
MUR = DUR× [TU(MU/DUR)] …………………………………………………….………... (D.3)
where TU indicate to the Table of Material Usage. [TU (MU/DUR)] shows a function of MU to DUR
that indicates the fraction of the material used given DUR which is called UR.
MU is the EPC maximum rate of material usage that can occurs given the current EI level regulated
by MIC
MU = EI/MIC ………………………………………………………………………….……… (D.4)
where minimum material inventory coverage, MIC is given.
DUR is the construction rate EPC firm seeks determined the expected material delivery rate, EMD
DUR = EMD………………………………………………………………………….….……… (D.5)
EMD, initialized when the t=0 as follows: EMD =EO at t=0 ………………………….…...….. (D.6)
EMD was determined by first order exponential smoothing technique as follow:
EMD = EO+ CMD …………………….……………………………………...……….………... (D.7)
where CMD, change in expected material delivery, is determined between EO and EMD adjusted by
the given AD, time to average delivery rate:
CMD = (EO – EMD)/AD …………………………………………….………….……………… (D.8)

101
When there is not enough supplier inventory coverage, there is discrepancy between DEI and EI,
which is referred as EID, EPC inventory gap which is adjusted by EDT:
EID = (DEI-EI)/EDT ………………………………………………….……….……………… (D.9)
EIC shows the number of weeks the EPC can carry out construction at the current MUR given EI.
EIC = EI/MUR………………………………………………………….…….………………. (D.10)
EPC contractor tries to maintain enough inventory EIC to give adequate service in term of the
construction rate. To maintain EIC, the EPC contractor tries to keep EI level adequate at the DEI by
protecting the EMD which affects the DUR
Therefore, DEI is determined by:
DEI = (MIC+ESS) ×DUR …………………………………………….…………………….. (D.11)
where MIC and ESS are given predetermined values.

102
APPENDIX B
COPYRIGHT PERMISSION
Figure 1.1 and 2.6
This Agreement between 57 Campus Dr ("You") and Elsevier ("Elsevier") consists of your
license details and the terms and conditions provided by Elsevier and Copyright Clearance
Center.
License Number 4727301272283
License date Dec 13, 2019
Licensed Content Publisher Elsevier
Licensed Content Publication International Journal of Project Management
Licensed Content Title Integrating supply chain and critical chain concepts in
engineer-procure-construct (EPC) projects
Licensed Content Author K.T Yeo,J.H Ning
Licensed Content Date May 1, 2002
Licensed Content Volume 20
Licensed Content Issue 4
Licensed Content Pages 10
Start Page 253
End Page 262
Type of Use reuse in a thesis/dissertation
Portion figures/tables/illustrations
Number of figures/tables/illustrations 2
Format both print and electronic
Are you the author of this Elsevier
article? No
103
Will you be translating? No
Title SYSTEMS APPROACH TO EPC MATERIAL
PROCUREMENT STRATEGY
Institution name University of Saskatchewan
Expected presentation date Dec 2019
Portions Figures 2 and 3
Requestor Location
57 Campus Dr
57 Campus Dr
Saskatoon, SK S7N 5A9
Canada
Attn: 57 Campus Dr
Publisher Tax ID GB 494 6272 12
Total 0.00 CAD
Terms and Conditions
INTRODUCTION
1. The publisher for this copyrighted material is Elsevier. By clicking "accept" in connection
with completing this licensing transaction, you agree that the following terms and conditions
apply to this transaction (along with the Billing and Payment terms and conditions
established by Copyright Clearance Center, Inc. ("CCC"), at the time that you opened your
Rightslink account and that are available at any time at http://myaccount.copyright.com).
GENERAL TERMS
2. Elsevier hereby grants you permission to reproduce the aforementioned material subject
to the terms and conditions indicated.
3. Acknowledgement: If any part of the material to be used (for example, figures) has
appeared in our publication with credit or acknowledgement to another source, permission

104
must also be sought from that source. If such permission is not obtained then that material
may not be included in your publication/copies. Suitable acknowledgement to the source
must be made, either as a footnote or in a reference list at the end of your publication, as
follows:
"Reprinted from Publication title, Vol /edition number, Author(s), Title of article / title of
chapter, Pages No., Copyright (Year), with permission from Elsevier [OR APPLICABLE
SOCIETY COPYRIGHT OWNER]." Also Lancet special credit - "Reprinted from The
Lancet, Vol. number, Author(s), Title of article, Pages No., Copyright (Year), with
permission from Elsevier."
4. Reproduction of this material is confined to the purpose and/or media for which permission
is hereby given.
5. Altering/Modifying Material: Not Permitted. However, figures and illustrations may be
altered/adapted minimally to serve your work. Any other abbreviations, additions, deletions
and/or any other alterations shall be made only with prior written authorization of Elsevier
Ltd. (Please contact Elsevier at [email protected]). No modifications can be made
to any Lancet figures/tables and they must be reproduced in full.
6. If the permission fee for the requested use of our material is waived in this instance, please
be advised that your future requests for Elsevier materials may attract a fee.
7. Reservation of Rights: Publisher reserves all rights not specifically granted in the
combination of (i) the license details provided by you and accepted in the course of this
licensing transaction, (ii) these terms and conditions and (iii) CCC's Billing and Payment
terms and conditions.
8. License Contingent Upon Payment: While you may exercise the rights licensed
immediately upon issuance of the license at the end of the licensing process for the
transaction, provided that you have disclosed complete and accurate details of your proposed
use, no license is finally effective unless and until full payment is received from you (either
by publisher or by CCC) as provided in CCC's Billing and Payment terms and conditions. If

105
full payment is not received on a timely basis, then any license preliminarily granted shall
be deemed automatically revoked and shall be void as if never granted. Further, in the event
that you breach any of these terms and conditions or any of CCC's Billing and Payment terms
and conditions, the license is automatically revoked and shall be void as if never
granted. Use of materials as described in a revoked license, as well as any use of the
materials beyond the scope of an unrevoked license, may constitute copyright infringement
and publisher reserves the right to take any and all action to protect its copyright in the
materials.
9. Warranties: Publisher makes no representations or warranties with respect to the licensed
material.
10. Indemnity: You hereby indemnify and agree to hold harmless publisher and CCC, and
their respective officers, directors, employees and agents, from and against any and all claims
arising out of your use of the licensed material other than as specifically authorized pursuant
to this license.
11. No Transfer of License: This license is personal to you and may not be sublicensed,
assigned, or transferred by you to any other person without publisher's written permission.
12. No Amendment Except in Writing: This license may not be amended except in a writing
signed by both parties (or, in the case of publisher, by CCC on publisher's behalf).
13. Objection to Contrary Terms: Publisher hereby objects to any terms contained in any
purchase order, acknowledgment, check endorsement or other writing prepared by you,
which terms are inconsistent with these terms and conditions or CCC's Billing and Payment
terms and conditions. These terms and conditions, together with CCC's Billing and Payment
terms and conditions (which are incorporated herein), comprise the entire agreement between
you and publisher (and CCC) concerning this licensing transaction. In the event of any
conflict between your obligations established by these terms and conditions and those
established by CCC's Billing and Payment terms and conditions, these terms and conditions
shall control.

106
14. Revocation: Elsevier or Copyright Clearance Center may deny the permissions described
in this License at their sole discretion, for any reason or no reason, with a full refund payable
to you. Notice of such denial will be made using the contact information provided by
you. Failure to receive such notice will not alter or invalidate the denial. In no event will
Elsevier or Copyright Clearance Center be responsible or liable for any costs, expenses or
damage incurred by you as a result of a denial of your permission request, other than a refund
of the amount(s) paid by you to Elsevier and/or Copyright Clearance Center for denied
permissions.
LIMITED LICENSE
The following terms and conditions apply only to specific license types:
15. Translation: This permission is granted for non-exclusive world English rights only
unless your license was granted for translation rights. If you licensed translation rights, you
may only translate this content into the languages you requested. A professional translator
must perform all translations and reproduce the content word for word preserving the
integrity of the article.
16. Posting licensed content on any Website: The following terms and conditions apply as
follows: Licensing material from an Elsevier journal: All content posted to the web site must
maintain the copyright information line on the bottom of each image; A hyper-text must be
included to the Homepage of the journal from which you are licensing
at http://www.sciencedirect.com/science/journal/xxxxx or the Elsevier homepage for books
at http://www.elsevier.com; Central Storage: This license does not include permission for a
scanned version of the material to be stored in a central repository such as that provided by
Heron/XanEdu.
Licensing material from an Elsevier book: A hyper-text link must be included to the Elsevier
homepage at http://www.elsevier.com . All content posted to the web site must maintain the
copyright information line on the bottom of each image.

107
Posting licensed content on Electronic reserve: In addition to the above the following
clauses are applicable: The web site must be password-protected and made available only to
bona fide students registered on a relevant course. This permission is granted for 1 year only.
You may obtain a new license for future website posting.
17. For journal authors: the following clauses are applicable in addition to the above:
Preprints:
A preprint is an author's own write-up of research results and analysis, it has not been peer-
reviewed, nor has it had any other value added to it by a publisher (such as formatting,
copyright, technical enhancement etc.).
Authors can share their preprints anywhere at any time. Preprints should not be added to or
enhanced in any way in order to appear more like, or to substitute for, the final versions of
articles however authors can update their preprints on arXiv or RePEc with their Accepted
Author Manuscript (see below).
If accepted for publication, we encourage authors to link from the preprint to their formal
publication via its DOI. Millions of researchers have access to the formal publications on
ScienceDirect, and so links will help users to find, access, cite and use the best available
version. Please note that Cell Press, The Lancet and some society-owned have different
preprint policies. Information on these policies is available on the journal homepage.
Accepted Author Manuscripts: An accepted author manuscript is the manuscript of an
article that has been accepted for publication and which typically includes author-
incorporated changes suggested during submission, peer review and editor-author
communications.
Authors can share their accepted author manuscript:
• immediately

108
o via their non-commercial person homepage or blog
o by updating a preprint in arXiv or RePEc with the accepted manuscript
o via their research institute or institutional repository for internal institutional
uses or as part of an invitation-only research collaboration work-group
o directly by providing copies to their students or to research collaborators for
their personal use
o for private scholarly sharing as part of an invitation-only work group on
commercial sites with which Elsevier has an agreement
• After the embargo period
o via non-commercial hosting platforms such as their institutional repository
o via commercial sites with which Elsevier has an agreement
In all cases accepted manuscripts should:
• link to the formal publication via its DOI
• bear a CC-BY-NC-ND license - this is easy to do
• if aggregated with other manuscripts, for example in a repository or other site, be
shared in alignment with our hosting policy not be added to or enhanced in any way
to appear more like, or to substitute for, the published journal article.
Published journal article (JPA): A published journal article (PJA) is the definitive final
record of published research that appears or will appear in the journal and embodies all value-
adding publishing activities including peer review co-ordination, copy-editing, formatting,
(if relevant) pagination and online enrichment.
Policies for sharing publishing journal articles differ for subscription and gold open access
articles:
Subscription Articles: If you are an author, please share a link to your article rather than
the full-text. Millions of researchers have access to the formal publications on ScienceDirect,
and so links will help your users to find, access, cite, and use the best available version.

109
Theses and dissertations which contain embedded PJAs as part of the formal submission can
be posted publicly by the awarding institution with DOI links back to the formal publications
on ScienceDirect.
If you are affiliated with a library that subscribes to ScienceDirect you have additional
private sharing rights for others' research accessed under that agreement. This includes use
for classroom teaching and internal training at the institution (including use in course packs
and courseware programs), and inclusion of the article for grant funding purposes.
Gold Open Access Articles: May be shared according to the author-selected end-user
license and should contain a CrossMark logo, the end user license, and a DOI link to the
formal publication on ScienceDirect.
Please refer to Elsevier's posting policy for further information.
18. For book authors the following clauses are applicable in addition to the
above: Authors are permitted to place a brief summary of their work online only. You are
not allowed to download and post the published electronic version of your chapter, nor may
you scan the printed edition to create an electronic version. Posting to a repository: Authors
are permitted to post a summary of their chapter only in their institution's repository.
19. Thesis/Dissertation: If your license is for use in a thesis/dissertation your thesis may be
submitted to your institution in either print or electronic form. Should your thesis be
published commercially, please reapply for permission. These requirements include
permission for the Library and Archives of Canada to supply single copies, on demand, of
the complete thesis and include permission for Proquest/UMI to supply single copies, on
demand, of the complete thesis. Should your thesis be published commercially, please
reapply for permission. Theses and dissertations which contain embedded PJAs as part of
the formal submission can be posted publicly by the awarding institution with DOI links
back to the formal publications on ScienceDirect.

110
Elsevier Open Access Terms and Conditions
You can publish open access with Elsevier in hundreds of open access journals or in nearly
2000 established subscription journals that support open access publishing. Permitted third
party re-use of these open access articles is defined by the author's choice of Creative
Commons user license. See our open access license policy for more information.
Terms & Conditions applicable to all Open Access articles published with Elsevier:
Any reuse of the article must not represent the author as endorsing the adaptation of the
article nor should the article be modified in such a way as to damage the author's honour or
reputation. If any changes have been made, such changes must be clearly indicated.
The author(s) must be appropriately credited and we ask that you include the end user license
and a DOI link to the formal publication on ScienceDirect.
If any part of the material to be used (for example, figures) has appeared in our publication
with credit or acknowledgement to another source it is the responsibility of the user to ensure
their reuse complies with the terms and conditions determined by the rights holder.
Additional Terms & Conditions applicable to each Creative Commons user license:
CC BY: The CC-BY license allows users to copy, to create extracts, abstracts and new works
from the Article, to alter and revise the Article and to make commercial use of the Article
(including reuse and/or resale of the Article by commercial entities), provided the user gives
appropriate credit (with a link to the formal publication through the relevant DOI), provides
a link to the license, indicates if changes were made and the licensor is not represented as
endorsing the use made of the work. The full details of the license are available
at http://creativecommons.org/licenses/by/4.0.
CC BY NC SA: The CC BY-NC-SA license allows users to copy, to create extracts,
abstracts and new works from the Article, to alter and revise the Article, provided this is not
done for commercial purposes, and that the user gives appropriate credit (with a link to the
111
formal publication through the relevant DOI), provides a link to the license, indicates if
changes were made and the licensor is not represented as endorsing the use made of the work.
Further, any new works must be made available on the same conditions. The full details of
the license are available at http://creativecommons.org/licenses/by-nc-sa/4.0.
CC BY NC ND: The CC BY-NC-ND license allows users to copy and distribute the Article,
provided this is not done for commercial purposes and further does not permit distribution
of the Article if it is changed or edited in any way, and provided the user gives appropriate
credit (with a link to the formal publication through the relevant DOI), provides a link to the
license, and that the licensor is not represented as endorsing the use made of the work. The
full details of the license are available at http://creativecommons.org/licenses/by-nc-nd/4.0.
Any commercial reuse of Open Access articles published with a CC BY NC SA or CC BY
NC ND license requires permission from Elsevier and will be subject to a fee.
Commercial reuse includes:
• Associating advertising with the full text of the Article
• Charging fees for document delivery or access
• Article aggregation
• Systematic distribution via e-mail lists or share buttons
Posting or linking by commercial companies for use by customers of those companies.
20. Other Conditions:
v1.9
Questions? [email protected] or +1-855-239-3415 (toll free in the US) or
+1-978-646-2777.