systemic risk and the u.s. insurance sector - naic.org · systemic risk are assessed with respect...
TRANSCRIPT
Systemic Risk and the U.S. Insurance Sector
By
Mary A. Weiss, Ph.D. Distinguished Scholar
Center for Insurance Policy & Research National Association of Insurance Commissioners
February 23, 2010
The author thanks Terri Vaughan, Todd Sells, David Vacca, Ed Toy, Kris DeFrain and other NAIC staff for their comments and contributions to this research. Any mistakes are solely the responsibility of the author. ©2010 Mary A. Weiss
1
Introduction Beginning with the bursting of the housing bubble in 2007, the term systemic risk
has been gathering increasing importance for all financial market players (investors,
regulators, financial institution management, etc.). In particular, defining systemic risk,
mitigating the effects of systemic events, and developing strategies to forestall future
systemic crises have been the focus in regulatory discussions at every level of functional
regulator and across all financial markets. In fact, new regulation has been proposed for
financial institutions at the federal level, including for some insurers. Therefore, a
specific question arises as to whether a financial institution such as an insurer is
systemically risky or not. Insurers, with the possible exception of monoline financial
guarantee, strongly maintain that insurance is not systemically risky, while some
regulators disagree. Very little direct research concerning insurance and systemic risk
exists however.1
The purpose of this paper is to investigate whether the U.S. insurance sector is
systemically risky. In answering this question, the basic operations of insurers are
examined (i.e., underwriting), and insurer financial statistics are compared to another,
systemically important financial sector, commercial banking. Of course, the term
systemic risk must be defined to achieve this research’s objective. Therefore, the finance
literature is reviewed for a common, reasonable definition of systemic risk. Primary
factors that are associated with systemic risk in the literature are identified (e.g.,
interconnectedness, substitutability, concentration, and infrastructure), and these factors
are reviewed for their role in systemic events. Finally, the factors associated with
systemic risk are assessed with respect to the insurance sector.
By way of preview, the analysis suggests that insurers are not instigators or the
cause of systemic risk. Therefore, they do not require systemic risk regulation -- any
direct systemic risk regulation of insurers is unlikely to stem future systemic risk crises.
Instead, most systemic risks arise from common shocks in the market. Thus systemic
risk regulation should concentrate on reducing the impact of these market shocks (rather
than focusing on “too big to fail” (TBTF) institutions). However, as financial
intermediaries, insurers are prone to the effects of systemic shocks on financial markets 1 Notable exceptions are Harrington (2009), Swiss Re (2003) and Bell and Keller (2009).
2
(regardless of their cause), especially life insurers. Therefore, insurance regulators have a
stake in developing any new regulations regarding systemic risk, because of insurers’
exposure to it. Thus insurance regulators should be included in discussions relating to
systemic risk and should play a role in any new systemic risk regulation.
The remainder of this paper is organized as follows. In the next section, insurers’
exposure to financial risk is discussed. Following this, systemic risk for purposes of this
research is defined. Primary and secondary factors associated with systemic risk are
discussed. The third section directly addresses the issue of whether U.S. insurers are
systemically risky. The last section concludes, with suggestions regarding regulation of
systemic risk and insurance.
Insurance Financial Risks
All financial institutions face financial risk. The principal types of financial risk
are market, credit, liquidity, and underwriting (or technical risk)2; and the extent of
exposure to these risks vary by type of financial institution (insurers, banks, and
securities firms). In this section, the exposure of insurers to financial risks is discussed.
Underwriting as Core Activity
Traditionally, the fundamental purpose of insurance is the pooling or
diversification of risk for purposes of achieving risk reduction (i.e., underwriting).3 In
the vernacular, pooling involves using the law of large numbers (or the law of averages)
to make losses more predictable, thus alleviating risks that individuals and companies
would otherwise have to bear. The types of risks pooled are typically “real events” such
as theft, fire, sickness, death, and natural hazards (Bell and Keller, 2009). These are
exogenous events and mostly independent in nature, as opposed to other types of
financial risk which tend to be systematic (such as market risk).4
In the simplest case, diversification takes place by insuring a variety of risks.
Typically, similar risks are pooled together through a risk classification process. Further
2 Of course, financial institutions are exposed to many other types of risk, such as operational risk. 3 An exception is that some types of life insurance products are primarily asset accumulation vehicles. 4 Some types of risks may be correlated, with classic cases being losses from a catastrophe (such as hurricane or earthquake) or a pandemic.
3
diversification takes place by underwriting different types of risk (e.g., fire and auto), by
underwriting in different geographic areas (across different states and different
countries), and by diversifying across different types of risks (such as underwriting and
investment risk).
To the extent that risk is not eliminated by diversification, mitigation techniques
may be used by insurers. The primary mitigation devices for underwriting risk are
reinsurance and securitization. In a reinsurance transaction, an insurer (the primary
company) cedes some of the business it has issued to another insurer (the reinsurer).5
Reinsurance may be desirable because the reinsurer may be able to achieve better pooling
or diversification of risk than the primary company since it operates on a global basis and
can further diversify risks geographically and by (risky) lines of business.6 Reliance on
reinsurance exposes insurers to another financial risk, credit risk (i.e., the risk that the
reinsurer will not be able to pay contractual losses under the reinsurance policy).7
Finally, securitization, such as through insurance-linked securities like catastrophe or
mortality bonds, is increasingly being relied upon for insurance of losses for which even
reinsurers may not be able to obtain an adequate spread of risk or in circumstances where
it is relatively cheaper to use securitization than reinsurance.8 Insurance-linked securities
are attractive to investors because of their low correlation with capital market returns.
Insurance policies are typically pre-funded, as premiums are paid prior to
providing coverage. Because insurance is pre-funded, insurers must estimate the losses
associated with policies prior to policy issuance; actuarial analysis and tools assist in this
process. Thus insurers face pricing or underwriting risk (sometimes called technical
risk), and this is a significant risk that insurers bear, especially property-liability
insurers.9 Once policies have been issued and loss experience begins to develop, insurers
form ex post estimates of losses for their policies. The estimate of unpaid losses for
insurance policies issued is frequently referred to as reserves, or loss reserves.
5 Ceding reinsurance is similar to transferring or selling the business, except that the primary insurer remains ultimately responsible for paying claims under the policy. 6 Some lines of business are considered riskier than others and may require a larger spread of risk for diversification than the primary insurer can underwrite, given the capital of the primary company. 7 This risk is sometimes mitigated by collateral requirements. 8 For a good discussion of risk mitigation devices including catastrophe bonds, see Cummins and Weiss (2009). 9 Market risk is the major risk borne for some types of life insurer policies such as some types of annuities.
4
Estimating adequate reserves for losses and benefits is complicated by the
payment patterns for losses and benefits. For example, in occurrence-based property-
liability insurance, even though coverage under a policy may cover occurrences over a
one year time frame, losses associated with the occurrence may be paid after coverage
under the policy has expired. Thus, latent diseases associated with the workplace may
not manifest themselves until years after a workers’ compensation policy has expired; but
if the occurrence (disease) can be traced back to the year of coverage, the insurer is
responsible for workers’ compensation losses. For some lines of business, such as
workers’ compensation, there can be a long time lag between payment of premiums and
payment of losses, hence these lines of business are sometimes referred to as long-tail.
Examples of long-tail lines typically include liability lines of business such as general
(commercial) liability, medical malpractice, homeowners multiple peril and auto
liability.10 In contrast, in lines such as property insurance (e.g., auto collision or theft),
loss payments are made relatively quickly; hence these lines of business are considered
short-tail. In life insurance, mortality and morbidity statistical tables makes estimation of
future losses more straightforward; however, complications can still arise (e.g.,
estimation of lapse rates).11
Insurers as Financial Intermediaries
Insurers invest the (pre-funded) premiums until loss (property-liability insurance)
or benefit payments (life insurance) are made. Investment of premiums exposes insurers
to market, credit and mispricing risk, as the major types of insurer invested assets are
bonds (both government and corporate) and equities. In particular, anticipated loss and
benefit payments under the policy are discounted when determining the premium, hence
10 The statutory statements of property-liability insurers, called the Annual Statement, details loss payments for these lines of business in Schedule P. Schedule P indicates historical loss payouts over a 10-year period attributed to specific years of occurrence (accident or report years) for long-tail lines of business. Using the year 1998 as an example, the payment history of losses attributable to 1998 over a 10-year period is provided in the Annual Statement. Of the total losses paid after 10 years, 45% were paid in 1998 and 91% had cumulatively been paid out by the end of 2002. The latter statistics apply to the entire industry. For specific lines of coverage, the payment pattern may be more extended. For workers’ compensation insurance, for example, of the total losses paid after 10 years for coverage associated with 1998, 25% were paid in 1998 and 85% were paid out by the end of 2002. These payment percentage estimates are extremely conservative because they assume that total losses associated with the year 1998 are all paid out after 10 years. In reality, the payment stream can continue over 20 years or more. 11 Lapse rates may be related to market risk and underlying economic conditions.
5
insurers face the risk that investments will yield a lower return than assumed in premium
pricing.
Predictability of loss payment timing varies by line of business, hence insurers
face the possibility that they may be required to liquidate assets at an inopportune time
(liquidity risk). Life insurers, especially, are exposed to liquidity risk in their life and
annuity contracts, since policyholders may have the option to cash in a policy (e.g., an
annuity). The liquidity risk may be related to market risk since policyholders may choose
to withdraw funds during adverse market conditions. The latter could be a significant
problem if withdrawals occur at the same time that markets freeze up.
Capital Requirements
Although pooling makes loss and benefit payments more predictable, they are by
no means known in advance with certainty. Therefore, regulation places significant
emphasis on the appropriate calculation of reserves. Further, insurers hold additional
capital (or surplus) to absorb the effects of larger than expected losses (underwriting risk)
and unexpected investment losses. Minimum amounts of capital are prescribed by
regulation and, in the U.S., are based on the risks of the specific insurer (i.e., capital
requirements are risk-based). Thus firms writing relatively riskier lines of business or
investing in relatively riskier investments are required to hold relatively larger capital, so
that the minimum amount of capital held is commensurate with each insurer’s risk. In
reality, most insurers hold capital amounts well above the minimum regulatory required
level.
Financial Distress and Guaranty Funds
Ultimate responsibility for U.S. insurer solvency rests with each state insurance
department and the state insurance Commissioner (sometimes also known as the
Administrator, Director or Superintendent of Insurance). State insurance departments are
assisted by the National Association of Insurance Commissioners (NAIC), whose
overriding objective is to assist state insurance regulators by offering financial, actuarial,
6
legal, computer, research, and economic expertise.12 Every state insurance department in
the U.S. is financially accredited. The purpose of the financial accreditation program is
for state insurance departments to meet minimum, baseline standards of solvency
regulation, especially with respect to regulation of multi-state insurers.13 It is partly
because of the accreditation program that it can be said that the U.S. has a national
system of state insurance regulation (NAIC, United States Insurance Financial Solvency
Framework, 2009).
In a competitive market such as in the U.S., insolvencies are not unexpected. In
theory regulation is designed to balance the benefit of reducing insolvencies from
increased regulation with the cost of increased regulation on the market. Table 1 contains
information on the number of insolvencies and insolvency rate (expressed as a percentage
of companies) for the years 1988 to 2008. The maximum number of insolvencies for life-
health (property-liability) insurers occurred in 1991 with 81 (60) insolvencies. The
average number of insolvencies (rate) was 21.3 (1.2%) for life-health insurers and 32.2
(1%) for property-liability insurers over the period. The low number of insolvencies and
impairment rates attest to the effectiveness of state insurance regulation and market
discipline in insurance.
Insurers that are seriously financially impaired are handled in one of two ways.
The insurer may be placed into receivership while the liabilities are “run-off.”14 That is,
as indicated above, loss payments under policies do not actually become due until some
point in the future (often years), so the receiver operates the insurer so as to pay off (or
run off) losses as they actually come due. Alternatively, for life-health insurance, the
business of the insolvent insurer may be sold to another insurer (with the help of
additional funds as explained below), and the policies are continued under the new
insurer. Thus, liquidation of assets at distressed prices usually does not occur in an
insurer insolvency nor are immediate payments/settlements to all policyholders made at
12 The NAIC is a voluntary organization of the chief insurance regulatory officials of the state insurance departments. 13 To be financially accredited, a state must demonstrate that it has met and continues to meet a wide range of legal, financial, functional and organizational standards. 14 An insolvent insurer is defined to be an insurer which is in receivership or liquidation.
7
that time.15 (An exception exists for life insurers. There is a danger that many
policyholders would surrender their (cash value) policies as an insurer becomes
financially distressed causing a liquidity problem.) The latter exception notwithstanding,
insolvent insurers typically have substantial assets on hand to cover liabilities when they
fail because losses are prepaid through premiums.16
In most countries, a safety net exists to provide protection for policyholders of
insolvent insurers in the form of guaranty funds. For example, each state in the U.S.
operates a guaranty fund under which solvent insurers are assessed each year to cover
shortfalls in loss payments for insolvent insurers, subject to the guaranty fund restrictions.
The restrictions consist of a limit on the maximum loss payable; and guaranty fund
coverage does not apply to all lines of business.17 Most guaranty funds are assessed on
an ex-post basis rather than being pre-funded by assessments.18
The payment from the guaranty fund each year is designed to cover the shortfall
in losses that are scheduled to be paid in that year only; that is, guaranty funds do not
make settlements with policyholders for all losses covered at the time of insolvency.
Instead guaranty funds are assessed as losses actually need to be paid.19 For life insurers
the insolvent insurer’s business may be sold to another insurer; in that case, the guaranty
fund is assessed an amount to make the sale attractive to the acquiring insurer.20
Guaranty fund payments sometimes are used to offset state premium tax payments the
assessed insurers would otherwise have to make to the state (usually 2-3% of premiums),
reducing this liability for insurers.21
15 Policyholder claim/benefit payments are typically frozen for a period of time, except for death and financial need. 16 For example, in a life insurer insolvency, the shortfall in assets relative to liabilities is typically in the 5 to 10% range, and very rarely can be as high as 25% (Galanis, 2009). 17 Small policyholders are typically protected by guaranty funds. Commercial insurance is covered also, however more than half of the states have a net worth restriction, such that if a company has net worth above some threshold (usually $25-50 million) they are excluded from coverage. In addition, workers compensation insurance is always covered, while a few lines such as title insurance and mortgage guaranty insurance are not covered. 18 New York is an exception. The rationale for ex post assessments is that, unlike the obligations of the FDIC, insurance payments under policies are spread over many years in the future as claims arise. 19 There is a cap on the amount of premiums an insurer can be assessed in an individual year, which varies by state. In life insurance, the cap is typically in the range of 2% of covered premiums (Galanis, 2009). 20In other words, guaranty funds replace policyholders’ coverage not policyholders’ cash. 21 A premium tax offset is more commonly allowed in some states for life insurance only, and offset availability varies by state.
8

This assessment system is designed to place minimal stress on solvent insurers
while protecting the policyholders of the insolvent insurer. But if necessary, guaranty
funds in the U.S. have the ability to borrow against future assessments in the event that
losses covered by the guaranty fund in any one year would place a financial stress on
solvent insurers. To date, in the U.S., guaranty funds (with their borrowing ability) have
successfully paid claims of insolvent insurers, including large insurers such as Reliance,
Executive Life, Confederation Life and Mutual Benefit Life. This is notable not only
because these insolvencies were large but because insolvencies tend to peak or cluster
together during certain periods so that guaranty fund payments to cover several
insolvencies at the same time have been required.
Table 1 provides statistics regarding guaranty fund assessments over the 20-year
period from 1988 to 2008. The total amount (annual average amount) paid from life-
health guaranty funds was approximately $6.5 billion ($312 million), and it was $11.7
billion ($555 million) for property-liability insurers. More importantly, the assessment
rate on premiums never exceeded 0.35% of total premiums assessed, a very low amount.
The guaranty fund system has stood up very well to impairments within the insurance
industry.22
Comparative Financial Statements
The insurance industry is segmented into life-health insurance and property-
liability insurance because the nature of the risks involved in each is different.23 Life-
health insurers may issue life insurance, annuities, deposit-type contracts and, of course,
health insurance. Except for health insurance, life-health insurance risks tend to be long-
term in nature, meaning that the policy exceeds a one year term (e.g., 10 year renewable
life insurance).24 Property-liability risks include property damage, theft, and liability and
are almost always one year or less in term.
22 In 2009 alone, the maximum assessment capacity of life-health insurers was estimated to be $8.8 billion. Of course, insolvencies that are much larger than this could have been financed because many claims of insolvent insurers actually need to be paid in the future, and assessments would continue until all claims are paid (Galanis, 2009). 23 The industry also consists of title, fraternal, and health-only insurance companies, although emphasis is placed here on life-health and property-liability insurers because of the large volume of business they transact. 24 The exception is one year term life insurance policies.
9
In this section, relative financial risks for these types of insurers are distinguished
by comparing the respective, aggregate balance sheets of these insurers. As an
illustration of how insurance differs from other financial institutions, the balance sheet
for commercial banks is reviewed also below.
Insurer Financial Statistics. U.S. industry aggregate balance sheet statistics for
life-health and property-liability insurers for 2007 are presented in Table 2. With respect
to total assets, Table 2 indicates that the life insurance industry is more than two times as
large as the property-liability insurance industry, with $3,150.5 billion in assets (without
separate accounts) for life-health compared to $1,551.3 billion for property-liability
insurance.25 This result is not surprising since most life insurance and annuity products
involve the accumulation of assets. As a percentage of GDP, insurance carriers and
related activities accounted for 2.4% of GDP in 2007.26,27
As expected for a financial intermediary, the bulk of assets are invested assets
(86% and 94% of total assets for property-liability and life-health insurers, respectively).
The total amounts invested in stocks and bonds are approximately equal for both types of
insurers (approximately 73%), although property liability insurers have proportionately
more invested assets in stocks than life insurers.28 Life insurers are more active in the
direct mortgage loan business (10 percent) than property-liability insurers, whose
investments are negligible. The longer term, asset accumulation aspect of life insurer
25 When separate accounts are included, the life insurance industry is more than three times larger than the property-liability insurance industry. Separate accounts include variable life contracts, variable annuities, modified guaranteed annuities, and modified guaranteed life insurance. They may also include some types of group contracts for pension and other employee benefit plans. Separate accounts can be used to accumulate funds which are intended to be used in the future to provide life insurance or to accumulate funds for settlement or dividend options. Separate accounts do not receive guaranty fund coverage; however, if a guaranteed minimum return is associated with a separate account product, then the general account of the insurer may be used to fulfill the guarantee. As the name suggests, separate account assets are held separately from all other life insurer assets. 26 It is sometimes tempting to compare total premium revenue to GDP to determine the importance of insurance in the economy. Such a comparison is incorrect. The bulk of premiums consist of expected loss/benefit payments, and losses/benefits are not “produced” by the insurer; rather they are exogenous events. Most of insurers’ premiums, typically, will be returned to policyholders in the form of loss/benefit payments. Instead, insurers produce services, and it is the estimated value of these services (the premium loading) which is included in GDP. 27 Before proceeding further it is important to realize that the percentages for asset and liability items for an individual insurer can vary considerably from that of the industry average. 28 CMBS and RMBS are included in the Bonds category of assets according to statutory accounting.
10

products explains why life-health insurers would be relatively more interested in a long-
term investment such as mortgages.
Table 3 contains statistics concerning the importance of life-health and property-
liability insurers in the economy as financial intermediaries.29 In terms of insurers’
importance in the capital markets, life-health insurers held 6.9% of all U.S. equities in
2007 while property-liability insurers held 1.1%, according to Table 3. Life-health
(property-liability) insurers held 17.6 (2.7)% of corporate and foreign bonds in the U.S.
economy in 2007. Property-liability insurers accounted for 14% of U.S. municipal
securities and loan holdings, while for life-health insurers the corresponding amount is
1.3% in 2007.
Thus, life insurers are relatively more important in the market for corporate and
foreign bonds, while property-liability insurers have more significant holdings in the U.S.
municipal securities and loan market. However, in assessing life insurer holdings it is
important to realize that these tend to be long-term because of the nature of life-health
insurer liabilities. Thus only a small fraction of the investment in corporate bonds would
become due (or turn over) in any given year and be available to meet the new credit
needs of corporations.30 That is, in a credit crunch affecting other financial institutions,
life insurers would have only the turnover in their corporate debt to reinvest each year as
well as the proceeds of new insurance policies issued.
It is interesting to note the interconnections via investments between banks and
securities firms. Historically, insurers have been attracted to bank bonds because the
issuers tend to have high credit quality, and their issues tend to be relatively long term.
Both attributes are desirable for life insurer portfolios. Banks also often issue
commercial paper, which is attractive to property-liability insurers. Banks have been
active in the issue of “hybrid” capital securities, which have in the past been attractive to
29 The statistics quoted include separate accounts for life insurers. 30 For example, if the average term of corporate bonds for life-health insurers is 25 years, then each year life-health insurers would have 1/25 of their portfolio turnover, and this amount would be available to invest in new corporate bonds or pay benefits. The latter is notable because even though life insurers have sizable investments in corporate debt, the amount invested in new corporate debt each year is much less than their total bond debt indicates. In contrast, banks have a shorter duration for their investments. If commercial banks have investments with average terms of 5 to 10 years, then 1/5 to 1/10 of their investments would pay off in any given year and be available to use for extending new credit or paying depositors.
11
insurers because they offered a relatively higher yield.31 Of the total U.S. corporate and
foreign bonds owned by U.S. insurers in 2008, 5.6% was invested in various types of
bank bonds, while less than 1% of corporate equities held by U.S. insurers were invested
in bank stocks. U.S. insurers invested a small proportion of their invested assets in the
bonds of securities firms (1.6%), and a negligible proportion in stocks of securities firms
(1%).32
Reinsurance recoverables represent amounts insurers have paid (or will pay) for
claims covered by reinsurance and for which the insurer will be indemnified by the
reinsurer. For both insurance sectors, reinsurance recoverables on losses are small,
ranging from approximately 2.3% in property-liability insurance to 0.1% in life insurance
when measured as a percent of assets. However, if difficulties exist in recovering
insurance, the capital of the insurer would be tapped to absorb the loss to the extent
reinsurer collateral was not available. Therefore, it is meaningful to compare reinsurance
recoverables against capital. As a percent of capital, reinsurance recoverables for
property-liability (life-health) insurers, represents 6.6% (1.4%) of capital. Hence, in total
for the industry, the credit risk posed by recovering these loss payments from reinsurers
appears to be manageable, everything else held equal.33
The largest liability item for both types of insurers is aggregate (or loss) reserves
which constitute 58% ($583.6/$1,014.1) of total liabilities for property-liability and 86%
($2,430/$2,821.8) for life-health insurers. Again, the larger percentage for life-health
insurers is accounted for by the fact that many life products involve accumulation of
assets, and the funds received by insurers not needed for current benefit payments and
expenses are added to policy reserves. Although not broken out separately in Table 2,
unearned premiums are a significant liability for property-liability insurers, accounting
31 Recently, insurers have been less active in this market because of uncertainty about their accounting treatment. 32 That is, approximately $119.5 billion of insurer investments were invested in bank bonds in 2008, and U.S. insurers held a total of $2,116.1 billion in U.S. corporate and foreign bonds. Approximately $0.122 billion of total U.S. insurers’ investments in equities ($1,161.0 billion) were held in bank stocks. The amount of U.S. insurers’ investment in U.S. securities firms’ bonds is $33,856.2 million, while the amount invested in securities firms’ stock is $746.9 million. The data regarding banks and securities firms were obtained directly from the NAIC. The remaining data were obtained from Insurance Information Institute, The Financial Services Fact Book, 2010. 33 The impact to capital from reinsurance recoverables may be somewhat understated. That is, if a large shock occurs in the reinsurance market, the same shock would probably have an impact on the primary insurance market and eat away at some insurer capital.
12
for approximately half of the amount included in All Other Liabilities for these
insurers.34 Borrowed money is a negligible liability for both types of insurers. Hence,
insurers do not have to worry about sources for continued borrowing to satisfy
policyholder obligations.
As indicated earlier, insurers mitigate risk through reinsurance transactions. In a
typical transaction with an authorized reinsurer,35 the ceding insurer transfers a
reinsurance premium to the reinsurer along with the accounting liability for the business
being ceded. In many cases, the reinsurer is an affiliate of the insurer, and reinsurance
among affiliates helps to diversify business among members of a group. Reinsurance
transactions with unauthorized reinsurers occur as well, but the liability associated with
this reinsurance is still carried as a liability on the books of the ceding company to the
extent that acceptable collateral is not held by, or in trust for, the ceding company as
security for the transferred liabilities. It is very difficult to obtain a precise measure of
the liabilities transferred to reinsurers through reinsurance transactions that are not
covered by collateral. However, a conservative (overstated) ball park figure for property-
liability insurance for 2008 is $660 billion.36 For life insurance, a conservative,
overstated ball park figure of outstanding reinsured liabilities (not covered by collateral)
is $210 billion for 2008.37
The relative amount of capital funding differs substantially between life-health
and property-liability insurers, with property-liability insurers relying more on capital
funding than life insurers. Equity capital accounts for approximately 35% of assets for
34 Unearned premiums refers to the portion of (prepaid) premiums for which coverage has not yet been provided. For example, if the premium for a one year policy is paid on July 1 of the year, then by December 31 of that year half of the premium would still be unearned and carried as a liability on the insurer’s balance sheet. 35In the U.S., an “authorized” reinsurer is one that is either licensed in the ceding insurer’s state of domicile to write the same type of business, an accredited reinsurer in the ceding insurer’s state of domicile, or is given regulatory equivalence by being licensed in a state with substantially similar credit for reinsurance laws and regulations through various specified means. 36The ball park estimate of total outstanding reinsurance liabilities is $776 billion, and this is offset by $116 billion in collateral to yield $660 billion for property-liability insurance. The data for property-liability and life-health insurers are from the aggregated Annual Statements of insurance legal entities filing to the NAIC Financial Data Repository on Reinsurance Ceded Schedule F, Parts 4 and 5 (property-liability insurance) and Schedule S, Parts 2 and 4 (life-health insurance). These figures can be materially overestimated due to double counting as a result of intercompany pooling arrangements within groups. 37 This amount consists of total outstanding reinsurance liabilities of $414 billion (ball park figure) less $204 billion in collateral, yielding $210 billion of net reinsurance liabilities outstanding.
13
property-liability insurers and 10.4% for life-health insurers. At least part of the
difference in leverage between life-health and property-liability insurance can be
explained by the fact that property-liability types of losses are more unpredictable than
the mortality and morbidity risks insured by life-health insurers.
Commercial Banking Financial Statistics. To better understand the relative
importance of insurance in the financial system and how it differs from other financial
institutions, the aggregate balance sheet for commercial banks is presented in Table 2
also. With respect to size, measured by assets, the commercial banking sector is more
than 7 times (3.5 times) larger than the property-liability (life-health) insurance sector. If
separate accounts are included, the commercial banking sector is 2 times larger than the
life-health insurance sector. When considering the combined assets of life-health and
property-liability insurers, the commercial banking industry is approximately 1.7 times
larger (2.4 times larger without separate accounts).38 For further comparison, the
securities industry had financial assets of $3,092 billion in 2007, which is on a par with
life insurers if separate accounts are excluded.39 In terms of GDP, the entire Finance and
Insurance Sector (including insurance, banks and securities firms) accounted for 7.9
percent of GDP in 2007 (Department of Commerce, Statistical Abstract of the U.S.).
The traditional business of banks is to make loans with demand deposit funds.
Hence the largest single asset of the commercial banking sector is loans, which account
for approximately 60 percent of assets. Investment in stocks, measured as a percentage
of assets, is on par with that of the property-liability insurance industry, while total
invested assets (measured as a percentage of assets) are on a par with life-health
insurers.40
Not surprisingly, (demand) deposits are the single largest liability item for
commercial banks, accounting for about 65 percent of assets. Commercial banks have
more borrowed money than insurers (approximately 10% of assets) and are more active
38 These figures do not include unregulated, non-banking affiliates and Special Investment Vehicles (SIVs) of commercial banks. 39 Securities firms such as Lehman Brothers and Bear Stearns were important security firms caught up in the current financial crisis because of their investments in RMBS and other structured securities, coupled with significant short-term funding. 40 Data were not available to determine banks’ investments in U.S. insurance companies.
14
in the federal funds purchasing and repo market (approximately 6.9% of assets). Thus
commercial banks are more dependent on borrowing than insurers and would have more
concerns about sources of credit financing during a crisis than insurers. Leverage,
measured as equity/total assets, is approximately the same for commercial banks and life-
health insurers (when separate accounts are excluded). Property-liability insurers have
substantially lower leverage.
Regarding relationships between insurers’ and other financial institutions, U.S.
insurers held approximately 9.4 percent of banks’ “other borrowed money” in 2008. This
may seem to be a surprisingly high figure; but, as noted above, borrowed money is not
the primary source of financing to banks (10% of liabilities). U.S. insurers held 14.1%
of securities firms’ outstanding corporate bond debt; however corporate bonds represent
only 11.2 percent of securities firms’ financings (liabilities). U.S. insurers held a
negligible portion of securities firms’ and banks’ stock outstanding.
Systemic Risk and Insurance In this section, systemic risk for purposes of this research is defined. Primary
indicators or characteristics of systemic risk are reviewed, and secondary indicators that
appear in some definitions of systemic risk or were precipitating factors in past systemic
crises are discussed. Finally, the insurance sector is assessed with respect to these
indicators to determine the potential of insurance to instigate a systemic crisis.
Note that instigating or causing a systemic crisis for purposes of this research is
not the same as being susceptible to the crisis. To instigate a systemic crisis the shock or
event must first emanate from the insurance sector due to the specific activity of insurers.
And it is not just a matter of semantics whether insurers are instigators or victims,
because regulation designed to pre-empt a systemic crisis would depend on whether
insurers are the instigators or not. That is, if insurers are instigators of systemic risk,
then more direct regulation of insurers would be called for. On the other hand, if insurers
are susceptible to loss because of their exposure to shocks that affect markets and thus
their investments, then more direct regulation of the market overall would be desirable.
15
Definition of Systemic Risk and Systemic Risk Indicators The financial literature is replete with definitions of systemic risk. Some construe
the term very broadly to include any disruption within one financial sector (life-health
insurance, property-liability insurance, securities or banking) that has any spillover effect
on the general economy. A narrower construct of the term encompasses a disruption
across all financial sectors (i.e., the financial system) and into the general economy. The
latter perspective is used in this study.
For purposes of this paper, systemic risk is defined as the risk of adverse
consequences that reverberate across a large segment of the financial sector as a whole,
posing a potentially grave effect on the economy. Systemic risk may arise from
interconnectedness among financial institutions that cascade throughout the financial
sector (akin to a domino effect) and/or from a significant common shock to which many
financial firms have a large exposure (Helwege 2009).41 Traditionally, systemic risk has
been considered important because it results in increases in the cost of capital or
reductions in its availability, while being frequently accompanied by asset price
volatility. The latter have spillover effects on the economy by affecting demand and/or
supply of goods for an extended period (Financial Stability Board, 2009).
Four general characteristics or indicators appear repeatedly in definitions of
systemic risk across the literature. These indicators are contagion (or
correlation/interconnectedness) in results across financial institutions; substitutability of
products; concentration of risk; and infrastructure.42 A number of other factors have
been shown to exacerbate the effect of a systemic event, once the event occurs, including
size (“too big to fail”), leverage, and liquidity. These risk factors are also associated with
systemic risk, as discussed below.
41 The shock may emanate from mispricing of assets (such as in an asset bubble) or from unexpected exogenous events (such as changes in oil prices). Note that not all asset bubbles are associated with systemic risk (e.g., the dot com bubble). 42 The Financial Stability Board (FSB) considers size (of exposures, volumes of transactions or assets managed), substitutability, and interconnectedness as the key criteria in identifying systemically important institutions (Financial Stability Board, 2009). The International Monetary Fund (IMF) considers size, interconnectedness, leverage, and (risky) funding structure in assessing the systemic importance of institutions (International Monetary Fund, 2009).
16
Primary Indicators of Systemic Risk Contagion/Correlation/Interconnectedness. The classic example of
contagion/correlation/interconnectedness occurs in the banking sector as a “run on the
bank” that cascades through the system. In principle, bank runs can occur in a widespread
fashion if depositors lose confidence in the overall banking system, as occurred in the
Great Depression. Bank runs can also occur because of the interconnectedness of banks.
That is, bank runs can unfold when bank customers (e.g., depositors) recognize that a
bank may be weak and rush to withdraw their funds. Since banks hold mostly long-term,
illiquid assets (loans), only a fraction of depositor funds are on hand at any particular
time to meet withdrawal demand. Thus the bank cannot readily meet all of the depositor
demands and ultimately closes. In the meantime, many of the dealings of most banks are
intertwined (or interconnected), with banks lending and borrowing extensively from each
other. Thus the closure of one bank (say a large bank) may have negative repercussions
on other banks which have loaned a substantial amount of money to the failed bank,
causing them financial distress. These other banks then may be subject to bank runs, and
so the saga continues with bank failures cascading through the system. Since banks are
connected internationally with each other, the cascade can extend world-wide in
principle. Note that otherwise sound banks can get caught up in both sorts of bank runs,
so that their solvency is in peril.
In order for the second bank run scenario to develop, the first bank to fail must be
very large, and the other banks which have loaned money to the first bank must have a
large investment in the first bank or somehow depend greatly on that bank. For the
banking crisis to continue to spread, many banks must have significant portions of their
assets tied up at other banks. But the latter defies the principles of diversification in
investments that underlies good financial practice. Nevertheless, this scenario provides
justification for a governmental policy in which banks that are “too big to fail (TBTF)”
receive governmental intervention. That is, the presumption is that the cascade or
domino effect can be forestalled if the first bank’s problems can be solved (by pumping
money into that bank).
But, the presence of federal deposit insurance from the FDIC should prevent runs
on the bank by depositors in the first place (as long as they maintain insured balances).
17
Thus, some question exists as to whether the scenario described above is actually
reasonable. According to Kaufman and Scott (2003, pp. 376 and 379),
There is little if any empirical evidence that the insolvency of an individual bank
directly causes the insolvency of economically solvent banks or that bank
depositors run on economically solvent banks very often or that, when they do,
they drive these banks into insolvency…Banks fail because of exposure to a
common shock such as a depression in agriculture, real estate or oil prices, not
because of direct spillover from other banks without themselves being exposed to
the shock…Sudden unexpected bad news about a particular bank or group of
banks appears to ignite a round of reexamination of other banks by market
participants to determine their risk exposures. Although deposit flows and stock
values of a large group of banks may be affected adversely immediately, the
sorting out process appears to occur relatively quickly.
In the events surrounding AIG Financial Products, the precipitating event was the
bursting of the housing price bubble. This exposed the guarantees written by AIG
Financial Products to loss where no loss had been expected previously.43 But the
precipitating event did not apply just to AIG Financial Products. Many banks and life
insurers were affected by this shock as well, requiring the government to intervene. So
the main point is that a shock occurs and this shock may lead to the appearance of
contagion among financial institutions, if they hold significant amounts of the assets
being shocked.44 Finally, in the current crisis, instead of a traditional depositor-led “bank
run,” the inter-bank loan market dried up. This was the result of widespread banking
investments in the housing market coupled with a lack of transparency, so counterparties
could not assess the solvency of those they were doing business with.
43 Goldman Sachs claims that is was well-hedged against a collapse of AIG, supporting the argument that at least some firms doing business with AIG protected themselves from counterparty risk. 44 Some contagion effect or “bank run” effects can be attributable to the rescinding of securities lending programs among financial institutions in the current crisis. That is, as ratings of lending financial institutions fell, security borrowers began to demand their cash collateral back. The securities borrowers would not have been insured by the FDIC, exposing them to loss from securities lending. Note that only financial institutions heavily involved in securities lending would be affected by the bank run rather than all financial institutions.
18
Also, in the U.S. at least, companies can access the capital markets directly, rather
than relying on funding through banks or other financial intermediaries, reducing the
effect of bank failures on these investors. This makes well-functioning capital markets
more important and contagion within capital markets more problematic. Bear Stearns is
a case in point, as it experienced a “bank run” after a market shock threatened its
financial viability. In addition, the collapse of Lehman Brothers, a major writer of
commercial paper, sent shock waves through that market and contributed to the freezing
of credit markets around the time of its bankruptcy.45
Substitutability. Problems can occur when the supply of a vital product is
removed from the market.46 If other market participants cannot step in quickly with a
substitute product, then market disruption may occur that spills over into the general
economy. Two characteristics of the market that are likely to have a bearing on whether
substitutability is a problem are ease of entry into the part of the market that is affected
and the size and concentration of the product market. Ease of entry can help to minimize
the amount of market disruption, while the failure of one firm that dominates a product
market can lock up or have severe repercussions on the market, everything else held
equal.
Concentration. Concentration may be related to substitutability, if concentration
in the product market means that an important product becomes scarce as a result of
insolvency of the concentrated firm. However, concentration encompasses more than
products. Concentration in investments – either by type of investment or geographic
location of the investment -- may have spillover effects if the investment or geographic
area becomes problematic. For example in the current crisis, concentration of
investments in subprime mortgages (either directly or through securitizations) led to
45 Lehman was a big investor in subprime and prime mortgages. Although it had been reporting losses on these investments, the market feared that Lehman Brothers had not come clean about its problems in the time leading up to its bankruptcy, and uncertainty concerning its transactions with banks and hedge funds only deepened the “crisis in confidence” Lehman’s was going through. 46 This might occur, for example, due to widespread insolvencies of providers or the insolvency of a few large suppliers that dominate the market.
19
extreme losses among many financial institutions, significantly decreasing the amount of
credit available to the economy overall.
Infrastructure. Infrastructure refers to critical resources required for an activity.
Financial distress at institutions that are part of the financial or payment infrastructure
can have spillover effects on the general economy.47 For example, banks are part of the
payment system so that large-scale bank failures can have a significant effect on the
payment system and the economy.
Risk Factors for Systemic Risk Leverage. Leverage is typically defined in terms of the relative amount of a
firm’s debt versus equity. Leverage can also be created through options, through buying
securities on margin or through some financial instruments. Leverage is related to
systemic risk because when a shock or run on the bank hits a financial firm, the ability to
absorb its effect is determined by the amount of equity it has relative to debt. Firms with
higher leverage have relatively less equity to absorb shocks and, thus, are more likely to
experience financial distress. This financial distress, in turn, can affect counterparties
(who may also be highly leveraged). More highly leveraged firms are also less likely to
withstand the market volatility associated with systemic events.
Size. The size of the firm helps to determine whether it is “too big to fail.” In
fact, the term “too big to fail” came into existence from the bailout of Continental Illinois
Bank and Trust Company of Chicago in 1984. Continental Illinois faced bank runs from
its wholesale depositors, prompting the FDIC to guarantee all liabilities of Continental
Illinois through a direct infusion of capital.48 In general, size may be important in a
failure if it is associated with large spillover effects. At the time of its failure,
47 Being part of the infrastructure also has a bearing on the degree of substitutability of the institution’s services. 48 William Isaac, Head of the FDIC in the 1980s, was quoted in Robert Trigaux, “Isaac Reassesses Continental Bailout,” American Banker, p. 6, July 31, 1989, as saying, “I wonder if we might not be better off today if we had decided to let Continental fall, because many of the large banks that I was concerned might fail have failed anyway. And they probably are costing the FDIC more money by being allowed to continue several more years than they would have had they failed in 1984.”
20
Continental Illinois was the seventh largest bank in the U.S. That is, it is reasonably
possible that a large financial institution may be engaged in significant, large transactions
with other financial institutions through interbank activities and securities lending, so that
potential spillover effects into the general economy could occur with its failure.
Of course, a lesson learned from the current financial crisis is that size measured
by assets may not capture the impact an institution can have on the market or economy.
The now defunct Financial Products division of AIG wrote hundreds of billions of dollars
of coverage with relatively little capitalization, forcing a bailout of AIG’s holding
company by the U.S. government costing billions of dollars. For this reason, size is not
included with the primary factors. Note, too that the term “too big to fail” is being
replaced with “Systemically Important Financial Institution” (SIFI), in recognition that
size is not an adequate proxy for spillover effects.
Liquidity. In the event of a run on the bank or an unexpected demand for cash to
settle contracts (e.g., caused by falling asset prices or a rating downgrade), the asset
liquidity of the institution is important. Liquidation of relatively illiquid assets (such as
long-term assets) at an inopportune time can create losses for a financial institution and
even failure. Securities lending is a case in point in the most recent financial crisis. As
the market dropped, counterparties that had provided collateral in exchange for the ability
to hold loaned securities from other institutions began to return the loaned securities and
demand the return of their cash collateral. In the meantime the cash collateral from these
securities lending transactions had been invested in other assets by the lender; and these
alternative assets had fallen in value, in many cases quite significantly. Typically the
lender would sell these investments to meet the cash collateral demands, but the prospect
of significant losses prevented this activity. This created a liquidity problem for the
security lender.
If many firms experience liquidity problems at the same time, then asset prices in
the capital markets can be (further) affected adversely if massive sales of assets are
required to meet claims. This in turn can affect the investment values of otherwise
solvent firms, potentially placing them in financial distress.
21
Regulation and Government Policy. As indicated previously, government policy
in the form of the FDIC has a large bearing on whether depositor-led bank runs occur.
But the elimination of bank runs comes at a cost. That is, the presence of federal deposit
insurance removes market discipline; demand depositors do not have the incentive to
monitor bank activity for riskiness. And bank deposit insurance is frequently underpriced
for banks, creating a moral hazard problem. That is, if banks engage in risky activity,
they are not penalized through higher deposit insurance premiums. They therefore have
an incentive to engage in risky activity, even potentially systemically risky activity.
Regulation played a role in the attractiveness of AIG Financial Products to the
banks that purchased CDSs from it. That is, these (mostly European) banks were
engaging in regulatory arbitrage; purchase of CDSs from AIG Financial Products reduced
capital requirements.49 The possibility exists that future forms of regulatory arbitrage
may play a comparable role in future systemic crises.
With respect to regulation and the current U.S. crisis, Harrington (2009, p. 800)
notes,
Banking regulation permitted and probably encouraged high leverage, aggressive
investment strategies, inadequate capital requirements for risky loans and
securitizations, and complex off-balance sheet vehicles, often financed by
commercial paper, all taking place within the framework of government deposit
insurance and TBTF policy.”
Further, regulation that may benefit the solvency of the regulated financial
institution can exacerbate a crisis. For example, an increase in capital requirements can
occur in times of financial distress (i.e., capital requirements can be pro-cyclical). Thus,
at a time when credit is most needed in an economy, financial institutions would be
forced to hold more capital, reducing the amount of funds available to invest or loan.
49 This occurred because Basel I was in effect. Under Basel II, this form of regulatory arbitrage would no longer be attractive.
22
Other Factors. A number of other factors have historically been shown to be
related to systemic risk. For example, if incentive compensation does not take risk of the
activity into account (as was the case with securitized mortgage loans), then an incentive
is provided to engage in risky activities with no repercussions. Accounting rules, too, can
influence firm behavior if the firm believes that the market responds to accounting
information reported. For example, if accounting rules do not require recognition of the
risk of some activities, then there is an incentive to engage in these activities to improve
apparent accounting performance such as reported income.
Systemic Risk in U.S. Insurance
In this section systemic risk in U.S. insurance is evaluated. The purpose is to
determine whether or to what extent insurers can instigate a systemic event. The
discussion proceeds by assessing the impact of the factors discussed above with respect
to insurance.
Insurance Contagion/Correlation/Interconnectedness. As indicated
previously, a run on the bank by (insured) depositors is unlikely to lead to a systemic
crisis. Similarly, if a run on an insurer occurred, there would likely be no significant
spillover effects to other financial institutions either within or outside of the insurance
sector.50 For example, as indicated earlier, U.S. life insurers in total held 9.4 and 14.1
percent of banks’ and securities firms’ other borrowed money and corporate bonds,
respectively, in 2008. But other borrowed money and corporate bonds for banks and
securities firms, respectively, are not a significant source of financing for these firms
(10% and 11.2%, respectively).51 And any one insurer would hold only a fraction of
50 Under stress testing conducted by the National Organization of Life and Health Insurance Guaranty Associations (NOLHGA), assessment capacity of life-health guaranty funds in 2009 alone was large enough to cover several nationally significant life insurer insolvencies in that year by selling the insolvent insurer’s policies to other insurers. That is, the assessment capacity would have been sufficient to make the sale of the insolvent insurers’ policies attractive to other insurers. No future assessments for these 2009 insolvencies would have been needed. 51 Thus the amount that banks depended on insurer holdings of other borrowed money in total in 2008 was 0.094*0.10= .0094 or less than 1 percent. Similarly, the total amount that securities firms relied on insurer financing in 2008 was 0.141*0.112=.016 or 1.6 percent.
23
these financial institutions’ bonds. So if life insurers were required to cash in bank and
securities firms’ related investments, it should not significantly affect their market value
(and cost of capital).52 It is true that bank affiliates are counterparties on derivatives
transactions. However, U.S. regulated insurers usually are not sellers of protection, and
insurers’ exposure to derivatives tends to be rather limited.53 There may be some
disruption in the banking sector if the bank affiliates covered their side of the derivatives
trades; but it is unlikely to be a cascading effect due to the limited exposure.54
A source of potential contagion/interconnectedness/correlation in the insurance
industry that is frequently mentioned is reinsurance. In particular, the fear is that the
insolvency of several reinsurers would set off a cascade of losses among primary (ceding)
insurers. However, as indicated earlier, reinsurance recoverables for U.S. property-
liability (life-health) insurers is only 6.6% (1.4%) of total capital. The liabilities
transferred to reinsurers (via reinsurance ceded) are much larger. A very rough gauge of
the effect on the property-liability insurance industry from widespread reinsurer failures
can be made by comparing estimated reinsured liabilities outstanding and the capital of
the industry. For example, if it is assumed that 20% of all (non-collateralized) reinsured
liabilities outstanding became uncollectible due to reinsurer failures, this would deplete
approximately 28 percent of equity (high-end, ball park figure) in the property-liability
insurance industry.55 For life-health insurers, if 20% of all (non-collateralized) reinsured
liabilities became uncollectible, this would deplete approximately 16% of capital,
52 Further, even if life insurer investment sales of financial institution’s debt or stock did affect price (and thereby cost of capital), banks do not go into the market to sell new instruments regularly; rather their financing needs are staggered. And banks tend to wait until markets are favorable before issuing new securities. 53 The Financial Products division of AIG was a net seller of protection, but this division was not an insurance company nor was it regulated by U.S. insurance regulators. 54 Note that insurers are more exposed to bank insolvencies than banks to insurer insolvencies. Major bank insolvencies would affect the value of insurers’ investments (at least to some extent), and banks may not be able to cover their side of derivatives transactions. Further, insurers rely on banks for many services – e.g., handling cash, custodial arrangements for securities, clearinghouse arrangements and securities lending arrangements. The high volume transactional nature of insurers’ relationships with banks means that insurers could experience service disruptions from major bank failures. 55 The 28% figure is found first by finding 20% of (non-collateralized) outstanding reinsured liabilities (0.2*$660 billion=$132 billion) and dividing the result by equity of property-liability insurers in 2008 ($132/$475.2 = 0.28). Source of equity data: A.M. Best Co., Best’s Aggregates & Averages – Property-Liability, 2009. Note that it is unlikely that all reinsurers would become insolvent at the same time.
24
keeping in mind that this is an overstated, ball park figure.56 These estimates of capital
depletion represent a substantial depletion of capital in the insurance industry, but the
depletion should be sustainable by the industry as a whole, especially since most insurers
hold more than the prescribed minimum capital amounts.
To mitigate reinsurance credit risk, primary insurers engage in due diligence to
determine the credit-worthiness of the reinsurer. Furthermore, insurers diversify the
reinsurance they cede among several reinsurers to insulate themselves from the failure of
any one reinsurer.57 Primary insurers may protect themselves from slow paying or
insolvent reinsurers by ceding and assuming reinsurance from the same reinsurer as well.
Then if trouble arises, the ceding company can net (or offset) together the payments owed
to the reinsurer with reinsurance payments due from the reinsurer. Finally, reinsurance
failures have not been a major factor in insurer insolvencies. Reinsurance failures were
the triggering event in 2% of life-health insurance insolvencies and 3.7% in property-
liability insurance failures over the period 1969-2008 (A. M. Best Co, 2009a, A. M. Best
Co., 2009b).58
A study by the G30 examined the effect of failures of reinsurers equal to 20% of
the global reinsurance market and concluded that there would be no systemic effect from
these bankruptcies (see Group of Thirty, 2006). The latter study considered the impact
on the primary insurance industry from unpaid reinsurer liabilities; the size of the
holdings of the reinsurance industry in the capital markets; and the relationship between
banks and reinsurers.59,60 The main negative effects posited from the reinsurer failures
56The 16% figure is found first by finding 20% of (non-collateralized) outstanding reinsured liabilities (0.2*$210 billion=$42 billion) and dividing the result by equity of life-health insurers in 2008 ($42/$258 = 0.163). Source of equity data: A.M. Best Co., Best’s Aggregates & Averages – Life-Health, 2009. 57 Over the years, this has become a little more difficult due to consolidation in the industry. 58 For life-health insurers, the most common triggering events for insolvency were inadequate pricing (27.7%), affiliate problems (19.3%) and rapid growth (14.7%) (A.M. Best Co, 2009b). For property-liability insurers, the most common triggering events were deficient loss reserves/inadequate pricing (38.1%) and rapid growth (14.3%) (A. M. Best Co., 2009a). It is not surprising to see that factors related to underwriting risk, the main business of insurers, are associated with the most failures. 59 A cautionary note should be made about the use of rating triggers in the reinsurance market. A reinsurance policy with a rating trigger allows the primary company to cancel the policy if the reinsurer experiences a rating downgrade below a threshold indicated in the policy. Triggering of this rating clause would likely place the reinsurer in runoff when it was already experiencing financial difficulty. Because of this potential, large, well capitalized reinsurers increasingly are refraining from writing policies with a ratings trigger clause. However, the reinsurance policies of small, less well capitalized reinsurers may still contain a rating trigger in their policies.
25
studied were (1) that primary insurance might become more expensive (if some primary
insurers failed) because it takes time to form an insurer and due to heavy regulation it is
difficult to form an insurer and (2) the price of reinsurance might rise. Both effects are
likely to be temporary, however. New reinsurers can be formed relatively quickly in
offshore locations such as Bermuda, restoring any capacity lost due to other reinsurer
failures. In another study of the reinsurance sector by Swiss Re, reinsurance is shown not
to be systemically risky (see Swiss Re, 2003).
In some parts of the world, insurance is linked directly to banking through cross-
holdings of bank and insurance stock and/or insurer purchase of bank subordinated debt.
Thus, theoretically a spiral might develop if insurers invest a significant fraction of assets
in bank debt, the cross holdings between banks and insurers is widespread through the
market and the cross holdings are significant in dollar amount. Then, a shock hitting
insurers could cause the stock price of the insurers to fall, leading to a decline in the
assets of the cross holding banks. The decline in the banks’ stock price would lead to a
further decline in the value of the insurers’ investment portfolios, since insurers hold the
banks’ stock (and possibly debt) as a significant asset. In the meantime, the declines in
the market value of the banks’ equity and subordinated debt would raise the cost of
capital to banks. These events could continue to reinforce each other or spiral through
the banking and insurance markets creating systemic risk. The risk of this occurring in
the U.S. is minimal, as insurers do not hold a large enough amount of bank stock or bank
debt to be able to influence their prices.61 However the scenario described above is
suggested as a possibility under Solvency II in Europe (see European Central Bank, 2007
pp. 14-15).
60 A retrocession market exists in reinsurance in which reinsurers sell off some of the business they have assumed (bought) to other reinsurers. Some have likened the retrocession market to interbank lending and borrowing in the banking industry. As such it is sometimes thought to be a transmission mechanism for contagion and systemic risk within the reinsurance industry. But unlike mortgage backed securities leading up to the recent crisis, retroceders still retain part of the risk (to reduce adverse selection). Regardless of the amount of retrocession activity that occurs, reinsurance recoverable to the primary insurer remains the relevant metric for determining the impact of this aspect of reinsurance on the primary industry (and this is small). And even if a spiral developed in the retrocession market, it would be unlikely to cause most of the reinsurance industry to become insolvent. As indicated above, even if 20% of U.S. reinsured liabilities became uncollectible, this could be tolerated within the U.S. insurance industry. 61 And, as indicated previously, assets of insolvent insurers are not all liquidated at the time of insolvency.
26
Another theoretical possibility for contagion in insurance is with respect to losses.
Most insurer loss exposures are idiosyncratic, uncorrelated events, so contagion is not an
issue. However, some losses may be correlated; for example, adverse rulings in court
cases can increase an insurer’s liability retrospectively (e.g., environmental impairment
liability).62 During the 1980s, a liability crisis occurred due to adverse rulings in various
liability-related cases. Catastrophes, such as hurricanes, are another type of loss that is
correlated. These risks can be mitigated through reinsurance and, increasingly for
catastrophes, by insurance-linked securitization (e.g., catastrophe bonds). Finally, it is
notable that even with correlation in losses, credit markets were not frozen nor were there
major spillover effects into the general economy from this correlation.
In conclusion, the risk of contagion spreading from the traditional insurance
market to other financial sectors and ultimately the overall economy is negligible.
However, insurers, because they are financial intermediaries, are subject to the same asset
shocks as other financial institutions, and the spreading of the shock across the industry
may have the appearance of contagion. But this is not the same as instigating a systemic
crisis; instead some other shock or event is required in this situation, and insurers are
victims of this shock as are other financial institutions.
Substitutability. Some types of liability insurance are required by law (such as
auto insurance or workers’ compensation in some states), and there is no substitute
possible for the insurance policy in most cases. (The exception concerns asset
accumulation products such as Guaranteed Investment Contracts (GICs) and other
investment type products that are offered by banks and life-health insurers.) Hence the
complete lack of some types of coverage has the ability to severely impact the amount of
economic activity that occurs.
A major, lengthy disruption is unlikely to occur, however, due to the ease in
formation of reinsurers in offshore locations (such as Bermuda) to provide capacity in the
62 In other words, insurers may find themselves liable for losses that they never intended to cover or, due to social inflation, losses on a major block of business may turn out to be higher than anticipated.
27

market63 and the existence of surplus lines insurance. That is, new reinsurance
capital/capacity can quickly be raised to provide coverage where supply is lacking. A
case in point is the formation of significant, new property catastrophe reinsurers after
Hurricanes Andrew and Iniki reduced capacity for property catastrophe insurance in the
U.S. in 1992. In addition, if some particular type of insurance is unavailable in a state
then a surplus lines insurer can come into the market to fill the void. Surplus lines
insurers are insurers that are not licensed to operate in the state but are allowed to offer
coverage in the state because of a shortage of capacity for some type of insurance.
The flexible supply of capacity in insurance contrasts with the situation in
banking. Banks don’t have the equivalent of reinsurance or surplus lines; rather capital
enters the industry through existing banks or the formation of new banks. Lack of
transparency in banking investment can hinder capital entry through existing banks in
crisis periods,64 and the process of obtaining a new bank charter and associated FDIC
approval can be a lengthy one.
It is true that some types of insurance may become unavailable at least during
some periods of time. For example, after 9/11 there was a shortage of most types of
commercial property and liability coverages, requiring the federal government to
intervene with the Terrorism Risk Insurance Act (TRIA). The reason for the shortage in
insurance capacity is that insurers assessed terrorism risk as uninsurable.65 Thus 9/11
was a shock for parts of the insurance market. Insurers did not instigate the shock (the
terrorist attacks), but the insurance market was severely affected by it.
Nevertheless, some associate the withdrawal of capacity after 9/11 and in other
similar situations as an indication that insurance is systemically risky. It is difficult to
understand how failing to underwrite a type of risk that could destabilize the insurance
industry (because it does not meet the conditions for insurance) would mean that
63 The reinsurer can assume (buy) insurance from a primary insurer who might otherwise not offer the coverage. In this case, the primary (ceding) company would still retain some fraction of the loss to avoid agency conflicts. 64 For example, investors would not be willing to place their money in banks in which the value of their investments (e.g., in RMBS and CMBS) is uncertain. 65 Insurers did not feel they could adequately evaluate and cover the risk that they were expected to underwrite. In other words, the existence of insurance is premised on the notion that losses are predictable and that the insurer has adequate capital to absorb any adverse losses that may develop. Terrorism risk shortly after 9/11 did not meet these requirements. Thus terrorism losses for commercial businesses became uninsurable.
28
insurance is systemically risky. In fact, by not underwriting such risks, solvency in the
industry is enhanced, reducing any systemic risk that might otherwise be present in the
industry.
In conclusion, because capital can flow freely into the insurance market,
substitutability risk is not considered to be significant for insurers.
Concentration. In insurance, concentration can primarily occur in types of
investment, types of lines written, and geographic location of the risks insured. Insurers’
investments tend to be conservative in nature; and to the extent needed insurers match the
maturity of assets with liabilities (asset-liability management). Asset-liability
management (ALM) is considered by regulators (e.g., the actuarial opinion addresses
ALM). To manage credit and market risk, insurers invest in a diversified portfolio of
credit instruments and equities; in fact regulations require diversification, and regulation
places limits on the type and size of investments that insurers can make. Insurers invest
in relatively liquid assets, however this can vary substantially by the lines of business the
insurer writes. Nevertheless, insurers, especially life insurers, were caught up in the
financial crisis in their role as financial intermediaries. That is, as noted previously,
insurers are prone to market risk.66
As an industry, whether property-liability or life-health, insurance is concentrated
in a relatively small number of groups.67 For example, in 2007, in property-liability
insurance the top 4 (10) groups accounted for approximately 29 (50)% of industry
premiums written, while the top 4 (10) life-health insurer groups accounted for
approximately 24 (45)% of industry premiums written. The top group in life-health
(property-liability) insurance accounted for approximately 7.1% (11)% of total premiums
in 2007.68 As a result, nationally significant insurers are reviewed every quarter by the
National Association of Insurance Commissioners (NAIC), and those that appear to be
66 The insurance industry has received very little funds from the Troubled Asset Relief Program as compared to banks. To date, with the obvious exception of AIG, only two insurer groups have received government funds. Hartford Financial Services received $3.4 billion, and Lincoln National Corporation received $950 million in funds. 67 An insurance group is a collection of firms, mostly insurers, under common ownership. 68 The source of these data is the NAIC. In contrast, the top 4 (10) reinsurers of U.S. property-liability business wrote 46 (82)% of premiums in 2007 (A.M. Best Co., Best’s Aggregates & Averages – Property Liability Edition, 2008).
29
performing poorly are prioritized for detailed analysis by a group of experienced,
seasoned financial regulators (i.e., the Financial Analysis Working Group (FAWG)).
But in fact it is misleading to assess concentration purely on group statistics.
Insurance entities (companies) are regulated at the state level. And if one or more
companies in a group exhibit signs of financial distress, state regulators act to “ring-
fence” the assets of the remaining insurers in the group. This protects the other insurers
in the group from the spread of financial distress. Thus, while the holding company for
AIG and AIG Financial Products are important in understanding the government bailout
of AIG, no insurer in the AIG group has become insolvent due to this ring-fencing
behavior.
On a company, or legal entity, basis, the top 4 (10) insurance companies
accounted for approximately 16-18% (28-31%) of net premiums written, and the top
company in life-health (property-liability) accounted for approximately 5.2 (7.1)% of net
premiums written in 2007. Further, there is diversity in the top insurance companies
writing different lines of business within the life-health and property-liability insurance
industry.69 Thus the industry is considerably less concentrated than it might seem at first.
In conclusion, the insurance industry may be somewhat concentrated as far as
susceptibility to concentration risk is concerned.70 As noted earlier, disruptions in the
U.S. product market for some type of insurance would likely be mitigated through
reinsurance and/or surplus lines.
Leverage. Property-liability insurers are much less highly leveraged than either
life-health insurers or banks and as a result would be better able to withstand a systemic
shock, everything else held constant. Leverage for life-health insurers is on a par with
commercial banks (when separate accounts are excluded), as noted earlier, and the effect
of a systemic shock on these institutions should be comparable, based on leverage alone.
69 This diversity exists even at the group level. The top writers in any given line are not the same across lines of insurance. 70 Australia learned this lesson for home builder’s warranty (with the HIH failure) and for medical indemnity insurance with the near failure of United Medical Protection.
30
On balance, then, life-health insurers would be much more susceptible to a
systemic event than property-liability insurers. Because life-health insurers are so highly
leveraged, their ability to sustain a large market shock may be limited.
Size. In 2007, the largest life-health (property-liability) insurance group had $457
($143) billion in assets.71 But as indicated previously, it may be more relevant to look at
the size of companies, since it is companies rather than groups that become insolvent.
The largest life-health (property-liability) insurance company, in 2007, had $297 ($104.8)
billion, representing 5.9 (6.8) % of industry assets.72
Compared to total credit debt outstanding, the largest life-health (property-
liability) insurance group had assets equal to 0.9 (0.3)% of total credit market debt
outstanding in 2007.73 On a company basis, the largest life-health (property-liability)
insurance company had assets equal to 0.6 (0.2)% of total credit market debt outstanding
in 2007. Even if one looks only at corporate credit market debt, the largest life-health
(property-liability) insurance group had assets equal to 3.3 (1.0)% of total corporate
credit market debt outstanding; of course the percentages for the largest insurance
companies are even smaller. (Keep in mind, also, that an insurer’s assets are not 100%
invested in corporate credit market debt.)
Thus, the insolvency of one of the largest insurers would not have a significant
impact on credit markets in terms of credit market debt outstanding. Further, as
explained previously, when an insurer becomes insolvent, all assets of the insurer are not
liquidated at that time. Rather it takes many years before all loss/benefit payments are
made to policyholders. Therefore the insolvent insurer can continue to hold considerable
corporate credit market debt until loss payments are due, so that the value of the bonds
should not decline significantly in value due to forced sales of these assets nor should the
cost of capital increase significantly to the bond issuer at the time of insolvency.
71 The largest life-health insurer group was Metropolitan Life, and the largest property-liability insurer group was Berkshire Hathaway in 2007. 72 The largest life-health (property-liability) insurance company in 2007 was Metropolitan Life Insurance Company (State Farm Mutual Auto Insurance Company). These data were obtained directly from the NAIC. 73 These data are from the Statistical Abstract of the U.S., Flow of Funds Accounts – Credit Market Debt Outstanding.
31
Therefore, size is not considered likely to be an issue with respect to any insurer
systemic risk in the U.S.
Liquidity. Potential liquidity problems caused by a run on an insurer vary by
industry segment. Liquidity problems caused by a run on a property-liability insurer by
policyholders are unlikely. First, property-liability insurers provide coverage for
exogenous events such as property damage and liability, thus policyholders cannot
withdraw funds for these on demand; the (random) event must occur first. Policyholders
are entitled to a return of premiums for coverage not yet provided if they cancel their
policies. In this case the insurer merely returns these (prepaid) amounts to policyholders,
and, as noted previously, these funds account for approximately 14 percent of all assets
for property-liability insurers.74 But U.S. property-liability insurers typically hold very
liquid assets (such as short-term US Treasury bonds) and customers often don’t want to
be uninsured, so payment for cancelled policies should not present a serious problem.
For life insurers, the same analysis applies to policies which do not have a cash
value (such as health insurance). However, some life insurance products involve asset
accumulations and provide for premature distribution of policy cash values at the
policyholder’s discretion. Moreover, since some life insurer products resemble banking
products, the search for favorable credit spreads can lead insurers to invest in some
complicated, illiquid assets, just as banks do. Thus, theoretically, a run on a life insurer is
more of a problem than for a property-liability insurer. In particular, the performance of
variable annuities and other Separate Account policies is related to the market, and a run
on these policies could occur during a market panic. Hence liquidity can be an issue for
life insurers during times of extreme market swings, and in some circumstances life
insurers can add to market disruptions once a systemic event occurs through their
investments.
However, premature surrender of a life insurance policy often entails severe
penalties to the policyholder so that the policyholder takes a substantial haircut on the
funds received; and there is a delay in receiving the payment (while the request is
74 In this case, it is relevant to compare unearned premiums with total assets, since the funds for unearned premiums were received and invested by the insurer. In contrast, reinsurance recoverables are amounts owed to the insurer.
32

processed). These features make premature withdrawal of funds undesirable for
policyholders. The existence of guaranty fund protection, subject to its limitations and
restrictions, also makes cancellation of policies less likely (Galanis, 2009).75 For
example, small policyholders with policies in personal lines would still receive coverage
for losses if the insurer failed. Hence a cancellation threat for life insurers exists, but it is
considered to be small to moderate.
Infrastructure. The U.S. insurance industry is not part of the financial or payment
infrastructure and does not impose any risk in this regard.
Regulation and Government Policy. As in banking, some moral hazard in the
operation of insurance guaranty funds exist; more specifically, guaranty fund premiums
are not risk-based. Recall that this feature of guaranty funds can lead to excessive risk-
taking in insurers. However, this is mitigated by the fact that insurance company guaranty
funds have claim payment limits.76 Thus an incentive to monitor insurers exists by
policyholders. Hence, relatively more market discipline for insurers exists than for other
financial institutions such as banks (Harrington, 2009).
Other Factors. This paper would be remiss if it did not consider the potential
impact of noninsurer, perhaps nonregulated, entities within the group as a source of
potential problems (e.g., AIG Group and its Financial Products division). As indicated
previously, regulators act to ring-fence assets of insurance companies within groups
experiencing financial trouble. However, legal, exercisable guarantees among insurers
within a group to noninsurance affiliates can link the results of members of a group
together. Thus the role of financial guarantees to noninsurance affiliates within a group
must be watched carefully, especially if the noninsurance affiliate is a banking or
securities entity. A similar argument can be made regarding intra-group transactions.
Nevertheless, as argued previously, the insolvency of a major U.S. insurance group
would most likely not set off a systemic crisis in credit markets at least as far as the
75 Recall, separate account products such as variable annuities are not subject to guaranty fund protection. 76 Recall, also, that some states have net worth restrictions that apply to commercial insurance.
33
insurance business is concerned. Primary markets would be expected to be disrupted
temporarily while new capacity (reinsurance capacity, surplus lines, and new capital for
solvent insurers) became available to fill the void.
Conclusion
The core activity of insurers is underwriting or pooling of losses, and loss events
for most types of insurance are unique and idiosyncratic in nature, unlike other financial
risks such as market and credit risk. To the extent that losses are not diversifiable,
insurers can partly mitigate their effects through reinsurance and, increasingly,
securitization.
To determine whether insurers are systemically risky, the term systemic risk must
be defined. For purposes of this research, systemic risk is defined as the risk of adverse
consequences that reverberate across a large segment of the financial sector as a whole,
posing a potentially grave effect on the economy. A distinction is made in this research
between instigating a systemic event and merely being susceptible to the effect of
systemic risk. The distinction is important, because the source of the systemic risk
suggests the types of entities and activities that should be regulated to avoid the
occurrence of future systemic events.
On the whole, this research concludes that insurers are not forseeably instigators
or the cause of systemic risk. That is, the analysis of primary indicators associated with
systemic risk and risk factors associated with systemic risk suggests that insurance does
not create systemic risk. Some correlation in losses within lines of insurance is possible
in the industry if unexpected losses arise due to the same event (e.g., adverse court
rulings), but the latter is unlikely to affect all lines of business (property, liability, and
life) at exactly the same time. In addition, insurance is pre-funded by the payment of
premiums, so that insurers typically have a large amount of assets on hand for payment of
losses when insolvency occurs. An orderly process for resolution of an insolvent insurer
exists in which assets of the insurer are not liquidated at insolvency. Rather the policies
of the insolvent insurers are transferred to another company or the insolvent insurer is
run-off with assets liquidated as loss/benefit payments come due, usually years in the
future.
34
Insurers are important financial intermediaries because of the gain from
investments resulting from premium pre-funding and the time lag between an accident
and the resulting claim payment. As intermediaries they are exposed to all of the
financial risk intermediaries face: credit risk, market risk, investment mispricing risk, and
liquidity risk. Typically insurers invest in high grade securities and/or use asset-liability
matching to mitigate market and credit risks. However, to the extent these risks are not
mitigated, insurers will be affected by systematic and systemic market events. In this
case, insurers are not the cause or instigators of the crisis, but rather are susceptible to its
consequences on markets. The capital markets likely to feel the most effect from
widespread insurer insolvencies are the market for corporate debt (life-health insurers)
and for municipal securities (property-liability insurers).
Because insurers cannot reasonably be viewed as instigators of systemic risk, they
do not require direct systemic risk regulation for their insurance operations. Further,
insurer operations are already regulated, successfully, for solvency. For example,
regulations exist already with respect to insurer investments concerning diversification
requirements and limits on investing. The capital an insurer is required to hold reflects
the relative riskiness of the insurer, including its investment and underwriting risk.
Thus, for insurers’ sake, systemic risk regulation should focus on forestalling
systemic shocks on markets and then mitigating their effect on markets overall when they
occur (rather than concentrating on a handful of firms that are TBTF). Further, the
impact systemic events have on insurers gives them an inherent interest in the imposition
of systemic risk regulation. Insurance regulators deserve a seat at the table in regulation
of systemic risk because the insurance industry can always be expected to be susceptible
to systemic risk.
35
References
A. M. Best Co., 2009a. 1969-2008 Impairment Review, Special Report, Oldwick: NJ, April 6. A.M. Best Co., 2009b. U.S. Life/Health – 1976-2008 Impairment Review, Special Report, Oldwick, NJ, May 25. Acharya, V.V.; J. Biggs; M. Richardson; and S. Ryan, 2009. On the Financial Regulation of Insurance Companies, working paper, NYU Stern School of Business, August. Bell, M. and B. Keller, 2009. Insurance and Stability: The Reform of Insurance Regulation, Zurich Financial Services Group, Zurich, Switzerland. Cummins, J.D., 2009. Do Insurance Companies Pose Systemic Risk?, Presentation made at the National Association of Insurance Commissioners Winter Meeting, San Francisco, CA, Dec. 3. Cummins, J.D. and M. A. Weiss, 2009. Convergence of Insurance and Financial Markets: Hybrid and Securitized Risk-Transfer Solutions, The Journal of Risk and Insurance, V. 76(3), pp. 493-545. De Bandt, O. and P. Hartmann, 2000. Systemic Risk: A Survey, European Central Bank Working Paper Series, Working Paper No. 35, November. European Central Bank, 2007. Potential Impact of Solvency II on Financial Stability, Frankfurt, Germany, July. Financial Stability Board, 2009. Report to G20 Finance Ministers and Governors, Guidance to Assess the Systemic Importance of Financial Institutions, Markets and Instruments: Initial Considerations. FSC 4(ii) 10.12.2009, 27 pp. Galanis, P.G., 2009. NOLHGA, the Life and Health Insurance Guaranty System, and the Financial Crisis of 2008-2009, presentation delivered at, “Insurer Receivership and Run-off: The Next Level,” American Bar Association, Tort Trial & Insurance Practice Session, June 5, 2009, New York, NY. Group of Thirty, 2006. Reinsurance and International Financial Markets, Washington, D.C. Harrington, S. E., 2009. The Financial Crisis, Systemic Risk, and the Future of Insurance Regulation, The Journal of Risk and Insurance, V. 76(4), pp. 785-819. Helwege, J., 2009. Financial Firm Bankruptcy and Systemic Risk, Regulation, Summer, pp. 24-29.
36
Hill, J.T., 2009. Statement of John T. Hill President and Chief Operating Officer Representing National Association of Mutual Insurance Companies, Testimony before the Capital Markets, Insurance, and Government Sponsored Enterprises Subcommittee, House Financial Services Committee hearing on Systemic Risk and Insurance, June 16. International Monetary Fund, 2009. Global Financial Stability Report, Responding to the Financial Crisis and Measuring Systemic Risks, April, Washington, D.C., 250 pp. Kaufman, G. G., 2000. Banking and Currency Crises and Systemic Risk: Lessons from Recent Events, Financial Markets, Institutions, and Instruments, V. 9(2), May. Kaufman, G.G. and K. E. Scott, 2003. What is Systemic Risk, and Do Bank Regulators Retard or Contribute to It?, The Independent Review V. VII(3), Winter, pp. 371-391. McRaith, M. T., 2009. Statement of Michael T. McRaith, Director of Insurance, State of Illinois on behalf of the National Association of Insurance Commissioners, Testimony before the Capital Markets, Insurance, and Government Sponsored Enterprises Subcommittee, House Financial Services Committee hearing on Systemic Risk and Insurance, June 16. Rech, J., 2009. Testimony of James Rech, Vice President, Risk Management and Financial Reporting Council of the American Academy of Actuaries, Subcommittee on Capital Markets, Insurance, and Government Sponsored Enterprises Subcommittee, House Financial Services Committee hearing on How Should the Federal Government Oversee Insurance, Washington, D.C., May 14. Schwartz, S. L., 2008. Systemic Risk, Duke Law School Legal Studies Research Paper Series, Research Paper No. 163, Durham, NC, March. Sullivan, T. R., 2009. Systemic Regulation, Prudential Matters, Resolution Authority and Securitization, Testimony of the National Association of Insurance Commissioners before the House Committee on Financial Services, Oct. 29, Washington, D.C.
Swiss Re, 2003. Reinsurance – A Systemic Risk?, Sigma V. 5, Zurich, Switzerland
37
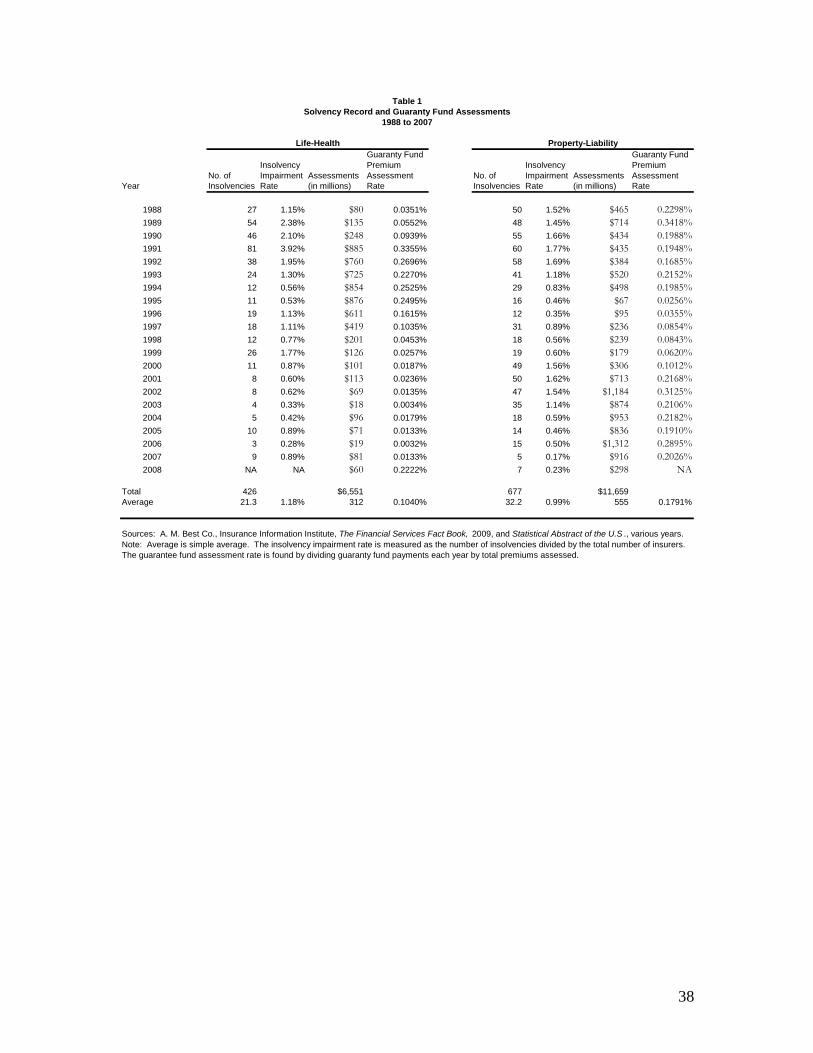
Guaranty Fund Guaranty Fund
Insolvency Premium Insolvency PremiumNo. of Impairment Assessments Assessment No. of Impairment Assessments Assessment
Year Insolvencies Rate (in millions) Rate Insolvencies Rate (in millions) Rate
1988 27 1.15% $80 0.0351% 50 1.52% $465 0.2298%1989 54 2.38% $135 0.0552% 48 1.45% $714 0.3418%1990 46 2.10% $248 0.0939% 55 1.66% $434 0.1988%1991 81 3.92% $885 0.3355% 60 1.77% $435 0.1948%1992 38 1.95% $760 0.2696% 58 1.69% $384 0.1685%1993 24 1.30% $725 0.2270% 41 1.18% $520 0.2152%1994 12 0.56% $854 0.2525% 29 0.83% $498 0.1985%1995 11 0.53% $876 0.2495% 16 0.46% $67 0.0256%1996 19 1.13% $611 0.1615% 12 0.35% $95 0.0355%1997 18 1.11% $419 0.1035% 31 0.89% $236 0.0854%1998 12 0.77% $201 0.0453% 18 0.56% $239 0.0843%1999 26 1.77% $126 0.0257% 19 0.60% $179 0.0620%2000 11 0.87% $101 0.0187% 49 1.56% $306 0.1012%2001 8 0.60% $113 0.0236% 50 1.62% $713 0.2168%2002 8 0.62% $69 0.0135% 47 1.54% $1,184 0.3125%2003 4 0.33% $18 0.0034% 35 1.14% $874 0.2106%2004 5 0.42% $96 0.0179% 18 0.59% $953 0.2182%2005 10 0.89% $71 0.0133% 14 0.46% $836 0.1910%2006 3 0.28% $19 0.0032% 15 0.50% $1,312 0.2895%2007 9 0.89% $81 0.0133% 5 0.17% $916 0.2026%2008 NA NA $60 0.2222% 7 0.23% $298 NA
Total 426 $6,551 677 $11,659Average 21.3 1.18% 312 0.1040% 32.2 0.99% 555 0.1791%
Note: Average is simple average. The insolvency impairment rate is measured as the number of insolvencies divided by the total number of insurers. The guarantee fund assessment rate is found by dividing guaranty fund payments each year by total premiums assessed.
Life-Health Property-Liability
Table 1Solvency Record and Guaranty Fund Assessments
1988 to 2007
Sources: A. M. Best Co., Insurance Information Institute, The Financial Services Fact Book, 2009, and Statistical Abstract of the U.S ., various years.
38
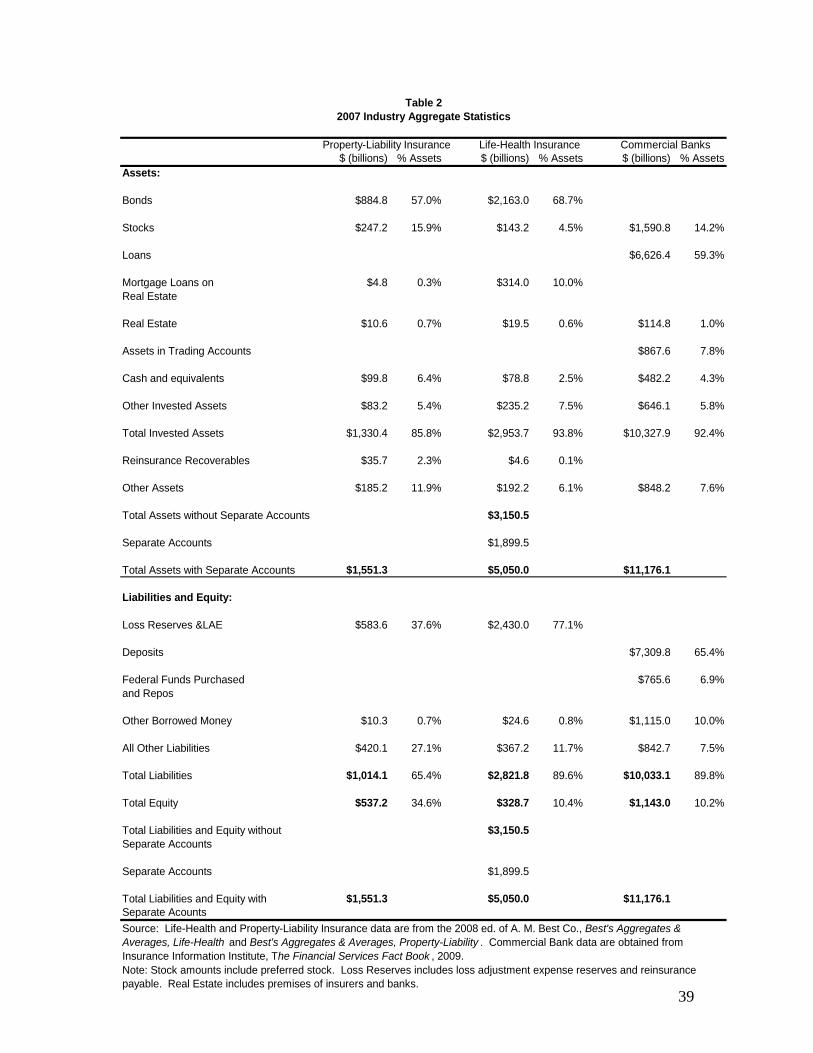
Property-Liability Insurance Life-Health Insurance Commercial Banks $ (billions) % Assets $ (billions) % Assets $ (billions) % AssetsAssets:
Bonds $884.8 57.0% $2,163.0 68.7%
Stocks $247.2 15.9% $143.2 4.5% $1,590.8 14.2%
Loans $6,626.4 59.3%
Mortgage Loans on $4.8 0.3% $314.0 10.0% Real Estate
Real Estate $10.6 0.7% $19.5 0.6% $114.8 1.0%
Assets in Trading Accounts $867.6 7.8%
Cash and equivalents $99.8 6.4% $78.8 2.5% $482.2 4.3%
Other Invested Assets $83.2 5.4% $235.2 7.5% $646.1 5.8%
Total Invested Assets $1,330.4 85.8% $2,953.7 93.8% $10,327.9 92.4%
Reinsurance Recoverables $35.7 2.3% $4.6 0.1%
Other Assets $185.2 11.9% $192.2 6.1% $848.2 7.6%
Total Assets without Separate Accounts $3,150.5
Separate Accounts $1,899.5
Total Assets with Separate Accounts $1,551.3 $5,050.0 $11,176.1
Liabilities and Equity:
Loss Reserves &LAE $583.6 37.6% $2,430.0 77.1%
Deposits $7,309.8 65.4%
Federal Funds Purchased $765.6 6.9%and Repos
Other Borrowed Money $10.3 0.7% $24.6 0.8% $1,115.0 10.0%
All Other Liabilities $420.1 27.1% $367.2 11.7% $842.7 7.5%
Total Liabilities $1,014.1 65.4% $2,821.8 89.6% $10,033.1 89.8%
Total Equity $537.2 34.6% $328.7 10.4% $1,143.0 10.2%
Total Liabilities and Equity without $3,150.5Separate Accounts
Separate Accounts $1,899.5
Total Liabilities and Equity with $1,551.3 $5,050.0 $11,176.1Separate AcountsSource: Life-Health and Property-Liability Insurance data are from the 2008 ed. of A. M. Best Co., Best's Aggregates & Averages, Life-Health and Best's Aggregates & Averages, Property-Liability . Commercial Bank data are obtained from Insurance Information Institute, The Financial Services Fact Book , 2009.
Table 22007 Industry Aggregate Statistics
39
Note: Stock amounts include preferred stock. Loss Reserves includes loss adjustment expense reserves and reinsurance payable. Real Estate includes premises of insurers and banks.
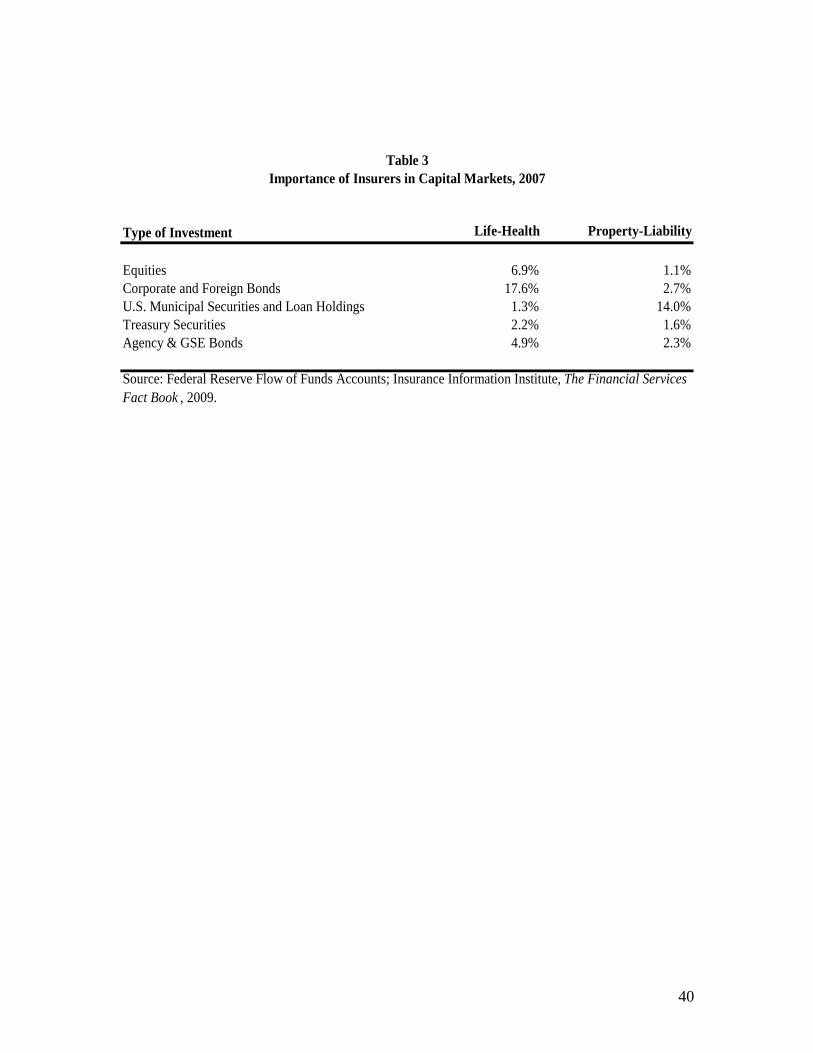
Type of Investment Life-Health Property-Liability
Equities 6.9% 1.1%Corporate and Foreign Bonds 17.6% 2.7%U.S. Municipal Securities and Loan Holdings 1.3% 14.0%Treasury Securities 2.2% 1.6%Agency & GSE Bonds 4.9% 2.3%
Source: Federal Reserve Flow of Funds Accounts; Insurance Information Institute, The Financial Services Fact Book , 2009.
Table 3Importance of Insurers in Capital Markets, 2007
40