systemic immunoregulatory and proteogenomic effects of tacrolimus to sirolimus conversion in liver...
TRANSCRIPT
Systemic Immunoregulatory and ProteogenomicEffects of Tacrolimus to Sirolimus Conversion
in Liver Transplant RecipientsJosh Levitsky,1,2 James M. Mathew,2,3 Michael Abecassis,2 Anat Tambur,2 Joseph Leventhal,2
Dhivya Chandrasekaran,2 Nancy Herrera,2 Patrice Al-Saden,2 Lorenzo Gallon,2 Anmaar Abdul-Nabi,4
Guang-Yu Yang,4 Sunil M. Kurian,5 Daniel R. Salomon,5 and Joshua Miller2,6
Immunosuppression (IS) withdrawal from calcineurin inhibitors is only possible in �20%of liver transplant recipients. However, mammalian target of rapamycin inhibitors (e.g.,sirolimus; SRL) appear to be more immunoregulatory and might promote a tolerant statefor withdrawal. Our aim was to determine whether systemic (i.e., blood, marrow, and allo-graft) signatures of immunoregulation are promoted by conversion from tacrolimus (TAC)to SRL. We therefore performed the following serial assays before and after SRL conver-sion in liver transplant recipients to test for enhanced markers of immunoregulation: (1)flow-cytometry immunophenotyping of peripheral blood mononuclear cells (PBMCs) andbone marrow aspirates for regulatory T cells (Tregs) (e.g., CD41CD25111FOXP31) andregulatory dendritic cells (DCregs) (immunoglobulin-like transcript 31/41); (2) liver bi-opsy immunohistochemical staining (e.g., FOXP3:CD3 and CD4:CD8 ratios) and immu-nophenotyping of biopsy-derived Tregs after growth in culture; (3) effects of pre- versuspostconversion sera on Treg generation in mixed lymphocyte reactions; (4) peripheralblood nonspecific CD4 responses; and (5) peripheral blood gene transcripts and proteo-mic profiles. We successfully converted 20 nonimmune, nonviremic recipients (age, 57.26 8.0; 3.5 6 2.1 years post–liver transplantation) from TAC to SRL for renal dysfunction.Our results demonstrated significant increases in Tregs in PBMCs and marrow and DCregsin PBMCs (P < 0.01) after conversion. In biopsy staining, FOXP3:CD3 and CD4:CD8ratios were significantly higher after conversion and a number of biopsy cultures developednew or higher FOXP31 cell growth. Nonspecific CD4 responses did not change. Both pre-and postconversion sera inhibited mixed lymphocyte reactions, although only TAC serasuppressed Treg generation. Finally, 289 novel genes and 22 proteins, several important inimmunoregulatory pathways, were expressed after conversion. Conclusions: TAC to SRLconversion increases systemic Tregs, DCregs, and immunoregulatory proteogenomic signa-tures in liver transplant recipients and may therefore facilitate IS minimization or with-drawal. (HEPATOLOGY 2012;00:000–000)
Life-long immunosuppression (IS) is generallyrequired after liver transplantation (LT). Withthe advent of calcineurin inhibitors (CNIs),
rejection rates have declined, yet toxicity resulting
from CNI therapy has led to long-term adverse out-comes.1 Complete IS withdrawal (i.e., operational tol-erance) would be ideal, although this has, thus far,been possible in only �20% of LT recipients.2 The
Abbreviations: ALT, alanine aminotransferase; ANOVA, analysis of variance; APC, antigen-presenting cell; ApoC-IV, apolipoprotein C4; BUN, blood ureanitrogen; ATP, adenosine triphosphate; CD, cluster of differentiation; CNIs, calcineurin inhibitors; CTLA-4, cytotoxic T-lymphocyte-associated antigen-4; DC,dendritic cell; DCregs, regulatory dendritic cells; eGFR, estimated glomerular filtration rate; FITC, fluorescein isothiocyanate; FOXP3, forkhead box protein 3;GFR, glomular filtration rate; HCV, hepatitis C virus; HgA1C, hemoglobin A1C tests; HLA, human leukocyte antigen; IHC, immunohistochemistry; IL,interleukin; ILT, immunoglobulin-like transcript; IS, immunosuppression; LT, liver transplantation; mAbs, monoclonal antibodies; MAPs, multianalyte profiles;MDRD, modified diet in renal disease; MIP-1a, macrophage inflammatory protein 1-alpha; MLR, mixed lymphocyte reaction; mTOR, molecular target ofrapamycin; NK, natural killer; PARC, pulmonary and activation-regulated chemokine; PBMC, peripheral blood mononuclear cell; PE, phycoerythrin; PerCP,peridinin-chlorophyll protein complex; SRL, sirolimus; TAC, tacrolimus; TFF3, trefoil factor 3; TGF-b, transforming growth factor beta; Treg, regulatory T cell;TRAIL-R3, tumor necrosis factor–related apoptosis-inducing ligand receptor 3; VCAM, vascular cell adhesion molecule.
1

inability to immunologically predict successful IS with-drawal has obligated long-term CNI maintenance attherapeutic doses, despite toxicities.The identification of specific cell populations and
pathways responsible for immunoregulation may giveclues toward achieving tolerance in LT. Tolerancedevelops initially by the interaction of antigen-specificT cells with unique thymic antigen-presenting cells(APCs) or regulatory dendritic cells (DCregs), respec-tively resulting in either clonal deletion, anergy, or anactive immunoregulatory process.3 Such DCregs arecharacterized by high surface expression of cluster ofdifferentiation (CD)123 and/or immunoglobulin-liketranscripts (ILTs) (e.g., ILT3 or ILT4) that inhibit anti-gen presentation (i.e., reflecting immunoregulation).4,5
As mentioned above, this interaction can lead to thegeneration of regulatory T cells (Tregs) (e.g.,CD4þCD25high) that migrate peripherally to controlimmune responses. These Tregs typically express an in-tracellular protein, forkhead box protein 3 (FOXP3),which blocks the transcription of T-cell activation mol-ecules, such as interleukin (IL)-2, and the expressionof CD127.6,7 Moreover, gene transcripts and proteinexpression patterns (i.e., antibodies as well as circulat-ing and cell proteins), as markers for immunoregula-tion, may also provide a window into the tolerantstate.Thus, there is strong interest in cellular (i.e., Treg
and DCreg), genomic, and proteomic assays to assessimmunoregulation and predict more reliably whomight achieve IS withdrawal.8,9 Because the liverappears to be the most tolerogenic transplanted organ,high numbers of such cells residing in the liver may beregulatory and protect against rejection. Similarly, thebone marrow, as a formative organ of the immune sys-tem, may also contain localized Treg niches thatenhance immunoregulation.10-12 Thus, assessing tol-erogenic signatures not only in the blood, but also in
the allograft and bone marrow may further differenti-ate regulatory from alloreactive states.In addition to the need for predictive assays, there
have been few efforts to modulate the immune systemto induce tolerance other than simultaneous hemato-poietic cell and solid organ transplantation,13 a riskyapproach in patients with severe end-stage liver diseaseundergoing LT. One potential reason for the low effi-cacy of IS withdrawal is CNI therapy itself, becausemost patients in such studies were being treated withCNIs at withdrawal.2 CNIs may hinder immunoregu-lation by inhibiting IL-2 production needed for Tregdevelopment and also by not inhibiting dendritic cell(DC) maturation.14,15 In contrast, molecular target ofrapamycin (mTOR) inhibitors, such as sirolimus(SRL), might facilitate immunoregulation by increas-ing Treg percentages (i.e., does not block IL-2 produc-tion) and inhibiting DC maturation and function.16-18
We previously demonstrated that LT recipients on SRLmonotherapy had significantly higher Treg percentagesthan those on tacrolimus (TAC) monotherapy.19 Thus,conversion to SRL may both minimize CNI toxicity20
and facilitate IS withdrawal by promotingimmunoregulation.We therefore hypothesized that prospectively studied
LT recipients converted from CNI to SRL monother-apy would display enhanced systemic cellular, func-tional, and proteogenomic immunoregulatory markers.This would support larger scale studies utilizing SRLconversion as an intermediate step toward more clini-cally successful IS withdrawal in LT.
Patients and Methods
Clinical Protocol and Study Procedures. Thestudy was a prospective investigation of the changes inimmunoregulatory markers in the blood, bone mar-
From the 1Division of Gastroenterology and Hepatology, Department of Medicine, Northwestern University Feinberg School of Medicine, Chicago, IL;2Comprehensive Transplant Center, Department of Surgery, Northwestern University Feinberg School of Medicine, Chicago, IL; 3Department of Microbiology-Immunology, Northwestern University Feinberg School of Medicine, Chicago, IL; 4Department of Pathology, Northwestern University Feinberg School of Medicine,Chicago, IL; 5The Scripps Research Institute, Department of Molecular and Experimental Medicine, La Jolla, CA; and 6Jesse Brown VA Medical Center, Chicago, IL.Received October 12, 2011; accepted December 21, 2012.This study was funded by the 2008 American Association for the Study of Liver Disease Career Development Award in Liver Transplantation in Memory of the
University of Michigan Transplant Team and an investigator-initiated grant from Wyeth/Pfizer Pharmaceuticals (to J.L.). Support also came from NationalInstitutes of Health grants U19 A1063603 and U01 AI084146 (to D.R.S., S.M.K., M.A., and J.L.).Address reprint requests to: Josh Levitsky, M. D., M. S., Division of Gastroenterology and Hepatology, Comprehensive Transplant Center, Northwestern
University Feinberg School of Medicine, 676 North St. Clair Street, 19th Floor, Chicago, IL 60611. E-mail: [email protected]; fax: 312-695-0036.CopyrightVC 2012 by the American Association for the Study of Liver Diseases.View this article online at wileyonlinelibrary.com.DOI 10.1002/hep.25579Potential conflict of interest: Nothing to report.Additional Supporting Information may be found in the online version of this article.
2 LEVITSKY ET AL. HEPATOLOGY, Month 2012
row, and liver allograft in recipients converted fromTAC monotherapy to SRL monotherapy for clinicalindications (e.g., TAC toxicity). Inclusion criteria wereas follows: age �18 years; �6 months post-LT; TACmonotherapy �1 month before SRL monotherapyconversion for nephrotoxicity (glomular filtration rate[GFR] 30-60 cc/min by modified diet in renal disease[MDRD]) or other indication; �6 months without arejection episode; no lymphocyte depletion therapy for�1 year; normal liver-function tests; and no rejectionor fibrosis on preconversion liver biopsy. Exclusion cri-teria were as follows: previous liver or multiorgantransplant; previous immune or viral liver diseaseunless hepatitis C virus (HCV) RNA was undetectable;proteinuria (�0.5 g/day); estimated glomerular filtra-tion rate (eGFR) �30 cc/min; �2 rejections post-LT;history of hepatic artery thrombosis; hematologicalabnormalities or severe hypertriglyceridemia; activeinfection or malignancy; and inadequacy for follow-up. All patients signed informed consent and were fol-lowed for 7 months after SRL conversion. The proto-col conformed to the Declaration of Helsinki guide-lines and was approved by the NorthwesternInstitutional Review Board (Northwestern UniversityFeinberg School of Medicine, Chicago, IL).History and physical exams, complete blood counts,
comprehensive metabolic panels, fasting lipids, hemo-globin A1C tests (HgA1C), and spot urine protein:-creatinine ratios were performed before and 3 and 6months after conversion. Bone marrow aspirations andpercutaneous liver biopsies were performed once beforeand 6 months after conversion. For conversion, SRL at2 or 3 mg (< or �100 kg body weight) daily was ini-tiated with subsequent weekly SRL trough-level moni-toring. When these reached �5 ng/mL, TAC was dis-continued followed by weekly laboratory tests andSRL trough levels (goal, 5-8 ng/mL) for 1 month,then monthly. Prospective liver- and renal-functiontests, lipid levels, urine protein:creatinine ratios, andany new SRL toxicities were recorded.Assay Methods. Peripheral blood. Treg immunophe-
notyping (twice before conversion and 3, 4, 6, and 7months after conversion): Peripheral blood mononuclearcells (PBMCs) were isolated from heparinized sampleson Ficoll-Hypaque gradients. Tregs were enumeratedutilizing extracellular immunofluorescent staining withCD3-FITC (fluorescein isothiocyanate), CD4-PerCP(peridinin-chlorophyll protein complex), CD8-PerCP,CD25-APC, and CD127-FITC (BD Biosciences, SanDiego, CA). After fixation and permeabilization, thecells were washed and incubated with anti-humanFOXP3-PE (phycoerythrin) or rat immunoglobulin
G2a-PE isotype control (eBioscience, San Diego, CA)(21, 22). Samples were acquired using the FACSCali-bur flow cytometer (BD Biosciences) and were ana-lyzed by gating based on CD4þCD127�
CD25þ expression against FOXP3 to calculate thepercentage of Tregs.Cell subset analysis: Peripheral blood was also labeled
with monoclonal antibodies (mAbs) for T-cell subsets(e.g., CD3, CD4, CD8, and CD25), B cells (CD19),monocytes (CD14), and natural killer (NK) cells(CD56). After red blood cell lysing, samples wereacquired on the FACSCalibur and the absolute cell-subset numbers/lL blood were calculated.DC surface markers (twice before conversion and 3, 4,
6, and 7 months after conversion): PBMC isolated byFicoll-Hypaque gradients were incubated with FITC-labeled mAbs to lineage markers (e.g., CD3, CD14,CD16, CD19, CD20, and CD56) for negative selec-tion and markers to distinguish between monocytoid(CD11c) and plasmacytoid (CD123) DCs (Beckman-Coulter, Miami, FL).19,23 Cells were further stainedwith CD205-PE and CD83-PC5 as DC antigenuptake/presentation markers or ILT3-PC5 and ILT4-PE as tolerogenic DC markers. Four-color multipara-meter flow cytometry was performed using a CoulterFC500 instrument (Beckman-Coulter) compensatedwith single fluorochromes.Functional assays (once before and once 6 months after
conversion): The Immune Cell Function Assay (CylexInc., Columbia, MD) assay was performed per themanufacturer’s instructions, detecting CD4 responsesby adenosine triphosphate (ATP) production in wholeblood after 18 hours of incubation with phytohemag-glutinin stimulation. In the Treg-MLR (mixed lym-phocyte reaction) assay, using healthy human leuko-cyte antigen (HLA)-typed volunteer PBMCs,responding cells were stimulated with X-irradiatedHLA2-DR matched stimulating allogeneic cells.21,22
To these cultures, LT recipient sera, containing troughlevels of TAC (preconversion) versus SRL (postconver-sion), were added and compared with the addition ofsimilar volumes of human AB sera (Invitrogen, Carls-bad, CA) versus media controls. After 7 culture days,lymphoproliferation was assessed by tritium-labeledthymidine (3H-TdR) incorporation and immunophe-notyping was performed for CD3, CD4, CD8,CD25, and FOXP3 markers. Stimulation indices werecalculated from the counts per minute measured witha beta counter.24
Gene-expression microarrays and protein multianalyteprofiles (once before and once 6 months after conversion):Peripheral blood was collected in PaxGene tubes
HEPATOLOGY, Vol. 000, No. 000, 2012 LEVITSKY ET AL. 3

(Qiagen, Valencia, CA) for gene microarrays andBaxter PPT tubes for multianalyte profiles(MAPs).25,26 RNA was extracted using the PaxGeneblood RNA kit. Whole blood human genome profilingwas performed with Affymetrix GeneChip 1.0 STarrays (Affymetrix, Santa Clara, CA), following stand-ard protocols. Plasma proteomics were performedusing a proprietary Luminex Bead technology testingthe 189 protein Human DiscoveryMAP v1.0 (RulesBased Medicine, Austin, TX).Bone marrow aspirates. Treg and DC immunopheno-
typing (once before and once 6 months after conversion):Under local anesthesia as outpatients, 10 cc of marrowwere aspirated from the posterior iliac crest using a16-gauge needle. After 5 minutes of pressure, normaldaily activities resumed. Leukocytes were isolated byFicoll-Hypaque gradients and characterized by flowcytometry for Treg and DC subsets identical to the pe-ripheral blood methods, as described above.Liver biopsy. Routine histolog;: Treg immunophenotyp-
ing by immunohistochemical staining and after culture(once before and once 6 months after conversion): A 2-cm core was obtained for hematoxylin and eosin, tri-chrome, and immunohistochemistry (IHC). IHCstaining of formalin-fixed tissue was performed withstreptavidin/biotin/peroxidase using dual-staining anti-bodies to FOXP3, CD3, CD4, and CD8.27 The num-ber of CD3- and FOXP3-positive and CD4- andCD8-positive lymphocytes were counted in a 400�power field. Ratios of FOXP3:CD3 and CD4:CD8were calculated, and an average of three portal-tractratios were recorded. A second core was obtained forflow immunophenotyping after 14 days of culture inmedia (50 U/mL of recombinant IL2 þ 50% MLRsupernatant) that reliably expands cells already acti-vated in vivo.28,29
Statistical Analysis. Pre- versus postconversionmeasurements of immune assays (e.g., PBMC, marrow,and biopsies) and clinical outcomes were performedusing the appropriate paired analysis (i.e., paired t testand Wilcoxon’s signed-rank test) or the chi-squared/Fisher’s exact test for continuous or categorical meas-ures, respectively. For microarray and MAP compari-sons, P values were calculated using a two-way analysisof variance (ANOVA) model by the method ofmoments,30 using the Partek Genomics Suite (PartekInc., St. Louis, MO). A false discovery rate correctionof �10% (q-values) was used for the proteomic data.A paired ANOVA was used for the gene-expressionchanges, because the samples represented two timepoints from the same individual. Analyses were per-formed using SAS 9.2 software (SAS Inc., Cary, NC).
Results
Patient Characteristics. Twenty-seven LT recipientswere initially considered candidates for TAC to SRLconversion because of renal dysfunction. Two wereexcluded before conversion: 1 because of elevated ala-nine aminotransferase (ALT) at screening and 1 withinterface hepatitis on the preconversion biopsy. Fivewere excluded as they were converted back to TACwithin 1 month after SRL conversion because of cost(n ¼ 1), SRL intolerability (1 foot ulcer and 1 nau-sea), or mild rejection on biopsy (n ¼ 2, each resolvedwith TAC reversion). Other than biopsy IHC stainingin the 2 with rejection, these 5 patients were with-drawn from the study and followed clinically becauseit was not considered necessary (i.e., no longer onSRL) or ethical to continue the serial sample collec-tions. Thus, 20 were successfully converted and com-pleted the study (Table 1).Clinical and Histological Outcomes. SRL was gen-
erally well tolerated. There were no infectious compli-cations. Side effects (e.g., 4 diarrhea, 3 anemia, 4lower extremity edema, and 1 rash) resolved by target-ing lower SRL troughs (�5 ng/mL). Although renalparameters (e.g., eGFR by MDRD equation, bloodurea nitrogen [BUN], creatinine, and potassium levels)improved, urine protein:creatinine ratios increasedwith SRL conversion (Table 2). Biochemical changesincluded minor decreases in bilirubin and increases in
Table 1. Preconversion Clinical Characteristics (n 5 20)
Mean 6 SD Median (Range)
Age (years) 59.2 6 7.9 58 (44-71)
Gender 13 M; 7 F
Caucasian race (%) 19 (95)
Cause of liver disease (%)
HCV (non-viremic) 4 (20)
Alcohol 7 (35)
Cryptogenic/fatty Liver 8 (40)
a-1 antitrypsin deficiency 1 (5)
Months post-LT 42.8 6 25.1 40.8 (9.6-104.6)
Months on TAC monotherapy
before conversion
24.4 6 26.7 39.6 (1.5-100.1)
Mean trough TAC level at conversion
(ng/mL)
6.3 6 1.5 5.6 (2.3-7.7)
Other immunosuppressive therapy* (%)
Induction at LT (alemtuzumab) 5 (25)
Number on prior prednisone post-LT 15 (75)
Months on prednisone post-LT 5.4 6 3.2 6 (3-12)
Number on mycophenolate mofetil
post-LT
14 (70)
Months on mycophenolate mofetil
post-LT
20.7 6 16 16.9 (6.1-59.4)
*Other immunosuppressive therapy (e.g., prednisone and mycophenolate
mofetil) was discontinued �3 months before study enrollment (see inclusion
criteria). Abbreviations: SD, standard deviation; M, male; F, female.
4 LEVITSKY ET AL. HEPATOLOGY, Month 2012
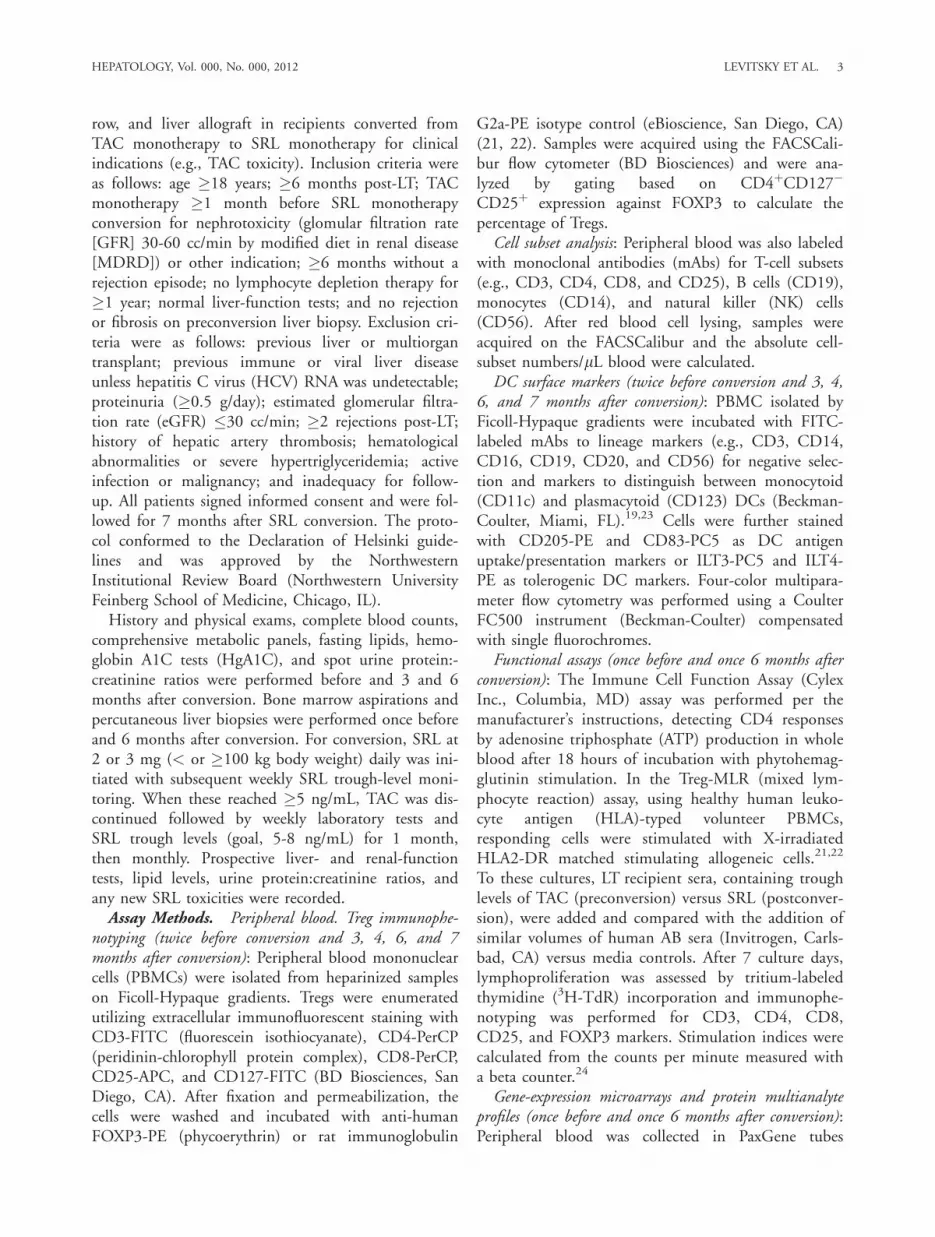
ALT. Significant increases in low-density lipoproteinsand triglycerides occurred. Liver biopsies did not dem-onstrate significant histological changes, other thanmild steatosis and increased portal lymphocytes latercharacterized as staining FOXP3þ (see below).Immunophenotyping: Peripheral Blood, Bone
Marrow, and Allograft. To clarify the rationale forthese assays, changes in Treg and DCreg percentagesafter SRL conversion were assessed because high per-centages of these cells were formerly reported in toler-ant LT recipients.5,8,9,31 Also, in previous studies, wehave safely and repeatedly performed outpatient mar-row aspirations, demonstrating the role of bone mar-row cells in controlling antidonor immuneresponses.10,11,32 Recently, bone marrow Tregs havebeen shown to establish an immunoregulatory niche insupporting stem cells and protecting against immuneinjury.12 Because SRL inhibits DC function in vitro, itwas also questioned whether SRL conversion mightaffect the percentage of ILT3, ILT4, and CD123, allof which are markers of regulatory DCs.5,18,33 Wetherefore measured bone marrow immunophenotypes(e.g., Treg and DCreg) before and after conversion todetermine whether changes similar to those observedin PBMCs occurred. In addition, liver biopsy IHC
staining has been utilized in previous studies demon-strating high Treg numbers in tolerant LT recipi-ents.8,27 We therefore performed both liver biopsyIHC staining and allograft culture immunophenotyp-ing, previously validated approaches,8,27-29 to charac-terize the percentage of Tregs residing within the graftbefore and after conversion.Peripheral blood and bone marrow immunophenoty-
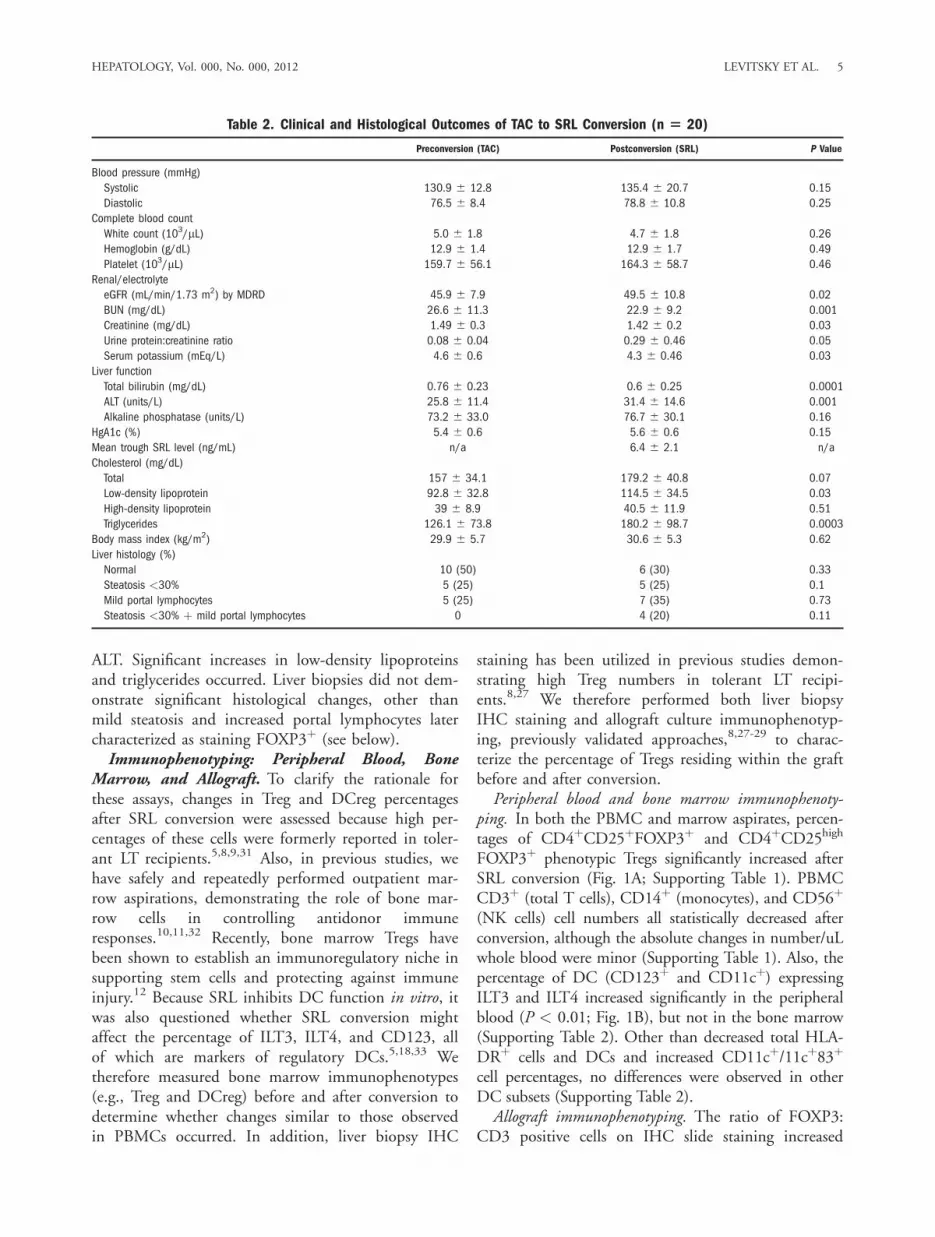
ping. In both the PBMC and marrow aspirates, percen-tages of CD4þCD25þFOXP3þ and CD4þCD25high
FOXP3þ phenotypic Tregs significantly increased afterSRL conversion (Fig. 1A; Supporting Table 1). PBMCCD3þ (total T cells), CD14þ (monocytes), and CD56þ
(NK cells) cell numbers all statistically decreased afterconversion, although the absolute changes in number/uLwhole blood were minor (Supporting Table 1). Also, thepercentage of DC (CD123þ and CD11cþ) expressingILT3 and ILT4 increased significantly in the peripheralblood (P < 0.01; Fig. 1B), but not in the bone marrow(Supporting Table 2). Other than decreased total HLA-DRþ cells and DCs and increased CD11cþ/11cþ83þ
cell percentages, no differences were observed in otherDC subsets (Supporting Table 2).Allograft immunophenotyping. The ratio of FOXP3:
CD3 positive cells on IHC slide staining increased
Table 2. Clinical and Histological Outcomes of TAC to SRL Conversion (n 5 20)
Preconversion (TAC) Postconversion (SRL) P Value
Blood pressure (mmHg)
Systolic 130.9 6 12.8 135.4 6 20.7 0.15
Diastolic 76.5 6 8.4 78.8 6 10.8 0.25
Complete blood count
White count (103/lL) 5.0 6 1.8 4.7 6 1.8 0.26
Hemoglobin (g/dL) 12.9 6 1.4 12.9 6 1.7 0.49
Platelet (103/lL) 159.7 6 56.1 164.3 6 58.7 0.46
Renal/electrolyte
eGFR (mL/min/1.73 m2) by MDRD 45.9 6 7.9 49.5 6 10.8 0.02
BUN (mg/dL) 26.6 6 11.3 22.9 6 9.2 0.001
Creatinine (mg/dL) 1.49 6 0.3 1.42 6 0.2 0.03
Urine protein:creatinine ratio 0.08 6 0.04 0.29 6 0.46 0.05
Serum potassium (mEq/L) 4.6 6 0.6 4.3 6 0.46 0.03
Liver function
Total bilirubin (mg/dL) 0.76 6 0.23 0.6 6 0.25 0.0001
ALT (units/L) 25.8 6 11.4 31.4 6 14.6 0.001
Alkaline phosphatase (units/L) 73.2 6 33.0 76.7 6 30.1 0.16
HgA1c (%) 5.4 6 0.6 5.6 6 0.6 0.15
Mean trough SRL level (ng/mL) n/a 6.4 6 2.1 n/a
Cholesterol (mg/dL)
Total 157 6 34.1 179.2 6 40.8 0.07
Low-density lipoprotein 92.8 6 32.8 114.5 6 34.5 0.03
High-density lipoprotein 39 6 8.9 40.5 6 11.9 0.51
Triglycerides 126.1 6 73.8 180.2 6 98.7 0.0003
Body mass index (kg/m2) 29.9 6 5.7 30.6 6 5.3 0.62
Liver histology (%)
Normal 10 (50) 6 (30) 0.33
Steatosis <30% 5 (25) 5 (25) 0.1
Mild portal lymphocytes 5 (25) 7 (35) 0.73
Steatosis <30% þ mild portal lymphocytes 0 4 (20) 0.11
HEPATOLOGY, Vol. 000, No. 000, 2012 LEVITSKY ET AL. 5
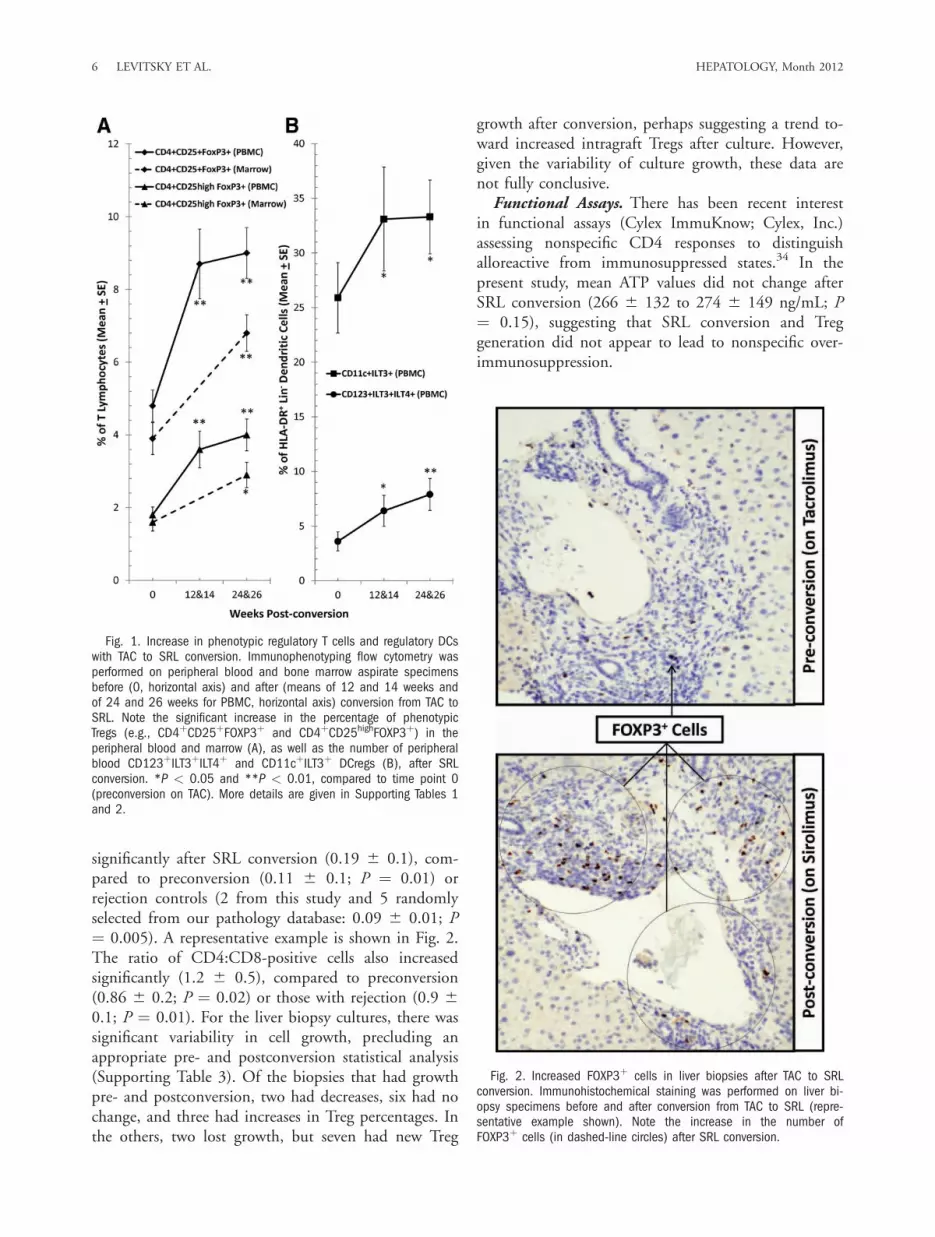
significantly after SRL conversion (0.19 6 0.1), com-pared to preconversion (0.11 6 0.1; P ¼ 0.01) orrejection controls (2 from this study and 5 randomlyselected from our pathology database: 0.09 6 0.01; P¼ 0.005). A representative example is shown in Fig. 2.The ratio of CD4:CD8-positive cells also increasedsignificantly (1.2 6 0.5), compared to preconversion(0.86 6 0.2; P ¼ 0.02) or those with rejection (0.9 60.1; P ¼ 0.01). For the liver biopsy cultures, there wassignificant variability in cell growth, precluding anappropriate pre- and postconversion statistical analysis(Supporting Table 3). Of the biopsies that had growthpre- and postconversion, two had decreases, six had nochange, and three had increases in Treg percentages. Inthe others, two lost growth, but seven had new Treg
growth after conversion, perhaps suggesting a trend to-ward increased intragraft Tregs after culture. However,given the variability of culture growth, these data arenot fully conclusive.Functional Assays. There has been recent interest
in functional assays (Cylex ImmuKnow; Cylex, Inc.)assessing nonspecific CD4 responses to distinguishalloreactive from immunosuppressed states.34 In thepresent study, mean ATP values did not change afterSRL conversion (266 6 132 to 274 6 149 ng/mL; P¼ 0.15), suggesting that SRL conversion and Treggeneration did not appear to lead to nonspecific over-immunosuppression.
Fig. 1. Increase in phenotypic regulatory T cells and regulatory DCswith TAC to SRL conversion. Immunophenotyping flow cytometry wasperformed on peripheral blood and bone marrow aspirate specimensbefore (0, horizontal axis) and after (means of 12 and 14 weeks andof 24 and 26 weeks for PBMC, horizontal axis) conversion from TAC toSRL. Note the significant increase in the percentage of phenotypicTregs (e.g., CD4þCD25þFOXP3þ and CD4þCD25highFOXP3þ) in theperipheral blood and marrow (A), as well as the number of peripheralblood CD123þILT3þILT4þ and CD11cþILT3þ DCregs (B), after SRLconversion. *P < 0.05 and **P < 0.01, compared to time point 0(preconversion on TAC). More details are given in Supporting Tables 1and 2.
Fig. 2. Increased FOXP3þ cells in liver biopsies after TAC to SRLconversion. Immunohistochemical staining was performed on liver bi-opsy specimens before and after conversion from TAC to SRL (repre-sentative example shown). Note the increase in the number ofFOXP3þ cells (in dashed-line circles) after SRL conversion.
6 LEVITSKY ET AL. HEPATOLOGY, Month 2012

We have also recently reported on a novel in vitroimmune monitoring assay in humans (the Treg MLR)demonstrating favorable immunoregulatory effects ofSRL versus TAC when added directly to MLR cul-tures.21,22 As another functional measure, we thereforequestioned whether the addition of patient sera con-taining TAC versus SRL and, possibly, other resultingregulatory molecules might suppress lymphoprolifera-tion and enhance Treg generation.21,22 Both pre- andpostconversion sera equally suppressed MLR lympho-proliferation (stimulation indices) below media con-trols (n ¼ 13; P < 0.05) (Fig. 3A). However, TAC
sera also suppressed CD4þCD25highFOXP3þ cell gen-eration (n ¼ 13; P < 0.01) (Fig. 3B), whereas SRLsera did not.Proteogenomic Signatures. Genomic, proteomic,
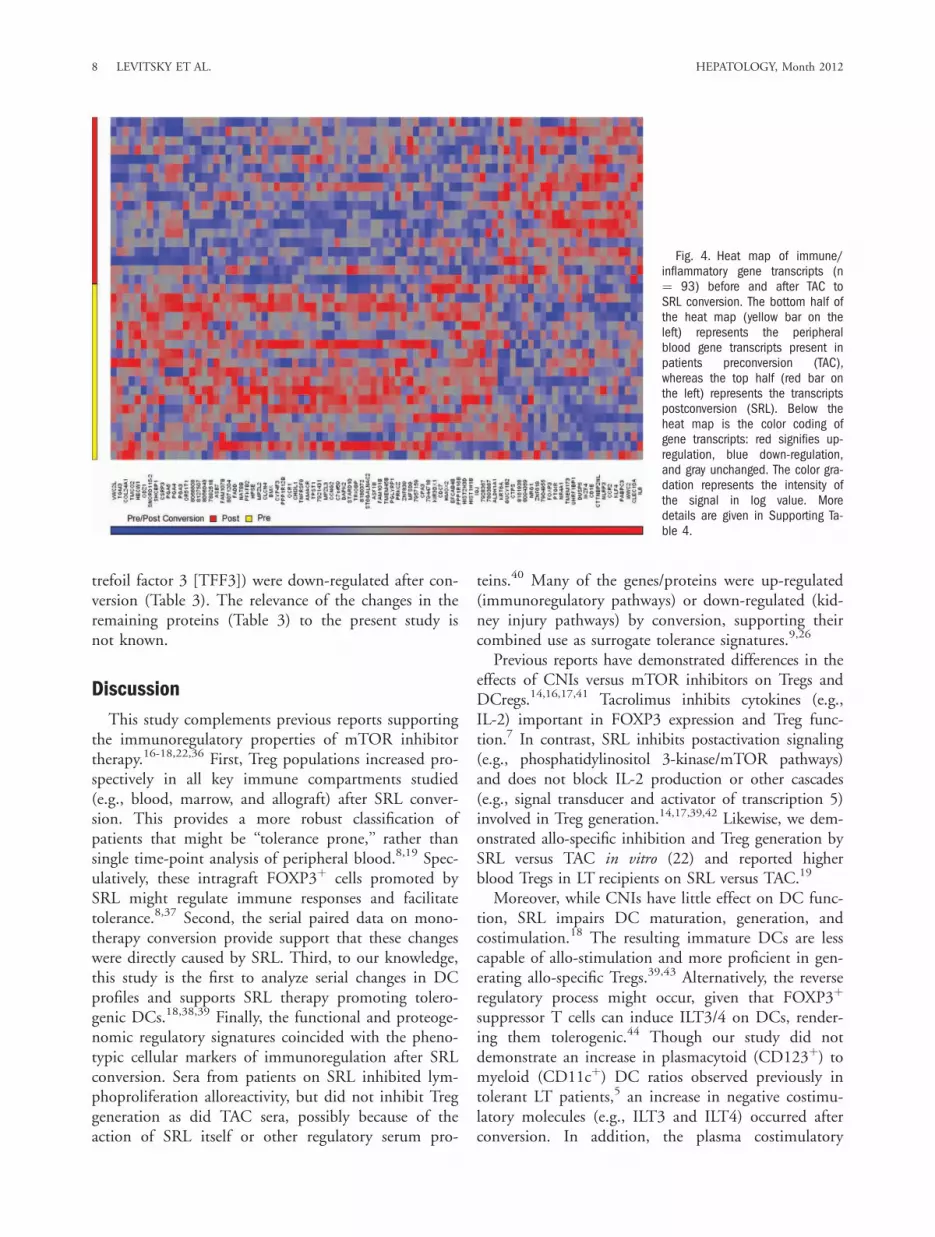
and cytokine signatures may have the potential to pre-dict tolerance.9,35 In previous reports, transcripts forcell-proliferation arrest proteins and T- and NK-cellreceptors have been identified as putative LT tolerancesignatures, correlating with increased circulating Tregs.We examined whether similar signatures of immunore-gulation might be also observed after SRL conversion.In the present study, several gene transcripts (n ¼ 288;Supporting Table 4) and plasma proteins (n ¼ 22; Ta-ble 3), many involved in immunoregulatory pathways,were found to be significantly different after SRL con-version (P < 0.005). Within the heat map displayedin Fig. 4 were up-regulated transcripts of FOXP3,CD25, and cytotoxic T-lymphocyte-associated antigen-4 (CTLA-4), transforming growth factor beta (TGF-b), and CD4 and down-regulated transcripts of che-mokine (C-C motif ) receptor 3, apolipoprotein C4(ApoC-IV) and collagen type IV (Supporting Table 4).Also, a number of proteins known to be involved inlymphocyte and DC activation (e.g., IL-3, IL-7, IL-13,macrophage inflammatory protein 1-alpha [MIP-1a],and CD40), lymphocyte trafficking (e.g., vascular celladhesion molecule [VCAM-1] and pulmonary andactivation-regulated chemokine [PARC]), and renalinjury (e.g., tumor necrosis factor–related apoptosis-inducing ligand receptor 3 [TRAIL-R3], MIP-1a, and
Fig. 3. Effect of patient preconversion (TAC) and postconversion(SRL) sera on lymphoproliferation and Treg generation in MLR. First, 5� 105 carboxyfluorescein succinimidyl ester–labeled respondingPBMCs from healthy volunteers were cultured with 5 � 105 PKH26-la-beled X-irradiated HLA-2DR matched stimulator cells in the presenceof the indicated heat-inactivated serum samples (final, 50%). Stand-ard 3H-TdR incorporation assays were also performed with 1 � 105
each of the responders and stimulators in the presence of the indi-cated sera. The results from peak responses on day 7 are depicted in(A). In parallel, flow-cytometric analysis was also performed on day 7and is depicted in (B). Both preconversion (TAC) and postconversion(SRL) sera inhibited lymphoproliferation by 3H-TdR incorporation (A; *P< 0.05), but only the preconversion sera (TAC) significantly inhibitedthe generation of new CD4þCD127�CD25HighFOXP3þ Tregs (**P <0.01) (B). To minimize variation between experiments, the data aredepicted as percentage of medium control. Only 13 MLRs were per-formed because the amount of pre- and post-conversion sera availablefrom the remaining seven patients was inadequate to conduct theseexperiments.
Table 3. Proteomic Profile Changes With TAC to SRLConversion
Fold Change (Post Verus Pre) P Value
IL-7 �8.83 0.0037
IL-3 �3.49 0.0053
IL-13 �2.24 0.0026
PARC �1.82 2.15E-06
Ferritin �1.66 0.0115
TFF3 �1.43 0.0020
CD5 �1.43 0.0104
MIP-1a �1.38 9.14E-05
Sex hormone-binding globulin �1.36 0.0066
IL-18 �1.32 0.0049
CD40 antigen �1.31 0.0095
TRAIL-R3 �1.25 0.0008
AXL receptor tyrosine kinase �1.20 0.0097
VCAM-1 �1.16 0.0107
Complement C3 1.22 0.0022
Haptoglobin 1.37 0.0057
Serum amyloid P-component 1.38 0.0001
Cancer antigen 125 1.40 0.0050
Factor VII 1.43 0.0011
Matrix metalloproteinase-3 1.43 6.42E-05
Glutathione S-transferase alpha 2.07 0.0020
Pancreatic polypeptide 2.65 0.0068
HEPATOLOGY, Vol. 000, No. 000, 2012 LEVITSKY ET AL. 7
trefoil factor 3 [TFF3]) were down-regulated after con-version (Table 3). The relevance of the changes in theremaining proteins (Table 3) to the present study isnot known.
Discussion
This study complements previous reports supportingthe immunoregulatory properties of mTOR inhibitortherapy.16-18,22,36 First, Treg populations increased pro-spectively in all key immune compartments studied(e.g., blood, marrow, and allograft) after SRL conver-sion. This provides a more robust classification ofpatients that might be ‘‘tolerance prone,’’ rather thansingle time-point analysis of peripheral blood.8,19 Spec-ulatively, these intragraft FOXP3þ cells promoted bySRL might regulate immune responses and facilitatetolerance.8,37 Second, the serial paired data on mono-therapy conversion provide support that these changeswere directly caused by SRL. Third, to our knowledge,this study is the first to analyze serial changes in DCprofiles and supports SRL therapy promoting tolero-genic DCs.18,38,39 Finally, the functional and proteoge-nomic regulatory signatures coincided with the pheno-typic cellular markers of immunoregulation after SRLconversion. Sera from patients on SRL inhibited lym-phoproliferation alloreactivity, but did not inhibit Treggeneration as did TAC sera, possibly because of theaction of SRL itself or other regulatory serum pro-
teins.40 Many of the genes/proteins were up-regulated(immunoregulatory pathways) or down-regulated (kid-ney injury pathways) by conversion, supporting theircombined use as surrogate tolerance signatures.9,26
Previous reports have demonstrated differences in theeffects of CNIs versus mTOR inhibitors on Tregs andDCregs.14,16,17,41 Tacrolimus inhibits cytokines (e.g.,IL-2) important in FOXP3 expression and Treg func-tion.7 In contrast, SRL inhibits postactivation signaling(e.g., phosphatidylinositol 3-kinase/mTOR pathways)and does not block IL-2 production or other cascades(e.g., signal transducer and activator of transcription 5)involved in Treg generation.14,17,39,42 Likewise, we dem-onstrated allo-specific inhibition and Treg generation bySRL versus TAC in vitro (22) and reported higherblood Tregs in LT recipients on SRL versus TAC.19
Moreover, while CNIs have little effect on DC func-tion, SRL impairs DC maturation, generation, andcostimulation.18 The resulting immature DCs are lesscapable of allo-stimulation and more proficient in gen-erating allo-specific Tregs.39,43 Alternatively, the reverseregulatory process might occur, given that FOXP3þ
suppressor T cells can induce ILT3/4 on DCs, render-ing them tolerogenic.44 Though our study did notdemonstrate an increase in plasmacytoid (CD123þ) tomyeloid (CD11cþ) DC ratios observed previously intolerant LT patients,5 an increase in negative costimu-latory molecules (e.g., ILT3 and ILT4) occurred afterconversion. In addition, the plasma costimulatory
Fig. 4. Heat map of immune/inflammatory gene transcripts (n¼ 93) before and after TAC toSRL conversion. The bottom half ofthe heat map (yellow bar on theleft) represents the peripheralblood gene transcripts present inpatients preconversion (TAC),whereas the top half (red bar onthe left) represents the transcriptspostconversion (SRL). Below theheat map is the color coding ofgene transcripts: red signifies up-regulation, blue down-regulation,and gray unchanged. The color gra-dation represents the intensity ofthe signal in log value. Moredetails are given in Supporting Ta-ble 4.
8 LEVITSKY ET AL. HEPATOLOGY, Month 2012
CD40 protein was reduced, which might also signifyimpairment of DC allo-activation and enhancedimmunoregulation.Supporting the immunophenotyping data, SRL con-
version led to enhanced peripheral blood transcriptexpression of known Treg markers (e.g., CD4,FOXP3, CD25, and CTLA-4) and Treg-enhancingcytokines (e.g., TGF-b). In addition, proteins involvedin lymphocyte responses (e.g., IL-3, IL-7, and IL-13),trafficking and adhesion (e.g., VCAM-1 and PARC),and DC development and costimulation (e.g., MIP-1aand CD40) were down-regulated (Table 3). Interest-ingly, other genes (e.g., ApoC-IV and collagen typeIV) and proteins (e.g., TFF3, factor VII, TRAIL-R3,and MIP-1a) often associated with renal dysfunctionwere down-regulated, correlating clinically with eGFRimprovement. Two (e.g., TFF3 and factor VII) wereassociated with chronic kidney disease after LT in ourrecent report.26 This might be merely related to CNIwithdrawal, although SRL has antifibrotic effects45
that might improve renal function.Several limitations in this report need to be men-
tioned. First, our final enrollment was only 20patients, although our tolerability was somewhat betterthan trials in which �30% could not tolerate SRL.This is possibly the result of our monotherapy patientsbeing further out from LT and targeted for lowertrough levels. Second, many of the biopsies did notgrow in culture media designed to expand Tregs, pre-cluding a pre- and postconversion statistical analysis.However, several biopsies had new or higher Treg per-centages after conversion. Also, the increased CD4þ
and FOXP3þ cells (i.e., putative Tregs) on IHC stain-ing might be more directly indicative of the regulatorycell changes within the allograft. Third, because donorcells were not available, we could not assess the effectof SRL conversion on donor-specific immunoregula-tion observed in vitro.21 Finally, our preliminaryresults, particularly the proteogenomic analysis, needto be validated in larger, prospective patient cohorts.In conclusion, this study is consistent with the
notion that CNI to SRL conversion after LT couldtake advantage of the regulatory properties of SRL andallow more successful subsequent IS minimizationand/or full withdrawal.
References1. Ojo AO, Held PJ, Port FK, Wolfe RA, Leichtman AB, Young EW,
et al. Chronic renal failure after transplantation of a nonrenal organ. NEngl J Med 2003;349:931-940.
2. Levitsky J. Operational tolerance: past lessons and future prospects.Liver Transpl 2011;17:222-232.
3. Sykes M. Chimerism and central tolerance. Curr Opin Immunol 1996;8:694-703.
4. Chatzipetrou MA, Mathew JM, Kenyon NS, Esquenazi V, Miller J,Ricordi C, Tzakis AG. Analysis of post-transplant immune status inrecipients of liver/bone marrow allografts. Hum Immunol 1999;60:1281-1288.
5. Mazariegos GV, Zahorchak AF, Reyes J, Ostrowski L, Flynn B, ZeeviA, Thomson AW. Dendritic cell subset ratio in peripheral blood corre-lates with successful withdrawal of immunosuppression in liver trans-plant patients. Am J Transplant 2003;3:689-696.
6. Liu W, Putnam AL, Xu-Yu Z, Szot GL, Lee MR, Zhu S, et al. CD127expression inversely correlates with FoxP3 and suppressive function ofhuman CD4þ T reg cells. J Exp Med 2006;203:1701-1711.
7. Hori S, Nomura T, Sakaguchi S. Control of regulatory T cell develop-ment by the transcription factor Foxp3. Science 2003;299:1057-1061.
8. Li Y, Zhao X, Cheng D, Haga H, Tsuruyama T, Wood K, et al. Thepresence of Foxp3 expressing T cells within grafts of tolerant humanliver transplant recipients. Transplantation 2008;86:1837-1843.
9. Martinez-Llordella M, Lozano JJ, Puig-Pey I, Orlando G, Tisone G,Lerut J, et al. Using transcriptional profiling to develop a diagnostictest of operational tolerance in liver transplant recipients. J Clin Invest2008;118:2845-2857.
10. Mathew JM, Fuller L, Carreno M, Garcia-Morales R, Burke GW, 3rd,Ricordi C, et al. Involvement of multiple subpopulations of humanbone marrow cells in the regulation of allogeneic cellular immuneresponses. Transplantation 2000;70:1752-1760.
11. Miller J, Mathew J, Garcia-Morales R, Zucker KE, Carreno M, Jin Y,et al. The human bone marrow as an immunoregulatory organ. Trans-plantation 1999;68:1079-1090.
12. Fujisaki J, Wu J, Carlson AL, Silberstein L, Putheti P, Larocca R, et al.In vivo imaging of Treg cells providing immune privilege to the haema-topoietic stem-cell niche. Nature 2011;474:216-219.
13. Kawai T, Cosimi AB, Spitzer TR, Tolkoff-Rubin N, Suthanthiran M,Saidman SL, et al. HLA-mismatched renal transplantation withoutmaintenance immunosuppression. N Engl J Med 2008;358:353-361.
14. Gao W, Lu Y, El Essawy B, Oukka M, Kuchroo VK, Strom TB. Con-trasting effects of cyclosporine and rapamycin in de novo generation ofalloantigen-specific regulatory T cells. Am J Transplant 2007;7:1722-1732.
15. Szabo G, Gavala C, Mandrekar P. Tacrolimus and cyclosporine A in-hibit allostimulatory capacity and cytokine production of human mye-loid dendritic cells. J Investig Med 2001;49:442-449.
16. Battaglia M, Stabilini A, Roncarolo MG. Rapamycin selectivelyexpands CD4þCD25þFoxP3þ regulatory T cells. Blood 2005;105:4743-4748.
17. Baan CC, van der Mast BJ, Klepper M, Mol WM, Peeters AM, Kore-vaar SS, et al. Differential effect of calcineurin inhibitors, anti-CD25antibodies and rapamycin on the induction of FOXP3 in human Tcells. Transplantation 2005;80:110-117.
18. Hackstein H, Taner T, Zahorchak AF, Morelli AE, Logar AJ, GessnerA, Thomson AW. Rapamycin inhibits IL-4-induced dendritic cell matu-ration in vitro and dendritic cell mobilization and function in vivo.Blood 2003;101:4457-4463.
19. Levitsky J, Miller J, Wang E, Rosen A, Flaa C, Abecassis M, et al.Immunoregulatory profiles in liver transplant recipients on differentimmunosuppressive agents. Hum Immunol 2009;70:146-150.
20. Morard I, Dumortier J, Spahr L, Hadengue A, Majno P, Morel P, et al.Conversion to sirolimus-based immunosuppression in maintenance livertransplantation patients. Liver Transpl 2007;13:658-664.
21. Levitsky J, Miller J, Leventhal J, Huang X, Flaa C, Wang E, et al. Thehuman ‘‘Treg MLR’’: immune monitoring for FOXP3þ T regulatorycell generation. Transplantation 2009;88:1303-1311.
22. Levitsky J, Gallon L, Miller J, Tambur AR, Leventhal J, Flaa C, et al.Allospecific regulatory effects of sirolimus and tacrolimus in the humanmixed lymphocyte reaction. Transplantation 2011;91:199-206.
HEPATOLOGY, Vol. 000, No. 000, 2012 LEVITSKY ET AL. 9
23. Wertheimer AM, Bakke A, Rosen HR. Direct enumeration and func-tional assessment of circulating dendritic cells in patients with liver dis-ease. HEPATOLOGY 2004;40:335-345.
24. Fathman CG, Collavo D, Davies S, Nabholz M. In vitro secondaryMLR. I. Kinetics of proliferation and specificity of in vitro primed re-sponder cells. J Immunol 1977;118:1232-1238.
25. Nakorchevsky A, Hewel JA, Kurian SM, Mondala TS, Campbell D,Head SR, et al. Molecular mechanisms of chronic kidney transplantrejection via large-scale proteogenomic analysis of tissue biopsies. J AmSoc Nephrol 2010;21:362-373.
26. Levitsky J, Salomon DR, Abecassis M, Langfelder P, Horvath S, Friede-wald J, et al. Clinical and plasma proteomic markers correlating withchronic kidney disease after liver transplantation. Am J Transplant2011;11:1972-1978.
27. Oo YH, Weston CJ, Lalor PF, Curbishley SM, Withers DR, ReynoldsGM, et al. Distinct roles for CCR4 and CXCR3 in the recruitmentand positioning of regulatory T cells in the inflamed human liver. JImmunol 2010;184:2886-2898.
28. Zeevi A. Propagation of lymphoid cells from biopsies. In: Hahn A,Land GA, Rosemarie MS, eds. American Society of HistocompatibilityLaboratory Manual, 4th ed. (vol. 1). Mt. Laurel, NJ: American Societyfor Histocompatibility and Immunogenetics; 2000.
29. Poindexter NJ, Steward NS, Shenoy S, Brennan DC, Lowell J, SingerG, et al. Renal allograft infiltrating lymphocytes: frequency of tissuespecific lymphocytes. Hum Immunol 1997;55:140-147.
30. Eisenhart C. The assumptions underlying the analysis of variance. Bio-metrics 1947;3:1-21.
31. Li Y, Koshiba T, Yoshizawa A, Yonekawa Y, Masuda K, Ito A, et al.Analyses of peripheral blood mononuclear cells in operational toleranceafter pediatric living donor liver transplantation. Am J Transplant2004;4:2118-2125.
32. Mathew JM, Carreno M, Fuller L, Ricordi C, Tzakis A, Esquenazi V,Miller J. Modulatory effects of human donor bone marrow cells onallogeneic cellular immune responses. Transplantation 1997;63:686-692.
33. Manavalan JS, Rossi PC, Vlad G, Piazza F, Yarilina A, Cortesini R,et al. High expression of ILT3 and ILT4 is a general feature of tolero-genic dendritic cells. Transpl Immunol 2003;11:245-258.
34. Kowalski RJ, Post DR, Mannon RB, Sebastian A, Wright HI, Sigle G,et al. Assessing relative risks of infection and rejection: a meta-analysisusing an immune function assay. Transplantation 2006;82:663-668.
35. Cookson S, Doherty DG, Todryk S, Gibbs P, Portmann B, O’Grady J,et al. Hepatic expression of IL-15 mRNA is associated with liver graftacceptance. Transpl Immunol 2003;11:39-48.
36. Nikolaeva N, Bemelman FJ, Yong SL, van Lier RA, ten Berge IJ. Rapa-mycin does not induce anergy but inhibits expansion and differentia-tion of alloreactive human T cells. Transplantation 2006;81:445-454.
37. Bestard O, Cunetti L, Cruzado JM, Lucia M, Valdez R, Olek S, et al.Intragraft regulatory T cells in protocol biopsies retain Foxp3 demethy-lation and are protective biomarkers for kidney graft outcome. Am JTransplant 2011;11:2162-2172.
38. Chiang PH, Wang L, Bonham CA, Liang X, Fung JJ, Lu L, Qian S.Mechanistic insights into impaired dendritic cell function by rapamy-cin: inhibition of Jak2/Stat4 signaling pathway. J Immunol 2004;172:1355-1363.
39. Turnquist HR, Raimondi G, Zahorchak AF, Fischer RT, Wang Z,Thomson AW. Rapamycin-conditioned dendritic cells are poor stimula-tors of allogeneic CD4þ T cells, but enrich for antigen-specificFoxp3þ T regulatory cells and promote organ transplant tolerance. JImmunol 2007;178:7018-7031.
40. Creput C, Le Friec G, Bahri R, Amiot L, Charpentier B, Carosella E,et al. Detection of HLA-G in serum and graft biopsy associated withfewer acute rejections following combined liver-kidney transplantation:possible implications for monitoring patients. Hum Immunol 2003;64:1033-1038.
41. Zeiser R, Nguyen VH, Beilhack A, Buess M, Schulz S, Baker J, et al.Inhibition of CD4þCD25þ regulatory T-cell function by calcineurin-dependent interleukin-2 production. Blood 2006;108:390-399.
42. Lim DG, Koo SK, Park YH, Kim Y, Kim HM, Park CS, et al. Impactof immunosuppressants on the therapeutic efficacy of in vitro-expandedCD4þCD25þFoxp3þ regulatory T cells in allotransplantation. Trans-plantation;89:928-936.
43. Taner T, Hackstein H, Wang Z, Morelli AE, Thomson AW. Rapamy-cin-treated, alloantigen-pulsed host dendritic cells induce ag-specific Tcell regulation and prolong graft survival. Am J Transplant 2005;5:228-236.
44. Manavalan JS, Kim-Schulze S, Scotto L, Naiyer AJ, Vlad G, ColomboPC, et al. Alloantigen specific CD8þCD28� FOXP3þ T suppressorcells induce ILT3þ ILT4þ tolerogenic endothelial cells, inhibitingalloreactivity. Int Immunol 2004;16:1055-1068.
45. Patsenker E, Schneider V, Ledermann M, Saegesser H, Dorn C, Heller-brand C, Stickel F. Potent antifibrotic activity of mTOR inhibitors siro-limus and everolimus but not of cyclosporine A and tacrolimus inexperimental liver fibrosis. J Hepatol 2011;55:388-398.
10 LEVITSKY ET AL. HEPATOLOGY, Month 2012