systematic global macro - opalesque
TRANSCRIPT
Systematic Global Macro: Performance, Risk, and
Correlation Characteristics
January 2009
Prepared by: Peter Park
Senior Research Manager, Graham Capital Management National Science Foundation Graduate Research Fellow, Harvard University 1997 BS Massachusetts Institute of Technology 1996 Oguz Tanrikulu Senior Research Manager, Graham Capital Management PhD Imperial College, London 1995 MS Imperial College, London 1992 BS O.D.T.U, Turkey 1990
Guodong Wang Quantitative Research Analyst, Graham Capital Management PhD California Institute of Technology 2004 BS University of Science and Technology China 1999
PURSUANT TO AN EXEMPTION FROM THE COMMODITY FUTURES TRADING COMMISSION IN CONNECTION WITH ACCOUNTS OF QUALIFIED ELIGIBLE PERSONS, THIS BROCHURE OR ACCOUNT DOCUMENT IS NOT REQUIRED TO BE, AND HAS NOT BEEN, FILED WITH THE COMMISSION. THE COMMODITY FUTURES TRADING COMMISSION DOES NOT PASS UPON THE MERITS OF PARTICIPATING IN A TRADING PROGRAM OR UPON THE ADEQUACY OR ACCURACY OF COMMODITY TRADING ADVISOR DISCLOSURE. CONSEQUENTLY, THE COMMODITY FUTURES TRADING COMMISSION HAS NOT REVIEWED OR APPROVED THIS TRADING PROGRAM OR THIS BROCHURE OR ACCOUNT DOCUMENT.

Table of Contents
1. Overview 2. Strategy Description and Sources of Returns 3. Analysis of Returns Statistics 4. Portfolio Construction 5. Conclusion
- 2 -

I. Overview Hedge funds have experienced significant growth over the last few decades. Assets under management have grown from an estimated $100 billion in 1995 to more than $1.4 trillion at the end of 2008.1 As a rapidly maturing alternative asset class, hedge funds can offer investors increased opportunities to receive positive returns, enhance diversification, lower volatility, and improve overall risk-adjusted returns. This paper discusses one particular hedge fund style known as “systematic global macro”, first reviewing this style’s risk and performance characteristics, and then discussing why it should continue to be a successful and essential component of a diversified portfolio that invests across a variety of hedge fund strategies. Exhibit I: NAVs of Barclays Systematic Traders, S&P 500, and Lehman Bond Index
NAV Char t Jan 1, 1987 - Dec 31, 2008
-
2,000
4,000
6,000
8,000
10,000
12,000
87 88 89 90 91 92 93 94 95 96 97 98 99 00 01 02 03 04 05 06 07 08 09
Barclays SYSTEMATIC TRADERS Index S&P 500 Index Lehman Bond Index
*Start date of January 1987 is the first date all three indices have data. Systematic global macro funds have a track record of producing positive annual returns for more than twenty years2 with low to negative correlations to most other asset classes and hedge fund strategies; see Exhibit I. These funds may also be classified as global macro, managed futures, or trend-following/CTA. A breakdown of current hedge fund asset allocations by investment style as of Q3 2008 is presented in Exhibit II. More than $219 billion is allocated to the CTA or systematic global macro industry as of this date.3 1 Williamson 2009. 2 The Barclay Systematic Traders Index experienced a compounded annual return of 10.15% from January 1987 to December 2008. 3 See www.BarclayHedge.com
- 3 -

Exhibit II: Industry Asset Allocation
Indus try As s e t Allocation Through 3rd Qtr 2008
14.2%
12.3%
10.6%8.6%
11.9%
6.6%
5.1%1.1%3.2%
6.2%
9.3%
4.5%2.4% 2.7%1.3% Emerging Markets 14.2% Equity Long/Short 12.3%
Multi-Strategy 10.6% Equity Long Bias 8.6%
Managed Futures 11.9% Fixed Income 6.2%
Event Driven 9.3% Dis tres sed Securities 6.6%
Sector Specific 5.1% Macro 4.5%
Equity Market Neutral 3.2% Convertible Arbitrage 1.1%
Other 2.4% Equity Long-Only 2.7%
Merger Arbitrage 1.3%
*Source: BarclayHedge. A distinguishing feature of these programs is that they trade as many as 150 distinct liquid markets through futures and forward contracts in the currency, fixed income, equity, and commodity sectors on a 24-hour basis.4 Daily participants in these markets include hedgers, traders, and investors, many of whom make frequent adjustments to their positions. These conditions allow systematic global macro strategies to accommodate large capacity and provide the opportunity to diversify across many different markets and sectors on a variety of timescales. Although systematic global macro encompasses many diverse sub-strategies, most can be classified into two basic types: trend-following and relative value. Traditional trend-followers attempt to capture price trends in the intermediate to long-term, with typical durations between one and six months. Diversified trend-followers have expanded this target range of trend length in both directions, down to intraday and up to multi-year. This wide range of durations increases both diversification and capacity. The success of trend-following strategies relies on the existence of trends somewhere in the markets. Since trend-followers diversify across both markets and timeframes, it becomes quite likely that at any point in time, trends will be present in several market/timeframe combinations. The ultimate success of these strategies depends on 4 There are currently over 500 futures contracts approved by the CFTC.
- 4 -

balancing the profits gained from entering likely trends against the cost of entering trades and against the possible losses when trends do not emerge or reverse against the profits gained. Relative value strategies create portfolios where each position is dependent on at least some of the other positions in the portfolio. Examples include spread trading, yield-capturing strategies, and convergence trades. This approach leads to many new opportunities that are not available in an individual market-by-market analysis. The starting point for a typical relative value strategy is the identification of a mispricing in the marketplace. Success in systematically profiting from these mispricings is heavily dependent on the control of risk, since a mispricing may persist or widen beyond expectations. In the following sections, this paper will investigate the characteristics of systematic global macro programs in more detail. The analysis will focus on the perspective of institutions, fund-of-funds managers, and other asset allocators who have invested or are considering investing in these types of strategies. First, techniques employed by such strategies will be discussed. Next, the standalone performance of systematic global macro programs will be examined, taking into account statistical measures of risk beyond the annualized volatility of monthly returns. Finally, the benefits of the inclusion of such programs in the context of a portfolio of hedge fund strategies will be explored.
- 5 -

II. Strategy Description and Sources of Returns A. Description of Systematic Global Macro Although systematic global macro programs are diverse, they share many common characteristics. First, they typically trade the global futures and forwards markets in the commodities, currencies, equity indices, and fixed income sectors. Second, investment decisions are made algorithmically, based on mechanical rules devised through statistical and historical analysis. Futures markets provide a straightforward method for gaining exposure to many global markets across the fixed income, currencies, equity indices, and commodities sectors. The global nature of these markets attracts large numbers of both hedgers and speculators, leading to deep liquidity. Futures exchanges minimize credit risk and allow for standardized contract specifications. Furthermore, margin requirements are generally significantly less than in the cash markets, creating an opportunity to use leverage effectively.5 Finally, there is empirical evidence that market impact costs are smaller in the futures markets.6 In recent years, there has been a rapid increase in the quantity and complexity of quantitative financial research due to advances in finance theory and statistical techniques, the improved quality and depth of economic and financial data, and continued development in computing capability. Much of this research has been focused on the forecasting of future market prices. It is not surprising that in such an environment, systematic trading has become more prevalent and accepted as a viable method of trading. Systematic global macro programs use proprietary trading models to generate returns. This is also true for an increasing number of other hedge fund strategies, such as statistical arbitrage, convertible arbitrage, volatility arbitrage, mortgage arbitrage, and fixed income arbitrage. Furthermore, there are many other financial market activities that also rely heavily on statistical modeling, including reinsurance, securitization, credit insurance, and asset allocation modeling. These activities have the goal of creating or taking advantage of potential investment opportunities through the use of sophisticated, and in almost all cases, proprietary trading models. The same is true for systematic global macro. The basic methodologies used by systematic global macro programs are well documented in academic and financial literature.7 However, it is widely believed that the most innovative ideas in this space are
5 See Schwager, JD. 1984 for a comprehensive treatment on futures markets. 6 Burghardt, G. 2006 7 For example, Aronson, DR. 2006, Brown, K., 2006, Burstein, Gabriel 1999, Dunis, L., Laws, J. and Naim, P., 2003, Katz, JO and McCormick, DL. 2000, Kaufman, Perry J. 2005, James, J. 2003, Gatev, E. et al., 2006.
- 6 -

non-public, as they require high levels of investment to produce, and their efficacy degrades as the information becomes more widely known.8 Quantitative research is the first step in the creation of a systematic trading strategy. Consequently, most new entrants into this profession are trained or practicing scientists and engineers. Market phenomena are uncovered through statistical analyses of historical data. Mechanical trading rules are then constructed to exploit the market inefficiencies that are uncovered. Historical simulations of the trading algorithms are often used to frame expectations of future performance, including risk measures such as volatility and drawdown statistics. Systematic trading may hold some significant advantages over discretionary styles. For example, one of the challenges faced by a discretionary trader is the control of emotions during critical points of market activity or personal performance. In contrast, systematic trading programs are emotionless and do not suffer from this issue. Furthermore, firms that employ systematic trading programs benefit from a reduction in “key man” risk. The maintenance of systematic programs can be transferred from one person to another. The same cannot necessarily be said of discretionary trading prowess. In addition, trading systems are inherently far more scalable since they are, by nature, almost or entirely automated, and can thus far more readily accommodate new markets or new investor capital. Finally, systematic programs are typically more broadly diversified than discretionary traders, both in the number of markets analyzed and in the types of strategies employed. Systematic global macro programs are usually comprised of multiple strategies, most of which can be classified as either trend-following or relative value. Trend-following is one of the most mature and well-established systematic trading styles, with a 28-year track record of profitability.9 The basic strategy results in a payout profile that is similar to being long options;10 that is, the strategy experiences large profits when a trend emerges, but relatively small losses when trends fail to materialize or reverse. The similarity in payout structures results from how trend-followers typically set their trade entry and exit points. Trend-followers generally place stop orders to limit losses when trends reverse. However, most trend-followers will either not utilize take-profit orders or will have take-profit orders much further away from the entry price than the stop-loss orders. This asymmetry helps trend-following strategies capture the upside when price moves inline with the trend, while capping downside losses when the identified trend reverses or proves to have been false. Exhibit III provides an illustration of a trailing stop being hit after a major up move in the US 10-year note for a long-term trend-following system with a single entry and exit.
8 See Morris, S. 1994 for an interesting discussion on the effect of asymmetric information on trading decisions. 9 From January 1980 to December 2008, the Barclays CTA Index achieved a 2805% return, or 12.2% compounded average annual return. 10 Fung, W and Hsieh DA 2001
- 7 -
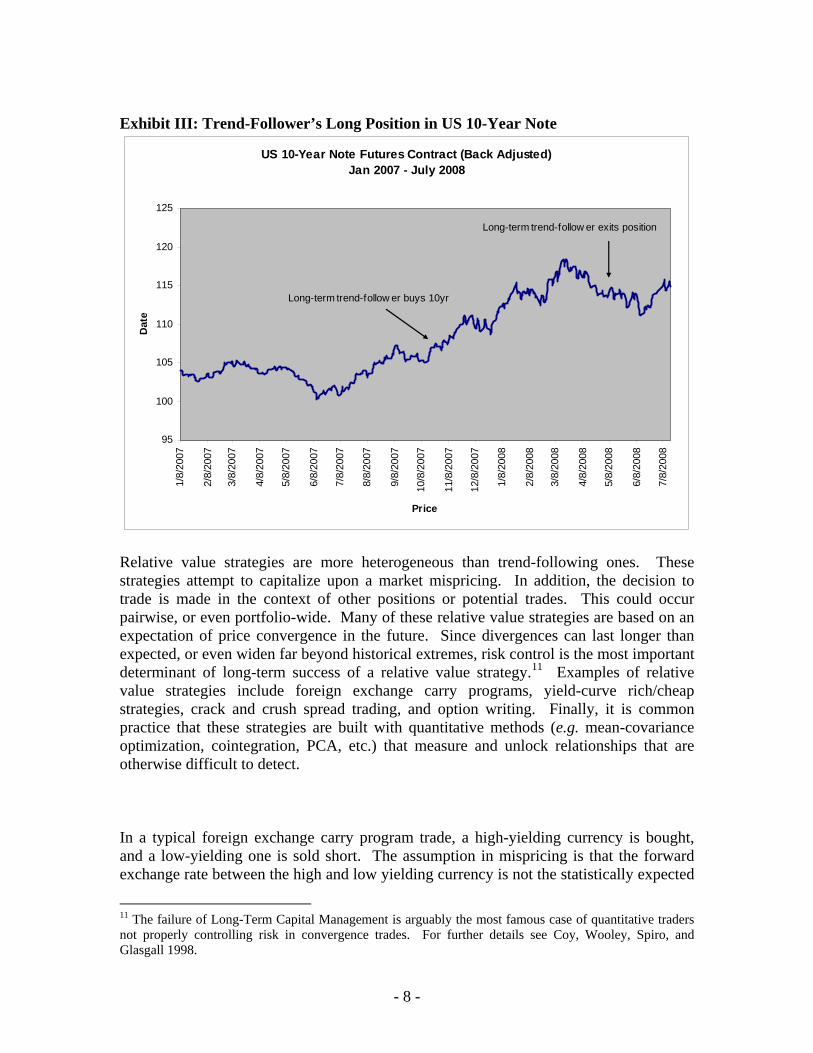
Exhibit III: Trend-Follower’s Long Position in US 10-Year Note
US 10-Year Note Futures Contract (Back Adjusted)Jan 2007 - July 2008
95
100
105
110
115
120
125
1/8/
2007
2/8/
2007
3/8/
2007
4/8/
2007
5/8/
2007
6/8/
2007
7/8/
2007
8/8/
2007
9/8/
2007
10/8
/200
7
11/8
/200
7
12/8
/200
7
1/8/
2008
2/8/
2008
3/8/
2008
4/8/
2008
5/8/
2008
6/8/
2008
7/8/
2008
Price
Dat
e
Long-term trend-follow er buys 10yr
Long-term trend-follow er exits position
Relative value strategies are more heterogeneous than trend-following ones. These strategies attempt to capitalize upon a market mispricing. In addition, the decision to trade is made in the context of other positions or potential trades. This could occur pairwise, or even portfolio-wide. Many of these relative value strategies are based on an expectation of price convergence in the future. Since divergences can last longer than expected, or even widen far beyond historical extremes, risk control is the most important determinant of long-term success of a relative value strategy.11 Examples of relative value strategies include foreign exchange carry programs, yield-curve rich/cheap strategies, crack and crush spread trading, and option writing. Finally, it is common practice that these strategies are built with quantitative methods (e.g. mean-covariance optimization, cointegration, PCA, etc.) that measure and unlock relationships that are otherwise difficult to detect. In a typical foreign exchange carry program trade, a high-yielding currency is bought, and a low-yielding one is sold short. The assumption in mispricing is that the forward exchange rate between the high and low yielding currency is not the statistically expected
11 The failure of Long-Term Capital Management is arguably the most famous case of quantitative traders not properly controlling risk in convergence trades. For further details see Coy, Wooley, Spiro, and Glasgall 1998.
- 8 -

price of the future spot exchange rate12. If this premise holds, buying high-yielding currencies while shorting low-yielding ones in the forward market could be a long-term profitable strategy. It is also well known that this type of trade can move violently against the strategy both in speed and magnitude.13 Thus, proper risk control is one key feature of carry programs that distinguishes successful ones from those that ultimately fail. Systematic traders also employ trading models that cannot be classified as either trend-following or relative value. Examples include pattern recognition, cyclical analysis, and fundamental analysis. B. Speculators, Hedgers, and “Zero-Sum” Trading Futures and forwards trading are often thought of as a “zero-sum” game. Since futures contracts are created by one party going long while another goes short, every price change of the contract leads to equal gains and losses. If all futures traders had positions only in futures contracts, and they traded only with each other, then all profits and losses would sum to zero (ignoring the interest earned on margin cash). This is in contrast to a cash market, such as single stock equities, where an up move in the stock market would create net wealth if there were a net long position amongst all participants. This concept depends on the assumption that all futures traders only have positions in futures markets. In reality, a large portion of participants in the futures markets are hedgers who operate businesses that need to hedge commodity, currency, and interest rate risk. In addition to these traditional hedgers, there are speculators such as market-makers and arbitrageurs that access the futures market to hedge across asset classes. These agents link the futures and cash markets together, expanding the closed system to an open one where trading is not constrained to be zero-sum. Thus the expected value of trading in futures markets for speculators as a whole is in fact non-zero in practice. The Keynesian notion of a “natural risk premium” suggests this expected value should in fact be positive;14 he argued that speculators in futures should receive a positive expected value by assuming a risk transfer from hedgers. In summary, futures traders can benefit from the wealth transfer across asset classes by traditional and non-traditional hedgers. The long track record of systematic global macro empirically supports this conclusion.
12 Hochradl and Wagner 2007. 13 Brunnermeier, M . et al., 2008. 14 Gray, R.W. and D.J.S. Rutledge. 1971
- 9 -

C. Conclusion Systematic global macro programs use statistical financial modeling with known quantitative techniques to execute both trend-following and relative value strategies in the global futures and forwards markets. The investment style has over a twenty-year track record demonstrating its viability. Hedgers provide the opportunity for speculators as a whole to earn positive returns due to the open nature of the financial markets, and the potential premium for accepting the transfer of price risk.
- 10 -

III. Analysis of Returns Statistics A. Stand-Alone Performance Analysis In the analysis of the historical performance of hedge fund styles, it is common to characterize the returns distribution with certain standard descriptive statistics. These usually include the first four moments of the distribution, as well as the autocorrelation of the returns. To capture properties beyond these, more sophisticated statistical techniques need to be employed. The first moment of a distribution is the mean. The second centralized moment is the variance, which measures the amount of dispersion in the data. Frequently, volatility, the square root of variance, is used rather than variance itself. The most commonly used metric of strategy performance is the information ratio, which is the same as the Sharpe ratio when the risk-free rate is set to zero. This is the ratio between the annualized return and annualized volatility; it implicitly assumes that volatility is a full measure of risk. When a distribution can be fully characterized by its first two moments (e.g. the normal distribution), the information ratio will be an appropriate measurement of reward versus risk. But when returns are not normally distributed, sole use of an information ratio may lead to a mis-estimation of the potential reward per unit risk. Exhibit IV below contains annualized information ratios for the major hedge fund style indices from January 1994 to December 2008 using monthly returns data. The start date is chosen to coincide with the beginning of the CSFB/Tremont hedge fund data. The Barclays Systematic Traders Index is chosen to represent the hedge fund style of systematic global macro, as CSFB/Tremont does not report an appropriate index for this investment style. It should be noted that since the subsequent analysis is based on hedge fund style indices, the statistical inference is applicable for a diversified portfolio of hedge funds of a particular style, not for the average hedge fund of a particular style. Exhibit IV: Annualized Information Ratios
Annualized
Return
Annualized Volatility of
Monthly Returns
Annualized Information
Ratio BARCLAYS SYSTEMATIC TRADERS 6.78% 9.44% 0.72 CSFB/Tremont Equity Market Neutral 5.57% 11.03% 0.51 CSFB/Tremont Multi-Strategy 7.00% 5.42% 1.29 CSFB/Tremont Fixed Income Arbitrage 3.47% 6.00% 0.58 CSFB/Tremont Event Driven 9.60% 6.11% 1.57 CSFB/Tremont Convertible Arbitrage 5.45% 6.84% 0.80 CSFB/Tremont Long/Short Equity 9.72% 10.22% 0.95 CSFB/Tremont Global Macro 12.47% 10.57% 1.18 CSFB/Tremont Dedicated Short Bias -0.78% 16.96% -0.05 CSFB/Tremont Emerging Markets Index 6.70% 15.85% 0.42
* For period January 1994 to December 2008
- 11 -

When non-normality is encountered, higher moments need to be analyzed as well. The third centralized moment, skew, is a measure of a distribution’s symmetry. Skew of zero indicates the distribution is symmetric; negative skew distributions have thicker left tails than right, with positive skew distributions having thinner left tails than right tails. The fourth centralized moment is kurtosis. Kurtosis is a measurement of how thick tailed the distribution is, with excess kurtosis being kurtosis relative to a normal distribution. Thus, excess kurtosis of zero indicates the distribution has the realization of tail events occurring at about the same frequency as a normal distribution. Platykurtic distributions have negative excess kurtosis, being more thin-tailed than the normal distribution. Conversely, leptokurtic distributions (i.e. those with positive excess kurtosis) are more fat-tailed than normal distributions. All else being equal, an investor would prefer strategies with the most positive skew and the most negative excess kurtosis. These would be strategies with the fewest occurrences of large negative returns. Another method of measuring this property is the ratio of upside to downside volatility. Low upside-to-downside volatility ratios imply that the underlying strategy has a short option profile, with large losses occurring more frequently than large gains. This undesirable property can also be detected through a negative skew with high excess kurtosis (fat left tail). Exhibit V: Descriptive Statistics of Strategy Monthly Returns
Monthly Upside
Volatility
Monthly Downside Volatility
Upside / Downside Volatility Skewness
Excess Kurtosis
BARCLAYS SYSTEMATIC TRADERS 2.65% 2.81% 0.94 0.22 0.14 CSFB/Tremont Equity Market Neutral 0.81% 7.69% 0.11 -11.92 151.16 CSFB/Tremont Multi-Strategy 1.00% 2.81% 0.35 -1.94 6.47 CSFB/Tremont Fixed Income Arbitrage 0.77% 3.26% 0.24 -4.59 29.09 CSFB/Tremont Event Driven 1.08% 3.20% 0.34 -2.68 14.37 CSFB/Tremont Convertible Arbitrage 1.06% 3.39% 0.31 -3.53 19.00 CSFB/Tremont Long/Short Equity 2.56% 3.57% 0.72 0.02 3.40 CSFB/Tremont Global Macro 2.53% 4.12% 0.61 -0.03 2.93 CSFB/Tremont Dedicated Short Bias 5.45% 4.32% 1.26 0.77 1.64 CSFB/Tremont Emerging Markets Index 3.74% 5.68% 0.66 -0.73 4.47
* For period January 1994 to December 2008 These ratios for the different hedge fund styles are reported in Exhibit V. Most strategies have a low upside/downside volatility ratio, with only Systematic Traders and Dedicated Short Bias having a ratio around or above one. A low upside/downside volatility ratio would indicate the returns distribution is skewed towards the left, indicating a short option type of strategy. This is confirmed by analyzing skewness and kurtosis. Of the eight styles with low upside/downside volatility ratios, seven of them have negative skewness with positive excess kurtosis. Furthermore, this group of seven contains the six styles with the highest excess kurtosis. The table above also suggests that it is likely that these monthly returns are not distributed normally. One of the most widely used tests for measuring a distribution’s
- 12 -
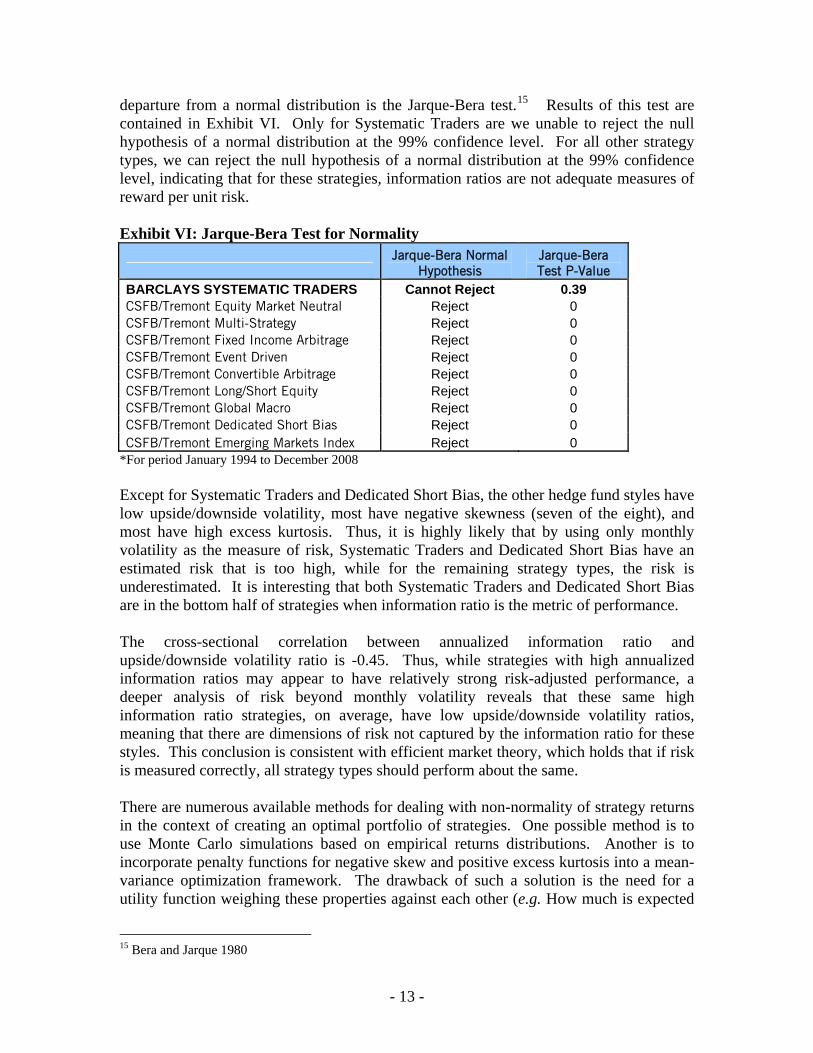
departure from a normal distribution is the Jarque-Bera test.15 Results of this test are contained in Exhibit VI. Only for Systematic Traders are we unable to reject the null hypothesis of a normal distribution at the 99% confidence level. For all other strategy types, we can reject the null hypothesis of a normal distribution at the 99% confidence level, indicating that for these strategies, information ratios are not adequate measures of reward per unit risk. Exhibit VI: Jarque-Bera Test for Normality
Jarque-Bera Normal
Hypothesis Jarque-Bera Test P-Value
BARCLAYS SYSTEMATIC TRADERS Cannot Reject 0.39 CSFB/Tremont Equity Market Neutral Reject 0 CSFB/Tremont Multi-Strategy Reject 0 CSFB/Tremont Fixed Income Arbitrage Reject 0 CSFB/Tremont Event Driven Reject 0 CSFB/Tremont Convertible Arbitrage Reject 0 CSFB/Tremont Long/Short Equity Reject 0 CSFB/Tremont Global Macro Reject 0 CSFB/Tremont Dedicated Short Bias Reject 0 CSFB/Tremont Emerging Markets Index Reject 0
*For period January 1994 to December 2008 Except for Systematic Traders and Dedicated Short Bias, the other hedge fund styles have low upside/downside volatility, most have negative skewness (seven of the eight), and most have high excess kurtosis. Thus, it is highly likely that by using only monthly volatility as the measure of risk, Systematic Traders and Dedicated Short Bias have an estimated risk that is too high, while for the remaining strategy types, the risk is underestimated. It is interesting that both Systematic Traders and Dedicated Short Bias are in the bottom half of strategies when information ratio is the metric of performance. The cross-sectional correlation between annualized information ratio and upside/downside volatility ratio is -0.45. Thus, while strategies with high annualized information ratios may appear to have relatively strong risk-adjusted performance, a deeper analysis of risk beyond monthly volatility reveals that these same high information ratio strategies, on average, have low upside/downside volatility ratios, meaning that there are dimensions of risk not captured by the information ratio for these styles. This conclusion is consistent with efficient market theory, which holds that if risk is measured correctly, all strategy types should perform about the same. There are numerous available methods for dealing with non-normality of strategy returns in the context of creating an optimal portfolio of strategies. One possible method is to use Monte Carlo simulations based on empirical returns distributions. Another is to incorporate penalty functions for negative skew and positive excess kurtosis into a mean-variance optimization framework. The drawback of such a solution is the need for a utility function weighing these properties against each other (e.g. How much is expected
15 Bera and Jarque 1980
- 13 -

return worth in terms of an extra unit of kurtosis?). Other solutions rely on portfolio metrics that take into account other aspects of return distributions, such as the Calmar ratio. Nevertheless, it seems reasonable to assume that for the same expected return and volatility, investors would generally prefer thinner tails and positive skew. Most investors are interested in yearly performance statistics, yet most hedge fund performance data is reported monthly. Thus, these monthly numbers need to be annualized (the process through which data of a certain frequency are transformed to a yearly frequency). In order to annualize volatility, it is common practice to multiply by a factor that is the square root of time. For example, to annualize monthly volatility, the monthly volatility is multiplied by the square root of twelve to obtain an annualized volatility. There is an implicit assumption in this calculation that each month’s return is uncorrelated to the returns of previous months. The annualizing calculation will only be correct if monthly returns exhibit no autocorrelation. If there is positive (negative) autocorrelation, the true annual volatility will in fact be greater (lesser) than the annualized volatility.16 Exhibit VII shows the monthly lag-one autocorrelation statistic for each of the hedge fund styles. Only Systematic Traders has a negative lag-one autocorrelation, while the other strategy types exhibit positive lag-one autocorrelations. Thus, by using annualized volatility as the measure of risk, a potential investor would be overestimating risk for Systematic Traders while underestimating risk for the other hedge fund styles. The Ljung-Box test provides a means of testing the overall likelihood of autocorrelation by testing randomness over a number of lags simultaneously rather than focusing on a single lag.17 Results are in Exhibit VIII. We can reject, at the 95% confidence level, the null hypothesis of no presence of autocorrelation in the first eleven lags of monthly returns for seven of the ten strategy types: only Systematic Traders, Equity Market Neutral, and Dedicated Short Bias do not exhibit statistically significant autocorrelations in lags 1-11 of monthly returns. This evidence makes it apparent that implicitly assuming zero autocorrelation by annualizing monthly returns with simple square-root-time scaling is simply not correct for most of these investment styles. 16 The formula to annualize monthly volatility while taking into account autocorrelations of lags 1 to 11 is:
∑=
−+=11
1)12(212
iiiMonthlyAnnualized ρσσ iρ represents lag i autocorrelation. where
17 Box and Ljung 1978
- 14 -

Exhibit VII: One-Month Lag Autocorrelation Coefficients
One Month
Lag BARCLAYS SYSTEMATIC TRADERS -0.01 CSFB/Tremont Equity Market Neutral 0.08 CSFB/Tremont Multi-Strategy 0.35 CSFB/Tremont Fixed Income Arbitrage 0.51 CSFB/Tremont Event Driven 0.39 CSFB/Tremont Convertible Arbitrage 0.57 CSFB/Tremont Long/Short Equity 0.22 CSFB/Tremont Global Macro 0.10 CSFB/Tremont Dedicated Short Bias 0.09 CSFB/Tremont Emerging Markets Index 0.32
*For period January 1994 to December 2008 Exhibit VIII: Ljung-Box Test for No Autocorrelation in Lags 1-11
Ljung-Box Test Lags 1-11
No Autocorrelation Ljung-Box Test
P -Value BARCLAYS SYSTEMATIC TRADERS Cannot Reject 0.15 CSFB/Tremont Equity Market Neutral Cannot Reject 0.99 CSFB/Tremont Multi-Strategy Reject 0.00 CSFB/Tremont Fixed Income Arbitrage Reject 0.00 CSFB/Tremont Event Driven Reject 0.00 CSFB/Tremont Convertible Arbitrage Reject 0.00 CSFB/Tremont Long/Short Equity Reject 0.00 CSFB/Tremont Global Macro Reject 0.02 CSFB/Tremont Dedicated Short Bias Cannot Reject 0.78 CSFB/Tremont Emerging Markets Index Reject 0.00
*For period January 1994 to December 2008 Autocorrelations of monthly returns for lags one to eleven can be estimated. With these eleven estimates, the calculation of annualizing volatility can be made more precise by including the effect of these autocorrelations, avoiding the implicit assumption of no autocorrelation of monthly returns. In this paper, the terms “annual volatility” and “annual information ratio” will be used to describe annualized volatility and the annualized information ratio incorporating the effects of estimated autocorrelations of monthly returns. The terms “annualized volatility” and “annualized information ratio” will refer to the standard annualizing process with the implicit assumption of no autocorrelation of monthly returns. Exhibit IX compares the use of annualized volatility versus annual volatility. The differences are striking. If monthly returns are annualized without incorporating autocorrelations, Systematic Traders has a 0.72 information ratio, while the (equal-weight) average across the other nine strategy types is 0.81. If autocorrelations are
- 15 -

properly accounted for in the calculations, Systematic Traders has an information ratio of 0.93, versus an average of 0.56 for the other nine strategy types. Clearly, ignoring autocorrelations in the presence of autocorrelation of monthly returns can lead to large errors in the estimation of risk. Exhibit VII has already made clear that most strategies do in fact display this type of autocorrelation.
Exhibit IX: Comparison of Annualized Versus Annual Information Ratios
Annualized
Return
Annualized Volatility of
Monthly Returns
Volatility of Annual
Return
Annualized Information
Ratio
Annual Information
Ratio
Information Ratio
Difference
BARCLAYS SYSTEMATIC TRADERS 6.78% 9.44% 7.32% 0.72 0.93 0.21 CSFB/Tremont Equity Market Neutral 5.57% 11.03% 13.02% 0.51 0.43 -0.08 CSFB/Tremont Multi-Strategy 7.00% 5.42% 9.09% 1.29 0.77 -0.52 CSFB/Tremont Fixed Income Arbitrage 3.47% 6.00% 9.86% 0.58 0.35 -0.23 CSFB/Tremont Event Driven 9.60% 6.11% 9.45% 1.57 1.02 -0.56 CSFB/Tremont Convertible Arbitrage 5.45% 6.84% 12.76% 0.80 0.43 -0.37 CSFB/Tremont Long/Short Equity 9.72% 10.22% 13.07% 0.95 0.74 -0.21 CSFB/Tremont Global Macro 12.47% 10.57% 12.77% 1.18 0.98 -0.20 CSFB/Tremont Dedicated Short Bias -0.78% 16.96% 15.00% -0.05 -0.05 -0.01
CSFB/Tremont Emerging Markets Index 6.70% 15.85% 20.54% 0.42 0.33 -0.10 *For period January 1994 to December 2008
Exhibit X quantifies the estimation error by not including autocorrelations in the annualizing process. Such an error overestimates the annual volatility of Systematic Traders by 29% while underestimating the annual volatility of the other nine strategy types by an average of 25%. Exhibit X: Estimation Error of Annual Volatility By Not Including Autocorrelations
Estimation Error of Annual Volatility
SYSTEMATIC TRADERS 29% CSFB/Tremont Equity Market Neutral -15% CSFB/Tremont Multi-Strategy -40% CSFB/Tremont Fixed Income Arbitrage -39% CSFB/Tremont Event Driven -35% CSFB/Tremont Convertible Arbitrage -46% CSFB/Tremont Long/Short Equity -22% CSFB/Tremont Global Macro -17% CSFB/Tremont Dedicated Short Bias 13% CSFB/Tremont Emerging Markets Index -23%
*For period January 1994 to December 2008 Exhibit XI provides further evidence of both non-normality and autocorrelation of monthly returns. It presents the ratio of the maximum drawdown in the historical period divided by the annualized volatility of monthly returns for each hedge fund style. If strategies had the same information ratio and monthly returns were uncorrelated and distributed normally, then this ratio should be about the same for the different strategy types. The most likely explanation for the varying ratios is that some strategies exhibit
- 16 -

strong positive autocorrelation, making it more likely for a drawdown to be large. Furthermore, distributions with negative skew and high kurtosis should also experience deeper drawdowns. Systematic Traders has the smallest magnitude ratio of 1.07, most likely due to the lack of autocorrelation in monthly returns accompanied by positive skew as well as low kurtosis returns. Exhibit XI: Maximum Drawdown in Units of Annualized Volatility
Max
Drawdown
Annualized Volatility of Monthly
Returns
Max Drawdown/Annualized Volatility
BARCLAYS SYSTEMATIC TRADERS 10% 9% 1.07 CSFB/Tremont Equity Market Neutral 43% 11% 3.88 CSFB/Tremont Multi-Strategy 25% 5% 4.56 CSFB/Tremont Fixed Income Arbitrage 29% 6% 4.84 CSFB/Tremont Event Driven 19% 6% 3.09 CSFB/Tremont Convertible Arbitrage 33% 7% 4.80 CSFB/Tremont Long/Short Equity 22% 10% 2.12 CSFB/Tremont Global Macro 27% 11% 2.53 CSFB/Tremont Dedicated Short Bias 47% 17% 2.75 CSFB/Tremont Emerging Markets Index 45% 16% 2.85
*For period January 1994 to December 2008 There is an apparent contradiction in the above discussion. Distributional moments such as skew and kurtosis used to measure risk are computed with monthly returns data, but performance metrics like information ratio are based on an annual frequency. This can be resolved by the fact that investors are asymmetric in the time frames used to analyze potential gains and losses. It is reasonable to assume most sophisticated investors would not invest in a fund due to a few months of stellar performance, but would indeed exit a fund after only a few months of large losses. Also, the decision to invest in a fund is generally based on long-term performance. Hence, it is important to investigate annual performance as well as possible shorter-term losses. B. Performance Analysis in the Context of a Portfolio Considering the stand-alone performance of individual strategy indices is insufficient when investments in a number of different strategy types are to be combined as a portfolio. The unconditional correlations of the potential constituents are a significant factor, as well as conditional correlations on certain tail events occurring. Furthermore, any non-linear relationships that may exist between the strategies are not reflected in the ordinary linear correlations. All else being equal, the more uncorrelated a strategy type is with the other strategy types, the more beneficial it would be to include the uncorrelated strategy into the portfolio. Correlation is a standard measure of the linear relationship between two variables. When investigating the linear relationships in a system of more than two variables, principal component analysis (PCA) is a superior mathematical tool, as it evaluates the entire system at once. PCA examines all linear combinations of the
- 17 -

variables in the original data set and ranks them by their explanatory power, as measured by their ability to account for the variation in the data set. The combination that explains most of the variation is called the first principal component, and the orthogonal one that explains the next largest part of the variation becomes the second principal component, and so on. By examining the constituents of this first component, variables that are most unlike the others in the context of the dominant factor can be determined. Exhibit XII shows the factor loadings in the first principal component of the ten hedge fund styles’ monthly return series. This first principal component explains 49% of the variance in the system, a significant number given there are ten components. The PCA reveals that only the Systematic Traders Index does not contribute to the first component, with Dedicated Short Bias contributing highly negatively. The other eight hedge fund styles contribute to the first component in the same positive direction, revealing a commonality not shared by Systematic Traders or Dedicated Short Bias. The fact that Systematic Traders is absent from the first component demonstrates that while it is not one of the most important ingredients in explaining the variation of style returns over time, the variation that it does explain is uncorrelated with the dominant factor. That is, an allocation to Systematic Traders yields returns that are uncorrelated with the primary source of return in the hedge fund space. This would indicate that there would be more of a diversification benefit from the inclusion of these two strategies, than from the common eight. Exhibit XII: PCA First Component Loadings
PCA Factor Loading (First
Component) BARCLAYS SYSTEMATIC TRADERS -0.01 CSFB/Tremont Equity Market Neutral 0.11 CSFB/Tremont Multi-Strategy 0.08 CSFB/Tremont Fixed Income Arbitrage 0.12 CSFB/Tremont Event Driven 0.21 CSFB/Tremont Convertible Arbitrage 0.15 CSFB/Tremont Long/Short Equity 0.37 CSFB/Tremont Global Macro 0.21 CSFB/Tremont Dedicated Short Bias -0.61 CSFB/Tremont Emerging Markets Index 0.59
*For period January 1994 to December 2008
- 18 -
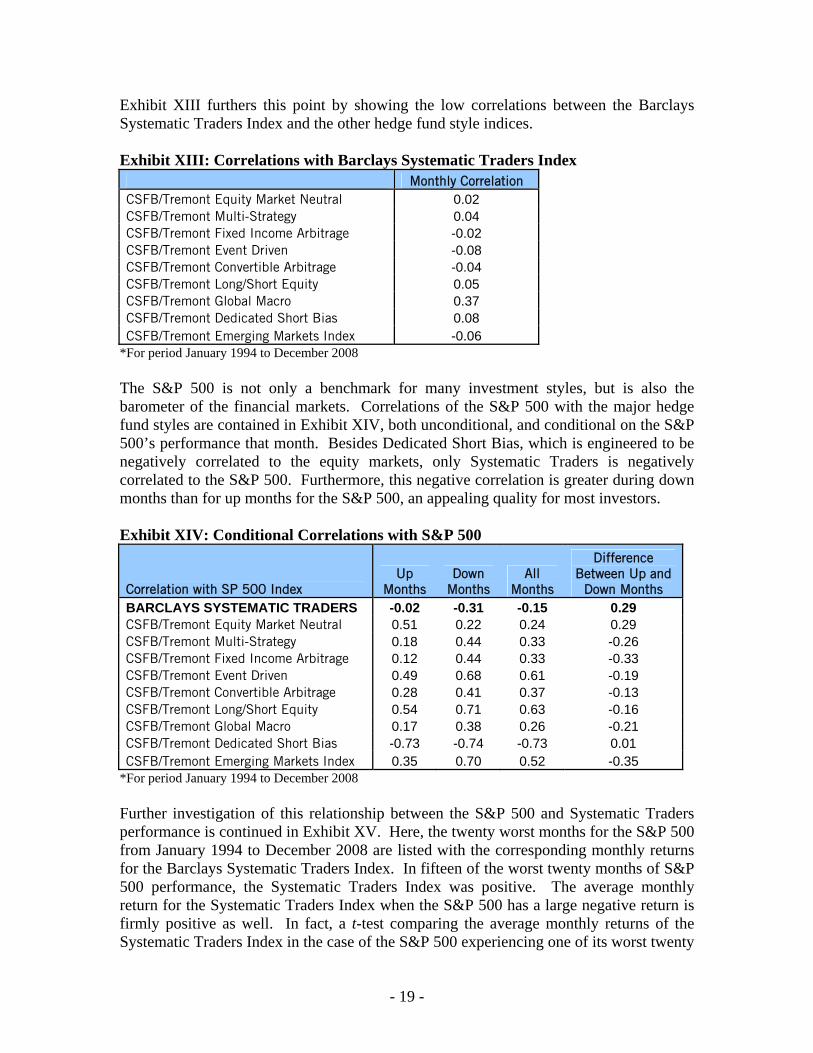
Exhibit XIII furthers this point by showing the low correlations between the Barclays Systematic Traders Index and the other hedge fund style indices. Exhibit XIII: Correlations with Barclays Systematic Traders Index Monthly Correlation CSFB/Tremont Equity Market Neutral 0.02 CSFB/Tremont Multi-Strategy 0.04 CSFB/Tremont Fixed Income Arbitrage -0.02 CSFB/Tremont Event Driven -0.08 CSFB/Tremont Convertible Arbitrage -0.04 CSFB/Tremont Long/Short Equity 0.05 CSFB/Tremont Global Macro 0.37 CSFB/Tremont Dedicated Short Bias 0.08 CSFB/Tremont Emerging Markets Index -0.06
*For period January 1994 to December 2008 The S&P 500 is not only a benchmark for many investment styles, but is also the barometer of the financial markets. Correlations of the S&P 500 with the major hedge fund styles are contained in Exhibit XIV, both unconditional, and conditional on the S&P 500’s performance that month. Besides Dedicated Short Bias, which is engineered to be negatively correlated to the equity markets, only Systematic Traders is negatively correlated to the S&P 500. Furthermore, this negative correlation is greater during down months than for up months for the S&P 500, an appealing quality for most investors. Exhibit XIV: Conditional Correlations with S&P 500
Correlation with SP 500 Index Up
Months Down
Months All
Months
Difference Between Up and
Down Months BARCLAYS SYSTEMATIC TRADERS -0.02 -0.31 -0.15 0.29 CSFB/Tremont Equity Market Neutral 0.51 0.22 0.24 0.29 CSFB/Tremont Multi-Strategy 0.18 0.44 0.33 -0.26 CSFB/Tremont Fixed Income Arbitrage 0.12 0.44 0.33 -0.33 CSFB/Tremont Event Driven 0.49 0.68 0.61 -0.19 CSFB/Tremont Convertible Arbitrage 0.28 0.41 0.37 -0.13 CSFB/Tremont Long/Short Equity 0.54 0.71 0.63 -0.16 CSFB/Tremont Global Macro 0.17 0.38 0.26 -0.21 CSFB/Tremont Dedicated Short Bias -0.73 -0.74 -0.73 0.01 CSFB/Tremont Emerging Markets Index 0.35 0.70 0.52 -0.35
*For period January 1994 to December 2008 Further investigation of this relationship between the S&P 500 and Systematic Traders performance is continued in Exhibit XV. Here, the twenty worst months for the S&P 500 from January 1994 to December 2008 are listed with the corresponding monthly returns for the Barclays Systematic Traders Index. In fifteen of the worst twenty months of S&P 500 performance, the Systematic Traders Index was positive. The average monthly return for the Systematic Traders Index when the S&P 500 has a large negative return is firmly positive as well. In fact, a t-test comparing the average monthly returns of the Systematic Traders Index in the case of the S&P 500 experiencing one of its worst twenty
- 19 -

months versus all other months results in a rejection of the null hypothesis that the average monthly return of the first subset of months is less than or equal to the average monthly return of the second subset of months at the 99% confidence level. In other words, it is statistically highly likely that the Systematic Traders Index performs much better than average when the S&P 500 has a very poor month than during the other months. Running the same test on the other hedge fund styles reveals that for all other strategy types except for the Systematic Traders Index and Dedicated Short Bias, it is highly likely (95% confidence level) that their mean return during one of the S&P 500’s worst twenty months is lower than for all the other months. Exhibit XV: Systematic Traders Performance For 20 Worst S&P 500 Months
Worst
S&P 500 Index
Monthly
Barclays Systematic
Trader Monthly
Oct-08 -16.94% 4.40% Aug-98 -14.58% 7.51% Sep-02 -11.00% 2.88% Feb-01 -9.23% -0.44% Sep-08 -9.08% 1.89% Jun-08 -8.60% 2.27% Sep-01 -8.17% 2.78% Nov-00 -8.01% 2.97% Jul-02 -7.90% 3.63% Nov-08 -7.48% 1.88% Jun-02 -7.25% 7.20% Mar-01 -6.42% 5.72% Aug-01 -6.41% 1.86% Apr-02 -6.14% -1.00% Jan-08 -6.12% 2.72% Dec-02 -6.03% 5.69% Aug-97 -5.74% -4.67% Sep-00 -5.35% -2.36% Jan-00 -5.09% 2.00% Jul-96 -4.57% -2.43% Average: -8.01% 2.22%
*For period January 1994 to December 2008 Finally, the worst five drawdowns for the S&P 500 from January 1987 to December 2008 are identified in Exhibit XVI. It also contains performance in those periods for the Dollar index, 2-year US Treasury note, the S&P 500, and the Barclays Systematic Traders Index. The Barclays Systematic Traders Index is the only one with positive returns during every drawdown period, with the other three assets losing in every period except for the Dollar Index from October 2007 to November 2008. Diversification benefits from inclusion of systematic global macro programs in portfolios of hedge funds are abundantly clear.
- 20 -

Exhibit XVI: Peak to Valley Performance for the Five Worst S&P 500 Drawdowns On Monthly Data
Start Date
End Date S&P 500
2 Yr US Treasury
Note (bps) Dollar Index
Systematic Traders Index
Aug-00 Sep-02 -46% -448 -5% 27% Oct-07 Nov-08 -42% -296 13% 18% Aug-87 Nov-87 -30% -19 -8% 12% May-90 Oct-90 -16% -75 -10% 26% Jun-98 Aug-98 -16% -69 -1% 7%
*For period January 1987 to December 2008 C. Summary Proper comparison of historical returns of different strategy types requires deeper analysis than cursory use of an annualized information ratio. Upside/downside volatility ratios, skewness and kurtosis may indicate non-normality of the returns. Furthermore, the process of annualizing volatility will lead to incorrect assessments of risk when autocorrelation of monthly returns is present. Finally, correlations with other strategy types and asset classes should be taken into account, both unconditionally and conditionally on poor performance periods. As demonstrated in this section, this kind of analysis adds significant support to the thesis that systematic global macro’s historical relative performance is underestimated by a simple annualized information ratio, and builds the case that systematic global macro should be included in portfolios that include a range of hedge fund styles.
- 21 -

IV. Portfolio Construction A. Introduction In this section, four different portfolios of hedge fund styles will be analyzed, each the result of optimizing for a different objective. The purpose of the exercise is to compare and contrast the portfolios in light of the previous discussion about measuring risk. The objectives will be to maximize (1) annualized information ratio, (2) annual information ratio, (3) Sortino ratio, and (4) the Calmar ratio, for the historical period January 1994 to December 2008. Possible weights per hedge fund strategy will range from 4% to 20%, in steps of 1%. The sum of the weights over the ten hedge fund strategies is constrained to equal 100%. Various metrics will be analyzed across the different portfolios, and the strategy weightings will be compared as well. It should be noted that this analysis is backward-looking; the forecasting of the optimal portfolio of the future would entail a deeper and more comprehensive treatment. B. Annualized Information Ratio The most commonly used metric of portfolio performance is the annualized information ratio with the implicit assumption of no autocorrelation of monthly returns. As previously discussed, if this assumption is incorrect, results could be far from optimal. Exhibit XVII contains the weightings for this optimal portfolio. With this portfolio metric objective, two strategies receive the highest allocation: Multi-Strategy and Event Driven. These strategies have the two highest stand-alone annualized information ratios as well. Exhibit XVII: Maximum Annualized Information Ratio Portfolio Weights
Maximum Annualized Information Ratio Portfolio Weight
SYSTEMATIC TRADERS 14% CSFB/Tremont Equity Market Neutral 4% CSFB/Tremont Multi-Strategy 20% CSFB/Tremont Fixed Income Arbitrage 4% CSFB/Tremont Event Driven 20% CSFB/Tremont Convertible Arbitrage 4% CSFB/Tremont Long/Short Equity 13% CSFB/Tremont Global Macro 4% CSFB/Tremont Dedicated Short Bias 13% CSFB/Tremont Emerging Markets Index 4%
*For period January 1994 to December 2008 C. Annual Information Ratio As discussed above in Section III, incorporating autocorrelations of monthly returns leads to a more accurate measurement of annual volatility, and hence, annual information ratio as well. Maximizing the annual information ratio (with autocorrelations of monthly
- 22 -

returns taken into account) leads to a portfolio with weightings shown in Exhibit XVIII. Note that even though the Multi-Strategy and Event Driven strategies have the highest annualized information ratios, neither retains its previous 20% allocation. The greatest difference between this portfolio and the one that maximizes annualized information ratio without autocorrelations taken into account is that Multi-Strategy now receives the lowest allocation of 4% in contrast to the maximum of 20%. This is not surprising given that Multi-Strategy has the second highest underestimation of risk using annualized volatility as opposed to annual volatility (see Exhibit IX). Exhibit XVIII: Maximum Annual Information Ratio Portfolio Weights
Maximum Annual Information Ratio Portfolio Weight
SYSTEMATIC TRADERS 20% CSFB/Tremont Equity Market Neutral 4% CSFB/Tremont Multi-Strategy 4% CSFB/Tremont Fixed Income Arbitrage 4% CSFB/Tremont Event Driven 18% CSFB/Tremont Convertible Arbitrage 4% CSFB/Tremont Long/Short Equity 18% CSFB/Tremont Global Macro 4% CSFB/Tremont Dedicated Short Bias 20% CSFB/Tremont Emerging Markets Index 4%
*For period January 1994 to December 2008 D. Sortino Ratio Using an objective of maximum Sortino ratio to form the optimal portfolio leads to the portfolio weights in Exhibit XIX, which are very similar to the weights from the maximum annualized information ratio portfolio. This is unsurprising since even though the Sortino ratio takes into account the asymmetry of upside and downside volatility, it does not take into account the autocorrelation of monthly returns of strategy indices. Here, the maximum allocations go to Systematic Traders and Event Driven. The biggest differences between this portfolio and the one that maximizes annualized information ratio are that Systematic Traders’ weight goes up from 14% to 20% while Multi-Strategy’s weight goes down from 20% to 14%. Multi-Strategy is likely penalized because its upside/downside volatility ratios, skewness, and kurtosis are all in the bottom half. In contrast, Systematic Traders has the second best ranking for the upside/downside volatility ratio and skewness, and the lowest kurtosis of all the hedge fund style indices. This illustrates the point that as more risk dimensions are captured in the portfolio metric, more allocation will go to strategies with appealing risk characteristics beyond monthly volatility, such as Systematic Traders, and at the expense of strategies such as Multi-Strategy that possess undesirable third and fourth moments.
- 23 -

Exhibit XIX: Maximum Sortino Ratio Portfolio Weights
Maximum Sortino Ratio
Portfolio Weight SYSTEMATIC TRADERS 20% CSFB/Tremont Equity Market Neutral 4% CSFB/Tremont Multi-Strategy 14% CSFB/Tremont Fixed Income Arbitrage 4% CSFB/Tremont Event Driven 20% CSFB/Tremont Convertible Arbitrage 4% CSFB/Tremont Long/Short Equity 13% CSFB/Tremont Global Macro 6% CSFB/Tremont Dedicated Short Bias 11% CSFB/Tremont Emerging Markets Index 4%
*For period January 1994 to December 2008 E. Calmar Ratio Finally, the Calmar ratio is used as the objective in the creation of the optimal portfolio. This is the ratio of annualized return to maximum drawdown in the simulation period. For those investors most concerned about drawdowns, the Calmar ratio may well be superior to any information ratio in quantifying portfolio performance. Weightings are shown in Exhibit XX. The maximum allocations in this portfolio go to Systematic Traders, Global Macro, and Dedicated Short Bias. Among the six strategies with the least amount of allocation in this portfolio are the four strategies with the highest ratio of maximum drawdown to annualized volatility. Exhibit XX: Maximum Calmar Ratio Portfolio Weights
Maximum Calmar Ratio
Portfolio Weight SYSTEMATIC TRADERS 20% CSFB/Tremont Equity Market Neutral 4% CSFB/Tremont Multi-Strategy 4% CSFB/Tremont Fixed Income Arbitrage 4% CSFB/Tremont Event Driven 16% CSFB/Tremont Convertible Arbitrage 4% CSFB/Tremont Long/Short Equity 4% CSFB/Tremont Global Macro 20% CSFB/Tremont Dedicated Short Bias 20% CSFB/Tremont Emerging Markets Index 4%
*For period January 1994 to December 2008 F. Summary Exhibit XXI compares the four optimal portfolios discussed in this section. Notably, maximizing the annualized information ratio without correcting for the autocorrelation of monthly returns creates the portfolio with the lowest annual information ratio, the deepest
- 24 -

drawdown, and the lowest Calmar ratio, i.e. a portfolio that ranks at the bottom on the metrics that are measure risk more broadly than simple monthly return volatility. Use of more comprehensive measures of risk that take into account higher moment distributional properties as well as autocorrelations lead to portfolios with better drawdown statistics. These portfolios, as expected, have greater weightings for strategies with favorable higher moments and autocorrelation statistics. Exhibit XXI: Comparison of Optimal Portfolios
Annualized Information
Ratio
Annual Information
Ratio Calmar Ratio
Sortino Ratio
Maximum Drawdown
Maximize Annualized Information Ratio 1.82 1.13 0.48 2.30 14.79% Maximize Annual Information Ratio 1.68 1.29 0.59 2.20 11.40% Maximize Calmar Ratio 1.48 1.19 0.69 2.00 10.33% Maximize Sortino Ratio 1.78 1.21 0.54 2.35 13.46%
*For period January 1994 to December 2008
- 25 -

V. Conclusion Over the last two decades, the hedge fund industry has matured dramatically. Both assets under management and the number of hedge funds have experienced significant growth. Hedge fund indices, as well as some individual funds, now have 20+ years of historical performance. With this maturation has come a growing level of acceptance of hedge funds as potential investments for traditional asset managers such as pension funds, insurance companies, and endowments. Increased differentiation among hedge funds has culminated into standard recognized hedge fund strategies, leading to the possibility of creating portfolios of hedge fund strategies. The construction of a portfolio of different hedge fund strategies is a complex task requiring a deep understanding of the statistics commonly used in the financial industry. The naïve approach of calculating annualized information ratios based on annualized volatilities without regard to autocorrelations of monthly returns is problematic for a number of reasons. First, higher moments such as skewness and kurtosis are ignored in such an analysis. There is strong empirical evidence that monthly returns of hedge fund strategies are not normally distributed. More specifically, most hedge fund strategies with relatively high annualized information ratios have a short option profile. Infrequently, this property will manifest itself with sharply negative monthly returns. Proper portfolio construction must take these tail events into account. The process of annualizing without regard to autocorrelation of monthly returns is another potential error that could lead to incorrect assessments of relative performance amongst hedge fund strategies. Statistical tests suggest that there exist significant levels of autocorrelation of monthly returns for most hedge fund strategies. Correcting for such autocorrelation leads to the conclusion that most annualized information ratios are overestimated by disregarding autocorrelations. In contrast, systematic global macro’s historical performance is most likely underestimated by this same error. Correlations of monthly performance of strategies to each other and to the S&P 500 should also be taken into account in the portfolio construction process. Most hedge fund strategies are not only positively correlated with each other, but with the S&P 500 as well. Systematic global macro, on the other hand, has the appealing quality of low to negative correlation with most other hedge fund strategies and the S&P 500. This potential diversification benefit should be included in any portfolio analysis. Potential diversification benefits could extend beyond the monthly time scale. Concurrent drawdown analysis explores this possibility, and such investigation leads to the finding that systematic global macro programs generally perform exceptionally well during drawdown periods for major asset classes. A thorough investigation of the risk and performance properties of hedge fund strategies on a standalone basis, as well as in the context of a portfolio of hedge fund strategies,
- 26 -

generally leads to a larger allocation to systematic global macro. Such portfolios, based on distributional properties beyond average return and monthly volatility, generally perform very well in terms of drawdowns and higher-moment risk measures, confirming the systematic global macro hedge fund style as an important ingredient in successful long-term investing.
- 27 -

References Aronson, DR. 2006. Evidence-Based Technical Analysis: Applying the Scientific Method and Statistical Inference To Trading Signals(Wiley). Barclayhedge.com. 2008. Bera, A.K. and C.M. Jarque. 1980. Efficient tests for normality, homoscedasticity and serial independence of regression residuals. Economics Letters 6 (3): 255-259. Box, G.E.P. and G.M. Ljung. 1978. On a measure of lack of fit in time series models. Biometrika 65 (2): 297-303. Brown, K., 2006. Trend Trading: Timing Market Tides(Wiley). Brunnermeier, M. et al., (2008), NBER Macroeconomics Annual. Burghardt, G. 2006. Measuring market impact: transaction cost analysis comes to the futures market. Futures Industry Magazine: Outlook 07. Burstein, Gabriel 1999. Macro Trading & Investment Strategies: Macroeconomic Arbitrage In Global Markets (Wiley). Coy, P., S. Wooley, L.N. Spiro, and W. Glasgall. 1998. Failed wizards of Wall Street. Business Week Sep. 21: 114-119. Dunis, L., Laws, J. and Naim, P., 2003. Applied Quantitative Methods for Trading and Investment. Fung, W and Hsieh DA 2001. The risk in hedge fund strategies: theory and evidence from trend followers. Review of Financial Studies 2001 14(2):313-341. Gatev, E. et al., 2006. Pairs Trading: Performance of a Relative-Value Arbitrage Rule. Review of Financial Studies 2006 19(3):797-827. Gray, R.W. and D.J.S. Rutledge. 1971. The economics of commodity futures markets: a survey. Review of Marketing and Agricultural Economics. Dec.: 57-108. HedgeFund.net and Institutional Investor News. 2007. The 2008 Hedge Fund Asset Flows & Trend Report. Hochradl M. and C. Wagner. 2006. Trading the forward bias: are there limits to speculation? Working Paper. James, J. 2003. Robustness of simple trend-following strategies. Quantitative Finance, Volume 3, Issue 6 December 2003, pages C114 - C116.
- 28 -
- 29 -
Katz, JO and McCormick, DL. 2000. The Encyclopedia of Trading Strategies (McGraw-Hill). Kaufman, Perry J. 2005 New Trading Systems and Methods (Wiley Trading). Morris, S. 1994. Trade with Heterogeneous Prior Beliefs and Asymmetric Information. Econometrica, Vol. 62, No. 6 (Nov., 1994), pp. 1327-1347. Schwager, JD. 1984. A Complete Guide to the Futures Markets: Fundamental Analysis, Technical Analysis, Trading, Spreads, and Options. Williamson, C. 2009. HFR: Hedge Fund Redemptions Hit Record. http://www.investmentnews.com (accessed January 26, 2009).