system of environmental- economic accounting for water (seeaw) learning centre on environmental...
TRANSCRIPT

System of Environmental-System of Environmental-Economic Accounting for Water Economic Accounting for Water
(SEEAW)(SEEAW)Learning Centre on Learning Centre on
Environmental AccountsEnvironmental Accounts United Nations Statistics DivisionUnited Nations Statistics Division
New York, 23 February 2009New York, 23 February 2009
OutlineOutline
• The need for SEEAW• Background, process of development
and implementation• Main concepts and standard tables• Common problems in compilation• Indicator and uses • Key lessons from implementation and
the way forward

The need for SEEAWThe need for SEEAW
• Supporting Integrated Water Resource Management (IWRM)Supporting Integrated Water Resource Management (IWRM)• Understanding the links between the economy and the Understanding the links between the economy and the
environmentenvironment• Maximising/optimising the social, economic and Maximising/optimising the social, economic and
environmental benefits of water use in the economyenvironmental benefits of water use in the economy• Managing water scarcity and competing demands for water, Managing water scarcity and competing demands for water,
especially in the context of climate changeespecially in the context of climate change• Water as an economic good (e.g. water pricing, full cost Water as an economic good (e.g. water pricing, full cost
recover, water rights)recover, water rights)• Identifying water intensive and water polluting industries for Identifying water intensive and water polluting industries for
policy response (e.g. application of users pays and polluter policy response (e.g. application of users pays and polluter pays principles)pays principles)
• Bring together dispersed data into a multi purpose analytical Bring together dispersed data into a multi purpose analytical frameworkframework
SEEAW – an interim SEEAW – an interim international statistical standardinternational statistical standard
• SEEAW was adopted by the United Nations Statistical Commission in March 2007 as an interim statistical standard
• SEEAW has been recognized as useful by the users of information
“SEEAW provides the much-needed conceptual SEEAW provides the much-needed conceptual framework for monitoring and assessment”framework for monitoring and assessment”
Roberto Lenton, Global Water PartnershipRoberto Lenton, Global Water Partnership
• UNSD has developed an implementation plan and there has been rapid adoption by countries

44 Countries have, or are planning, water accounts* 44 Countries have, or are planning, water accounts*
• AndorraAndorra• AustraliaAustralia• AustriaAustria• BahamasBahamas• BotswanaBotswana• CanadaCanada• ChinaChina• ColombiaColombia• DenmarkDenmark• Dominican Dominican
RepublicRepublic• EgyptEgypt• FranceFrance• GermanyGermany• GuatemalaGuatemala• HungaryHungary• IraqIraq
•IsraelIsrael•ItalyItaly•JordanJordan•MexicoMexico•NamibiaNamibia•NetherlandsNetherlands•New ZealandNew Zealand•PeruPeru•PhilippinesPhilippines•PortugalPortugal•SingaporeSingapore•South AfricaSouth Africa•SpainSpain•SwedenSweden•SwitzerlandSwitzerland•Trinidad and TobagoTrinidad and Tobago•UkraineUkraine
•Armenia•Estonia•Greece•Lebanon•Mauritius•Norway•Occupied Palestinian Territory•Romania•Tunisia•Turkey•United Kingdom
*Data from the Global Assessment of *Data from the Global Assessment of Water Statistics and Water AccountsWater Statistics and Water Accounts
http://unstats.un.org/unsd/statcom/doc09/BG-WaterAccounts.pdf
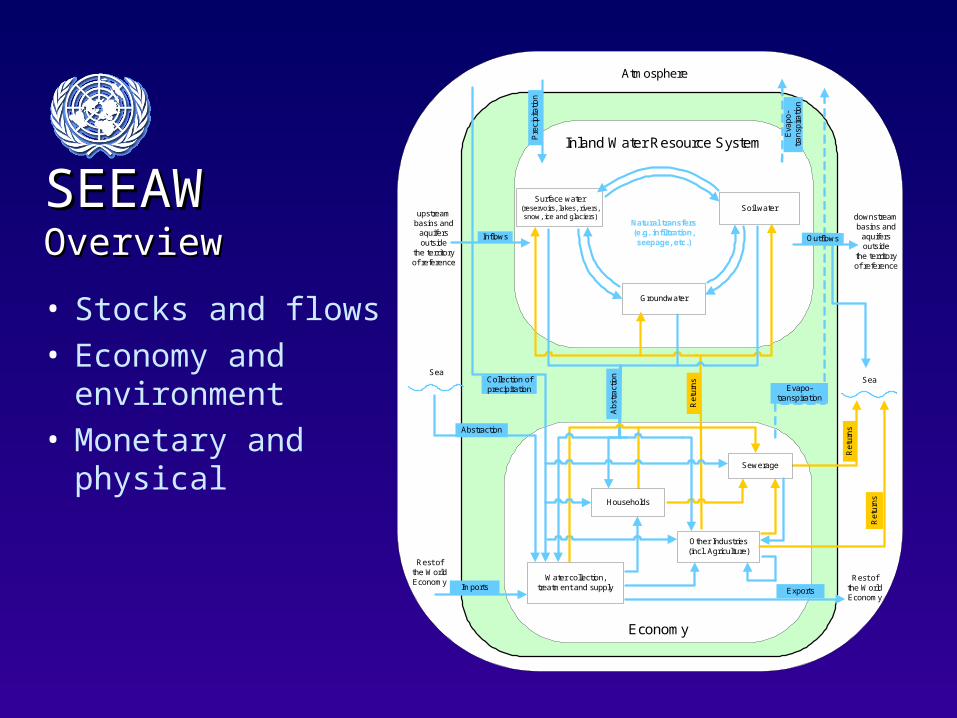
SEEAWSEEAWOverviewOverview
Economy
Exports
Evapo-transpiration
Other Industries(incl. Agriculture)
Imports
Abstraction
Sea
Atmosphere
Collection ofprecipitation
Households
Abs
trac
tion
Water collection,treatment and supply
Inland Water Resource System
Surface water(reservoirs, lakes, rivers,snow, ice and glaciers)
Soil water
Groundwater
upstreambasins and
aquifersoutside
the territoryof reference
Natural transfers(e.g. infiltration,seepage, etc.)
Sea
Inflows
downstreambasins and
aquifersoutside
the territoryof reference
Outflows
Pre
cipi
tatio
n
Eva
po-
tra
nspi
ratio
n
Sewerage
Rest ofthe WorldEconomy Rest of
the WorldEconomy
Re
turn
s
Ret
urn
s
Ret
urn
s
• Stocks and flows• Economy and
environment• Monetary and
physical

Inland Water Resources
Water SupplyISIC 36
SewerageISIC 37
HouseholdsElectricityISIC 35
Mining*ISIC 5-9
Manufacturing*ISIC 10-33
AgricultureISIC 1 Other ISIC
2,3,38,39, 45-99
? ?
?38559924110227?
?
? ?
2045
529 246 60172 862 232
341725329
6582
556115
?
?
?
577
Australia – physical water supply and use, 2004-05 (GL)
1874
38
11160
280 6137 78
?
2
The SeaThe Sea
1232
Key
WastewaterWaterReuse water
0
* Note shown is the supply of distributed water and reuse water by mining and manufacturing, 25 GL in total.
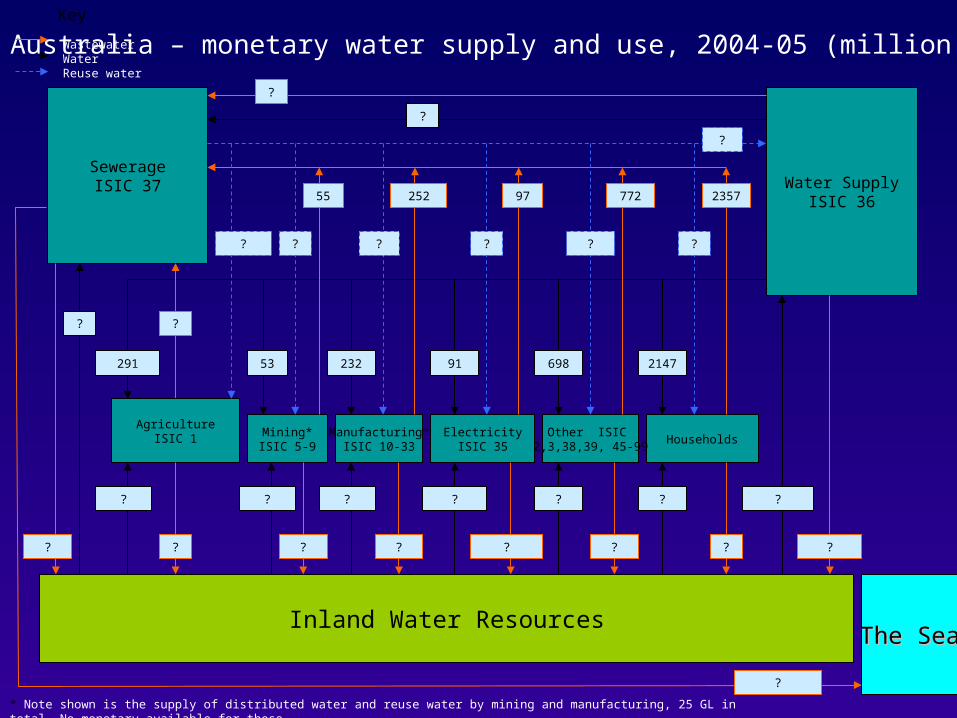
Inland Water Resources
Water SupplyISIC 36
SewerageISIC 37
HouseholdsElectricityISIC 35
Mining*ISIC 5-9
Manufacturing*ISIC 10-33
AgricultureISIC 1 Other ISIC
2,3,38,39, 45-99
97 772
??????
?
55 252
?
? ? ? ? ?
23253291
?
69891
?
?
?
?
Australia – monetary water supply and use, 2004-05 (million AUD$)
2147
?
?
? ??? ?
2357
?
The SeaThe Sea
?
Key
WastewaterWaterReuse water
* Note shown is the supply of distributed water and reuse water by mining and manufacturing, 25 GL in total. No monetary available for these.
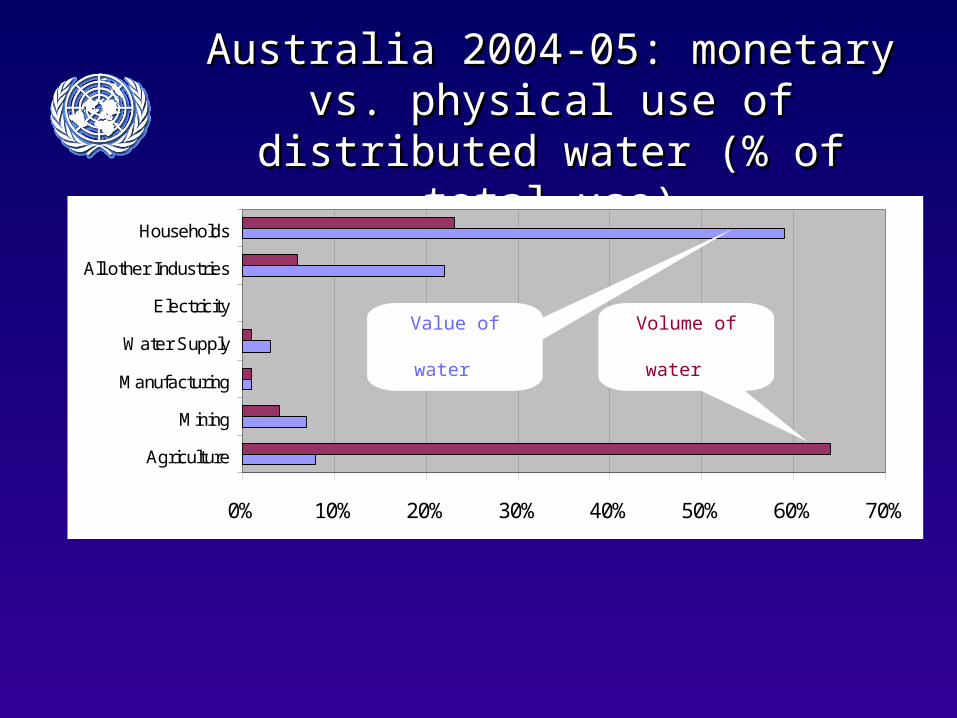
Australia 2004-05: monetary vs. physical Australia 2004-05: monetary vs. physical use of distributed water (% of total use)use of distributed water (% of total use)
0% 10% 20% 30% 40% 50% 60% 70%
Agriculture
Mining
Manufacturing
Water Supply
Electricity
All other Industries
Households
Volume of water Value of water
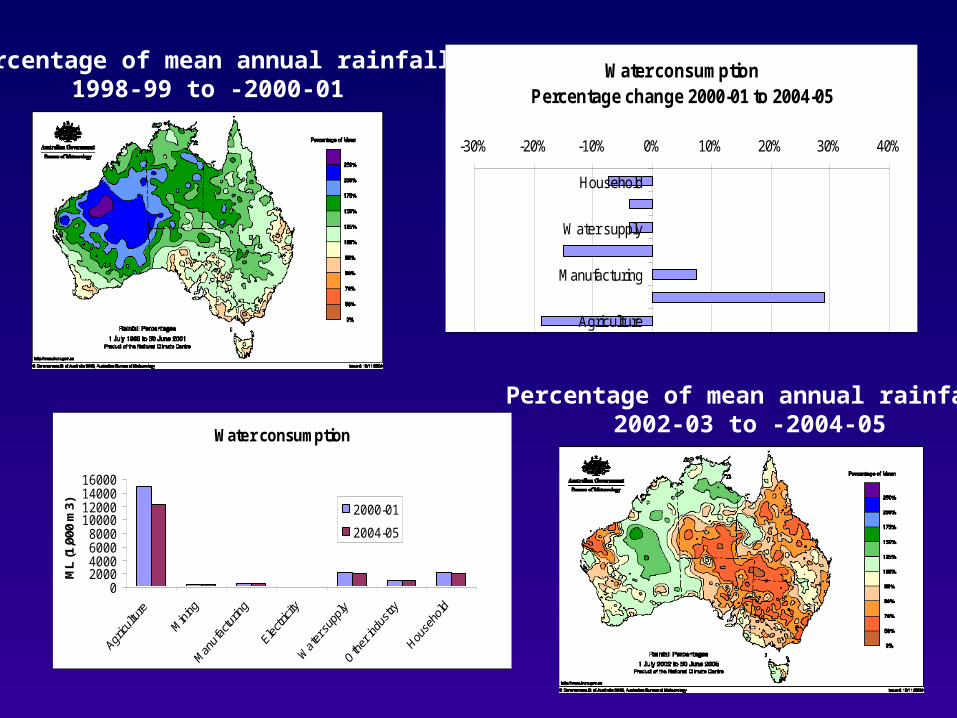
Percentage of mean annual rainfall1998-99 to -2000-01
Percentage of mean annual rainfall2002-03 to -2004-05Water consumption
02000400060008000
10000120001400016000
ML
(1,0
00 m
3) 2000-01
2004-05
Water consumptionPercentage change 2000-01 to 2004-05
-30% -20% -10% 0% 10% 20% 30% 40%
Agriculture
Manufacturing
Water supply
Household

12 Standard Tables12 Standard Tables1. Physical supply 2. Physical use3. Gross and net emissions4. Emissions by ISIC 375. Hybrid (Monetary and Physical) supply6. Hybrid use7. Hybrid supply and use8. Hybrid water supply and sewerage for own use9. Government accounts for water related collective consumption services
(Monetary)10. National expenditure for waste management (Monetary)11. Financial accounts for waste water management (Monetary)12. Asset account (Physical)
12 Supplementary tables

Physical water use: Standard Table IPhysical water use: Standard Table I
Physical units
Industries (by ISIC categories)
Households
Rest of the world
Total 1-3
5-33, 41-43 35 36 37
38,39,
45-99
Total
From the environment
U1 - Total abstraction (=a.1+a.2= b.1+b.2):
a.1- Abstraction for own use
a.2- Abstraction for distribution
b.1- From water resources:
Surface water
Groundwater
Soil water
b.2- From other sources
Collection of precipitation
Abstraction from the sea
Within the economy
U2 - Use of water received from other economic units
U=U1+U2 - Total use of water
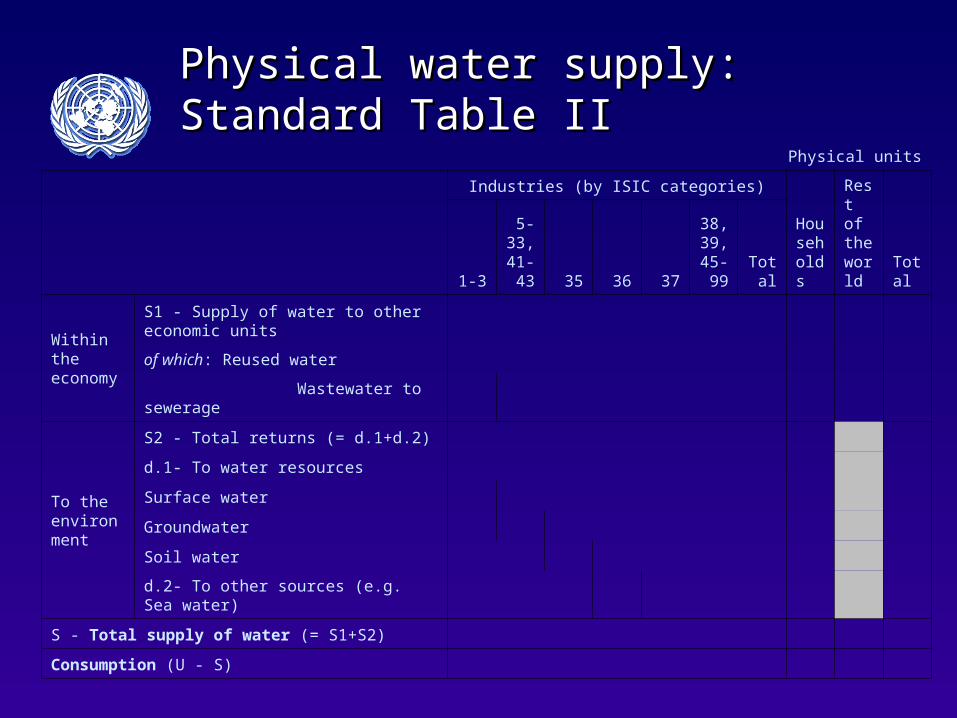
Physical water supply: Standard Table IIPhysical water supply: Standard Table IIPhysical units
Industries (by ISIC categories)
Households
Rest of the world
Total 1-3
5-33, 41-43 35 36 37
38,39,
45-99
Total
Within the economy
S1 - Supply of water to other economic units
of which: Reused water
Wastewater to sewerage
To the environment
S2 - Total returns (= d.1+d.2)
d.1- To water resources
Surface water
Groundwater
Soil water
d.2- To other sources (e.g. Sea water)
S - Total supply of water (= S1+S2)
Consumption (U - S)
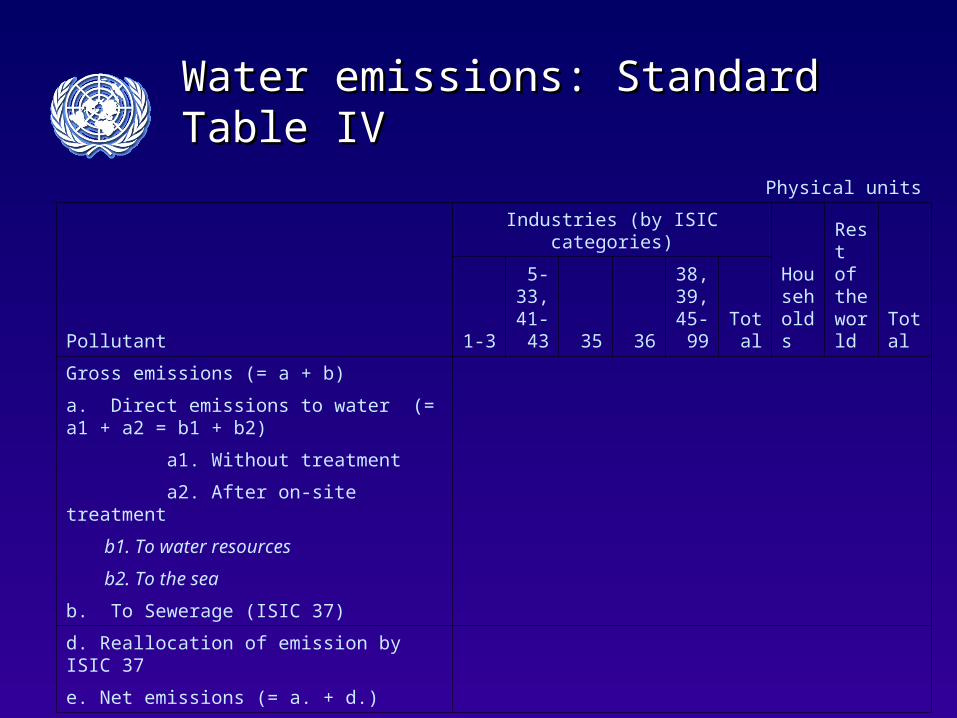
Water emissions: Standard Table IVWater emissions: Standard Table IV
Physical units
Pollutant
Industries (by ISIC categories)
Households
Rest of the world
Total 1-3
5-33, 41-43 35 36
38,39, 45-99
Total
Gross emissions (= a + b)
a. Direct emissions to water (= a1 + a2 = b1 + b2)
a1. Without treatment
a2. After on-site treatment
b1. To water resources
b2. To the sea
b. To Sewerage (ISIC 37)
d. Reallocation of emission by ISIC 37
e. Net emissions (= a. + d.)

Hybrid water use: Standard Table VIHybrid water use: Standard Table VI
Physical and monetary units
Intermediate consumption of industries (by ISIC categories) Actual final consumption
Capital formation
Exports
Total uses at purchaser’s price1-3
5-33, 41-43
35
36 37
38,39, 45-99
Total industry
Households
Government
Total
of which: Hydro
Final consumpt
ion expenditu
res
Social
transfers in kind from
Government and NPIS
Hs Total
Total intermediate consumption and use (monetary units)
of which: Natural water (CPC 1800)
Sewerage services (CPC 941)
Total value added (monetary units)
Total use of water (physical units)
U1 - Total Abstraction
of which: a.1- Abstraction for own use
U2 - Use of water received from other economic units
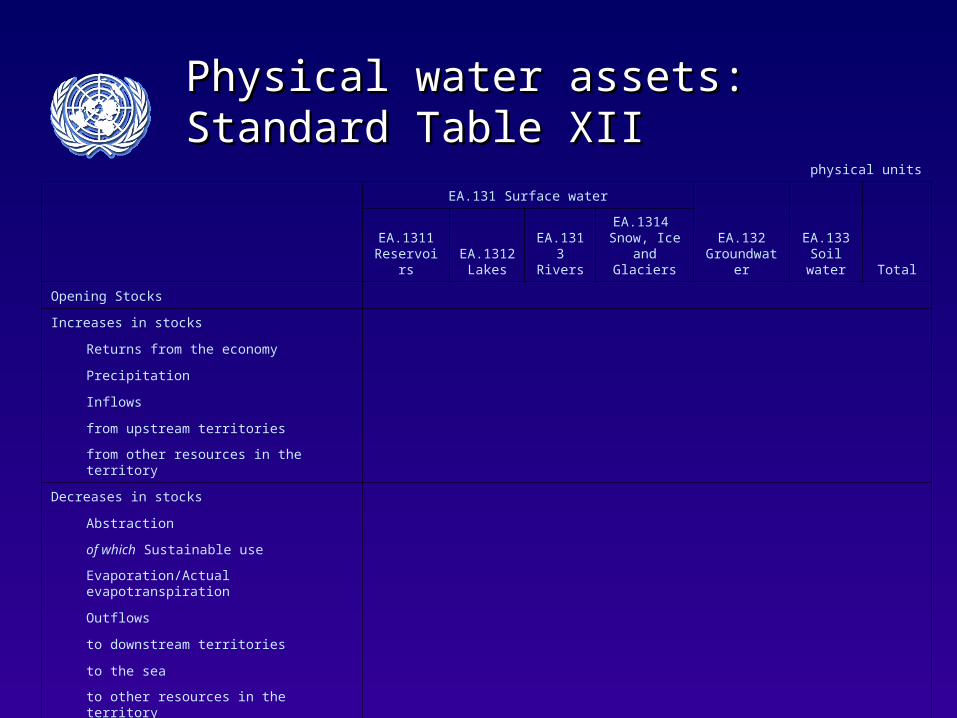
Physical water assets: Standard Table XIIPhysical water assets: Standard Table XIIphysical units
EA.131 Surface water
EA.132 Groundwater
EA.133 Soil water Total
EA.1311 Reservoirs
EA.1312 Lakes
EA.1313 Rivers
EA.1314 Snow, Ice and
Glaciers
Opening Stocks
Increases in stocks
Returns from the economy
Precipitation
Inflows
from upstream territories
from other resources in the territory
Decreases in stocks
Abstraction
of which Sustainable use
Evaporation/Actual evapotranspiration
Outflows
to downstream territories
to the sea
to other resources in the territory
Other changes in volume
Closing Stocks
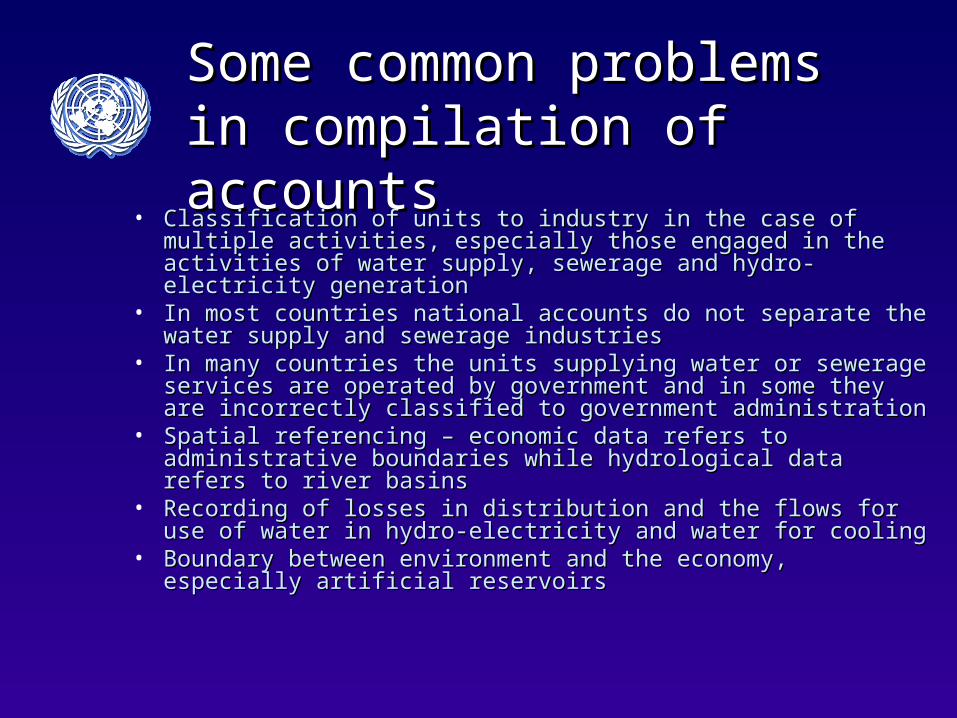
Some common problems in Some common problems in compilation of accountscompilation of accounts
• Classification of units to industry in the case of multiple activities, Classification of units to industry in the case of multiple activities, especially those engaged in the activities of water supply, sewerage especially those engaged in the activities of water supply, sewerage and hydro-electricity generationand hydro-electricity generation
• In most countries national accounts do not separate the water supply In most countries national accounts do not separate the water supply and sewerage industriesand sewerage industries
• In many countries the units supplying water or sewerage services are In many countries the units supplying water or sewerage services are operated by government and in some they are incorrectly classified to operated by government and in some they are incorrectly classified to government administrationgovernment administration
• Spatial referencing – economic data refers to administrative Spatial referencing – economic data refers to administrative boundaries while hydrological data refers to river basinsboundaries while hydrological data refers to river basins
• Recording of losses in distribution and the flows for use of water in Recording of losses in distribution and the flows for use of water in hydro-electricity and water for coolinghydro-electricity and water for cooling
• Boundary between environment and the economy, especially artificial Boundary between environment and the economy, especially artificial reservoirsreservoirs

Source of pressure on water resources: • Macro trends in total water use, emissions, water
use by natural source and purpose, etc. ‘Decoupling’ economic growth and water use, pollution
• Industry-level trends: indicators used for environmental-economic profiles
• Technology and driving forces: water intensity/productivity and total (domestic) water requirements to meet final demand
• International transport of water and pollution
Use and indicators from SEEAWUse and indicators from SEEAW
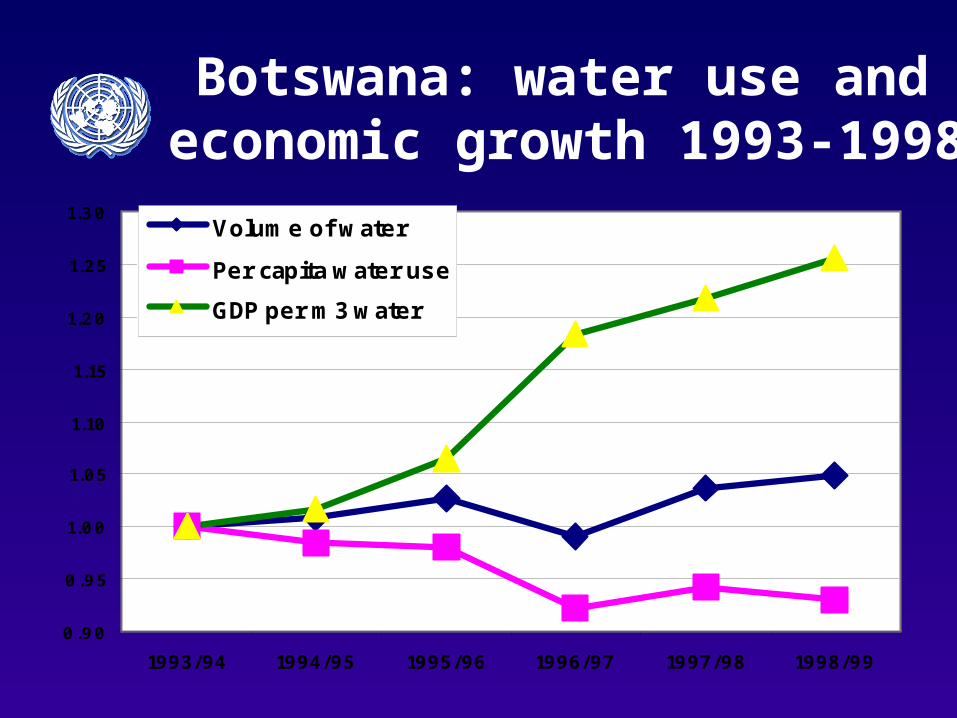
Botswana: water use and economic growth 1993-1998
0.90
0.95
1.00
1.05
1.10
1.15
1.20
1.25
1.30
1993/94 1994/95 1995/96 1996/97 1997/98 1998/99
Volume of water
Per capita water use
GDP per m3 water

Netherlands: water pollution and economic growth, 1999-2001
80
85
90
95
100
105
110
115
120
1996 1997 1998 1999 2000 2001
nutrients
metals
wastewater
GDP
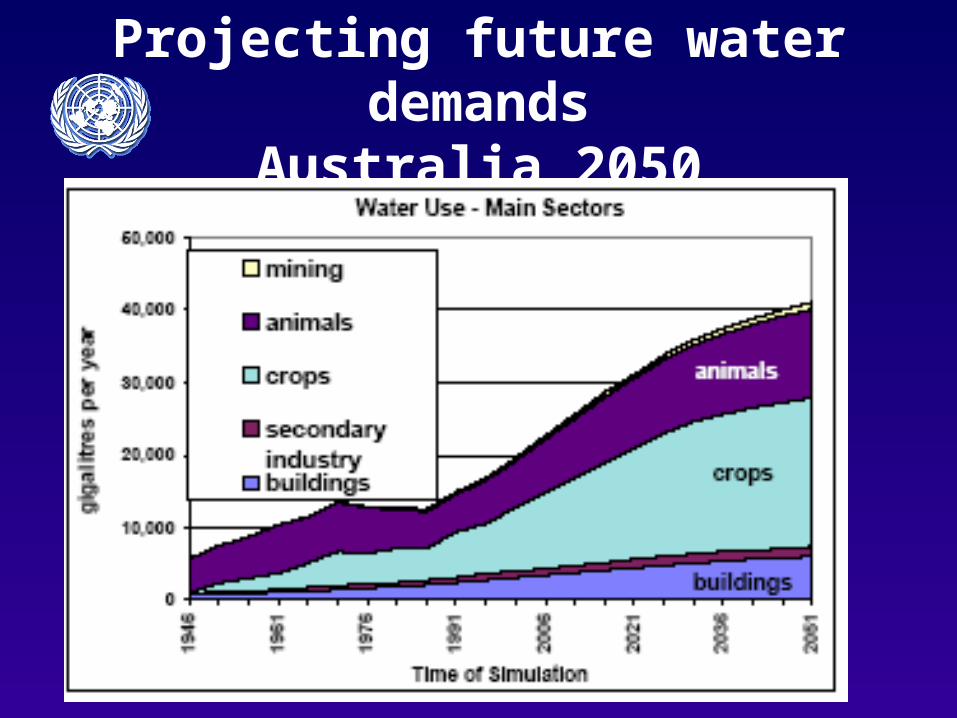
Projecting future water demandsAustralia 2050
Key findings of the Global Assessment and Key findings of the Global Assessment and lessons from countries implementing SEEAWlessons from countries implementing SEEAW
1. Build on existing knowledge and recognise that a range of different systems are already in place
2. Cooperation is essential
3. High level support is needed
4. An agency needs to take the lead
5. A phased approach is needed and pilot or experimental accounts are very useful
6. A lot of progress can be made quickly

Build on existing knowledge and recognise that a range of different information systems are already in place
• Many institutions already have information • Countries have developed information systems to
meet their own data needs for management, including international obligations
• These institutions need to understand that their data is valuable and that others could use it for their purposes

Cooperation is essential
• The majority of countries report cooperation with other agencies in the production of water accounts (68%)*
• Despite this the lack of cooperation or data sharing was identified as an issue in 32% of countries for water accounts*
• Data are usually dispersed in many agencies (e.g. agricultural agencies collect information on irrigation water, water ministries collect information to construct water balances, etc.)*
• In many countries there are data gaps and in some countries there is duplication of statistical activity*
Cooperation in needed• Within statistical offices• Between statistical offices, water departments, economic/planning
departments and agricultural departments• With the water supply industry• With the scientific and research communities• Between users and producers of information *Data from the Global Assessment of *Data from the Global Assessment of
Water Statistics and Water AccountsWater Statistics and Water Accounts
http://unstats.un.org/unsd/statcom/doc09/BG-WaterAccounts.pdf
High level support is neededHigh level support is needed
• The water accounts require a high degree of coordination within and between agencies, and so high level support helps to ensure that:• The proper legal and administrative processes are
developed and used for the sharing and integration of data and that the duplication of activity is reduced between different agencies
• Within agencies it paves the way for internal cooperation
• There are no “turf wars” between or within agencies• Resources need to be devoted to the production of the
accounts.

An agency needs to take the lead
It is usual for one agency to take the lead in the coordination and production of the accounts.
• In the majority (53%) of case the agency is most often the NSO*
• The lead agency does the preliminary work, including learning the details of the SEEAW and investigating the available data *Data from the Global Assessment of *Data from the Global Assessment of
Water Statistics and Water AccountsWater Statistics and Water Accounts
http://unstats.un.org/unsd/statcom/doc09/BG-WaterAccounts.pdf

A phased approach is needed and pilot or experimental accounts are very useful
• Start with the accounts that address the issues of most importance to countries: • In water scarce countries it has been water
supply and use and asset accounts. In industrialized countries it has been pollution and emission accounts.
• Pilot accounts enable indicators and other policy uses to be demonstrated with data

A lot of progress can be made quickly
• Many countries already have much of the data needed to compile water accounts
• For example, China, Mexico, Jordan and Dominican Republic were all able to produce preliminary accounts within 6 months
• In addition it appears that UNSD/UNEP, OECD/Eurostat and the EEA already collect much of the data needed to produce some of the water accounts
• As such for many countries and agencies is a matter of re-arranging current data to match the format of the standard tables and to ensure they are consistent with the definitions and classifications of SEEAW
• In this process data gaps and deficiencies may be identified and, if important enough, these can be addressed

The main roles of NSOs*The main roles of NSOs*
• Usually the source of the national accounts Usually the source of the national accounts • Often collect water data for example on water abstraction, treatment and Often collect water data for example on water abstraction, treatment and
distribution , connection sewers, etc., through household and business distribution , connection sewers, etc., through household and business surveys. surveys.
• Bring together the various stakeholders and help to ensure the Bring together the various stakeholders and help to ensure the commitment to the development and implementation of a multipurpose commitment to the development and implementation of a multipurpose integrated information system (i.e. the SEEAW) in countries, to meet the integrated information system (i.e. the SEEAW) in countries, to meet the needs of a wide variety of users needs. Making better use of existing needs of a wide variety of users needs. Making better use of existing resources would help to address problems with data availability and data resources would help to address problems with data availability and data quality, which were the main impeding factors for the compilation of quality, which were the main impeding factors for the compilation of water statistics and accounts in countries. water statistics and accounts in countries.
• Lead the development of a data collection strategy to improve and further Lead the development of a data collection strategy to improve and further develop the water statistics and accounts programme in countries.develop the water statistics and accounts programme in countries.
• Assist in the process of harmonizing definitions and classifications related Assist in the process of harmonizing definitions and classifications related to water and ensure their harmonization with those used in economic to water and ensure their harmonization with those used in economic statistics.statistics.
*From the Global Assessment of Water Statistics and *From the Global Assessment of Water Statistics and Water AccountsWater Accounts
http://unstats.un.org/unsd/statcom/doc09/BG-WaterAccounts.pdf

UNSD activity to support the implementation of UNSD activity to support the implementation of the SEEAW the SEEAW (In accordance with the SEEAW Implementation (In accordance with the SEEAW Implementation Plan presented to the UNSC in 2008)Plan presented to the UNSC in 2008)
• Conducting of regional workshopsConducting of regional workshops• Targeted country assistanceTargeted country assistance• Development of International Development of International
Recommendations for Water StatisticsRecommendations for Water Statistics• Development of a knowledge-base to house Development of a knowledge-base to house
practical material and countries experiences practical material and countries experiences on the compilation of water statistics and on the compilation of water statistics and accountsaccounts