system monitoring and network intrusion detection …€¦ · · 2009-05-28system monitoring and...
TRANSCRIPT
1
System Monitoring and Network Intrusion Detection
using DDS and CEP
OMG RTESS WorkshopWashington DC, July 14-16, 2008
Gerardo Pardo-Castellote, Ph.D. (RTI)Joe Schlesselman (RTI)
www.rti.com

2
Background
This presentation describes the results and architecture of a DoD-funded research effort to develop a common normalized information picture combining data from System Monitoring Tools and Intrusion Detection Systems.
The purpose of this work is to increase the speed and effectiveness of the technologies used to detect & counter network attacks.

3
Project Partners
RTI (Prime) DDS
Coral8 CEP
SL Visualization
Promia IDS Hardware
ObjectSecurity Security Manager

4
Outline
The problem of [Distributed] System Monitoring– System Monitoring– Intrusion Detection
Available Technologies– Ganglia, Nagios– Snort, Nessus, Saint
Practical solution using DDS and CEP

5
System Monitoring & Network Intrusion
Middleware Technologies, such as DDS help build large distributed systems 100s or 1000s or computers with an order of magnitude more processes– Functionally the system may be correct– … but it may still fail operationally…
These large systems require monitoring. We focus on two aspects:– Network Intrusion Detection– System Monitoring– Information Sharing/Normalization– Information Processing
The integration of these technologies illustrates the essence of the open integration problem we are trying to address.

6
100’s of Available ToolsTool Categories:
Network Intrusion Detection Systems– Snort– OSSEC NDIS
Vulnerability Scanners– Nessus, Nmap– Saint, GFI LanGuard
Sniffers– Wireshark, Kismet,– Netcat, Metasplot, hping,
OS fingerprinting, Service identification– Nmap, P0f
System Monitoring– Ganglia
Knowledge Repositories– IDS Rules– Vulnerability Databases (CVE)
Analysis, Detection, Decision Making– General purpose (e.g. CEP)– Specialized (e.g. Snort rules)
Monitoring, Visualization/HMI Tools– HP OpenView– SL RTView, Promia Asset Viewer
See: http://sectools.org/

7
The tool Integration problem
Many open source and COTS tools– Complementary functionality– Overlapping functionality
Each tool must combine:– Sensors, Rules, Alerts/Notifications, Visualization…
“Each Tool and Isolated Island”– Rules/knowledge bound to the tool/sensor– Must learn specifics of each sensor– Can’t easily multiple sensors in a rule– Limited to what each sensor offers
The Result: Cost, Complexity, Limited Power:– Cannot aggregate, correlate, extend

8
Each tool an isolated island
Sensor1 DetectionEngine1
Rules1
Visualization1
Sensor2 DetectionEngine2
Rules2
Visualization2
Sensor3 DetectionEngine3
Rules3
Visualization3
9
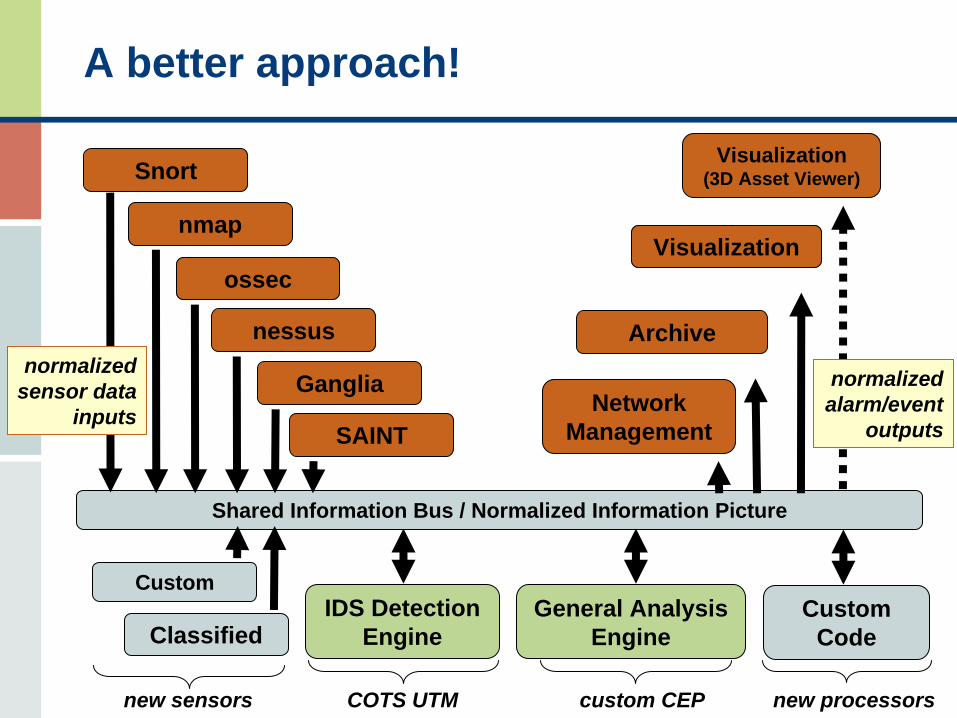
Shared Information Bus / Normalized Information Picture
A better approach!
IDS DetectionEngine
Snort
Archive
General AnalysisEngine
Ganglia
Visualization
NetworkManagement
nmap
nessus
SAINT
Custom
Classified
Visualization(3D Asset Viewer)
new sensors COTS UTM custom CEP
normalizedsensor data
inputs
normalizedalarm/event
outputs
CustomCode
new processors
ossec

10
A better approach with Standards & COTS
COTS Middleware(DDS Global Data Space)
Vulnerability SignatureDatabase
COTSRecording/Auditing
COTS HMI/ Dashboards
COTS System Sensors(Ganglia)
Host Sensor Host Sensor
COTSEventProcessing
`
Send updated signature
COTS Vulnerability Sensors(Nmap, Nessus, Saint)
Custom/ClassifiedIDS Sensors
Custom SensorsCOTS IDS Sensors(Snort)

11
Infrastructure Technology Selection
DDS was selected because it provides a Standard API and Network Protocol able to handle large volumes of real-time information and prioritize it by setting QoS policies.
CEP was selected because it provides a familiar (SQL-like), powerful and extensible language able to process large amounts of streaming data, aggregate the information, correlate it, and uncover interesting events and threats.
12
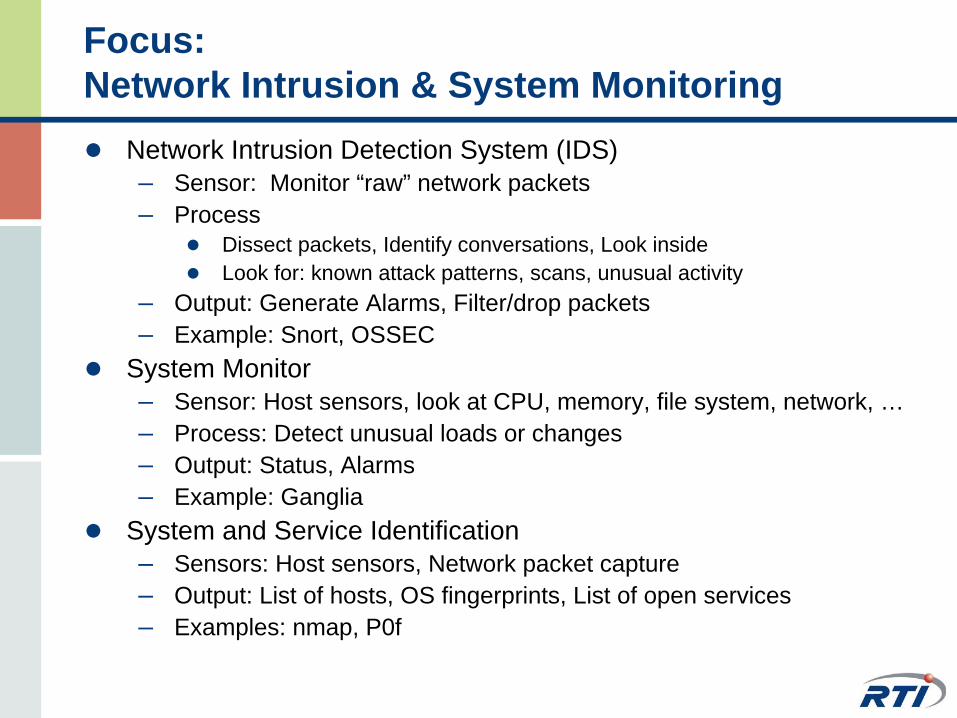
Focus: Network Intrusion & System Monitoring
Network Intrusion Detection System (IDS)– Sensor: Monitor “raw” network packets– Process
Dissect packets, Identify conversations, Look inside Look for: known attack patterns, scans, unusual activity
– Output: Generate Alarms, Filter/drop packets– Example: Snort, OSSEC
System Monitor– Sensor: Host sensors, look at CPU, memory, file system, network, …– Process: Detect unusual loads or changes– Output: Status, Alarms– Example: Ganglia
System and Service Identification– Sensors: Host sensors, Network packet capture– Output: List of hosts, OS fingerprints, List of open services– Examples: nmap, P0f

13
IDS: Snort Overview
Open source software (Linux, Windows)– Commercial support available
Can operate as: – Sniffer / packet logger, – Inline Mode: Intrusion Prevention System (IPS)
Interfaces with IP tables to drop/reject packets/connections and log the alertCan also modify bytes in the packets
– Network intrusion detection system (NDIS) Uses lib PCAP to monitor traffic & generate alertsCan also operate from a saved PCAP fileCan match src/dst and do deep packet inspectionCan produce references to know attack databases (e.g. NIST’s CVE)
Simple rule language for NDIS– Customizable/extensible by end user– Active community-based rules database

14
Snort deployment
Internet
Detect all intrusion events
Detect intrusion events that get
thought the firewall

15
Snort Implementation
Analyzes,modifies and takesactions like: Alert,Log, Drop, Reject.
Applies rulesDetects “intrusion”events
Outputs alertsTo files, database,Socket, …

16
Snort rules
The rule matches if all elements match: protocol, src, destination, …content, etc.– <direction> can be “->” or “<>”– “content:” used for deep-packet inspection. There is a mini language:
Can specify offsets and depth, Can relate to other matches in same packetCan use PERL regular expressions
– Can also do matches in the packet (IP/TCP,UDP) headersIf a rule matches the action is taken:– Alert, log, pass,
Rules are applied in sequence
alert tcp any any -> 10.10.100.0/24 111 \(content:“|00 01 86 a5|”; msg:”mountd access”;)
keyword
protocol source destinationaction
keyword
<action> <proto> <src> <direction> <dst> (<options>)

17
Snort Actions
alert – generate alert and log packetlog - log packetpass – ignore packetactivate – alert and turn on dynamic ruledynamic – inactive rule until activated then log
Inline-mode only:drop – drop packet and logsdrop – drop packet without loggingreject – drop packet, log, and send reset/ICMP port unreachable to sender
Custom actions can also be used to bind to specific output plugins:Ruletype dds_alert {
type alertoutput dds_write: domain=36 topic=“SnortAlert”
}

18
Normalized IDS Alert information
struct NormalizedAlert {SensorDetails sensor;NodeInfo source;NodeInfo target;ProtocolInfo protocolInfo;Timestamp alarmTimestamp;string alertMsg;short priority;sequence<ExtraValue> extra;
};
struct SensorDetails {string name;string version;long agentId;long type;NodeInfo node;
};struct NodeInfo {NetworkAddr networkAddr;unsigned short port;PhysicalAddress phylAddr;string hostName;
};struct ProtocolInfo {
string type;UdpInfo udpInfo;TcpInfo tcpInfo;IpInfo ipInfo;IcmpInfo icmpInfo;EthernetInfo ethInfo;
};

19
System Monitoring: Ganglia Overview
Open source software (Linux, Windows)– Originally developed at UC berkeley
Distributed Monitoring system for Clusters/Grids– Has scaled to clusters with 2000 nodes
Many built-in metrics– CPU, Network, IO, Memory, Disk– Can be extended with user-defined metrics

20
Ganglia Deployment (data collection)
Host-based (gmond daemon on each host)– monitor changes in host state– announce relevant changes– listen to the state of other ganglia nodes– answer requests for an XML description of the cluster state.
Outputs:– Metrics to multicast UDP
Sent at configured period… or when value changes beyond configurable threshold
– Responses to requests received via TCP
GMOND GMOND GMOND GMOND GMOND GMOND
multicast
GMETRIC
APP
(standard metrics) (custom metrics)

21
Ganglia Implementation & Deployment
GMOND
Cluster 1
GMONDGMONDGMOND
ApacheWeb Server
Cluster 2
Poll
Poll
HMI
GMETAD
GMETAD
GMONDCluster 3
multicast
RRDatabase
RRDatabase
TCP
TCP
GMETRIC
APPGMETRIC
APP

22
Normalized System Monitoring Information
struct StandardMetrics{DoubleMetric disk_total; LongMetric cpu_speed; LongMetric swap_total; StringMetric os_name;FloatMetric cpu_user; FloatMetric cpu_system; FloatMetric bytes_out; FloatMetric pckts_in; …
};
struct NormalizedSysMon {SensorDetails sensorDetails;ClusterInfo clusterInfo;StandardMetrics stdMetrics;
};
struct ClusterInfo { string name; Timestamp localtime; string owner; string latlong; string url;
};
23
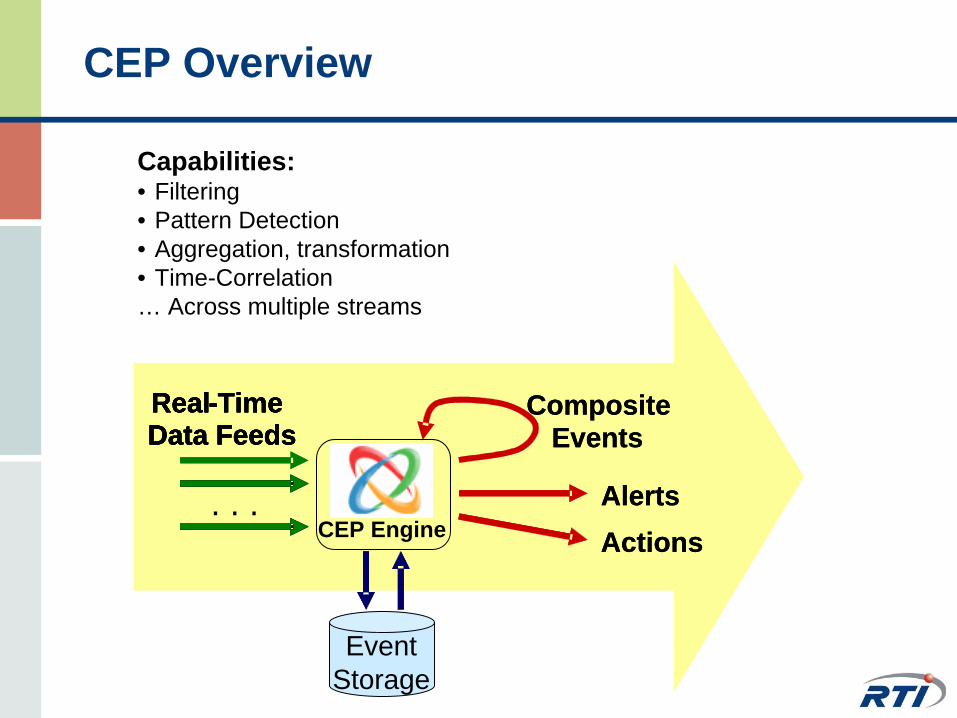
CEP Overview
Capabilities:• Filtering• Pattern Detection• Aggregation, transformation• Time-Correlation… Across multiple streams
Real-Time Data FeedsReal-Time Data Feeds
. . . AlertsActions
CompositeEvents
Real-Time Data FeedsReal-Time Data Feeds
CEP EngineAlertsActions
CompositeEvents
EventStorage

24
CEP – Example 1
activity: disk free
tool: Ganglia
CEP
DDS Topic
activity: ftp request
tool: Snort
RTIRecorder
DDS TopicRule:
If free disk < 10% andftp request
Then send DDS topic
alert
RTViewDDSTopic
CEP

25
CEP – Example 2
event: CPU load
tool: Ganglia
CEP
DDS Topic
activity: ssh
tool: Snort
RTIRecorder
DDS TopicRule:
If CPU > 50% andssh
requestThen send DDS topic
alert
RTViewDDSTopic
CEPCEP

26
Potential
Information normalization would allow rules to be written independent of sensorsUse of CEP would– allow rules to apply across sensors– enable much more sophisticated rules that mix historical data,
time-windows, causality, etc.
Use of DDS would– enable prioritization and other QoS– provide unified API to access all data with highest performance– allow segmentation and parallelization of processing– enable easy visualization using general purpose tools– Provide many out of the box services: recording, durability…
across all sensors with no additional work

27
Status: RTI Prototype Demo CONOPS v0.1
Shapes Traffic
CEP viaCoral8 Engine
Shapes traffic = UDP/IPv4 DDS traffic created by RTI DDS Shapes demo application
Windows
Solaris
Linux
Generic Traffic = legitimate and illegitimate random TCP/IPv4 network traffic
Legitimate = valid, well-formed packets of various protocols created using network traffic stimulatorIllegitimate = invalid, non-well-formed but not malicious packets of various protocols
Rogue = packets that violate one or more security policies, whether or not malicious
Generic Traffic
Shapes Traffic
Generic Traffic
Shapes Traffic
Generic Traffic
Linux
Producers
Sensors
SAINT
NmapSnortNessus
OpenPMF
Processors
Promia Raven UTM
Naughtiness
Rogue DDS
Shapes Traffic
Windows
Solaris
Linux
Generic Traffic
Shapes Traffic
Generic Traffic
Shapes Traffic
Generic Traffic
Consumers
RTC Database(SQL, Archive)
RTI DeveloperPlatform Tools(Analyzer, Wireshark)
SL RTView
Ganglia
RTI DDS

28
Future objectives
Integrate additional sensors of each class & refine the Normalized data format
Gather IDS data in real scenarios
Develop more sophisticated CEP rules based on IDS data
Develop CONOPS v 1.0
